Article Outline
Figures and tables
Volume 5 Issue 2 > pp. 34-42 • doi: 10.15627/jd.2018.6
Daylighting Metrics: an Approach to Dynamic Cubic Illuminance
Juan Manuel Monteoliva,* Ayelén Villalba, Andrea Pattini
Author affiliations
Instituto de Ambiente, Hábitat y Energia (INAHE), CONICET, Ruiz Leal N/N Avenue (CP5500), Mendoza, Argentina
* Corresponding author.
jmonteoliva@mendoza-conicet.gob.ar (J. M. Monteoliva)
avillalba@mendoza-conicet.gob.ar (A. Villalba)
apattini@mendoza-conicet.gob.ar (A. Pattini)
History: Received 6 October 2018 | Revised 21 November 2018 | Accepted 26 November 2018 | Published online 28 November 2018
Copyright: © 2018 The Author(s). Published by solarlits.com. This is an open access article under the CC BY license (http://creativecommons.org/licenses/by/4.0/).
Citation: Juan Manuel Monteoliva, Ayelén Villalba, Andrea Pattini, Daylighting Metrics: an Approach to Dynamic Cubic Illuminance, Journal of Daylighting 5 (2018) 34-42 http://dx.doi.org/10.15627/jd.2018.6
Figures and tables
Abstract
Advances in research work in the field of numerical analysis of daylight performance have generated in-depth knowledge on photometric measurements of daylight quality. Most dynamic metrics are based on illuminance, which is a two-dimensional concept insofar as it is concerned with the density of luminous flux incident at a point on a surface. In order to extend dynamic metrics into the third dimension and consider the distribution of illumination at a point in space, it is important to generate new advances in simulation environments and consider spatial illumination metrics. In this context, the main objective of the present work was to advance in the development of cubic dynamic daylight metrics, as a complement to the two dimensional analysis currently employed, promoting the use of Climate Based Daylight Modelling (CBDM). For this purpose, cylindrical to horizontal illuminance ratio is applied to dynamic simulation paradigm developing the concept of useful modeling indexs (UMIs). The research methodology applied in this work is divided into two main parts: (i) two dimensional concept: spatial daylight autonomy (sDA(300lx,50%) -horizontal-, sDA(175lx,50%) -vertical-) and uniformity, and (ii) three dimensional concept: useful cylindrical to horizontal illuminance ratio (uEcl/Eh(0.3-0.6)). In order to assess this method, two spaces (RR1 and RR2) of the Lavalle Public Library, located in Mendoza-Argentina, were taken as a case study. Results show important differences in horizontal illuminance between RR1 and RR2 (∆sDA(300lx, 50%) > 80%). Similar values of uEcl/Ewp(0.3-0.6) -useful cylindrical to horizontal illuminance ratio- are detected in both rooms (RR1= 69.32 % and RR2= 72.24 %) in nodes near north opening. Yet there are significant differences (< 36%) of uEcl/Ewp(0.3-0.6) between nodes located near the south wall, this is due to the obstruction of a south opening in RR2. Furthermore, it is important to mention that 2D metrics display a more uniform behavior than 3D metrics. This shows itself clearly if we take into account that difference in sDA are much lower than difference in uEcl/Eh(0.3-0.6), if we compare nodes closest to the north windows to does that are far from it, in both rooms (RR1 and RR2). This results from the fact that cubic metrics are more sensitive to the direction of light. This is of crucial importance for daylight studies in clear sky condition, due to the defined direction of direct solar radiation. Finally, a new approach to daylighting performance analysis based on the addition of cubic metrics to dynamic daylight paradigm is proposed: useful modelling indexs (UMIs). UMIs make it possible to quantify annual occurrence of proper light modelling conditions. As an initial approach, cylindrical to horizontal illuminance ratio (Ecl/Ewp(0.3-0.6)) has been considered, due to its current use in international standards.
Keywords
Daylight; Cubic illuminance; Dynamic simulation; Daylighting Metrics
Nomenclature
'E |
Illuminance due to the illumination vector on a plane normal to the x axis (lx) |
|E| |
Illumination vector magnitude (lx). Note that this is a scalar, not a vector. Suffixes are as for E. |
~ E |
Symmetric illuminance (lx) |
Esr |
Scalar illuminance (lx) |
Ecl |
Cylindrical illuminance (lx) |
Ewp |
Horizontal working plane illuminance (lx) |
Ewp |
Horizontal working plane illuminance (lx) |
e |
Illumination unit vector, defining the direction of the illumination vector and specified by components on the x, y and z axes. Suffixes are as for E. |
Emin |
Minimum illuminance (lx) |
Eaverage |
Average illuminance (lx) |
sDA |
Spatial daylight autonomy |
Uo |
Illuminance uniformity |
uEcl/Ewp |
Useful cylindrical to horizontal illuminance ratio |
1. Introduction
Currently the term quality of lighting does not present a consensus on what exactly it is, since it is a very broad and ambiguous concept [1] thus lighting quality is considered a construct; therefore, different lighting aspect that have an influence on it are included. The quality of lighting can be determined by measuring performance indicators independently. Several attempts have been developed to generate models of unique indicators capable of evaluating and describing this construct [1,2], including the visibility level model, lighting quality index, the comfort, satisfaction and performance index, interior lighting evaluation system, and the ergonomic lighting indicator; but all have significant limitations [3]. Therefore, the indirect measurement of light quality is explored as described by Kruisselbrink et al. [3]: quantity of light (illuminance and luminance) [4], distribution of light (uniformity, luminance distribution) [5], glare (disability glare, discomfort glare, veiling reflections) [6], spectral power distribution of light (color appearance, light color quality) [7], daylight (daylight penetration, outside view), directionality of light (direction and modelling) [8,9], and dynamics (variability and rhythm) [10].
Today, advances in research work in the field of numerical analysis of daylight performance have enabled to gain in-depth knowledge on photometric measurements of daylight quality. Daylight coefficient (DC) concept, introduced by Tregenza, and Waters [11], introduces greater accuracy in lighting simulation tools. The proposed method builds a sky luminance distribution based on annual weather climate files that make it possible to predict lighting levels at a point in space for a wide variety of sky conditions. This contribution among others, such as climate based daylight modelling (CBDM) [12-14] and Perez All-Weather Sky Model [15], resulted in an important paradigm change in daylighting simulation: dynamic paradigm [16]. In this approach, the use of hourly or even hourly intervals to describe the relevant climatic variables allows us to understand the distribution of daylight in a space in different climates and times of the year [17-18]. This new perspective also incorporates a series of dynamic metrics (DA, UDI, aUDI, and sDA among others) [19-21] that substantially improve light quantification methods (illuminances and luminances) in simulation environments. However, illuminance is essentially a two-dimensional concept insofar as it is concerned with the density of luminous flux incident at a point on a surface [3]. New advances in simulation environments and spatial illumination metrics are necessary in order to add a third dimension and consider the distribution of illumination at a point in space. Various three-dimensional illuminance metrics have been proposed over the past three decades to describe what Lynes et al. [22] referred to as the vectorial flow of light within architectural environments. “These metrics have included modeling ratios, mean cylindrical and semicylindrical illuminance, scalar (mean spherical) illuminance, semi-scalar (mean hemispherical) illuminance, vectorial illuminance, the vector-to-scalar illuminance ratio, and cubic illumination” [8]. One of the most thorough descriptions and explanations has been given by Cuttle [9] later rewritten in different books and journals [8-23,24].
Artificial and natural light affect a person's ability to procure the necessary environmental visual information, in particular, when tasks as face recognition must be done [25]. Modelling is the balance between diffuse and directional light. It is a valid criterion of lighting quality in virtually all types of interiors. The general appearance of an interior is enhanced when its structural features, the people and objects within it are lit so that form and texture are revealed clearly and pleasingly. Generally, this occurs when the light comes predominantly from one direction; the shadows, so essential to good modelling, are then formed without confusion [26]. The perception of volume, texture and the intensity of colors also depend on the direction of light: (a) strong modelling: occurs when the volume shows an excessive contrast with very dark shadows over the face, caused by a source of light with a strong directional component; (b) moderate modelling: happens when the volume of the face shows low contrast, produced mainly by diffuse light; (c) weak modelling: appears when the volume of the face shows a pleasant and well balanced contrast. Three-dimensional volume with details and textures [24].
Various studies have proposed different relationships for face and ambient modelling assessment, as described by Kruisselbrink et al. [3]: vector to scalar ratio [9]; cylindrical to horizontal illuminance ratio [27], vector to cylindrical illuminance ratio [28], and vertical to horizontal illuminance ratio [29]. In most cases, metrics developed have deepened in the field of artificial lighting.
1.1. Illumination distribution
At a theoretical level, the directionality of a point within a room is “determined based on an infinitesimal sphere that is met by an infinite number of luminance rays from all directions” [8,30]; consequently, these rays can be described as three dimensional bound vectors. In the case that the light source is not located on one of the main axes, the received illuminance at a reference point can be thought of as a vector projected on the main axes X, Y, Z [31]. In this case, cubic illuminances E(x), E(-x), E(y), E(-y), E(z) and E(-z) can be reported always with positive values. The illuminance vector ´E on each of the cubic axes therefore reads
The vector sum is also a vector (E(x,y,z)) with the illuminance as magnitude (|E|), "hence the terms vector illuminance or illumination vector" [8]. The direction of the illumination vector is the altitude angle generated between the maximum and minimum luminance rays [8,9].
This intensity of luminous flux is described by the magnitude of the illumination vector with respect to the total amount of incident light in this infinitesimal sphere, and also called scalar illumination (Esr) [22]. To reach this value, it is necessary to calculate previously symmetric components on the x, y and z axes (Eq. (5)); and symmetric illuminance (Eq. (6)).
In practice, this theoretical concept is difficult to apply, and simplifications are required to assess directionality. The indicators of the direction of the light are limited to the direction of the illumination vector. In addition, for the strength of light flow, or modeling, several indicators have been developed. Of these indicators, the vector/scale ratio is the most commonly used. These indicators are determined based on the cubic illumination measured by means of single photocell methods to measure successively six faces of a cube, or of a cubic six-cell photometer. "Subsequently, the scalar, cylindrical, horizontal and vertical illuminance are calculated by adding the relevant sensor pairs" [9].
All the methods described for direction and modeling use absolute and instantaneous values [3], according to static methods, except the one proposed by Howlett et al. [32] based in luminance maps. This approach reduces the dynamic of daylight and it´s interaction with the environment into a single prediction value, limiting the predictive potential of simulation environments in daylight assessment. Advanced simulation environments enable annual dynamic analysis of daylight on an hourly basis. In the scientific and technical field’s dynamic paradigm is well established and validated. In the last few years it has been applied in many international standards and recommendations (EN 12464-122, IES LM-83-12 y LEED IEQ, among others). Nevertheless, the search for an improved description of daylight performance, leads to further deepen the study of simulation tools and metrics. In this context, the main objective of the present work was to advance in the development of cubic dynamic daylight metrics (distribution of illumination at a point in space), as a complement to the two dimensional analysis currently employed (density of luminous flux incident at a point on a surface), promoting the use of Climate Based Daylight Modelling (CBDM). For this purpose, the following issues were considered:
1. Daylight analysis through modelling index, according to dynamic daylight paradigm, is assessed.
2. New dynamic daylight metric: "useful cylindrical to horizontal illuminance ratio (uEc/Eh(0.3-0.6))", is proposed.
3. Visualization and analysis of the obtained dynamic daylight results.
As a case study the Lavalle Public Library (Latitude -32.721157; Longitude -68.602050), located in the Department of Lavalle, 36 km from the city of Mendoza-Argentina, was selected.
2. Method
2.1. Case study description
The Lavalle Public Library was opened in September 2014. The building has a compact layout which has a total area of 172 m². It´s main facade has a north facing exposure. In order to carry out this study, two rooms were selected: Reading Room 1 (RR1) (26.3 m²) and Reading Room 2 (RR2) 46.5 m² (Fig. 1). These two rooms are connected by a hall.
Figure 1
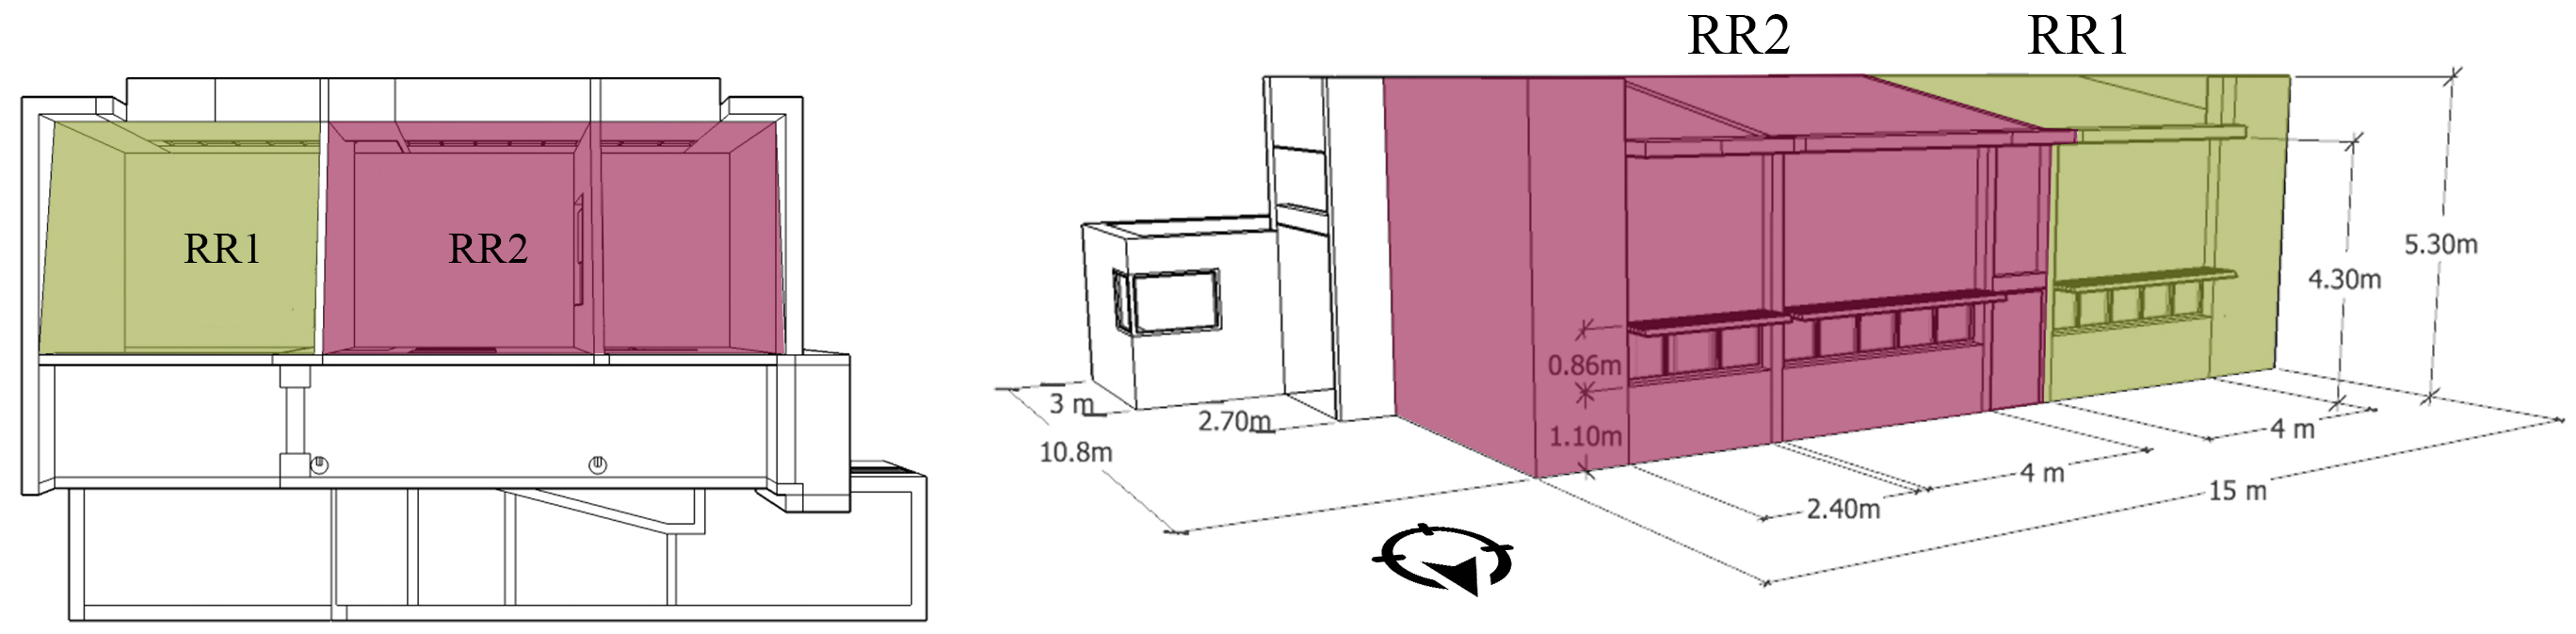
Fig. 1. 3D model of the Lavalle Public Library (Reading Rooms 1 and 2) – Source: INAHE – CCT CONICET Mendoza.
2.2. Validation
In this section we seek to validate the virtual model of the library from data (horizontal illuminance) measured in situ. The data used were those registered by the Research Group of Sustainable Daylighting of the Institute of Environment, Habitat and Energy National Scientific and Technical Research Council (INAHE CONICET-CCT Mendoza) in the instance of human resources training and direction of post-graduate thesis [33]. The statistic employed to perform the comparison of the data sets (measured and simulated) is root-mean-square error (RMSE). The RMSE allows determining the difference between the measured and the simulated horizontal illuminance values. The average 0.25 (RMSE (RR1) = 0.23 and RMSE (RR2) = 0.28) (Table 1).
Table 1
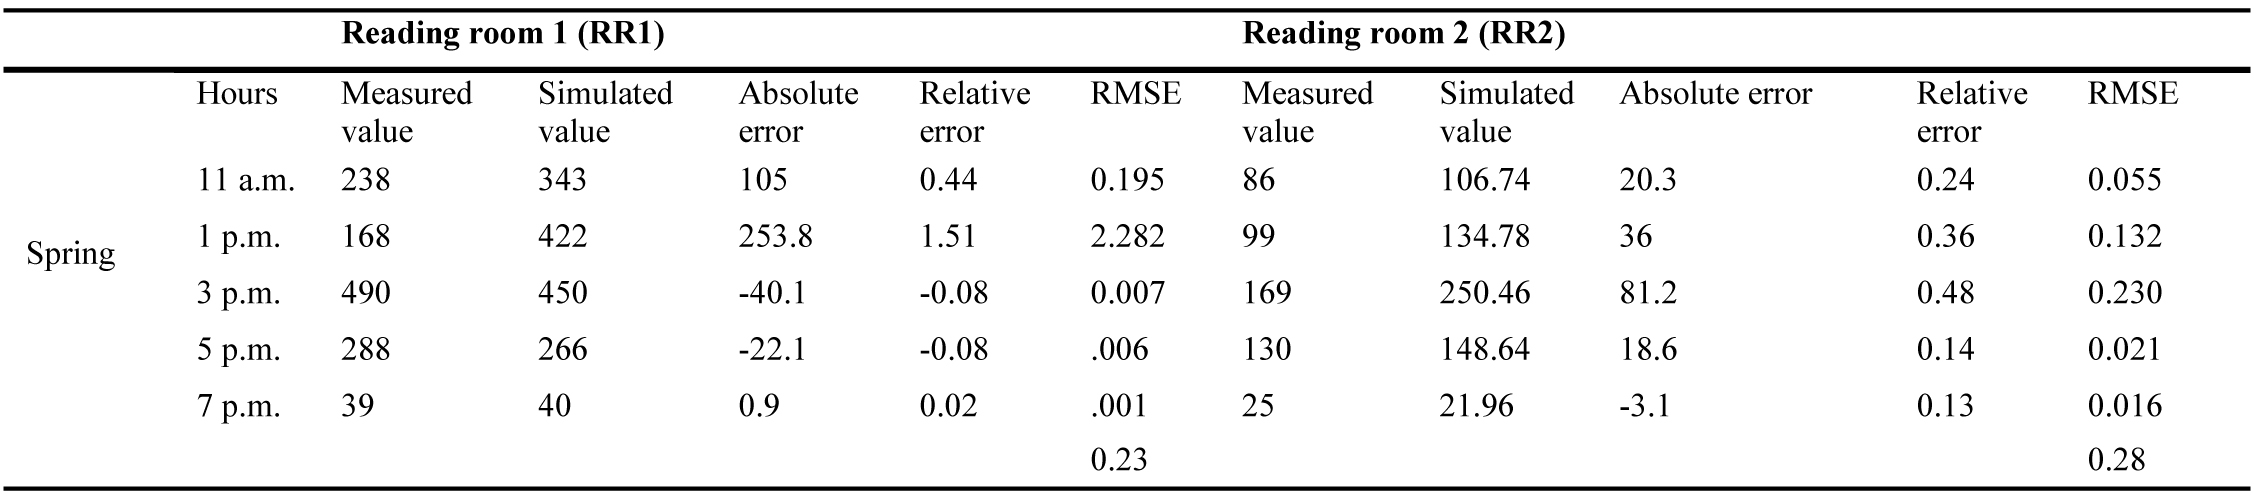
Table 1. Validation of the virtual model - RMSE average of 0.25.
2.3. Daylight modelling
2.3.1. Daylight simulation
The CAD model of the library was generated with Trimble SketchUp Make v. 2015. This software has ruby code language, an interpreted, reflexive and object-oriented programming language, which makes it easier for users to generate program segments to modify its functionality. Within this code language, we worked with Warehouse Groundhog extension [34] Open Source v.3 (GPLv3), in order to export 3D models to the RADIANCE environment. RADIANCE [35,36] is a highly accurate raytracing software, considered one of the most powerful and popular forms of lighting simulation software, it has been extensively validated in the last 20 years [37].
Table 2 shows the methods used for optical characterization of the materials that make up the shading and solar control systems used in the studied rooms.
Table 2
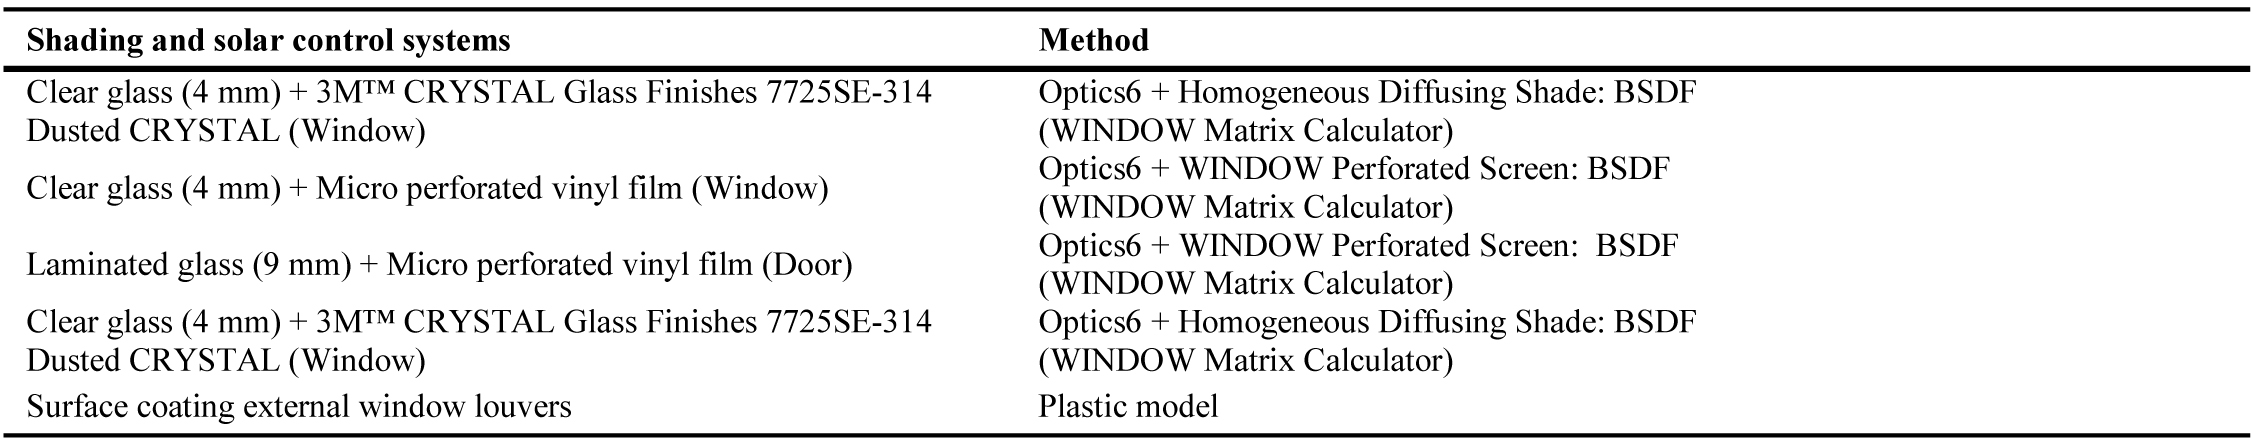
Table 2. Methods used for optical characterization of shading and solar control systems.
Surface reflectances are the following: walls (rho = 0.77); ceiling (rho= 0.80); floor (rho = 0.45); outside ground (rho = 0.13).
Simulations were performed using weather data file ARG_MendozaCCT (landbased station data), which corresponds to the city of Mendoza. This database was generated from information provided by measuring stations of daylight at the Institute of Environment, Housing and Energy (INAHE), located in the Science and Technology Center Mendoza (32° 52' S and 68°51' W) [18]. The simulation parameters used in RADIANCE correspond to Jacobs´s accurate scene [38] (ab) 5; (ad) 2048; (as) 512; (aa) 0.08; (ar) 512; (dt) 0; (ds) 0.
2.3.2. Dynamic daylight performance metrics
In order to analyze the luminous behavior inside the selected rooms, two dynamic daylighting metrics were used. Spatial Daylight Autonomy (sDA) is expressed as a percentage of area. As proposed by the IES LM-82-12 [21] sDA, gives a clear vision of the area percentage that meets illuminance requirements (at least 300 lx) for a specified fraction of the operating hours per year (50% of the hours) (sDA(300lx, 50%)). To measure horizontal illuminance values, two grids of sensors were arranged at the height of 0.8 m in a homogenous distribution -the distance between the sensors was 0.5 m-: Reading Room 1 (16 sensor grid) and Reading Room 2 (24 sensor grid). As a complementary analysis, the annual uniformity of the surfaces (Uo = Emin/Eaverage) will be calculated looking for the annual percentage of Uo > = 0.4 in the different surfaces throughout the year.
Daylight performance on vertical surfaces (walls) in both rooms is analyzed based on sDA and a new reference value of illuminance (175 lx), established in the international standart guide [39]. This analysis gives a clear vision of the percentage of area that meets illuminance requirements within the established range (175 lx) for a specified fraction of the operating hours per year (50% of the hours) (sDA(175lx, 50%)). In order to be able to measure vertical illuminance values, three grids of sensors in each space were arranged on the walls with a distance between the sensors of 0.5 m: Reading Room 1 (60 sensor, divided in three surface grids E, W and S with 20 sensors each); and Reading Room 2 (70 sensor, divided in three surface grids E, W -20 sensor per grid- and S -30 sensor grid-).
The underlying principle of cubic illumination was proposed by Cuttle [9]. “Six measured or predicted illuminance values on the facets of a cube enable estimation of a range of spatial illumination metrics” [40]. The benefit of using vector algebra is that it provides a framework for lighting calculations that deals concisely and consistently with both dimensions and illuminances, and this opens up opportunities to really explore illumination as a three-dimensional concept [40]. For this purpose, cylindrical to horizontal illuminance ratio was used as proposed by EN12464-1 [26].
Cylindrical illuminance (Ecl) (Eq. 8) has been previously proposed as an index of the perceived adequacy of ambient illumination [27] (a). It also serves as a measure of average vertical illuminance. Its relation with horizontal illuminance, cylindrical illuminance to horizontal ratio (Ecl/Ewp), has been proposed as a modelling index. Standard proposes modelling calculation within a space to reveal form and texture with respect to structural features, people and objects within the space [26].
In order to assess cylindrical to horizontal illuminance ratio (Ecl/Ewp), in the studied rooms two nodes were selected in each space. Occurrence of Ecl/Ewp between 0.30 – 0.60 at 1.2 m above floor was analyzed. A node selection and location criterion was proximity to the source of daylight (window). In RR1 node 14, is located in front of the north window and node 7 is located in the opposite corner, away from the window. In RR2 node 20 is closest to the north window and node 9 is in the opposite corner (Fig. 2). The nomenclature of the nodes is in accordance with their designation on the grids.
Figure 2
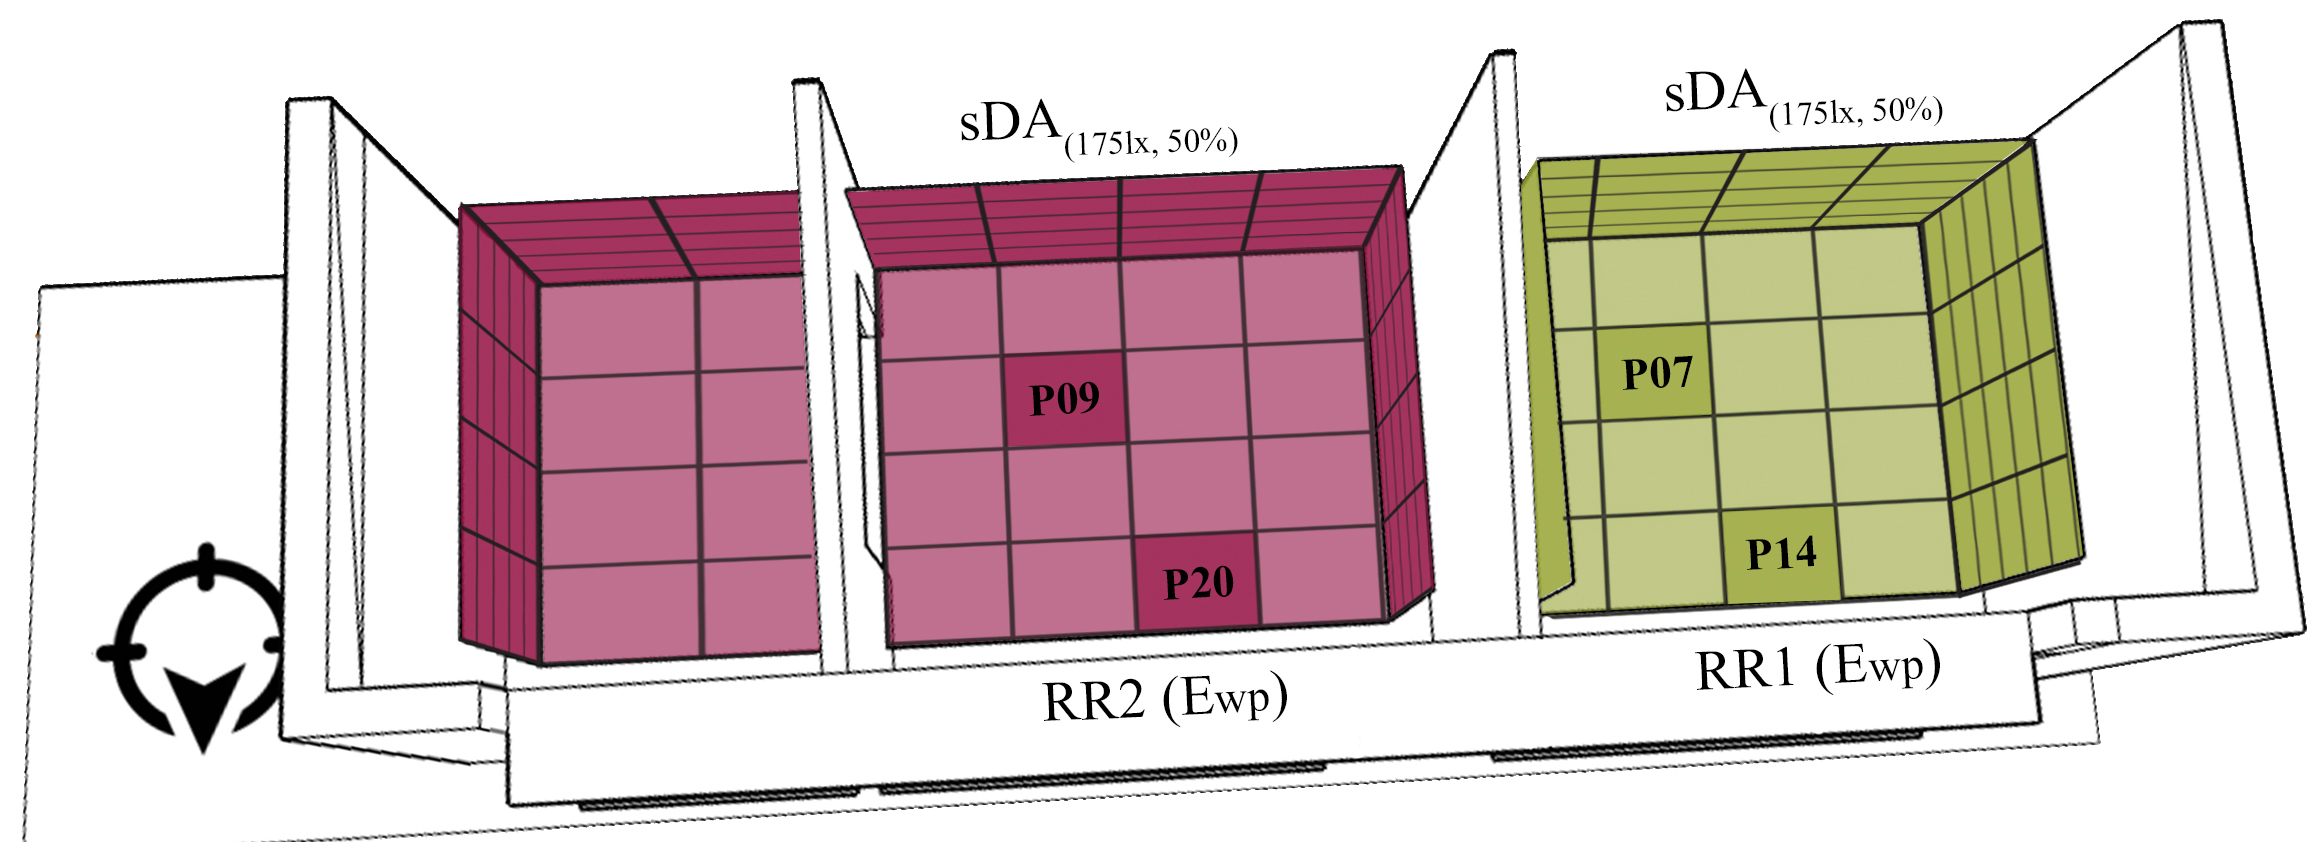
Fig. 2. Grids and individual points analyzed – Source: INAHE – CCT CONICET Mendoza.
The importance of modelling lies in its relation with the recognition of three-dimensional objects and the feeling of pleasure and acceptance of an installation that may be judged by natural appearance of people, along with object detection [41]. “The lighting should not be too directional or it will produce harsh shadows, neither should it be too diffuse or the modelling effect will be lost entirely, resulting in a very dull luminous environment” [32].
In accordance with what has been previously exposed, a new concept for dynamic daylight analysis is proposed: useful modelling indexes (UMIs). This approach seeks to quantify the annual occurrence of desired daylighting conditions using modelling performance indicators, such as useful cylindrical to horizontal illuminance ratio (uEcl/Eh(0.3-0.6)). This method estimates the annual occurrence (%) of uEcl/Ewp between 0.3-0.6 in the selected node. Furthermore, this procedure can be linked to dynamic daylight analysis with traditional metrics (density of luminous flux incident at a point on a surface) in order to improve the quality of daylighting performance studies (Fig. 3).
Figure 3
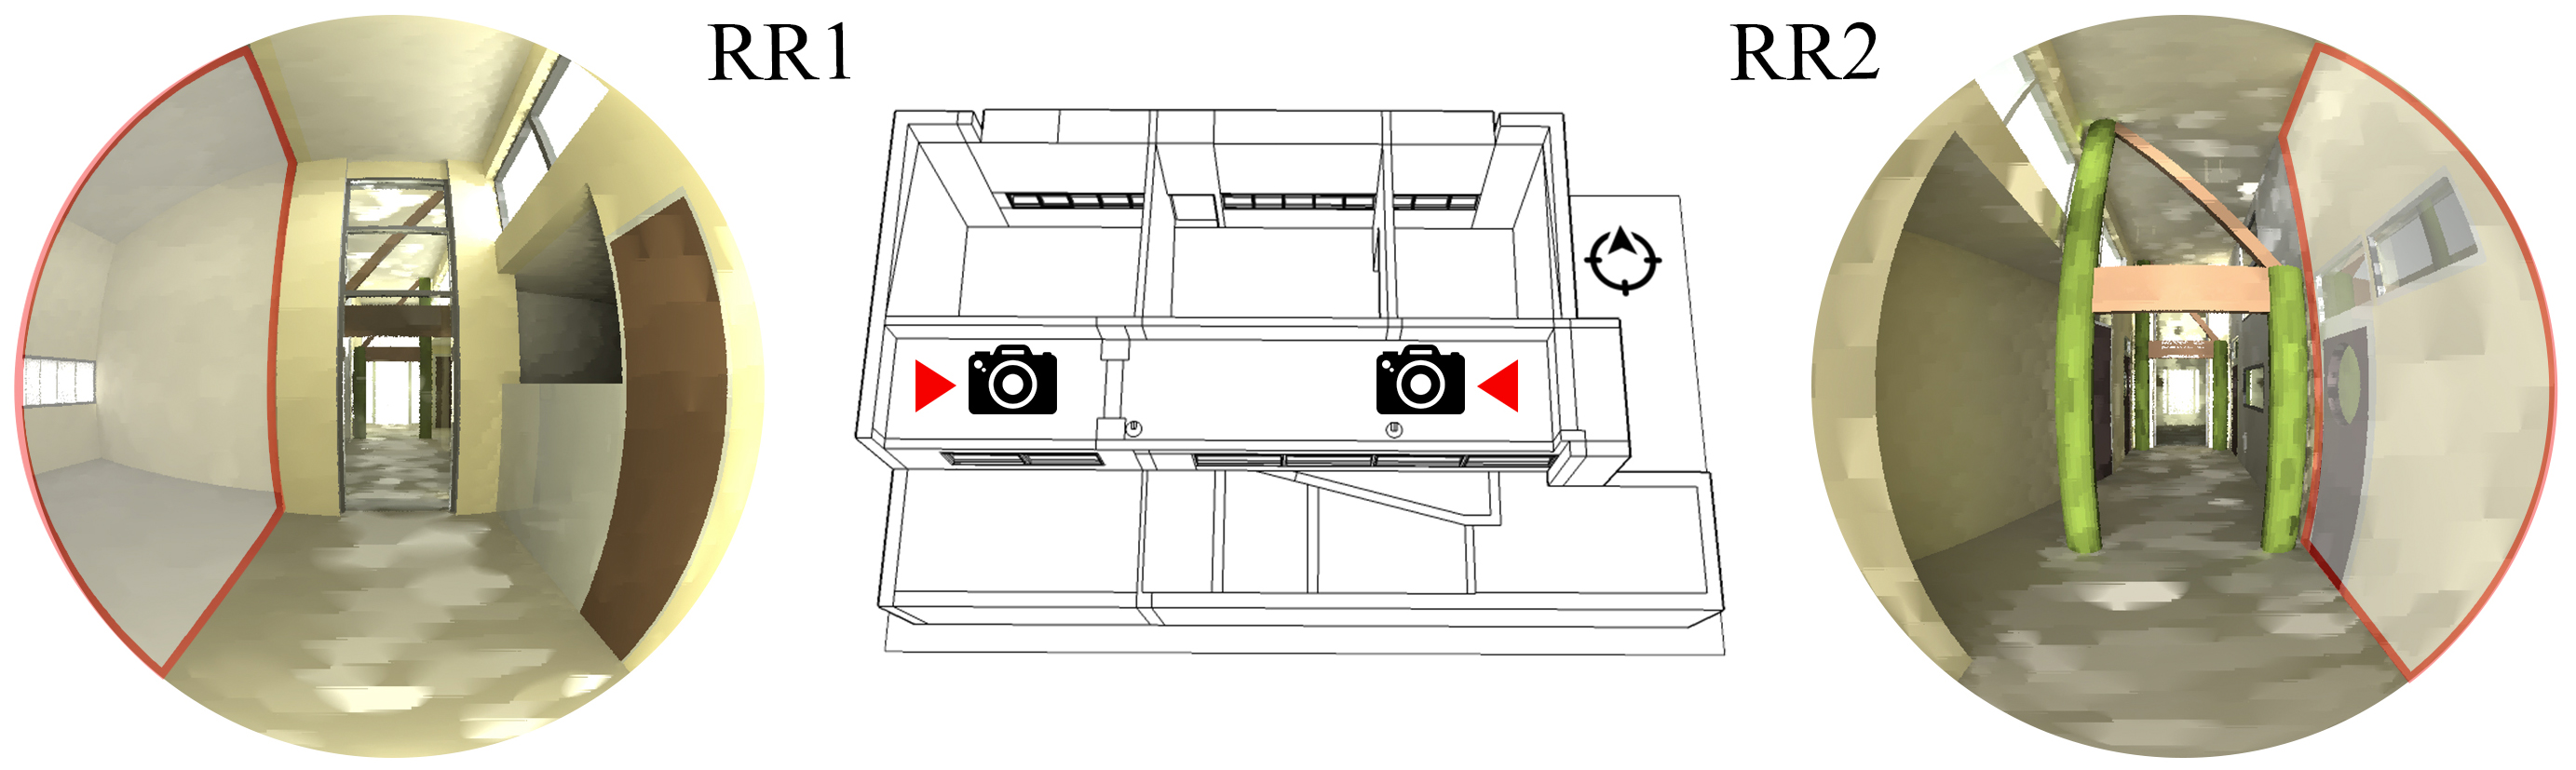
Fig. 3. Results of sDA(300lx, 50%) and sDA(175lx, 50%).
3. Results
3.1. Two Dimensional Concept: Spatial Daylight Autonomy (sDA)
In Fig. 3 and Table 3, results show two differing lighting situations in adjacent spaces. In RR1 the sDA(300lx, 50%) is 100%, this means that all the nodes of the tested grid have values of illuminance above 300 lx over 50% of the operating hours per year. When analyzing the obtained values of uniformity (Uo) in it can be seen that the horizontal illuminances have annual Uo = 67.63% in RR1 and Uo = 57.20% in RR2.
Table 3
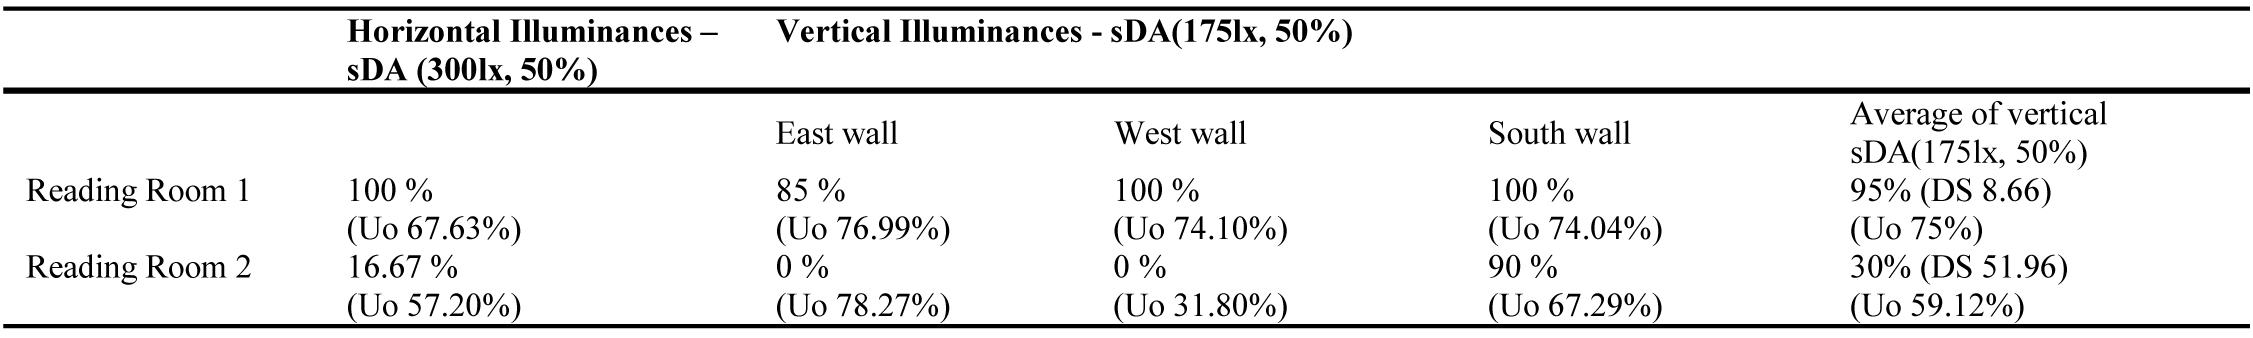
Table 3. Results of sDA(100lx, 50%), sDA(175lx, 50%) and Uo in Reading Room 1 and Reading Room 2.
Likewise, when considering vertical illuminance we can emphasize that the sDA(300lx, 50%) is over 85% in all the analyzed surfaces in RR1 (average 95% (SD 8.66)). In RR2 results indicate that annual sDA(300lx, 50%) is 16.67%. This value is far below the observed in RR1; there is a difference between both rooms above 80%. The results obtained in RR2 with respect to vertical surfaces (sDA(175lx, 50%)) range from 0% -east wall and west wall- to 90% -south wall-. Average sDA on these surfaces is 30% (DS 51.96), presenting a difference of sDA (175lx, 50%) with space RR1 of 65%. When analyzing the annual Uo on vertical surfaces, we can see that in RR1 in the west, east and north walls the annual Uo exceeds 75% (ΔUo < 3%), while in RR2 it decreases to 57.20%. It is further observed that RR2 has a higher variation in the annual percentage of uniformity, with a Uo > 67% on west and north walls, and on the east wall with a Uo = 31.80%.
The differences in daylight performance of RR1 and RR2 are mainly due to the fact that RR1 gains diffuse visible solar radiation thanks to the opening located on the southern wall. RR2 has an almost completely blind wall that separates the reading room from the hall which blocks the daylight coming in through the south windows (Fig. 4).
Figure 4
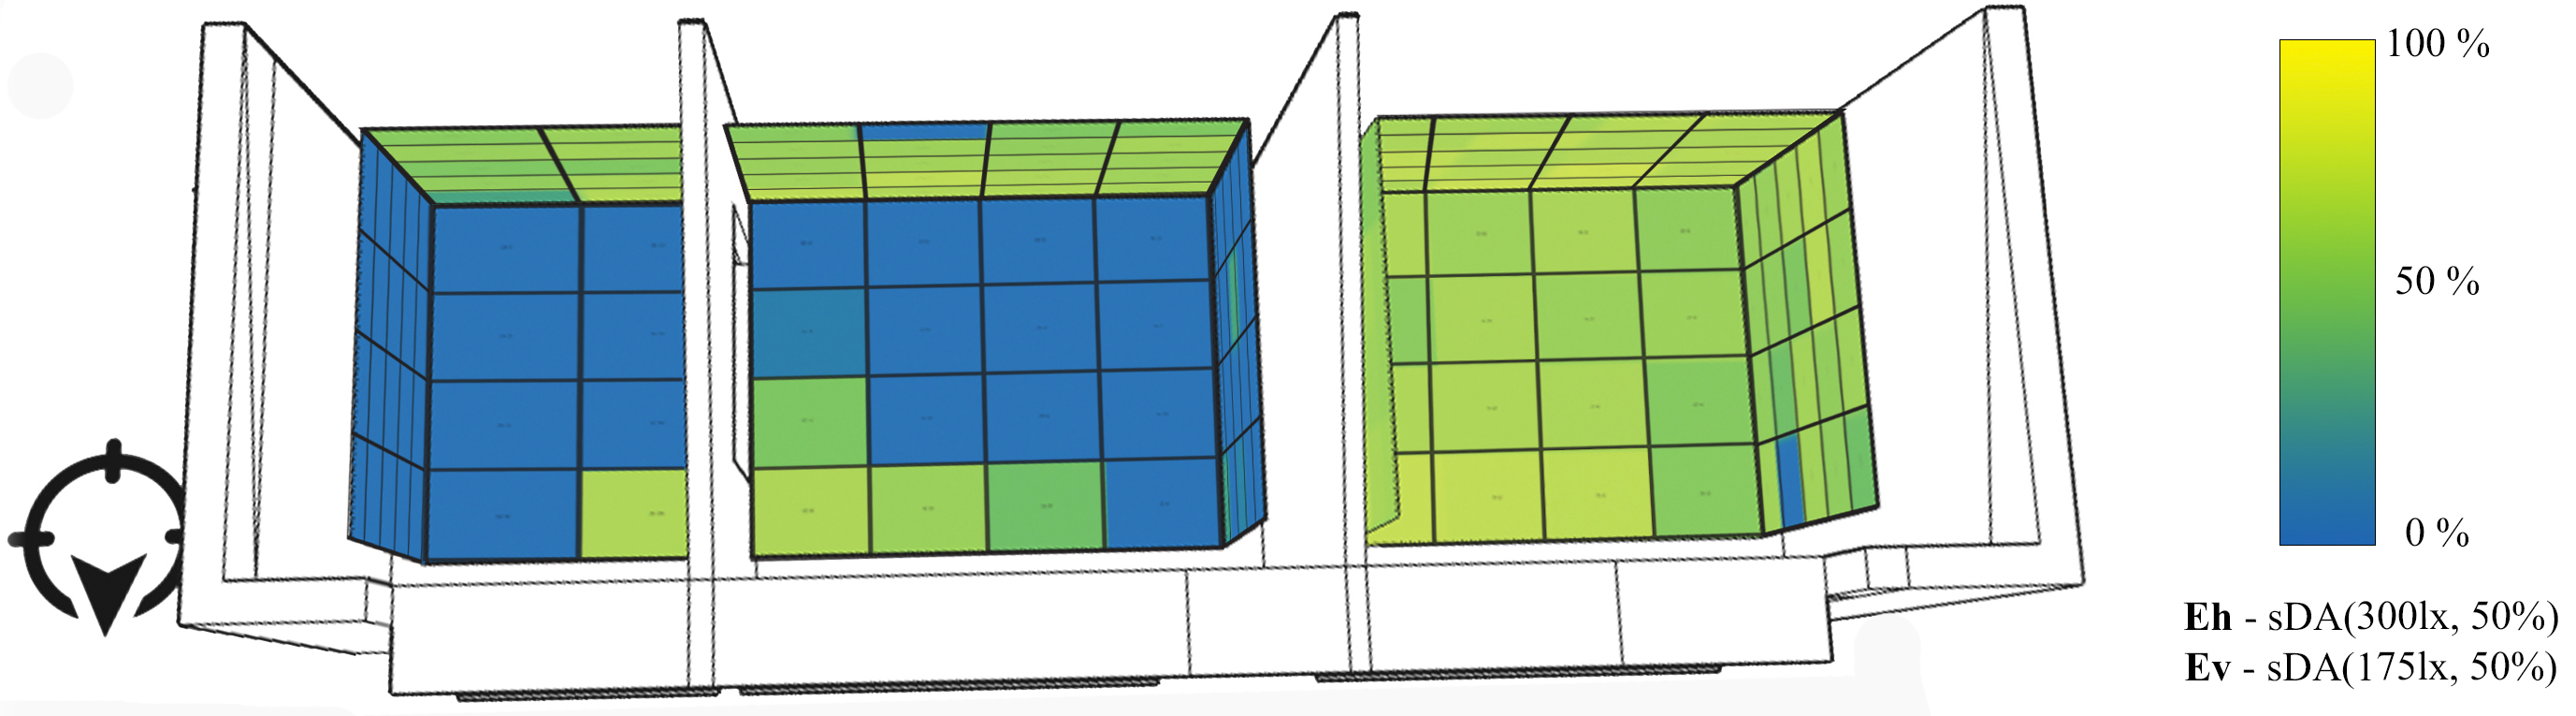
Fig. 4. Results of uEcl/Ewp(0.3-0.6) measurement in points 7 & 14 (RR1) and 9 & 20 (RR2). (a) Ecl/Ewp(0.3-0.6) 46.05 % - Point 7 (Reading Room 1), (b) uEcl/Ewp(0.3-0.6) 69.32 % - Point 14 (Reading Room 1), (c) uEcl/Ewp(0.3-0.6) 9.79% - Point 9 (Reading Room 2), and (d) uEcl/Ewp(0.3-0.6) 72.24 % - Point 20 (Reading Room 2).
3.2. Three dimensional concept: Cubic Illuminance
Cubic illuminance illustrates how the light field surrounding the point will interact with a three-dimensional object that is placed at the point. The following tables (Tables 4-7) show average annual values of cubic illuminance, vector components, symmetric components, uEcl/Ewp(0.3-0.6) and DA(300lx).
Table 4
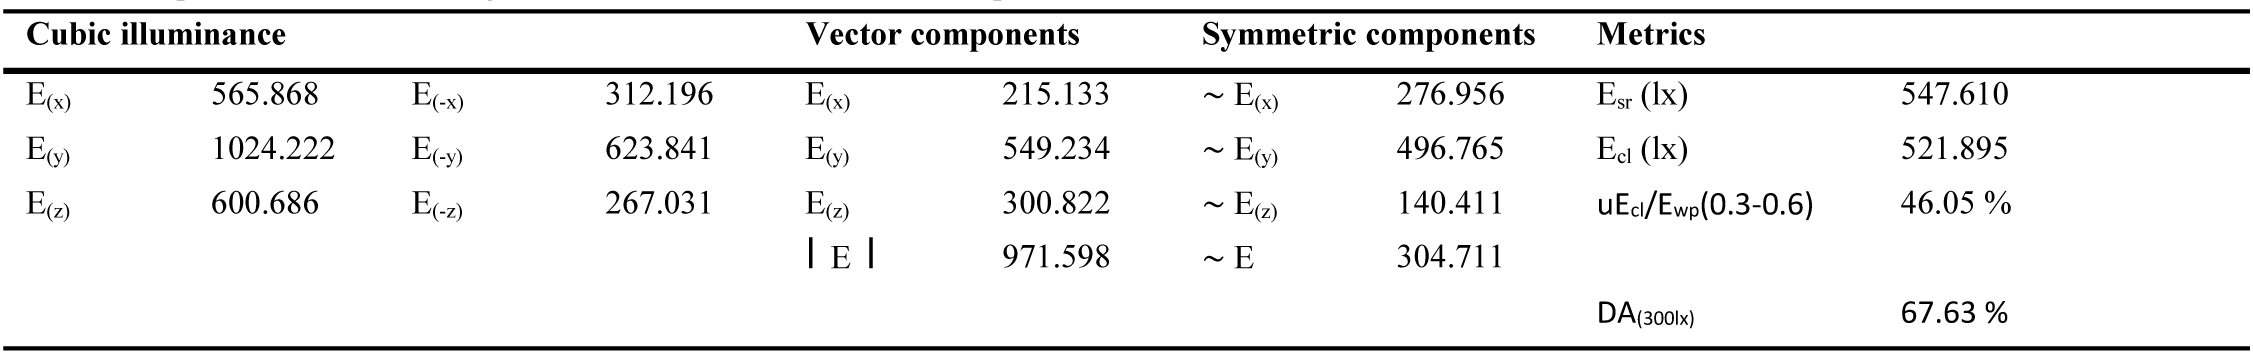
Table 4. Output of the annual average cubic illumination measurement in point 7 - RR1 – Source: Author.
Table 5
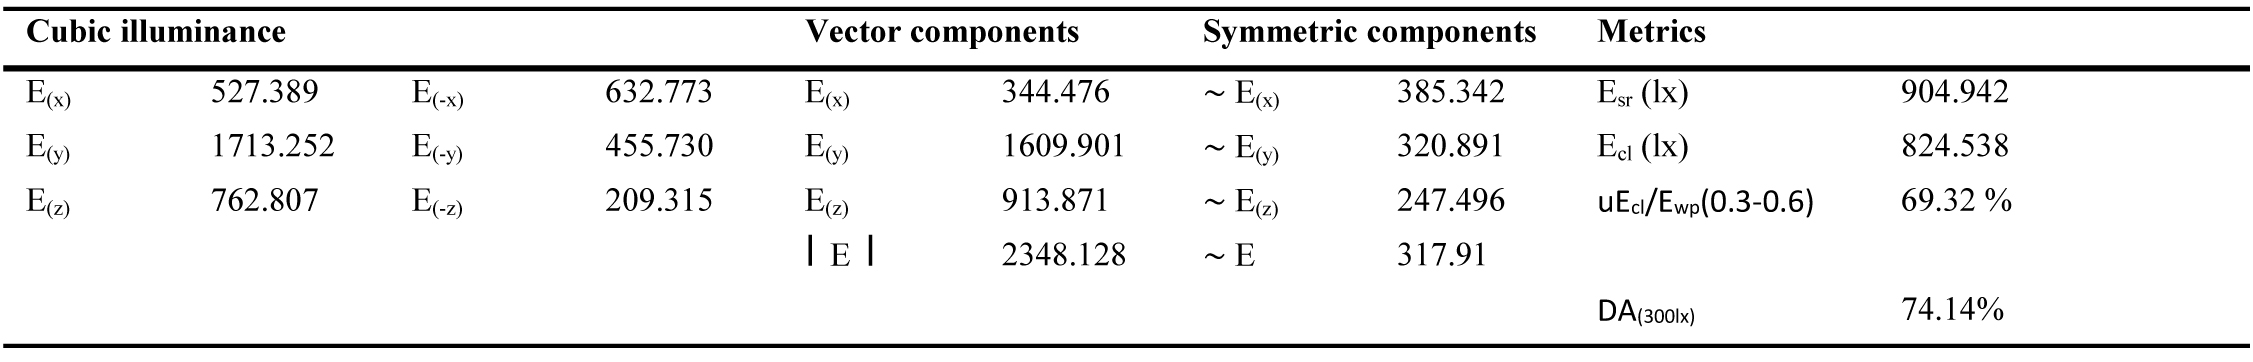
Table 5. Output of the annual average cubic illumination measurement in point 14 - RR1 – Source: Author.
Table 6
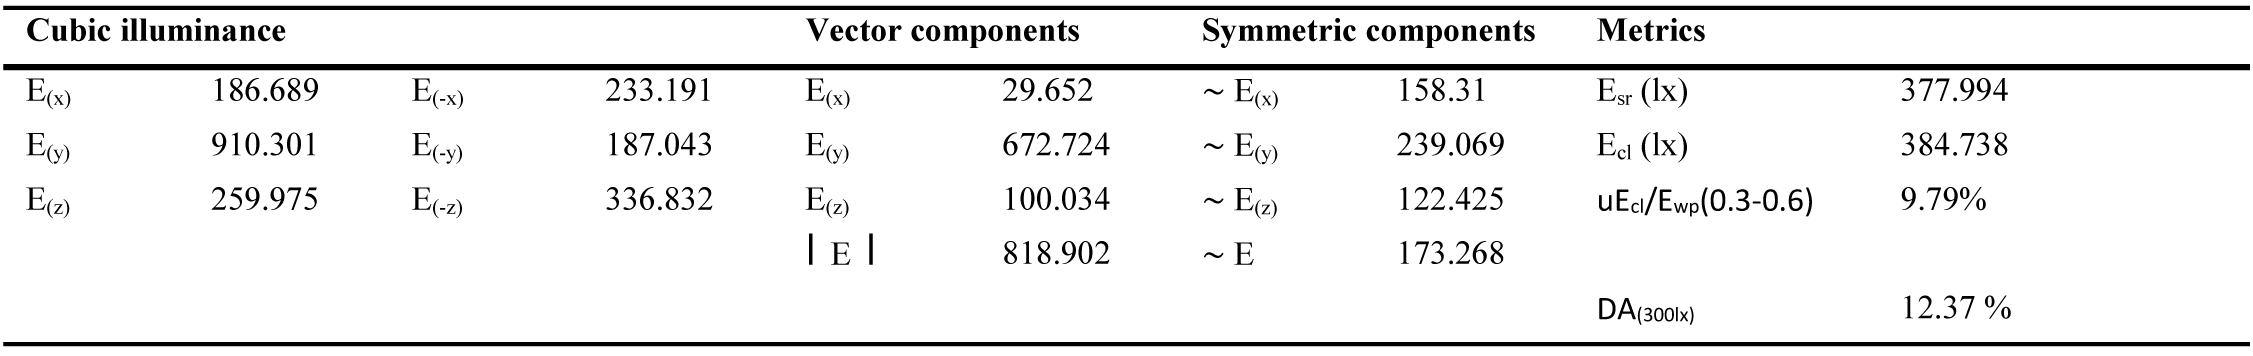
Table 6. Output of the annual average cubic illumination measurement in point 9 - RR2 – Source: Author.
Table 7
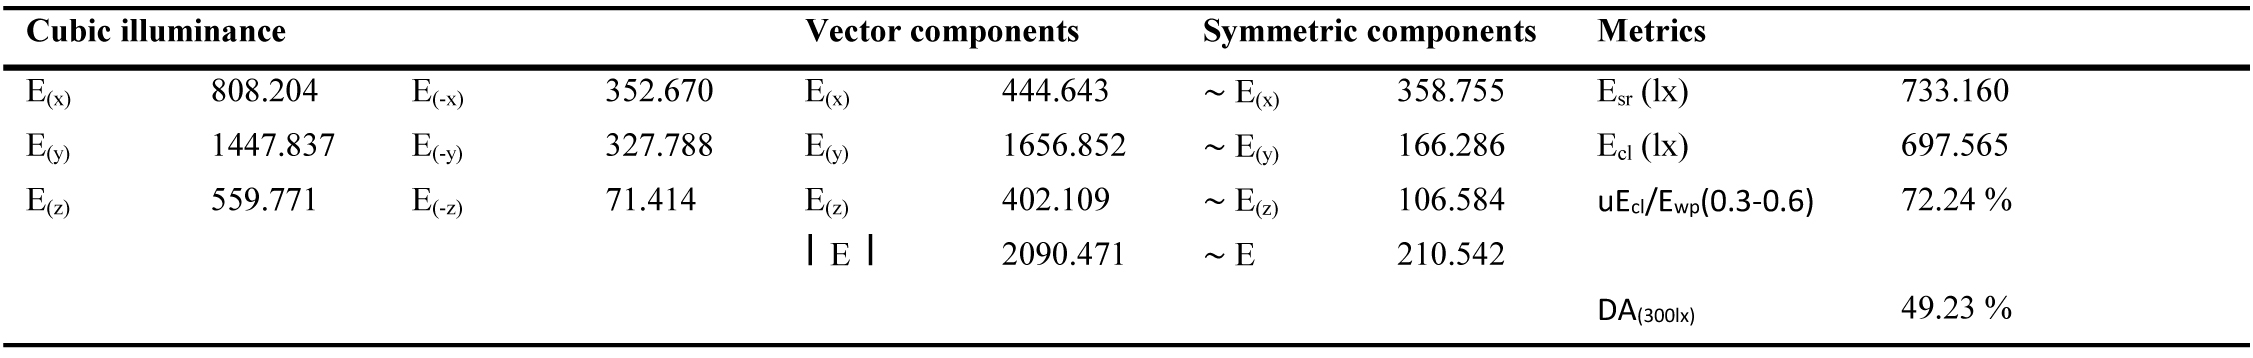
Table 7. Output of the annual average cubic illumination measurement in point 20 - RR2 – Source: Author.
When analyzing uEcl/Ewp(0.3-0.6) in RR1, one can observe that the highest percentage of annual useful modelling situations (0.30-0.60) is achieved in node 14 (69.32%.). This point is located close to the north window. Point 7, located away from windows, shows a lower percentage of uEcl/Ewp(0.3-0.6) (46.05%). The difference between the two nodes located in RR1 is < 24%. Similar results between both nodes were observed for DA(300lx). Node 14, closest to the window, has a higher annual percentage of DA(300lx) (74.14%), whereas DA(300lx) in node 7 is 67.63%. the difference in this metric is lower than the observed for uEcl/Ewp(0.3-0.6).
In RR2 the values of uEcl/Ewp(0.3-0.6) for nodes 9 and 20 show a significant difference (> 60%). uEcl/Ewp(0.3-0.6) below 10 % for node 9 and above 70 % for node 20 (Table 4). Likewise, DA(300lx) on nodes 9 and 20 show a significant difference (above 35%). With respect to RR1 similar values of uEcl/Ewp(0.3-0.6) are detected in both rooms (RR1 and RR2) in nodes 14 and 20 (near north opening). Yet there are significant differences of uEcl/Ewp(0.3-0.6) between nodes 7 and 9 (<36%), this is due to the obstruction of a south opening in RR2. In order to display results in a visual manner the following graphs present results obtained for modeling index: uEcl/Ewp(0.3-0.6), in the four nodes analyzed. In a similar way as annual daylighting availability, occupancy schedules and annual glare are plotted, this graphs show uEcl/Ewp(0.3-0.6) according to dynamic paradigm: 24 hours (y axis); 365 days of the year (x axis). They can easily be used to visualize the occurrence of a daylight condition (e.g. uEcl/Ewp(0.3-0.6)) throughout the year (Tables 4-7) and detect effectively situations with strong criticisms. For instance, nodes 14 and 20 (percentages of uEcl/Ewp(0.3-0.6) > 69%) present deficient modelling conditions (by excess or defect) during the winter period, specifically between 4:00 p.m. and 5:00 p.m. This situation reverts from 6:00 p.m. until the end of the day. This information is very useful to identify daylighting conditions and implement actions that can improve it.
4. Discussion
Dynamic paradigm in simulation has resulted in new indexes and significant progress in daylight performance analysis, mainly on horizontal surfaces through daylighting metrics based on horizontal illuminance (DF, UDI, DA, DAcon, sDA, among others). However, the use of new technologies (e.g. projectors) and the complexity of indoor spaces have spawned the need to add vertical surface to dynamic daylight analysis. This paper assesses daylight performance on vertical and horizontal surfaces. This information makes it possible to analyze daylight performance in a detailed manner in the studied rooms. On the one hand, important differences in horizontal illuminance between RR1 and RR2 were detected (∆sDA(300lx, 50%) > 80%); on the other hand, the study shows that RR1 achieves a homogeneous distribution of daylight in its walls, while RR2 has a substantial disparity between vertical illuminance incident on its walls: east and west: ∆sDA(175lx, 50%) = 0%; south: ∆sDA(175lx, 50%) = 90%. It was also detected that east and west vertical surfaces also differ markedly in the two studied rooms (∆sDA(175lx, 50%) > 85%), while south vertical surfaces (facing the window) in both rooms have similar daylight performance (∆sDA(175lx, 50%) = 10%).
Previously analyzed data does not only show the daylight performance of the studied spaces it can also guide the use of daylighting strategies. In current case study the helpful effect of south and north openings in RR1 can be observed: north opening with a correct shading strategy and diffuse daylight provided by the south window. RR1 and RR2 have 6 lighting devices (without diffusing screen) with 2 T8 (36 W) fluorescent tubes each, resulting in an installed power of 432 W. If we consider the number of hours that artificial lighting system should remain on the in each room, an increase of 36.98% can be detected in RR2 compared to RR1. This increase is equivalent to 7580 kWh/year. This type of assessments enables us to recognize the importance of the proper use of daylighting strategies and systems as an influencing factor on energy consumption and visual comfort.
Furthermore, it is important to mention that 2D metrics (density of luminous flux incident at a point on a surface) display a more uniform behavior than 3D metrics (distribution of illumination at a point in space). This shows itself clearly if we take into account that difference in sDA are much lower than difference in uEcl/Ewp(0.3-0.6), if we compare nodes closest to the north windows to does that are far from it, in both rooms (RR1 and RR2). This results from the fact that cubic metrics are more sensitive to the direction of light. This is quite clearly seen if we consider that nodes which are furthest from the north opening have uEcl/Ewp(0.3-0.6) substantially lower than those closest to the north window. This is of crucial importance for daylight studies in clear sky condition, due to the defined direction of direct solar radiation.
As described previously in this paper, the objective of this research is to make further progress in dynamic daylight paradigm by incorporating cubic metrics, while preserving accuracy and validation of dynamic simulation. In this context, it is important to point out that simulation and data processing were performed in freeware software’s and extensions (RADIANCE, SageMath and Groundhog). The proposed method is currently limited to experts in the field with programming skills; however, it can be adapted to user-friendly interfaces. With regard to the latter, another aspect worth highlighting is the use annual useful cylindrical to horizontal illuminance ratio (uEcl/Ewp(0.3-0.6)) graphics to facilitate the comprehension of daylight performance, as frequently used for annual glare analysis. In future studies it is expected to work on modelling annual analysis by generating new ranges, which not only quantify the occurrence of desired or useful modelling, but also conditions by default (weak modelling (uEcl/Ewp(<0.3))) and excess (strong modelling (uEcl/Ewp(>0.6))).
5. Conclusions
This paper corresponds to a research area focused on the study of daylight performance in indoor spaces, promoting the use of Climate Based Daylight Modelling (CBDM). The authors of this work have produced several studies in this area previously [18-42,43]. The main findings of this research are:
i. New approach to daylighting performance analysis based on the addition of cubic metrics to dynamic daylight paradigm are studied. Useful modelling indexs (UMIs) seeks to integrate various different light modelling indexes to dynamic paradigm, in accordance with useful daylight illuminances (UDI). UMIs make it possible to quantify annual occurrence of proper light modelling conditions. As an initial approach of UMIs, cylindrical to horizontal illuminance ratio (Ecl/Ewp(0.3-0.6)) has been considered, due to its current use in standard [26]. It is important to consider that this dynamic methodology can be applied to other modelling indicators that arise from the information obtained from cubic illuminance, such as: vector to scalar ratio [9], vector to cylindrical illuminance ratio [28], and vertical to horizontal illuminance ratio [29].
ii. Considering 2D metrics (density of luminous flux incident at a point on a surface) based on illuminance results show important differences in horizontal illuminance (RR1: sDA(300lx, 50) 100%; RR2: sDA(300lx, 50) 16.67%) and vertical illuminance (RR1: mean sDA(175lx, 50) 95%; RR2: mean sDA(175lx, 50) 30%). These data not only reveal the differences in the behavior of daylight between the two rooms but also, highlights the need to add vertical surface assessment to dynamic daylight analysis, according to the activities that are currently carried out in the learning spaces. With regard to 3D metrics (distribution of illumination at a point in space), as previously discussed, similar values of uEcl/Ewp(0.3-0.6) are detected in both rooms (RR1 node 14 = 69.32% and RR2 node 20 = 72.24%) in nodes near north opening. Yet there are significant differences between nodes located near the south wall (RR1 node 7 = 46.05 % and RR2 node 9 = 9.79%). The analysis points out that 2D metrics (RR1: DA(300lx, 50) node 7: 67.63%; DA(300lx, 50) node 14: 74.14% / RR2: DA(300lx, 50) node 9: 12.37 %; DA(300lx, 50) node 20: 49.23%) show a more uniform behavior than 3D metrics, if we compare nodes closest to the north windows (point 14 and point 20) to does that are far from it (point 07 and point 09), in both rooms (RR1 and RR2). For the current case study, results show that 3D metrics are more responsive to the direction of light. This is a fundamental issue in clear sky condition daylighting studies considering high direct solar radiation availability.
Finally, the aim of this research is to apply cubic metrics in dynamic daylight simulations. As we all know, there are different modeling indexes: vector to scalar ratio; cylindrical to horizontal illuminance ratio, vector to cylindrical illuminance ratio, and vertical to horizontal illuminance ratio. This gives rise to new questions: which of the modelling indexes will reach a more representative result in daylight analysis? If any, which one is more precise under clear sky conditions?
Acknowledgment
The authors disclosed receipt of the following financial support for the research, authorship, and/or publication of this article: This research was supported by National Scientific and Technical Research Council (CONICET, Argentina) - PIP-0728-CONICET, and the National Agency for Scientific and Technological Promotion (ANPCyT, Argentina) - PICT-2013-2889 / PICT-2016-0872. The funding source had no involvement in this study design; in the collection, analysis and interpretation of data; in the writing of the report; or in the decision to submit the article for publication.
Contributions
All authors are contributed equally.
References
- P. Boyce, Lighting quality for all, in: CISBE SLL Int. Light. Conf., 2013, pp. 1–5, Dublin.
- J. A. Veitch and G. R. Newsham, Determinants of Lighting Quality I: State of the Science, Journal of the Illuminating Engineering Society 27 (1998) 92–106. https://doi.org/10.1080%2F00994480.1998.10748215
- T. Kruisselbrink, R. Dangol, and A. Rosemann, Photometric measurements of lighting quality: An overview, Building and Environment 138 (2018) 42–52. https://doi.org/10.1016%2Fj.buildenv.2018.04.028
- T. M. Goodman, Measurement and specification of lighting: a look at the future, Light. Res. Technol. 41 (2009) 229–243. http://dx.doi.org/10.1177/ 1477153509338881
- M., Christophe, M. Fontoynont, J. Christoffersen, M.C. Dubois, J. Wienold, and W. Osterhaus, User Assessment of Visual Comfort: Review of Existing Methods’. Ingélux (France) with Danish Building Research Institute (SBi, Denmark) and Fraunhofer Institute for Solar Energy Systems (ISE, Germany), 2003.
- J. Wienold, J. Christoffersen, Evaluation methods and development of a new glare prediction model for daylight environments with the use of CCD cameras, Energy and Buildings 38 (2006) 743–757. http://dx.doi.org/10.1016/j.enbuild.2006.03.017
- R.J. Lucas, S.N. Peirson, D.M. Berson, T.M. Brown, H.M. Cooper, C.A. Czeisler, M.G. Figueiro, P.D. Gamlin, S.W. Lockley, J.B. O'Hagan, L.L.A. Price, I. Provencio, D.J. Skene, G.C. Brainard, Measuring and using light in the melanopsin age, Trends Neurosci. 37 (2014) 1–9. http://dx.doi.org/10.1016/j.tins.2013.10.004
- I. Ashdown, The virtual Photometer: modeling the flow of light, IESNA 1998 Annu. Conf. Tech. Pap, 1998.
- C. Cuttle, Cubic illumination, Lighting Research and Technology, vol. 29, no. 1, pp. 1–14, Mar. 1997. https://doi.org/10.1177%2F14771535970290010601
- W.J.M. van Bommel, G.J. van den Beld, Lighting for work: a review of visual and biological effects, Lighting Research and Technology 36 (2004) 255–269. http://dx.doi.org/10. 1191/1365782804li122oa
- P.R. Tregenza, I.M.Waters, Daylight coefficients, Lighting Research and Technology 15 (1983) 65-71. https://doi.org/10.1177%2F096032718301500201
- J. Mardaljevic, L. Heschong, E. Lee. Daylight metrics and energy savings, Lighting Research and Technology 41 (2009) 261–283. https://doi.org/10.1177%2F1477153509339703
- C.F. Reinhart, J. Wienold, The daylighting dashboard a simulation-based design analysis for daylit spaces, Building and Environment 46 (2011) 386-396. https://doi.org/10.1016/j.buildenv.2010.08.001
- M. Andersen, S. Kleindienst, L. Yi , J. Lee, M. Bodart, B. Cutler, Informing daylighting design with the Lightsove approach: Why and how in: Conference on Passive and Low Energy Architecture, 2008, Dublin.
- R. Perez, R. Seals, J. Michalsky, All-weather model for sky luminance distribution – Preliminary configuration and validation, Solar Energy 50 (1993) 235–245. https://doi.org/10.1016/0038-092x(93)90157-j
- C. Reinhart, J. Mardaljevic, Z. Rogers, Dynamic daylight performance metrics for sustainable building design, Leukos 3 (2006) 7–31. https://www.tandfonline.com/doi/abs/10.1582/LEUKOS.2006.03.01.001
- V. Costanzo, G. Evola, L. Marletta, and F. Pistone Nascone, Application of Climate Based Daylight Modelling to the Refurbishment of a School Building in Sicily, Sustainability 10 (2018) 2653. https://doi.org/10.3390%2Fsu10082653
- J. Monteoliva, A. Villalba, and A. Pattini, Variability in dynamic daylight simulation in clear sky conditions according to selected weather file: Satellite data and land-based station data, Lighting Research & Technology 49 (2015) 508–520. https://doi.org/10.1177%2F1477153515622242
- A. Nabil, J. Mardaljevic, Useful daylight illuminances: A replacement for daylight factors, Energy and Buildings, 38 (2006) 905-913. https://doi.org/10.1016/j.enbuild.2006.03.013
- J.M. Monteoliva, A. Villalba, A. Pattini, Uso de dispositivos de control solar en aulas. Impacto en la simulación dinámica de la iluminación natural, Ambiente Construido, 14 (2014) 43-58. https://doi.org/10.1590/s1678-86212014000300004
- Illuminating Engineering Society of North America, IES LM-83-12. IES Spatial Daylight Autonomy (sDA) and Annual Sunlight Exposure (ASE). New York: IESNA, 2012.
- L. Bellia, F. Fragliasso, and A. Pedace, Evaluation of Daylight Availability for Energy Savings, Journal of Daylighting 2 (2015) 12-20. http://dx.doi.org/10.15627/jd.2015.2
- C. Cuttle, Research Note: A practical approach to cubic illuminance measurement, Lighting Research & Technology 46 (2013) 31–34. https://doi.org/10.1177%2F1477153513498251
- Cuttle C. Lighting by Design. 2nd edition, Oxford: Architectural Press, 2008.
- L. Córica, C. Lagsano, E. Colombo, A. Pattini, Análisis y caracterización fotométrica de un espacio de transición iluminado con luz natural: sus implicancias en la visión funcional, Ambiente Construído, 15 (2015) 103–115. http://dx.doi.org/10.1590/s1678-86212015000300029
- British Standards Institution. BS EN 12464-1: 2011. Light and Lighting – Lighting of Work Places – Part 1: Indoor Work Places, London: BSI, 2011.
- H. Hewitt, D.J. Bridgers, R.H. Simons, Lighting and the environment, Trans. Illum. Eng. Soc. 30 (1965) 91.
- A.R. Bean, Modelling indicators for combined side and overhead lighting systems, Lighting Research and Technology 10 (1978) 199–202. http://dx.doi.org/10.1177/ 096032717801000405
- J. A. Love and M. Navvab, The Vertical-to-Horizontal Illuminance Ratio: A New Indicator of Daylighting Performance, Journal of the Illuminating Engineering Society 23 (1994) 50–61. https://doi.org/10.1080%2F00994480.1994.10748080
- A. Gershun, The light field, J. Math. Phys. 18 (1936) 51–151. https://doi.org/10.1002/sapm193918151
- R. Mangkuto, A comparison of three approaches for determining scalar illuminance from cubic illuminance data, Lighting Research & Technology, p. 147715351876644, 2018. https://doi.org/10.1177%2F1477153518766443
- O. Howlett, L. Heschong, J. Mchugh, Scoping study for daylight metrics from luminance maps scoping study for daylight metrics from luminance maps, Leukos 3 (2007) 201–215. http://dx.doi.org/10.1582/LEUKOS.2007.03.03.003
- Ruiz, Veronica Jimena, Iluminación sustentable. Diagnóstico y propuesta de intervención. El caso de una biblioteca pública. Tesis de maestria. Facultad Regional Mendoza. Universidad Tecnológica Nacional, Mendoza (Argentina), 2017.
- G. Molina, S.Vera, W. Bustamante, T. Bleicher. Groundhog - SketchUpExtension for exporting Radiance models, 2008, Available at: https://extensions.sketchup.com/en/content/groundho.
- G. Ward, F. Rubinstein, A new technique for computer simulation of illuminated spaces, Lawrence Berkeley Laboratory Report 23042, 1988.
- G. Ward, The RADIANCE Lighting Simulation and Rendering System, Computer Graphics, in: Proceedings of '94 SIGGRAPH Conference, 1994, Orlando, Florida, USA.
- U. Berardi, T.Wang. Daylighting in an atrium-type high performance house, Building and Environment, 76 (2014) 92–104. https://doi.org/10.1016/j.buildenv.2014.02.008
- J.A. Jakubiec C.F. Reinhart, The 'adaptive zone' - A concept for assessing glare throughout daylit spaces, Lighting Research and Technology, 44 (2012) 149-170. http://dx.doi.org/10.1177/1477153511420097
- Guide to British Standards Institution. BS EN 12464-1: 2011. Light and Lighting – Lighting of Work Places – Part 1: Indoor Work Places, London: BSI, 2011.
- C. Cuttle. Research Note: A practical approach to cubic illuminance measurement, Lighting Research and Technology 46 (2014) 31–34. https://doi.org/10.1177/1477153513498251
- International Commission On Illumination. Guide to the Lighting of Urban Areas. CIE, 1992. Technical Report.
- A. Villalba, J.M. Monteoliva & A. Pattini, A dynamic performance analysis of passive sunlight control strategies in a neonatal intensive care unit, Lighting Research and Technology 50 (2016) 191–204. https://doi.org/10.1177/1477153516656225
- J.M. Monteoliva, A. Villalba, A.Aceña, A. Pattini, Modelo Simplificado para el cálculo de iluminancia por luz natural útil (UDI) en espacios individuales perimetrales en cielos claros. Caso de estudio: Mendoza, Argentina, Hábitat Sustentable 6 (2016) 51-59. https://doi.org/10.22320/07190700.2016.06.01.06
Copyright © 2018 The Author(s). Published by solarlits.com.


