Volume 6 Issue 2 > pp. 169-175 • doi: 10.15627/jd.2019.15
Optical Characteristic Investigation on an Underwater Adjustable Focus Solar Concentrator with Single-Layer Membrane
Shen Liang, Hongfei Zheng, Dandan Cui, Xinglong Ma*
Author affiliations
School of Mechanical and Vehicular Engineering, Beijing Institute of Technology, Beijing, 100081, china
* Corresponding author. Tel.: +86-010-68912510
liangshen09@163.com (S. Liang)
hongfeizh@bit.edu.cn (H. Zheng)
danna1019@163.com (D. Cui)
baalxmxl@yeah.net (X. Ma)
History: Received 19 September 2019 | Revised 25 November 2019 | Accepted 6 December 2019 | Published online 13 December 2019
Copyright: © 2019 The Author(s). Published by solarlits.com. This is an open access article under the CC BY license (http://creativecommons.org/licenses/by/4.0/).
Citation: Shen Liang, Hongfei Zheng, Dandan Cui, Xinglong Ma, Optical Characteristic Investigation on an Underwater Adjustable Focus Solar Concentrator with Single-Layer Membrane, Journal of Daylighting 6 (2019) 169-175. http://dx.doi.org/10.15627/jd.2019.15
Figures and tables
 Figure 4
Abstract
This paper presents an underwater adjustable focus solar concentrator, which is composed of a piece of transparent elastic membrane and a hollow cylindrical-like structure. The deformation characteristic of the membrane is simulated in this study. It is found that the membrane is deformed into a sphere under the action of pressure difference. Optical simulation of the concentrator with different deformation ratios is carried out. The results illustrate that both the f-number and the concentration ratio are decreased when the membrane deformation is enlarged. For instance, if the deformation ratio changes from 0.1 to 0.4, the f-number ranges from 20 to 5.6, and the concentration ratio is changed from 440 to 40. The variation of the light receiving rate with the tracking error is also analyzed. The results show that the receiver captures 73% light within the tracking error of 0.6°. Experiments are performed to investigate the energy distribution on the focus and the performance of the underwater photovoltaic system. As a result, when the solar radiation of 590 W/m2 is achieved, the maximum energy density on the focus decreases from 40 kW/m2 to about 35.4 kW/m2 with the deformation ratio ranges from 0.1 to 0.3. In addition, the average output power of about 1.3 W of the gallium arsenide solar cell, having a size of 10×10 mm2, is achieved.
Keywords
Photo-bioreactors, Microalgae, Responsive shading system, Visual comfort
1. Introduction
Nowadays, the extensive development and utilization of renewable energy has become a consensus. Solar energy is an indispensable part of renewable energy sources, and it has become an import topic around the world for development [1]. The application and development of solar energy is the most promising choice, because nearly 1.8×10¹⁴ kW solar energy can be absorbed by the earth without any expense and pollution [2]. For this reason, solar energy is expected to displace fossil fuel for satisfying the energy consumption of mankind [3]. However, the energy density of solar energy is relatively low, to increase the energy density different solar concentrators have been developed over the past decades [4]. Parabolic concentrator, flat-plate solar collector, compound parabolic collector (CPC), Fresnel Lens, etc. have been widely used in the field of thermal application and photovoltaic [5-7].
The oceans are twice as large as the land area that are also rich in solar energy. On a sunny day, the solar radiation over the sea can reach 1000 W/m2, and solar energy is still available at a certain depth in the sea [8]. At depths of up to 10 m, the solar energy density can still remain 200 W/m2 which is much higher than the energy density of ocean tidal energy, thermal energy, etc [9]. At the same time, with the rapid development of marine exploration, the number of underwater devices continues to increase, the underwater working devices need efficient and stable energy supply system to better complete the exploration mission. While, the problem is that the existing energy supply patterns that mainly include base station, supply ships, and self-loading batteries, cannot meet the energy requirements for underwater devices [10]. It would be very meaningful to develop the underwater solar energy utilization technology. It will not only expand the application area of solar energy, but also provides a solution to the energy supply issue of the underwater devices.
There are some unique advantages using solar energy underwater. Firstly, the attenuation coefficient in the 450-700 nm band is the smallest when sunlight travels in seawater, that means the solar cells will have a relatively high energy conversion efficiency [11]. Secondly, the temperature of a solar cell will inevitably rise when it converts solar radiation into electricity, which will have a negative impact on the efficiency [12]. To overcome the problem of low efficiency of solar cell caused by high temperature, many researchers have paid their attention on the temperature control of the solar cell. Many cooling solutions have been proposed, such as submerged PV system in shallow water [13-15]. While, the temperature of the underwater photovoltaic system is not increased significantly because the seawater can act as an efficient cooling system, thus, the solar cells can always perform efficient photoelectric conversion. In addition, there have been many theoretical studied and applied researches on the utilization of solar energy underwater. The US Institute of Marine Technology and the Institute of Autonomous Underwater Systems have developed a kind of solar autonomous underwater vehicle whose performance and future availability have been verified by long-term experiments [9]. Solar energy can also be used to aid the battery life and to operate low power sensor nodes, the applicability of solar cell as a power sources for medusa-inspired biomimetic has been detail analyses by Keyur, and some valuable conclusions have been presented [16].
This paper presents an underwater adjustable focus solar concentrator, which is designed to collect solar radiation underwater. The concentrator is composed of a piece of transparent elastic membrane and a hollow cylindrical-like structure, the structure of the concentrator is very simple and easy to manufacture. The difference between this design and other concentrators is as follows: the existing solar concentrators such as parabolic concentrator, CPC, Fresnel Lens, etc. are designed for terrestrial use, which means they can not be applied underwater because of the difference in the optical properties of water and air, while this concentrator is specially designed to work underwater. With this design, the underwater solar energy density can be effective improved, which can reduce the number of the solar cells for an underwater photovoltaic system.
The brief content of this paper is as follows: the concentrating principle and membrane deformation features are introduced in section 2. In section 3, the optical characteristics of the concentrator are studied. Finally, an experimental system is set up to test the energy distribution of the focus and to verify the possibility of the underwater photovoltaic system with Gallium arsenide solar cell.
2. Design method of underwater solar concentrator
2.1. Concentrating principle
The pressure inside the static liquid is not directional, when a membrane is used to isolate part of the liquid, the membrane always bears a vertical pressure. Furthermore, the deformation can be effectively altered by adjusting the pressure difference between the two sides of the membrane. The underwater adjustable focus solar concentrator is designed based on the above deformation characteristic of the membrane. There will be an airtight chamber when one end of a hollow cylindrical-like structure is covered with membrane and the other end of the structure is a transparent tablet. The membrane is deformed into a spherical surface when the airtight chamber is put underwater because of the pressure difference. Hence, the part of water, which is surrounded by the membrane, will form a convex lens-like structure. When light passes through the structure, a high energy focus will form below, as shown in Fig. 1. Meanwhile, the focus size and focal length can be altered by adjusting the air quality inside the cavity, which will change the curvature of the membrane.
Figure 1
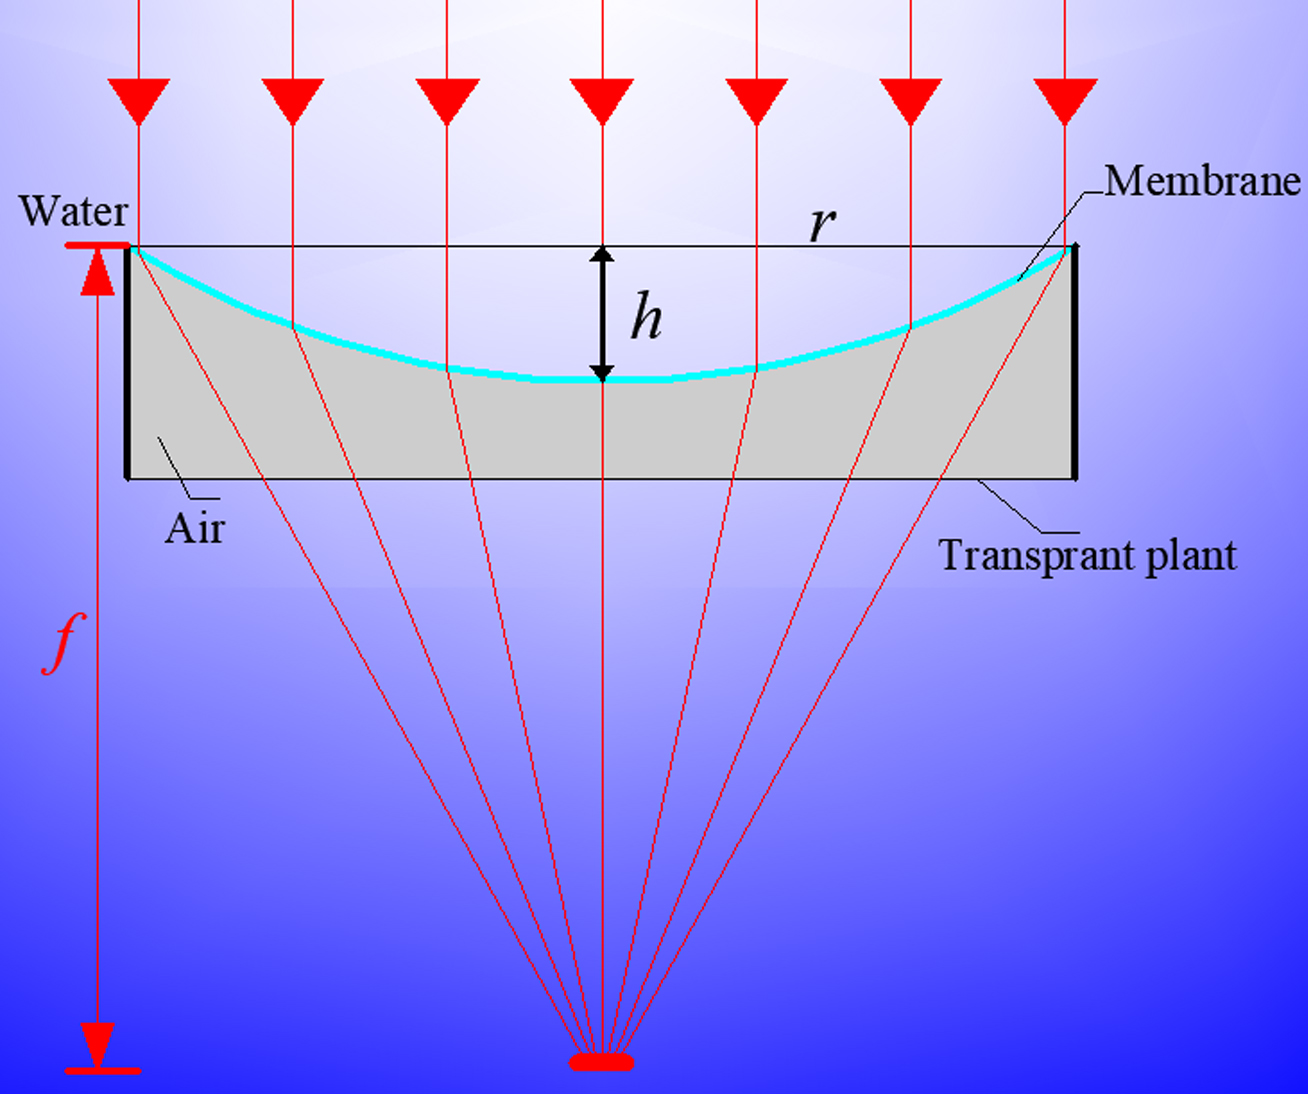
Fig. 1. Schematic diagram showing concentrating principle of the concentrator.
2.2. Membrane deformation simulation
Whether the concentrator can effectively concentrate the light depends on the shape of the elastic membrane after deformation. The concentrator is composed of an elastic membrane and a supporting structure where the inner side of the membrane has air and the outer side has water. Under the action of pressure difference, the membrane is deformed, which is equivalent to a surface load acting on the membrane whose periphery is fixed. The material of the membrane includes Ethylene tetrafluoroethylene (ETFE), as listed in Table 1, and the deformation characteristic of the membrane is studied by COMSOL. The simulation result shows that the deformed surface is a standard sphere, as shown in Fig. 2. The light is concentrated as it passes through the spherical surface as the near-axis concentration condition is satisfied; hence, the design method of this underwater adjustable focus solar concentrator is made feasible in theory.
Table 1

Table 1. Physical parameters of the ETFE.
Figure 2
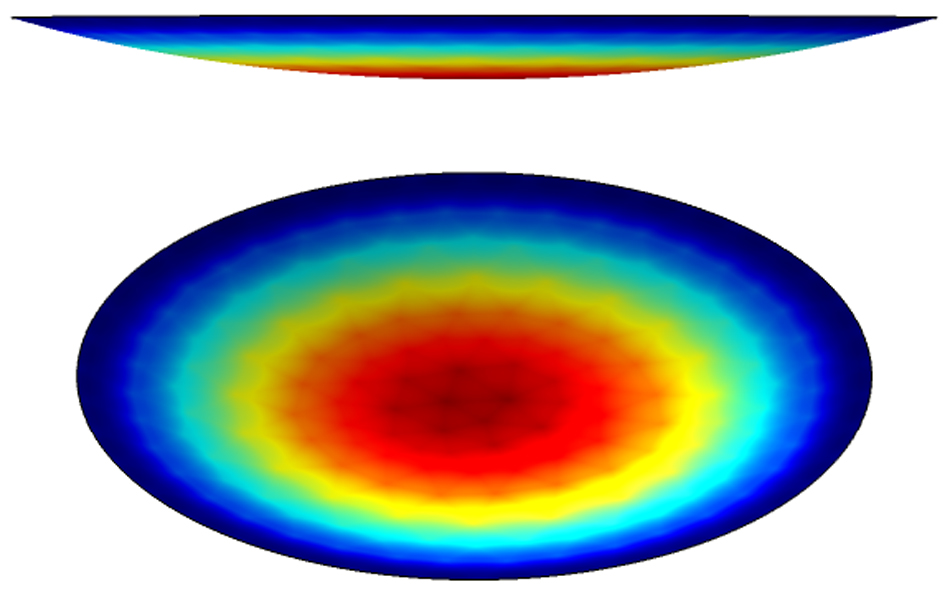
Fig. 2. The simulation result of the membrane deformation.
3. Optical simulation
A dimensionless parameter, deformation ratio α, represents the deformation displacement of the membrane central point, h, to the membrane radius, r, and can be expressed as
A concentrator model with membrane radius of 100 mm is developed in optical software Lighttools®. The deformation ratio is adjusted by setting the curvature of the membrane. To simulate the working environment of the concentrator, the system environment of the software is set as seawater with a refractive index of 1.33, and the material of the concentrator is set as air and the refractive index is 1. The variation of f-number and concentration ratio with deformation ratio is simulated. In addition, the variation tendency of light receiving rate with tracking error angle is also studied.
3.1. Optical characteristics with different deformation ratio
Figure 3(a) shows the optical path of the concentrator with the deformation ratio of 0.2, 0.3, and 0.4. Based on the simulations, the curves of the concentration ratio and the f-number with α are made that are shown in Fig. 3(b). As can be seen from Figs. 3(a) and (b), both the f-number and concentrator ratio decrease when the deformation ratio is enlarged. For an instance, when the deformation ratios are 0.1 and 0.4, the f-numbers are 20 and 5.6, and the concentration ratios are 440 and 32, respectively.
Figure 3
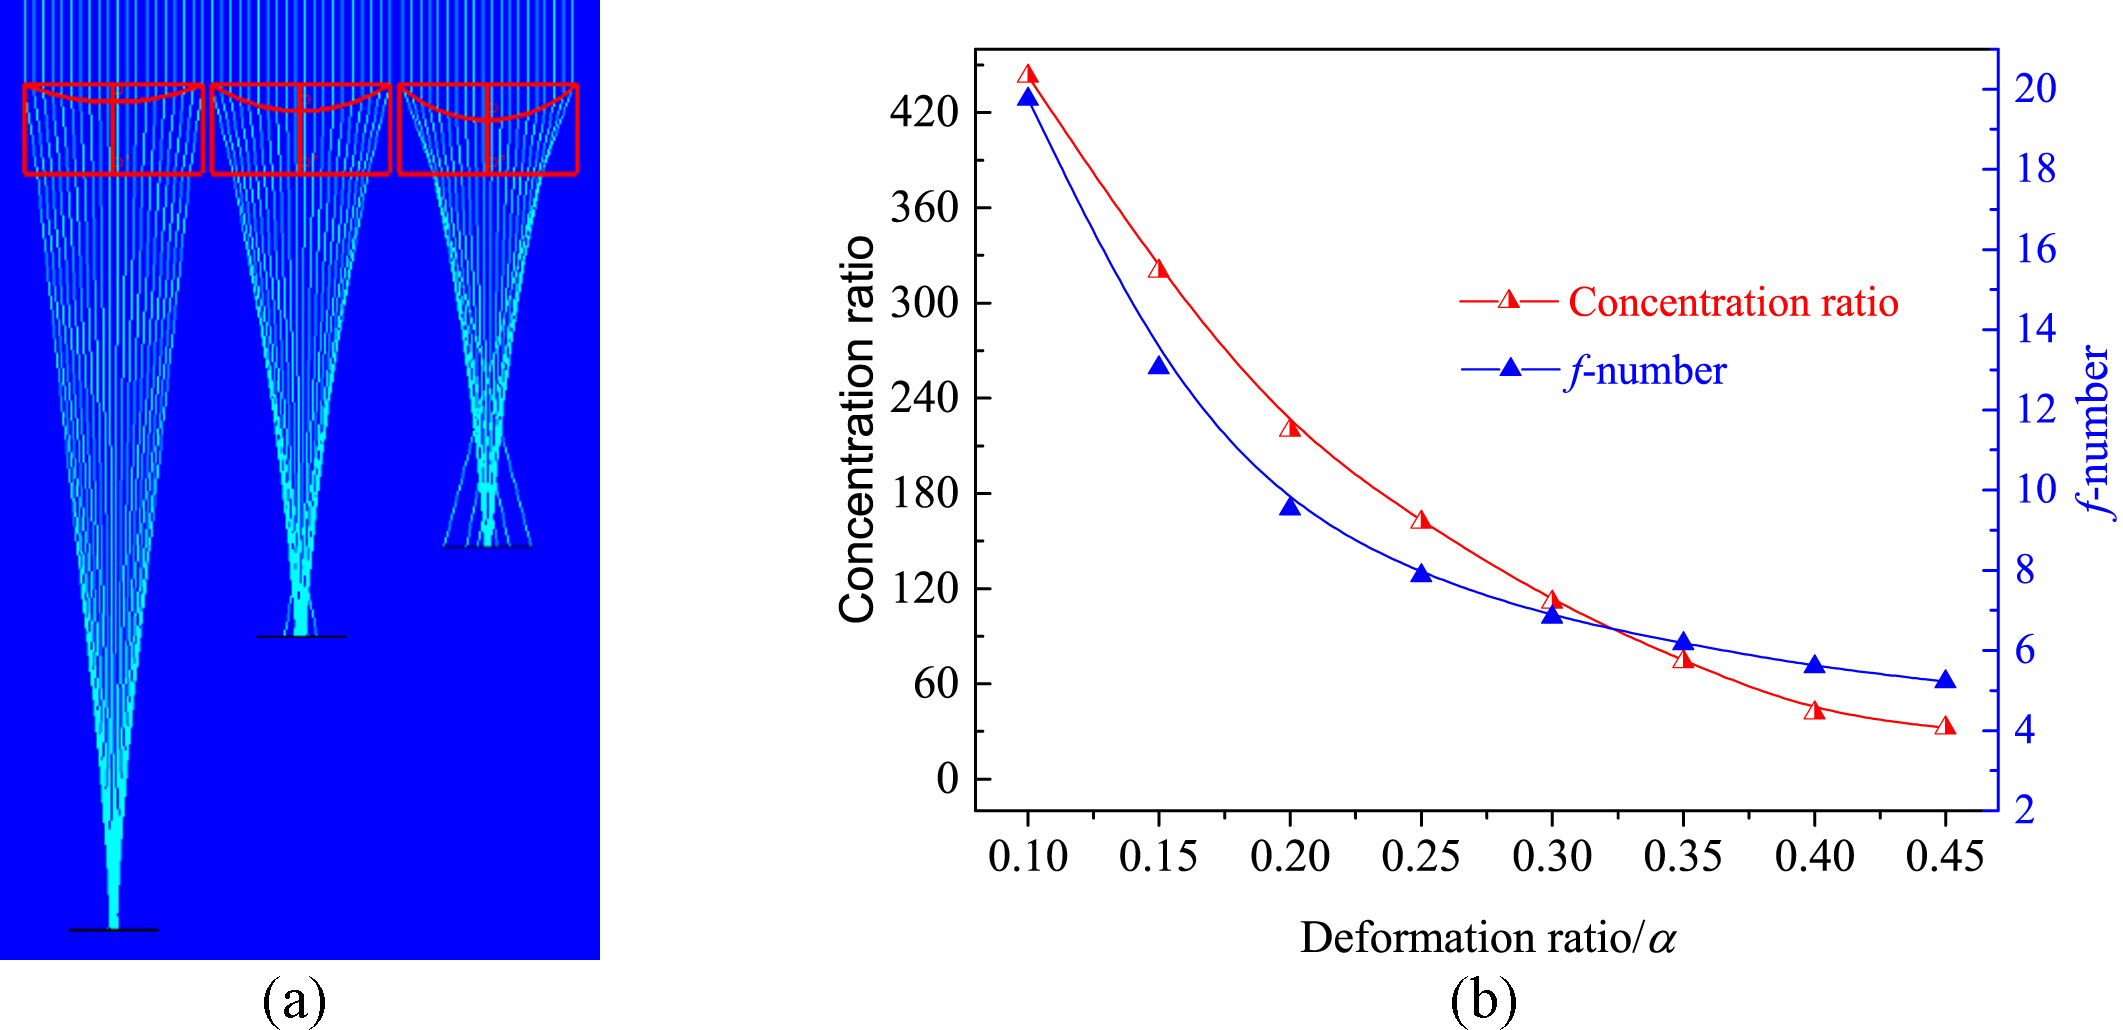
Fig. 3. (a) Light path diagram with different deformation ratio and (b) concentration ratio and f-number with α.
The tendency of the f-number and concentration ratio can be explained by the following reasons. As the α increases, the slope of each point on the membrane is increased. This is to say that the normal plane of the incident light is changed, and the light incident angle is increased, the emergent angle is accordingly increases resulting in the decrease of f-number. The size of the focus increases as f-number becomes shorter; therefore, the concentration ratio is decreased.
3.2. Optical characteristics with tracking error
Due to the revolution and rotation of the earth, the incidence angle of sunlight varies continuously throughout a day. The sun's altitude and azimuth angles are constantly changed. Therefore, most types of solar concentrators need to track the sun, but the tracking system are prone to have errors that will prevent sunlight from entering the concentrator vertically. In this case, the efficiency of the concentrator is decreased. Therefore, it is very necessary to analyze the influence of the tracking error angle on the light receiving rate of the concentrator. When process the simulation work, the sunlight is considered as parallel, the receiver is arranged in the focal plane, and it is a square with length of 20 mm. Figure 4 shows the light path of the concentrator with α, which is 0.25, and the tracking error angles range from 0° to 0.8°. It can be seen form Fig. 4, when the tracking error angle is 0°, all the sunrays can be focused into a small area. With the increase of the tracking error angle, the incident light gradually deviates from the center of the receiver, and when the tracking error is greater than 0.8°, a large proportion of the light is not concentrated to the receive.
Figure 4
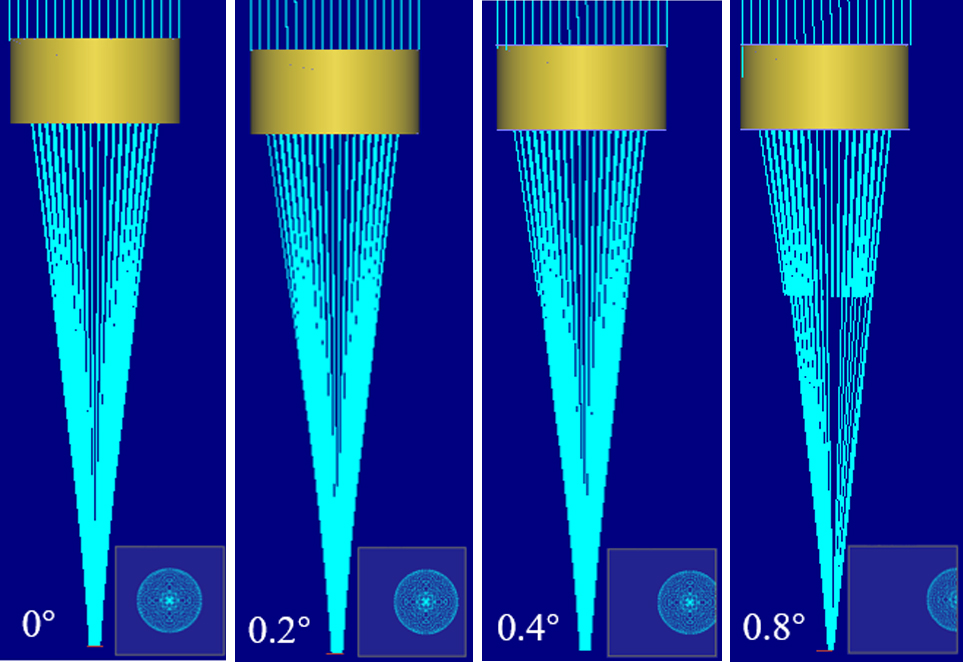
Fig. 4. (a) Light path with different tracking error angles.
Figure 5 shows the corresponding curve of the light receiving rate with tracking error angles. Figure 5 indicates that when the tracking error angle is less than 0.4°, the light receiving rate can reach 100%, and when the tracking error angle is less than 0.6 °, the light receiving rate is more than 73%. But, if the error angle exceeds to 1°, light receiving rate will drop to 17%. Therefore, if the light receiving rate is required to be greater than 70%, the maximum allowable tracking error angle reaches to 0.6 degrees.
Figure 5

Fig. 5. Variation of the light receiving rate with tracking error angle.
4. Experimental investigation
4.1. Experimental design
A concentrator sample with the membrane radius of 200 mm and supporting structure of 100 mm is manufactured. In addition, an experimental system is set up to test the energy distribution of the focus and to verify the possibility of the underwater photovoltaic system with Gallium arsenide solar cell. Figure 6(a) shows the concentrator sample, the hollow cylindrical-like structure has acryl and the membrane has ETFE material whose light transmittance rate is up to 97%. In addition, it also has good mechanical properties, such as seawater corrosion resistance. In short, ETFE membrane can totally meet the demand of the concentrator. Figure 6(b) shows a schematic diagram of the experimental system, which is mainly composed of a reflector, the concentrator, an arsenide solar cell (10×10 mm2). The instruments and devices used in the experiment include CCD camera, ruler, K type thermocouple, temperature patrol instrument, multimeter, solar radiometer, bucket, etc.
Figure 6
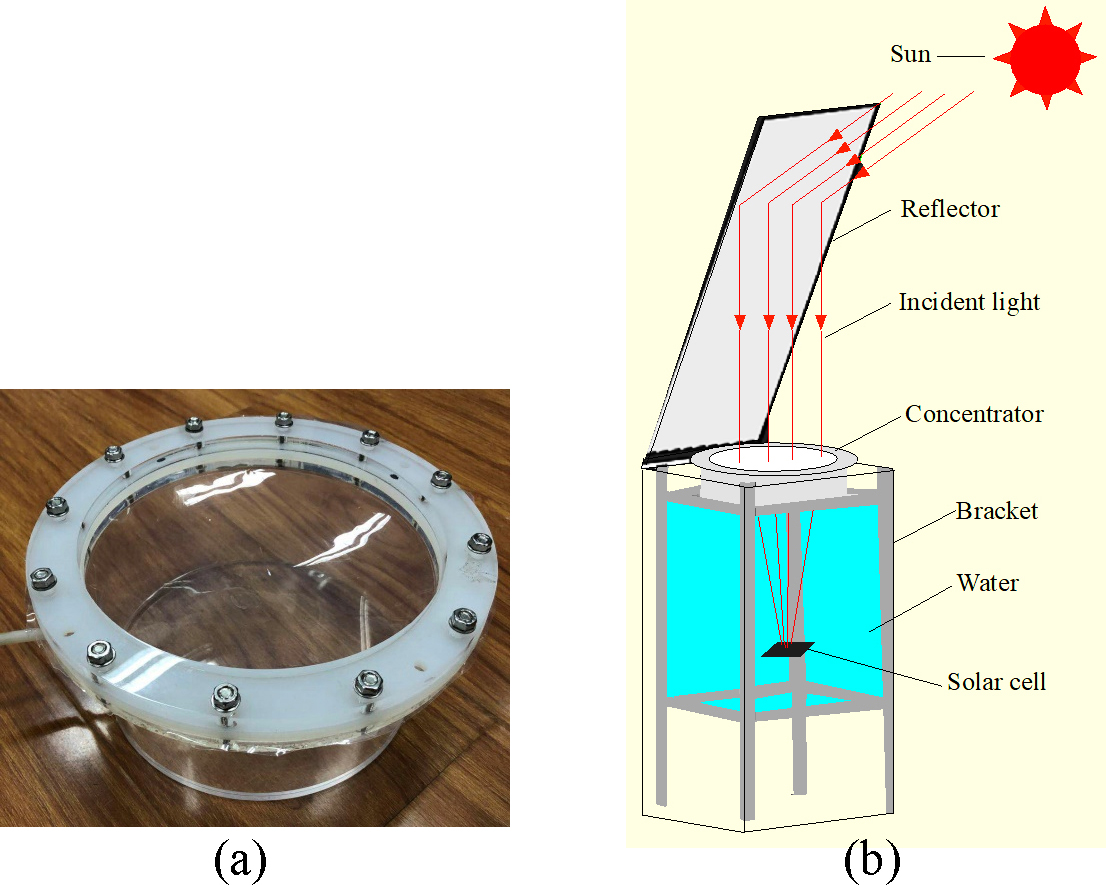
Fig. 6. (a) Showing the concentrator and (b) the experimental system.
During the period of the experiment, the concentrator is placed in clean water, and in order to facilitate experimental operation, the concentrator is always placed horizontally. The reflector is used to change the sunlight path into vertically or at some particular angles. The experiments are divided into two parts; firstly, using CCD camera, the focus photos of focus are captured, and the energy distribution on the focus is analyzed by MATLAB. Then, the underwater photovoltaic system is tested. During the experiment, the deformation ratio is fixed at 0.25, the average solar radiation is about 348W/m2, and every 30 minutes is selected as a test unit. The output voltage and current of the solar cell are measured by a precision multimeter. The temperature of both sides of the cell are also measured and recorded using K thermocouples and temperature patrol instrument.
4.2. Results and discussions
4.2.1. Energy distribution of the focus
The energy distribution of the focus determines its energy conversion capacity. Under different deformation ratio, the energy distribution of the focus was tested under actual weather conditions. Figure 7 shows focus points that are obtained by CCD camera while the energy distribution cloud images are processed by MATLAB. As we can see, the shape of the focus closes to a disc under actually weather conditions. In addition, the energy distribution cloud maps indicate that the focus energy distribution tendency remains same under different deformation ratio. Furthermore, the center region of the focus has high energy density area. For energy density value, at the solar radiation of 590W/m2, the maximum energy density decreases from 40 kW/m2 to about 35.4 kW/m2 when the deformation ratio from 0.1 to 0.3 is enlarged. Figure 7 also illustrates relatively uniform energy distribution of the focus, which is very beneficial for photovoltaic applications. In addition, the concentrator with small focus is easy to combine with other components, such as light-conducting tube. In short, the applications scope of the underwater adjustable focus solar concentrator can be further expanded.
Figure 7

Fig. 7. (a-d) Illustrating focus and energy distribution.
4.2.2. Underwater photovoltaic experiments
The curves of the open circuit voltage and short circuit current of the gallium arsenide solar cell with test time are presented in Fig. 8(a). The curves of the temperature on both sides of the cell are presented in Fig. 8(b). According to Fig. 8, the open circuit voltage and short circuit current of the solar cell are relatively stable underwater. The voltage and current are 2.85V and 455 mA, respectively. As the ambient temperature is 3℃, the average temperature of the upper and lower surfaces of the cell are 25℃ and 15℃, respectively. Although the temperature of the solar cell rises a little bit, the efficiency of the gallium arsenide cells is not affected. For a silicon solar cell, the efficiency reduces 0.4% as the temperature rise 1℃. For terrestrial photovoltaic systems, the temperature is generally higher than 50 degrees or even 80 degrees, as a result, solar cells tend to have a low efficiency. The temperature of the underwater photovoltaic system is not increased significantly, which is one of the advantages of the system.
Figure 8
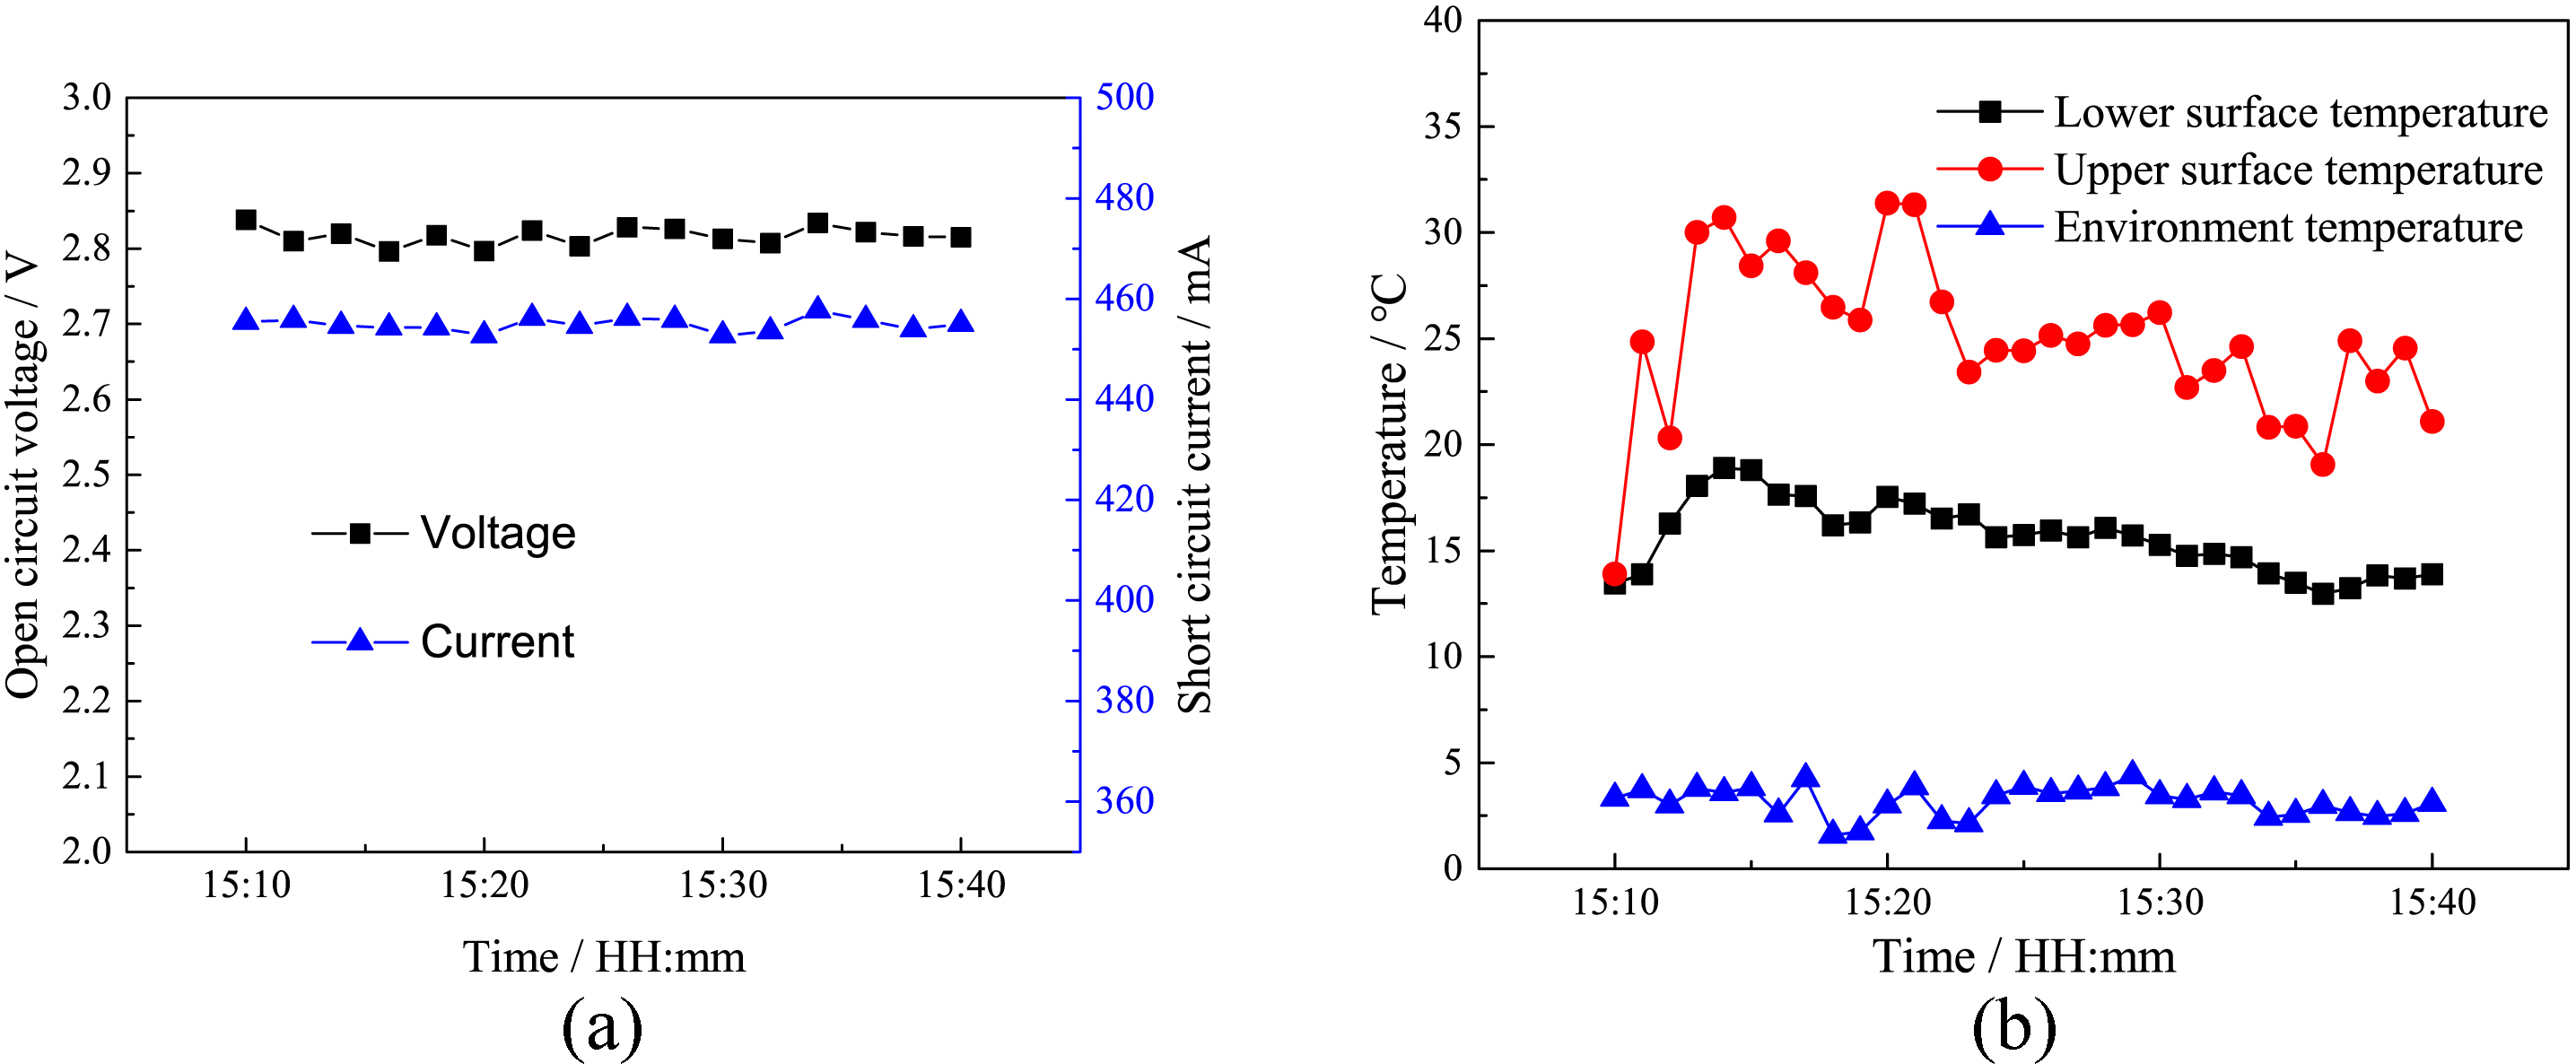
Fig. 8. Test curves of underwater photovoltaic system: (a) open circuit voltage and short circuit current and (b) temperature on both sides of the cell.
According to the Figs. 8(a) and (b), the open circuit voltage is about 2.85V, and the short circular current is about 450 mA. The average output power, W, can be calculated by
where FF is the fill factor, which has typical value of 0.8-0.9. In this study, FF has a value of 0.85. Therefore, the average output power W is about 1.105 W. During the period of the experiment, the direct solar radiation is 348 W/m2. The total energy entering the system can be calculated by
where I is the solar radiation and A is the area of the light inlet of the concentrator. The efficiency of the underwater concentrated photovoltaic system can be calculated by
For an underwater photovoltaic system, a large proportion of the solar radiation is absorbed by the water, but the efficiency of the system can still reaches to 8.84%, which proves the feasibility of the underwater concentrating photovoltaic system.
5. Conclusions
This paper presents an underwater adjustable focus solar concentrator. The deformation characteristic of the membrane is studied. In order to investigate the optical characteristic of the concentrator under different deformation ratio, optical simulations are carried out. The variation of the light receiving rate with the tracking error angles is analyzed. In addition, the concentrating performance has been verified by experiment. Based on this work, the following main conclusions are obtained.
- According to the optical simulation results, both f-number and concentrator ratio gradually decrease when enlarging the membrane deformation. When the deformation ratio is 0.1 and 0.45, the f-number is 20 and 5.2, and the concentrator ratio is 440 and 32, respectively. In addition, light receiving rate keeps more than 73% when the tracking error angle is within 0.6 °.
- Under the condition of solar radiation of 590 W/m2, the experimental results show that the maximum energy density on the focus decreases from 40 kW/m2 to about 35.4 kW/m2 enlarging the deformation ratio from 0.1 to 0.3.
- Under the condition of solar radiation of 384 W/m2, the output power of the underwater photovoltaic system reached to 1.105 W. The system efficiency of 8.84% is achieved.
Acknowledgment
This work is supported by the National Science Foundation of China (No.51576017) and Graduate Technological Innovation Project of Beijing Institute of Technology (No.2019CX20017).
Contributions
The simulation and writing work of this paper are completed by S. Liang. The idea behind this work is provided by H. Zheng. The experimental work is done by D. Cui. The experiment and simulation work of this paper are completed under the guidance of X. Ma.
References
- Y. Jia, G. Alva, G. Fang, Development and applications of photovoltaic–thermal systems: A review, Renewable and Sustainable Energy Reviews 102 (2019) 249-265. https://doi.org/10.1016/j.rser.2018.12.030
- T. T. Chow, Performance analysis of photovoltaic-thermal collector by explicit dynamic model, Solar Energy 75 (2003) 143–152. https://doi.org/10.1016/j.solener.2003.07.001
- W. Qu, H. Hong, H. Jin, A spectral splitting solar concentrator for cascading solar energy utilization by integrating photovoltaics and solar thermal fuel, Applied Energy 248 (2019) 162-173. https://doi.org/10.1016/j.apenergy.2019.04.115
- D. Ikwaba Paul, Application of compound parabolic concentrators to solar photovoltaic conversion: A comprehensive review, International journal of energy research 43 (2019) 4003-4050. https://doi.org/10.1002/er.4428
- X. Ma, H. Zheng, S. Liu, Optimization on a cylindrical Fresnel lens and its validation in a medium-temperature solar steam generation system, Renewable Energy 134 (2019) 1332-1343. https://doi.org/10.1016/j.renene.2018.08.075
- Z. Zhu, H. Zheng, Q. Wang, M. Chen, Z. Li, B. Zhang, The study of a novel light concentration and direct heating solar distillation device embedded underground, Desalination 447 (2018) 102-119. https://doi.org/10.1016/j.desal.2018.08.021
- G. Sadeghi, H. Safarzadeh, M. Ameri, Experimental and numerical investigations on performance of evacuated tube solar collectors with parabolic concentrator, applying synthesized Cu2O/distilled water nanofluid, Energy for Sustainable Development 48 (2019) 88-106. https://doi.org/10.1016/j.esd.2018.10.008
- P. P. Jenkins, S. Messenger, K. M. Trautz, S.I. Maximenko, D. Goldsteln, D. Scheiman, R. Hohelsel, R. J. Walters, High-Bandgap Solar Cells for Underwater Photovolt aic Applications, IEEE Journal of Photovoltaics 4 (2014) 202-207. https://doi.org/10.1109/jphotov.2013.2283578
- M. D. Ageev, Application of solar and wave energies for long-range autonomous underwater vehicles, Advanced Robotics 16 (2002) 43-55. https://doi.org/10.1163/156855302317413736
- B. H. Robison, The coevolution of undersea vehicles and deep-sea research, Marine Technology Society Journal, 33 (1999) 65-73. https://doi.org/10.4031/mtsj.33.4.7
- J. A. Muaddi, M. A. Jamal, Spectral Response and Efficiency of a Silicon Solar-Cell Below Water-Surface, Solar Energy 49 (1992) 29-33. https://doi.org/10.1016/0038-092x(92)90123-r
- M. Rosa-Clot, R. Rosa-Clot, G. M. Tina, P. F. Scandura, Submerged photovoltaic solar panel: SP2, Renewable Energy 35 (2010) 1862-1865. https://doi.org/10.1016/j.renene.2009.10.023
- A. A.-R. Amr, A. A. M. Hasson, M. Abdel-salam, A. M. EI-sayed, Enhancement of photovoltaic system performance via passive cooling: Theory versus experiment, Renewable energy 140 (2019) 88-103. https://doi.org/10.1016/j.renene.2019.03.048
- R. Nowzari, Numerical analysis of a photovoltaic module integrated with various water cooling systems, Transactions Of Famena 43 (2019) 19-30. https://doi.org/10.21278/tof.43202
- D. Sato, N. Yamada, Review of photovoltaic module cooling methods and performance evaluation of the radiative cooling method, Renewable and Sustainable Energy Reviews 104 (2019) 151-166. https://doi.org/10.1016/j.rser.2018.12.051
- K. B. Joshi, J. H. Costello, S. Priya, Estimation of Solar Energy Harvested for Autonomous Jellyfish Vehicles (AJVs), IEEE Journal of Oceanic Engineering 36 (2011) 539-551. https://doi.org/10.1109/joe.2011.2164955
Copyright © 2019 The Author(s). Published by solarlits.com.


