Article Outline
2. Literature review on the impact of daylight attributes on interior space
3. Experimental analysis procedure
Declaration of competing interest
Figures and tables
Volume 10 Issue 2 pp. 173-191 • doi: 10.15627/jd.2023.15
The Effect of Parametric Patterned Façade Variations on Daylight Quality, Visual Comfort, and Daylight Performance in Architecture Studio-Based Tutoring
Yasmine Mahmoud Saad Abdelhamid,⁎,a Sherine M. Wahba, b Menna ElHusseinyb
Author affiliations
a Faculty of Engineering, Cairo University
b Department of Architecture, Faculty of Engineering, Cairo University
*Corresponding author.
yasmeen346@eng.cu.edu.eg (Y. M. S. Abdelhamid)
sherine_wahba@yahoo.com (S. M. Wahba)
mennatallahelhusseiny@gmail.com (M. ElHusseiny)
History: Received 18 October 2023 | Revised 10 November 2023 | Accepted 12 December 2023 | Published online 29 December 2023
Copyright: © 2023 The Author(s). Published by solarlits.com. This is an open access article under the CC BY license (http://creativecommons.org/licenses/by/4.0/).
Citation: Yasmine Mahmoud Saad Abdelhamid, Sherine M. Wahba, Menna ElHusseiny, The Effect of Parametric Patterned Façade Variations on Daylight Quality, Visual Comfort, and Daylight Performance in Architecture Studio-Based Tutoring, Journal of Daylighting 10 (2023) 173-191. https://dx.doi.org/10.15627/jd.2023.15
Figures and tables
 Table 8
Abstract
Parametric design influences on building envelope design are exponentially increasing in the current era due to the dominance of computational design on architectural outcomes. The composition of the building envelope’s patterns, shape, size, and distribution of the perforations can affect the efficiency of daylighting within the space; daylight quality, visual comfort, and daylight performance. Through the manipulation of the daylighting patterns, a balance between illuminance and glare control is created. This research study aims to analyze and evaluate the effect of different parametric patterns integration on daylighting in “Architecture Studio-based” tutoring through the distribution of perforation on façade openings, percentage of perforation, and perforation size in a hot-dry climate. The analysis is conducted through building performance simulation software (Climate Studio). The research concludes that the “Triangles Parametric Pattern” among all the tested patterns, achieves the highest performance in compliance with the recommended thresholds of daylight quality, visual comfort, and daylight performance metrics within the studio space compared to other parametric patterns and the base case model. The implications of such an experiment inform designers to categorize daylight performance while selecting patterns in window design as part of façade design.
Keywords
Daylight simulation, Daylight performance, Visual comfort, Parametric design
1. Introduction
Daylight is considered one of the most important natural forces architects can utilize to enhance daylight performance in spaces, visual comfort, and indoor visual light quality [1]. The dynamic change and variety of daylight are a stimulus for the circadian cycle and are capable of influencing occupants’ health, mood, and many more. Consideration of daylight design is significantly important in interior spaces and especially in educational spaces as a result of the high level of visual activities [2].
Daylighting has been considered an integral aspect of buildings and their interiors. Daylight can transform any space while providing occupants with a unique spatial experience. This ability to illuminate the space while making it stimulating is one of the main reasons architects utilize daylighting as a tool that can be controlled. Daylight quality in buildings can be evaluated through a set of aspects; its impact on health and well-being, visual task performance, and occupants’ satisfaction [3].
Recent Studies have shown a connection between daylighting and occupants’ physiology and psychology across different building typologies. Among the typologies that are commonly investigated are hospitals, shops, schools, offices, and infrequently educational facilities. However, these effects are not achieved by merely admitting daylight within the building spaces. There are several considerations that need to be taken into account; the daylight quality as well as occupants’ performance and subjective response.
A study by Kynthia Chamilothori, Jan Wienold, and Marilyne Andersen [4] focused on the effect of perforated building facades and the resulting daylight patterns on user’s experience as well as the perceived spatial ambience. The investigations focused on the geometry and irregularity of façade patterns which are manipulated in a virtual space creating different luminance conditions. The study results indicated that the characteristics of façade patterns impacted the perceived spatial ambiance.
A study by Muhammad Anas Bin Othman, Nur Azfahani Ahmad, and Azizah Md Ajis [5] investigated daylighting strategies for educational studios in universities through the maximization of daylighting penetration in the building space to create a more green-conducive studio. Another local study by Raghda M. ElBatran, and Walaa S.E. Ismaeel [6] investigated a number of design parameters that create a balance between daylight availability and visual comfort in office buildings using double skin façade. The study offers guidelines for performance metrics; Spatial Daylight Autonomy, and Annual Sunlight Exposure. The research results indicated that the percentage of perforation, and depth of the double skin façade provide the greatest influence on daylight performance.
Ahmed Rashwan [7] analyzed the effect of various parametric patterns on daylight quality in office spaces in a hot-dry climate using simulation software and through actual and in situ measurements. The study concluded that the combination of parametric pattern and window-to-wall ratio where the WWR can increase or decrease in order to achieve the required daylight quality following the space requirements.
The requirements for daylighting are very strict for certain space functions, for example, educational spaces, while it can be more flexible for residential spaces. However, in order to provide good lighting in spaces, there are three main factors that should be taken into consideration; the quantity of light, quality of light, and lightning distribution. There are also considerations and measurements of daylight performance and visual comfort which will be discussed in the upcoming sections [8].
The purpose of this study is to provide substantial evidence on how the daylight pattern variations through parametric patterned façade and the resulting daylight patterns can jointly affect the constructs of this study; daylight quality, performance, and visual comfort. To fulfill this purpose, this research has four objectives. The first objective is to identify daylight quality, performance, and visual comfort and how they can be measured using daylight metrics. Second, identify different daylighting systems concluding with the selected system and the reason for choice. Third, identify the latest daylight simulation tool to be utilized in the experiment. Finally, investigates the effect of daylighting distribution through parametric patterned façade on daylight metrics and consequently, its effect on daylight performance, visual comfort, and daylight quality and how they can be manipulated to reach optimum requirements for architecture studio-based tutoring. Accordingly, this study will present a framework for parametric patterned facade design in studios bridging the gap between the psychological and physiological effect of daylighting on users and the amount provided through design broadening our knowledge of the joint impact of space and light on occupants.
2. Literature review on the impact of daylight attributes on interior space
2.1. Daylighting performance, quality, and visual comfort
In order to understand the characteristics of daylight and to utilize its potential benefits and attributes effectively within the architectural design practice, a set of daylight performance metrics has been proposed [9]. The definition of performance metrics is quality measures of daylit buildings that help in the assessment of daylighting behavior inside the space in addition to establishing analytical comparative study between different measures [10]. This enables having a benchmark for referencing [9]. Performance metrics are divided into two main types; Static Daylight Performance Metrics which include Illuminance (Lux) and Dynamic Daylight Performance Metrics which are also known as “Climate Based Daylight Modeling” consider the daily and seasonal variations of daylight in a given building site with respect to its quantity and character [10]. There is significant evidence to support the use of these metrics. It is capable of predicting the luminous quantities established on standardized meteorological files specific to the local climate for the building under evaluation [9]. Each metric will be discussed in the results section.
Daylighting quality marks the success or failure of a lighting design that meets the needs of users [11]. Authors Veitch and Newsham [12] stated that lighting quality exists when the lighting system; initiates good conditions for visual tasks, reinforces task performance, promotes desirable interaction and communication, creates a good mood environment, promotes health and well-being, and influences the aesthetic appreciation of the space.
The authors [12] also stated that the lighting quality is not directly measurable however it is capable of creating an interplay between the lit environment and the user. According to environmental psychology, lighting quality is a construct which means that it is an intangible condition that has no physical equivalent. In other words, lighting quality can’t be measured like for instance lumen output. Henceforth, it can be evaluated indirectly by means of lighting quality aspects, or behavioral measures [12,11].
The understanding of the term ‘qualities of light’, one has to understand the power and purpose of light in order to comprehend the importance of its effects on experiencing the built form/space. The architect has the ability to control the mood, atmosphere, scale, and perception. With these characteristics and with the composition of formal architectural elements, the architect can eventually shape one’s experience of space through subtle changes in light qualities. Evaluating the aforementioned factors will offer a simplified methodology for understanding light in relation to the space [13].
There are four main factors that affect daylight quality. The first factor is the Source. There are three fundamental characteristics of light that require investigation; Intensity, Color, and Texture. The intensity of light refers to bright vs. dark. Lower light levels are associated with intimate or private spaces, while higher levels are associated with public spaces that are inclined to be more active. The intensity of natural light is a vital contributor to the perception of spaces [13].
The second characteristic is the color of light which is reliant on variants; Warm vs. Cool. Light color and color temperature can enhance mood and well-being as well as affect the perception of space. Warm colors can create an inviting environment that promotes slow-paced activities, while cool colors can create productive and kinetic spaces. When it comes to natural light, the architect can take advantage of the way in which light hits surfaces resulting in a color temperature that affects users’ experience of the space [13].
The last characteristic of the light source is the light texture which involves two important variables; directional vs. diffused. Light texture refers to the means of delivery of light from the source whether artificial or in our case the texture produced as natural light hits surface materials within a space. When light hits a surface, part of it is reflected back, this reflection normally takes the shape of diffused (nondirectional) light. This diffused light is dependent on the surfaces’ reflection [14]. There is an important consideration when it comes to light texture, it is highly dependent on location, season, and time of day which makes it such evocative characteristics [13].
Soft and even light can create a diffused environment while directional light creates roughness and delivers light to a specific position. This form can be originated through natural and artificial light, however light texture created from natural light cannot be controlled and often creates a unique spatial experience. Architects often take advantage of this characteristic and sculpt windows in a way that invites a balance of diffused and directional natural lighting. The most evocative of the three characteristics of the light source is the light texture as it significantly initiates the interplay of shadows created within a space [13].
The second factor affecting daylight quality is the surface. The treatment of surfaces is responsible for the mean by which light is reflected, refracted, or absorbed giving the surface materials higher importance. Material types that are utilized can alter the amount of light distributed within a space as well as establish a good light quality. Materials’ texture and color create reflections, refractions, and absorption of light. For instance, if the surface has a glossy finish, then it will reflect light. While rough or matte surfaces will diffuse light. If the surface is colored then the reflection from that surface will carry the color. The light could be absorbed by surfaces that have the ability to reveal quirks and imperfections (Fig. 1) [13].
Figure 1
![(a)-(c) Illustrating light on surfaces [15].](figures/10-173-1.jpg)
Fig. 1. (a)-(c) Illustrating light on surfaces [15].
The third factor is the geometry. Light has the ability to reveal space geometry. It can be a tool to emphasize form and space structure. Also, the qualities of shadows can contribute to assessing the depth of field. The intensity of natural light is capable of dematerializing form and veiling the clarity of edges. Silhouetting, shadows, spatial depth , and lighting patterns all work together in contrasting harmony to express the tones of light in the geometry of spaces (Fig. 2) [13].
Figure 2
![Light revealing form geometry [15].](figures/10-173-2.jpg)
Fig. 2. Light revealing form geometry [15].
The last factor is perception. The human perceptual system is in control of the entire space perception. Humans’ perception of space is built based on existing perceptions and preconceptions. As one experiences the built environment, the light will create a mapping system for the surfaces and materials in addition to the intensity of light and the shadows it creates providing the observer with information regarding the surrounding environment [13]. For instance, for Le Corbusier, light is a powerful tool that can be manipulated to create a one-of-a-kind atmosphere. It is capable of granting the space a poetic experience. The architecture of the Ronchamp Chapel, controlled the light to create a mystical environment inside the chapel. Each space within the chapel is lit differently and uniquely to give each space its own poetic and mystical feel. The scene created informs our perceptual system of the formal qualities of the environment and our reactions in relation to it [15]. Figure 3 illustrates the previously mentioned notion.
Figure 3
![The ronchamp chapel [15].](figures/10-173-3.jpg)
Fig. 3. The ronchamp chapel [15].
Daylight quality is measured by photometric indicators which are illuminance, distribution of illuminance, illuminance uniformity, and glare. For working environments, horizontal illuminance is the most adequate criterion. The working plan illuminance is the most commonly used indicator of lighting quality as a result of the easiness of measurement and has been used and recommended in multiple studies [16]. To measure illuminance, a grid must be created to cover the overall lighting of the space because each point must be measured at a time. The European standards offered guidelines for the suitable grid. Moreover, a zone of 0.5 meters from the walls should be excluded from the grid. Illuminance is sometimes measured for the task position. Daylighted zones are created based on the distance between the activity zone and the window. One measurement point in each daylighted zone is placed at the location that represents the typical illuminance of that zone [11,17].
The extent to which the distribution of light influences daylight quality as well as visual comfort. The human eye is capable of adapting to vast variations of light levels; however, it is incapable of simultaneously managing large differences of light. Ill distribution of light can result in visual stress and fatigue as a result of continuous eye movements between contrasting surfaces. On the other hand, it is undesirable to have equivalently distributed light because it results in dull lighting which may lead to tiredness and lack of attention. Henceforth, it is important to have some variations to create a stimulating environment. The indicator for illuminance distribution is the uniformity [17]. Uniformity is defined as the ratio between the minimum and average illuminance on a surface.
There are other studies that use the ratio between the minimum and the maximum illuminance to determine uniformity. Uniformity is an indicator that has been frequently used as a result of the ease of determination based on illuminance measurement [17,18].
Glare is defined as the sensation that takes place when there is greater luminance than the sufficient amount that causes disturbance to the viewer’s eyes, discomfort, and a decrease in visual performance. Discomfort glare is the glare type that causes discomfort but does not necessarily affect performance but may cause physical symptoms such as headaches fatigue and decreased concentration [19]. It is caused by high luminance contrasts or unsuitable luminance distributions within the visual field. It is commonly measured using the Daylight Glare Probability (DGP) [17].
The definition of visual Comfort is the state of mind that articulates satisfaction with the surrounding visual environment. Visual Comfort is a basic human need that can affect task performance, mood, health, safety, and spatial experience. Problems as a result of visual comfort are often experienced in the daily lives in different settings; schools, universities, libraries, offices, and many more Fields [20]. There are two dimensions to Visual Comfort;
- The quantitative dimension (measurable); is when enough light is provided to satisfy the required visibility [20].
- The qualitative dimension (unmeasurable); is the elimination of the distracting effects related to the lighting [20].
To assess visual comfort, first, an understanding of certain basic laws of psychophysics should be illustrated. Psychophysics is related to the sensation by which users experience the space and the physics that causes these sensations (which are known as stimuli). For instance, the relationship between the amount of daylight provided by the opening design and the sensation of brightness can be determined. Similarly, Visual adaptation which is a form of physiological adaptation that can alter users’ sensitivity to the amount of light must be considered [21].
Architects should be able to adapt design strategies for sustainable daylighting in order to achieve proper visual comfort [14]. Effective daylight design aims to provide adequate lighting and efficient visual performance as well as ensure a comfortable environment [11]. There are three main approaches that can be utilized to achieve a sustainable daylighting design supporting large ecological goals [14]. These approaches are;
- Architectonics, the difficulty of adapting daylighting measures in a building, is the lack of specified design tools. Most large practices nowadays have the capacity to be equipped with a diverse team of consultants and design tools that qualify them to undertake complex daylighting analysis. On the other hand, small offices or schools are unable to provide such measures [14].
- The human Factor; different functions require different daylighting strategies in order to achieve optimum daylighting conditions that offer visual comfort as well as glare control. Such parameters can be achieved by utilizing shading devices that filter direct daylight when entering the space [14].
- Environmental Factor; the use of natural forces can impact the design, as well as the energy conservation [14].
2.2. Daylighting systems
While conventional windows adequately distribute the daylight needs of a space, there are new technologies and solutions that extend daylight performance beyond that of conventional solutions [8]. The use of daylighting systems is only one fundamental of a daylighting strategy. Poor selection of daylight systems may affect the performance of buildings that have good daylight potential. On the other hand, a sensible selection of daylight system can compensate for the error created through the early stages of the design process [22].
Additionally, daylighting systems can be used in the reduction of both thermal and visual discomfort that is the result of glare produced by fenestration. This is achieved by controlling and redirecting the direct sunlight from hitting the work plane by means of uniformly distributing daylight. The benefits of daylight distribution are the reduction of energy loads and the improvement of daylighting quality, daylighting performance, as well as visual comfort for space occupants [23]. Moreover, daylight systems can increase the use of daylight in sunny environments where control of daylight is required [8]. In order to select an appropriate system, there are key parameters that need to be addressed first; [22]
- Building Site, latitude, cloudiness, obstructions, and daylight conditions.
- Daylighting strategies inferred in the architectural design.
- Window design and function.
- Operational restrictions for the system; fixed/operable.
- Function and performance parameters of the system.
- Architectural and construction constraints
It is also important to emphasize the major objectives for applying daylighting systems [22];
- Daylight redirection.
- Improvement of daylight quality to enhance task illumination and glare control.
- Providing solar shading to enhance thermal and visual comfort.
Daylighting systems are divided into two main categories; Shading Systems, and Non-Shading Systems (Optical Systems) [22,24]. These systems can be used in skylights or vertical windows. For this research purpose and the existing case study, the focus will be on vertical systems. Shading systems are primarily designed to prevent direct sunlight and allow the diffuse of daylight. The conventional daylighting shading systems are utilized to prevent the building from overheating and occupants from glare effects, however, these systems reduce the utilization of daylighting for visual tasks. To overcome this limitation, daylight systems with shading are developed and utilized to redirect daylight into the ceiling of the interior space while preventing glare issues. Non-Shading systems on the other hand are utilized to redirect daylight to areas away from the window and diffuse it within the space [22,24].
There are five vertical shading systems, Light Guiding Shade (hot climate, sunny skies), Louvers and Blinds (all climates), Sunlight Redirecting Light Shelves (all climates), Glazing with Reflecting Profile (all climates), and Turnable Lamellas (all climates). All of these are used to redirect daylight, prevent glare issues, and provide homogenous illumination. The following Table 1 illustrates the installation of the previously discussed systems [22,24].
Table 1
![Vertical shading systems [22,24].](figures/10-173-22.jpg)
Table 1. Vertical shading systems [22,24].
The Non-Shading Systems are divided into four categories; Diffuse Light Guiding Systems, Direct Light Guiding Systems, Scattering Systems, and Light Transport Systems. The diffusing light guiding systems are used in overcast skies where it is brighter in the zenith area rather than the horizontal part of the sky where the zenith light is typically close to the window. The use of this system redirects light to the depth of the space providing higher utilization of daylight. It is also utilized in situations where the only well-lit area is near the window. There are four diffusing light guiding systems; Light Shelve, Anidolic Integrated System, Anidolic Ceiling, and Fish System. All of these are used in temperature climates to guide light to the depth of the space, provide homogenous illumination, and allow the view to the outside. Table 2 illustrates the installation of the previously discussed systems [22,24].
Table 2
![Diffuse light guiding systems [22,24].](figures/10-173-23.jpg)
Table 2. Diffuse light guiding systems [22,24].
The direct light guiding systems are used to avoid glare and overheating issues. There are three direct light guiding systems; Laser cut Panels, Prismatic Panels, and Light Guiding Glass. All of these are used in all climates to guide light to the depth of the space, prevent glare issues, and provide homogenous illumination. Table 3 illustrates the installation of the previously discussed systems [22,24].
Table 3
![Direct light guiding systems [22,24].](figures/10-173-24.jpg)
Table 3. Direct light guiding systems [22,24].
The scattering system is used to allow the even distribution of daylight. However, when used on vertical windows, it produces a great amount of glare. Lastly, the light transport system is used to collect daylight from the outside and guide it through light-guiding channels into the interior space. There are two light transport systems; Light-Pipe, and Light Guiding Ceiling. Both are used in all climates to guide light to the depth of the space, prevent glare issues, and provide homogenous illumination. Table 4 illustrates the installation of the previously discussed systems [22,24].
Table 4
![Scattering and light transport systems [22,24].](figures/10-173-25.jpg)
Table 4. Scattering and light transport systems [22,24].
2.2.1. Parametric pattern panels as a daylight system
Building envelop design that integrates designed patterns, shapes, sizes, and distribution along the external openings can influence the efficiency of the internal spaces [7]. Based on the previously discussed literature, Parametric Pattern Panels are considered a modern non-shading daylighting system that can be used to redirect and diffuse daylight into the depth of the interior in all climates similar to laser cut panels [22,24]. This integration is very critical in the fulfillment of daylight in the interior space, reduces glare, and can protect the occupants against direct solar radiation. It also acts as an insulating device and thermal barrier. Consequently, daylight quality, visual comfort, and daylight performance are affected by the integration of patterns [25]. When it comes to building envelope design, the climatic region and building function are two critical parameters that affect daylighting efficiency and space function performance. Henceforth, it is crucial to harmonize the achievement of the environmental benefits that are caused by the increasing area of external openings [7].
For designing parametric building envelopes, architects usually use programs and software that create models to aid in the visualization of different ideas and styles. These softwares have flexibility when it comes to change and adjustability. Additionally, some of these softwares have the ability to identify relationships between different parameters and will update when one of these parameters is modified. This is what it’s called the “Parametric Design” [7]. The parameters are not confined to numbers relating to geometry, they can also be performance-based criteria like luminance levels, or even aesthetic principles [26].
Parametric originated from “parameter”, any measurable factor that defines or limits a system. Therefore, parametric design can be defined as the process of describing any problem using variables, giving a range of possible solutions and alternatives. Any change in the variables would alter the final solution. Nowadays, contemporary design practices depend on computers that support parametric design. The language of parametric modeling can be programming or writing code using a specific programming language [7].
Although parametric facades are still developing, Robert Woodbury and his team were able to systematically develop a comprehensive set of parametric patterns by the utilization of consistent templates. Some of these patterns were published in his book Elements of Parametric Design [7]. While Wassim Jabi [27] was able to develop higher-level algorithm styles and strategies in his book “Parametric Design for Architecture” so as to originate shapes and definitions of Parametricist topologies. Figure 4 illustrates the different parametric façade patterns.
Figure 4
![Example of parametric facade patterns [7].](figures/10-173-4.jpg)
Fig. 4. Example of parametric facade patterns [7].
2.3. Simulation tool and climate studio
Climate Studio is an accurate and efficient software for daylight and energy performance simulation. It is a plugin in Rhino software that allows flexibility of use and creates complex and calculated geometry for daylight simulation. Climate Studio permits users to conduct a series of environmental performance evaluations of the built environment (indoors and outdoors). Output data can be in the form of irradiance maps, photorealistic renderings, climate-based daylight metrics, and annual and personal time Step Glare Analysis. It also calculates LEED and CHPS Daylighting Compliance, Single Thermal Zone Energy, and Load Calculations. Climate Studio offers Site Analysis, Point-In-Time Illuminance, Daylight Availability, Annual Glare, Radiance Render, and Thermal Analysis studies within the software [28].
2.3.1. Daylight availability
Through this workflow, the calculation of a variety of daylight metrics can be carried out. Through these metrics, indoor illuminance, daylight quality, and performance can be evaluated under certain conditions and/or annually [28]. The First daylight metric is the Useful Daylight Illuminance (UDI) which reports the frequency of daylight level. Unlike Spatial Daylight Autonomy (sDA) which only measures daylight sufficiency, UDI tries to isolate excessive bright conditions which may cause visual discomfort. As such, UDI_a determines a Goldilocks zone, which means it is adequate daylight for work tasks while preventing glare. Also, UDI_s signifies daylight levels sufficient to supplement electric lighting (but not replace) [28]. UDI Visualization is shown in Fig. 5 [28].
Figure 5
![(a) and (b)UDI visualization [28].](figures/10-173-5.jpg)
Fig. 5. (a) and (b)UDI visualization [28].
The Second daylight metric is sDA which is the percentage of spaces that are daylit; spaces that meet the illuminance levels of 300 lux using daylight only for 50% of the occupied hours. The calculations are climate-based simulations of numerous sky conditions throughout the year. As per EIS standard guidelines, shading devices have to be specified for all exterior windows. sDA Visualization is shown in Fig. 6 [28].
Figure 6
![sDA visualization [28].](figures/10-173-6.jpg)
Fig. 6. sDA visualization [28].
The Third daylight metric is Annual Sunlight Exposure (ASE) which is the percentage of spaces that are over-lit; spaces that receive direct sunlight greater than 1000 Lux for more than 250 occupied hours. Refer to below ASE Visualization is shown in Fig. 7 [28].
Figure 7
![ASE visualization [28].](figures/10-173-7.jpg)
Fig. 7. ASE visualization [28].
The last daylight availability metric is the mean illuminance which is the average illuminance of occupied spaces to the occupied hours. Mean Illuminance Visualization is presented in Fig. 8 [28].
Figure 8
![Mean illuminance visualization [28].](figures/10-173-8.jpg)
Fig. 8. Mean illuminance visualization [28].
2.3.2. Daylight availability
Climate Studio has the ability to calculate annual glare distribution in any occupied spaces, the calculation is based on Daylight Glare Probability (DGP) metrics. The prediction of DGP is based on the probability that the user at any given position or orientation would experience discomfort glare. This metric is usually calculated using a fisheye rendering with an opening angle of 180 degrees. The values of this metric are between 0 and 100% and are divided into four categories illustrated in Fig. 9 showing DGP Categories and Values [28].
Figure 9
![DGP categories and values [28].](figures/10-173-9.jpg)
Fig. 9. DGP categories and values [28].
Spatial Disturbing Glare (sDG) is the percentage of occupied area that experiences Disturbing or Intolerable Glare (DGP > 38%) for a minimum of 5% of occupied hours. The calculation is constructed on DGP hourly values for 8 different view directions at each position in each space. Disturbing glare frequency is visualized through the Rhino software viewport using eight directional pie slices, with the color indicating frequency from 0 to 5%. Disturbing Glare Frequency Visualization is shown in Fig. 10 [28].
Figure 10
![(a) and (b) Disturbing glare frequency visualization [28].](figures/10-173-10.jpg)
Fig. 10. (a) and (b) Disturbing glare frequency visualization [28].
3. Experimental analysis procedure
When it comes to educational buildings, lighting is considered one of the most important building systems. In order to provide an effective learning environment, schools rely on lighting as it is one of the most critical physical characteristics. It is claimed by the researcher L. Gelfand that natural lighting in classrooms is capable of connecting both teachers and students to nature which directly boosts their mood. The mental function in educational facilities is affected by the amount of light provided, while the lack of windows may cause stress to users [29].
A study by Heschong examined a number of 8000 students in 450 different classroom settings and the study showed that natural light can directly affect students’ performance. The study showed a high correlation between the reported improvement in students’ test scores as the daylight provided increased. Classrooms with daylight showed a promotion of 20% in comparison to the ones without daylight [29,30].
The researcher also investigated schools in California where clear sky and adequate daylighting are provided in comparison to schools in Seattle where daylighting is limited as a result of the cloudy sky. The investigation was done by means of reading and math tests with a sample of 21,000 students and the results showed that students in California had an increase in academic performance by a percentage of 20 to 26%, while in Seattle showed about 7% to 18% development. When a comparison is done between classrooms with maximum and minimum daylighting, students’ scores in classrooms with maximum daylighting improved by 20% in math and by 26% in reading [29,30].
In the field of architecture education, Architecture Studio-Based Tutoring is highly important as a result of the duration of use than any other classroom. Therefore, the daylight quality within the studio is an immense consideration to improve students’ performance, visual comfort, and overall mood. The Architecture Studio is not confined to the production of drawings, but also the place where design is explored. Henceforth, the space needs to be capable of simulating students’ creativity in the space design. The space chosen for the study is Architectural Studio at the Cairo University Faculty of Engineering, Egypt. The studio has two facades facing both North and South and the openings are vast which allows excessive daylight to penetrate the space.
Egypt is located at 26.8206° N, and 30.8025° E where the climate is mostly hot and dry. During the summer season (May to October) temperature ranges from 7°C at night and 43°C during the day. During the winter season (November to April) the temperature sometimes drops to 0°C and can reach as high as 18°C during the day. The sky is clear and sunny most of the year, with a few cloudy and partially cloudy days. As for precipitation, Egypt is considered an arid country receiving very little precipitation annually. The weather file used for the simulation is Typical Meteorological Year (TMY). This type of file comprises measured hourly data for various physical quantities that are necessary for the environmental performance analysis such as direct and diffuse solar radiation, temperature, humidity, wind speed, and wind direction.
3.1. Research methodology
The research methodology is divided into Four phases; Database Creation, Preliminary Simulation, Facades Simulation, and Comparative Analysis. The following subsections discuss the steps followed in each phase (Fig. 11).
Figure 11
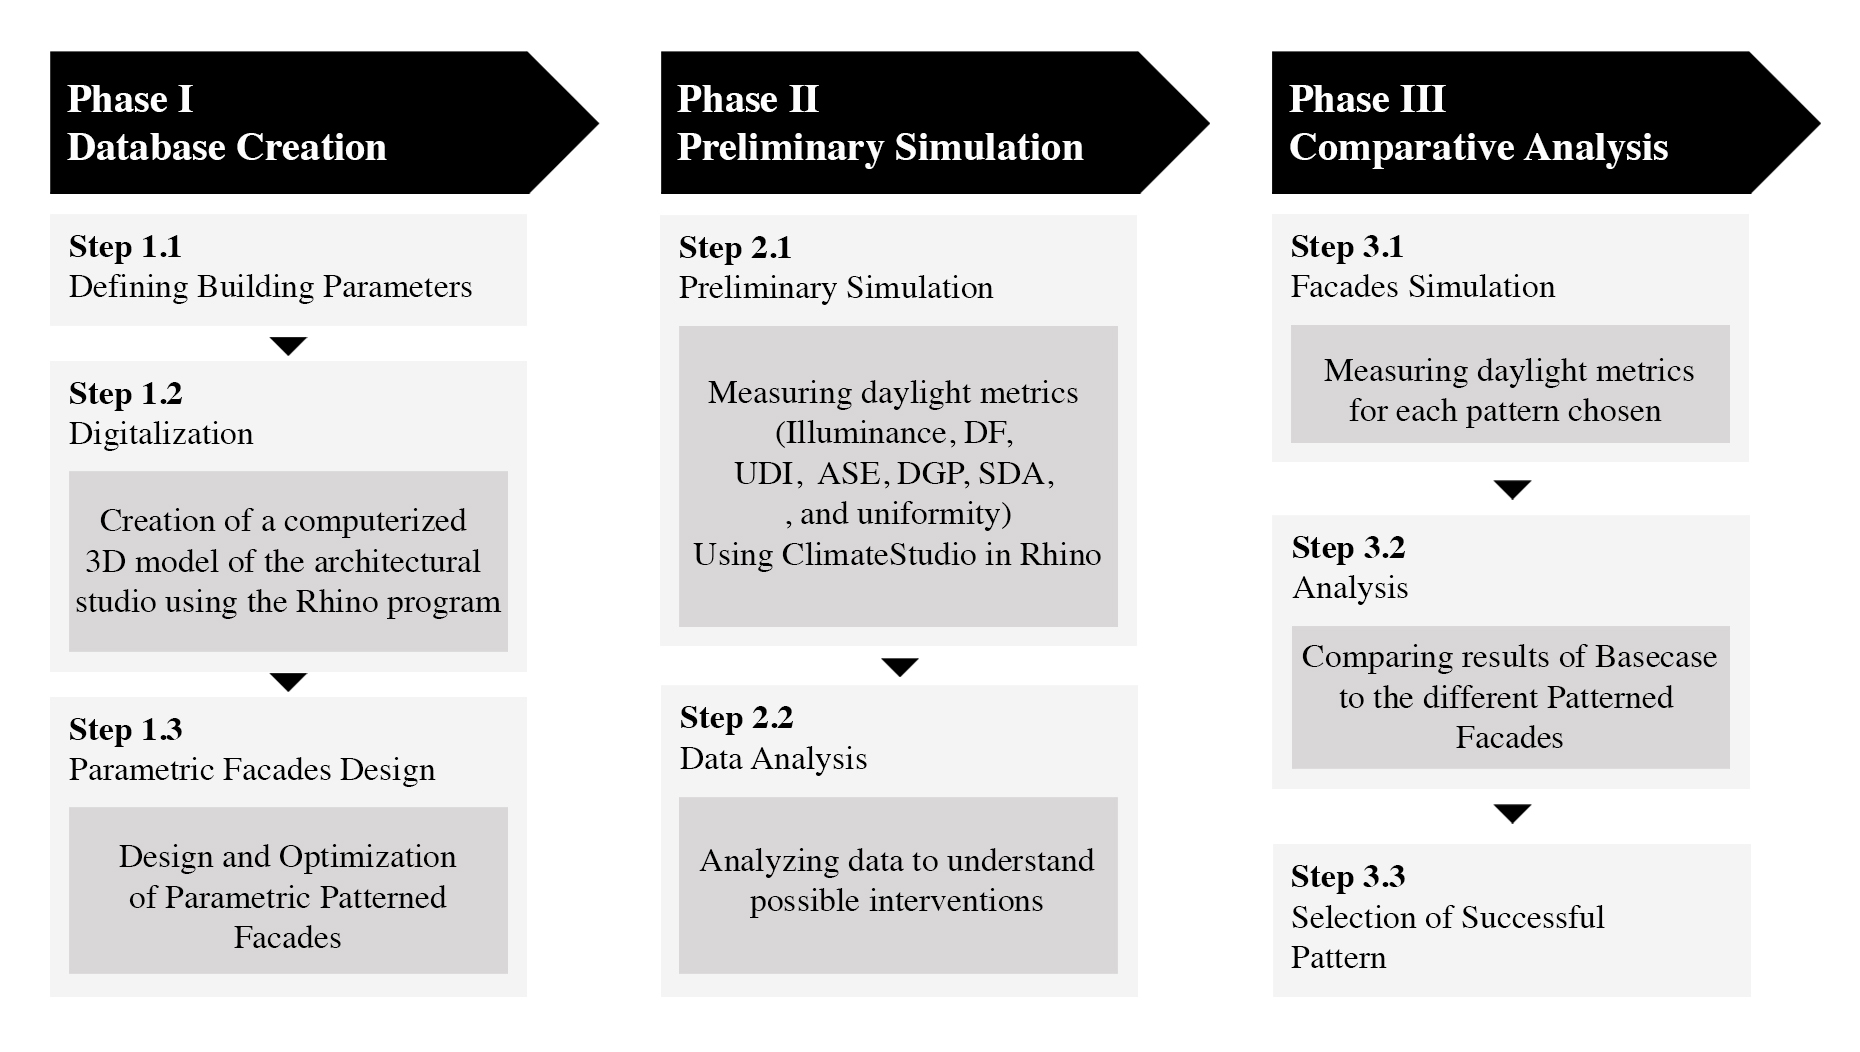
Fig. 11. Summary of Research Methodology.
Phase I: Material and methods
Step 1.1: Select the target building and studio and digitize the design parameters as input features; Record the condition of the existing studio which includes class dimensions, wall color, floor and ceiling, class layout, class orientation, sky conditions, opening dimensions, opening material, floor elevation, and measurement time. Step 1.2: Creation of a computerized 3D model of the architectural studio using the Rhino program in order to represent the base case without the addition of the patterned façade. Step 1.3: Parametric Patterned Façade Design and Optimization.
Phase II: Daylight simulation study
Step 2.1: Measuring daylight metrics (Illuminance, Daylight Factor (DF), UDI, ASE, Daylight Glare Probability (DGP), sDA, and uniformity through the daylight simulation program Climate Studio. Step 2.2: Data collection and analysis based on daylight Simulation in order to understand the possible interventions.
Phase III: Comparative analysis
Step 3.1: Measuring daylight metrics (Illuminance, DF, UDI, ASE, Daylight Glare Probability (DGP), sDA, and uniformity through the daylight simulation program Climate Studio for each Parametric Patterned Facade. Step 3.2: Comparing results of patterned facades to base case one. Step 3.3: Selection of successful patterns.
3.2. Phase I; material and methods
The space selected for the simulation study is an Architecture Studio-based Tutoring at the Cairo University, Faculty of Engineering in Egypt, located on the sixth floor of the architecture building. The occupancy of the studio is from 8 a.m. to 6 p.m. from Saturday to Thursday. For the Selection Criteria; The first criterion is that the studio is on the sixth floor where there are no buildings obstructing daylight from penetrating the studio. The second criterion is the studio orientation where it has two facades facing both North and South which means that the south façade has a high level of daylight penetration. The third criterion was the college level which was the 4th year students. The reason behind this selection is that the students would have sufficient knowledge to assess the space and be knowledgeable of the space requirements and standards. Figure 12 shows the sixth-floor plan of the Architecture Building. Figure 13 illustrates the studio plans and sections with dimensions. Figure 14 shows images of the studio in real life.
Figure 12
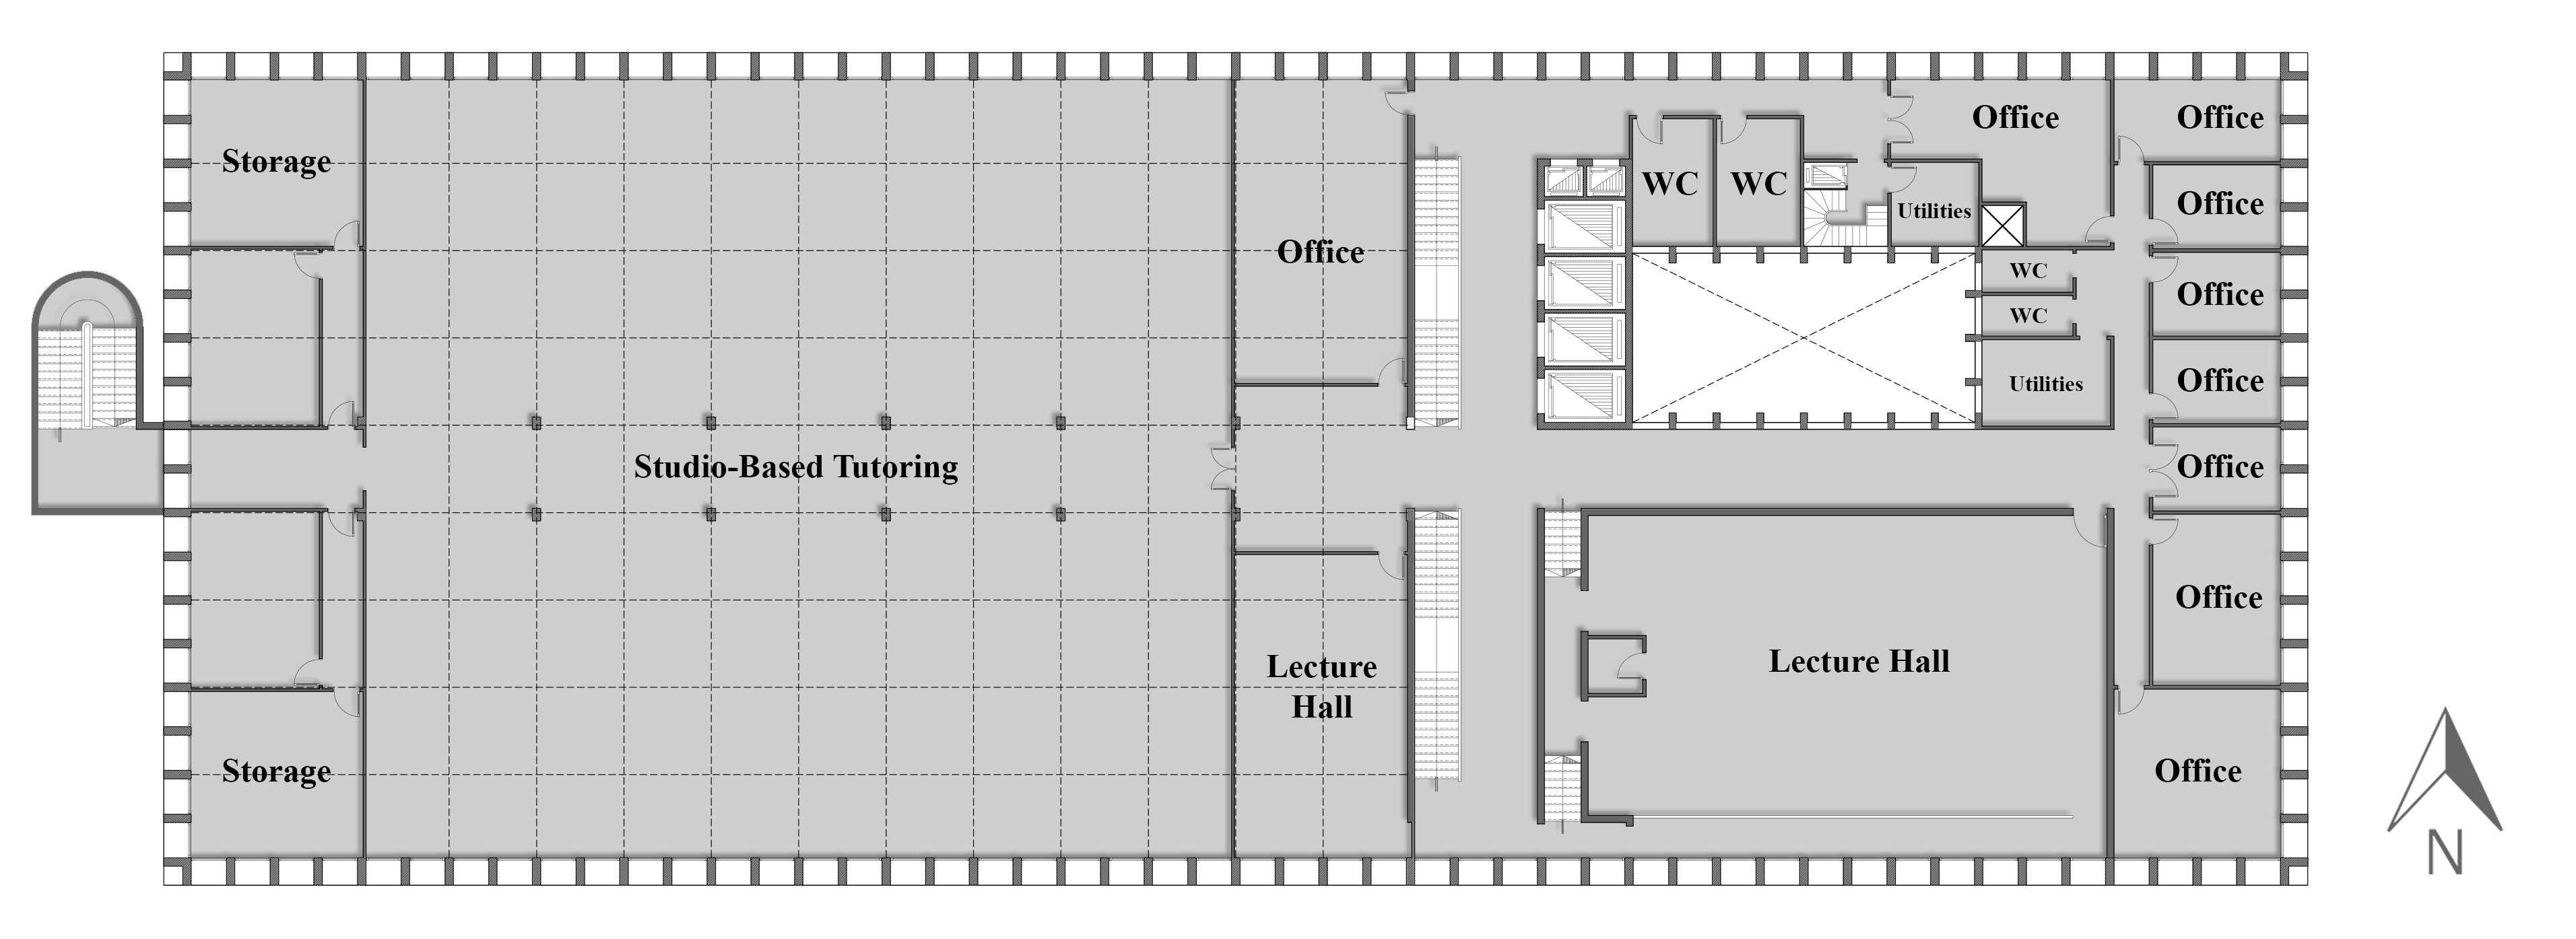
Fig. 12. Sixth floor architecture building.
Figure 13
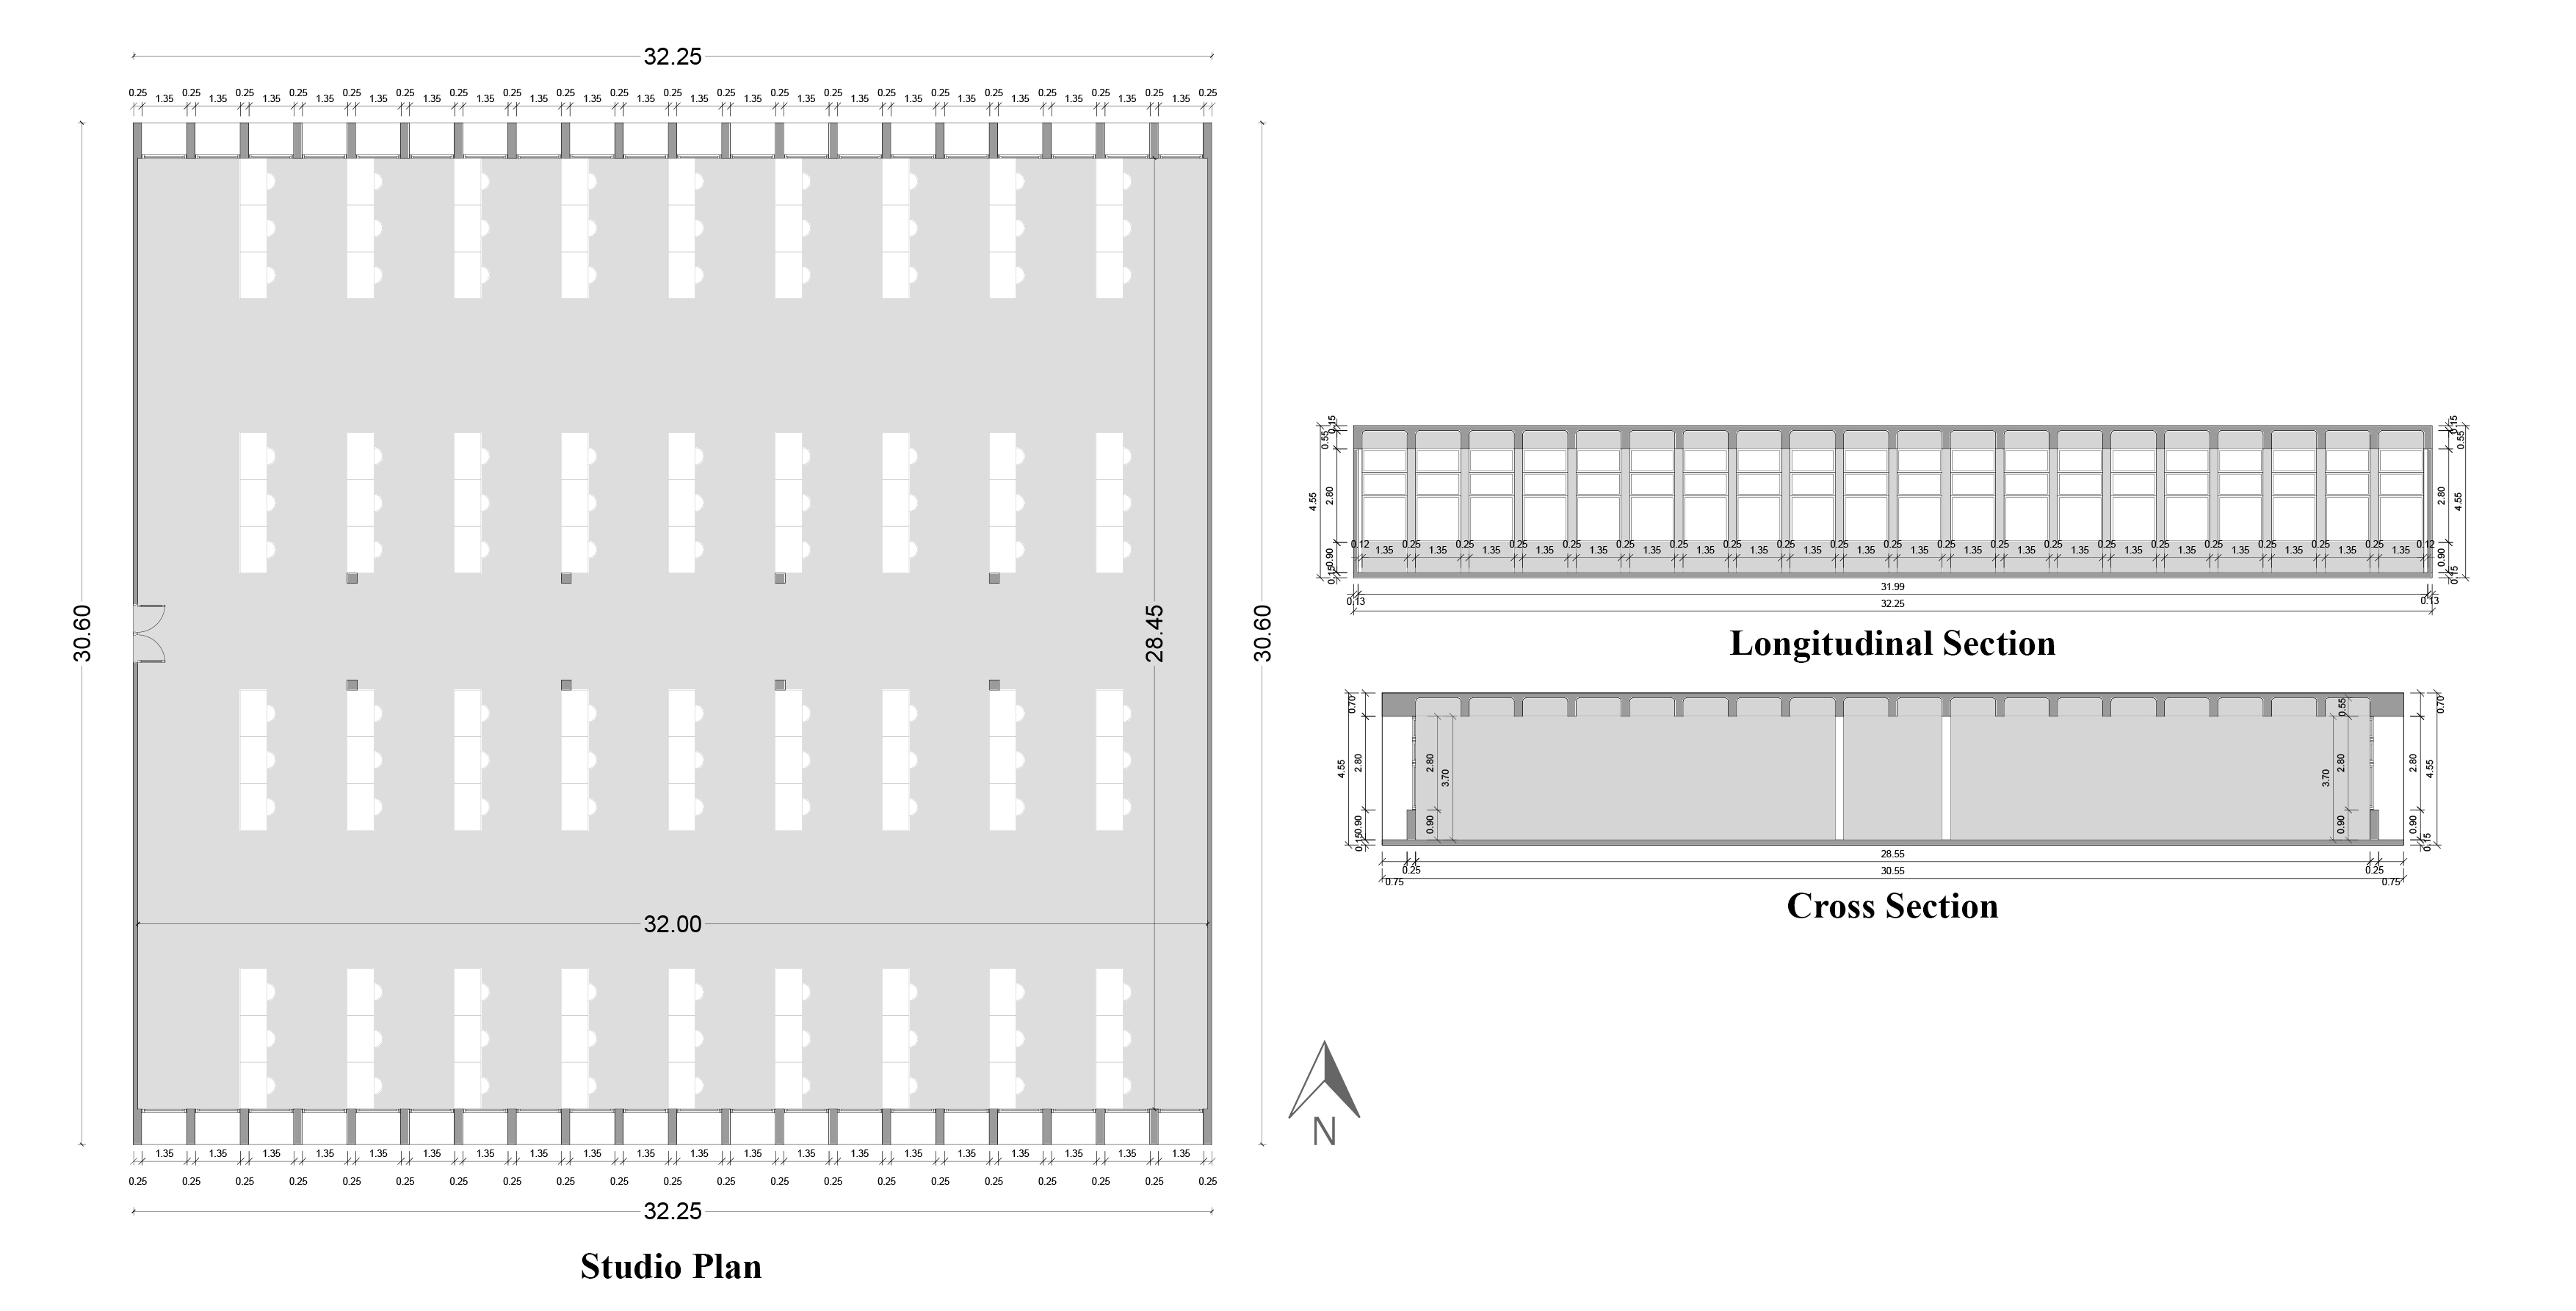
Fig. 13. Studio plan and sections.
Figure 14
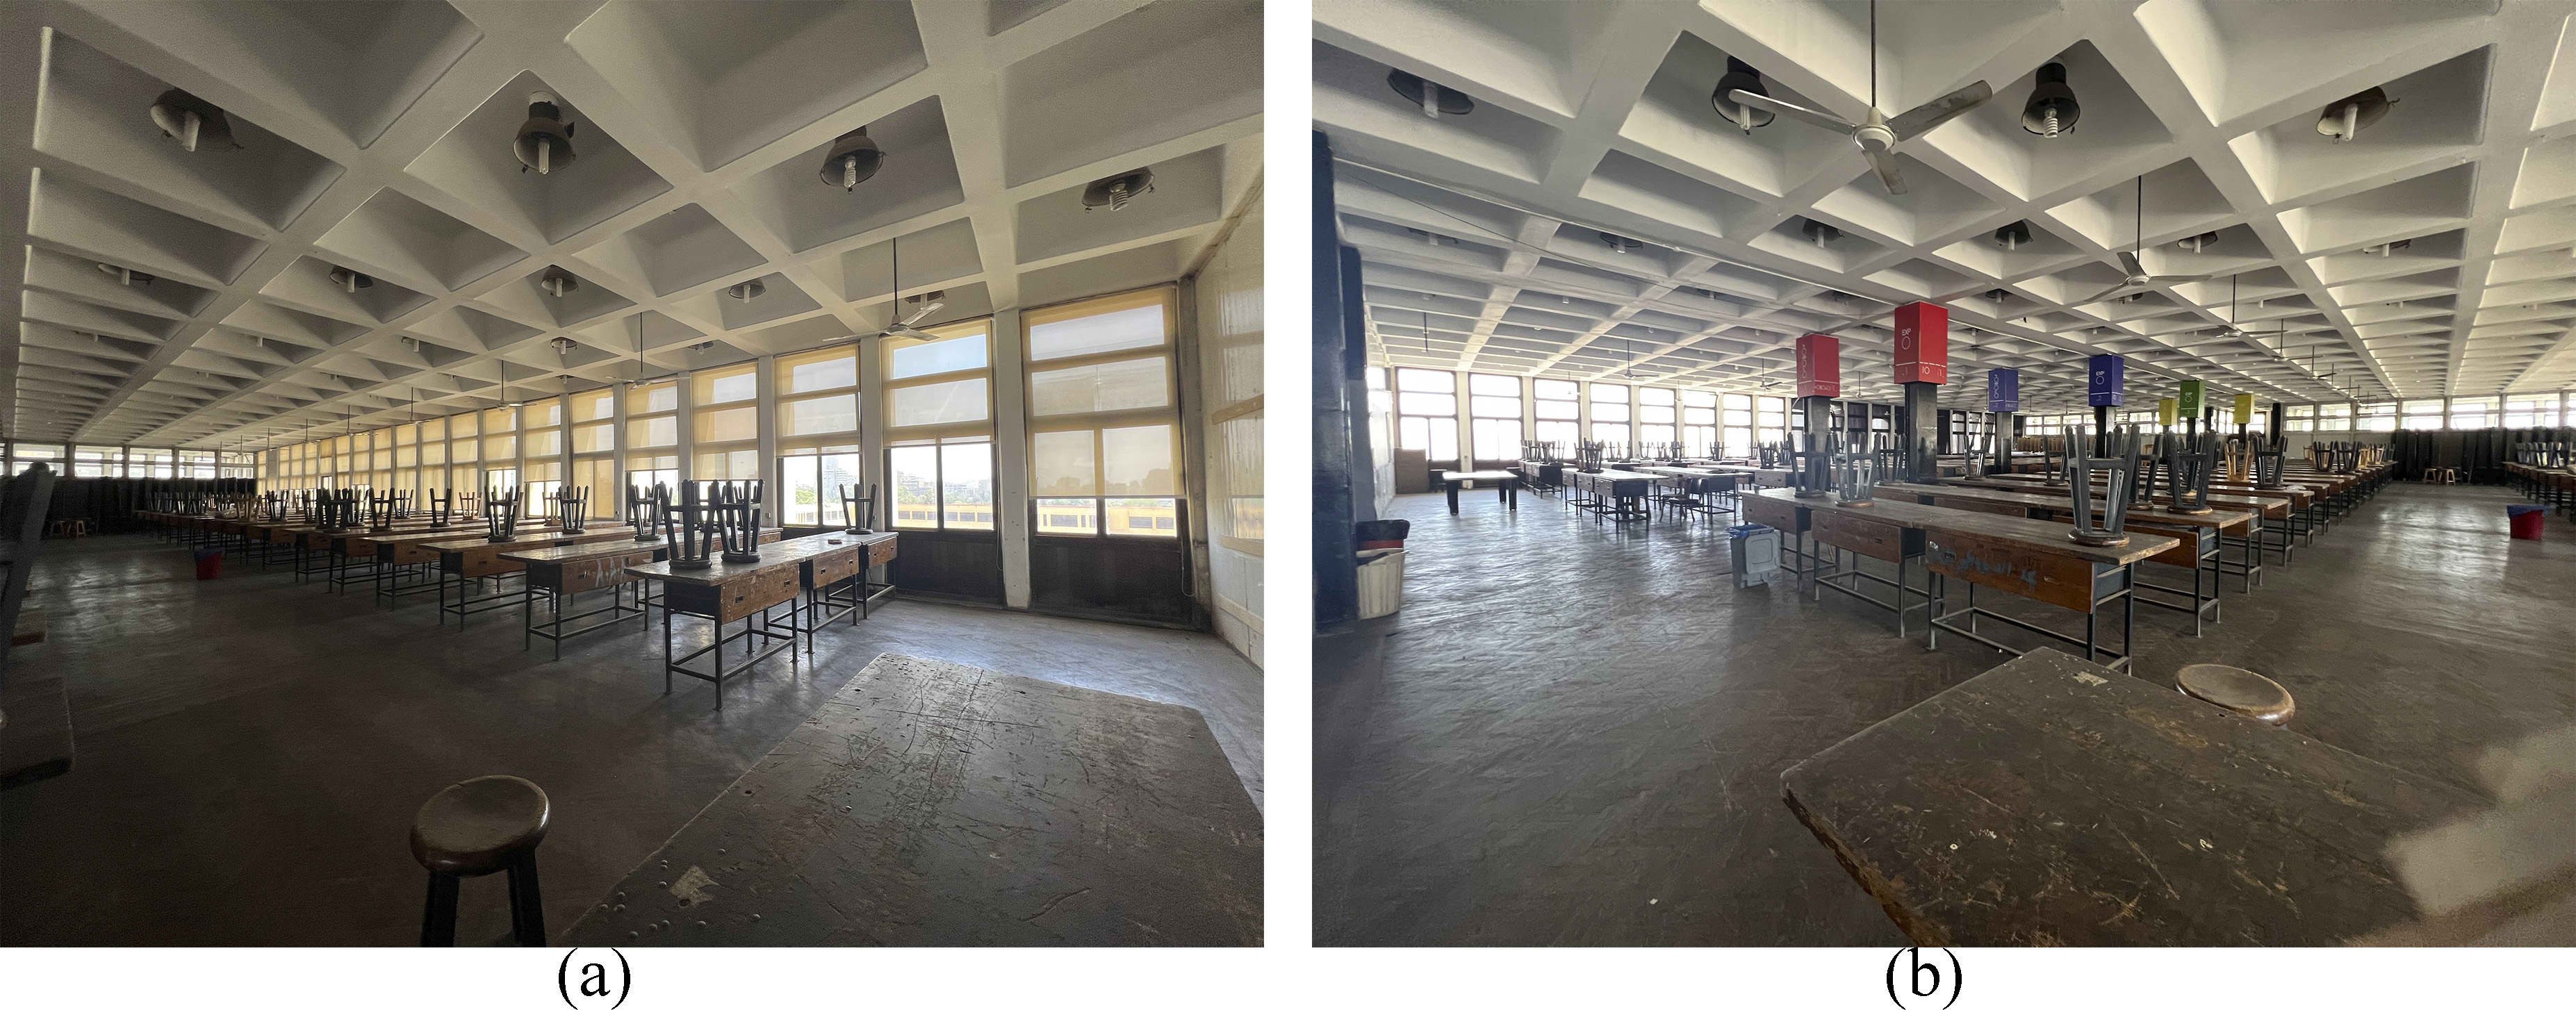
Fig. 14. (a) and (b) Real-life images of the studio.
Table 5 illustrates the space parameters that are used to build the base case model for the daylight simulation study;
Table 5
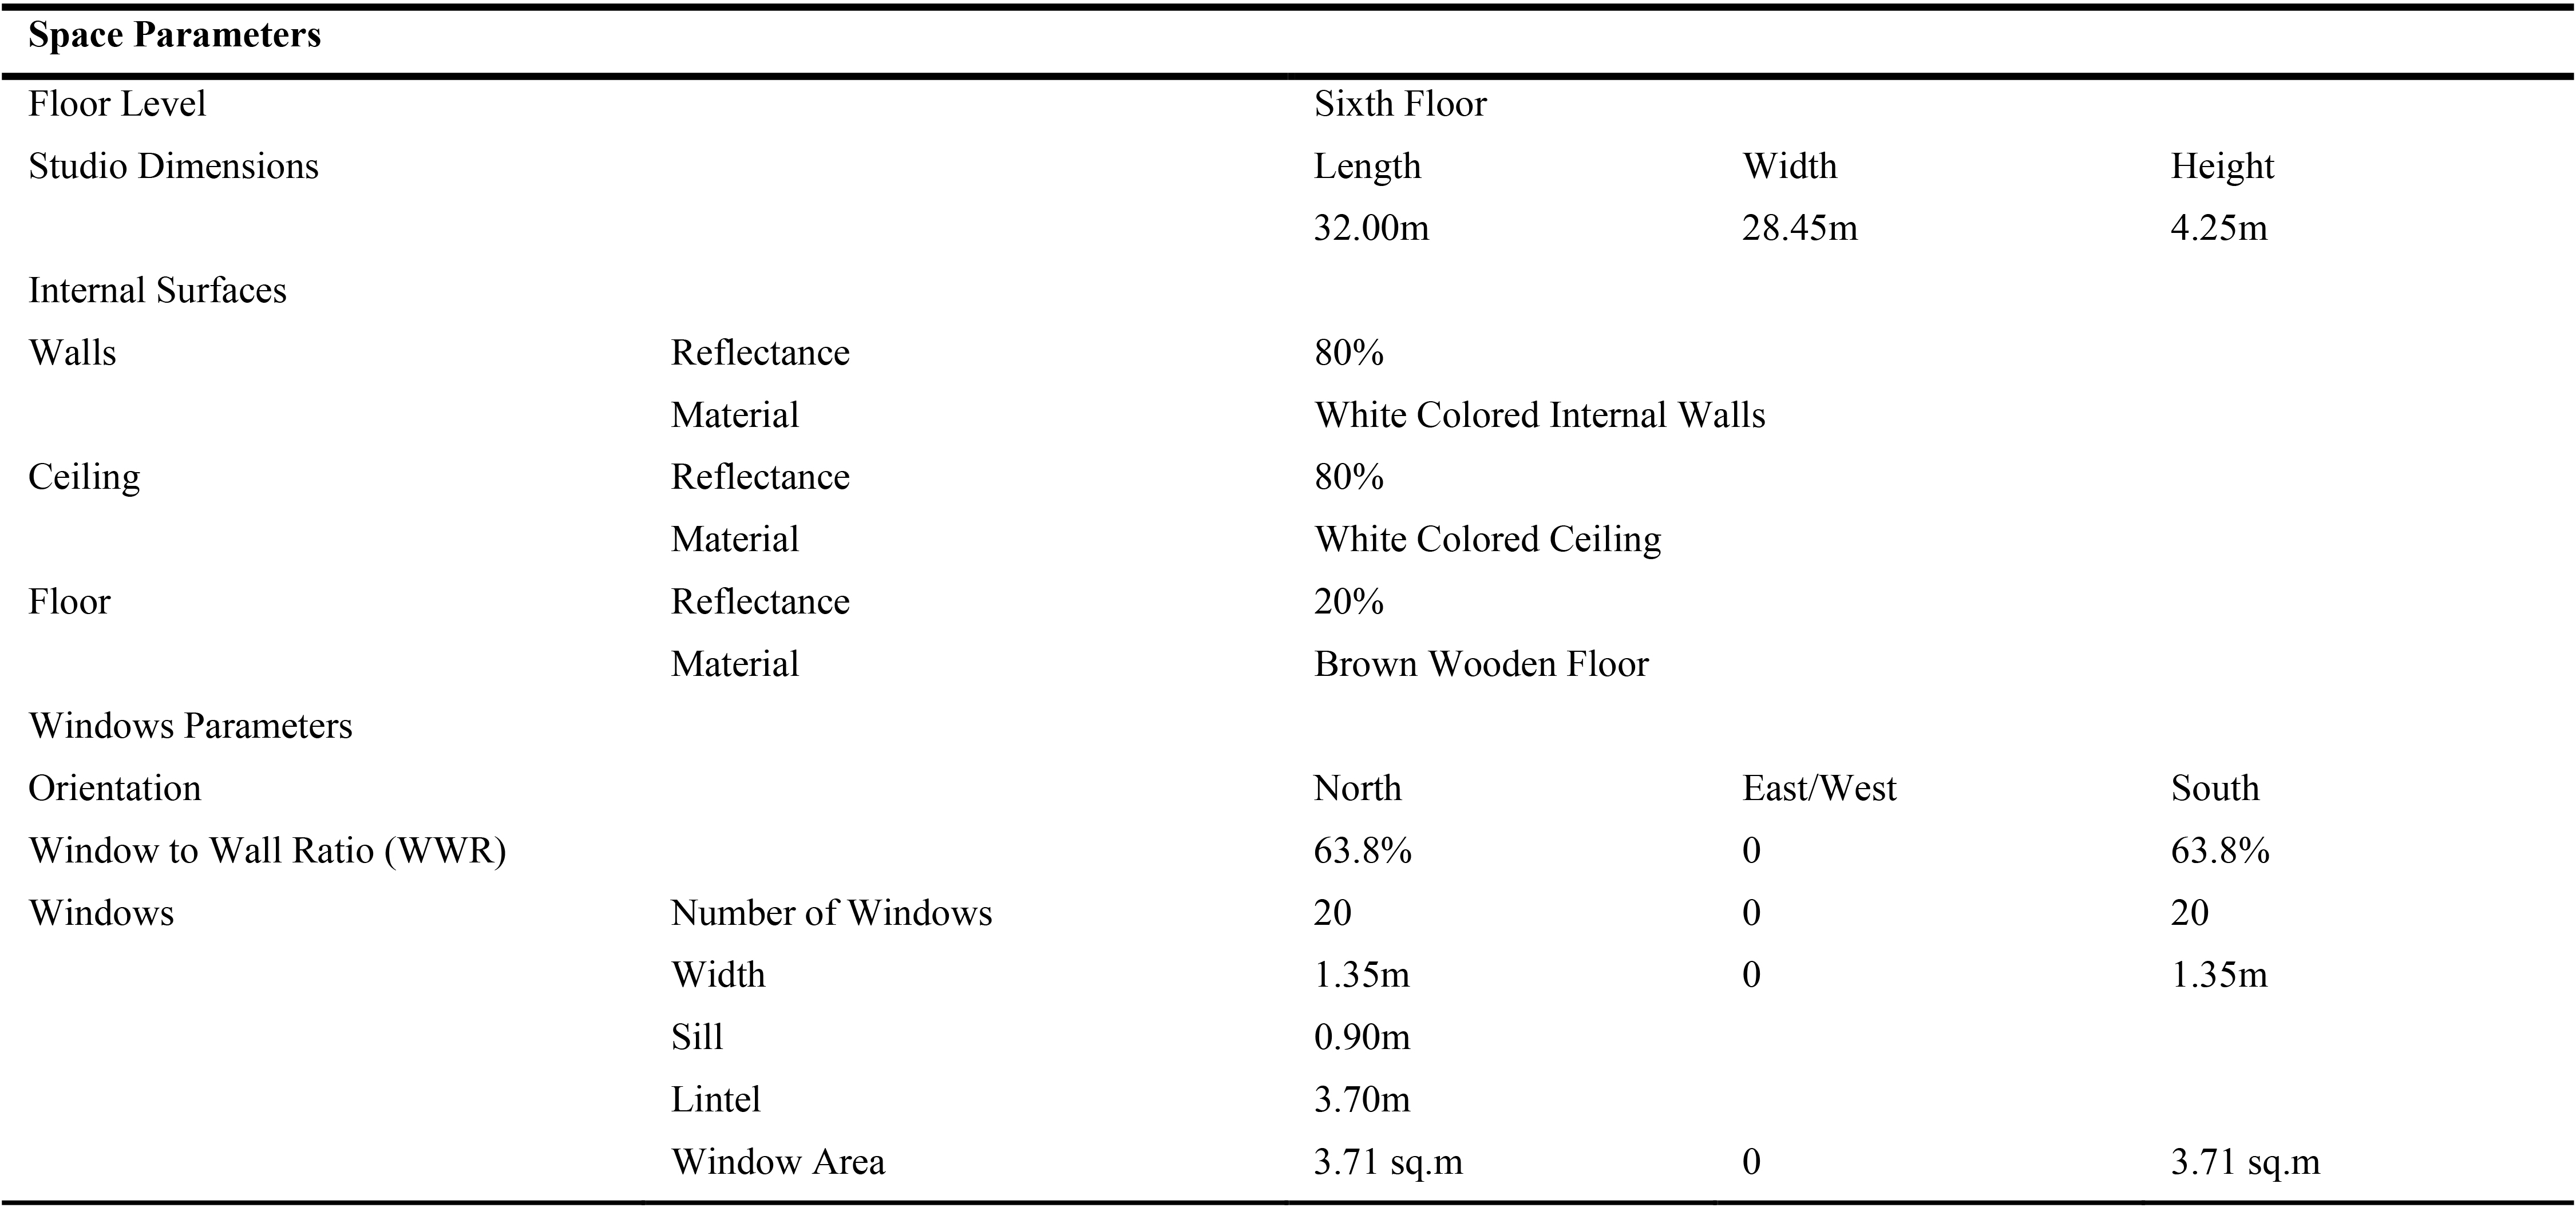
Table 5. Base case model parameters.
3.3. Parametric patterned facades design and optimization
For the parametric patterned facades simulation, different designs were created and simulated. First, based on an experiment by Ahmed Rashwan et. Al showed that the deconstructive pattern (named tiling and subdivision (VOR) by the author) displayed the best results for daylight performance [7], however, when the simulation was conducted using different climatic region, the results were almost similar to the base case model; illuminance, illuminance distribution, UDI, ASE, DF, and DGP all exceeded the recommended threshold due to the large perforation size. We also tried Islamic patterns mimicking the “Islamic Mashrabeya” with a small perforation size. A study by Hana M. Aljawder and Hala A. El-Wakeel showed that the “Islamic Mashrabeya” has a positive effect on daylight performance [31], however, when the simulation was conducted using different climatic region, the results showed excessive levels of illuminance and glare in the area near the windows. Based on the findings of the previous two simulations, we then designed geometric parametric patterns with consistent openings the opening size was the same from top to bottom. The results were improved, however, the results showed that the area near the south façade openings suffered from high levels of illuminance and glare. When we designed parametric geometric patterns with controlled perforation size and area, where the area of each single perforation decreased gradually from top to bottom (gradient patterns), daylight metrics improved. The gradient distribution of the parametric patterns where the upper area of the screen is relatively larger than the bottom allows daylight to enter deeper into the studio space, reduces illuminance levels, and prevents glare at the area near the window. Trial patterns are presented in Fig. 15.
Figure 15
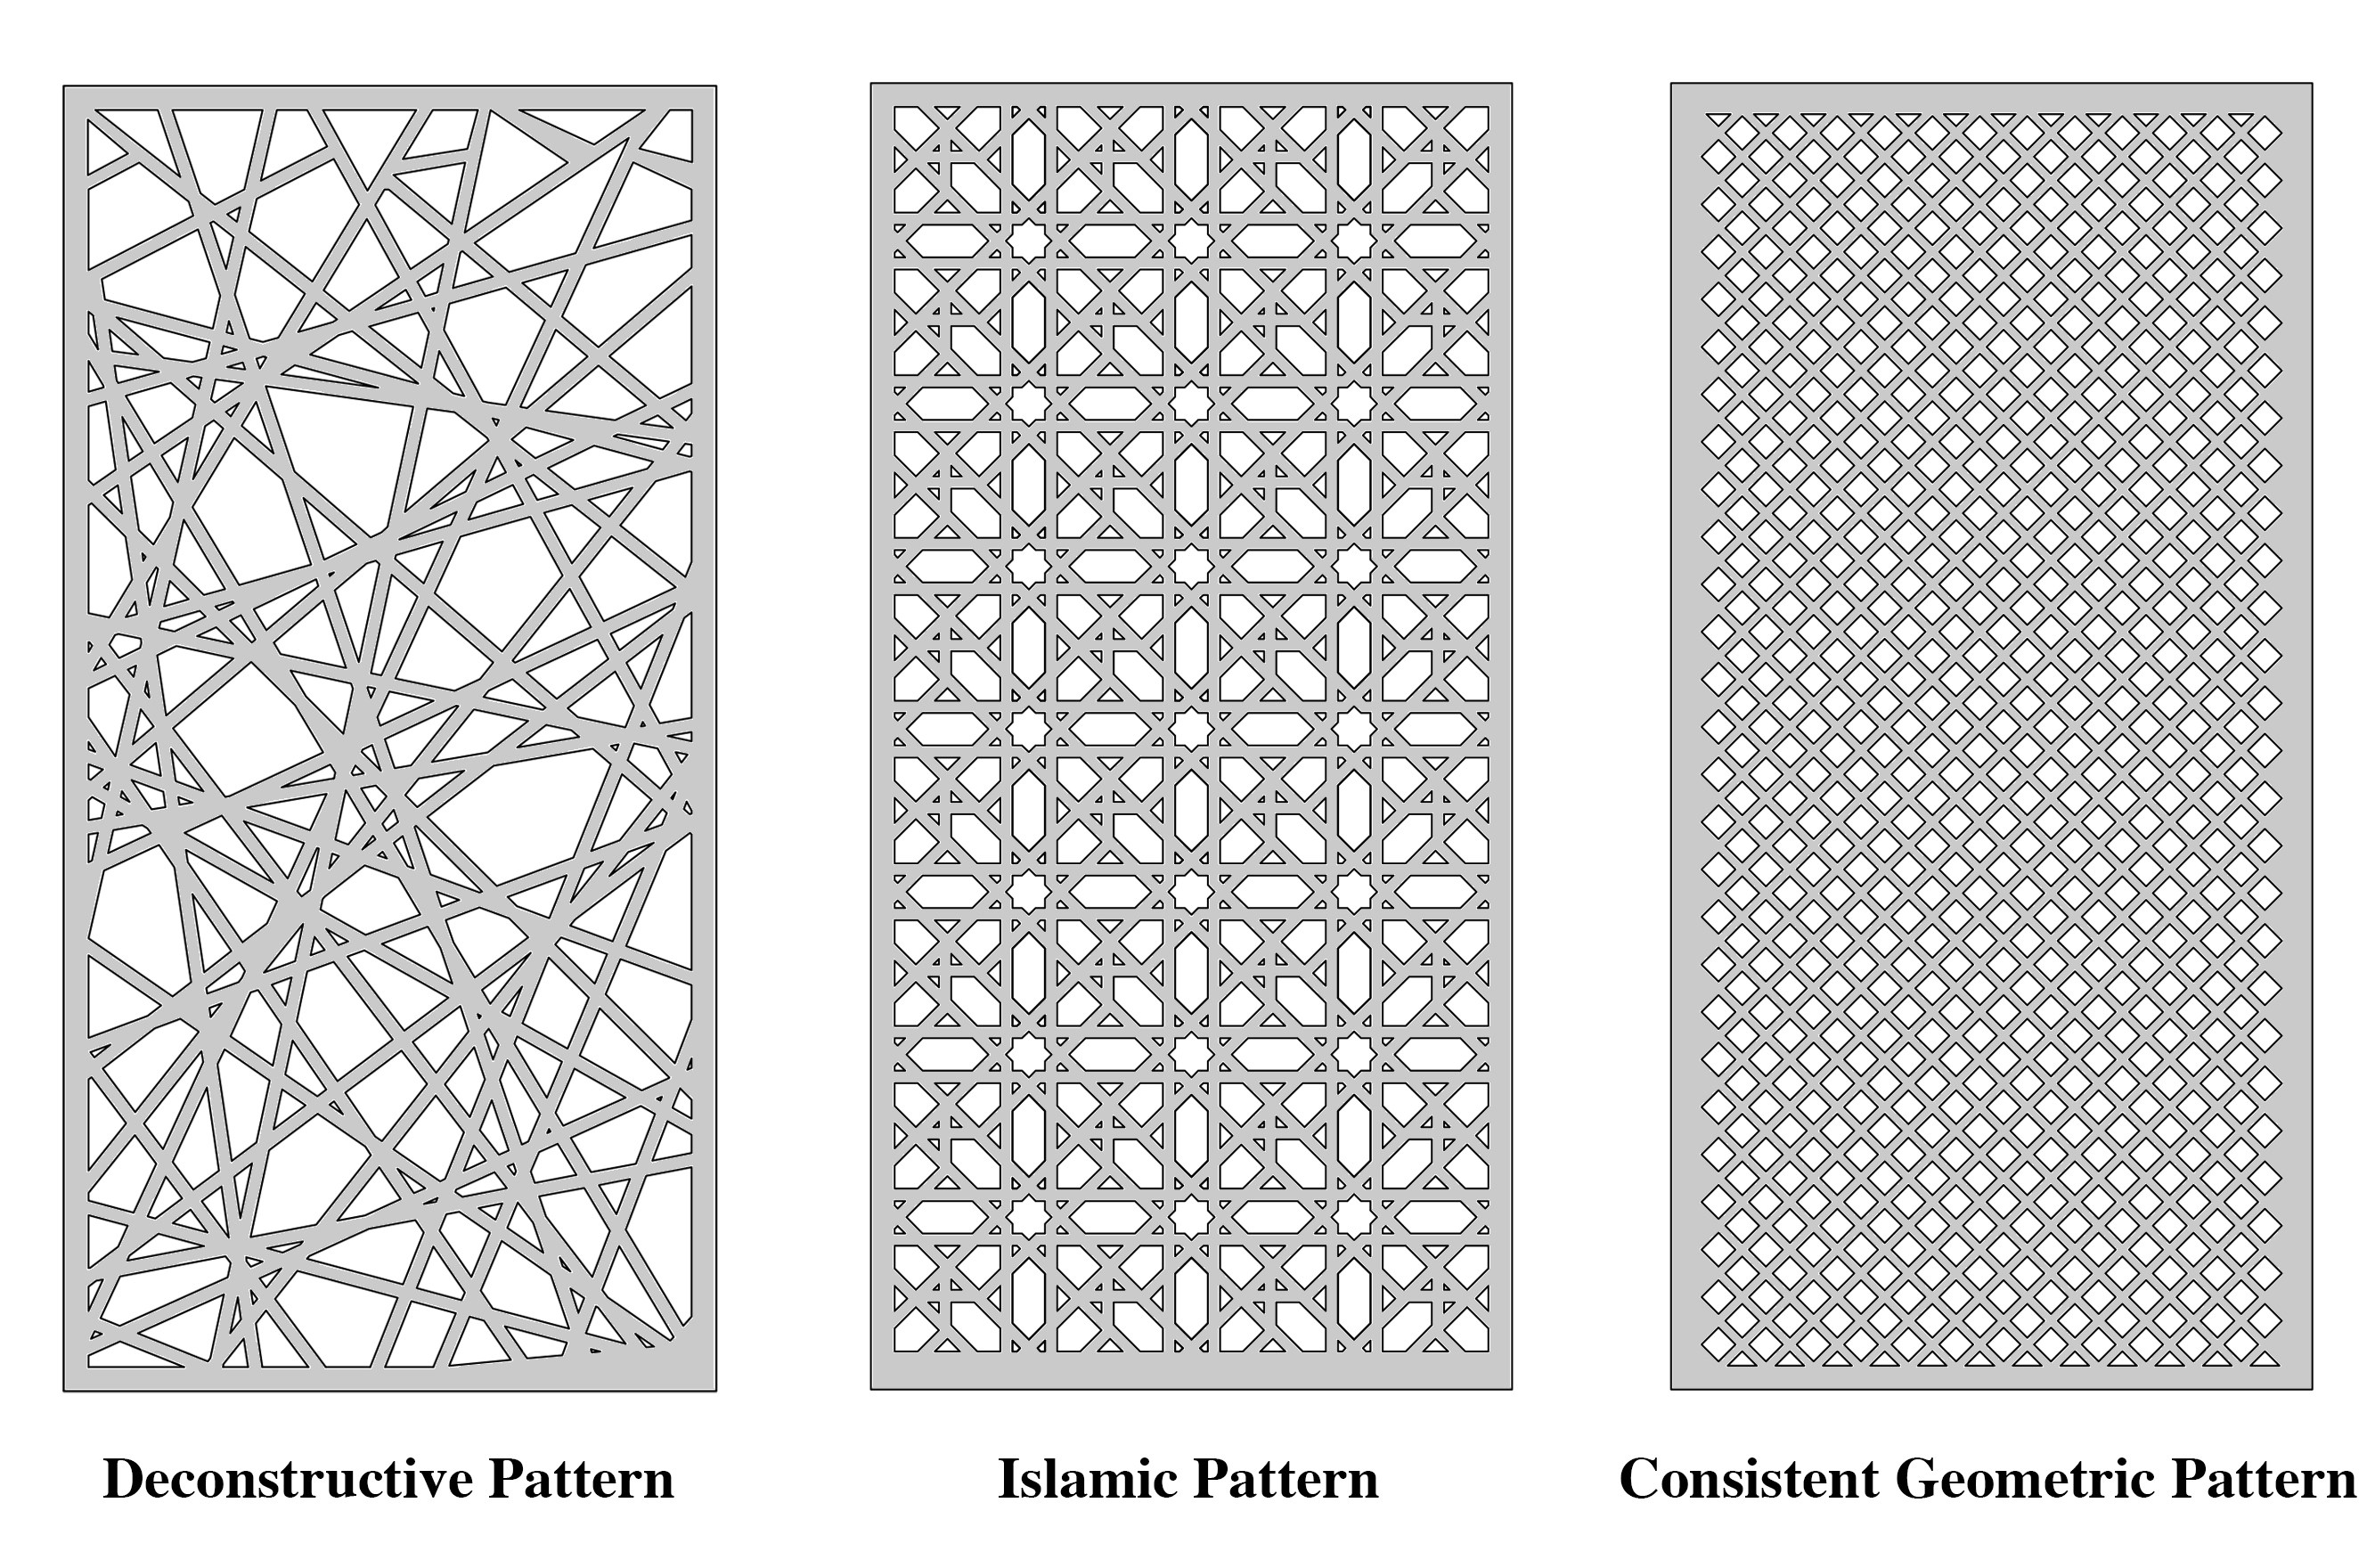
Fig. 15. Trial Patterns.
Three geometric parametric patterns were created; Circles, Squares, and Triangles. The three patterns differ mainly in the perforation area while perforation size is almost constant. For the South façade, the recommended perforation size needs to be small and gradually decrease. For the North façade, the recommended perforation size needs to be 3 times larger than that of the South façade and gradually decrease. The first pattern designed is the Circles Pattern (patterns 1.1 and 1.2). For the South façade, the perforation size started at 28 sq. cm and gradually decreased to 13 sq. cm (53% decrease) where the total perforation area is 0.83 sq. m. (22% perforation ratio). For the North façade, the perforation size started at 83 sq. cm and gradually decreased to 58 sq. cm (30% decrease) where the total perforation area is 0.85 sq. m. (23% perforation ratio). The second pattern designed is the Squares Pattern (patterns 2.1 and 2.2). For the South façade, the perforation size started at 26 sq. cm and gradually decreased to 8 sq. cm (70% decrease) where the total perforation area is 1.01 sq. m. (27% perforation ratio). For the North façade, the perforation size started at 100 sq. cm and gradually decreased to 36 sq. cm (64% decrease) where the total perforation area is 1.20 sq. m. (28% perforation ratio). The third pattern designed in the Triangles Pattern (pattern 3.1 and 3.2). For the South façade, the perforation size started at 23 sq. cm and gradually decreased to 6 sq. cm (75% decrease) where the total perforation area is 1.44 sq. m. (38% perforation ratio). For the North façade, the perforation size started at 73 sq. cm and gradually decreased to 42 sq. cm (42% decrease) where the total perforation area is 1.40 sq. m. (37.8% perforation ratio). When we tried increasing the perforation percentage above 40%, illuminance levels increased beyond the acceptable thresholds as well as glare. Figure Fig. 16 illustrates the Parametric Patterned Facades. In Table 6, Patterned Facade Parameters defines the Pattered Facades parameters previously discussed.
Figure 16
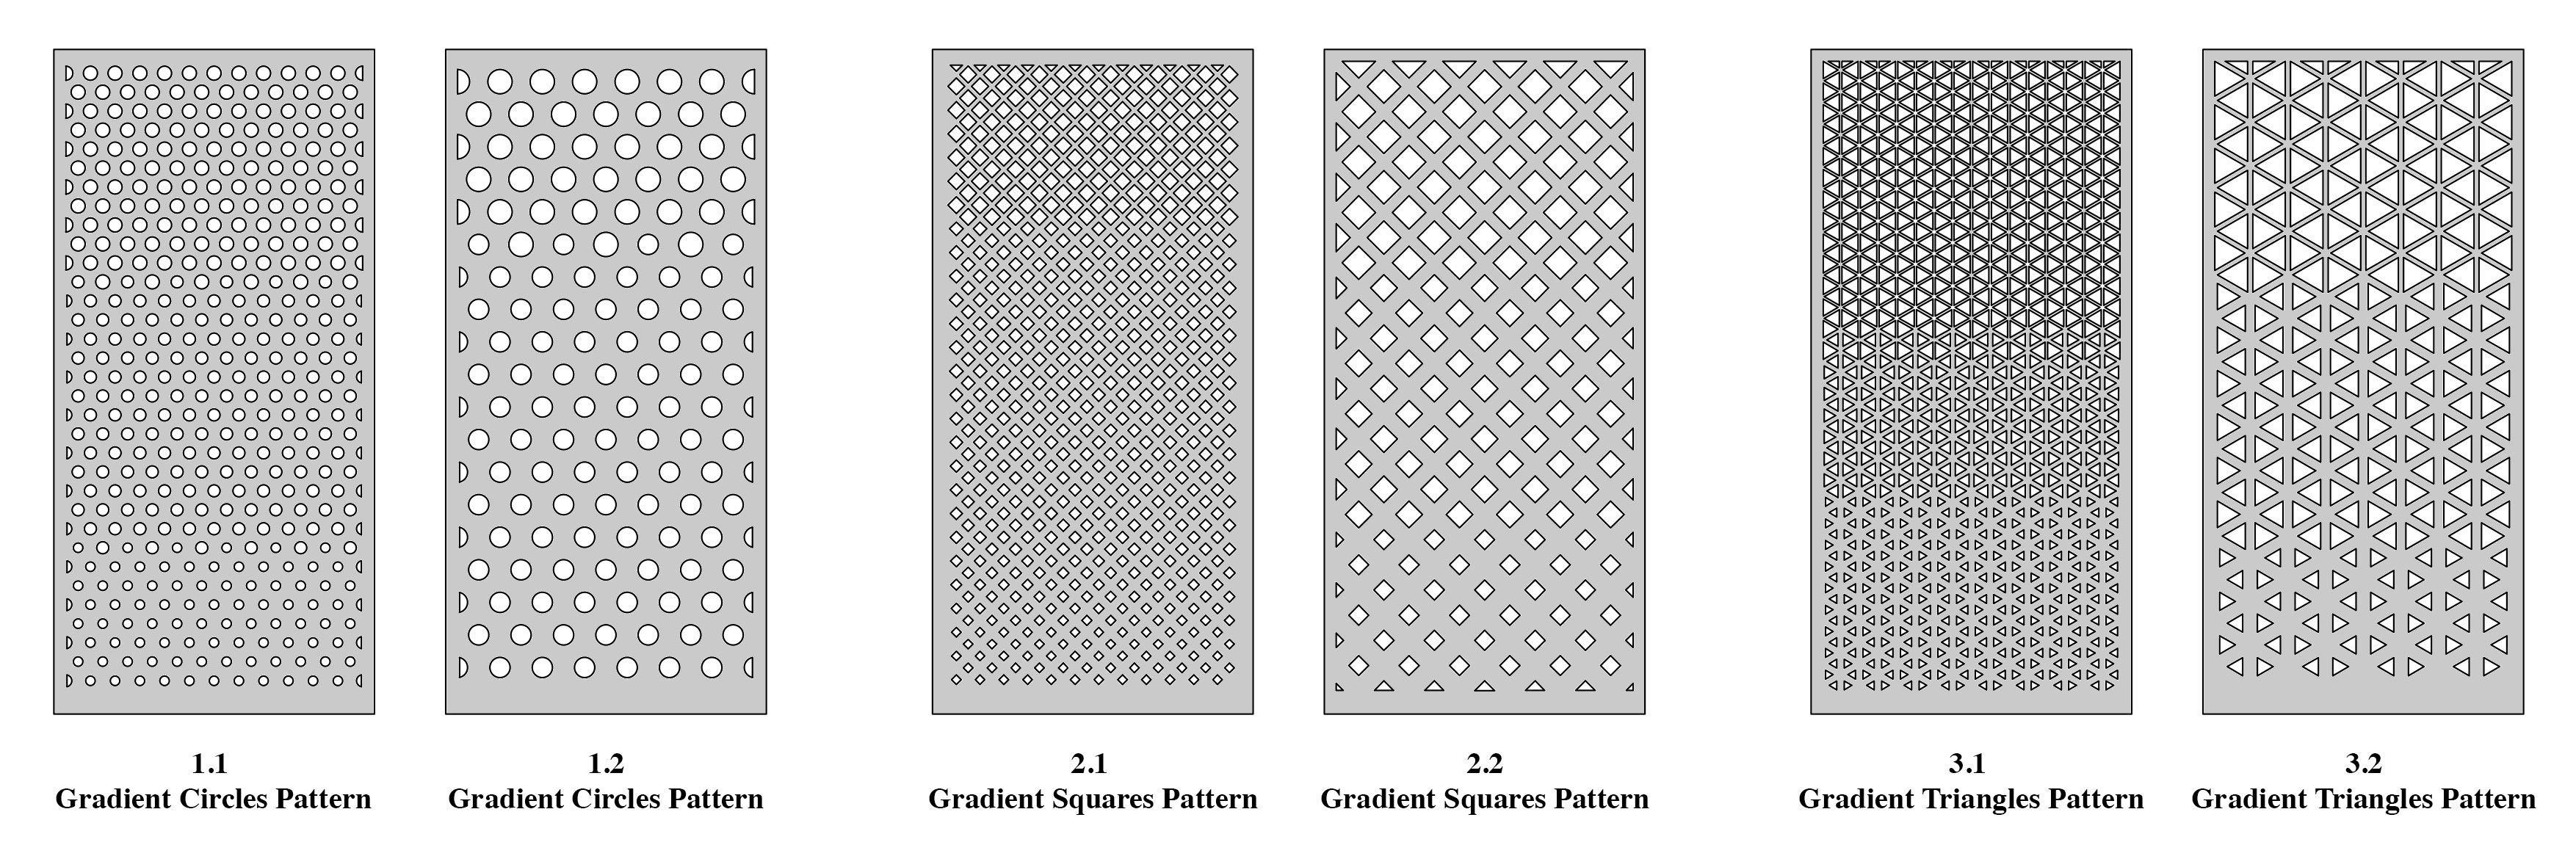
Fig. 16. Parametric patterned facades.
Table 6
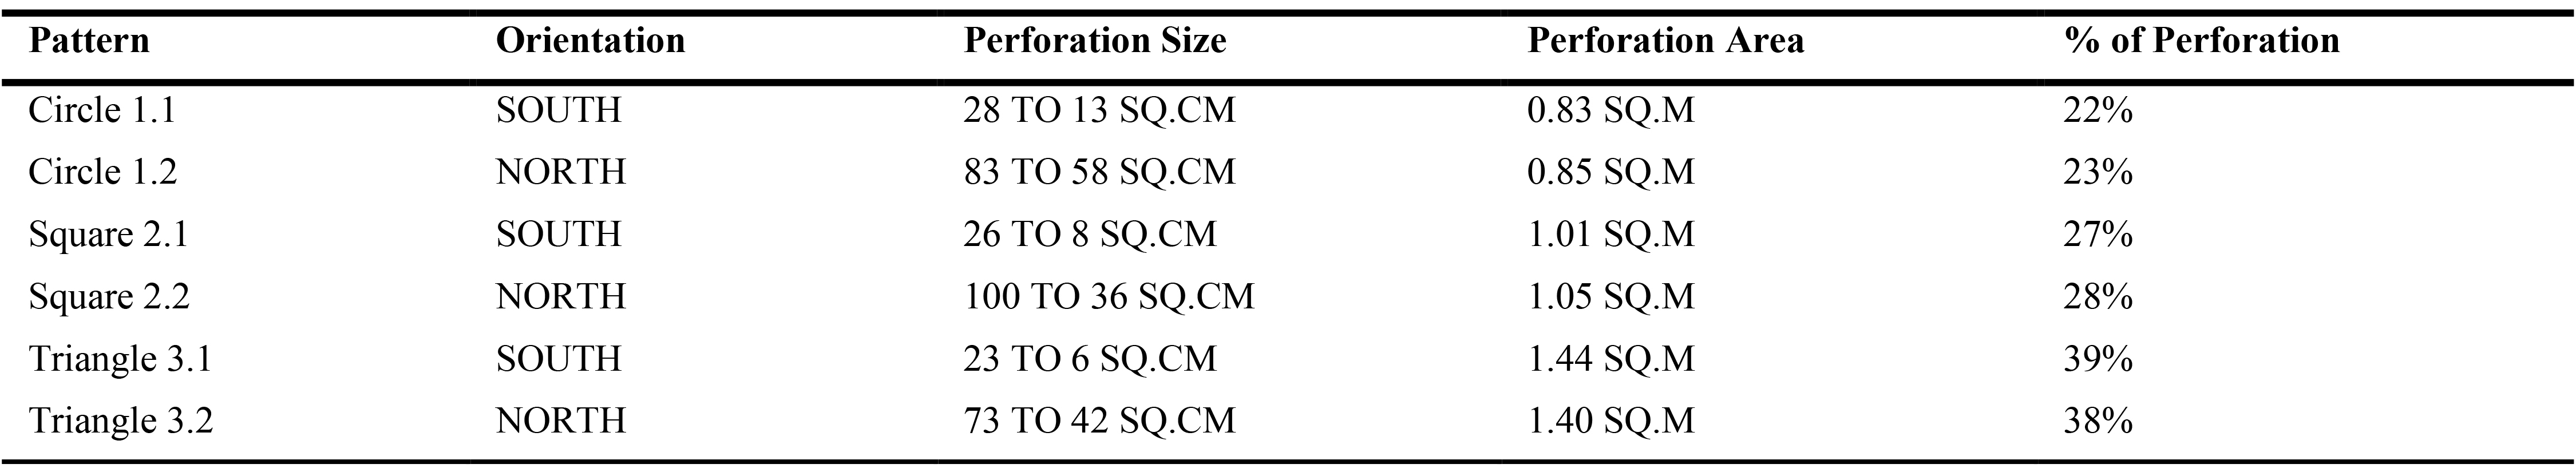
Table 6. Base case model parameters.
3. Results
4.1. Phase II; preliminary simulation
The total area for simulation is 910.4 sq. m. The reference plane on which the simulation was conducted is placed at a height of 0.9m, and the sensor count is 2444 with spacing between each sensor 0.61m by 0.61m. The occupancy of the space is from 8 a.m. to 6 p.m.
The first metric is Illuminance which refers to the luminous flux incident on a surface. Due to its simplicity in terms of measurement, illuminance is a broadly used method to capture light sufficiency in lighting standards. Also, it is widely explored as a potential variable that influences human performance [32]. The Illuminating Engineering Society (IES) recommends horizontal and vertical illuminance targets to ensure sufficient illumination for occupants. It is described in “lux” (lumens per square meter) or footcandles (lumens per square foot); 1 footcandle = 10.76391 lux. The range of adequate illuminance threshold is limited between 300 to 3000 Lux [33]. For architecture studio-based tutoring, the range of the illuminance values should be between 300-750 Lux.
The results for annual Illuminance show that both north and south facades receive high values that reach 3600 lux and the values decrease at the center of the studio receiving low values that reach 451 lux, while the mean illuminance value is 2394 lux. The illuminance chart shows that daylight illuminance is available from 5 am to 7 pm, where the maximum illuminance during the day is from 7 am to 5 pm and is equal during the whole year. Figure 17 illustrates the annual illuminance distribution and chart within the studio area.
Figure 17
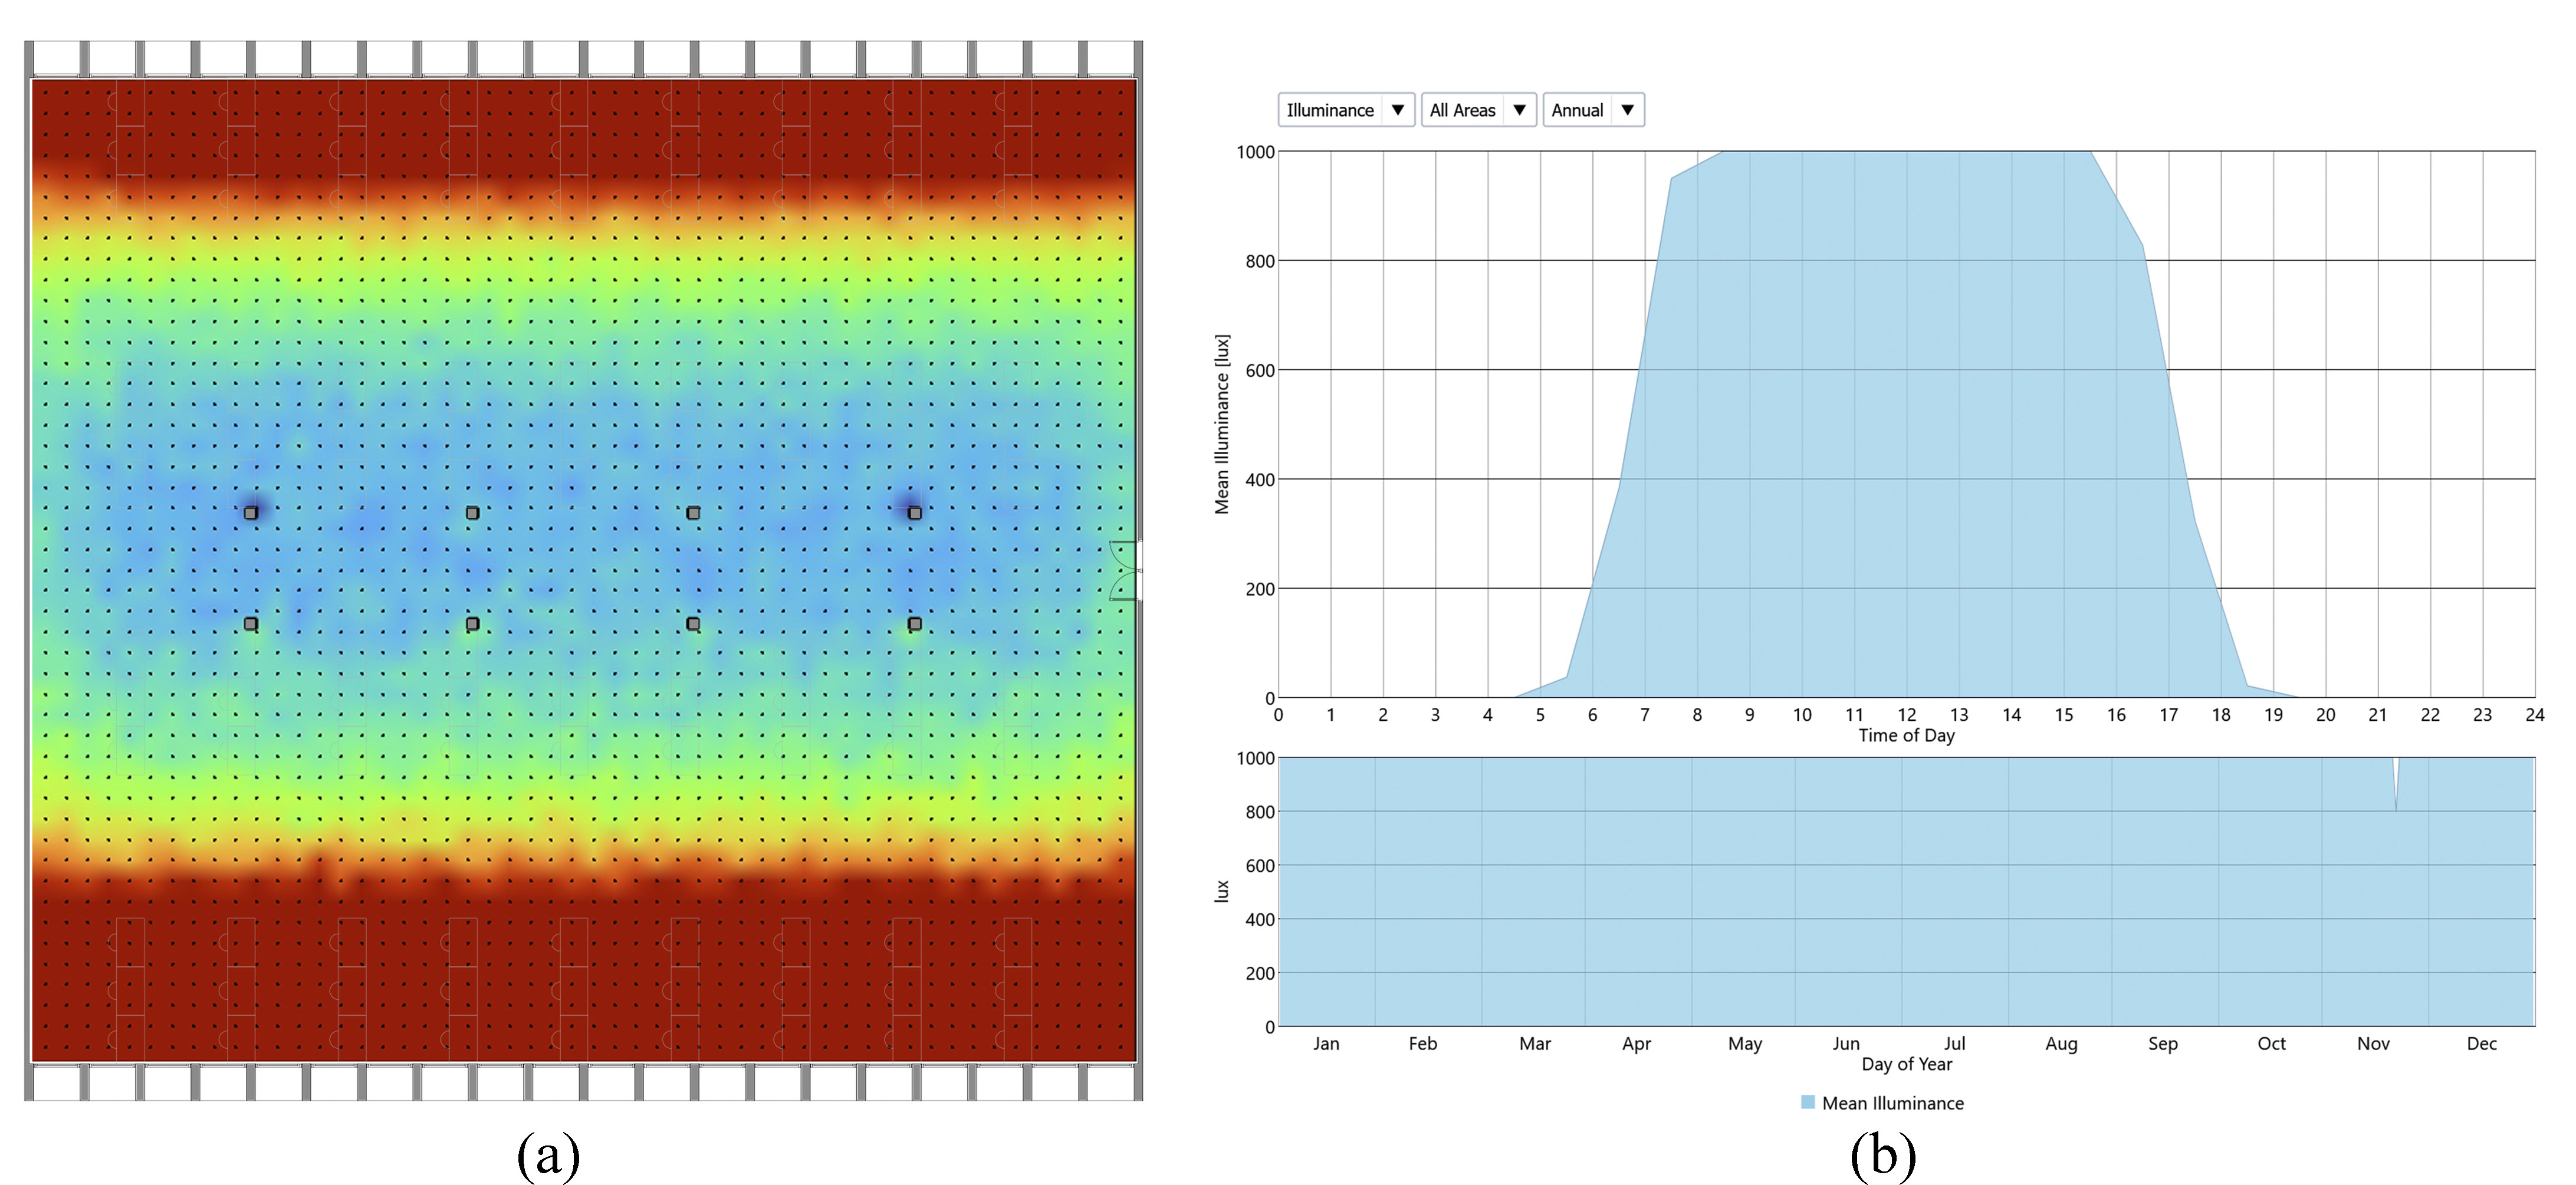
Fig. 17. (a) and (b) Illuminance distribution and chart.
The second metric is UDI which aims to determine the “useful” daylight level for occupants [34]. UDI discards the hourly value that is established on four illumination ranges; 0-100 lux Failing, 100-300 lux Supplemental, 300-3000 Acceptable, and greater than 3000 lux Excessive [29].
For the base case, UDI results show the percentage of the area receiving lux less than 100 lux (UDI Failing) is 3.77%, while the area receiving lux between 100 to 300 lux (UDI Supplemental) is 2.73%, area receiving lux between 300 and 3000 (UDI acceptable) is 78.78%, and the area receiving lux more than 3000 (UDI Excessive) is 14.71%. This indicates that the South and North facades need intervention to minimize the discomfort resulting from excessive UDI while the center area of the studio receives acceptable UDI. The UDI chart illustrates that UDI excessive is present during the day is from 6 am to 6 pm all throughout the whole year, UDI supplemental and acceptable is present during the day from 5 am to 6 pm, where it is at its maximum from March to October and slightly decreases at the beginning and the end of the year. Figure 18 illustrates the annual UDI distribution and chart within the studio area.
Figure 18
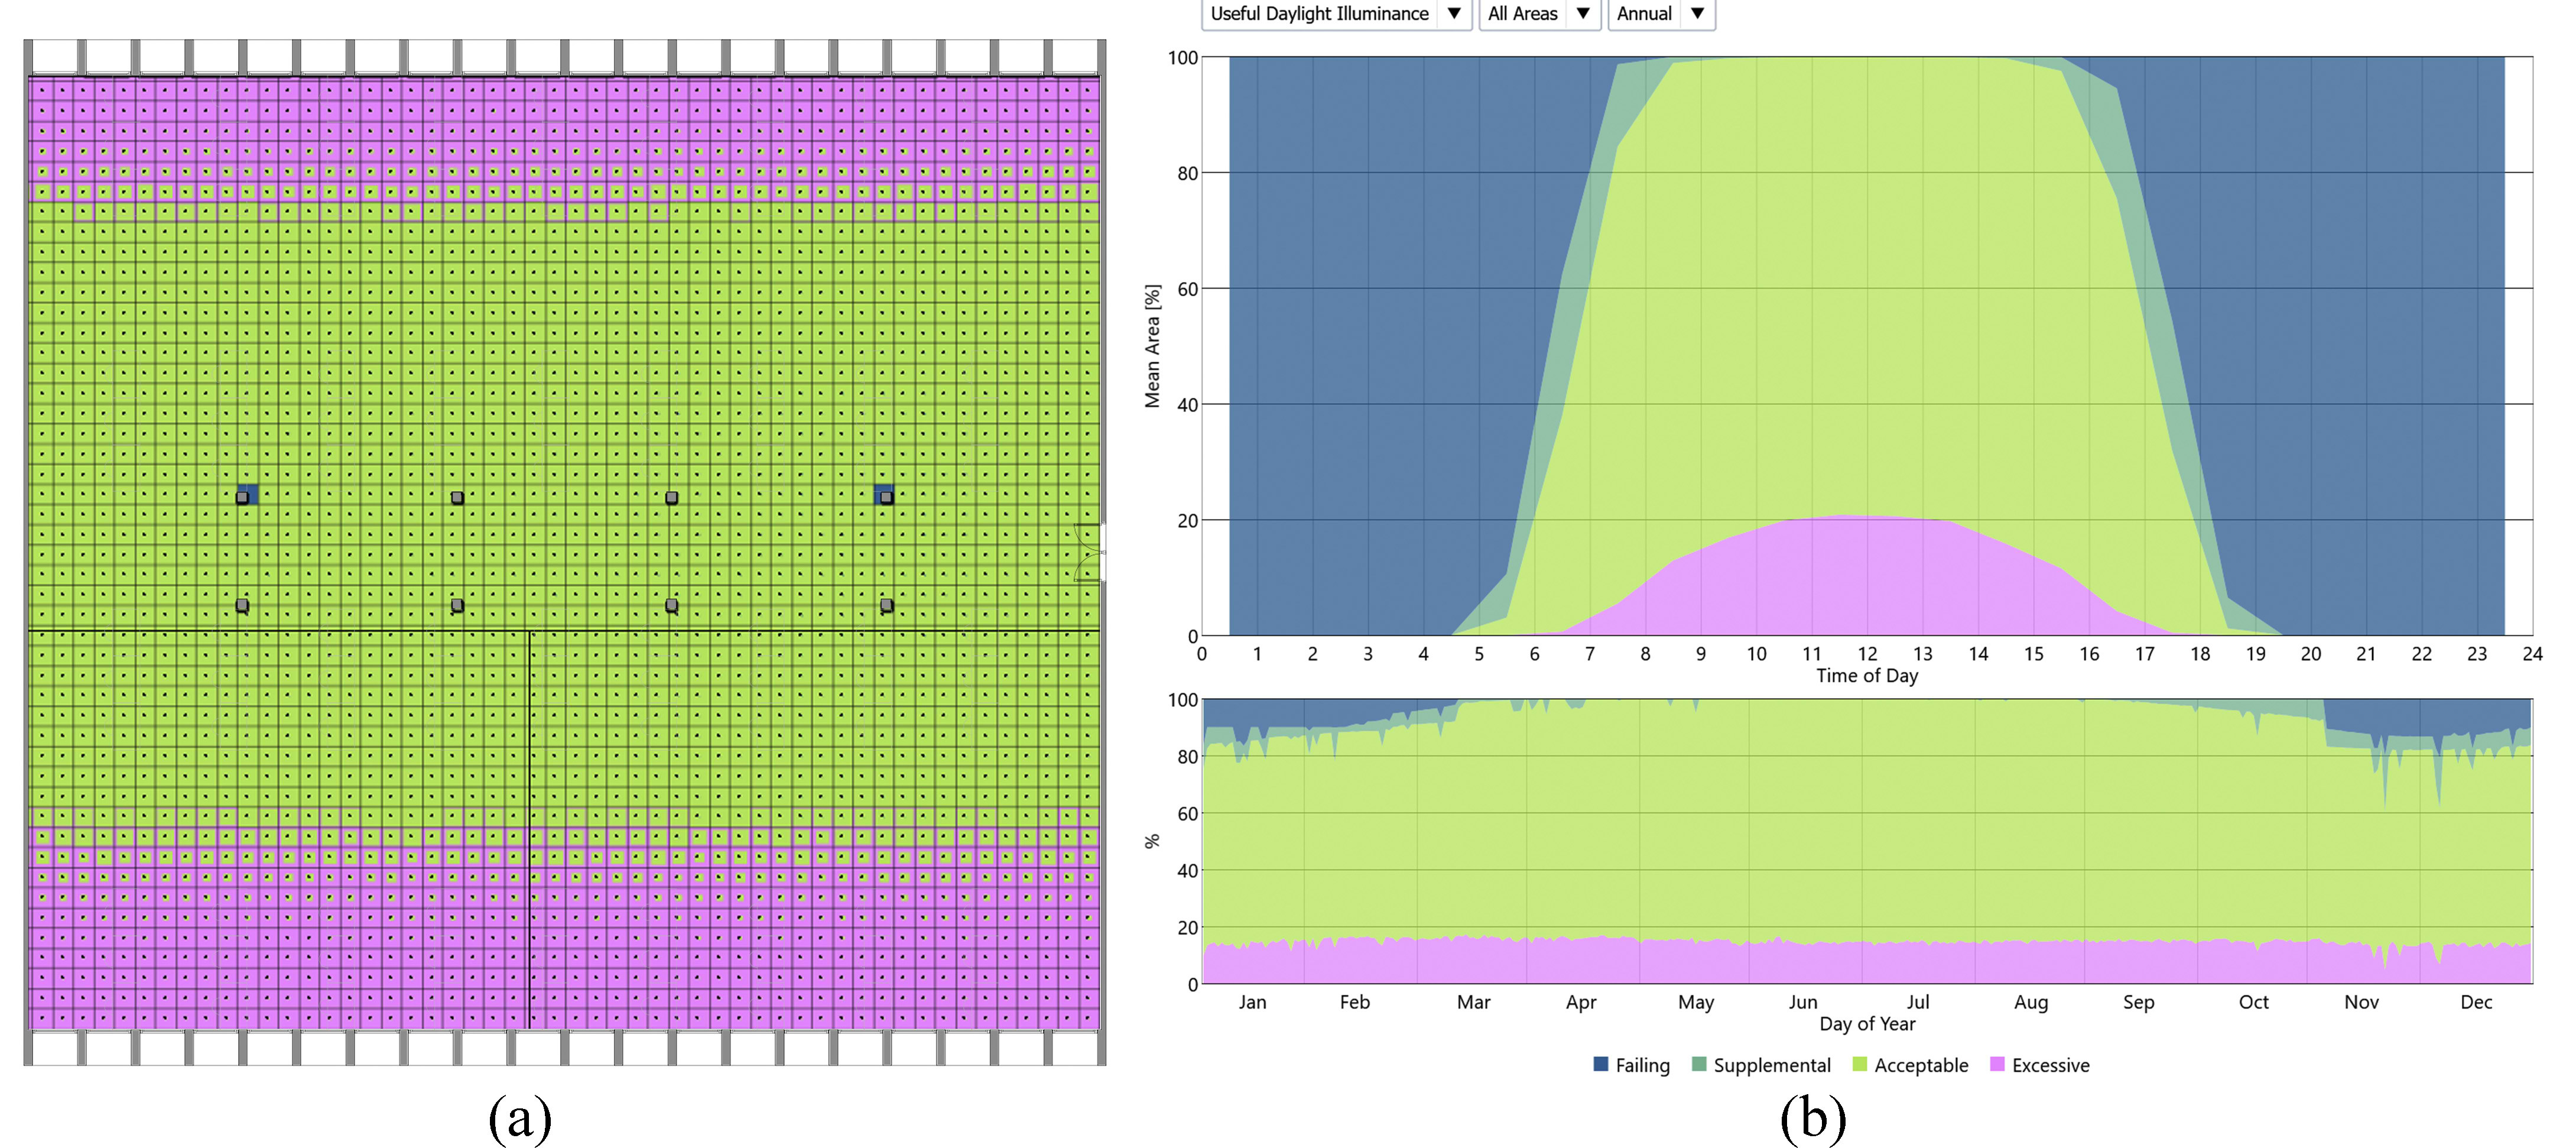
Fig. 18. (a) and (b) UDI distribution and chart.
The third metric is ASE which signifies the number of hours per year at a given point in a space where the direct sun is incident on the surface, possibly causing discomfort, glare, or increased cooling loads. It is defined as the percentage of square footage that has direct sunlight (at least 1000 lux) for more than 250 hours per year [35]. According to the Illuminating Engineering Society (IES) for daylight in spaces, it is desirable to be less than 10% ASE1000,250h per year [36].
The base case results for Annual Sun Exposure ASE show that the south façade receives lux greater than 1000 (over-lit) and resembles 7.1% of the total studio area. The ASE chart illustrates that it is present from 9 am to 3 pm at the beginning and end of the year. Figure 19 illustrates the distribution and chart of ASE within the studio area. Figure 19 illustrates the annual ASE distribution within the studio area.
Figure 19
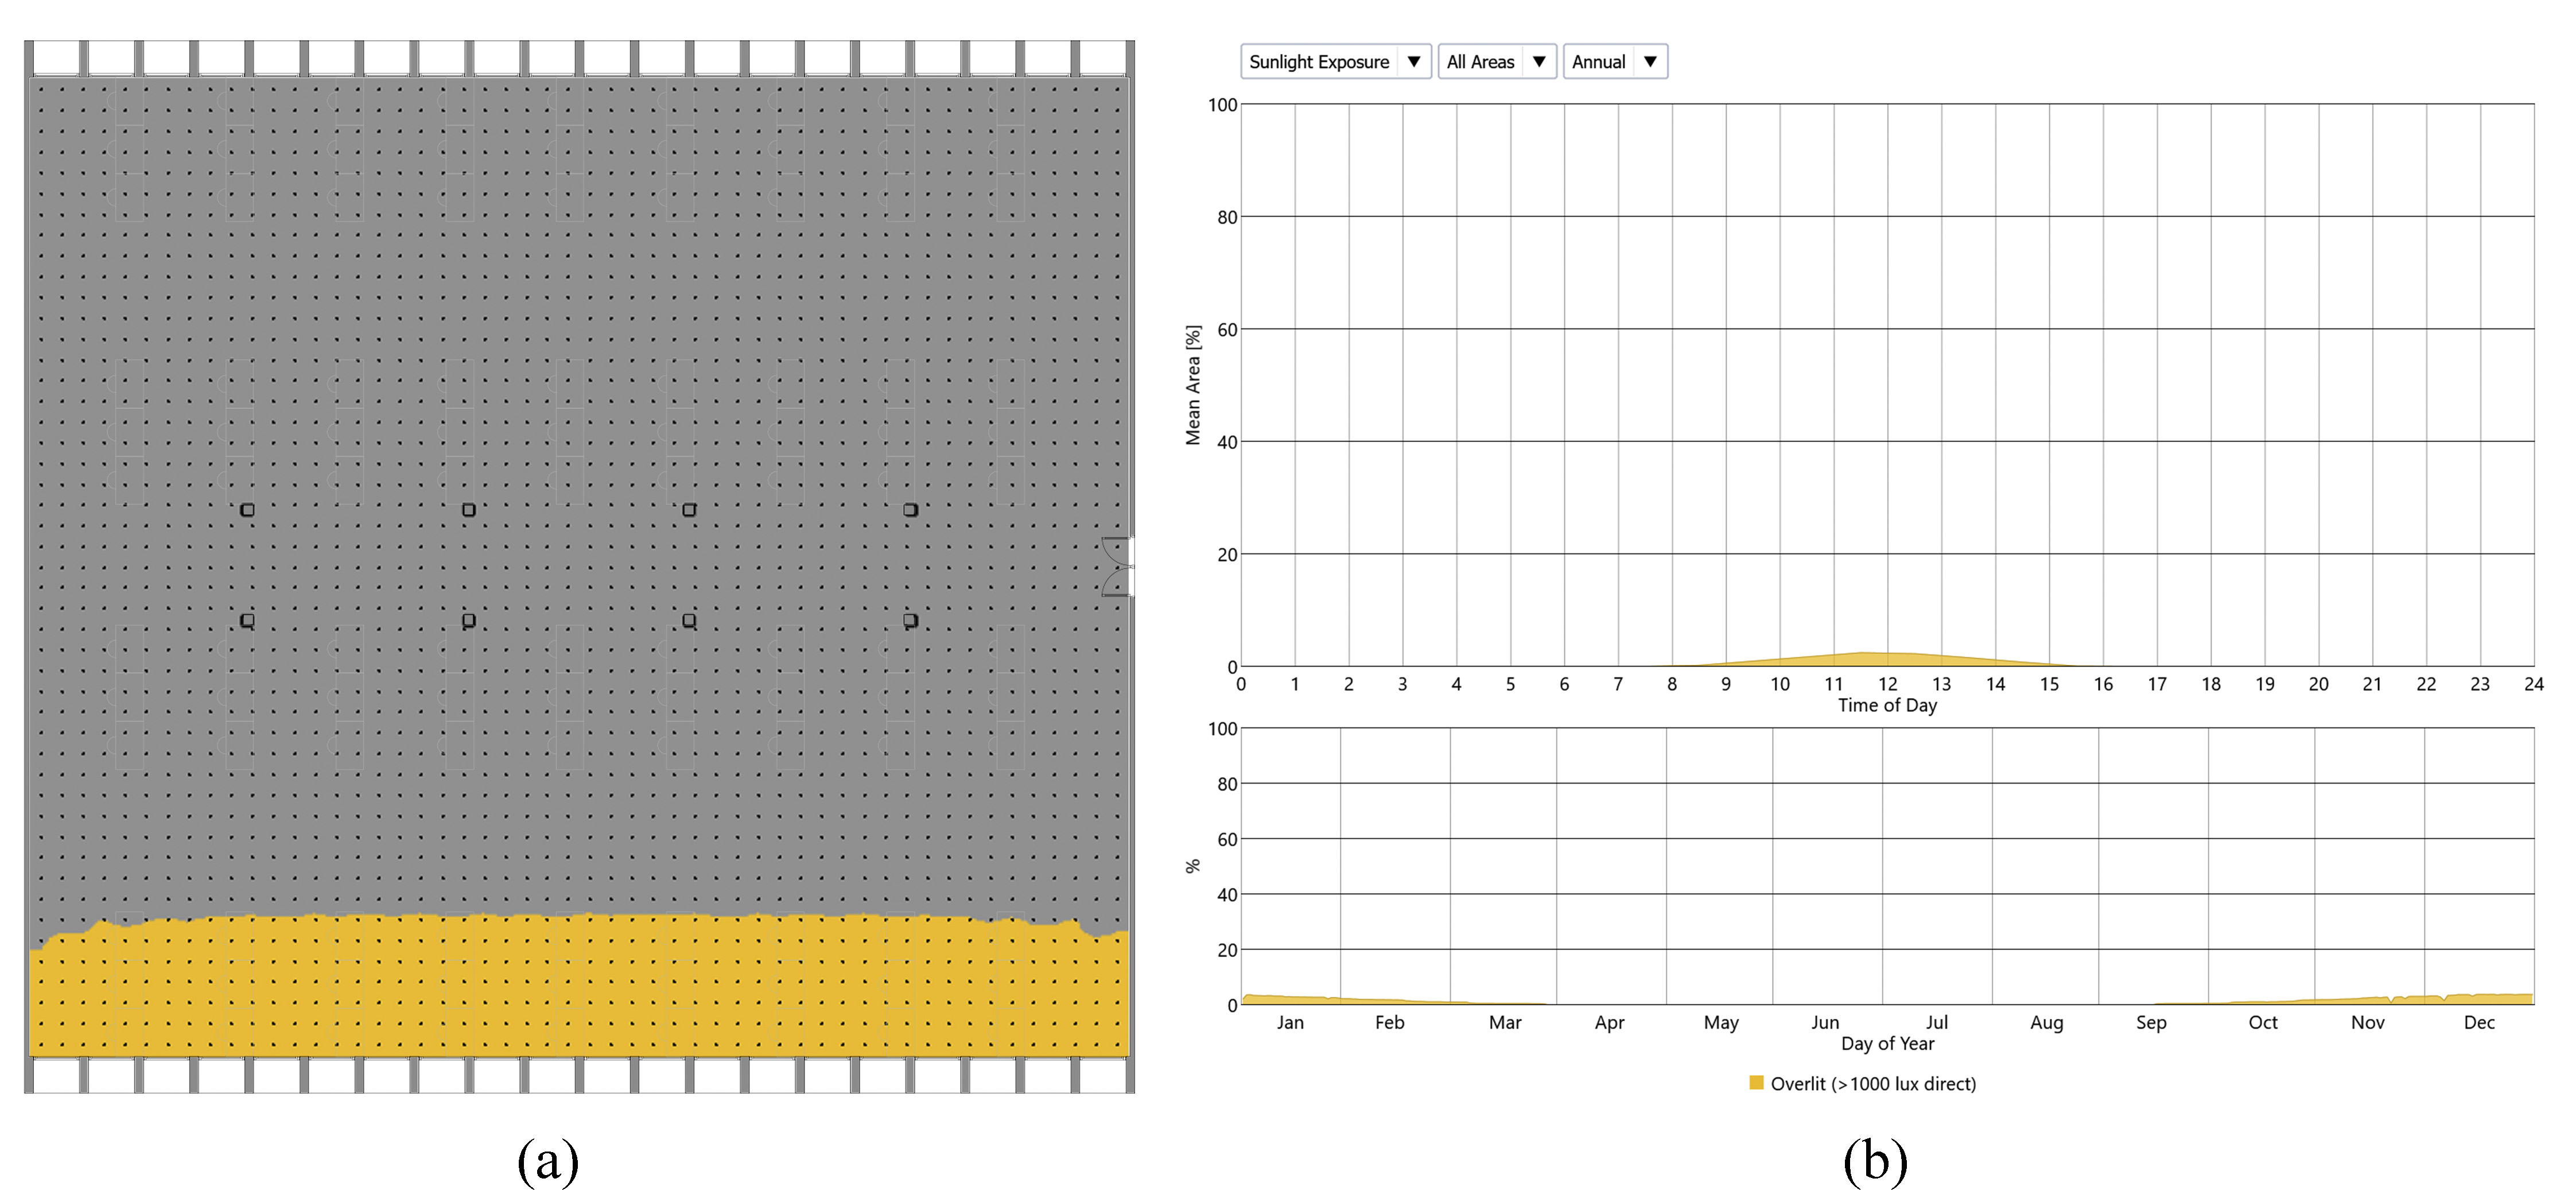
Fig. 19. (a) and (b) Annual sun exposure distribution and chart.
The fourth metric is sDA which is defined as the amount of sufficient daylighting received by a space. Precisely, it defines the percentage of floor area that receives the level illuminance for a standard percentage (e.g. 50%) of the annual working hours [37]. A more detailed definition is the percentage of an analysis area (work plane) that meets the minimum daylight illuminance level (300 lux) for a required fraction of the operating hours per year. It describes the annual sufficient daylight level in a space. The accepted value of sDA recommended by IES should be 55% or more while the preferred value should be greater than 75%.
The base case results for the sDA show that the total floor area of the studio is daylight autonomous (100% SDA) as it receives illuminance levels of 300 lux for a minimum of 50% of the occupied hours. The SDA chart illustrates that it is present during the day from 5 am to 7 pm, where it is at its maximum from May to October, and slightly decreases at the beginning and end of the year. Figure 20 illustrates the annual SDA distribution and chart within the studio area.
Figure 20
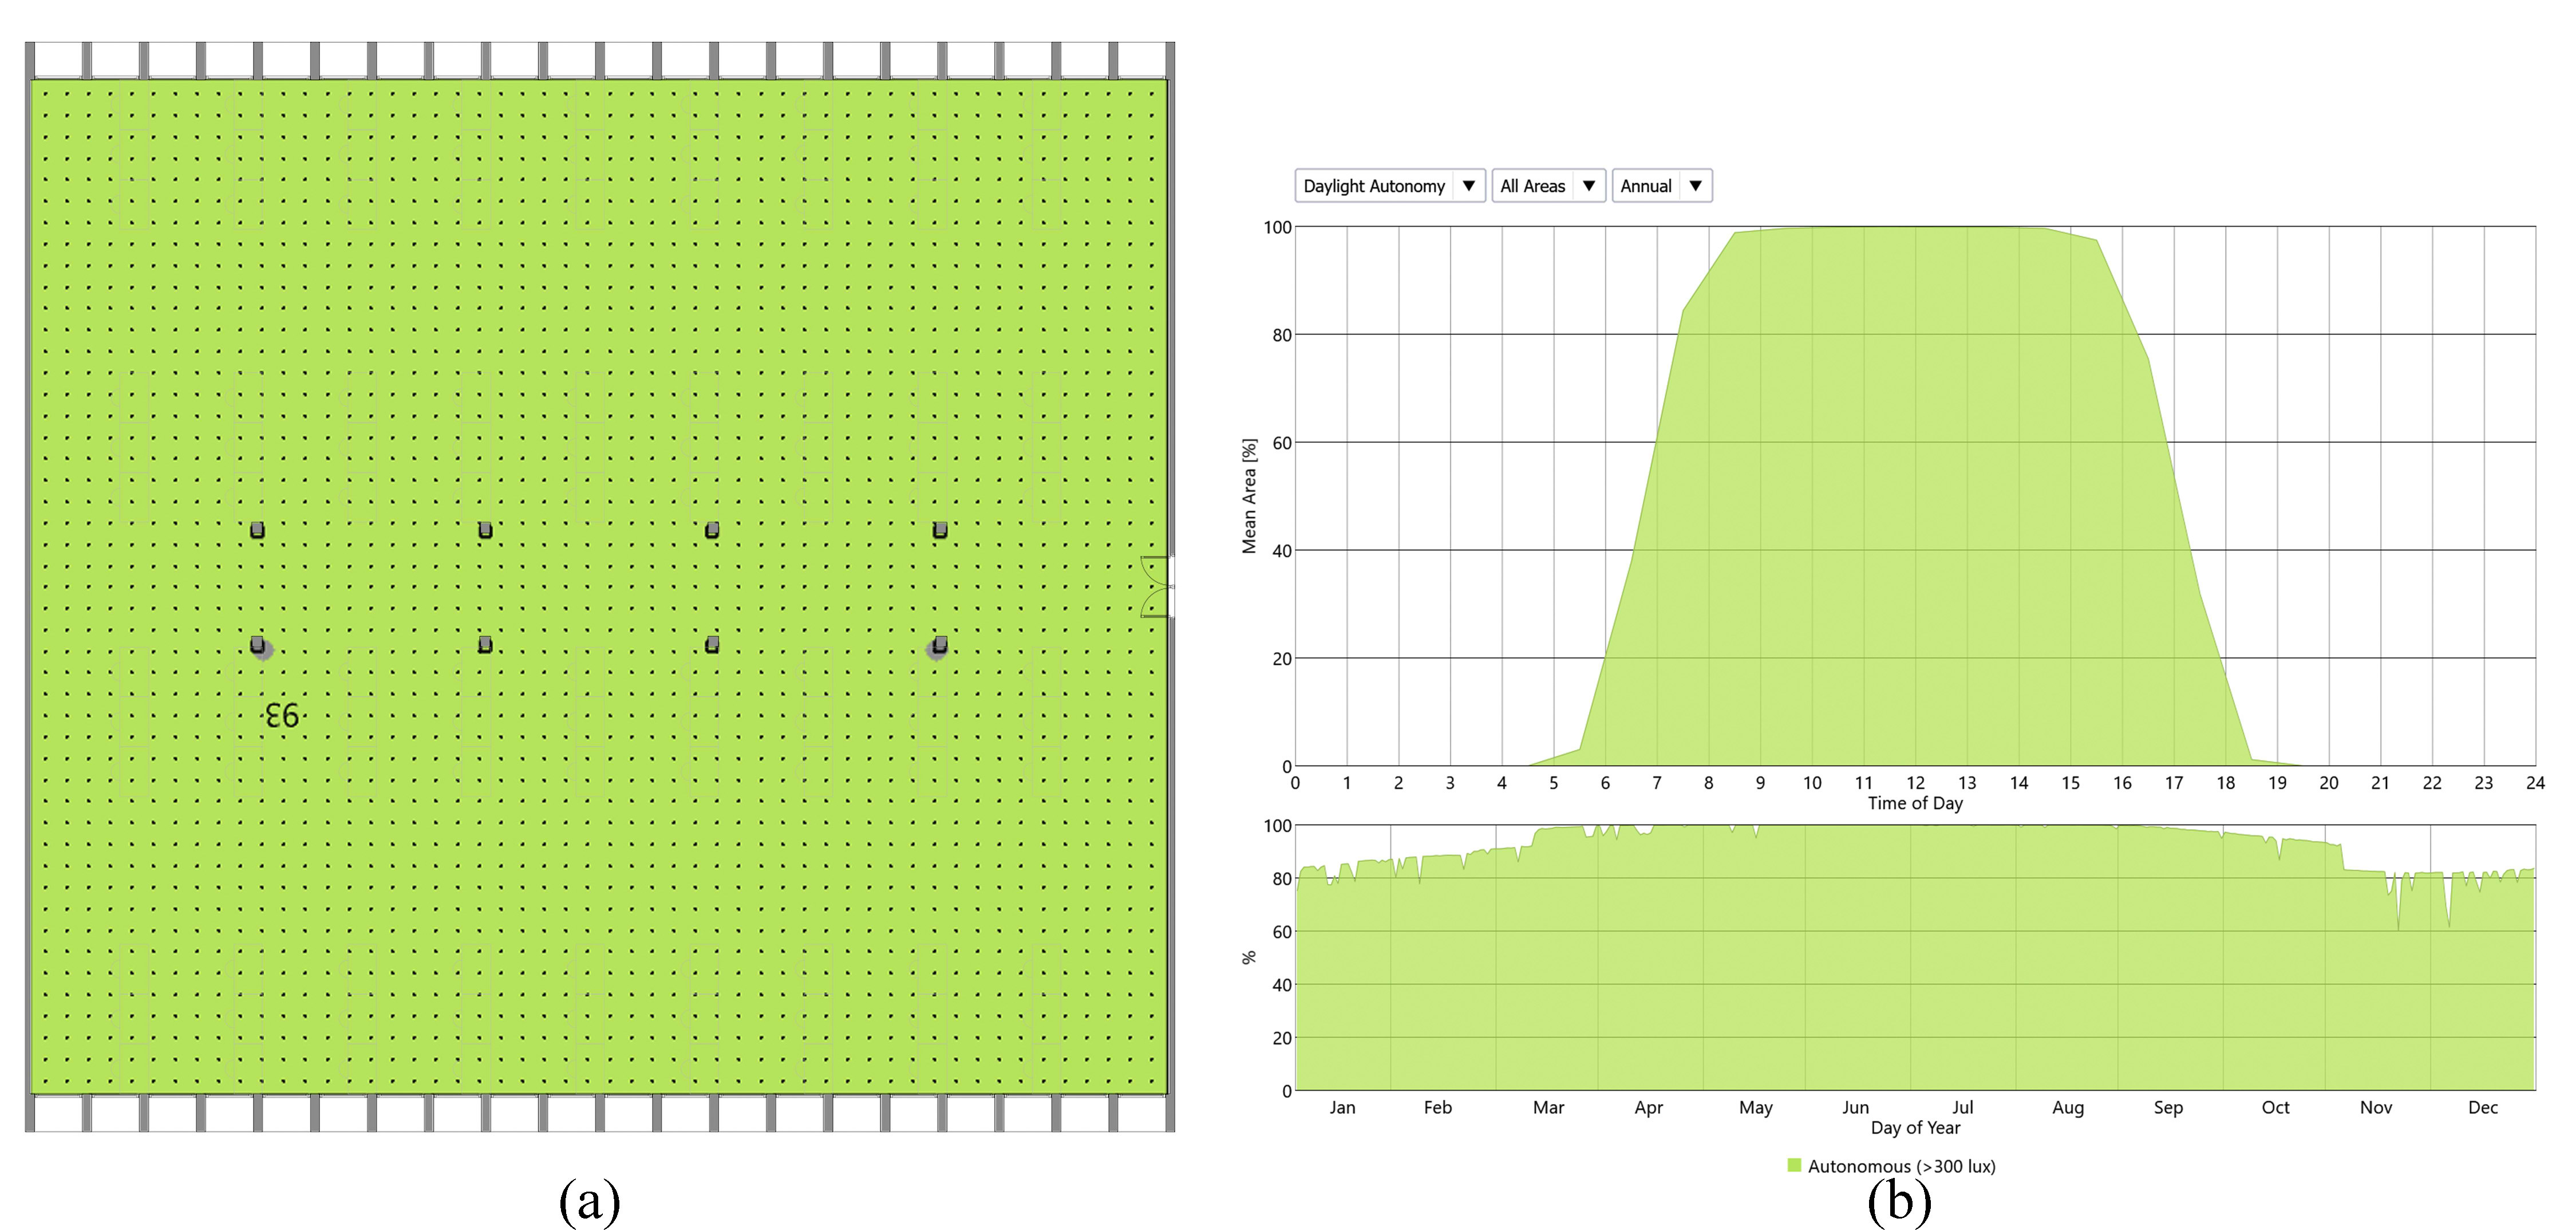
Fig. 20. (a) and (b) sDA distribution and chart.
The final metric is Daylight glare probability (DGP) which is used to assess the visual comfort and glare aspects as a result of daylighting [10]. It is the percentage of people disturbed taking into consideration the vertical illuminance at the eye level. It is defined as one of the most reliable and influential metrics to assess the appearance of discomfort glare level [38]. The method is divided into four main categories; DGP less than/equal to 0.35 is Imperceptible, values between 0.35 and 0.4 are Perceptible, values between 0.4 and 0.45 are Disturbing, and values above 0.45 are intolerable.
For the base case results for Daylight Glare probability show that the percentage of annual SDG for the likelihood that the user at a given view position and orientation will experience discomfort glare DGP is 24.1% which exceeds the threshold which is 5%. The SDG chart illustrates that it is present from 6 am to 6 pm during the whole year. Figure 21 illustrates the distribution and chart of the annual SDG.
Figure 21
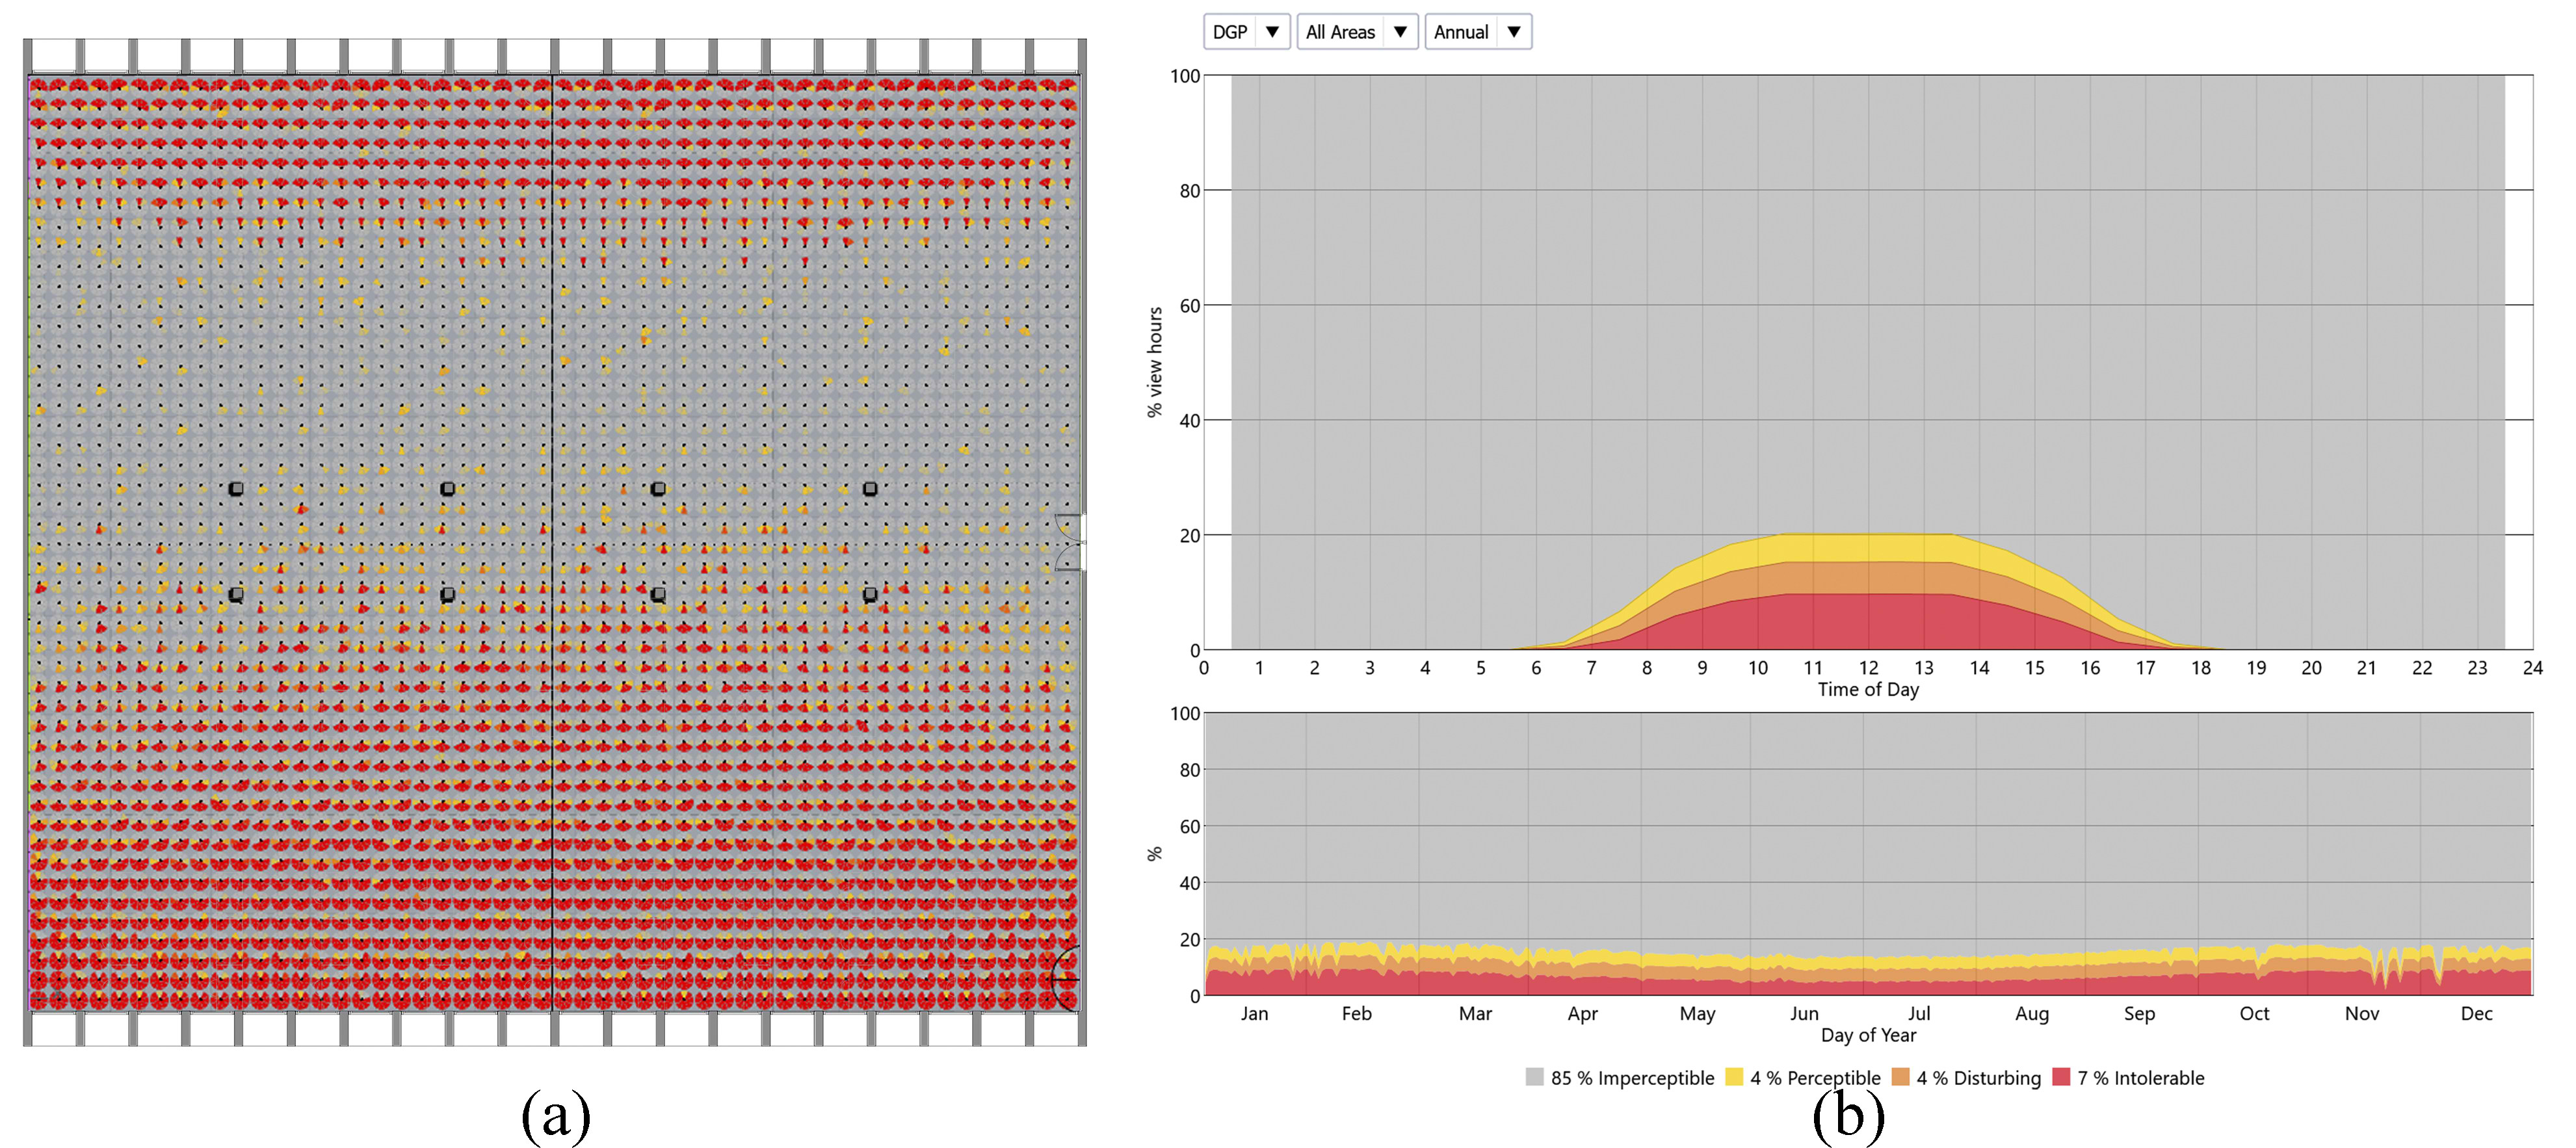
Fig. 21. Annual glare probability distribution and chart.
Based on the results demonstrated, it is clear that daylight performance, daylight quality, and visual comfort are compromised due to the excessive daylight penetrating the space. Henceforth, there is a need for intervention to solve the problems developed. As a solution, we suggest the use of parametric panels on the building façade.
4.2. Phase III; comparative analysis
The results for illuminance show that Triangles Parametric Patterns (3.1-3.2) display the best illuminance values with a mean illuminance of 346 lux. The area near the north and south facades reached illuminance values of 700 lux meeting the required illuminance for studio-based tutoring and decreased gradually to reach illuminance values of 300 lux. The pattern following the triangle one is the Square Parametric Pattern (2.1-2.2) where the mean illuminance is 324 lux. Similar to the triangle’s patterns; the area near the north and south facades reached illuminance values of 700 lux and decreased gradually to 300 lux. The least illuminance values achieved were by the Circles Parametric Pattern (1.1-1.2) where the mean illuminance was 241 lux.
The illuminance charts for the three patterns illustrate that illuminance is the same during the day and its levels are decreased to reach the threshold. It also shows that the Triangles Pattern provides the most effective illuminance during the day and throughout the year. Table 7 is shown for the summary of illuminance values, distribution, and illuminance chart for the three patterns.
Table 7
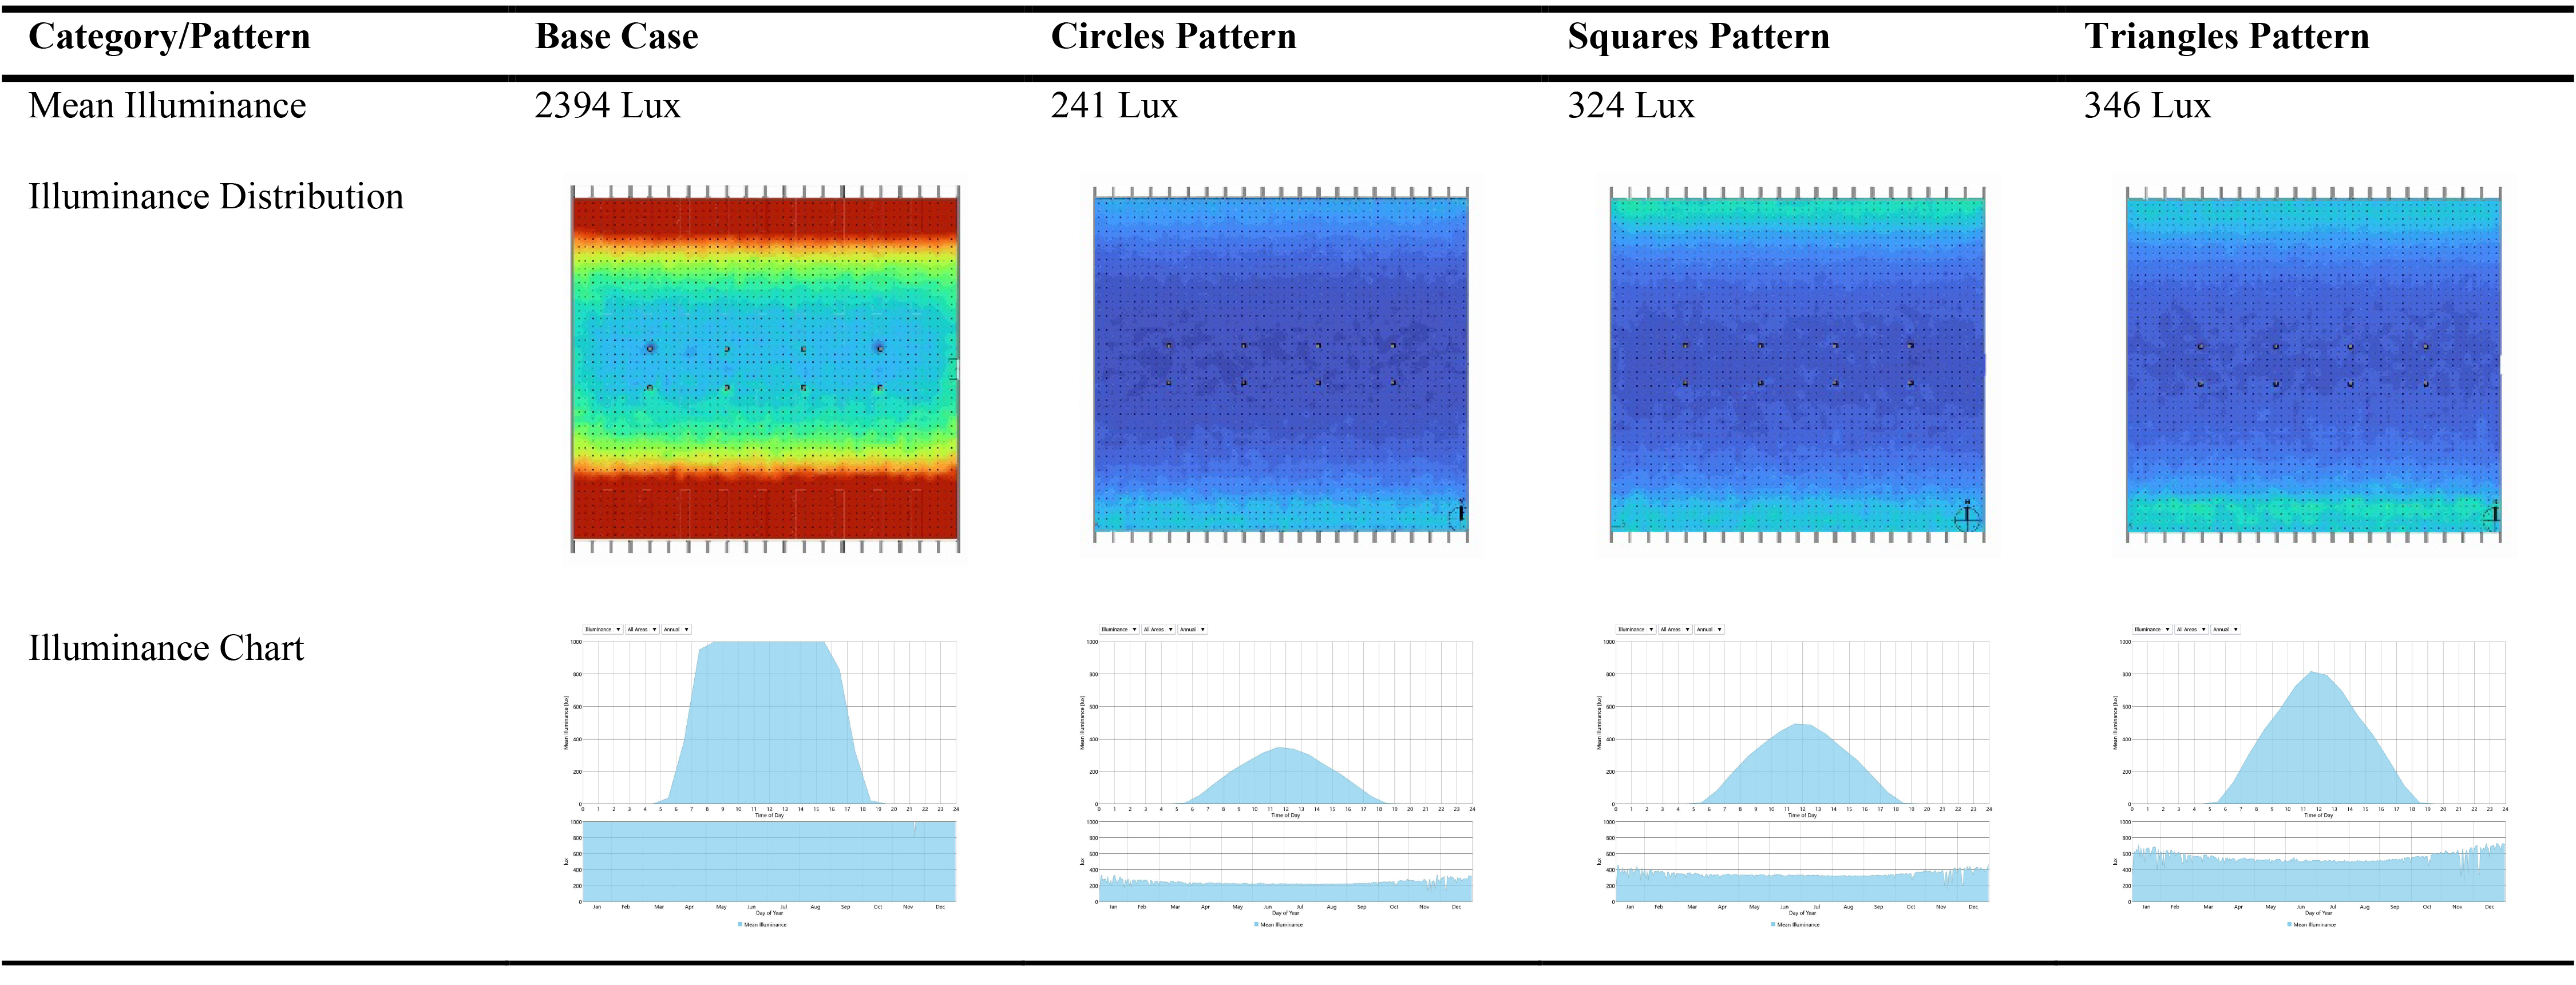
Table 7. Illuminance values, distribution and charts for the three patterns.
For the UDI results, the Triangles Parametric Pattern (3.1-3.2) displays the best values where the UDI-F (failing) values are 9.7% of the studio area, UDI-S (supplemental) is 51.1%, UDI-A (acceptable) is 39.1%, and the UDI-E (excessive) is 0.1%. This illustrates that most of the studio receives adequate illuminance values. Squares Parametric Pattern (2.1-2.2) comes after with UDI values of 12.5% UDI-F, 51.8% UDI-S, 35.6% UDI-A, and 0.1% UDI-E. While the least values are achieved by the Circles Parametric Pattern (1.1-1.2) where the UDI-F value is 27.1% of the studio area, UDI-S is 47.3%, UDI-A is 25.4%, and UDI-E is 0.2%.
The UDI charts for the three patterns illustrate that excessive UDI is eliminated while the Triangles pattern provides the most effective UDI values during the whole year compared to the other patterns. Table 8 shows the summary of UDI values, distribution, and illuminance chart for the three patterns.
Table 8
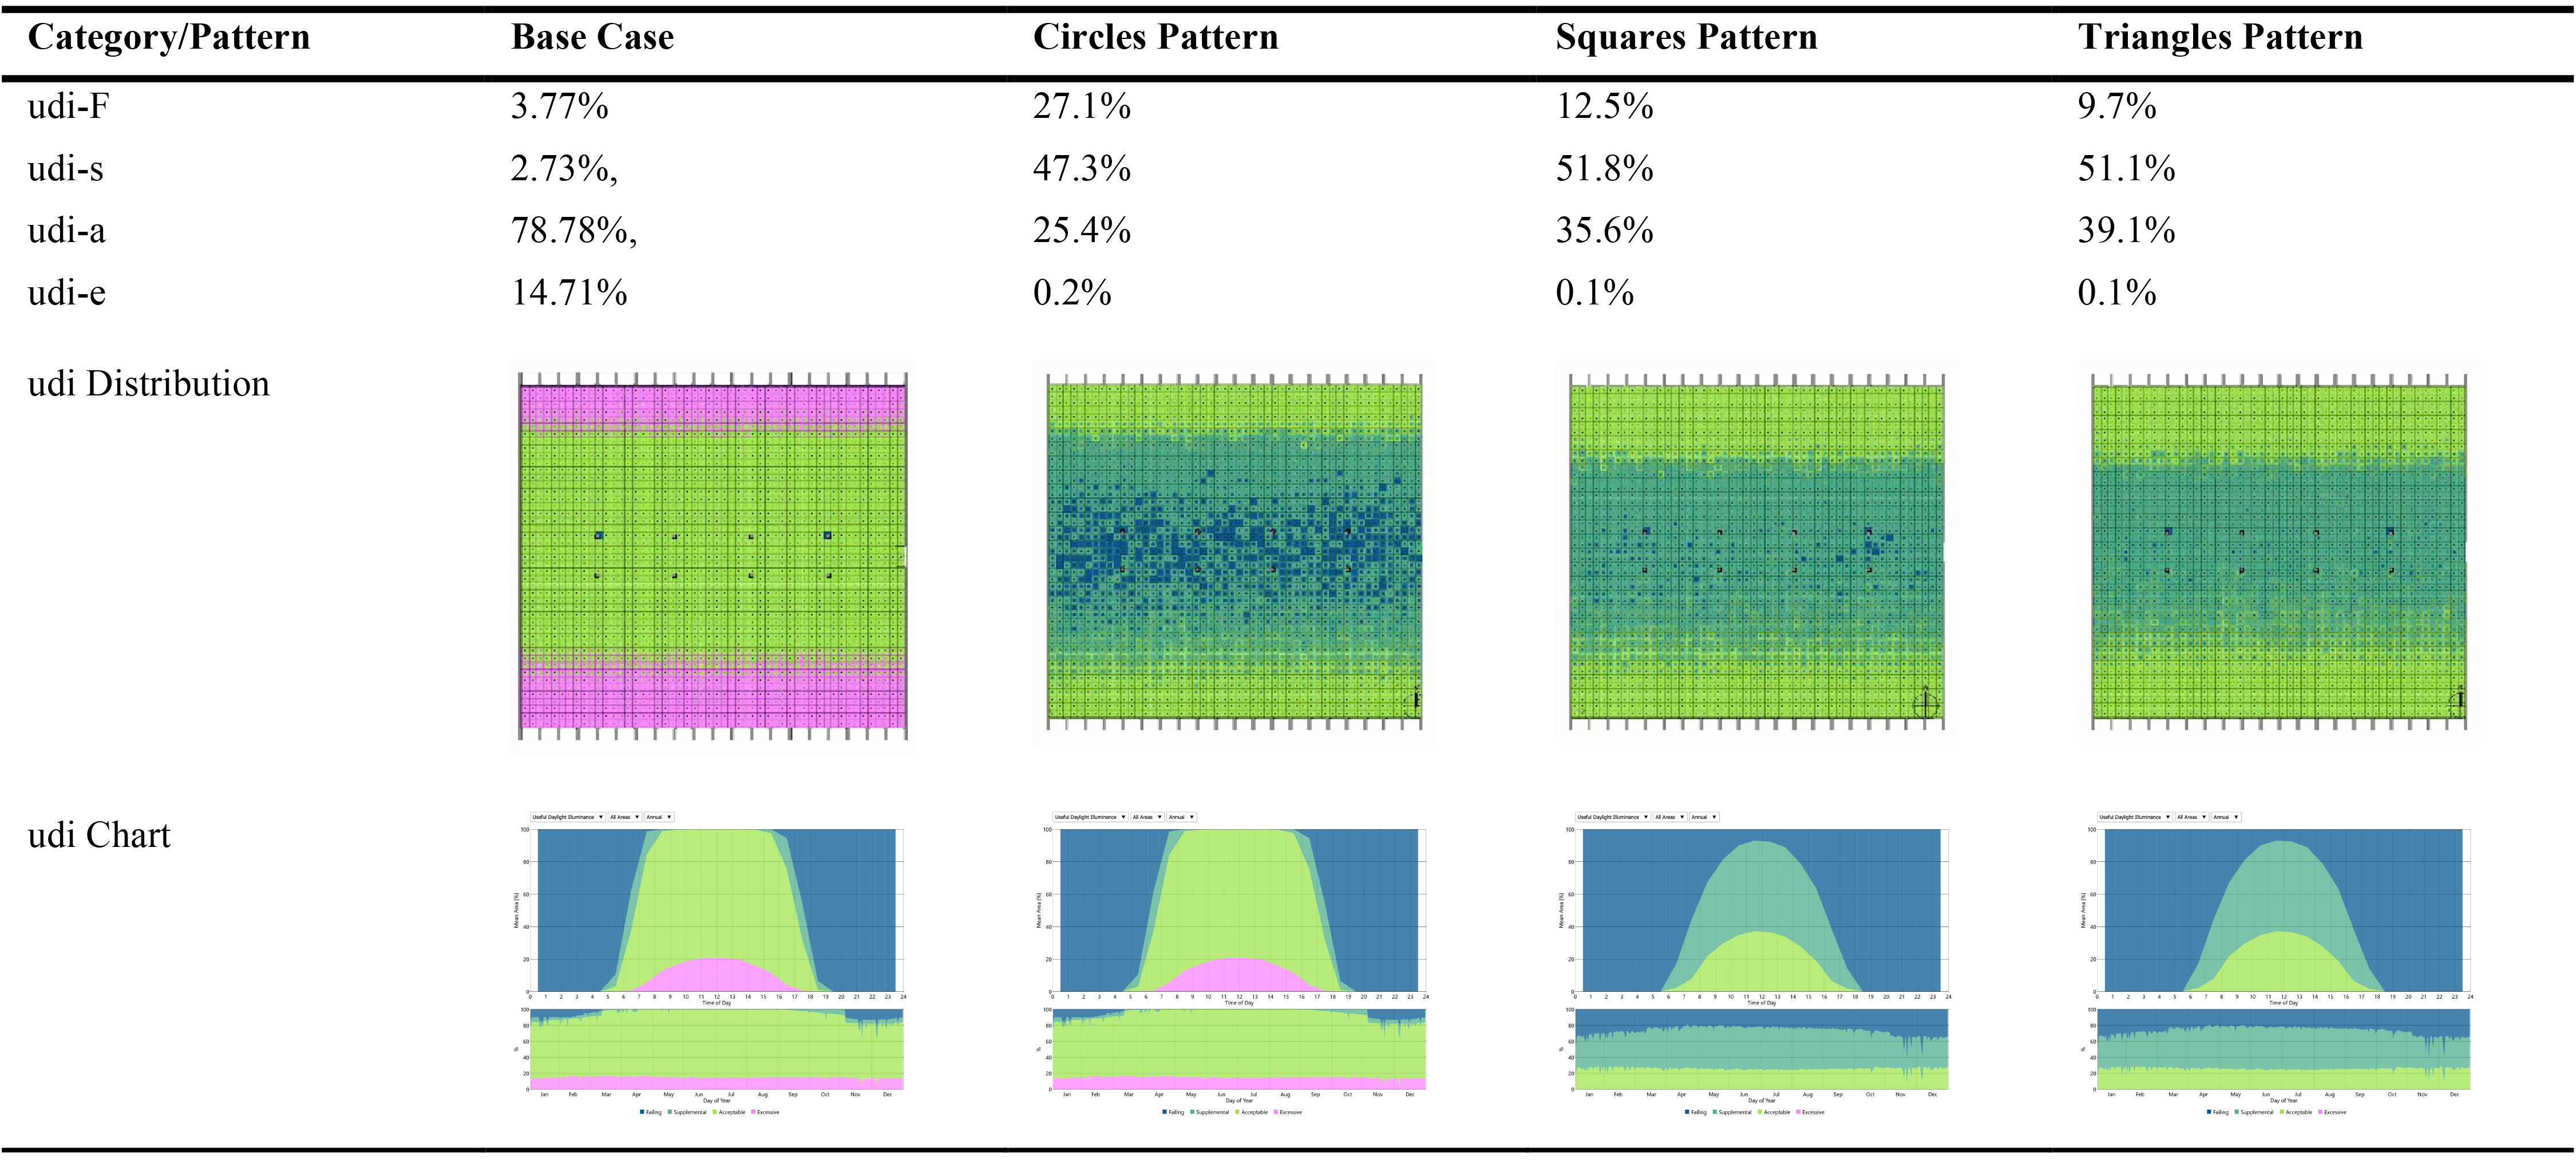
Table 8. UDI Values, distribution and charts for the three patterns.
The results for ASE (both distribution and charts) show that the three Parametric Patterns have the same value which is 0% which is within the acceptable values for daylight performance and visual comfort. Table 9 shows the summary of ASE values, distribution, and ASE chart for the three patterns.
The results for SDA show that the Triangles Parametric Pattern (3.1-3.2) displayed the best results at 39.4% followed by the Squares Parametric Pattern of value 35.9%, and finally the Circles Pattern of value 26.1%. However, the acceptable values for SDA should be 50% and above.
Table 9
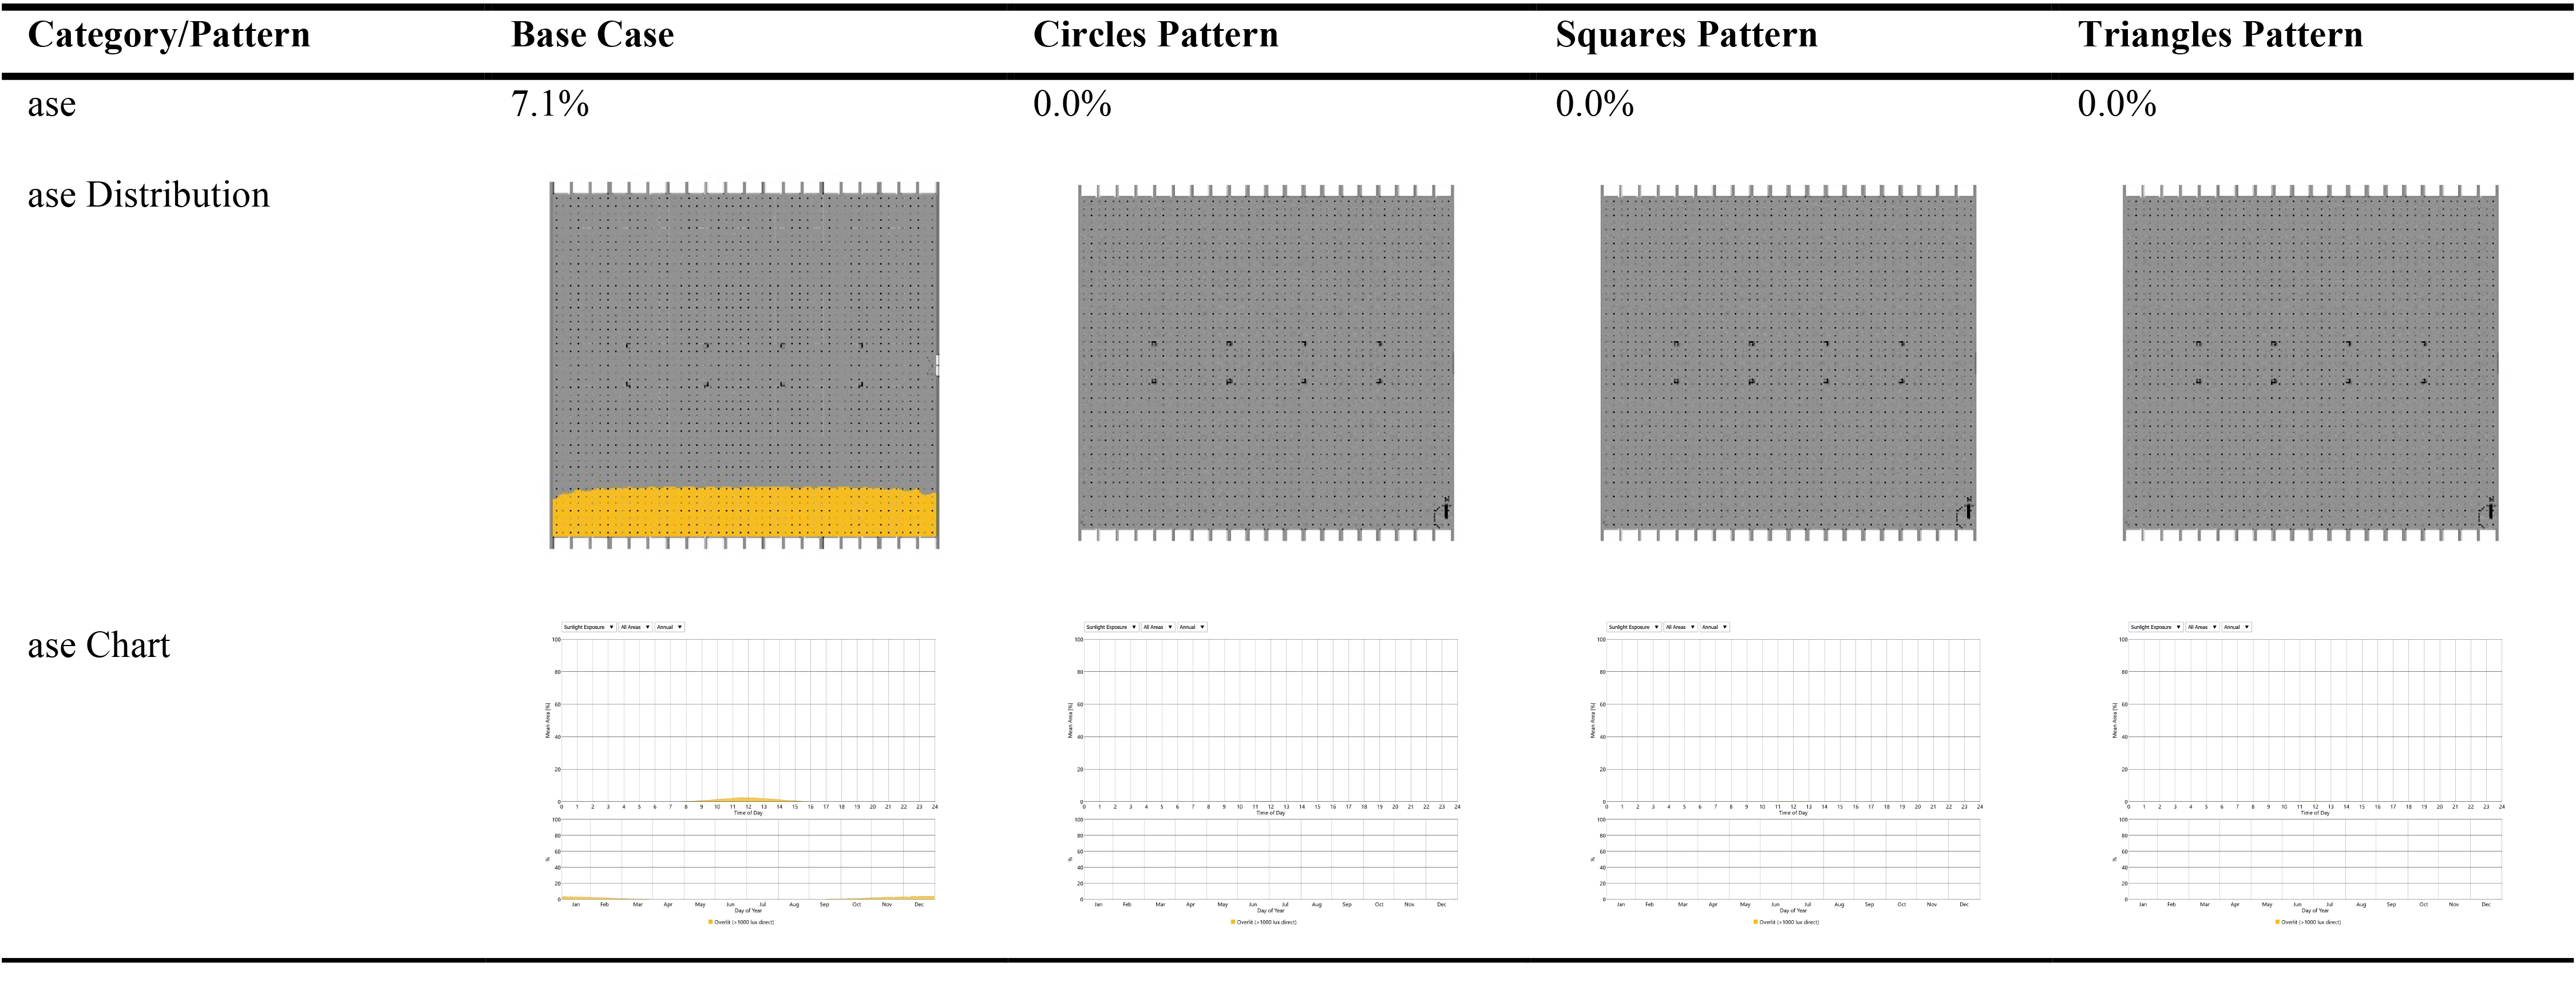
Table 9. ASE values, distribution and charts for the three patterns.
The SDA charts illustrate that the period where it is present hasn’t changed during the day for all patterns, while the Triangles pattern provide the highest values during the day and throughout the year. Table 10 presents the summary of SDA values, distribution, and SDA chart for the three patterns.
Table 10
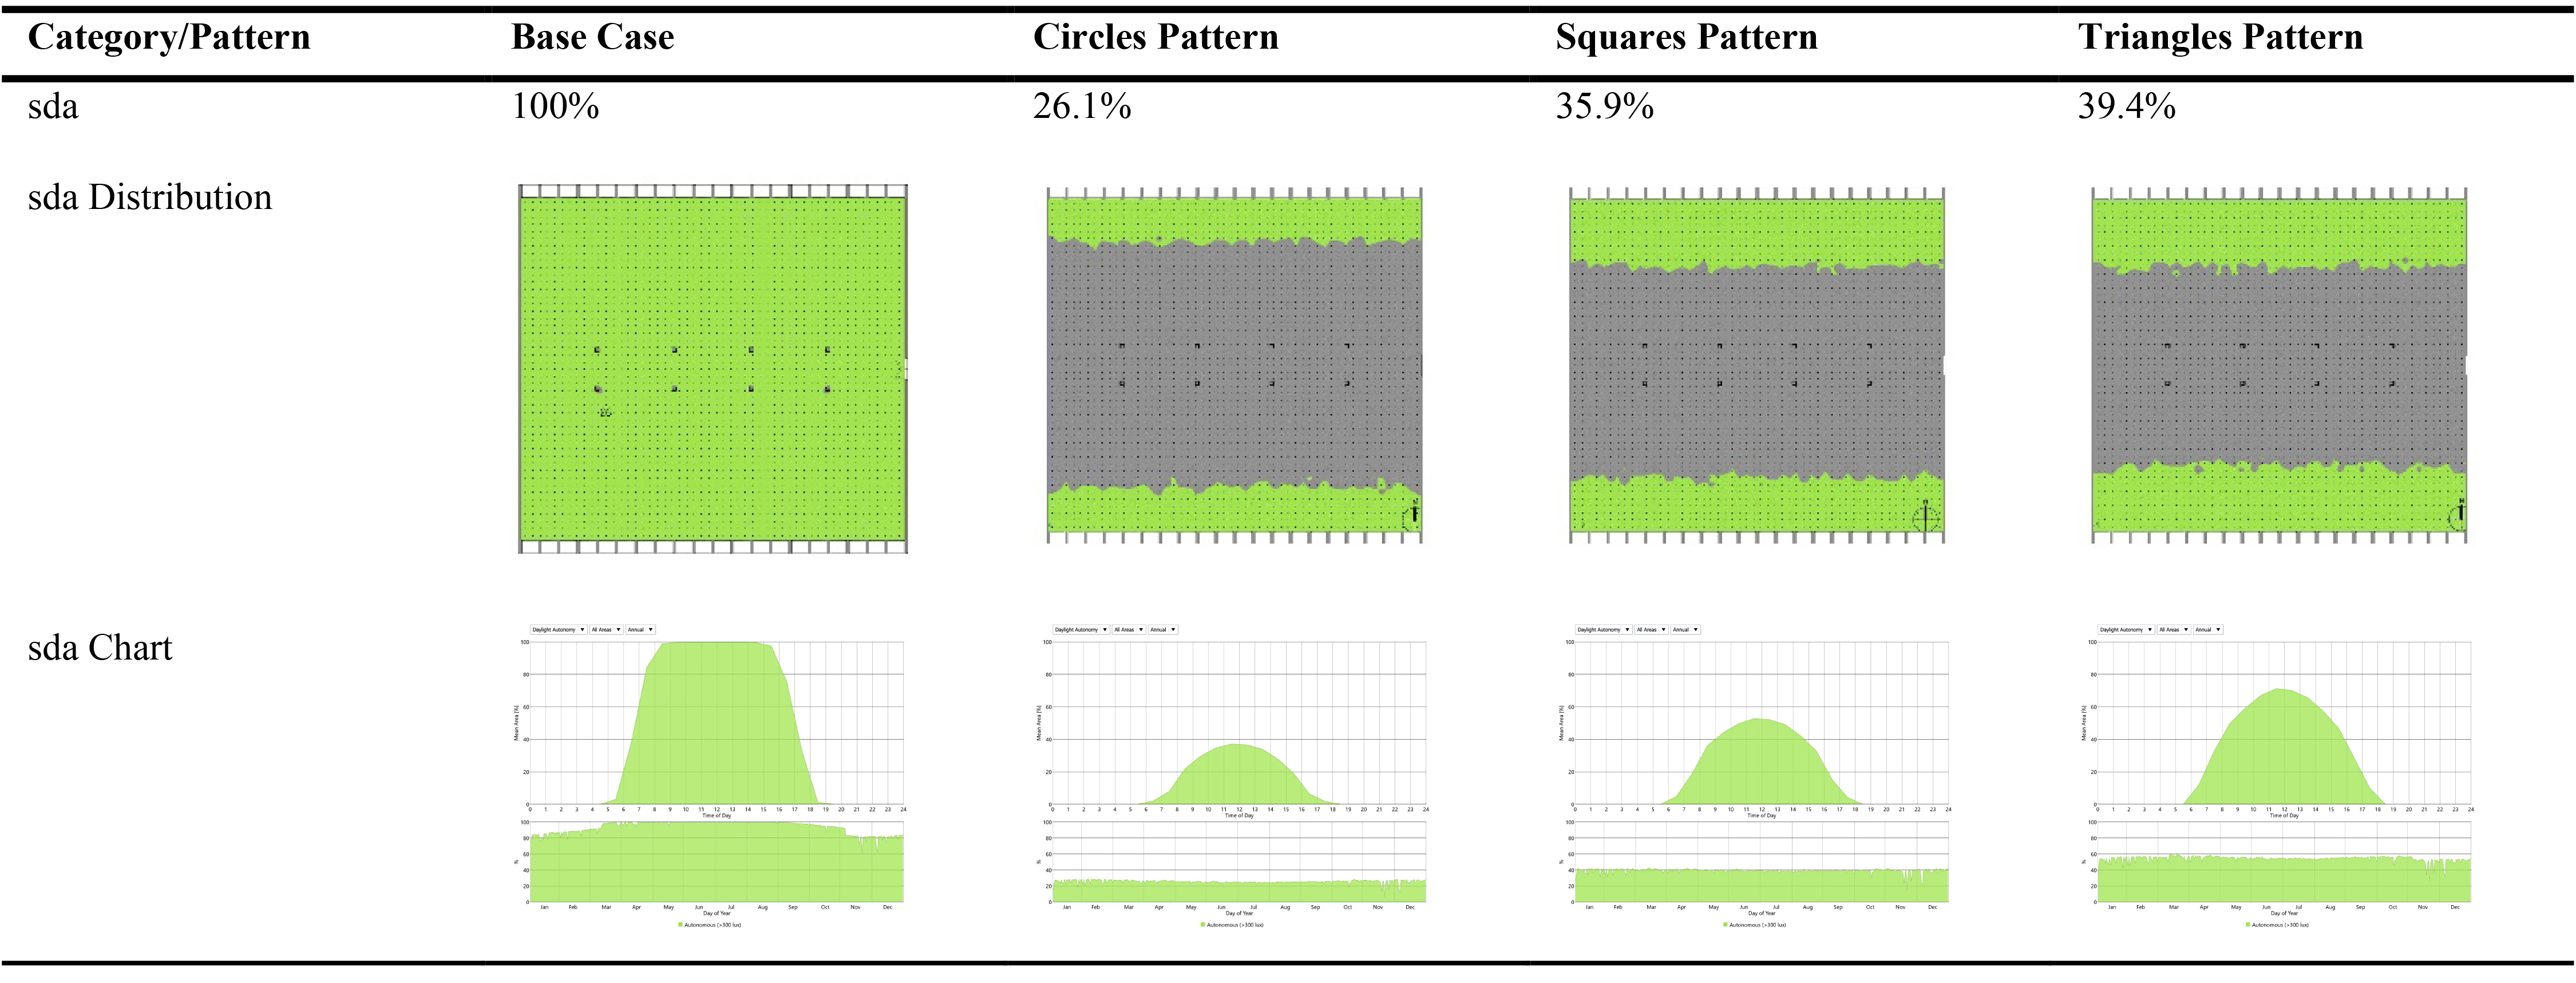
Table 10. SDA values, distribution and charts for the three patterns.
The results for DGP (both distribution and charts) show that both Circles and Squares Parametric Patterns have completely eliminated DGP, and the results for the Triangles Parametric Pattern is only 0.1% which is within the acceptable threshold. Table 11 presents the summary of DGP values, and distribution for the three patterns.
Table 11
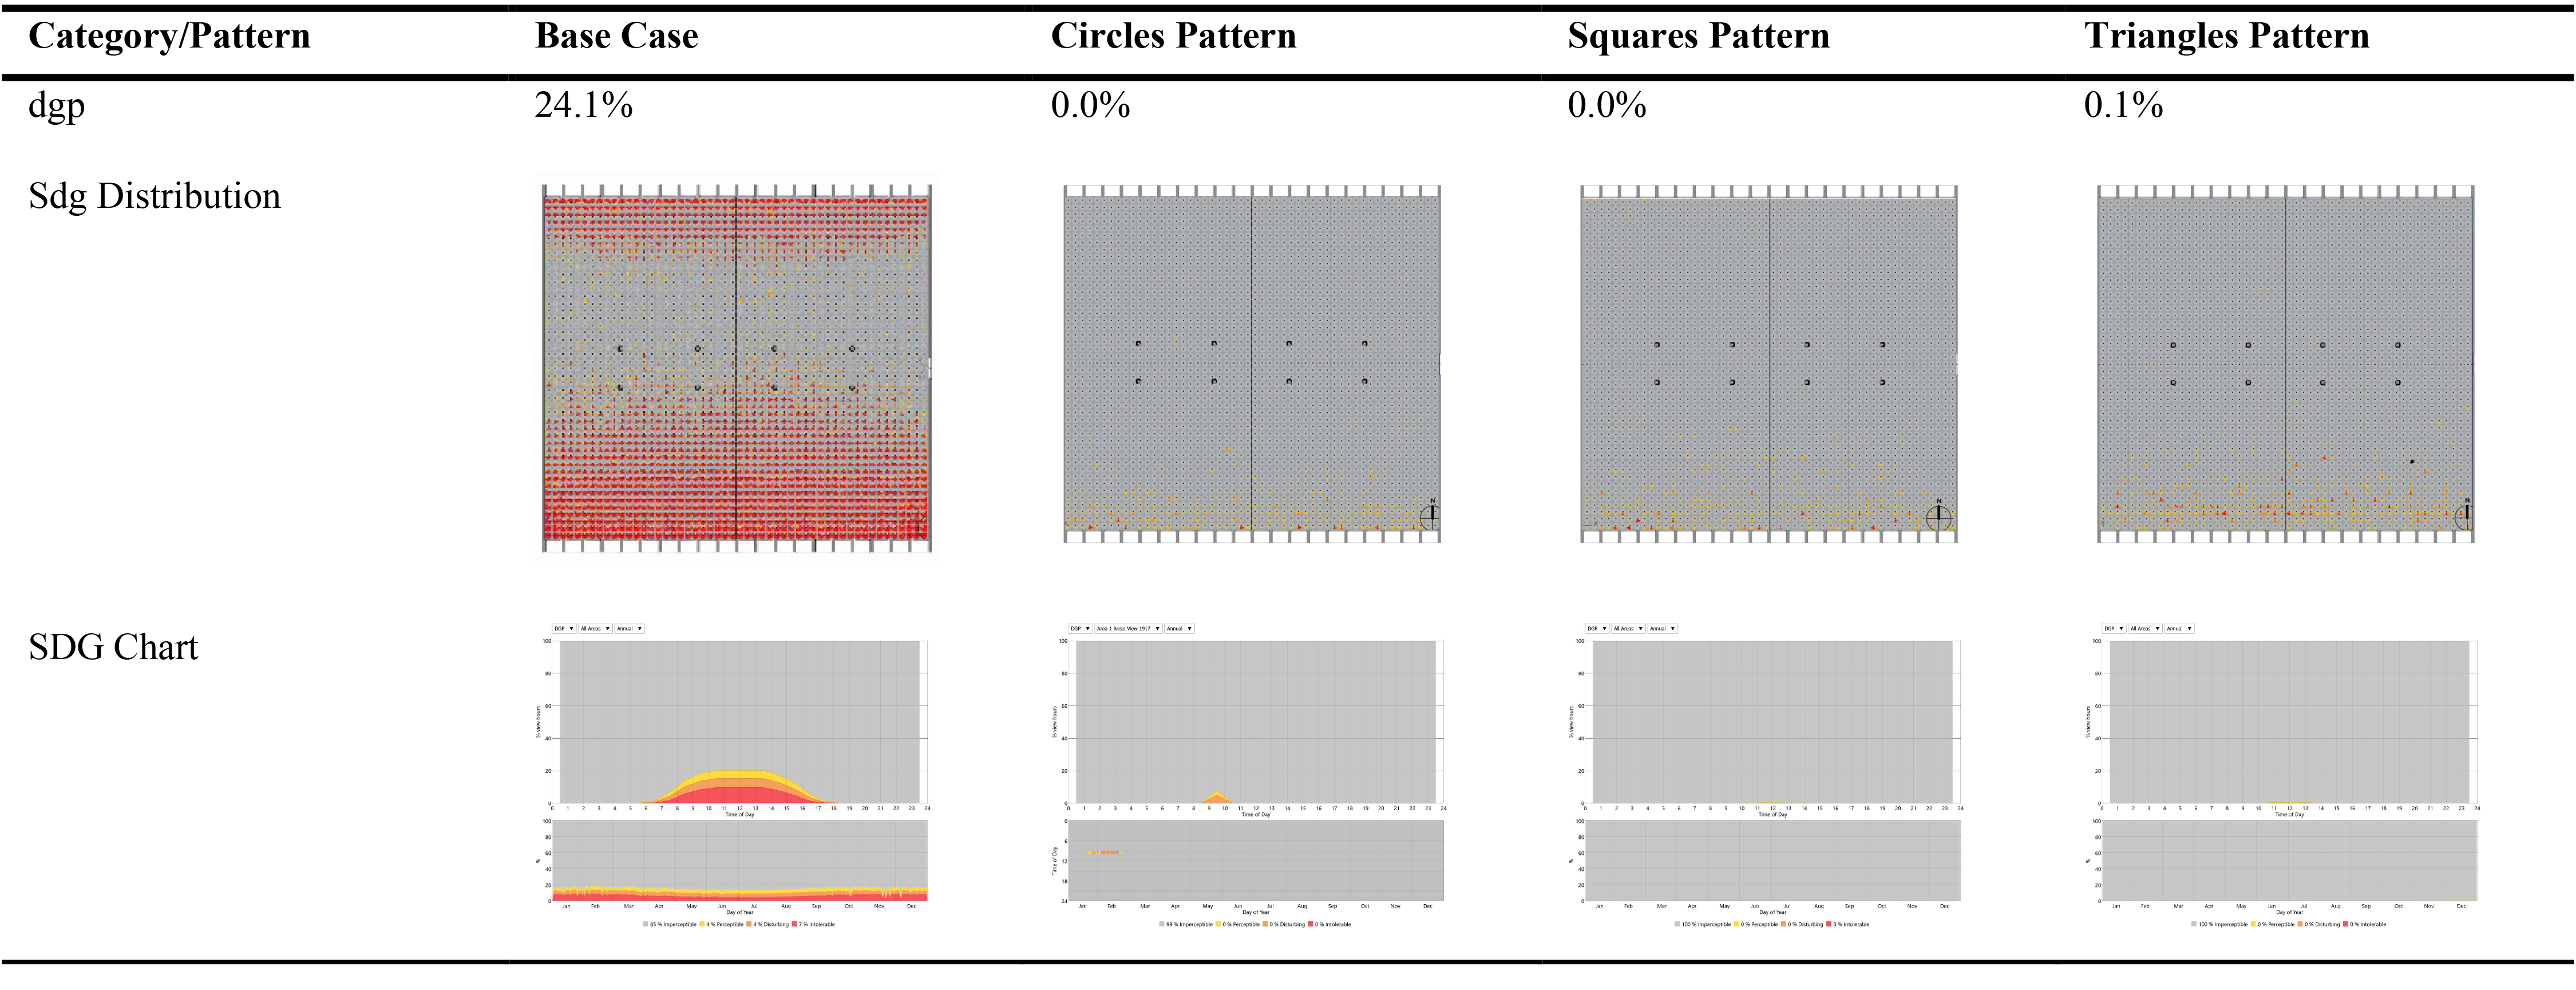
Table 11. DGP values and distribution.
5. Discussion
Daylighting has been studied across different disciplines and in different building typologies. However, the effect of daylight distribution through Parametric Patterned Facades and its effect on daylight quality, performance, and visual comfort in architecture studio-based tutoring has not yet been discussed.
Different daylight systems are developed to redirect daylighting to a given space leading to the enhancement of the indoor environment. Façade design has a significant role in the optimization of daylight performance as well as the enhancement of daylight quality and visual comfort. This study provides substantial evidence that Parametric Patterned Facades have an influence on Daylight Quality, Visual comfort, and Daylight Performance. It demonstrates the ability of Parametric patterns in the creation of designs that optimize daylight performance in buildings. More importantly, it introduces a new methodology that integrates computational and simulation tools that would aid architects in their quest to enhance daylight design. The methodology offered can be utilized in the early stages of the design process to avoid future complications.
However, the research has limitations that can be addressed in future investigations. First, the research is limited to the utilization of fixed facades. However, kinetic facades could be investigated using the same methodology. Second, to ensure the reliability of this research, future research will take in situ measurements and compare them to the simulation results. Third, this research focuses on the quantification of daylight quality and visual comfort, although there are psychological and physiological dimensions that potentially affect the proposed methodology, therefore, future field research will be conducted to assess the effect of Parametric Patterned Facades on students’ task performance, health, and wellbeing. Finally, different parametric patterns can be simulated and tested to evaluate their performance of daylight metrics in relation to the patterns presented in this research study.
6. Conclusion
This research analyzed and assessed the impact of different integrated parametric patterns with architecture studio-based tutoring envelope on daylight quality, visual comfort, and daylight performance within the space through the use of environmental performance simulation programs (Climate Studio) in the analysis of daylight metrics. The parametric patterns compared were: Circles Pattern, Squares Pattern, and Triangles Pattern (Figure 16 showing Parametric Patterned Facades).
Based on the metrics, the research concluded that the Triangles Parametric Pattern (3.1-3.2) shows the best performance values for daylight quality, visual comfort, and daylight performance in architecture studio-based tutoring compared to the rest of the Parametric Patterns. It was followed by the Squares Parametric Pattern (2.1-2.2), then the Circles Parametric Pattern (1.1-1.2). The simulated results for the working area and the adjoining space confirmed that the Triangle parametric pattern was the highest pattern in the value of the daylight illuminance, UDI, and SDA while eliminating ASE and DGP.
The simulation results for all metrics showed that daylight quality, performance, and visual comfort were drastically enhanced in the months with the worst conditions (Spring, and Summer seasons) which was highlighted throughout the annual metrics charts. Nevertheless, the performance results were not compromised during Fall and Winter seasons.
Therefore, it can be concluded that the criteria for the choice of Parametric Pattern is the gradual distribution of the perforation (Gradient Pattern), the percentage of perforation area to the façade area, and the perforation size. First, the recommended distribution of perforations is to be relatively large at the upper area to allow the penetration of daylight deep into the studio area and gradually decrease to minimize high illuminance levels at the area near the facades. The second recommendation is for the perforation percentage to be between 38 and 40% for both North and South Facades. The third recommended is the perforation size where for the North Façade the perforation size should start at 73 sq. cm and gradually decrease to 42 sq. cm. While for the South Façade, the perforation size should start at 23 sq. cm and gradually decrease to 6 sq. cm. It should be noted that the perforation percentage and perforation size could increase or decrease by a value not greater than 10%.
It must be highlighted that this research study intends to determine criteria for the design of a parametric patterned façade that fulfills daylight quality, visual comfort, and daylight performance metrics compared to the base case model. Also, the study intends to determine the performance of different parametric patterned facades compared to the base case model to discover the efficiency of the best pattern.
Acknowledgment
I would like to acknowledge the role of the Department of Architecture, Faculty of Engineering, Cairo University in providing the necessary information for the simulation to take place, and for providing room for future field study.
Contributions
Y. M. S. Abdelhamid: Conceptualization, Methodology, and Writing of Original Draft. S. M. Wahba: Conceptualization, Methodology, Review and Editing. M. Elusseiny: Conceptualization, Methodology, Review and Editing.
Declaration of competing interest
The authors declare no conflict of interest.
References
- A. A. Razon, A Study on Window Configuration to Enhance Daylight Performances on Working Space of an Architect's Office in Chittagong, International Journal of Scientific & Engineering Research, 8 (2) (2017) 1-9. https://doi.org/10.14299/ijser.2017.02.007
- A. A. Buhari and H. Z. Alibaba, Analysis of Daylighting Quality in Institutional Libraries, International Journal of Electrical and Electronics Research, 7 (4) (2019) 6-20.
- D. Mehta, A Review on Challenges of Daylight-Based-Classroom-Studies and their Methodology Regarding Architectural-Design-Process, International Journal of Innovative Research in Science, Engineering and Technology (IJIRSET) (2020) 10112-10123.
- K. Chamilothori, J. Wienold, and M. Andersen, Daylight Patterns as a Means to Influence the Spatial Ambience: A Preliminary Study, in: 3rd International Congress on Ambiances, 2016, 117-122.
- M. Anas, B. Othman, N. A. Ahmad, and A. Ajis, Daylight Strategies for Architectural Studio Facilities: The Literature Review, 7th International Conference on Environment and Industrial Innovation IOP Conf. Series: Earth and Environmental Science, 64, 2017, 1-7. https://doi.org/10.1088/1755-1315/67/1/012025
- R. M. Elbatran and W. S. E. Ismaeel, Applying a parametric design approach for optimizing daylighting and visual comfort in office buildings, Ain Shams Engineering Journal, 12 (3) (2021) 3275-3284. https://doi.org/10.1016/j.asej.2021.02.014
- A. Rashwan, L. El, and S. Sheta, Evaluation of the effect of integrating building envelopes with parametric patterns on daylighting performance in office spaces in hot-dry climate, Alexandria Engineering Journal 58 (2) (2019) 551-557. https://doi.org/10.1016/j.aej.2019.05.007
- K. Johnsen and R. Watkins, Daylight in Buildings, Energy Conservation in Buildings & Community Systems & Solar Heating and Cooling Programmes, 2010, 1-50.
- Z. Keskin, Investigating the Effect of Daylight on Seating Preferences in an Open-Plan Space: A Comparison of Methods, Final Thesis of Doctor of Philosophy in the University of Sheffield, 2019.
- A. Ali and I. Nessim, Enhancing the Performance of Daylighting in Top-lit Drawing Halls Using Diva-For-Rhino as One of the Simulation Programs: A Case Study of Drawing Halls in Cairo , Egypt as a Hot Arid Climate, Journal of Engineering Sciences Assiut University, 45 (3) (2017), 380-394. https://doi.org/10.21608/jesaun.2017.116276
- C. Marty, C. Marty, M. Fontoynont, and J. Christoffersen, User Assessment of Visual Comfort: Review of Existing Methods, ECCO-Build, 031121, (2015), 1-90.
- J. A. Veitch and G. R. Newsham, Preferred Luminous Conditions in Open-Plan Offices: Research and Practice, Lighting Research & Technology, 32, (2000), 199-212. https://doi.org/10.1177/096032710003200404
- P. M. Jayasuriya, The importance of the quality of light in public architecture and its effect on experiencing the built form, Final Thesis Bachelor of Interior Architecture UNSW Built Environment, Australia 2016.
- S. Kubba, Indoor Environmental Quality, in Sustainability Energy and Architecture, 2013, 1-26.
- Y. M. S. Abdelhamid, The Phenomenology of Light in Mosques; An Interpretative Phenomenological Analysis of the Light Experience in Al-Sultan Al-Zahir Barqouq Mosque, Final Thesis in Master of Science, Faculty of Engineering, Cairo University, Egypt, 2019.
- D. Bishop and J. G. Chase, A Luminance-Based Lighting Design Method : A Framework for Lighting Design and Review of Luminance Measures, Sustainability, 15 (4369), (2023) 1-16. https://doi.org/10.3390/su15054369
- T. Kruisselbrink, R. Dangol, and A. Rosemann, Photometric Measurements of Lighting Quality: An Overview, Building and Environment, 138, (2018) 42-52. https://doi.org/10.1016/j.buildenv.2018.04.028
- F. Leccese, G. Salvadori, M. Rocca, C. Buratti, and E. Belloni, A Method to Assess Lighting Quality in Educational Rooms Using Analytic Hierarchy Process, Building and Environment, 168 (2020), 1-15. https://doi.org/10.1016/j.buildenv.2019.106501
- W. K. E. Osterhaus, Discomfort glare assessment and prevention for daylight applications in office environments, Solar Energy 79 (2005), 140-158. https://doi.org/10.1016/j.solener.2004.11.011
- D. Hafiz, Daylighting, Space, and Architecture: A Literature Review, Enquiry The ARCC Journal, 12 (2020), 1-8. https://doi.org/10.17831/enq:arcc.v12i1.391
- P. Singh, Built Architecture: The Role of Natural Light, IJRAR, 5 (3) (2018), 55-59.
- Ø. A. Norwegian, S. Aydinli, J. Christoffersen, and I. Edmonds, Daylight in Buildings - A Sourcebook on Daylighting Systems and Components, International Energy Agency (IEA) Solar Heating and Cooling Programme, Energy Conservation in Buildings & Community Systems, Berkeley, 2000.
- C. M. Paredes, Daylighting and Architectural Quality Aesthetic Perception of Daylit Indoor Environments, Final Thesis of Doctor of Philosophy in the Norwegian University of Science and Technology, Faculty of Architecture and Fine Art Department of Architectural Design, Form and Colour Studies, 2016.
- M. Kischkoweit-lopin, An Overview Of Daylighting Systems, Solar Energy, 73 (2) (2002), 77-82. https://doi.org/10.1016/S0038-092X(02)00036-1
- A. Sarkar and S. Bose, Exploring Impact of Opaque Building Envelope Components on Thermal and Energy Performance of Houses in Lower Western Himalayans for Optimal Selection, Journal of Building Engineering, 7 (2016), 170-182. https://doi.org/10.1016/j.jobe.2016.06.009
- M. O. Hegazy, S. M. Shehata, and M. A. Shebl, Parametric Architecture Tools as an Approach to Optimize Daylighting in Office Buildings, Engineering Research Journal, 40 (4) (2017), 367-374. https://doi.org/10.21608/erjm.2017.66363
- W. Jabi, Parametric Design for Architecture, Laurence King Publishing Ltd, London, 2013.
- C. Studio, Custom Daylight Availability, Solemma, 2023. [Online]. Available: https://climatestudiodocs.com/docs/daylightCustom.html. [Accessed: 23-Jun-2023].
- K. R. Piparsania, P. Vaidya, and P. C. Kalita, Evaluation of Daylight Performance of Classroom Spaces in Ahmedabad, in NordDesign 2020, pp. 1-12, Denmark. https://doi.org/10.35199/NORDDESIGN2020.29
- L. Heschong, Daylighting in Schools An Investigation into the Relationship Between Daylighting and Human Performance Condensed Report, California Board for Energy Efficiency, 1999.
- H. M. Aljawder and H. A. El-wakeel, Evaluating The Performance Of A Daylighting Traditional Device, The Mashrabiya, In Clear Sky Conditions: Case Study Of A Traditional Bahraini House, Built Environment, 191 (2019), 395-409. https://doi.org/10.2495/STR190341
- I. Konstantzos, S. Amir, M. Kim, J. Xiong, and A. Tzempelikos, The Effect of Lighting Environment on Task Performance in Buildings - A review, Energy in Buildings, 226 (2020), 1-14. https://doi.org/10.1016/j.enbuild.2020.110394
- A. Bayz and H. Amin, School Design Daylighting Analysis, Sulaimani Journal for Engineering Sciences, 6 (2) (2019), 21-34. https://doi.org/10.17656/sjes.10084
- M. G. Abu-Dakka, The Use of Useful Daylight Illuminance (UDI) to Test New Designs for Improving Daylight Performance of Office Buildings in Dubai-UAE, Final Thesis in Master of Science in Sustainable Design of the Built Environment, Faculty of Engineering, The British University in Dubai, UAE, 2009.
- J. Lee, M. Boubekri, and F. Liang, Impact of Building Design Parameters on Daylighting Metrics Using an Analysis, Prediction, and Optimization Approach Based on Statistical Learning Technique, Sustainability, 11 (1474) (2019), 1-21. https://doi.org/10.3390/su11051474
- Omnia A. M. Ibrahim , Ahmed A. E. Faggal, Ashraf A. I. Nessim, Daylighting Retrofitting in Existing Educational Spaces (By using Solar Tube), A Case Study of Design Studio Hall in Cairo, Egypt, Engineering Research Journal, 1 (50) (2021), 135-140. https://doi.org/10.21608/erjsh.2021.226106
- S. Li, D. H. W. Li, and W. Chen, A comparative study between Daylight Factor Based Metric and other Daylight Metrics for Daylighting Design, in The 54th International Conference of the Architectural Science Association (ANZAScA), 2020, pp. 11-20, Auckland.
- A. Elghandour, A. Saleh, O. Aboeineen, and A. Elmokadem, "Using Parametric Design to Optimize Building's Façade Skin to Improve Indoor Daylighting Performance, in Proceedings of BSO Conference 2016: Third Conference of IBPSA-England, 2014, pp. 353-361, London.
Copyright © 2023 The Author(s). Published by solarlits.com.

SHARE ON


