Volume 11 Issue 1 pp. 1-22 • doi: 10.15627/jd.2024.1
Electrochromic Glazing and Evaluation of Visual and Non-Visual Effects of Daylight: Simulation Studies for Brasilia – Brazil
João Francisco Walter Costa,∗ Cláudia Naves David Amorim, Joara Cronemberger Ribeiro Silva
Author affiliations
Faculty of Architecture and Urbanism, University of Brasilia, Darcy Ribeiro Campus, Ala Norte, Brasilia, DF, Brazil
*Corresponding author.
joao.walter@aluno.unb.br (J. F. W. Costa)
clamorim@unb.br (C. N. D. Amorim)
joaracronemberger@unb.br (J. C. R. Silva)
History: Received 27 October 2023 | Revised 3 January 2024 | Accepted 7 January 2024 | Published online 29 February 2024
Copyright: © 2024 The Author(s). Published by solarlits.com. This is an open access article under the CC BY license (http://creativecommons.org/licenses/by/4.0/).
Citation: João Francisco Walter Costa, Cláudia Naves David Amorim, Joara Cronemberger Ribeiro Silva, Electrochromic Glazing and Evaluation of Visual and Non-Visual Effects of Daylight: Simulation Studies for Brasilia – Brazil, Journal of Daylighting 11 (2024) 1-22. https://dx.doi.org/10.15627/jd.2024.1
Figures and tables
Abstract
The employment of electrochromic glazing can be a solution to balance circadian lighting and avoid glare. This can be achieved by controlling daylight entering the room and may be useful within the context of highly glazed facades in buildings in hot climates. Nevertheless, the use of this technology is rarely discussed in this context. In this regard, the aim of this study is to investigate the electrochromic glazing for the lighting conditions, including visual and non-visual effects within the luminous context of Brasilia, Brazil. The method consisted of computer simulations of a representative highly glazed non-residential room with the comparison of electrochromic glazing and conventional clear glass. Climate Studio was used to evaluate the visual effects of light for the entire year, and ALFA for the evaluation of melanopic daylight illuminance, vertical illuminance, and melanopic daylight efficacy ratio (mel-DER) in four days, including two solstices and two equinoxes encompassing the beginning of the four seasons. Results for the electrochromic glazing showed a better balance between a minimum threshold of 250 lux of mel-EDI without exceeding 1,500 lux of vertical illuminance in comparison with the clear glass. This was achieved in 33.33% of the hours for the north, against 27.78% of the hours for the east, 29.17% for the west, and 24.72% for the south. For the clear glass, this balance was achieved in only 9.17% of the hours for north, 10.28% for east, 12.22% for west, and 15% for south. Regarding the spectrum, higher results of melanopic daylight efficacy ratio were observed for the clear glass over the four simulated days. The main conclusion was that the electrochromic glazing was capable of providing a better balance between visual and non-visual requirements and can be a suitable solution for highly glazed facades in Brasilia. Nevertheless, particularly for the north orientation, the supply of circadian lighting can be jeopardized when the electrochromic glazing remained at the dark state.
Keywords
Electrochromic glazing, Buildings, Non-visual effects, Hot climate
1. Introduction
Windows, whose main component is the glass, are responsible for important attributes related to the user’s well-being, such as the presence of natural light and a view of the outside, with visual and non-visual effects related to the circadian cycle [1]. In this regard, the employment of innovative transparent and translucent materials on facades allows the maximization of daylight and the supply of circadian lighting [2]. In this context, innovative materials, such as smart windows, can help maximize daylight in the built environment and simultaneously can filter unwanted solar radiation, protecting users from glare [3,4]. Smart windows are those that present phase change properties – which, considering the luminous comfort, are characteristic of controlling the light transmittance [5].
One well-known technology of smart windows is electrochromic glazing, which is composed of a transparent electrolyte layer, e.g., a conducting polymer or an inorganic ionic conductor and two other layers of transparent polyester. This conducting element is in the center and joins two nanoporous oxide films, typically tungsten oxide (WO2) and nickel oxide (NiO). This pile of three layers functions as electric transparent batteries with different optical absorption depending on electrical charges. The application of a small voltage in between the two transparent conductors, typically a few volts, charges the load between the tungsten oxide (WO2) and the nickel oxide (NiO). The optical properties can be unaltered – dark, bleached or intermediary, which allows highly energy-efficient operations. The optical changes are gradual and take place at a rate that depends on the size of the device. An area of a few square centimeters may darken and bleach in seconds, whereas the response time can be tens of minutes for large glazing [6]. This technology offers the advantage of controlling the properties of the visible transmittance. Therefore, the amount of visible radiation can be controlled [7,8]. Figure 1 illustrates the visible transmission and solar heating gain coefficient (SHGC) for each operational state of the electrochromic glazing [9,10].
Figure 1
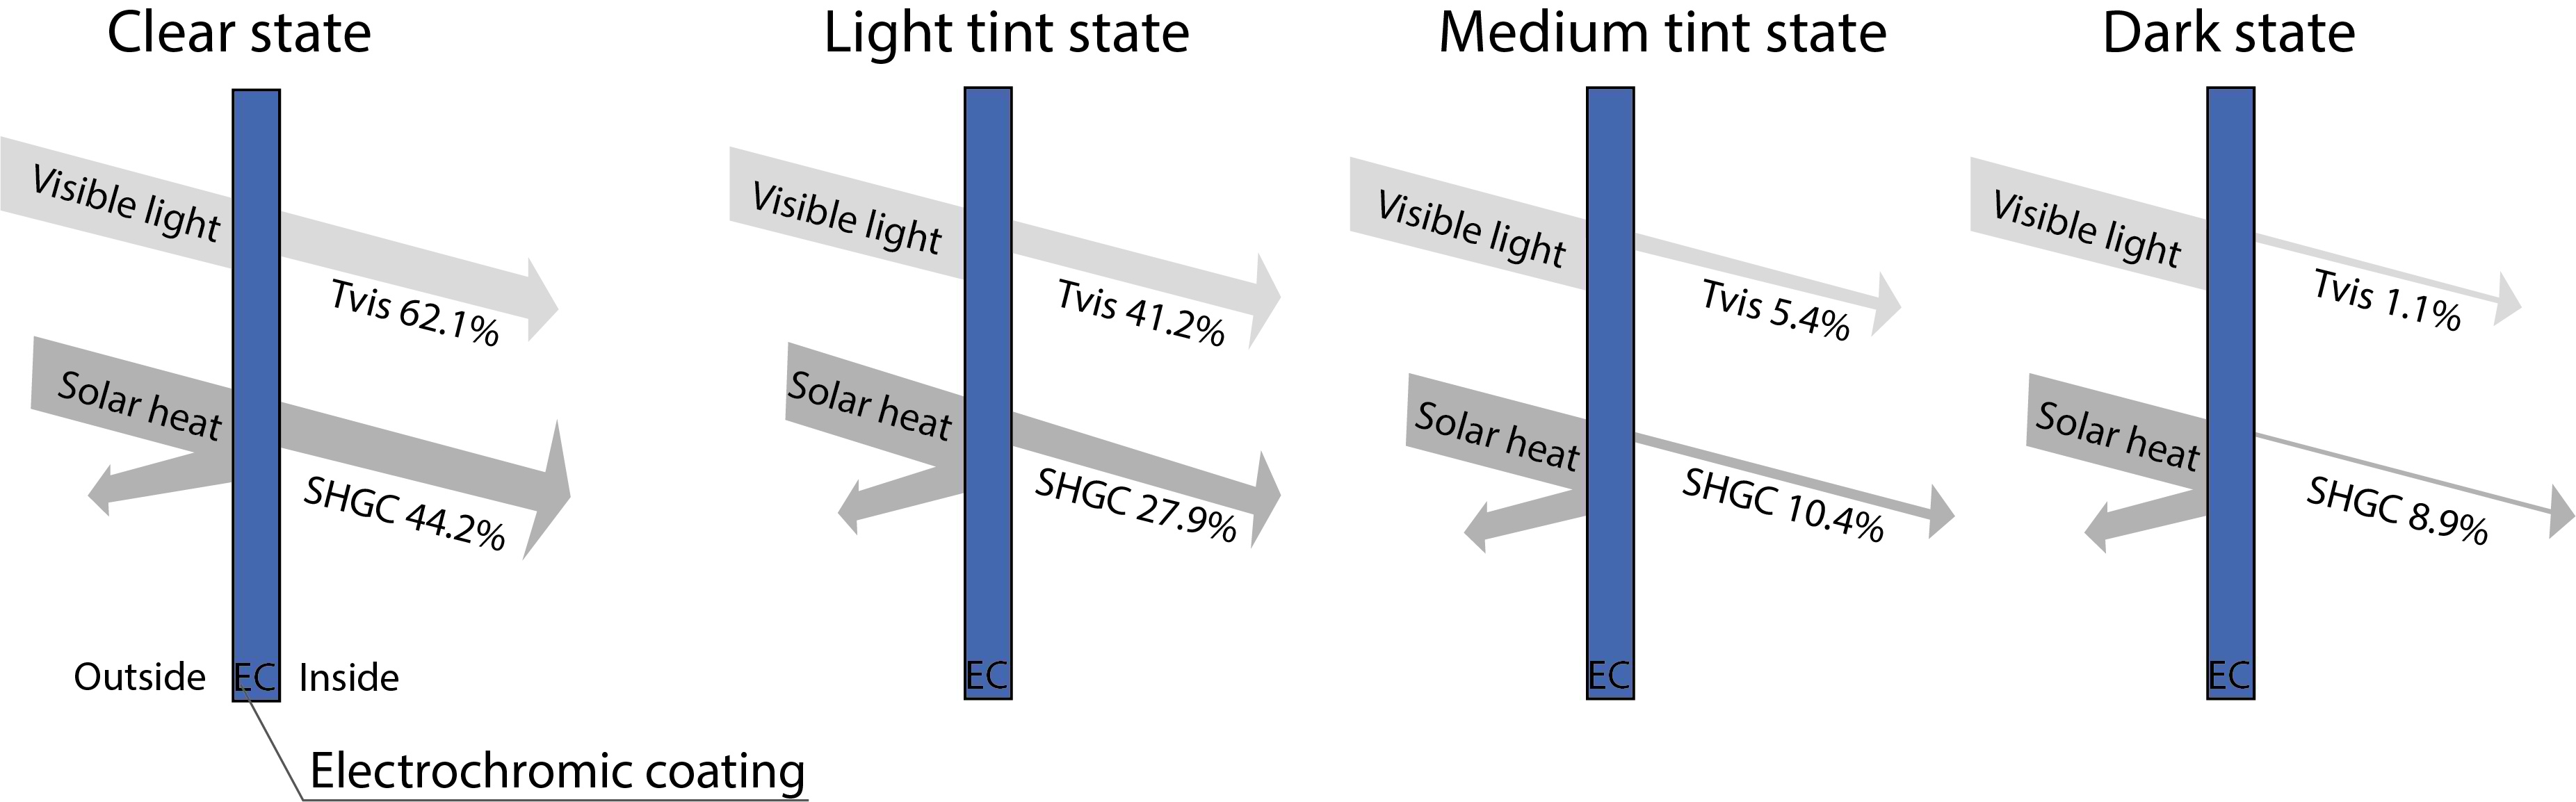
Fig. 1. Visible light transmission and solar heating gain coefficient for each operational state of the electrochromic glazing.
Since its development, many questions arise concerning the luminous performance and user acceptability of electrochromic glazing in built environments, particularly in non-residential buildings. A major drawback of using electrochromic glazing is the reduced visible transmittance in its “dark” state, and this aspect has been discussed in two studies. Day et al. [11] identified through the evaluation of 1,068 questionnaires in three big commercial buildings criticisms coming from the users in the rooms with the electrochromic glazing because they were under constant darkness, and the light transmission was reduced to approximately 1%. In this regard, the electrochromic glazing was installed for the purpose of energy efficiency, ignoring the users’ subjective needs and acceptability of this technology. Additionally, Lee et al. [12] reinforced that the current generation of electrochromic windows sacrifices some aspects of view and daylight quality to manage energy and glare through the reduction of visible transmittance from 60% to 1%. Here, spectral transmission is also of concern, but since the tint varies, the hours of operation of these windows in each optical state will also need to be considered. So, in effect, it will be possible to determine if, for example, the technologies of electrochromic glazing and other smart windows can provide adequate access to daylight, view to the outside and adequate circadian lighting.
The quantification of daylight is a challenge because it presents constant variations in intensity, color temperature and sky conditions. At the same time, daylight provides a positive influence when compared to artificial lighting because it has a positive influence on non-visual effects, such as circadian lighting [13]. More recently, many studies have identified two pathways of light from the stimulus to the physiological responses on the human body, which are received from our eyes and processed in the human body. They include visual and non-visual effects of light, and both aspects must be considered [14]. Visual effects include the luminous characterization of the space and can be evaluated through luminance values in the vertical field of view, illuminance distribution, evaluation of glare, etc. Non-visual effects include the circadian stimulus, and it is evaluated based on the spectral power distribution in the eye. These are important elements to understand the physiological responses of light in humans, specifically when the luminous performance of the electrochromic glazing is assessed [15,16]. The following section is dedicated to the description of studies about electrochromic glazing and the luminous characterization of indoor spaces regarding the visual and non-visual effects of light.
1.1. Electrochromic glazing and luminous characterization of indoor spaces
At first, studies were directed at understanding the luminous distribution provided by the employment of the electrochromic glazing on the façade. The efforts of researchers and manufacturers have resulted in a continuous improvement of electrochromic devices’ performance. Wu et al. [17] conducted experiments in a full-scale testbed, with dimensions of 2 m × 4.5 m × 3.3 m and a WWR of 64%, to demonstrate the daylighting performance under various sky conditions. The electrochromic glazing used in the study had four states of luminous transmittance: 60% (clear), 18% (tint light), 6% (medium tint), and 1% (full tint). The testbed was built in Berkeley, CA – United States (37° N/122° W). Experimental results showed that in 83% of the working time, the illuminance values for the work plane were constrained in comfort range, between 500 lux and 2,000 lux, and daylight glare probability was lower than 35% under clear skies. The results indicated that a balance between illuminance values on the work plane and mitigation of glare was possible to be achieved.
Jain, Karmann, and Wienold [18] evaluated the performance of the electrochromic glazing in minimizing discomfort glare in a controlled user assessment setup and the performance in relation to glare in the user’s field of view, including the daylight glare probability (DGP). The experiments were conducted in a test room located on the EPFL campus in Lausanne, Switzerland (46° N/6°E) in a room 6.55 m deep, 3.05 m wide, and 2.65 m high. The test room was oriented to the south with a window-wall-ratio of 62%. Results from the subjective evaluation indicated that a sun disk luminance of around 5 million cd/m² (visible transmittance of 0.6%) was sufficient to control glare when the sun was in the peripheral field of view of the participant whereas the same was not applicable in critical viewing direction (e.g., sun position within 30° cone around the fovea). Based on the subjective assessment of glare according to the sun disk illuminances, thresholds of discomfort due to glare were determined when the electrochromic glazing was found in the dark state. A threshold of 1,180 lux of vertical illuminance corresponded to a DGP of 40%, and 1,213 lux of vertical illuminance corresponded to a DGP of 43%.
These two studies indicated that the electrochromic glazing was able to balance illuminance levels on the vertical field of view and, at the same time, mitigate glare. Nevertheless, non-visual effects of light were not considered in their assessment. This issue was discussed later, but only under specific dates, seasons and locations at higher latitudes.
Regarding the non-visual effects of light, Boubekri et al. explored the impact of optimized daylight and views on the sleep and cognitive performance of thirty office workers in the Durham ID Building in Durham, North Carolina, U.S. (35° North/78° West). They spent one week working, from Monday to Friday, from 8 a.m. to 6 p.m. in each of the two office environments with identical layouts, furnishings, and orientations in November. However, one was outfitted with electrochromic glazing and the other with traditional blinds, producing lighting conditions of 40.6 and 316 equivalent melanopic lux, respectively. Participants slept 37 minutes longer and performed better in cognitive performance tests when exposed to optimized daylight and views during the day, with higher circadian lighting, which could be provided by the electrochromic glazing and not provided by the traditional blinds [19].
Saiedlue et al. carried out computer simulations in the software ALFA, Adaptive Lighting for Alertness, in a side-lit open plan office space located in Minneapolis, United States (44° North/93° West). Equivalent melanopic lux over 12 hours on March 21 with three zones, near (A), in the middle (B), and distant from the window (C). Three glazing systems were also evaluated: double glazing, with visible transmittance of 63%, and electrochromic glazing, with two zones and three zones. The software ALFA was used to measure the glazing performance at eye level in office spaces. In zone A, all glazing systems provided melanopic lux levels above 200 EML in all time periods and in all view directions. Electrochromic glazing with three zones provided 200 EML or higher and provided an acceptable photopic illuminance range between 7 a.m. and 5 p.m. in view direction facing the window (45°- 135°) in zone B. Zone C provided 200 EML or higher between 7 a.m. and 8 a.m. and between 3 p.m. and 5 p.m. in view direction facing the window (22.5°- 157°). Findings showed that the electrochromic glazing with three zones provided the best performance in creating the balance among the new metrics (i.e., Equivalent Melanopic Lux – EML and Photopic Illuminance on a vertical plane at eye level) [20].
Based on the literature review, it was possible to verify that there are few studies about the evaluation of electrochromic glazing regarding visual and non-visual effects. They are still constrained to a limited period, from two days to a week, only in two different locations within the United States. Different seasons, hours, and latitudes must be considered. The next section is dedicated to the discussion of glazed facades in the context of non-residential buildings in Brazil.
1.2. Glazed façades: Brazilian context of non-residential buildings and potentiality of the electrochromic glazing
In Brazil, there are really few studies regarding the employment of electrochromic glazing [21-23]. When well-designed, electrochromic glazing control can improve the energy performance of buildings and the visual comfort of occupants in highly glazed buildings [17]. Its employment on facades has a great potential to mitigate glare and to provide circadian lighting [18,19]. Considering the Brazilian context of non-residential buildings, the most important aspect to be considered is the dominant economic formula, which “governs the production of a conventional office building characterized by the following factors: the largest possible internal usable area in relation to the total built-up area and the smallest façade area for the largest office plan area and the use of the fully glazed façade” [24].
This solution of highly glazed façades has been replicated in large cities, such as Sao Paulo, Belo Horizonte, and Brasilia. Studies reported problems related to glare, excess light on working surfaces, and an increase in energy consumption for lighting due to the incidence of direct sunlight inside the working environment [25–29]. Moreover, the use of clear glass was also identified on facades in Brasilia and Sao Paulo in modernist buildings, mostly built between the 1960s and 1970s [24,27,30]. To mitigate problems related to glare and overheating, reflective glasses have been employed since the 2000s, but this was not sufficient to entirely solve these issues [31]. Lima and Caram [32] evaluated the performance of three glasses with different visible transmissions, reflective (14%), grey (51%), and colorless (81%) in a highly glazed office environment with WWR of 75% regarding useful daylight illuminance. It was observed that solar control using shading devices presented substantially better results than solar control by reducing the transmission of solar radiation by the glass.
Geraldi et al. [33] provided a pioneering, top-down analysis of the non-residential building stock in Brazil. A country-wide dataset was used, comprising 10,000 buildings divided into 12 typologies that included office and non-residential buildings. Key indicators included floor area, energy use intensity, and operation patterns. These data included the window-to-wall ratio (WWR) among the typologies of buildings. Among the evaluation of 2,400 office buildings analyzed, almost 20% of them had more than 76% of WWR. This also corroborated that the use of glazed façades in this typology of buildings was frequent.
A balance and categorization were made considering research developed about daylight in buildings in Brazil. This categorization included the most important conferences and journals in the country. Among the issues discussed, it was pointed out that topics related to the non-visual effects of light and the possibility of using innovative transparent and translucent materials, which included electrochromic glazing, must be further researched in hot climates and lower latitudes. They can be used as solutions to the problems arising from the intense use of highly glazed façades [23]. It is still unclear, therefore, how the employment of these materials affects circadian lighting within the Brazilian climatic context and if a balance can be achieved in a different context outside higher latitude places, mainly below 30º and in different luminous and climatic contexts [22].
Particularly in Brasilia, almost half of the buildings were built between the 1970s and 1980s, and many are being retrofitted. Through the evaluation of 267 buildings, sun shading devices were not identified in 67% of the facades. This reinforced the understanding that in many cases, the solution of employing reflective glasses is adopted instead of the use of sunshades on the facades, and in some cases, the sunshades were replaced by reflective glasses [34]. The use of highly glazed facades may cause problems regarding glare, overheating, and visual discomfort [35].
In this context, questions arise regarding the potentiality of the electrochromic glazing. There are still few research that simultaneously focus on the luminous performance of electrochromic glazing regarding these three aspects of daylight: quantification of daylight, glare mitigation, and supply of circadian lighting. Another issue is about the performance of the electrochromic glazing on façades compared to conventional glasses used in non-residential buildings in Brazil. Particularly in Brasilia, there are buildings that are over forty years old and are being retrofitted with conventional glass, including clear glass. In many cases, the solar protections are being removed. In this regard, electrochromic glazing can be a suitable solution to mitigate problems related to glare and excess light and to provide circadian lighting.
Therefore, the aim of this study is to investigate electrochromic glazing for the lighting conditions, including visual and non-visual effects in a highly glazed non-residential room in Brasilia (15° S/47° W). The specific aim is to discuss under which conditions the electrochromic glazing was more effective in balancing visual and non-visual effects regarding solar orientation, north, south, east, and west. The second aim is to compare the luminous performance of the electrochromic glazing with conventional clear glass.
2. Method
The method consisted of computer simulations of a non-residential room in Brasilia (15° S/47° W). The Smart Glass Insulated Unit technology with a layer of electrochromic coating was used as a glazing system. This technology was chosen because it was available on the market, and its optical properties were taken from the International Glazing Database [9,10]. As a means of comparing electrochromic glazing to a conventional technology used in non-residential buildings in Brasilia, clear glass was selected. The properties are described in section 2.2. In Fig. 2, the location of Brasilia and the sun-path diagram is shown.
Figure 2
![Location of Brasilia and sun-path diagram in Analysis Sol-Ar v. 6.2 [41].](figures/11-1-2.jpg)
Fig. 2. Location of Brasilia and sun-path diagram in Analysis Sol-Ar v. 6.2 [41].
At first, the non-residential test room was modelled in the software Rhinoceros, v.7 with its geometry [36]. Then, the electrochromic glazing’s optical properties were inserted, and the first round of simulations was carried out in Climate Studio, v. 1.9, to simulate the visual effects of light with the evaluation of Spatial Daylight Autonomy (sDA), Useful Daylight Illuminance (UDI), and Annual Glare, Daylight Glare Probability (DGP) [37]. The climate file used was of Brasilia in the EPW format of 2018 [38,39].
The software ALFA will be used to simulate the non-visual effects. ALFA, Adaptive Lighting for Alertness, is a spectral raytracing software that utilizes 81-color channels to approximate the spectral variations as opposed to traditional 3-color channels (RGB). Spectral properties of the skies for clear, hazy, overcast, and heavy overcast cover conditions are generated using a radiative transfer library (libRadtran). Material properties are also modeled with high spectral resolution derived from spectrophotometric measurements [40].
Bellia et al. [42] studied the accuracy and applicability of the software ALFA. For the purpose of evaluating non-visual effects, two different approaches, based on the use of ALFA and DIALux, were described, validated against on-field measurements, and compared. Spectral irradiance was measured at the work plane and at the eye in a test room where the walls’ finishes and the luminaires’ spectrum were changed, obtaining 21 scenarios. When the test room was simulated using the two methods, acceptable results were obtained for horizontal illuminance, with percentage errors within the range of approximately 10%, whereas for the vertical plane, errors depend on the software and the lighting scenario. Overall, the simulations in ALFA performed better than in DIALux, but it gave percentage errors trespassing more or less 10% in 38.10% and 52.38% of the scenes in estimating circadian stimulus and melanopic illuminance, respectively. Additionally, Inanici, Abboushi, and Safranek [43] provided an evaluation of the existing spectral sky models in lighting simulation software. They highlighted the advantage that ALFA can be calculated for different locations and times but reported similar problems related to the trespassing of melanopic and photopic illuminances of the sky in 17%. On the other hand, variations to calculate correlated color temperature and light spectrum are minimal. In conclusion, both studies pointed out variations of the software ALFA to predict melanopic illuminances in 10% and 17%, but also emphasized accuracy in calculating the light spectrum.
Consequently, the second round of simulations was carried out in ALFA, and vertical illuminance and units of Equivalent Melanopic Lux (EML) were generated [44]. Based on the CIE standard S026/E:2018 [45], the units of EML were converted to mel-EDI with units in lux. Mel-EDI is a scalar multiplier of melanopic lux (EML), and mel-EDI can be easily obtained by multiplying by 0.9058 the value of the melanopic illuminance calculated according to the method proposed by Lucas et al. [42,46,47]. As a consequence, the units reported in this study will be the mel-EDI. Finally, the data were analyzed and discussed. The method structure is illustrated in Fig. 3.
Figure 3
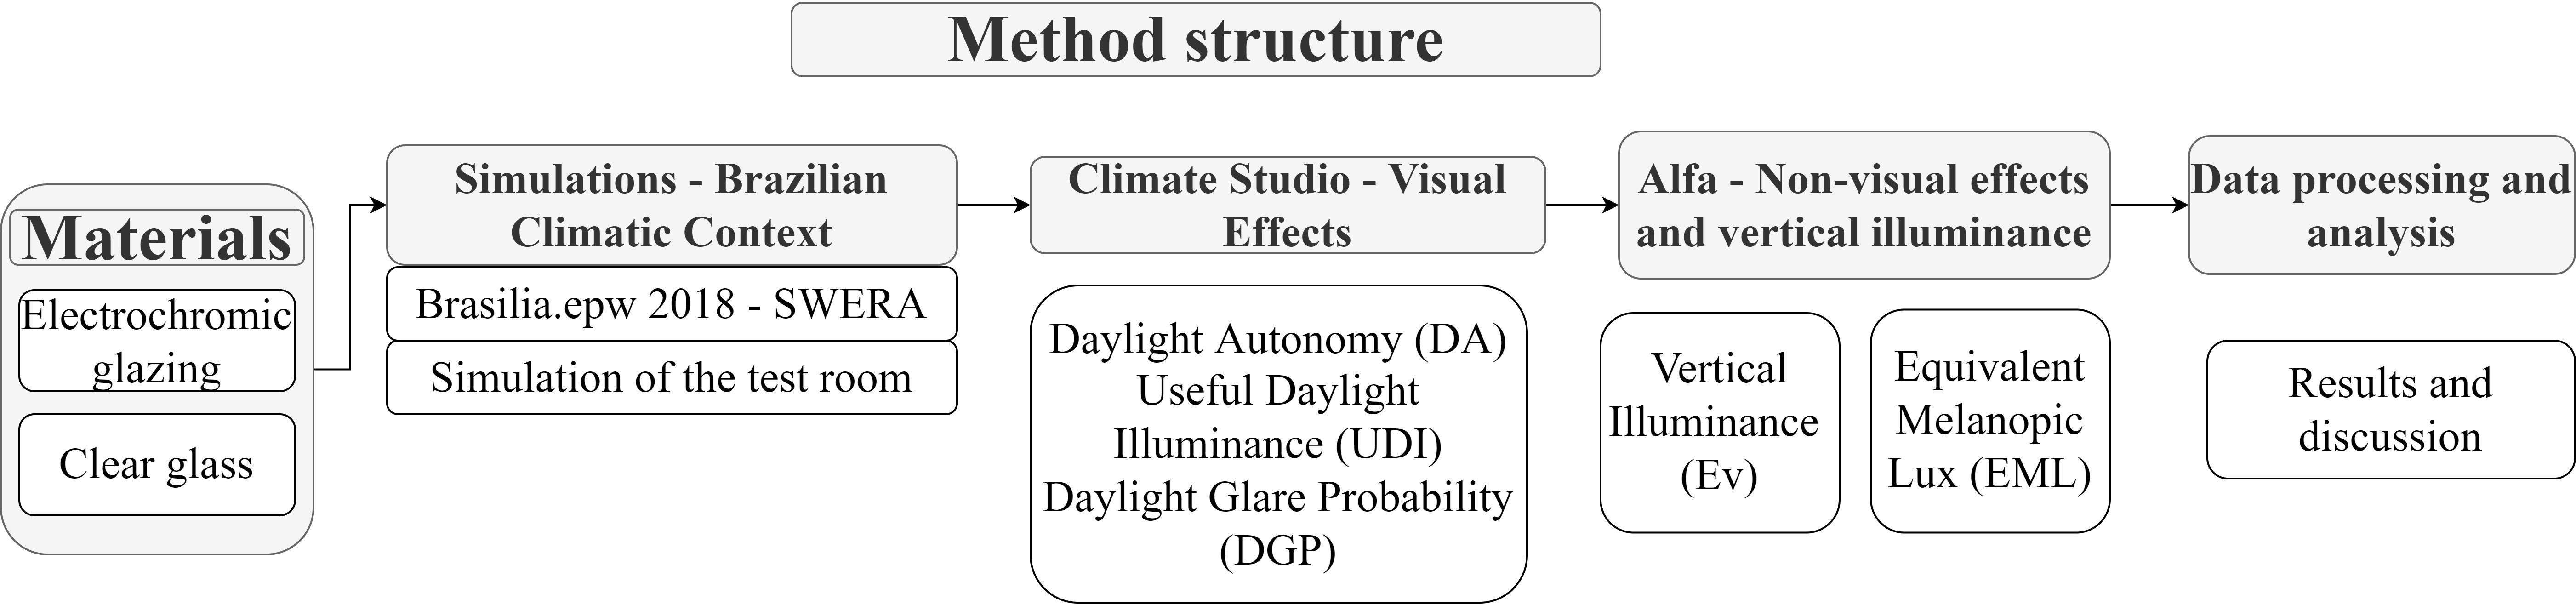
Fig. 3. Method structure.
The details are further explained in the following sections. In section 2.1, the luminous context of Brasilia is briefly described. In section 2.2, the simulation model is presented, and in sections 2.3 and 2.4, the simulation workflow and parameters are described. In section 2.5, the statistical and data analysis are reported.
2.1. Climate of Brasilia and climate file data extraction
According to data from the National Institute of Meteorology [38,48], the climate of Brasilia (15° 7’ south/47° 9’ west) presents two distinct seasons:
- Warm and humid season: rainy summer from October to April with predominance of partly cloudy sky.
- Warm and dry season: dry winter from May to September with conditions of clear sky, particularly between July and September.
To understand the luminous context, the climate file Brasilia.epw of 2018 was opened in Climate Consultant v. 6.0 [49], and the data were filtered and opened as .csv file. In it, the data on global and direct illumination, radiation, and sky cover were presented in the form of graphics. The results described in this section were extracted from the climate file BRASILIA_2018.epw and were used in the simulations in Climate Studio. According to the results, the daily average of global horizontal illumination for the climate of Brasilia per month ranges from 36,000 lux in November, during the rainy season, and in April to 52,000 lux, as illustrated in Fig. 4.
Figure 4
![Daily average of global horizontal illumination in Brasilia in 2018 – extracted from climate file [38].](figures/11-1-4.jpg)
Fig. 4. Daily average of global horizontal illumination in Brasilia in 2018 – extracted from climate file [38].
Figure 5 shows the daily average sky cover in Brasilia. Between October and April, the sky cover is higher, with daily averages greater than 50%. At this period, the sky is normally partly cloudy and overcast. During the dry season, from May to September, the sky is usually partly cloudy. The sky cover is, on average, lower than 40% in July, August and September. In April, May, June and October, the sky cover remains between 50% and 60%.
Figure 5
![Daily average of sky cover in Brasilia – extracted from climate file [38].](figures/11-1-5.jpg)
Fig. 5. Daily average of sky cover in Brasilia – extracted from climate file [38].
It is illustrated in Fig. 6 the daily average direct and diffuse horizontal radiation in Brasilia per month, with ranges between 479 Wh/m² in January and 338 Wh/m² in November. The presence of direct radiation is greater than 100 Wh/m² during the entire year. Due to the variations in the global illuminations, sky cover, and solar radiation for the climate of Brasilia, the simulations in ALFA considered four days, two solstices, and two equinoxes representing the beginning of each season.
Figure 6
![Direct and diffuse horizontal radiation in Brasilia – extracted from climate file [38].](figures/11-1-6.jpg)
Fig. 6. Direct and diffuse horizontal radiation in Brasilia – extracted from climate file [38].
2.2. Simulation model, parameters, and variables
The simulated model was a representative highly glazed non-residential room with dimensions of 3.48 m wide, 6.03 m long, and 3.00 m high, with WWR of 85%, as described in Fig. 7. This model represented a generic office space within the Brazilian context, and its dimensions were based on the studies of Amorim et al. [50], Cavaleri, Cunha, and Gonçalves [26], and Sarra and Mühlfart [27]. The walls, floor, and roof were modeled using the command “box,” inserting the already described dimensions, with a width of 0.15 m. The surfaces corresponding to the floor, ceiling, and window were modeled using the command “_SrfPt.”
Figure 7
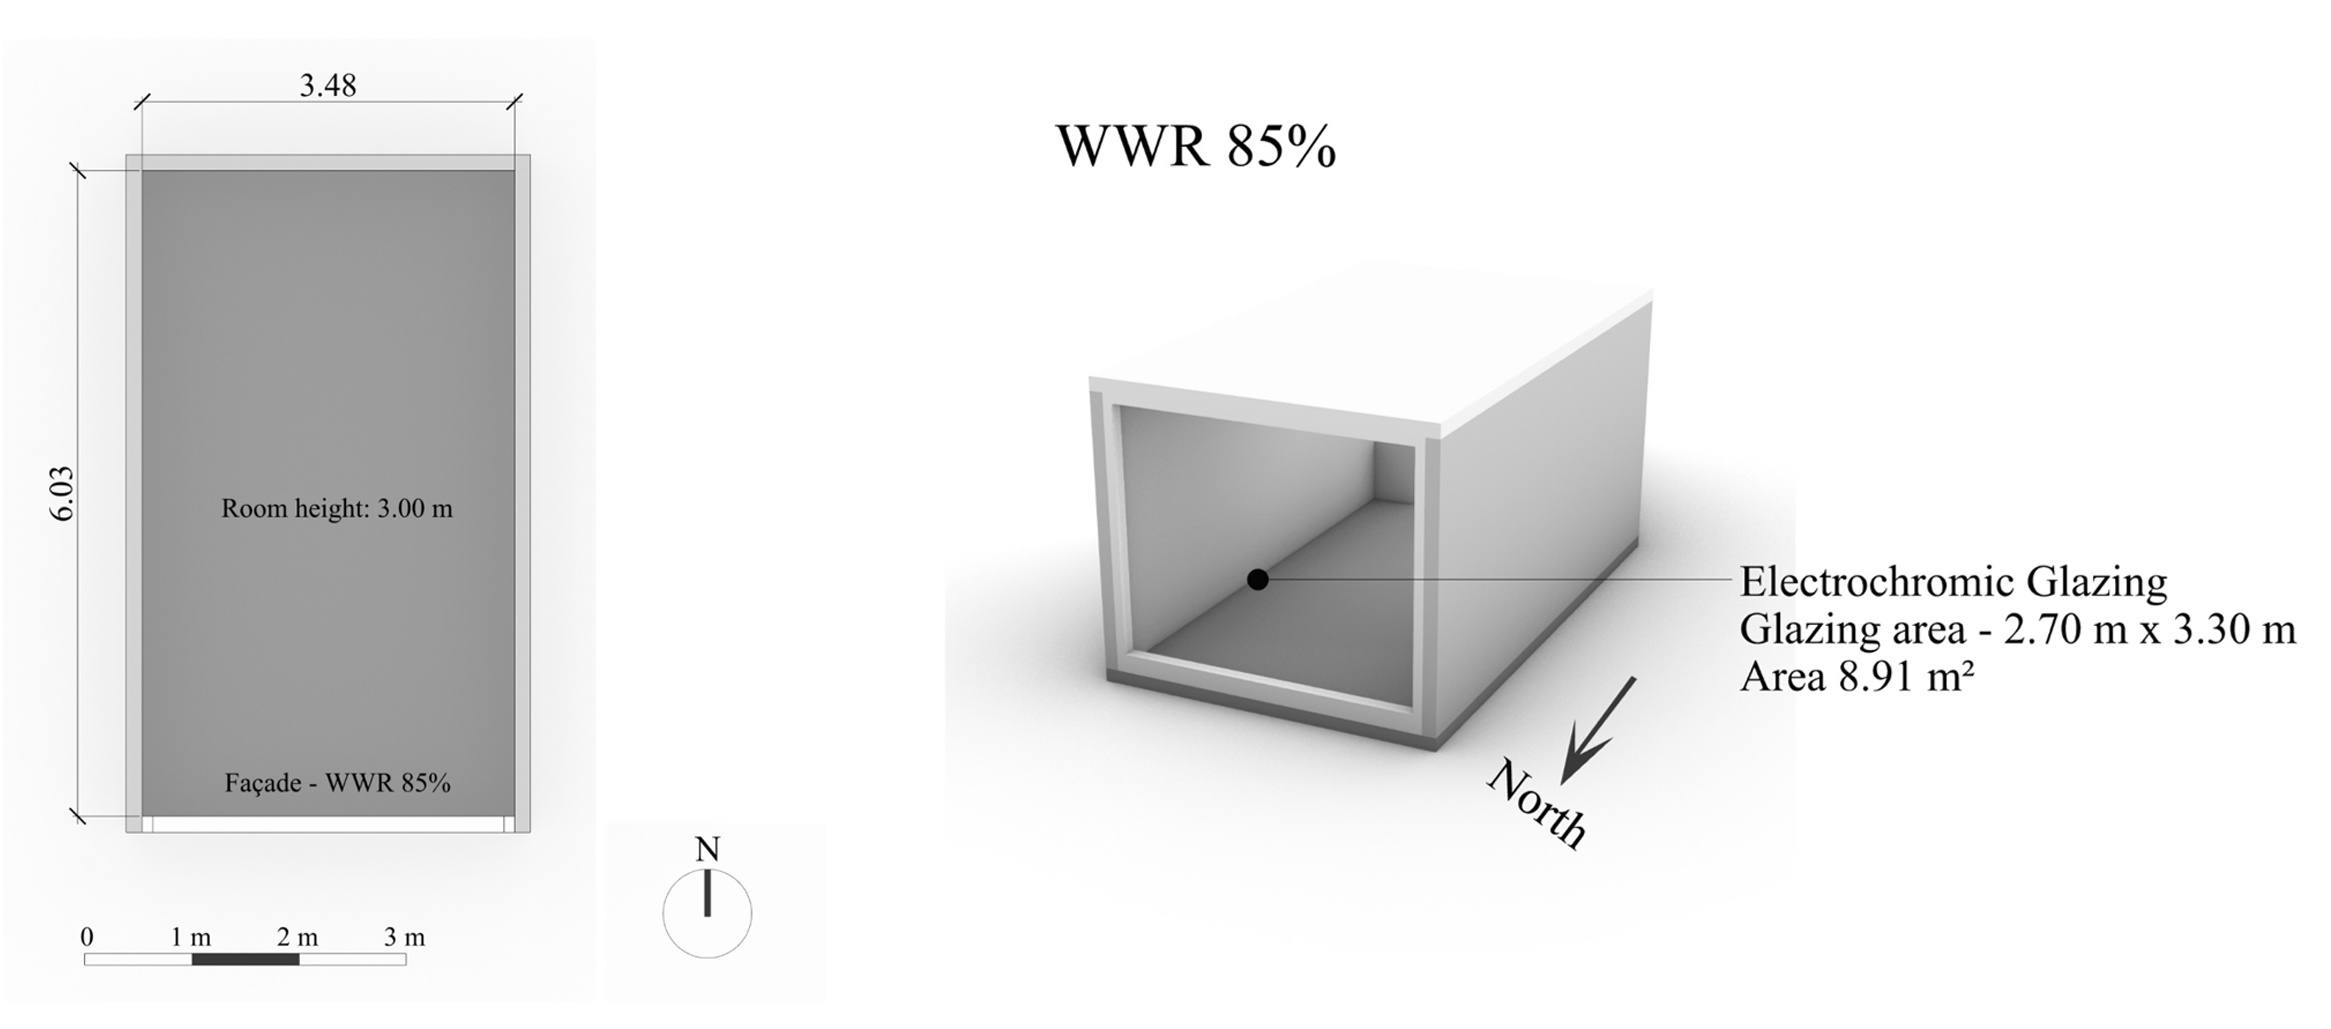
Fig. 7. Plan of the simulated non-residential room.
It is important to mention that the surface corresponding to the window had to be modeled and directed to the outside. To verify if this condition was fulfilled, the command “dir” was used. These were the tools and commands used to model the simulated room. It is shown in Fig. 7 the dimensions of the simulated non-residential room. The Smart Glass Insulated Unit has a visible light transmittance of 62.1% (clear state), 41% (light tint), 5.4% (medium tint), and 1.1% (fully tinted state) [9]. The clear glass has a visible transmittance of 88% [9]. The occupation was during working hours, between 8 a.m. and 6 p.m. [33,51].
Reflectance values were chosen following the recommendations of the Brazilian National Standard NBR 8995 (2013) [52], which were between 60% and 90% for the ceiling, 30% and 80% for the walls, 20% and 60% for the work environment and 10% and 50% for the floor. Table 1 shows the optical properties of the simulated materials, with the photopic and melanopic reflectance values for the opaque materials and visible transmittances for each state of the electrochromic glazing. The third column presents the melanopic/photopic ratio for each material [53].
Table 1
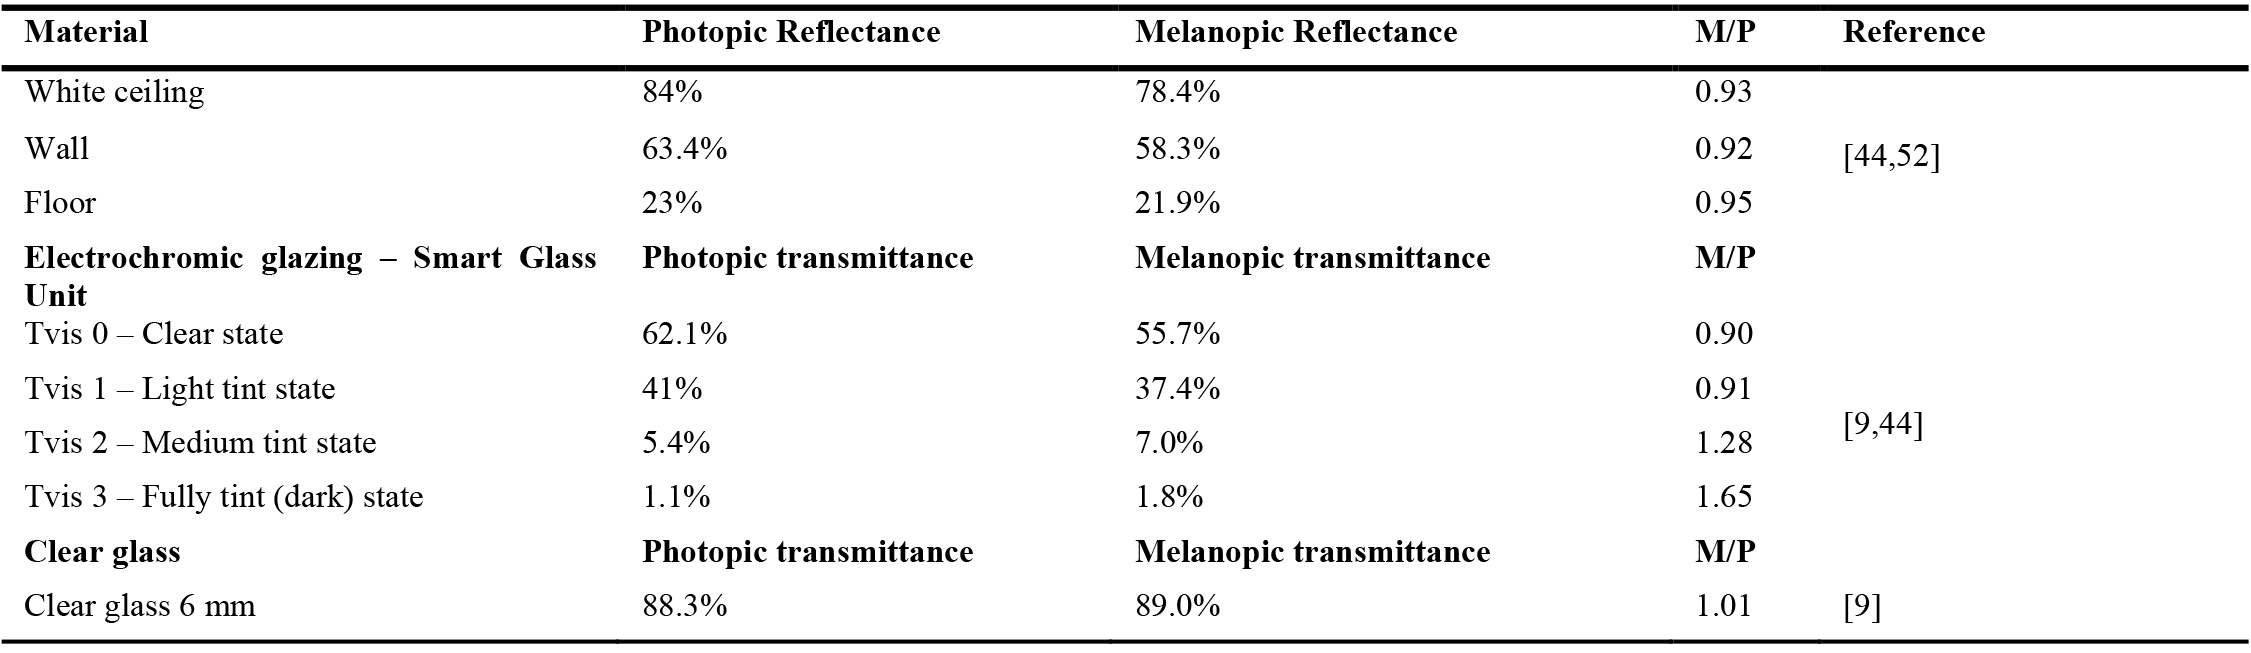
Table 1. Optical properties of the simulated materials.
Additionally, Table 2 describes the simulation parameters with recommendations from the existing literature. For the simulations in ALFA, the ground albedo was configured at 15%, simulating a generic urban environment as recommended by Martins [54].
Table 2
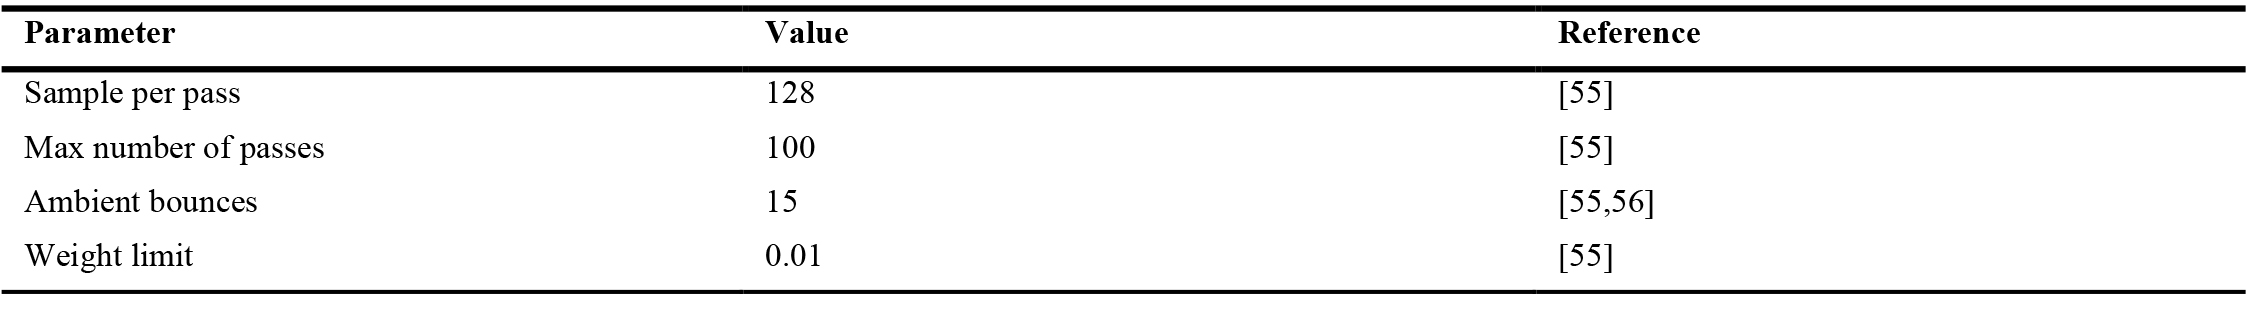
Table 2. Optical properties of the simulated materials.
Visual and non-visual effects of light were evaluated. The intention was to evaluate the balance between minimum requirements, such as minimum horizontal illuminance and circadian lighting with excess light, evaluating glare. To do so, nine sensors were chosen for analysis of daylight following the recommendations of the Brazilian Standard, ABNT NBR 15215 – 4 (2023) [57]. The sensor grid was positioned 0.75 m above the floor. For the assessment of glare, vertical illuminance, and non-visual effects, the sensors were placed at eye level, 1.20 m above the floor, and all sensors were placed facing the window, with a view angle to the front.
The simulated variables were four solar orientations north, south, east, and west, nine sensors to assess the distribution of light across the room, and the third variable was the glazing material, electrochromic glazing, and the clear glass. The position of the sensors can be seen in Fig. 8. The sensors were named P1 to P9 and located in three zones, which were considered according to the room depth. P1, P2, and P3 were located in zone A, which was close to the window, at a distance of 0.50 m; P4, P5, and P6, in the middle (zone B), 3 m far from the window; and P7, P8, and P9 far from the window (zone C), at a distance of 5.5 m from the window. This reference to zones was based on the study of Saiedlue et al. [20]. All nine analysis sensors were spaced 2.5 m from each other over the room’s depth and 1.25 m over its width.
Figure 8
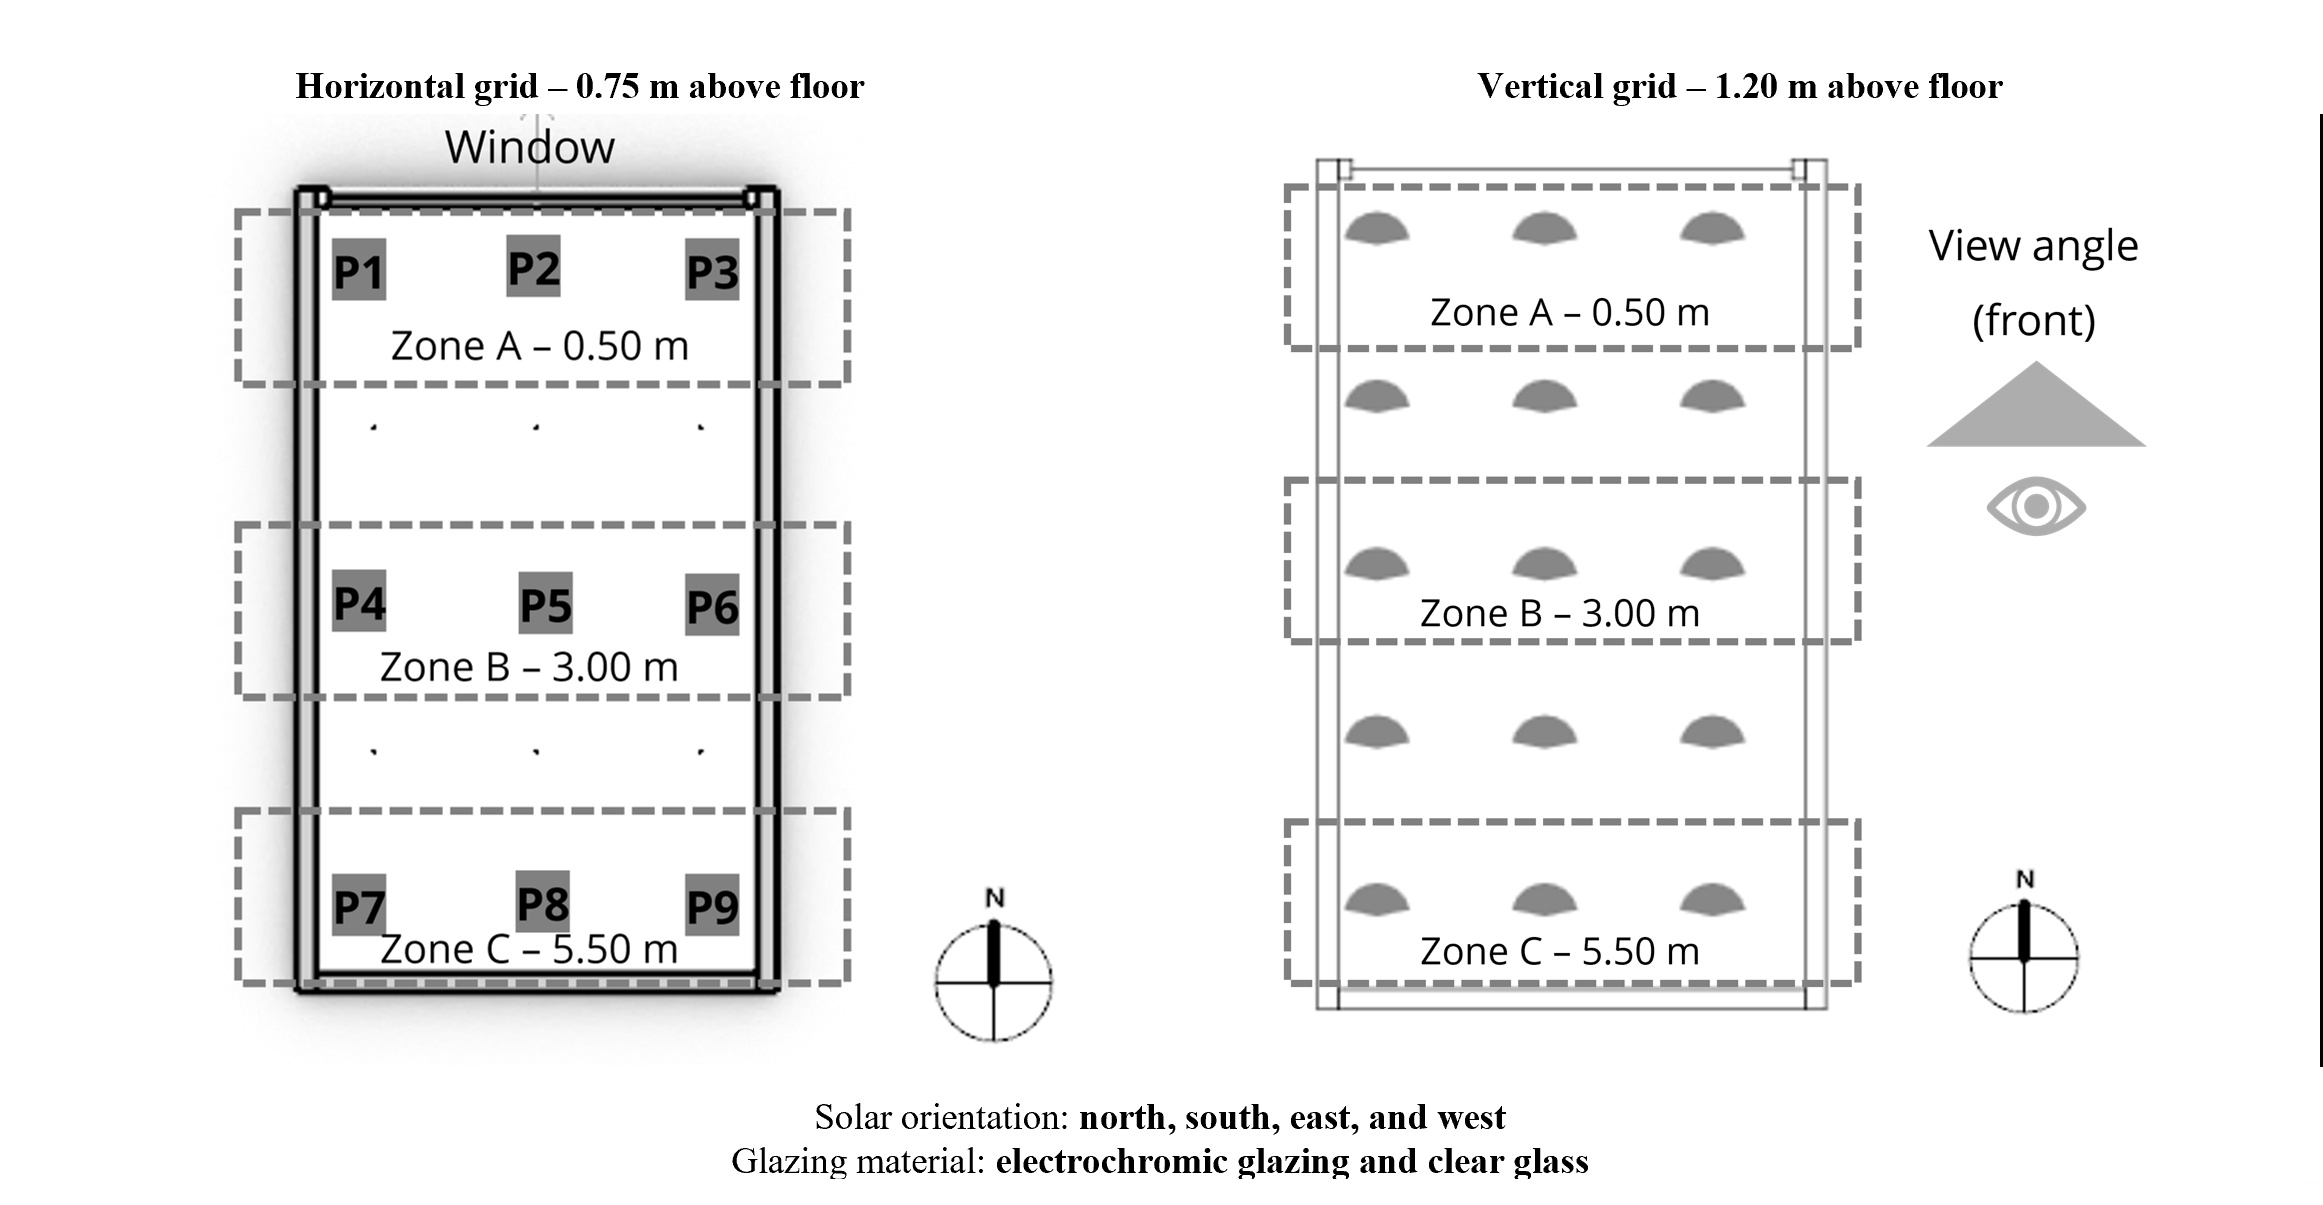
Fig. 8. Simulated variables: Solar orientation, north, south, east, west, window material, clear glass and electrochromic glazing and sensor grids, P1 to P9.
2.3. Assessment criteria for visual and non-visual effects of light
To assess visual effects of light, three criteria were used. For illuminance levels, spatial daylight autonomy was considered with a minimum level of 300 lux in at least 50% of the space in 50% of the hours [58,59]. Useful daylight autonomy (UDI) was also considered in the simulations, with an interval between 100 and 3,000 lux [60]. The third criterion was the Daylight Glare Probability, which was divided into four categories: perceived (DGP ≤ 35%), perceived but mostly not disturbing (35% < DGP ≤ 40%), perceived and often disturbing (40% < DGP ≤ 45%) and intolerable (DGP ≥ 45%) [61,62].
To assess the circadian lighting during a cycle of working hours, from 8 a.m. to 6 p.m., a minimum of 250 lux of mel-EDI (melanopic equivalent daylight illuminance) was considered, with a recommendation of the full daylight period on the user’s vertical field of view at the height of 1.20 m [63-66]. To evaluate discomfort due to glare, the maximum value of 1,500 lux of vertical illuminance was considered based on the studies of Karslen et al. [67] and Jain, Karmann, and Wienold [18].
M/P ratio represents the ratio between the melanopic and photopic illuminance produced by light sources of a given spectral power distribution [68,69]. Melanopic daylight efficacy ratio (mel-DER) is the ratio of a test source’s melanopic efficacy of luminous radiation to the melanopic efficacy of luminous radiation of CIE Standard Daylight D65. Melanopic DER is unitless, with the value 1 corresponding to the light source of D65 [45,70]. In the simulated room, mel-DER was calculated considering the two solstices and the two equinoxes from 8:00 a.m. to 6 p.m., totalizing 40 hours for each solar orientation, north, east, south, and west for each sensor, P1 to P9. The intention was to verify the melanopic efficacy of the light received in the sensors. The idea was to compare and categorize it among the common illuminants CIE Fluorescent FL 12 (3000 K), CIE Fluorescent FL 11 (4000 K), Standard Illuminant D55 (Daylight 5500 K), and CIE Standard Illuminant D65 (Daylight 6500 K), with the corresponding mel-DER to 0.404, 0.562, 0.904 and 1 respectively [45]. After the discussion of the assessment criteria for the simulations, the simulation workflow in Climate Studio and ALFA is presented in the following section.
2.4. Simulation workflow in Climate Studio and in ALFA
As discussed in section 1, electrochromic glazing is dynamic and can be controlled according to the variations of daylight, such as seasonal variations, sky conditions, the incidence of solar radiation, etc [5,7,17]. Therefore, it was necessary to create two workflows for the assessment of the performance of the evaluated electrochromic glazing regarding visual and non-visual effects. One was created for Climate Studio, and the other for ALFA.
In Climate Studio, the materials were configured as described in section 2.2, and the climate file containing the data for Brasilia was inserted to consider daily and seasonal variations in the sky [37]. The simulation workflow is illustrated in Fig. 9.
Figure 9
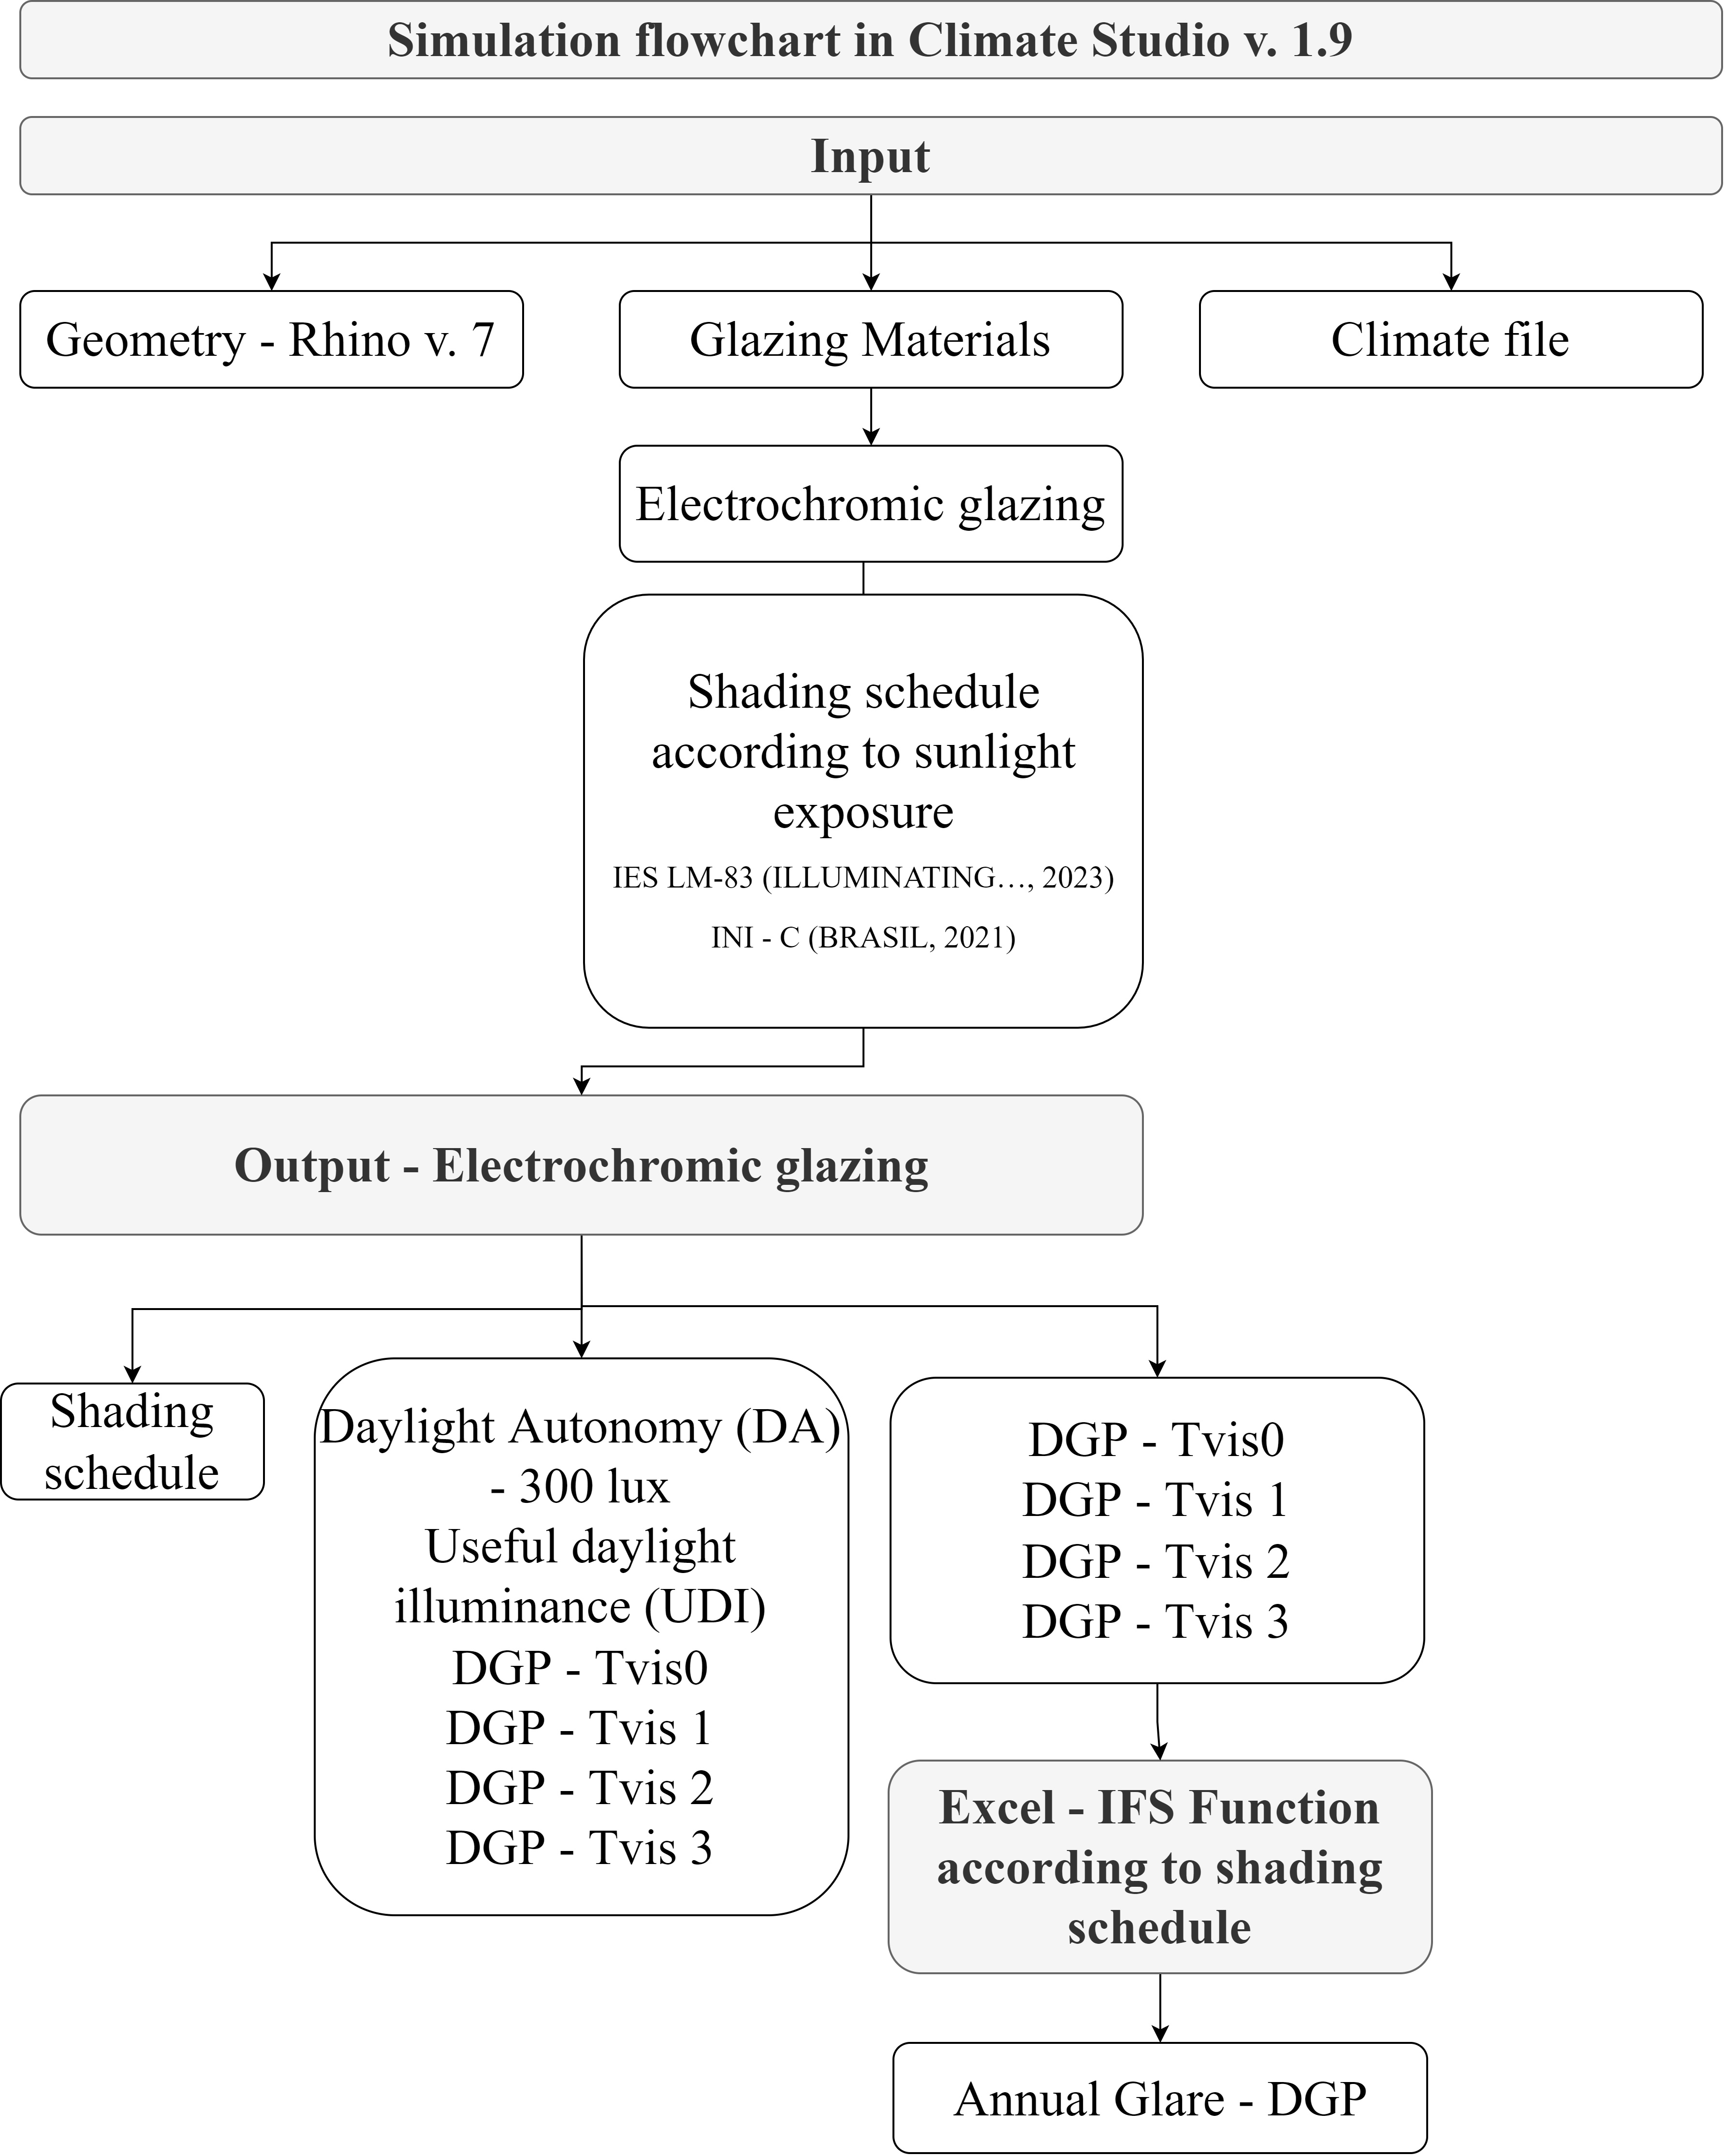
Fig. 9. Simulation flowchart in Climate Studio v 1.9.
The shading schedule of the electrochromic glazing was configured to limit direct sunlight on the horizontal plane. For each hour of the occupied period, between 8 a.m. and 6 p.m., if more than 2% of the horizontal grid area, analysis points receive direct sunlight, defined as more than 1,000 lux directly from solar disc, the transmitting window is instructed to lower the visible transmittance of the glass until either the sensors are brought below 1,000 lux or the glass unit is in its darkest state [58,59]. In Climate Studio, the schedule of blind or dynamic glazing is generated considering all 8,760 hours of the year in a 24-hour period per day [37].
As output, results of Spatial Daylight Autonomy and Useful Daylight Illuminance were obtained and exported to .csv file. The hourly shading schedule was also exported to a .cvs file and used to generate input data for the simulations of non-visual effects in ALFA. The Annual Glare was calculated for the four states of electrochromic glazing, one for each visual transmittance. Tvis 0, or “0”, corresponds to a visible transmittance of 62.1 % (clear state), Tvis1, or “1”, to 41% (light tint), Tvis2, or “2”, 5.4% (medium tint) and Tvis 3, or “3” to 1.1% (fully tinted) [9]. After that, values of Daylight Glare Probability of the four tint states were exported to .csv files and were associated with each corresponding hourly tint state of the electrochromic glazing using the IFS function in Excel. In that way, it was possible to calculate the Annual Glare for the simulated electrochromic glazing considering all four states. The results were analyzed for all nine sensors, as described in section 3.1.
One major limitation of ALFA is that the simulations are static. This means that for each hour, one sky condition, among clear, hazy, and overcast, and one tint state of the electrochromic glazing must be inputted to generate metrics of equivalent melanopic lux and M/P ratio, later converted to mel-EDI (lux) and mel-DER respectively [2,40,45,71].
Therefore, the procedures recommended by the International Energy Agency for the evaluation of daylight and electric light-integrated projects for point-in-time simulations were followed. In them, single measurements, in this case, simulations must ideally be as close as possible to a solstice or equinox [71]. The simulation input of Brasilia’s climate file corresponded to the year 2018 [38]. For this reason, four dates were defined, which were March 22, autumn equinox; June 21, winter solstice; September 22, spring equinox; and December 22, summer solstice.
For this reason, the data of the climate file was opened in Climate Consultant, v. 6.0 [49], filtered, and exported to .csv. To determine the sky condition for each hour, data on the sky cover was filtered for the four described dates between 8 a.m. and 6 p.m. Then, to determine the sky condition, from 0% (clear sky) to 100% (overcast), the recommendation of the Brazilian Standard ABNT NBR 15.215 – 2 was followed. In it, three sky conditions were considered: clear sky, for sky cover between 0% and 25%; intermediate sky, for sky cover of 25% and 75%; and overcast, for values between 75% and 100% [72].
Following that, the location of Brasilia (15° 7’ south/47° 9’ west) was inserted, and the same model described in section 2.2 was considered. To consider the dynamism of the electrochromic glazing, each state from Tvis 0 (clear) to Tvis 3 (dark tint) was inputted for each hour considering the generated shading schedule in Climate Studio. As output, values in units of equivalent melanopic lux (EML) were obtained for each hour, totalizing 1,440 results considering the nine analyzed sensors, as described in section 3.3. Data on vertical illuminance and the M/P ratio for each hour were also obtained. Figure 10 illustrates the simulation flowchart in ALFA v.0.6. Later the results of EML were converted to mel-EDI and M/P ratio to mel-DER.
Figure 10
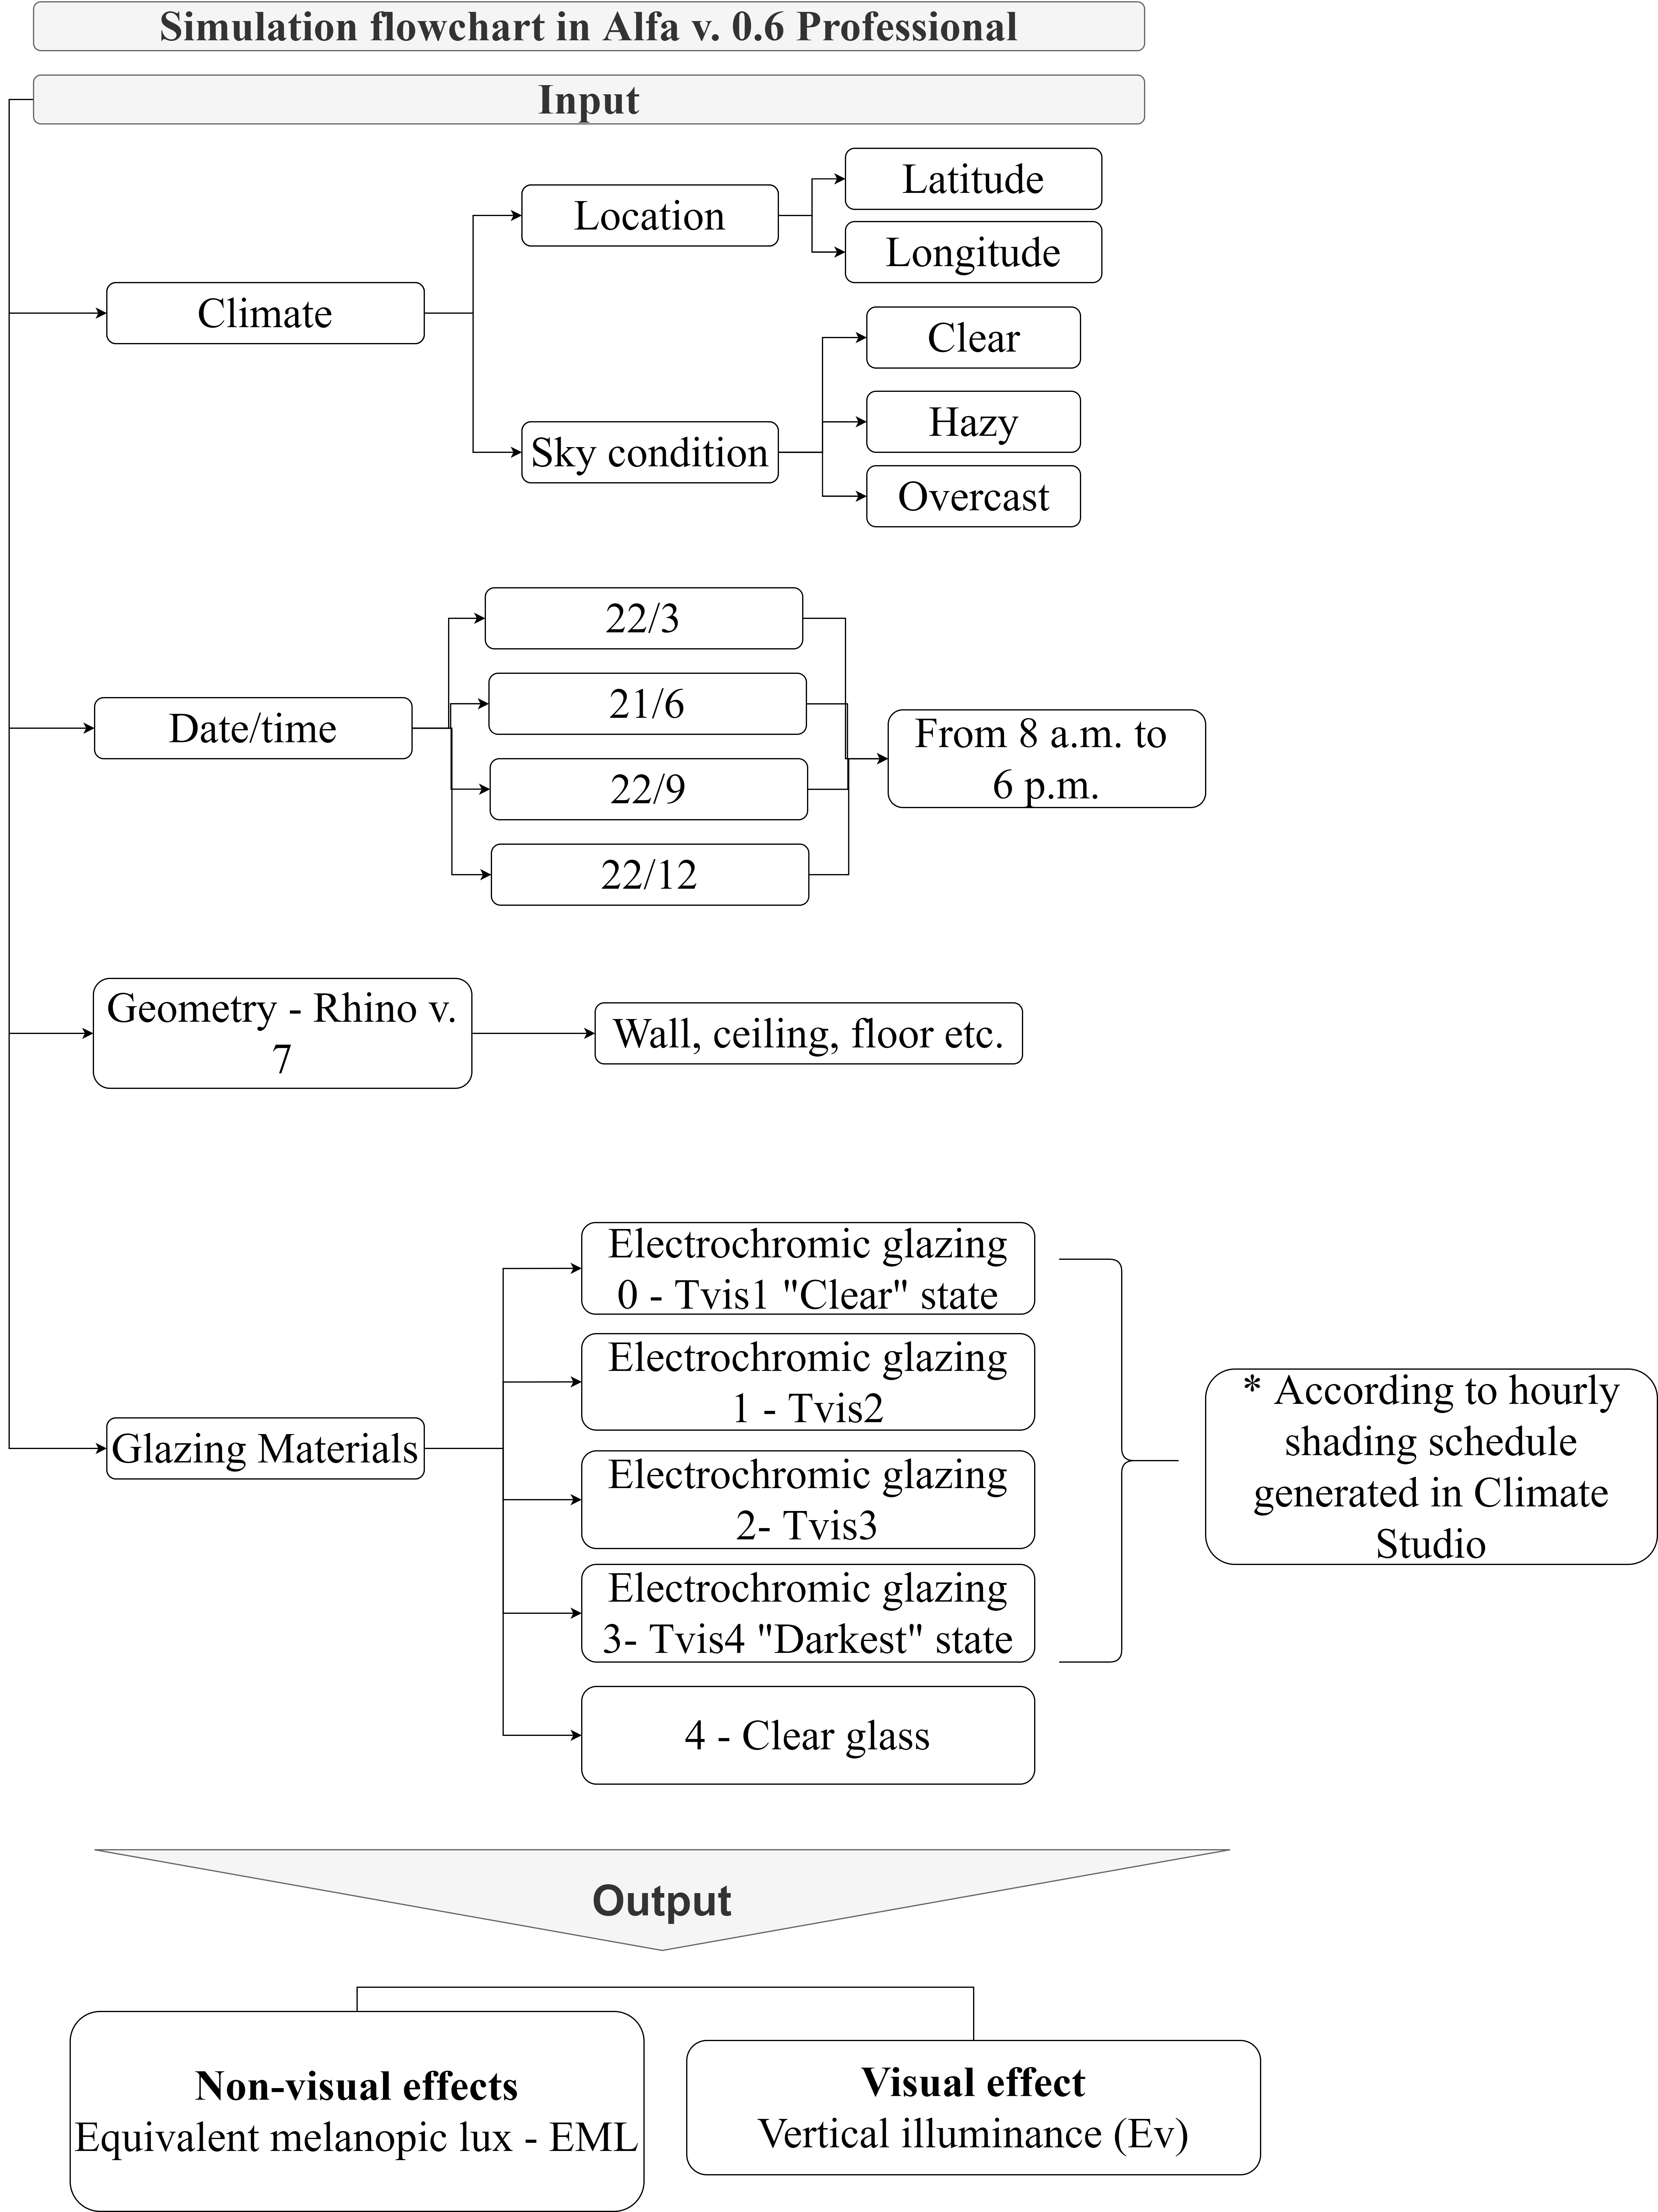
Fig. 10. Simulation flowchart in ALFA v. 0.6 Professional.
2.5. Statistical analysis
While the results of EML were generated in ALFA, it was noticed that within Zone A, B, and C, the results in the three points were similar. To verify if there was an equivalence of results of EML within zone A, P1 to P3, zone B, P4 to P6, and Zone C, P7 to P9, significance hypothesis tests were conducted. This is a more robust form of comparison than the direct comparison between the averages because it assures that the differences or equivalences are not random, as the averages come from distinct distributions.
Analysis of Variance (ANOVA) is a statistical technique used to determine if two averages from two or more populations are similar or not. The tested hypothesis is the equality between the averages. The adopted significance value – tolerated a margin of error of 5%, which supports the rejection of the null hypothesis. The difference between two or more averages is significant if the calculated Sig or P-value is below 0.05 (5%). Otherwise, if the P-value is equal to or above 0.05, the averages are considered statistically equivalent, even though the numerical results are not identical. These hypothesis tests were calculated using R Script [73]. As a result, it was possible to determine if there were equivalent results between the three points in each simulated zone, A, B, or C.
Techniques of descriptive statistics were used to report the results in ALFA, including the categorization and frequency counting. To facilitate the analysis by combining the minimum threshold of 250 lux of mel-EDI to a maximum vertical illuminance of 1,500 lux, a double classification was created, combining these two different parameters [74]. The idea was to associate both metrics with counting the frequency in which these thresholds were achieved, a minimum of circadian lighting with a maximum threshold for vertical illuminance. So, in effect, to count the frequencies, a binary classification was made between “yes” and “no” to verify if these both conditions were satisfied for each sensor, P1 to P9 for north, east, south, and west for each simulated hour. For each orientation, 360 values were counted considering the nine sensors (P1 to P9), four days (two solstices and two equinoxes), and ten hours (8 a.m. to 6 p.m.). It was possible to verify the frequencies in which there was a balance between a minimum of circadian lighting recommended without discomfort due to glare. Additionally, the results of mel-EDI and mel-DER were counted and classified according to the assessment criteria described in section 2.3. These frequencies were counted using R.
3. Results and discussion
As discussed in section 2.4, the shading schedule of the electrochromic glazing was generated using Climate Studio to limit direct exposure to sunlight, i.e., when more than 2% of the grid area receives at least 1,000 lux directly. The idea was to lower its visible transmittance to control the incidence of direct sun on the horizontal sensor grid. The schedules were generated considering all 8,760 hours of the year. The results of the shading schedules of the four solar orientations are illustrated in Fig. 11.
Figure 11
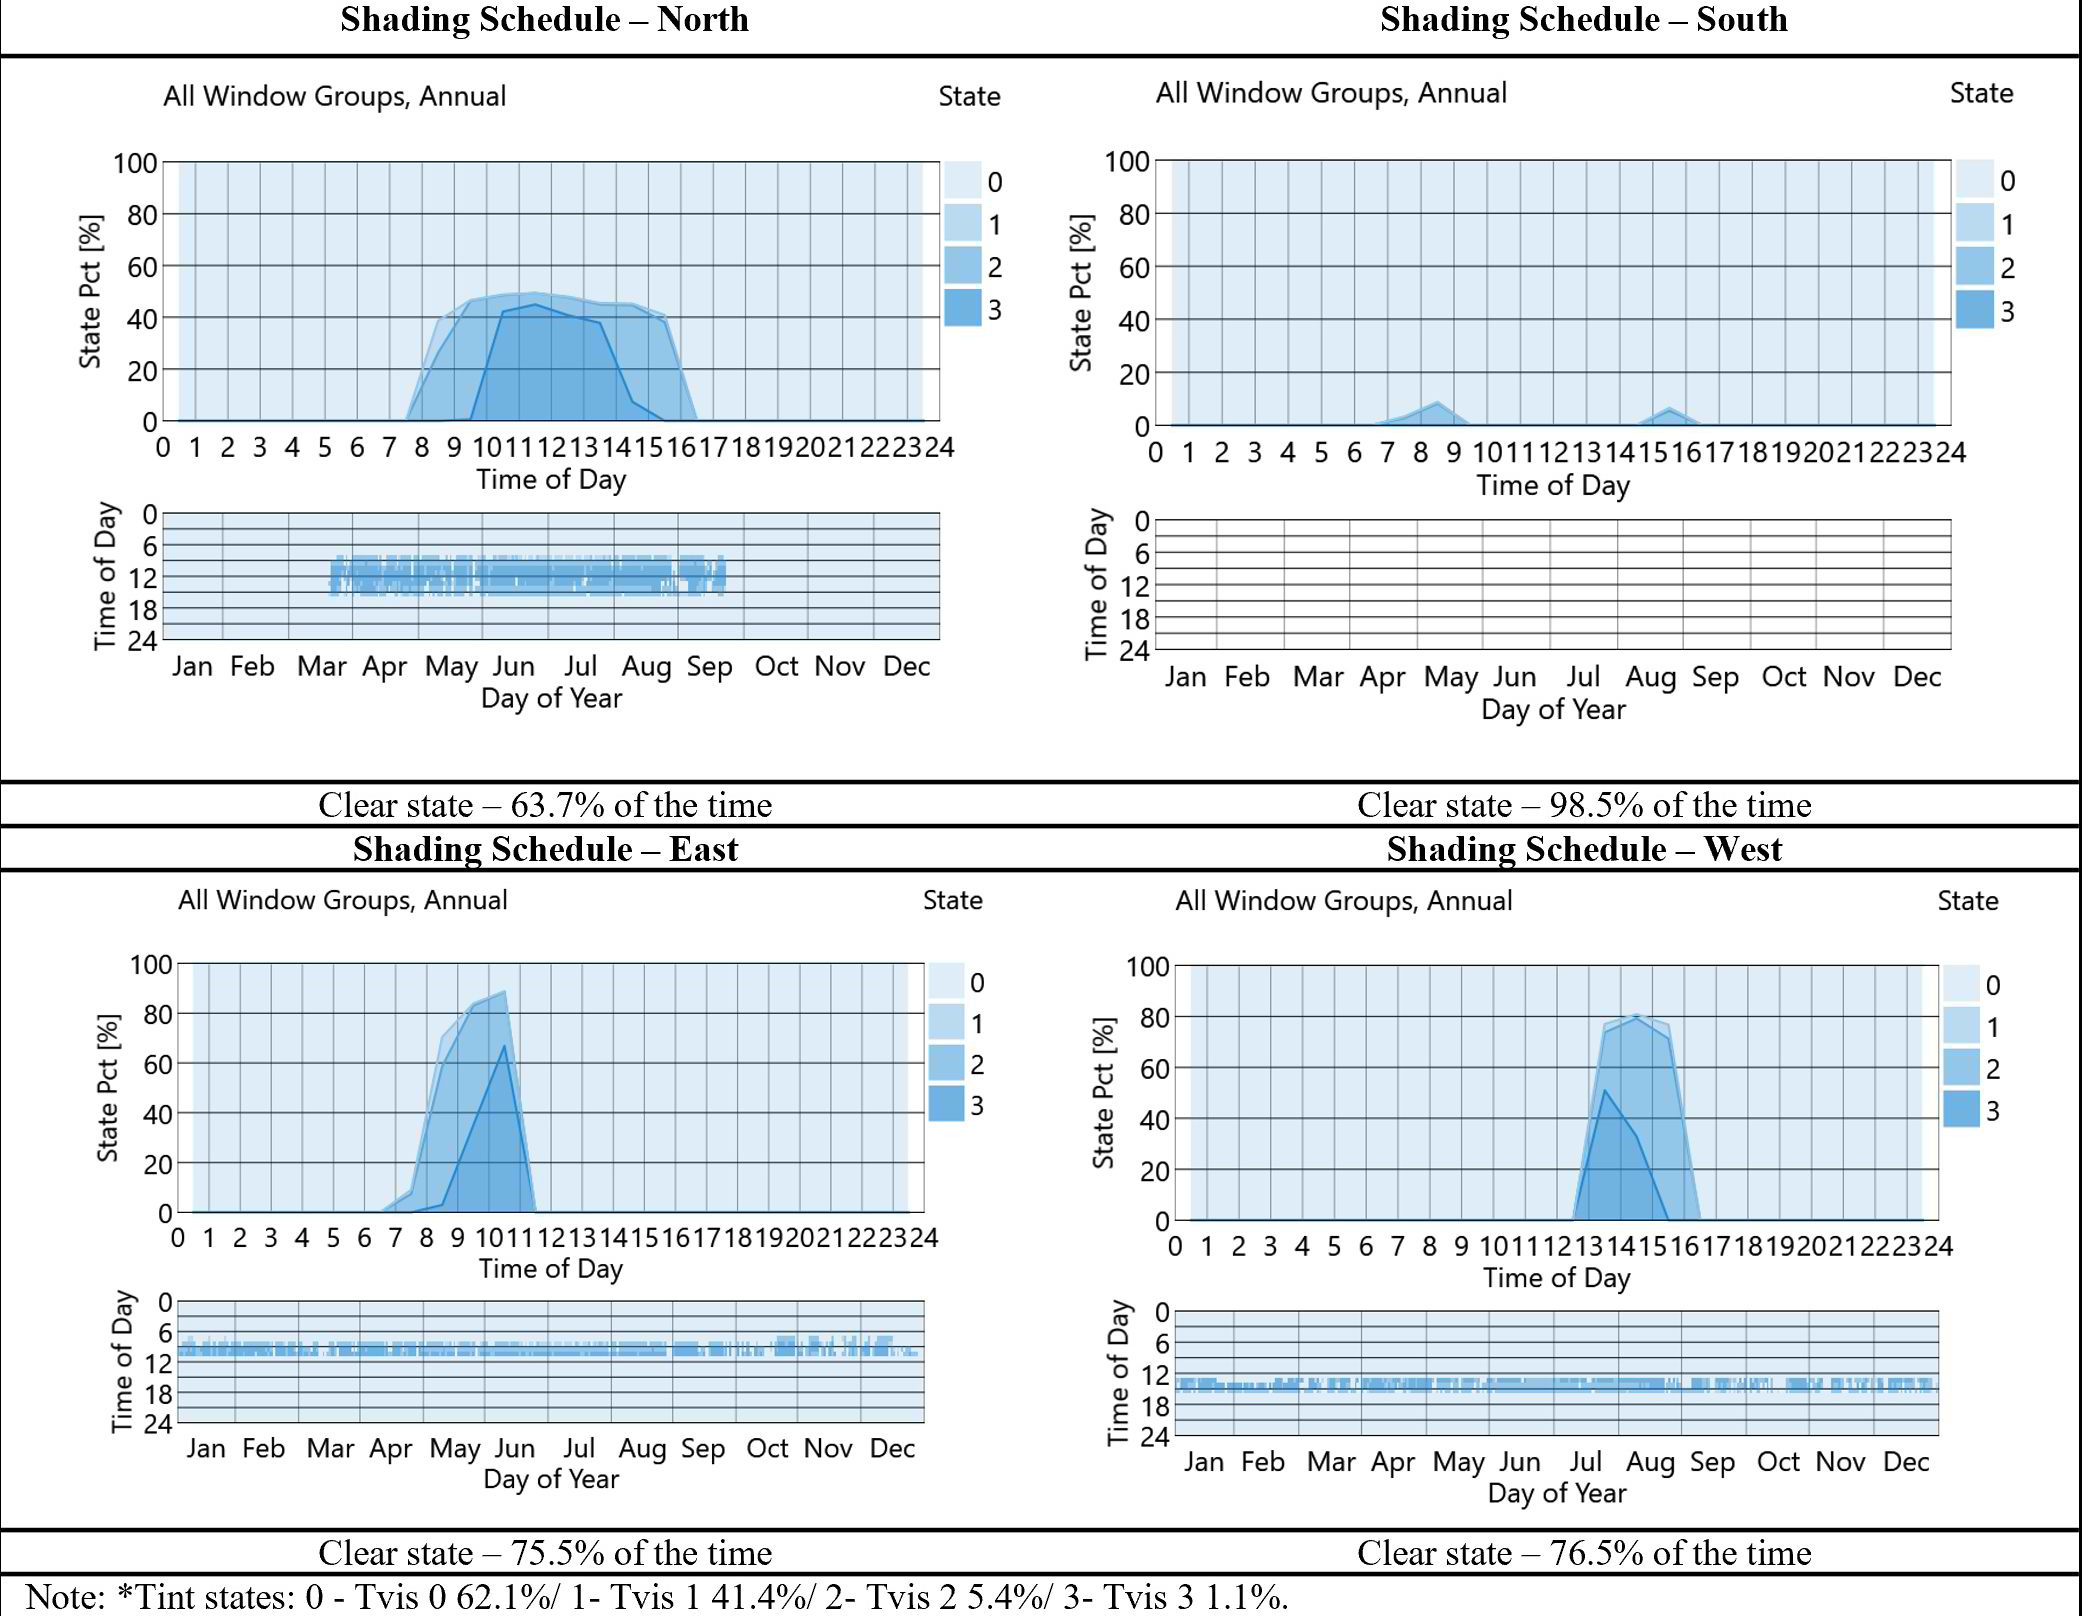
Fig. 11. Results for shading schedule for each solar orientation (Climate Studio). * Note: *0 – Tint states: Tvis 0 62.1%/ 1- Tvis 1 41.4%/ 2- Tvis 2 5.4%/ 3- Tvis 3 1.1%.
When the electrochromic glazing (EC glazing) was faced to the north, the visible transmittance tint state was set to reduce from March to September from 8 a.m. to 4:30 p.m. From 9:30 a.m. until 3 p.m., the EC glazing remained in the “fully tinted” state, with visible transmittance of 1.1%. From the middle of September until the middle of March, the electrochromic glazing was in clear state almost all of the time during spring and summer.
When facing south, the electrochromic glazing was found in the clear state, state 0, in almost all 8,760 hours of the year, since there was not much incidence of direct solar radiation in most part of the year. Facing east, the electrochromic glazing was set in lower tint states, mostly between 8 a.m. and 11:30 a.m. From 8 a.m. until 11:30 a.m., it was set in state 3, with visible transmittance of 1.1% from January to December. On the other hand, when faced west, the electrochromic glazing was set in a full tint state from 12:30 p.m. until 3:30 p.m. and with medium tint state, with visible transmittance of 5.4% from 3:30 p.m. until 4:30 p.m. from January to December.
3.1. Simulations of visual effects of light in Climate Studio
Daylight autonomy of 300 lux in all sensors was above 50% in all four orientations: north, south, east, and west, as illustrated in Fig. 12. This meant that all sensors complied with the spatial daylight autonomy parameters, which were at least 300 lux in 50% between 8 a.m. and 6 p.m. This compliance is applied to the electrochromic glazing and the clear glass.
Figure 12
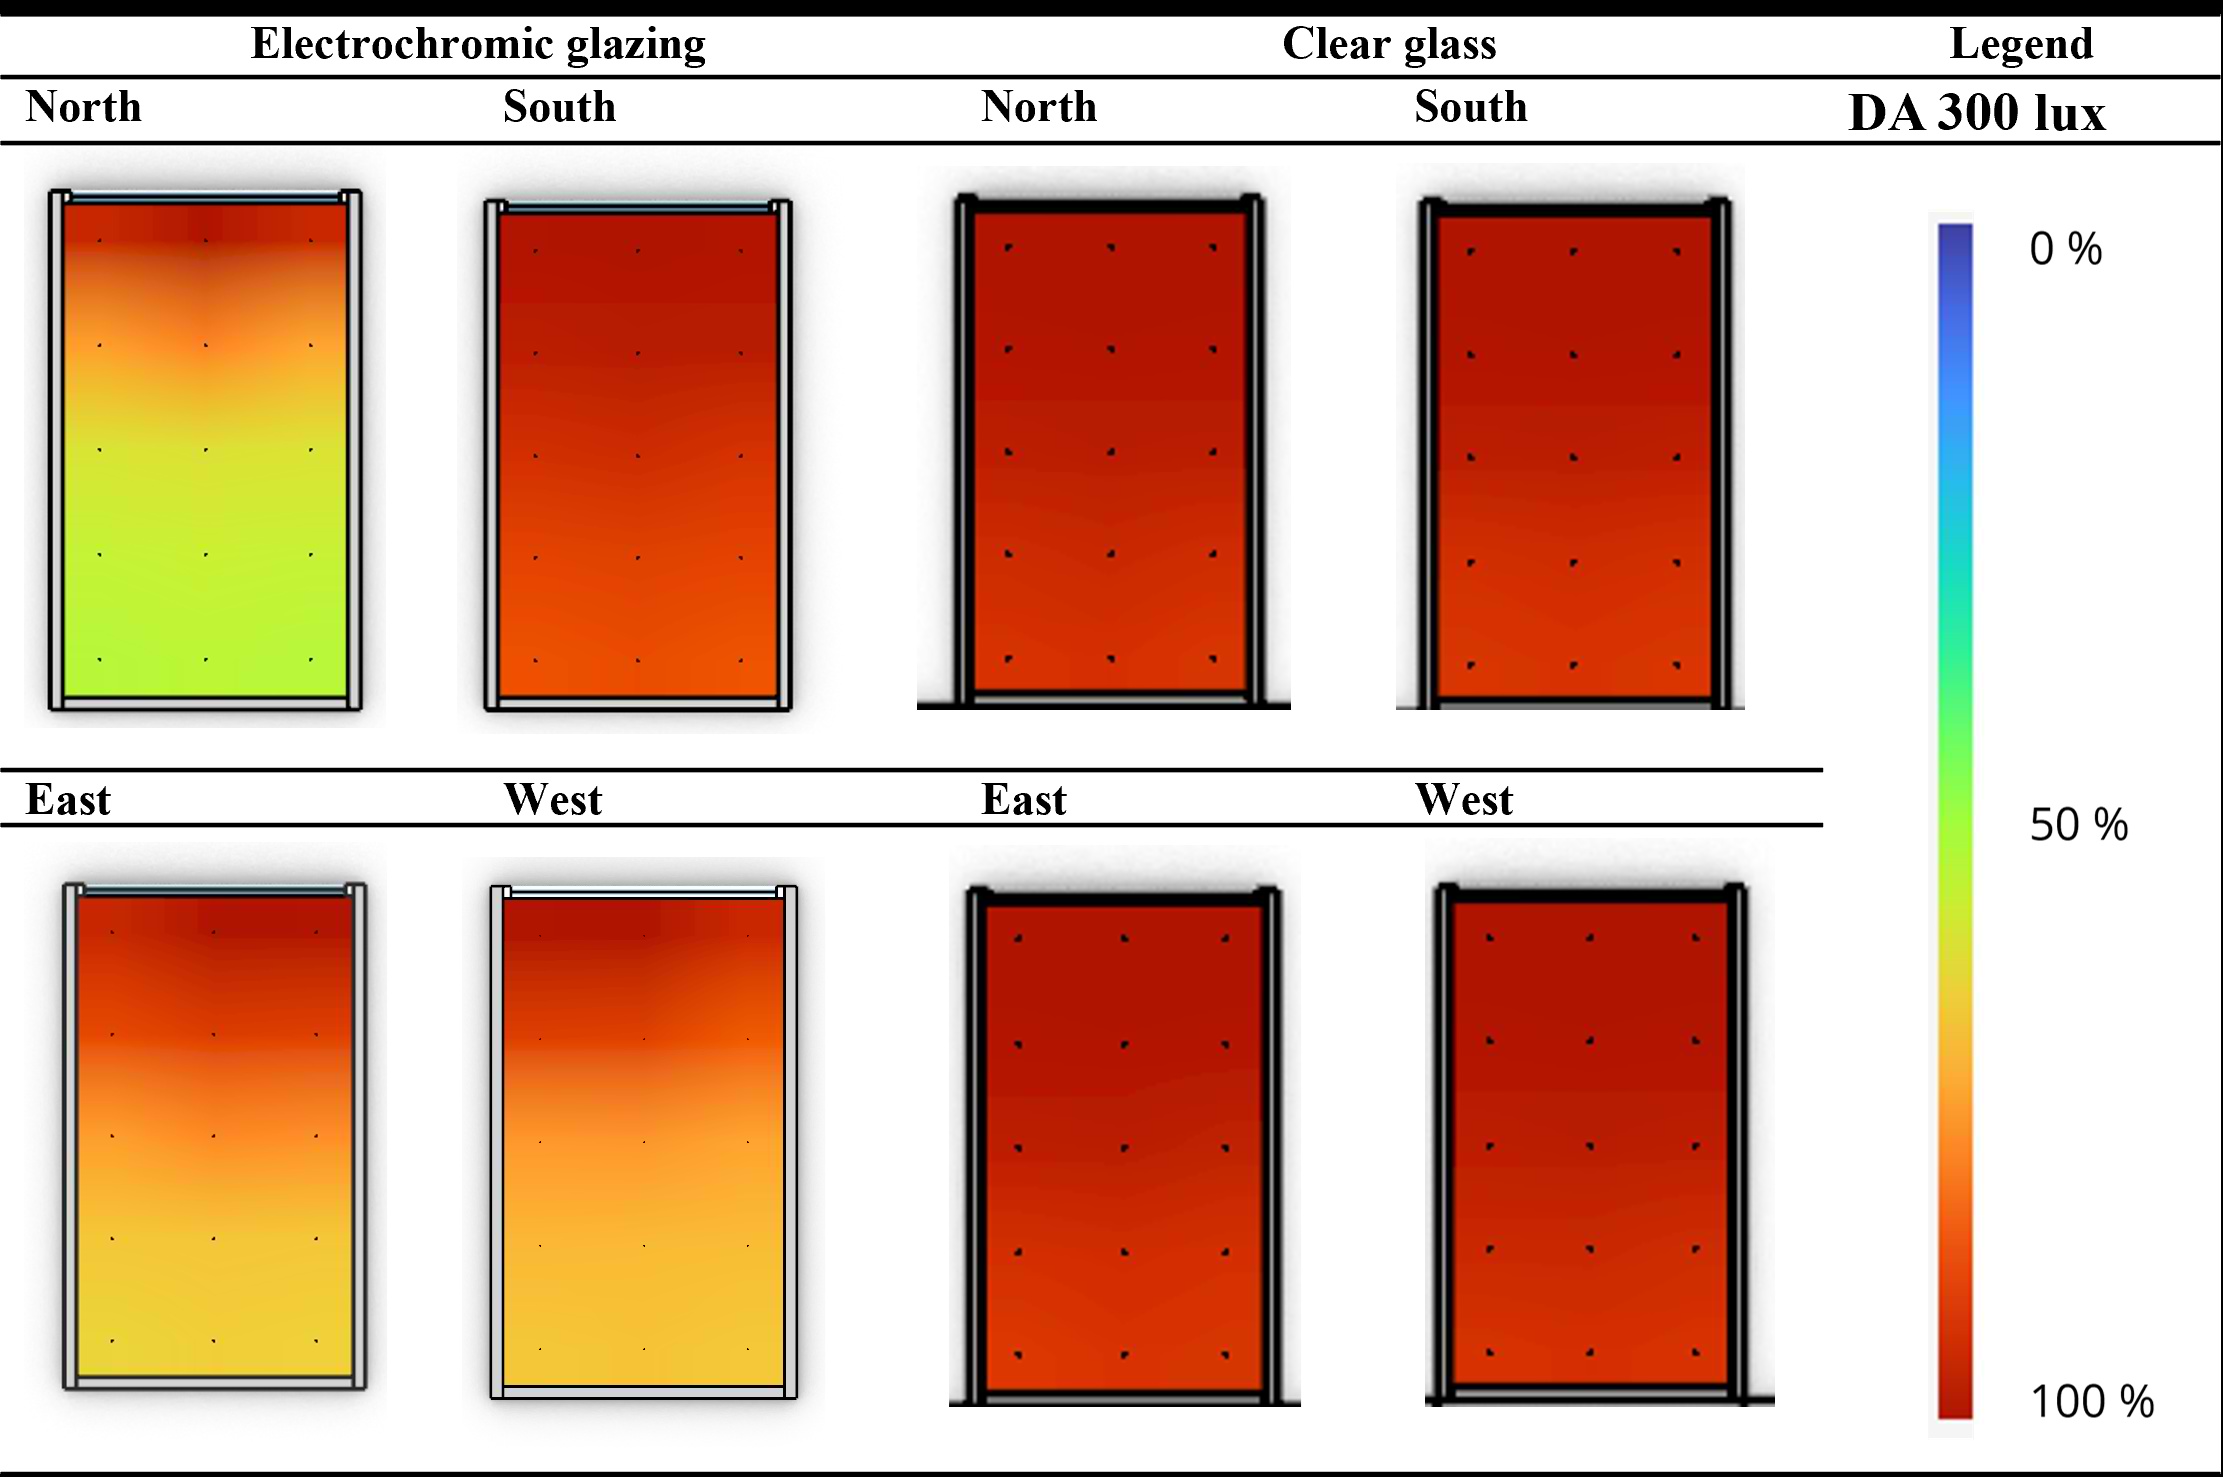
Fig. 12. Results for Daylight Autonomy of 300 lux according to solar orientation (Climate Studio) from 8 a.m. and 6 p.m.
Results of useful daylight illuminance (UDI) for the electrochromic glazing were displayed for the middle sensor per zone. In zone A, close to the window, at a distance of 0.50 m, the illuminance levels were within the UDI 100-3000 lux, facing east in 45% of the time and west in 40%, facing south in 23% and north, in 50%. In Zone B, the UDI values were 81% or more. In Zone C, the results of UDI were above 72% of the time during the day facing all solar orientations. The results are shown in Fig. 13.
Figure 13
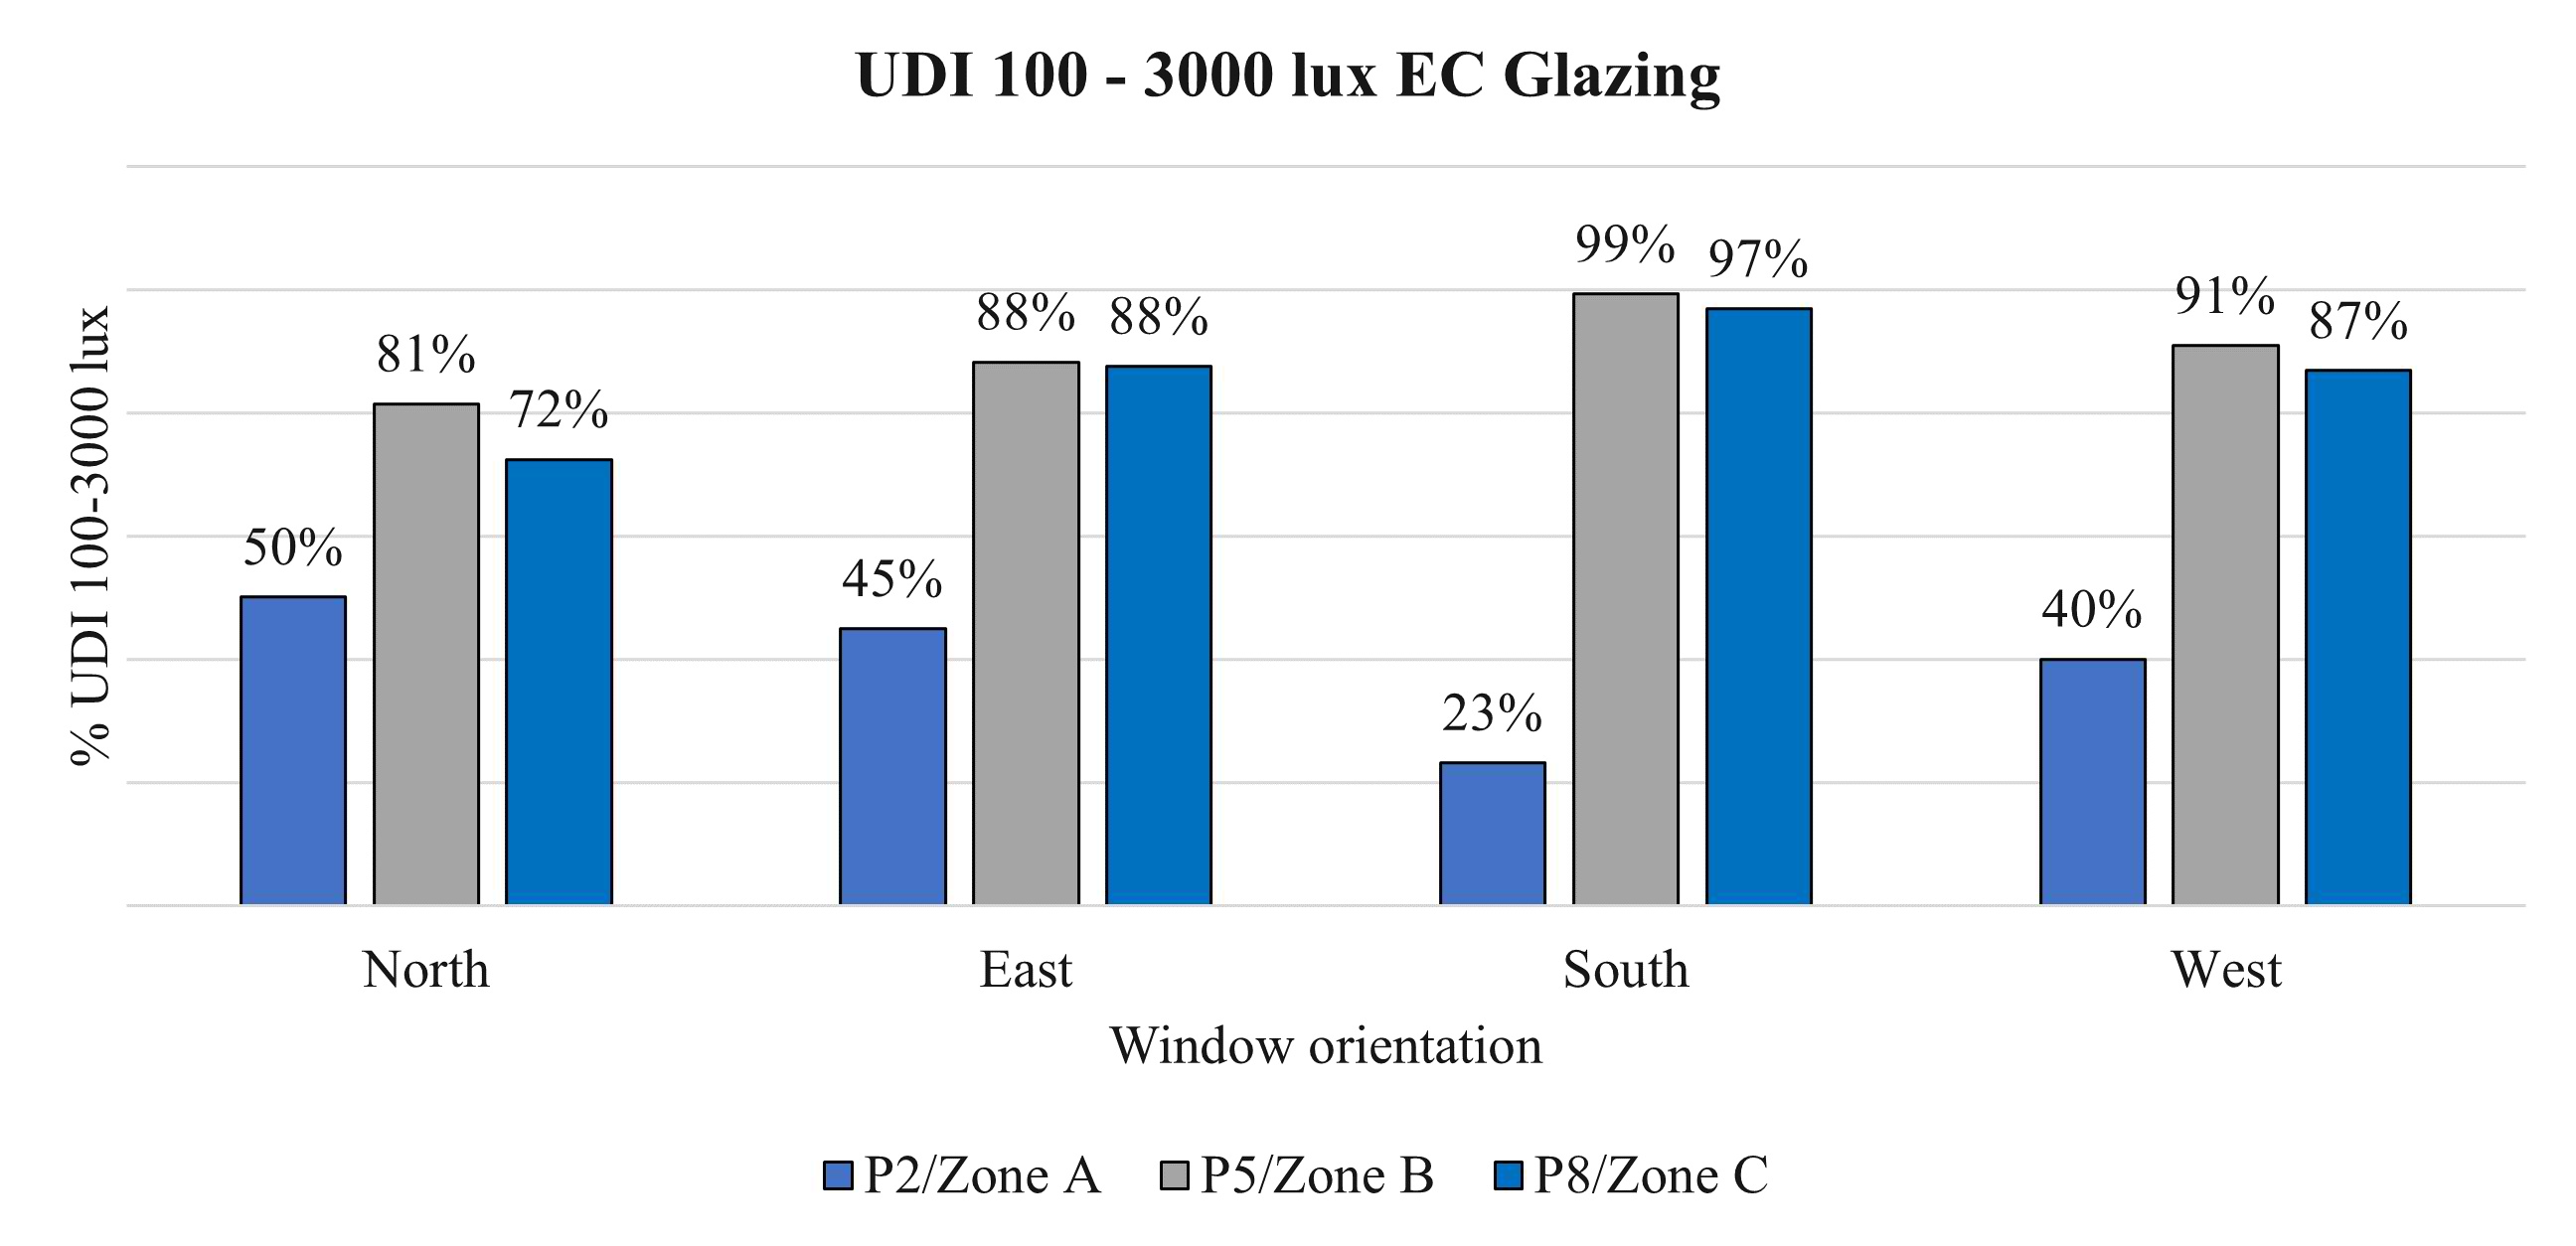
Fig. 13. Results for the electrochromic glazing of the useful daylight illuminance (UDI) between 100 and 3,000 lux in the three zones between 8 a.m. and 6 p.m.
Results of useful daylight illuminance (UDI) for the clear glass were displayed for the middle sensor per zone, and significant differences in the results were found, as seen in Fig. 14. In zone A, close to the window, at a distance of 0.50 m, the illuminance levels were within the UDI 100-3000 lux facing east in 12% of the time and west in 10%, facing south in 11%, and north in 10%. In Zone B, the UDI values were 64% or more. In Zone C, the results of UDI were above 95% of the time during the day facing all solar orientations. In general, in all orientations, the electrochromic glazing performed better in relation to UDI levels, particularly in zone A, close to the window. For south, the reduction of UDI was 11%, north 40%, east 33%, and west 30%.
Figure 14
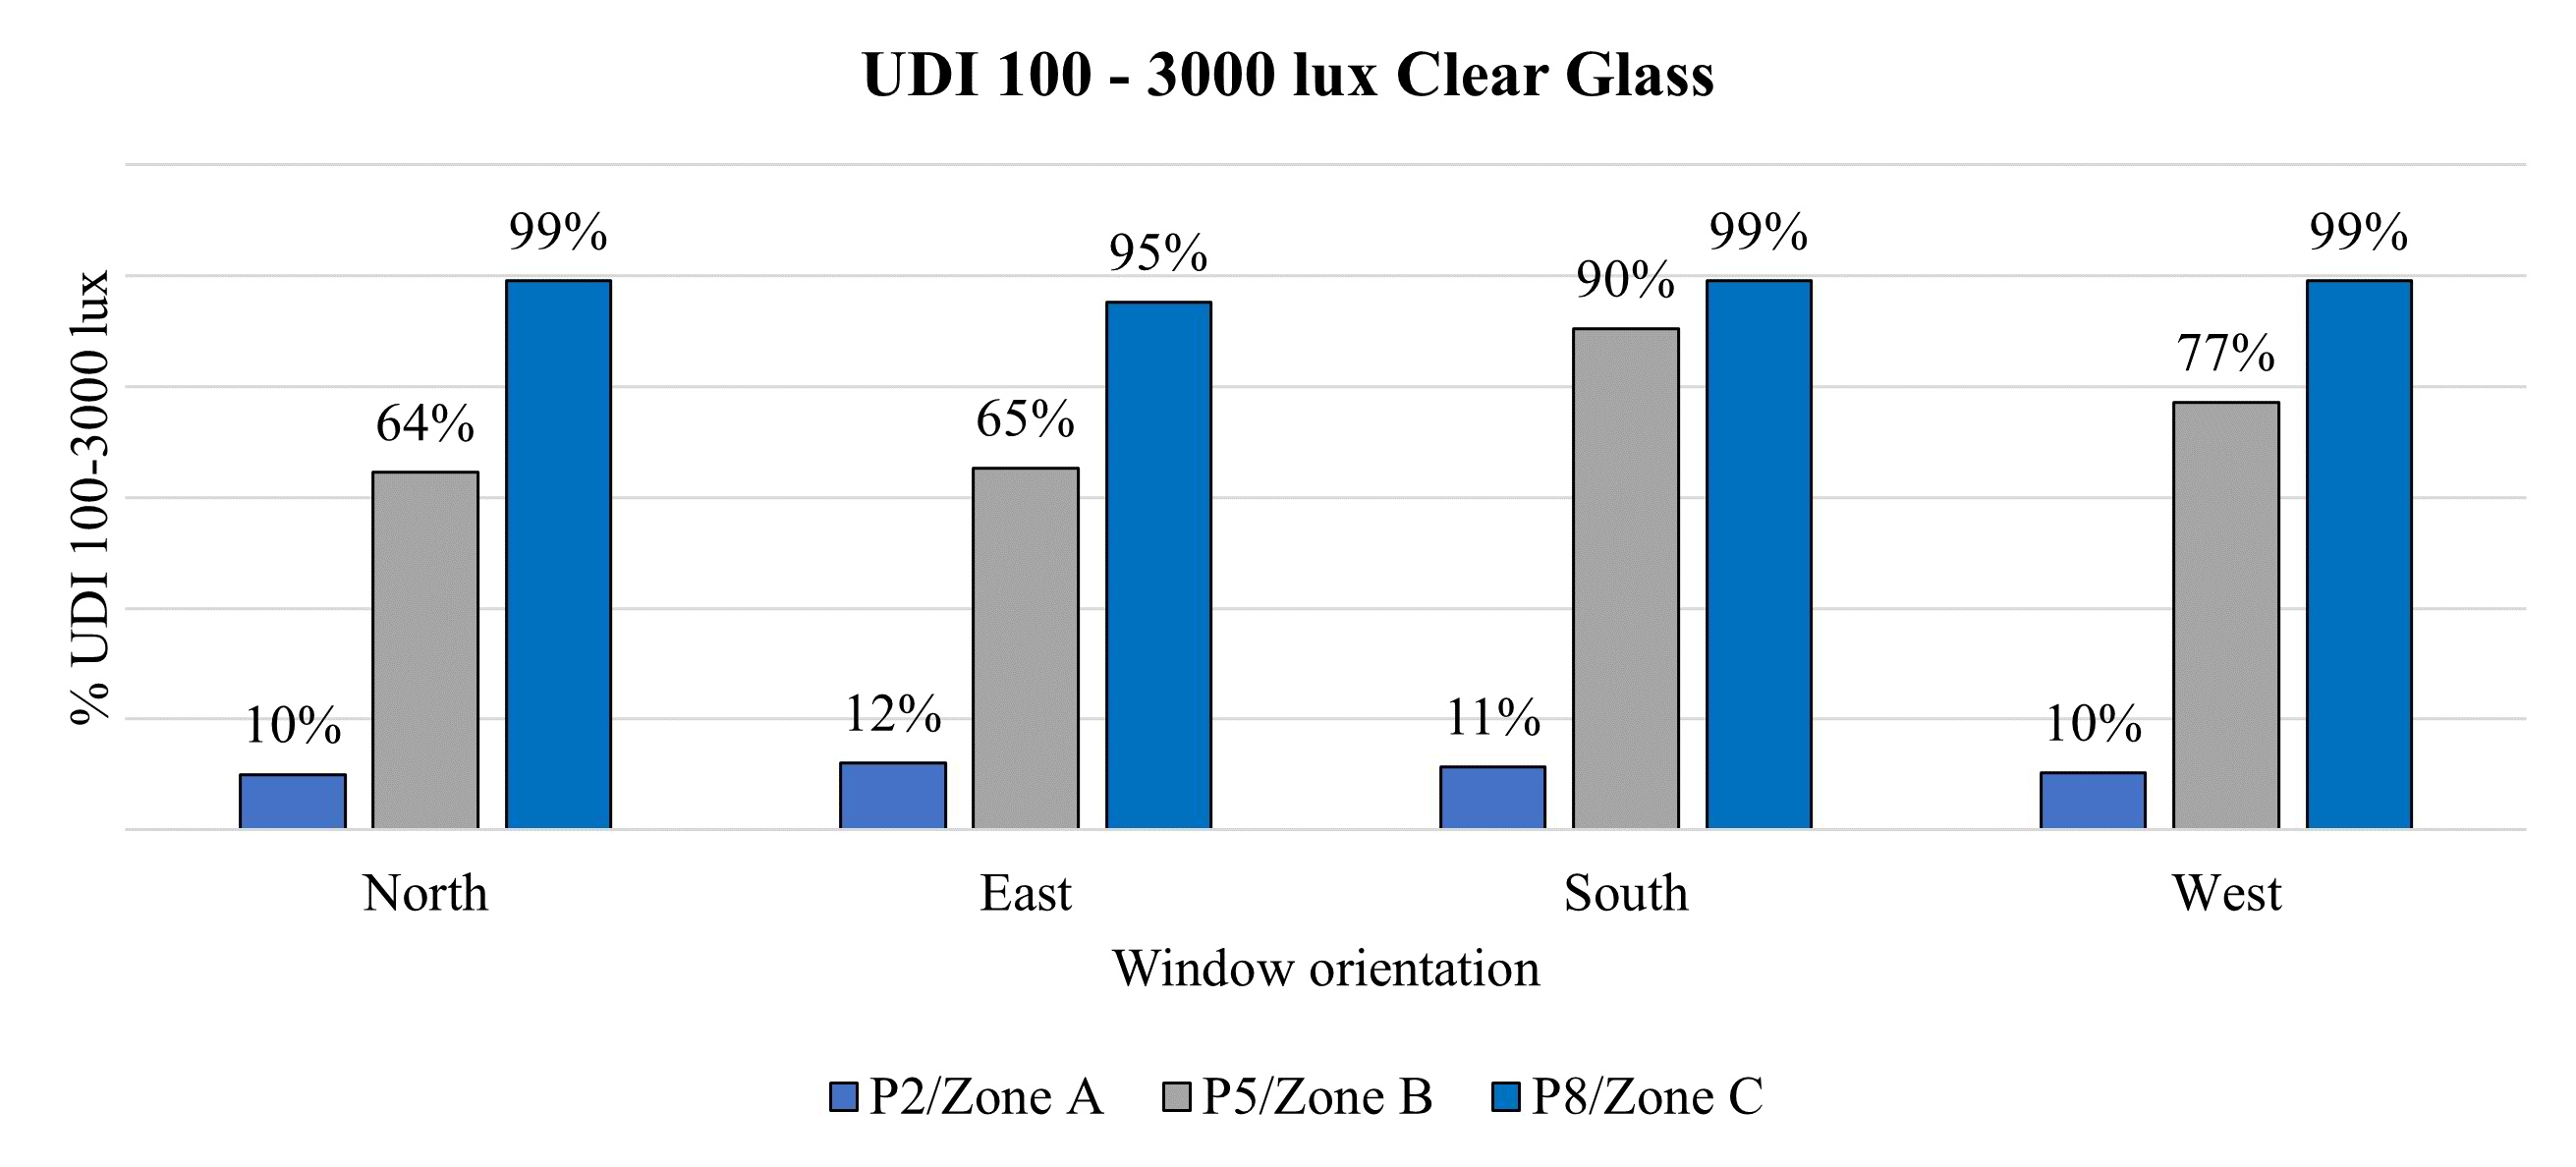
Fig. 14. Results for the clear glass of the useful daylight illuminance (UDI) between 100 and 3,000 lux in the three zones between 8 a.m. and 6 p.m.
The results of daylight glare probability for the electrochromic glazing presented variations according to the distance of the sensor from the window. Close to the window, at a distance of 0.50 m in Zone A, intolerable glare was found in 47% of the time when the model was facing north. To south, intolerable glare was present 72% of the time, and to the west 56% of the time. When the simulation model was facing south, the electrochromic glazing remained in the clear state in 98.5% of the time, and that was one of the possible reasons for a significant increase in hours of intolerable glare in relation to the same position of the sensors considering the three other orientations.
As the distance of the window increased to 2.5 m from zone B for north, east, and west, imperceptible glare was present for more than 70% of the hours during the day and for the south in 63% of the hours. In zone C, 5.5 m distant from the window, glare was imperceptible during all simulated hours. The results of annual glare (DGP) for the electrochromic glazing are presented in Fig. 15.
Figure 15
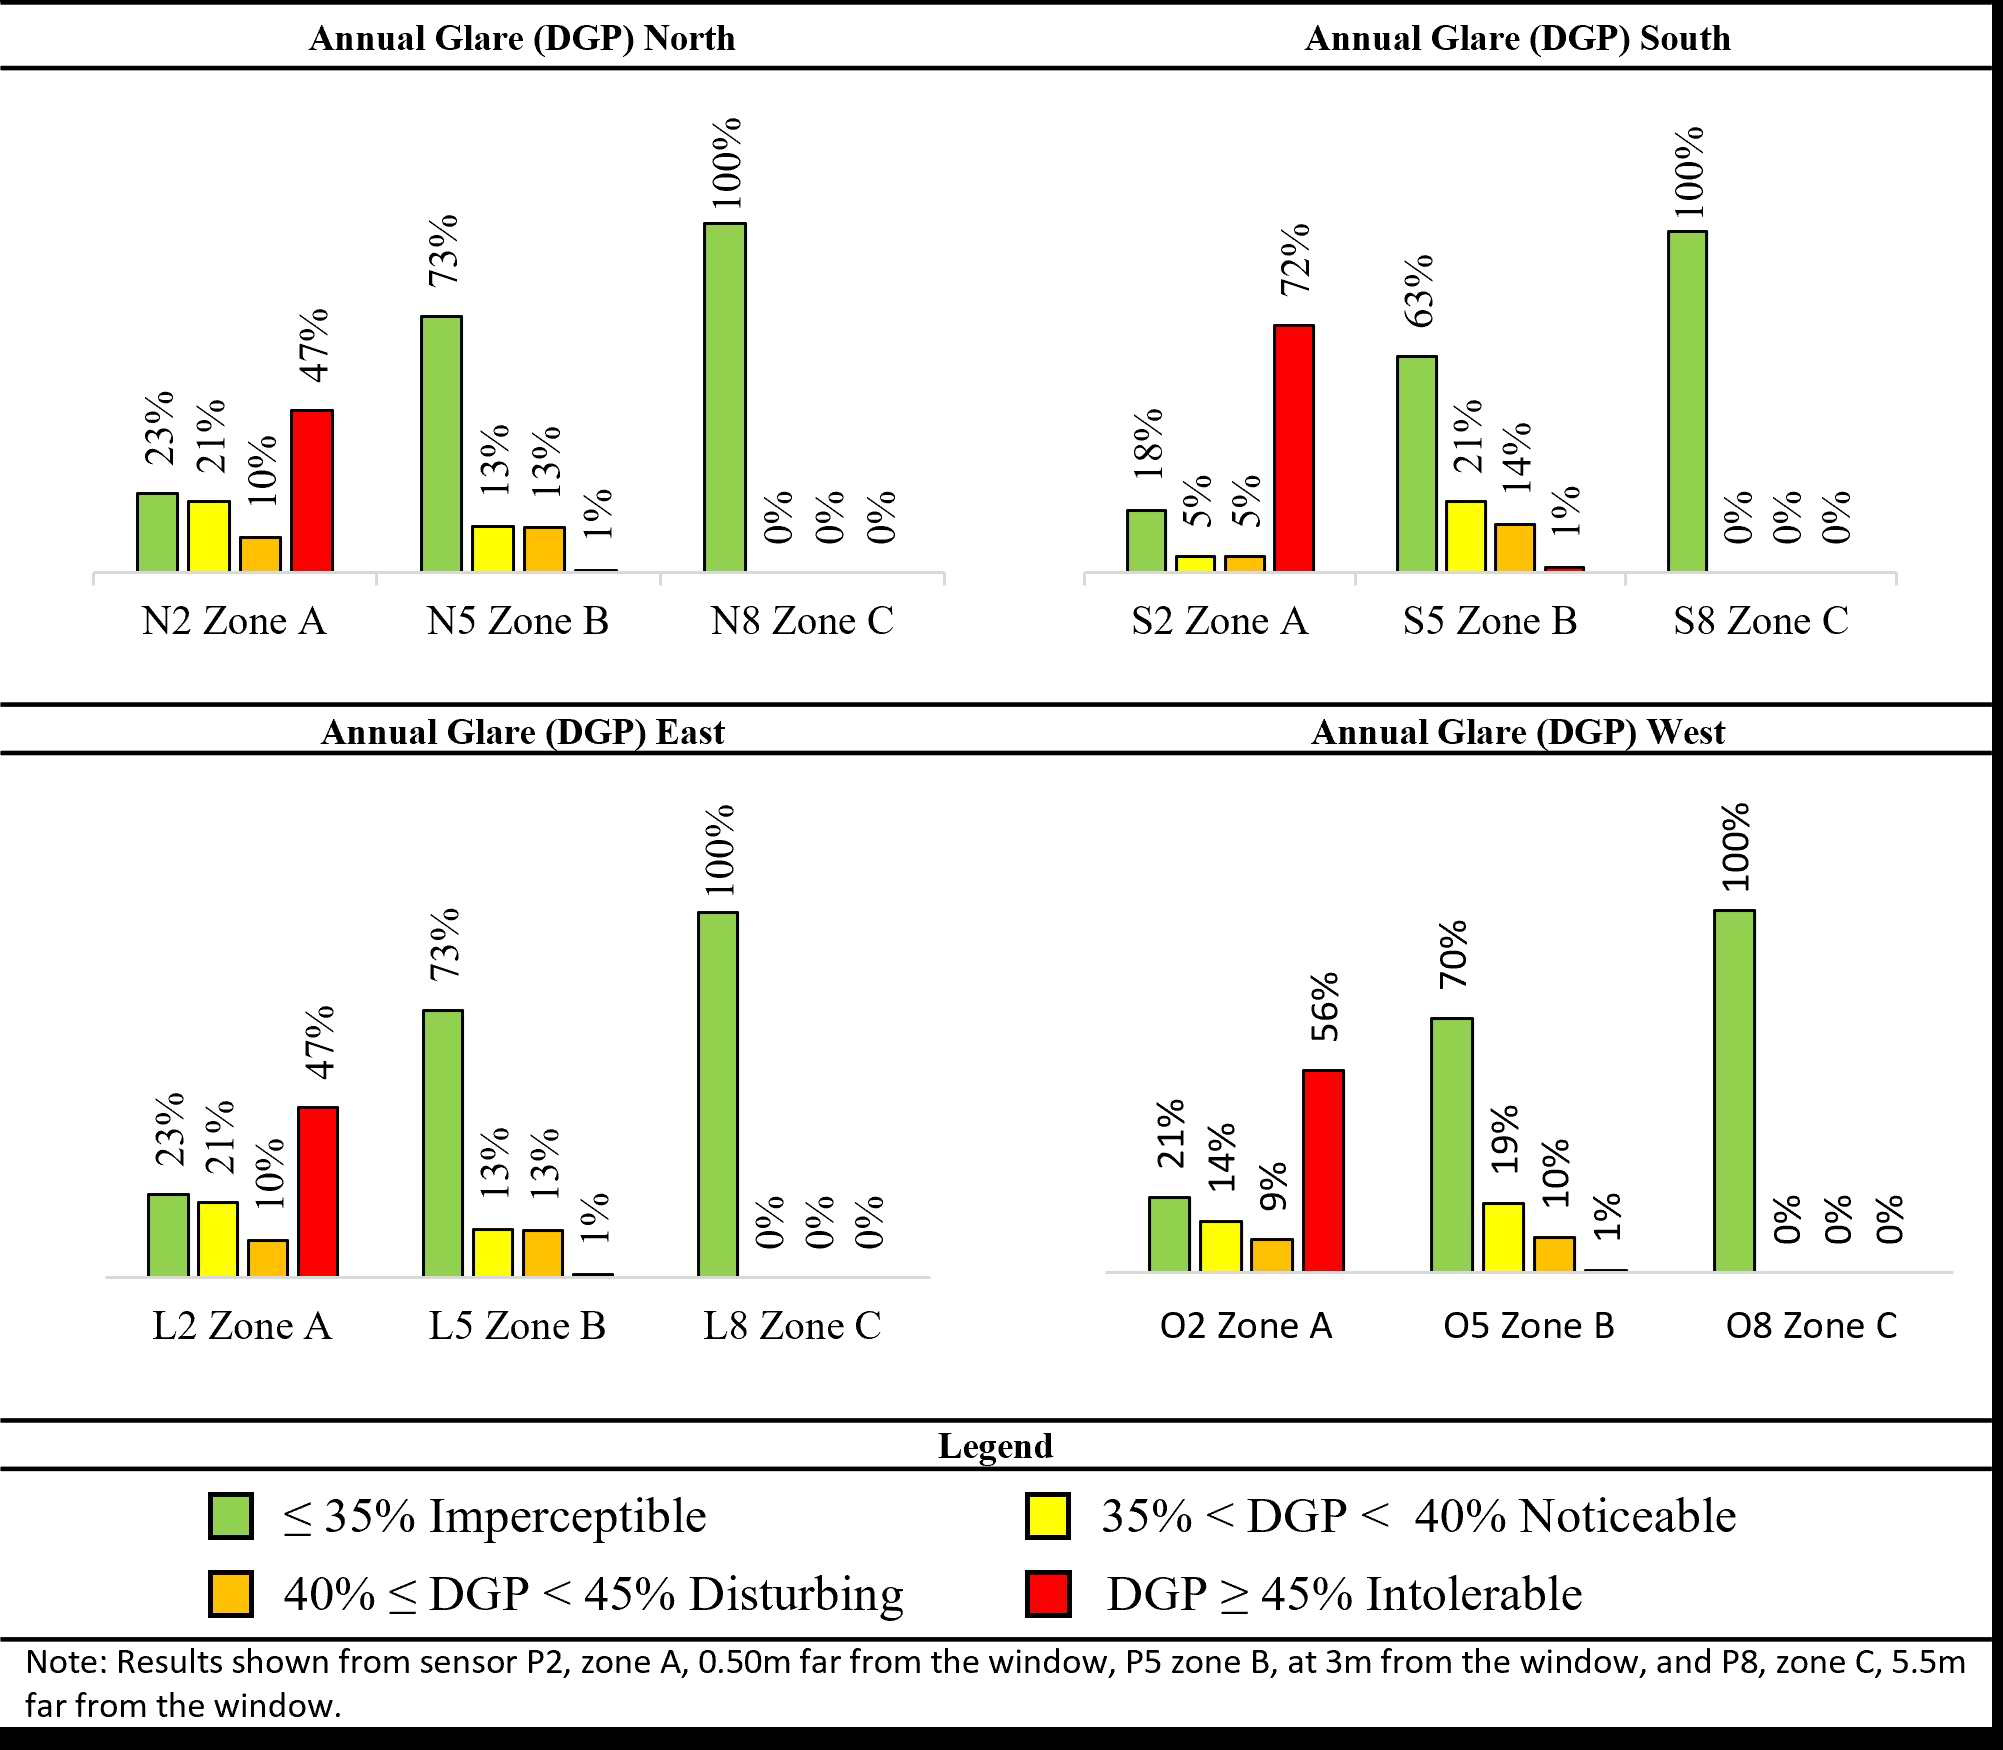
Fig. 15. Annual glare (DGP) for the electrochromic glazing according to solar orientation between 7:30 a.m. and 5:30 p.m.
Results of annual glare for the clear glass indicated that daylight glare probability was mitigated by electrochromic glazing. The results of annual glare for the clear glass are illustrated in Fig. 16. In zone A, intolerable glare was far worse than the results of intolerable glare with clear glass, and it was present in at least 87% of the simulated hours in all four orientations. In zone B, intolerable glare was present in at least 50% of the simulated hours for the north, east, and west and for the south in 31% of them. In the same zone, B, imperceptible glare was only observed in approximately 19% to 23% of the hours for north, east, and west and for south in 29% of the time. In zone C, imperceptible glare was observed in at least 73% of the hours, and intolerable glare was present in 6% of the time for the east.
Figure 16
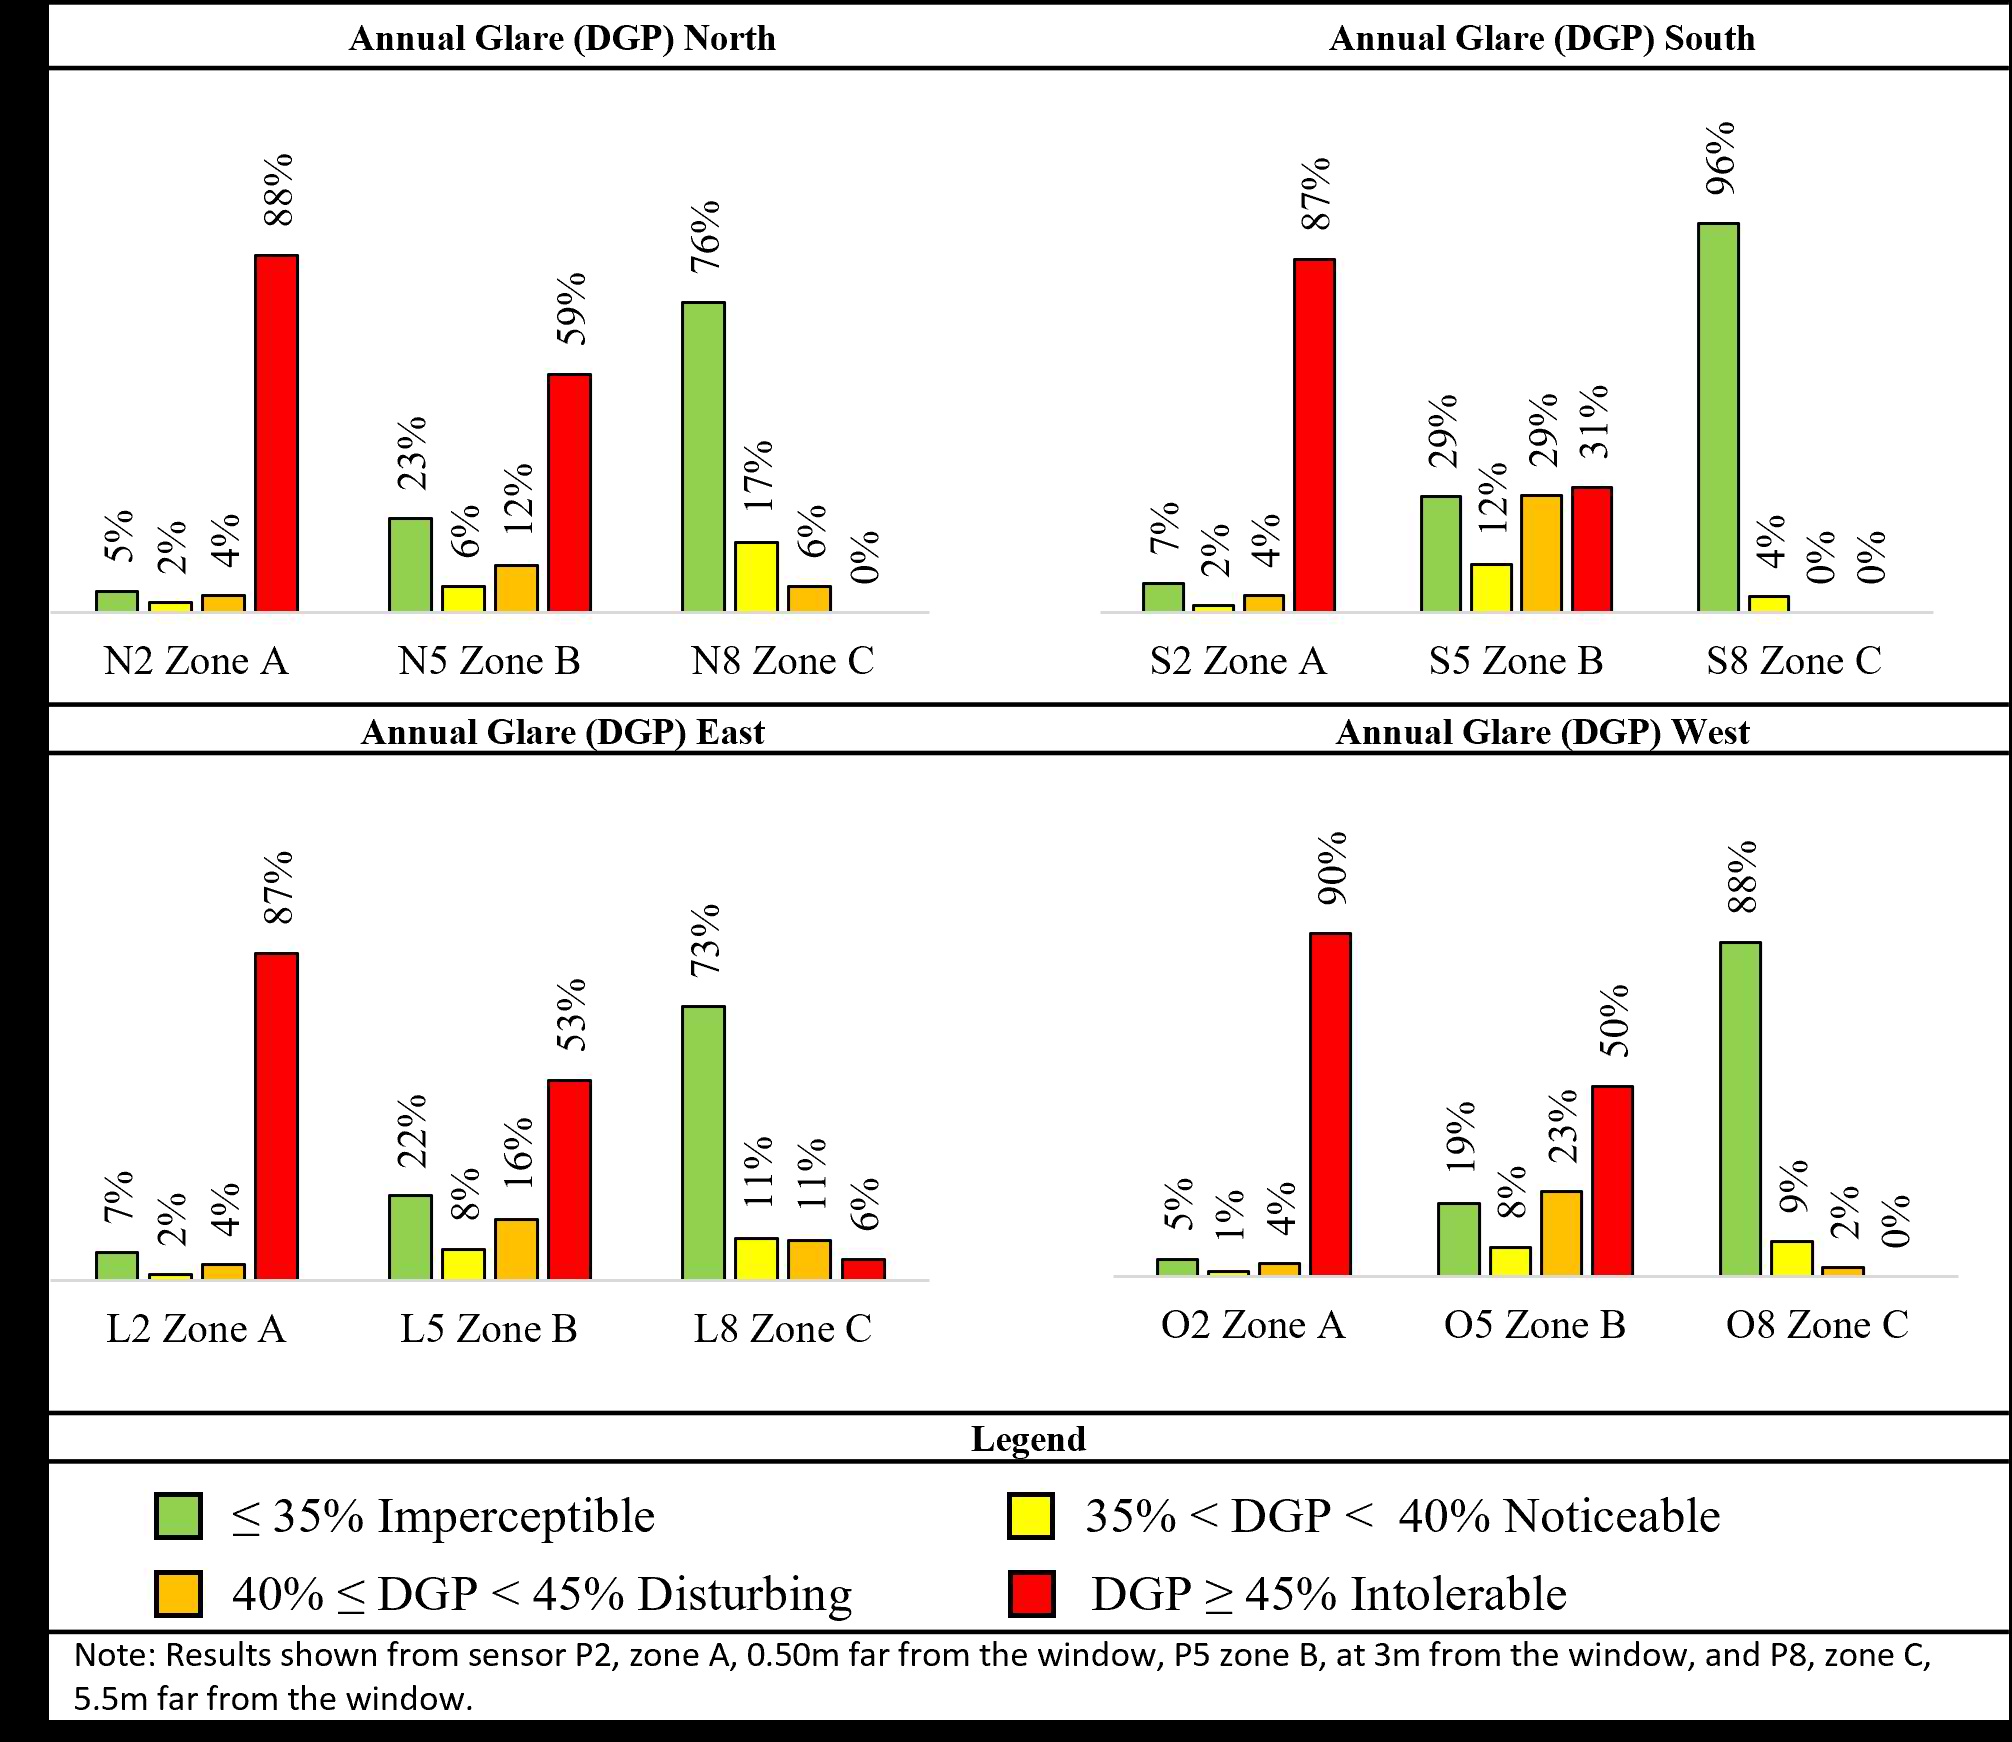
Fig. 16. Annual glare (DGP) for the clear glass according to solar orientation between 7:30 a.m. and 5:30 p.m.
According to the results of DGP, the worst situations were when the sensors were close to the window, at a distance of 0.50 m for both window materials. The shading schedule generated for the electrochromic glazing, avoiding direct sun, prevented problems related to glare for the east, west, and north, but this solution was less effective for the south. The results of DGP indicated significant improvements provided by the electrochromic glazing when compared to the clear glass, specifically in zones A and B. In zone A, close to the window, intolerable glare was reduced from 88% to 47% for the north, 87% to 72% for the south, 87% to 47% for the east, and from 90% to 56% for the west. In zone B, improvements were observed as well, particularly for intolerable glare. With the electrochromic glazing, zone B intolerable glare was not a problem in all four orientations, whereas it was with clear glass in at least 50% of the simulated hours for east, west, and north and 31% for the south.
3.2. Simulations in ALFA: equivalence of the nine sensor grids within Zones A, B, and C
Since the results of equivalent melanopic lux generated in ALFA were similar among zones A, B, and C, the averages were compared to see if they were statistically equivalent or not, considering a tolerated margin of error of 5%. ANOVA was used regarding the four solar orientations. They were converted to melanopic equivalent daylight illuminance (mel-EDI), as mentioned in section 2.
Within zone A, 0.50 m far from the window, the averages of units of mel-EDI were between 2,579.5 lux and 8,599.2 lux. The grid sensors P1, P2, and P3 in zone A were only equivalent in the east, north, and west, with P-values above 21.6%. However, to the south, the results of mel-EDI from sensors P1, P2, and P3 were not equivalent. Within zone B, P4, P5, and P6 were equivalent regarding all four solar orientations, with P-values equal to or above 41.3%. The same equivalence occurred within zone C, with sensors P7, P8, and P9, with p-values equal to or above 62.8%. The equivalence tests are displayed in Table 3.
Table 3
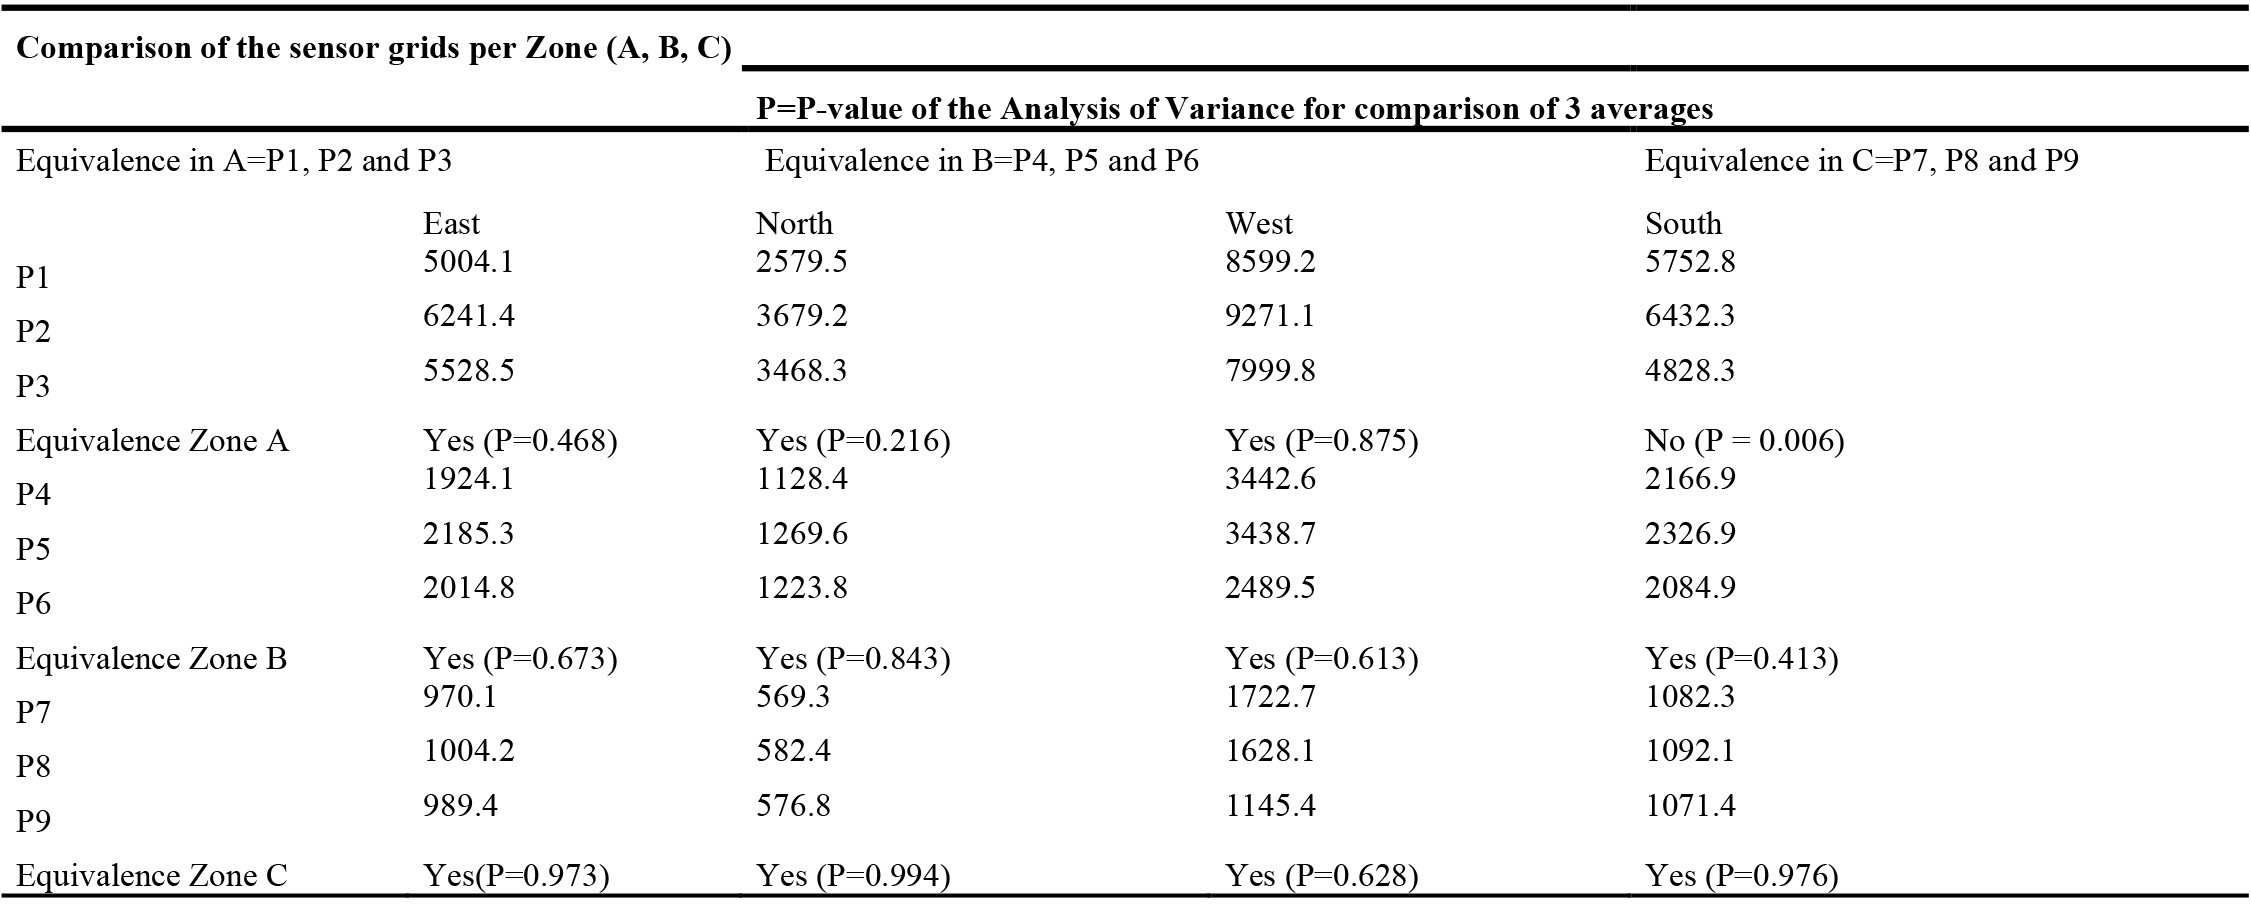
Table 3. Equivalence test of sensor grids (P1 to P9) per Zone (A, B, and C) considering the four solar orientations for the simulation in ALFA for the electrochromic glazing.
This meant that results of mel-EDI considering all nine grid sensors were equivalent within zones A, with sensors P1, P2, and P3; zone B, with sensors P4, P5, and P6; and zone C, with sensors P7, P8, and P9, to east, north and west. To the south, the results of sensors P4 to P6, within zone B, were equivalent, as well as the ones from zone C, P7 to P8. Nevertheless, in Zone A to the south, the results of sensors P1, P2, and P3, within Zone A were not equivalent, with a P-value of 0.6%. It is important to emphasize that this equivalence of these tests of the sensors for zones A, B, and C may only apply to this simulation model. The equivalent tests were done to verify if the results were statistically equivalent between the sensors within the three zones to increase the understanding of the simulated results.
3.3. Circadian lighting of the simulated room: results from melanopic equivalent daylight illuminance (mel-EDI)
In this section, the results generated in ALFA consisted of units of EML and were later converted to mel-EDI with units in lux. As discussed in section 2.3, a minimum of 250 lux is required to meet the described recommendations [63,64,66]. Therefore, a count was done to verify in which of the four simulated days, two solstices, and two equinoxes, the minimum of 250 lux was achieved, as described in Fig. 17.
Figure 17
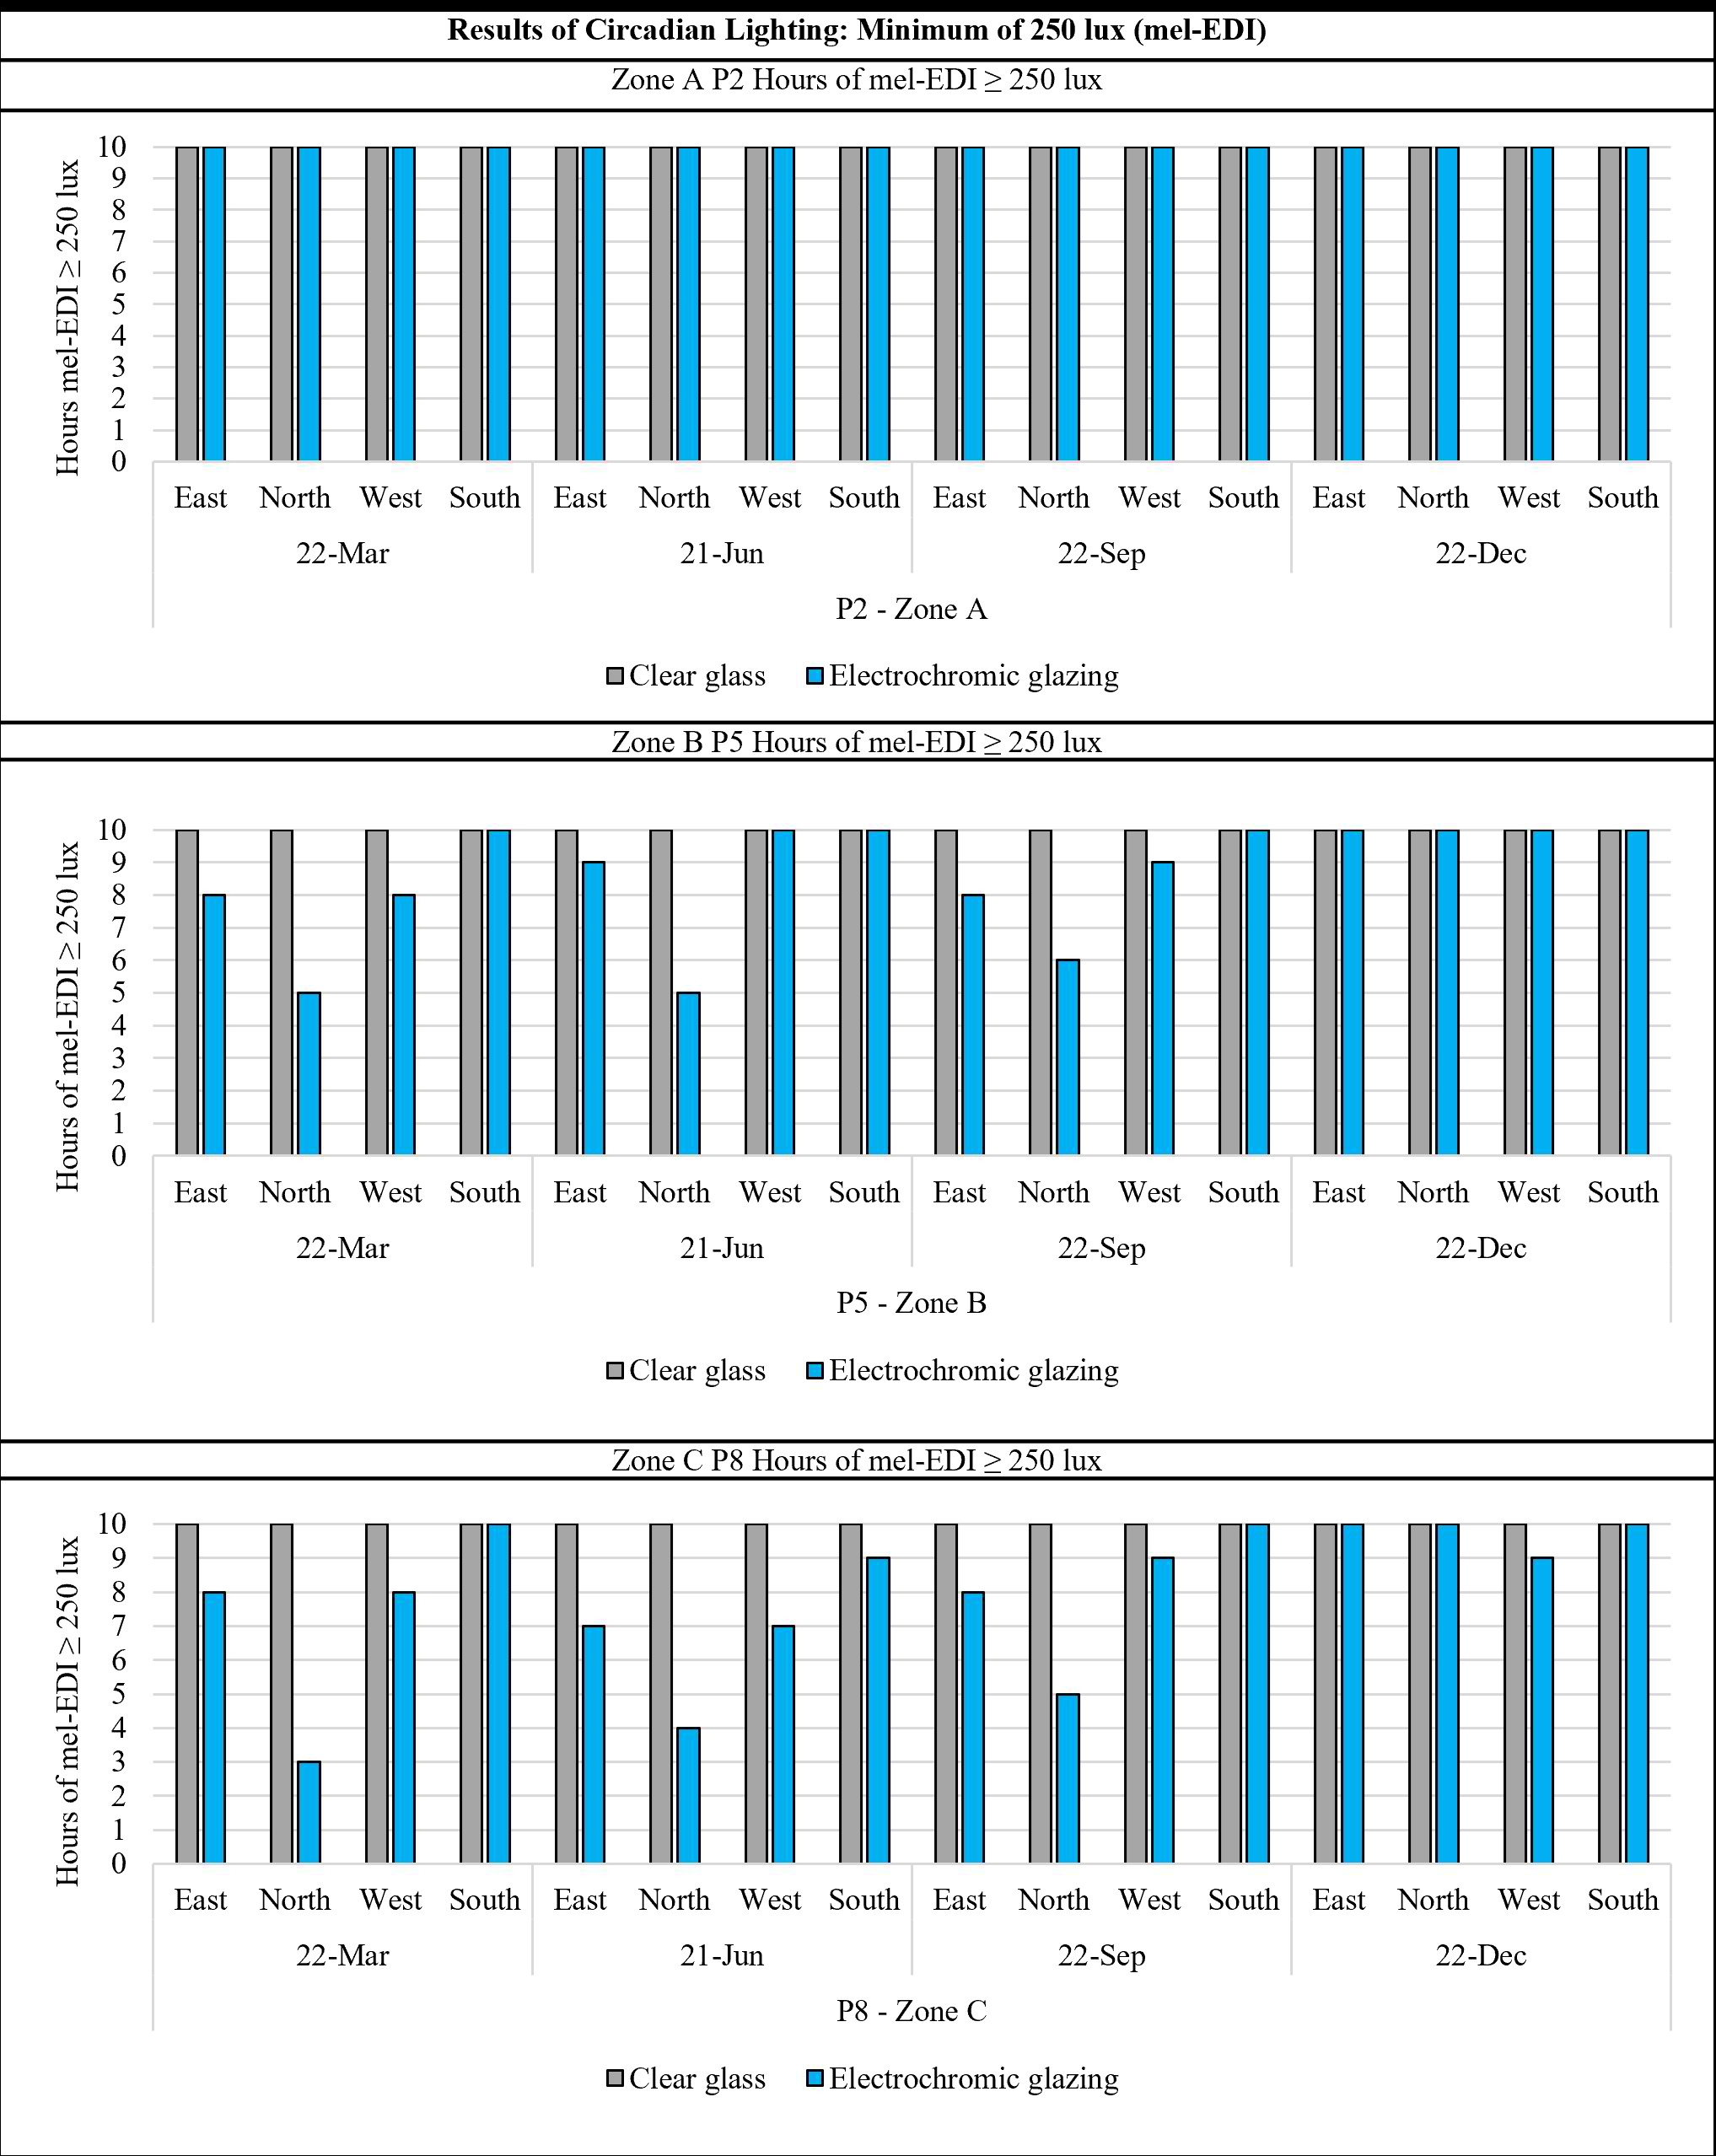
Fig. 17. Hours of circadian lighting with a minimum of 250 lux (mel-EDI) per solar orientation.
In Zone A, 0.50 far from the window, in sensor P2, all results were equal or above 250 lux during all simulated hours on March 22, June 21, September 22, and December 22 for the clear glass and the electrochromic glazing. In zone B, 3.0 m from the window, and in zone C, 5.5 m from the window, all results were equal to or greater than 250 lux for the clear glass.
However, the results were different for the electrochromic glazing. For north, the results in P5 showed a reduction in the hours with a minimum of 250 lux on March 22 and on June 21, achieved in 5 hours, on September 22, with 6 hours, and on December 22, in 10 hours. For east and west, a minimum of 8 hours with 250 lux or more of circadian lighting was observed.
In zone C, according to the results in P8, 5.5 m from the window, the hours with the minimum of 250 lux of mel-EDI decreased in three orientations: east, north, and west. For east and west, a minimum of 7 hours with 250 lux or more of circadian lighting was observed, and there was a slight decrease in circadian lighting. For north, a minimum of 250 lux of mel-EDI was only achieved in 3 hours on March 22, 4 hours on June 21, and 5 hours on September 22. On December 22, circadian lighting was achieved in all ten simulated hours. This reduction in the number of the minimum of 250 lux of mel-EDI can be explained by the decrease in the visible transmittance to 1.1%, fully tinted state of the electrochromic glazing during these three dates to north, east, and west as can be seen in Fig. 11.
Since the equivalence tests of the simulations in ALFA did not apply to the south in Zone A, the results for P1, P2, and P3 were analyzed separately. According to the results displayed in Table 4, all simulated results presented values of circadian lighting with a minimum of 250 lux of mel-EDI.
Table 4
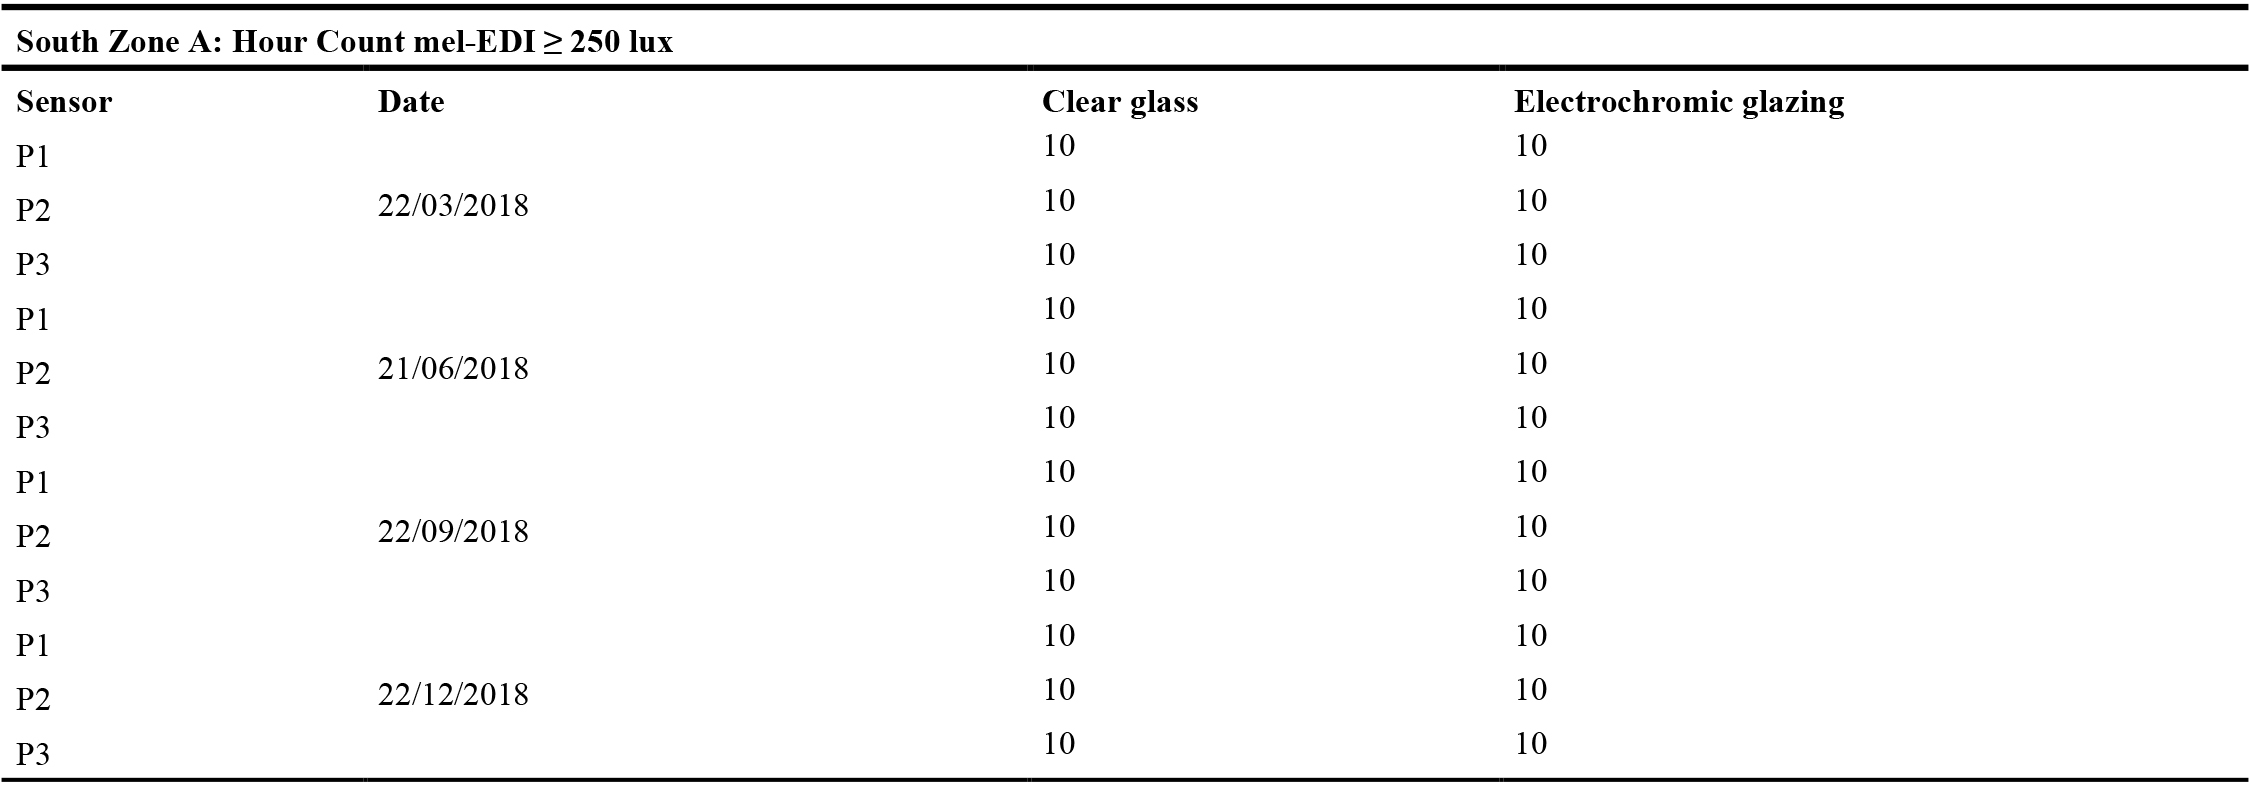
Table 4. Hours of circadian lighting with a minimum of 250 lux (mel-EDI) to south.
3.4. Balance between circadian lighting and avoidance of discomfort due to glare
As discussed in section 2.5, a double classification was created to understand if, of circadian lighting, a minimum of 250 lux of mel-EDI can be achieved without exceeding vertical illuminance of 1,500 lux. As discussed in section 2.5, the idea was to associate both metrics to count the frequency in which these thresholds were simultaneously achieved: a minimum of circadian lighting and a maximum threshold for vertical illuminance. The results of the hour count combining these parameters are described in Table 5.
Table 5
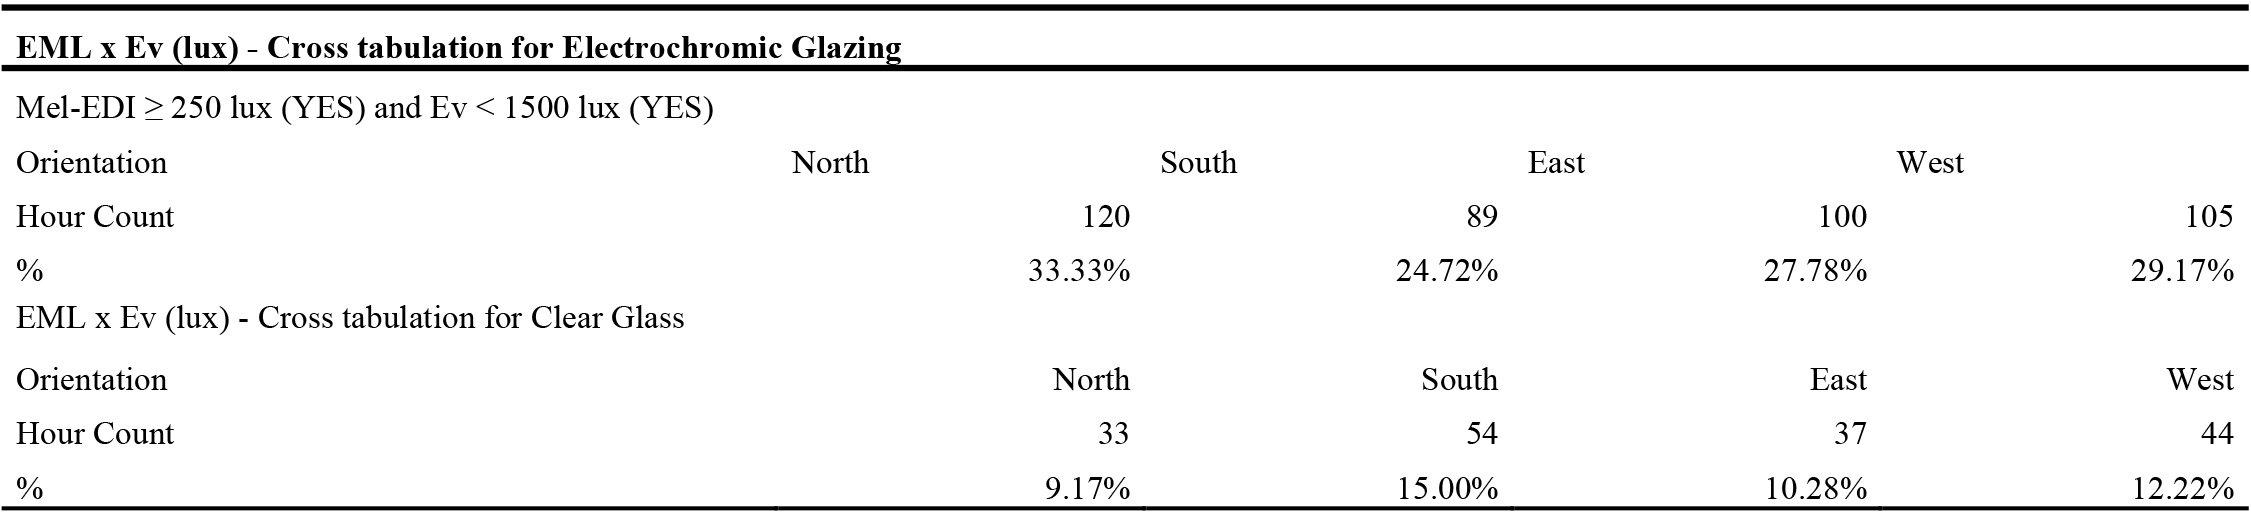
Table 5. Hourly frequencies combining a minimum of circadian lighting with a maximum threshold of vertical illuminance per solar orientation for the electrochromic glazing and the clear glass.
When the simulation model faced north, the electrochromic glazing performed best regarding the combination of the minimum required circadian lighting with the maximum threshold of vertical illuminance. The optimal situation happened in 120 hours, 33.33% of the 360 simulated hours for this orientation. The results showed improvements in relation to the clear glass when the optimal situation occurred in 33 hours, in 9.17% of the simulated hours.
To the south, the electrochromic glazing had the worst performance due to the fact that it was in the clear state in 98.5% of the time. The optimal situation was found in 89 hours, only in 24.72% of the 360 simulated hours for this orientation. For the clear glass to the south, this was constrained in 54 hours, in 15% of the hours, with a reduction of 9.72% when both conditions were fulfilled, with a minimum of 250 lux (mel-EDI) and a maximum of 1,500 lux of vertical illuminance. This can be explained by the reduction in the visible transmittance, from 88.3% for the clear glass to 62.1% for the clear state of the simulated electrochromic glazing.
For the electrochromic glazing for the east, the number of hours when there was a minimum of 250 lux (mel-EDI) without exceeding 1,500 lux of vertical illuminance was 100, representing 27.78% of the simulated hours; to the west, it was 105 hours, corresponding to 29.17% of the simulated hours. When compared to the clear glass, both criteria were met in only 37, 10.28% of the simulated hours for the east and in 44, 12.22% of the simulated hours for the west. The performance of the electrochromic glazing for these orientations was also better when compared to the clear glass.
3.5. Results of melanopic daylight efficacy ratio
Results of melanopic daylight efficacy ratio (mel-DER) indicated that in sensors P1 to P9, there were differences in the results for the clear glass and the electrochromic glazing. In total, per orientation and sensor, 40 hours were simulated considering the four dates. Differences in the results of mel-DER were higher when comparing the intervals between 0.562 and 0.904 corresponding to the interval of CIE illuminant FL11 (4000 k) for the four orientations in P2 and P5 for clear glass and the electrochromic glazing. Results can be seen in Fig. 18.
Figure 18
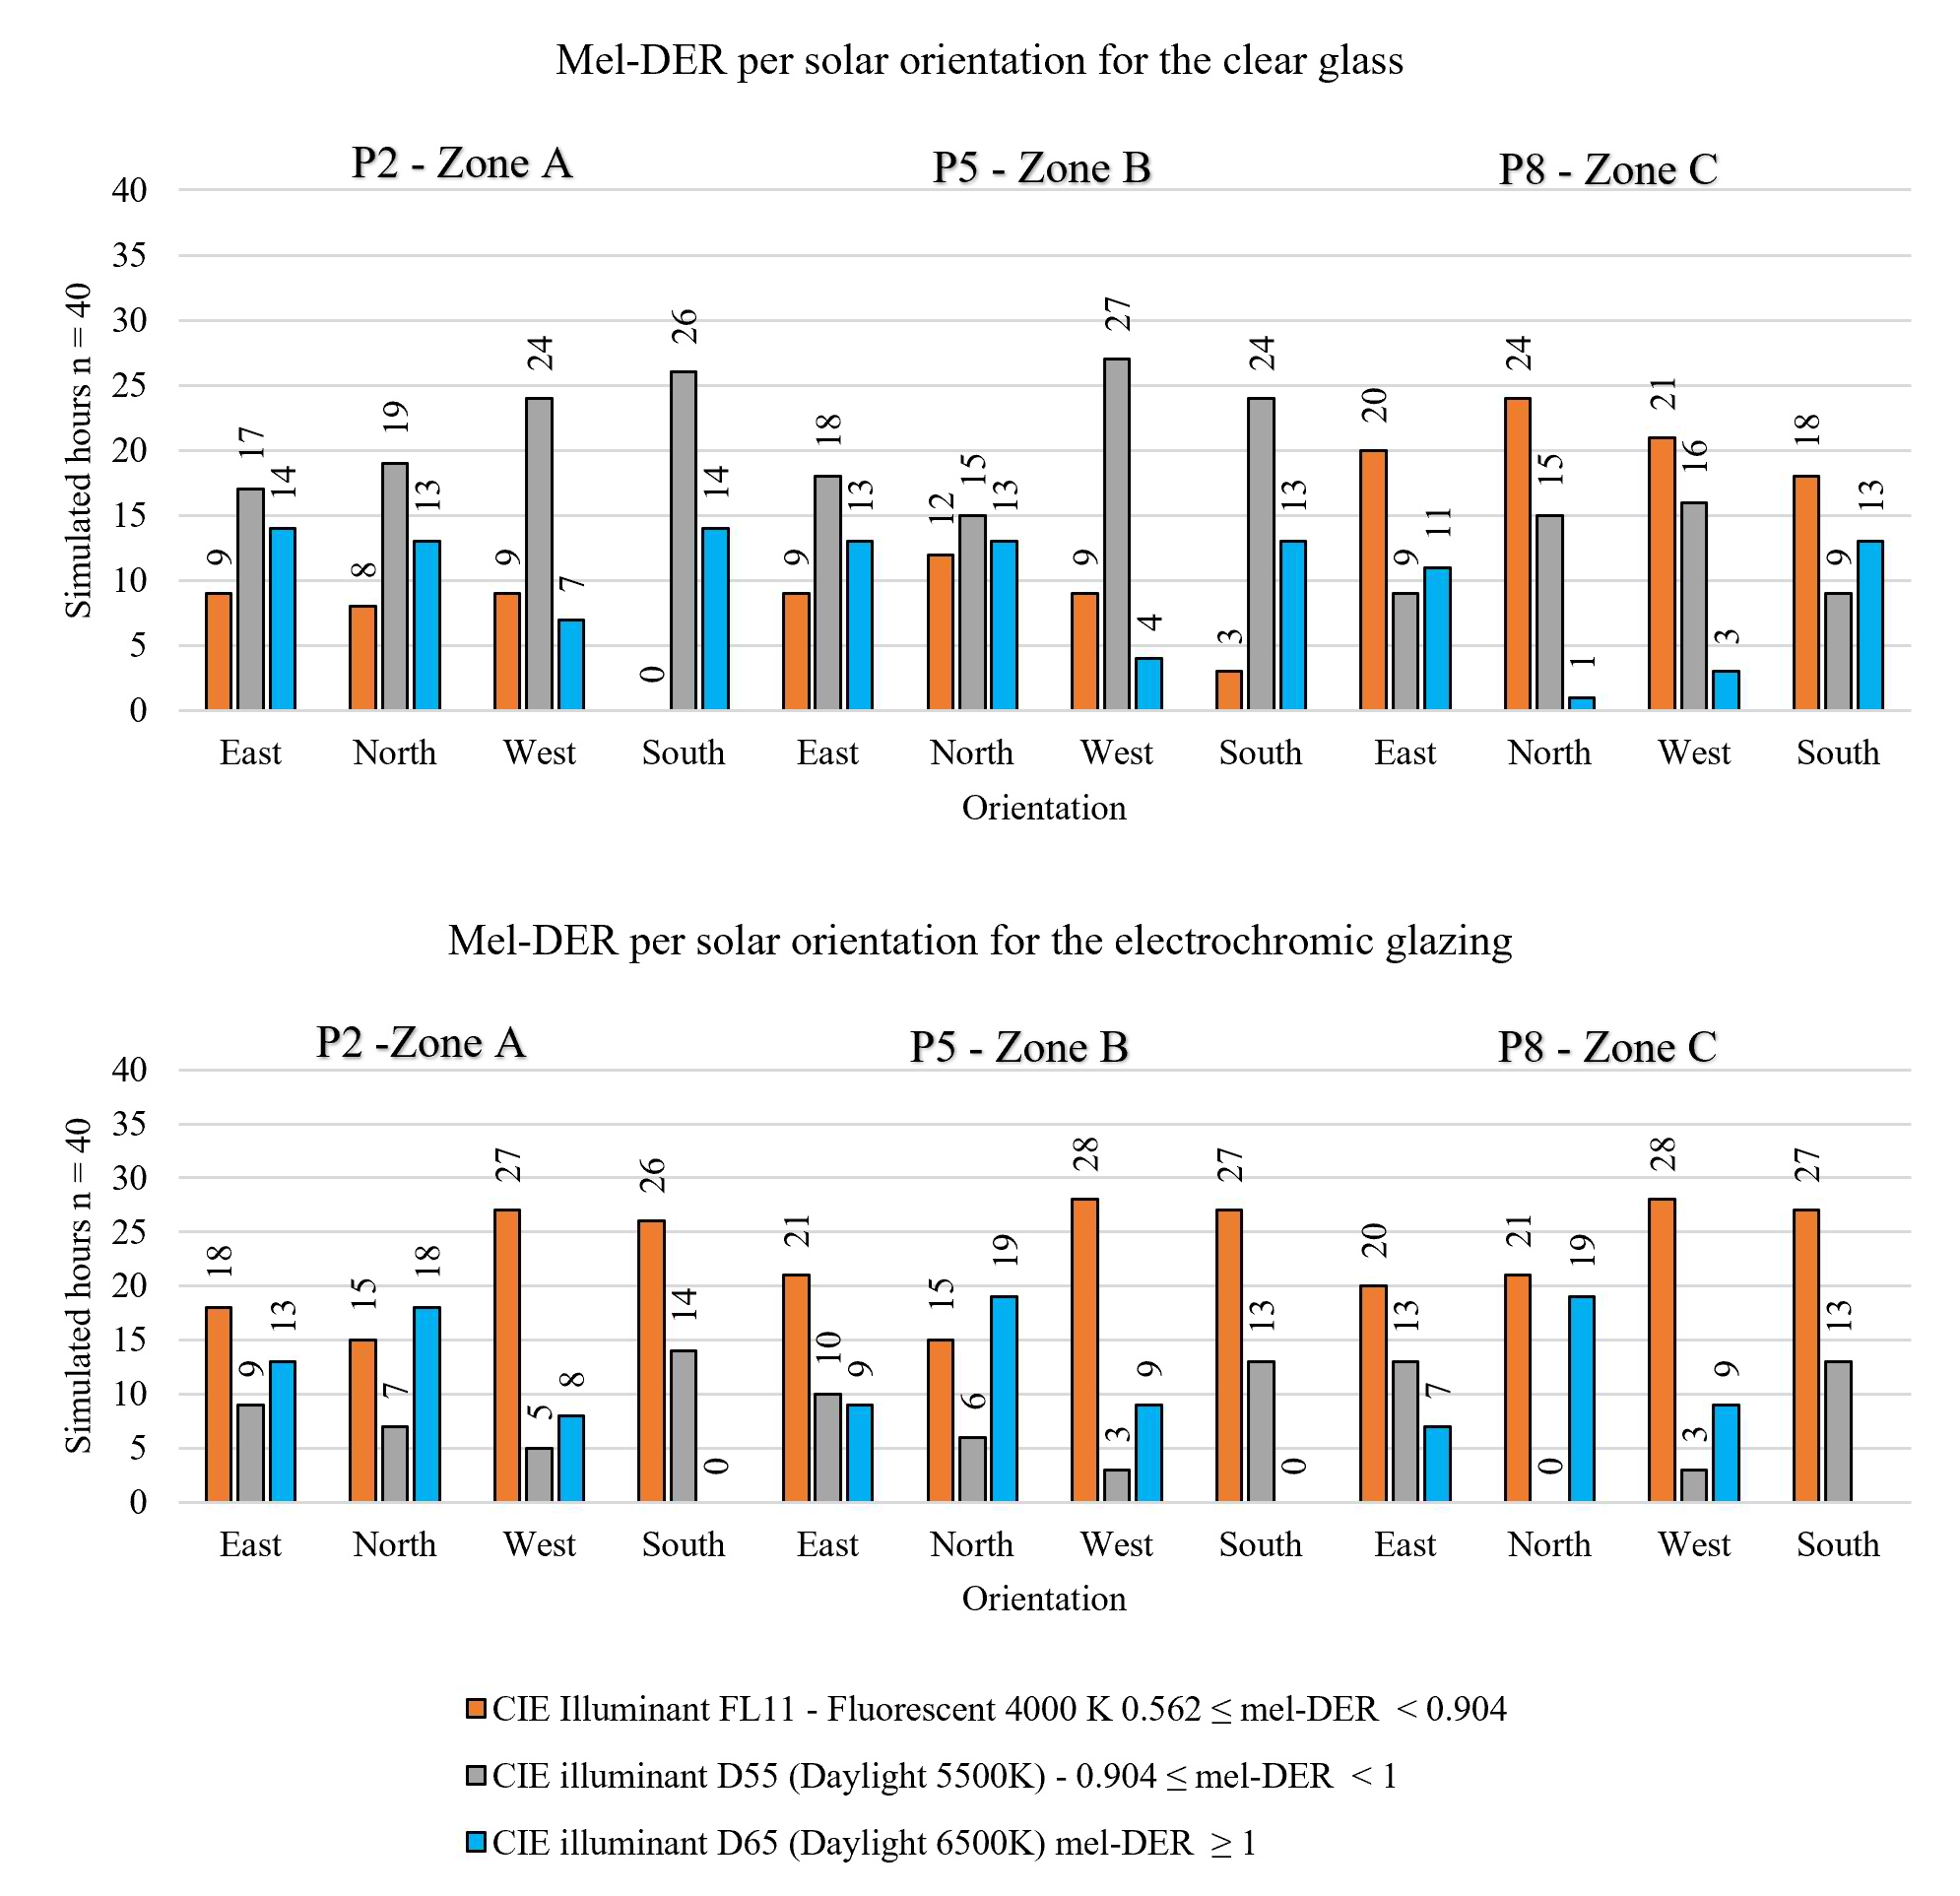
Fig. 18. Results of mel-DER per solar orientation for the clear glass and the electrochromic glazing.
In the interval of melanopic efficacy of CIE illuminant FL 11 (4000 K), results for the electrochromic glazing in P2 for east were counted in 18 hours, north in 15 hours, west in 27 hours, and south in 26 hours. For the clear glass, mel-DER between 0.562 and 0.904 was counted in 9 hours for the east, 8 hours for the north, not counted for the south and 9 hours for the west. For P5, results of mel-DER between the interval of CIE illuminant FL11 for the electrochromic glazing were counted in 21 hours for the east, 15 hours for the north, 28 hours for the west, and 27 hours for the south. For the clear glass in P5, the results were significantly different for the interval of CIE illuminant FL11, with 9 hours for the east, 12 hours for the north, 9 hours for the west, and 3 hours for the south. In P8, the significant differences for the interval of mel-DER corresponding to the CIE illuminant FL11 (4000 K) were to the west, with 28 hours against 21 hours to the west and 27 to 18 hours to the south for the results of the electrochromic glazing and the clear glass respectively.
Regarding the interval of mel-DER between 0.904 and 1, corresponding to the efficacy of the CIE illuminant D55 (Daylight 5500 K), differences were also found in the three sensors in the four orientations. For P2, results of mel-DER - CIE D55 (Daylight 5500 K) for the electrochromic glazing were counted in 9 hours for the east, 7 hours for the north, 5 hours for the west, and 14 hours for the south. For the same interval, mel-DER CIE D55 (Daylight 5500 K) for P2 for the clear glass, the count was higher, with 17 hours for the east, 19 hours for the north, 24 hours for the west, and 26 hours for the south. For P5, in general, the results of mel-DER in the interval CIE D55 were at least 44% lower for the electrochromic glazing when compared to the clear glass. In P8, the most significant difference was for the north. Results of mel-DER – CIE D55 (5500 K) were counted in 15 hours against no counted hours for the north and 16 hours against 3 hours for the west for the clear glass and the electrochromic glazing, respectively.
At a distance of 5.50 m far from the window for the electrochromic glazing, contrasting results were also found. At 5.50 m far from the window, results corresponding to the melanopic efficacy of CIE illuminant D65 (Daylight 6500 K) were higher for the electrochromic glazing when compared to the clear glass. For east, mel-DER – CIE D65 results were counted in 11 hours for the electrochromic glazing, against 7 hours for the clear glass. The results of mel-DER – CIE D65 were observed for the other orientations in zone C. For the north, the count was 1 hour for the clear glass against 19 hours for the electrochromic glazing, and for the west, 3 hours for the clear glass compared to 9 hours for the electrochromic glazing. On the other hand, for the south, the opposite occurred; for the clear glass, results of mel-DER – CIE D65 were counted in 13 hours for the clear glass, against no counted hour for the electrochromic glazing.
As discussed in section 3.2, it was necessary to analyze the results for sensors P1, P2, and P3 separately in zone A for the south as there was no equivalence among them. Similar results were observed, as discussed in P2, for the south. In general, the results of mel-DER were counted more frequently in the interval corresponding to the CIE illuminant FL11 (4000 K) for the electrochromic glazing. For the clear glass in zone A, the results of mel-DER were counted with more frequency to the intervals of CIE illuminants D55 (Daylight 5500 K) and D65 (6500 K) (Fig. 19).
Figure 19
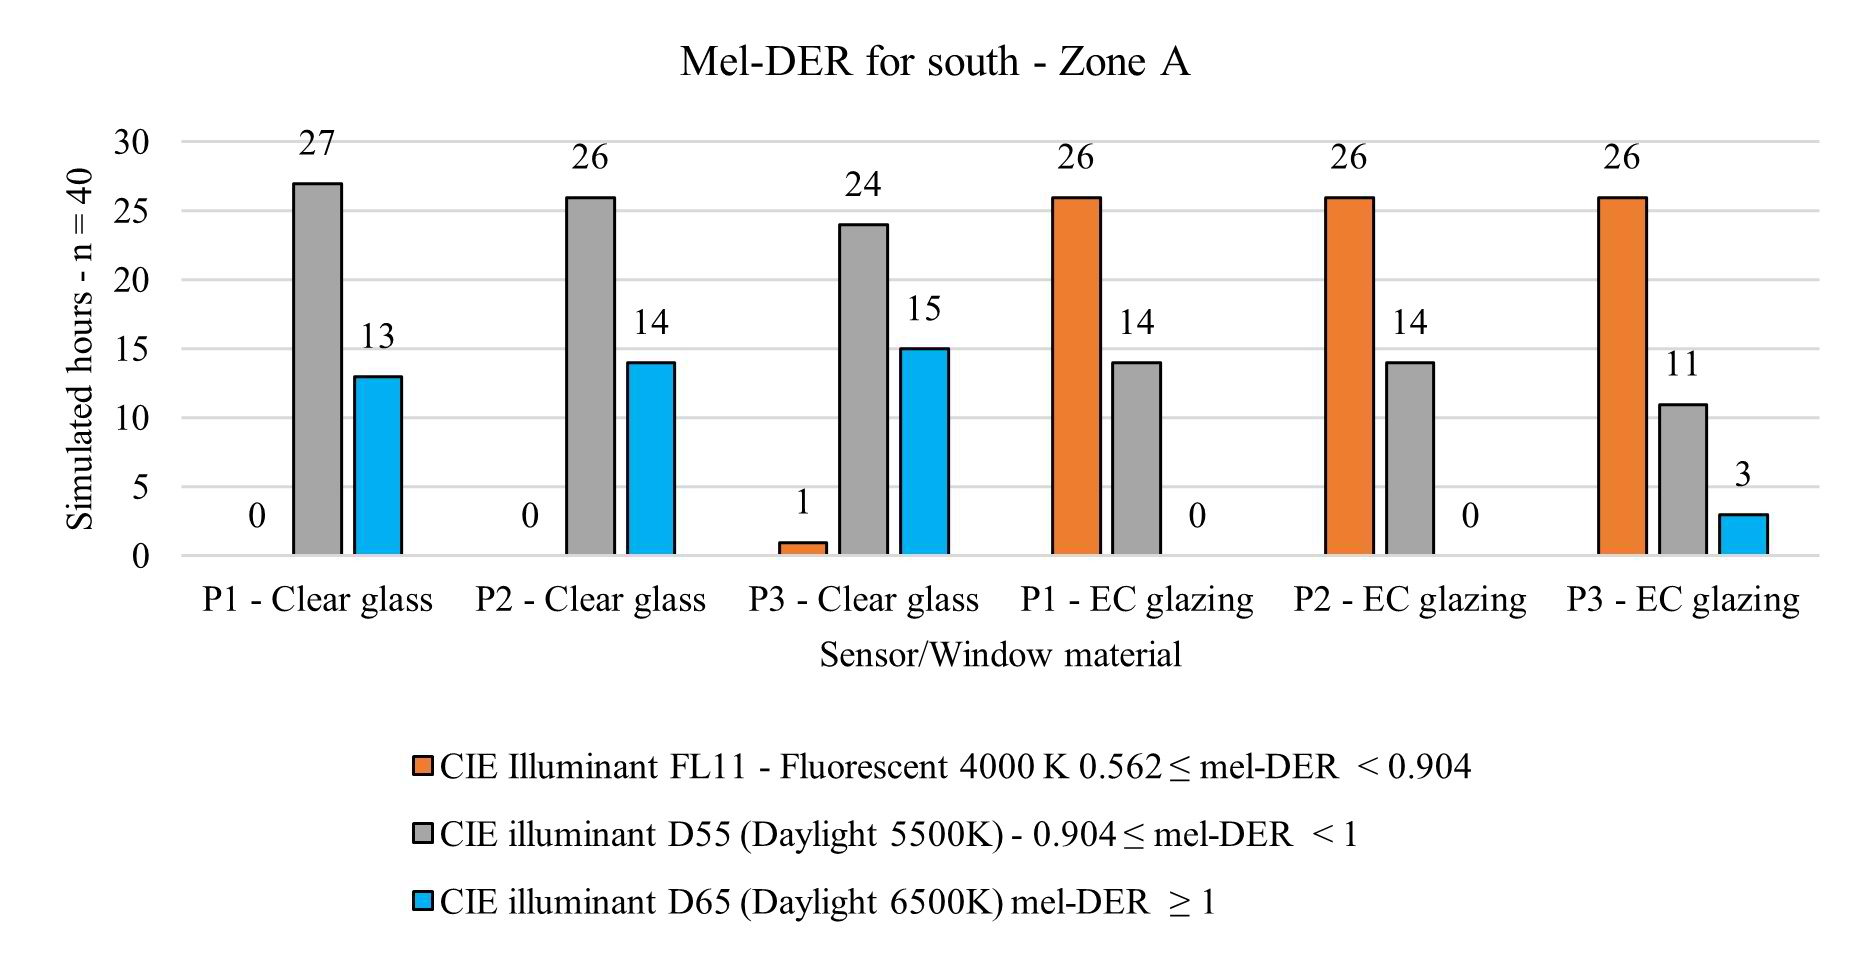
Fig. 19. Results for mel-DER for the south in Zone A
Results suggested that the use of the electrochromic glazing had significant impacts on the results of mel-DER in the four orientations when compared to the clear glass. The results of mel-DER indicated that at distances of 0.50m and 3m from the window, there were differences among the results for the clear glass and the electrochromic glazing. This indicated that next to the window and in the middle of the room, at the mentioned distances from the window, mel-DER were found more frequently in the intervals corresponding to CIE illuminants D55 and D65 for the clear glass in at least 70% of the time, in 28 of the 40 hours. However, the predominant frequency of hours for the electrochromic glazing was in the interval of CIE illuminant FL 11 (4000 K) in at least 67.5% of the time, in 27 of 40 hours for south and east, and in at least 37.5% of the hours, 15 of 40 hours for north and 45% of the hours, 18 of 40 hours for the east.
Nevertheless, at a distance of 5.50m far from the window, results corresponding to the melanopic efficacy of CIE illuminant D65 (Daylight 6500 K) were higher for the electrochromic glazing when compared to the clear glass for east, north, and west, except for south. This can be explained by higher M/P ratios of the electrochromic glazing in medium dark and dark state than of the clear glass, as described in Table 1.
4. Conclusion
Considering all evaluated variables for the simulation studies, it was possible to determine in which conditions the performance of the electrochromic glazing was better in a non-residential room for the climate of Brasilia. The simulated window-wall ratio was 85%, representing a highly glazed façade. It is important to mention that the tint states of the electrochromic glazing, from fully clear, 62.1% of visible transmittance to fully tinted, 1.1%, were controlled according to the presence of direct sun on the incident on the horizontal grid. Facing north, the fully tint state was between 10 a.m. and 3 p.m. from the middle of March until the middle of September. It was in the clear state 63.7% of the time, 34.8% less than in relation to the south-facing window. Facing east, the electrochromic glazing was set in lower tint states mostly between 8 a.m. and 11:30 a.m. during the morning period in almost the entire year and west from 12:30 p.m. and 4:30 p.m. throughout the year. Both remained in the clear state for approximately 76% of the time during the year.
The parameter of spatial daylight autonomy (sDA) was useful for understanding the illuminance in the horizontal grid. Regarding sDA, all sensors, considering the four solar orientations, were above 300 lux in at least 50% of the simulated hours. For this parameter, both materials, electrochromic glazing and clear glass, performed well. Nevertheless, there were differences between the performance of UDI between 100 lux and 3,000 lux when comparing the electrochromic glazing and clear glass in zone A at a distance of 0.50m from the window. For the clear glass, illuminance levels were within the UDI 100-3000 lux, facing east in 12% of the time and west in 10%, facing south in 11% and north in 10%, and for the electrochromic glazing, the results were 50% for north, 45% for east, 23% for south and 40% for west. At the distances of 3m and 5.5m from the window, zones B and C, the differences of UDI 100-3000 lux were not so significant. This meant that the electrochromic glazing performed better at keeping the illuminance levels on the horizontal grid at more comfortable levels in comparison with the clear glass.
When annual glare was evaluated, the probability increased when the sensors were located closer to the window in all four orientations for the electrochromic glazing for both window materials. Differences were noted when contrasting the results of both window materials. In zone A, close to the window, intolerable glare was reduced from 88% to 47% for the north, 87% to 72% for the south, 87% to 47% for the east, and from 90% to 56% for west when the electrochromic glazing and the clear glass were compared. The shading schedule generated for the electrochromic glazing, avoiding direct sun, prevented problems related to glare for the east, west, and north, but this solution was less effective for the south.
For the results of electrochromic glazing, intolerable glare was not an issue as the distance from the window increased from 0.5m to 3m in zone B for north, east, and west, as imperceptible glare was present in more than 70% of the hours during the day and for south, in 63% of the hours. Nevertheless, intolerable glare for the clear glass was significantly worse in zone B. Intolerable glare was observed in at least 31% of the simulated hours for the south and at least 50% of the time for the other three orientations for the clear glass. In zone C, 5.5 m far from the window, glare was imperceptible during all simulated hours for the electrochromic glazing and in at least 73% of the year for the clear glass. Consequently, the use of electrochromic glazing accomplished better results than clear glass, and this is a suitable solution to mitigate glare in the context of Brasilia.
On the other hand, it is important to emphasize that in certain situations, the use of the electrochromic glazing on the simulated highly glazed test room presented some disadvantages regarding the supply of circadian lighting, particularly for the north orientation. On all four orientations for all simulated hours, the minimum value of 250 lux of mel-EDI was achieved in all sensors for the clear glass. When analyzing the electrochromic glazing for the north, the supply of circadian lighting decreased in at least 40% of the simulated hours for zone B, a distance of 3m from the window, and at least 50% in zone C, the distance of 5.5m from the window at the beginning of autumn, on March 22, winter, on June 21 and spring, on September 22. In relation to east and west, this reduction was 20% in zones B and C in the four simulated dates.
As can be seen in Table 1, the simulated electrochromic glazing had a melanopic to a photopic ratio of 0.90 in the clear state and 1.65 in the fully tint state, indicating higher melanopic transmittance in the fully tint state than the clear state and 1.01 for the clear glass. Regarding the spectrum, higher melanopic daylight efficacy ratios were observed for the clear glass than for the electrochromic glazing. In general, the results of the clear glass indicated that there were no significant alterations in the received daylight in the simulated room, with the predominance of mel-DER in the intervals of CIE illuminant D55 and D65. When the performance of the electrochromic glazing was analyzed, the melanopic daylight efficacy ratios were lower, and approximately 50% of the time during the four evaluated days, the mel-DER were not equivalent to CIE illuminant D55 and D65, indicating distortions in the spectral distribution of daylight entering the room. Frequently, results of mel-DER for the electrochromic glazing fell to levels below 0.904 and indicated melanopic efficacy comparable to artificial lighting, CIE illuminant FL11 (4000 K), or light sources with lower correlated color temperatures. It is suggested that the melanopic efficacy of the electrochromic glazing be further investigated.
For the context of Brasilia of non-residential buildings, electrochromic glazing can be a suitable choice for highly glazed façades, particularly for purposes of the mitigation of glare and supply of circadian lighting. For the electrochromic glazing, a balance between the minimum threshold of 250 lux (mel-EDI) without exceeding 1,500 lux of vertical illuminance was observed in 33.33% of the hours for the north, against 27.78% of the hours for the east, 29.17% for the west and 24.72% for the south. When compared to the clear glass, this balance was 24.16% better for the north, 9.72% for the south, 17.5% for the east, and 16.95% for the west. With these results, it was possible to conclude that the electrochromic glazing performed better regarding the visual and non-visual effects evaluated compared to the conventional clear glass.
As discussed in the literature review, the darkness provided by the electrochromic glazing was a constant source of criticism by the users of non-residential buildings. In the context of Brasilia, the most important aspect to be observed is the employment of electrochromic glazing for the north orientation. In this context, the supply of circadian lighting was jeopardized when the electrochromic glazing was found in the dark state because of the higher incidence of direct sun between March and September.
This work is part of a PhD thesis, and this discussion will be deepened. To understand the employment of electrochromic glazing within the national context, different cities with distinct luminous contexts and latitudes, predominantly in hot climates, will be further investigated. Another aspect to be considered is the comparison of the performance of electrochromic glazing regarding visual and non-visual effects compared with reflective glasses, which are commonly used in non-residential buildings in Brazil.
Acknowledgment
The research documented in this paper was carried out with the support of the National Council of Scientific and Technological Development (CNPq) and the Coordination for the Improvement of Higher Education Personnel (CAPES).
Contributions
J. F. W. Costa: Writing: original draft, Data curation, Conceptualization, Investigation. C. N. D. Amorim: Conceptualization, Methodology, Writing - original draft, Project administration, Funding acquisition. J. C. R. Silva: Conceptualization, Writing - original draft. M. I. M. T. Walter: Statistical Analysis.
Declaration of competing interest
The authors declare no conflict of interest.
References
- E.S. Lee, B.S. Matusiak, D. Geisler-Moroder, S.E. Selkowitz, L. Heschong, Advocating for view and daylight in buildings: Next steps, Energy and Buildings. 265 (2022) 112079. https://doi.org/10.1016/j.enbuild.2022.112079
- N. Gentile, E.S. Lee, W. Osterhaus, S. Altomonte, C. Naves David Amorim, G. Ciampi, V. Garcia-Hansen, M. Maskarenj, M. Scorpio, S. Sibilio, Evaluation of integrated daylighting and electric lighting design projects: Lessons learned from international case studies, Energy and Buildings. 268 (2022) 112191. https://doi.org/10.1016/j.enbuild.2022.112191
- I.E. Agency, Daylight in buildings, Lawrence Berkeley National Laboratory, [Berkeley], 2000. https://facades.lbl.gov/sites/all/files/daylight-in-buildings.pdf.
- M. Knoop (ed.), Daylighting and electric lighting retrofit solutions, Berlin, 2016. http://task50.iea-shc.org/data/sites/1/publications/Technical_Report_T50_B6_final.pdf.
- S. Attia, S. Bilir, T. Safy, C. Struck, R. Loonen, F. Goia, Current trends and future challenges in the performance assessment of adaptive façade systems, Energy and Buildings. 179 (2018) 165-182. https://doi.org/10.1016/j.enbuild.2018.09.017
- C.G. Granqvist, Electrochromics and Thermochromics: Towards a New Paradigm for Energy Efficient Buildings, Materials Today: Proceedings. 3 (2016) S2-S11. https://doi.org/10.1016/j.matpr.2016.01.002
- M. Casini, Active dynamic windows for buildings: a review, Renewable Energy. 119 (2018) 923-934. https://doi.org/10.1016/j.renene.2017.12.049
- N. DeForest, A. Shehabi, S. Selkowitz, D.J. Milliron, A comparative energy analysis of three electrochromic glazing technologies in commercial and residential buildings, Applied Energy. 192 (2017) 95-109. https://doi.org/10.1016/j.apenergy.2017.02.007
- L.B.N. Laboratory, International Glazing Database, (2023). https://windows.lbl.gov/igdb-downloads.
- R. Mitchell, C. Kohler, D. Curcija, L. Zhu, S. Vidanovic, S. Czarnecki, D. Arasteh, WINDOW 7 User Manual, Berkeley, 2019. https://windows.lbl.gov/sites/default/files/software/WINDOW/WINDOW7UserManual.pdf.
- J.K. Day, B. Futrell, R. Cox, S.N. Ruiz, A. Amirazar, A.H. Zarrabi, M. Azarbayjani, Blinded by the light: Occupant perceptions and visual comfort assessments of three dynamic daylight control systems and shading strategies, Building and Environment. 154 (2019) 107-121. https://doi.org/10.1016/j.buildenv.2019.02.037
- J. Hoon Lee, J. Jeong, Y. Tae Chae, Optimal control parameter for electrochromic glazing operation in commercial buildings under different climatic conditions, Applied Energy. 260 (2020) 114338. https://doi.org/10.1016/j.apenergy.2019.114338
- M. Knoop, O. Stefani, B. Bueno, B. Matusiak, R. Hobday, A. Wirz-Justice, K. Martiny, T. Kantermann, M.P.J. Aarts, N. Zemmouri, S. Appelt, B. Norton, Daylight: What makes the difference?, Lighting Research and Technology. 52 (2020) 423-442. https://doi.org/10.1177/1477153519869758
- Y.A.W. de Kort, J.A. Veitch, From blind spot into the spotlight. Introduction to the special issue "Light, lighting, and human behaviour"., Journal of Environmental Psychology. 39 (2014) 1-4. https://doi.org/10.1016/j.jenvp.2014.06.005
- T. Kruisselbrink, R. Dangol, A. Rosemann, Photometric measurements of lighting quality: An overview, Building and Environment. 138 (2018) 42-52. https://doi.org/10.1016/j.buildenv.2018.04.028
- C. Vetter, P.M. Pattison, K. Houser, M. Herf, A.J.K. Phillips, K.P. Wright, D.J. Skene, G.C. Brainard, D.B. Boivin, G. Glickman, A Review of Human Physiological Responses to Light: Implications for the Development of Integrative Lighting Solutions, LEUKOS - Journal of Illuminating Engineering Society of North America. 18 (2021) 387-414. https://doi.org/10.1080/15502724.2021.1872383
- Y. Wu, T. Wang, E.S. Lee, J.H. Kämpf, J.L. Scartezzini, Split-pane electrochromic window control based on an embedded photometric device with real-time daylighting computing, Building and Environment. 161 (2019) 106229. https://doi.org/10.1016/j.buildenv.2019.106229
- S. Jain, C. Karmann, J. Wienold, Behind electrochromic glazing: Assessing user's perception of glare from the sun in a controlled environment, Energy and Buildings. 256 (2022) 1-13. https://doi.org/10.1016/j.enbuild.2021.111738
- M. Boubekri, J. Lee, P. MacNaughton, M. Woo, L. Schuyler, B. Tinianov, U. Satish, The Impact of Optimized Daylight and Views on the Sleep Duration and Cognitive Performance of Office Workers, International Journal of Environmental Research and Public Health. 17 (2020) 3219. https://doi.org/10.3390/ijerph17093219
- S. Saiedlue, A. Amirazar, J. Hu, W. Place, Assessing circadian stimulus potential of lighting systems in office buildings by simulations, ARCC Conference Repository. (2019) 719-727. https://www.arcc-journal.org/index.php/repository/article/view/655/528.
- J. da S. Porto, J.M.R. de Freitas, R.D.C. Balboni, S. Treichel, E.G. da Cunha, R.S. de Mattos, R.K. Leitzke, C.M. Cholant, C.A.O. Avellaneda, Thermoenergetic and luminous performance of a office building with the use of electrochromic glasses, Revista Materia. 25 (2020) 1-15. https://doi.org/10.1590/s1517-707620200003.1106
- J.F.W. Costa, C.N.D. Amorim, Materiais transparentes e translúcidos inovadores em fachadas e seu desempenho em iluminação natural: panorama internacional e aplicabilidade no contexto brasileiro, Ambiente Construído. 22 (2022) 179-198. https://doi.org/10.1590/s1678-86212022000400635
- A.B.M. Alves, A.L. Schmid, Iluminação natural em edifícios, PARC Pesquisa Em Arquitetura e Construção. 14 (2023) e023017. https://doi.org/10.20396/parc.v14i00.8671285
- J.C.S. Gonçalves, The new working environment: environmental diversity and flexibility of space, Pós: Revista Do Programa de Pós-Graduação Em Arquitetura e Urbanismo Da FAUUSP. 26 (2019) 126-135. https://doi.org/10.11606/issn.2317-2762.posfau.2019.161676
- T. Alves, L. Machado, R.G. de Souza, P. de Wilde, A methodology for estimating office building energy use baselines by means of land use legislation and reference buildings, Energy and Buildings. 143 (2017) 100-113. https://doi.org/10.1016/j.enbuild.2017.03.017
- M.P. Marcondes Cavaleri, G.R.M. Cunha, J.C.S. Gonçalves, Iluminação natural em edifícios de escritórios: avaliação dinâmica de desempenho para São Paulo, PARC Pesquisa Em Arquitetura e Construção. 9 (2018) 19-34. https://doi.org/10.20396/parc.v9i1.8650725
- S.R. Sarra, R.C.K. Mülfarth, OS IMPACTOS DA ILUMINAÇÃO SOBRE A SAÚDE E O CONFORTO EM EDIFÍCIOS DE ESCRITÓRIOS / THE IMPACTS OF LIGHTING ON HEALTH AND COMFORT IN OFFICE BUILDINGS, Brazilian Journal of Development. 6 (2020) 91493-91512. https://doi.org/10.34117/bjdv6n11-529
- J.F. Walter Costa, C.N. David Amorim, J.C. Ribeiro Silva, Retrofit guidelines towards the achievement of net zero energy buildings for office buildings in Brasilia, Journal of Building Engineering. (2020) 101680. https://doi.org/10.1016/j.jobe.2020.101680
- A.V.P. Lima, L. Noda, J.F. de Souza, S.M. Leder, O impacto das janelas na percepção visual em ambientes de escritórios no clima tropical quente e úmido, Ambiente Construído. 22 (2022) 137-154. https://doi.org/10.1590/s1678-86212022000400632
- J.F.W. Costa, C.N.D. Amorim, N.P.R. de Oliveira, Morphological characteristics and energy consumption of office buildings in the central area of Brasilia, in: PASSIVE AND LOW ENERGY ARCHITECTURE, NCEUB, Edinburgh, 2017: pp. 2507-2514. https://plea2017.net/wp-content/themes/plea2017/docs/PLEA2017_proceedings_volume_II.pdf.
- J. Gonçalves, R. Mülfarth, M. Roméro, R. Michalski, A. Shimomura, E. Pizarro, M. Marcondes-Cavaleri, M. Mello, J. Cotta, J. Trigo, O pobre desempenho ambiental dos escritórios em caixa de vidro, Vitruvius. (2021) 1-7. https://vitruvius.com.br/revistas/read/drops/21.160/7999?fbclid=IwAR2_ehObDCvxj6Qel-mID8eNlUNKDs1LncE2QJyRpOXnVnSJeoV5GpcF6kw.
- K.M. de Lima, R.M. Caram, Avaliação de sistemas de janela para suporte a decisões de projeto quanto ao equilíbrio de ganhos de luz e calor, Ambiente Construído. 15 (2015) 117-133. https://doi.org/10.1590/s1678-86212015000300030
- M. Soares Geraldi, A.P. Melo, R. Lamberts, E. Borgstein, A. Yujhi Gomes Yukizaki, A.C. Braga Maia, J. Borghetti Soares, A. dos Santos Junior, Assessment of the energy consumption in non-residential building sector in Brazil, Energy and Buildings. 273 (2022) 112371. https://doi.org/10.1016/j.enbuild.2022.112371
- C.N.D. Amorim, J.M.M. Sánchez, J. Cronemberger, J.F.W. Costa, Retrofit e preservação de edifícios não residenciais modernos em Brasília: uma aobrdagem para eficiência energética e iluminação natural, in: A Construção Civil Em Uma Perspectiva Econômica, Ambiental e Social, Editora Científica, Guarujá, 2021: pp. 340-357. https://www.editoracientifica.com.br/artigos/retrofit-e-preservacao-de-edificios-nao-residenciais-modernos-em-brasilia-uma-abordagem-para-eficiencia-energetica-e-iluminacao-natural. https://doi.org/10.37885/210303862
- F. Goia, Search for the optimal window-to-wall ratio in office buildings in different European climates and the implications on total energy saving potential, Solar Energy. 132 (2016) 467-492. https://doi.org/10.1016/j.solener.2016.03.031
- Mcneel, Rhinoceros v.7, (2023). https://www.rhino3d.com/.
- S. LLC, Climate Studio: Advanced daylighting, electric lighting and conceptual thermal analysis, (n.d.). https://www.solemma.com/climatestudio.
- Laboratório de Eficiência Energética em Edificação, Arquivos climáticos INMET 2018, (2018). https://labeee.ufsc.br/downloads/arquivos-climaticos/inmet2018.
- L.K. Lawrie, D.B. Crawley, Repository of free climate data for building performance simulation, (2018). https://climate.onebuilding.org/WMO_Region_3_South_America/BRA_Brazil/index.html.
- N. Altenberg Vaz, M. Inanici, Syncing with the Sky: Daylight-Driven Circadian Lighting Design, LEUKOS - Journal of Illuminating Engineering Society of North America. 17 (2021) 291-309. https://doi.org/10.1080/15502724.2020.1785310
- Laboratório de Eficiência Energética em Edificação, Analysis Sol-AR, (n.d.). https://labeee.ufsc.br/pt-br/downloads/softwares/analysis-sol-ar.
- L. Bellia, U. Błaszczak, F. Diglio, F. Fragliasso, Assessment of melanopsin-based quantities: Comparison of selected design tools and validation against on-field measurements, Building and Environment. 232 (2023). https://doi.org/10.1016/j.buildenv.2023.110037
- M. Inanici, B. Abboushi, S. Safranek, Evaluation of sky spectra and sky models in daylighting simulations, Lighting Research and Technology, 2022. https://doi.org/10.1177/14771535221103400
- S. LLC, Alfa: Adaptive Lighting for Alertness, (2023). https://www.solemma.com/alfa.
- I.C. on Illumination, CIE S 026/E:2018: system for Metrology of Optical Radiation for ipRGC-Influenced Responses to Light, Vienna, 2018. https://doi.org/10.25039/S026.2018
- R.J. Lucas, S.N. Peirson, D.M. Berson, T. Brown, H. Cooper, C.A. Czeisler, M.G. Figueiro, P.D. Gamlin, S.W. Lockley, J.B. O'Hagan, L.L.A. Price, I. Provencio, D.J. Skene, G.C. Brainard, Irradiance Toolbox User Guide, (2013) 1-19. http://lucasgroup.lab.manchester.ac.uk/measuringmelanopicilluminance/.
- R.J. Lucas, S.N. Peirson, D.M. Berson, T.M. Brown, H.M. Cooper, C.A. Czeisler, M.G. Figueiro, P.D. Gamlin, S.W. Lockley, J.B. O'Hagan, L.L.A. Price, I. Provencio, D.J. Skene, G.C. Brainard, Measuring and using light in the melanopsin age, Trends in Neurosciences. 37 (2014) 1-9. https://doi.org/10.1016/j.tins.2013.10.004
- INSTITUTO NACIONAL DE METEOROLOGIA, Normais climatológicas do Brasil: período 1961 a 2010. 2010, Brasilia, 2010. http://www.inmet.gov.br/portal/index.php?r=clima/normaisclimatologicas.
- E.D.T. Group, Climate Consultant v. 6.0, (2019). https://basc.pnnl.gov/library/climate-consultant-60.
- C. Naves David Amorim, B.K.S. de Souto, A.D. de Medeiros, Qualidade da Iluminação e Eficiência Energética em Edifícios Públicos: Análise Comparativa de Soluções de Retrofit, Paranoá: Cadernos de Arquitetura e Urbanismo. 29 (2021) 1-17. https://doi.org/10.18830/issn.1679-0944.n29.2021.10
- J. Gonçalves, R. Mülfarth, M. Roméro, R. Michalski, A. Shimomura, E. Pizarro, M. Marcondes-Cavaleri, M. Mello, J. Cotta, J. Trigo, O pobre desempenho ambiental dos escritórios em caixa de vidro, Vitruvius. (2021) 1-7. https://vitruvius.com.br/revistas/read/drops/21.160/7999?fbclid=IwAR2_ehObDCvxj6Qel-mID8eNlUNKDs1LncE2QJyRpOXnVnSJeoV5GpcF6kw.
- ABNT - Associação Brasileira de Normas Técnicas, NBR ISO - CIE 8995 - 1: iluminação de ambientes de trabalho: interior, Rio de Janeiro, 2013.
- S.M. Berman, R.D. Clear, A practical metric for melanopic metrology, Lighting Research and Technology. 51 (2019) 1178-1191. https://doi.org/10.1177/1477153518824147
- T.A.D.L. Martins, De condicionantes solares à oportunidades de desenho urbano: otimização de tipo-morfologias urbanas em contexto de clima tropical, (2014) 470.
- N.L. Jones, C.F. Reinhart, Experimental validation of ray tracing as a means of image-based visual discomfort prediction, Building and Environment. 113 (2017) 131-150. https://doi.org/10.1016/j.buildenv.2016.08.023
- C.F. Reinhart, O. Walkenhorst, Validation of dynamic RADIANCE-based daylight simulations for a test office with external blinds, Energy and Buildings. 33 (2001) 683-697. https://doi.org/10.1016/S0378-7788(01)00058-5. https://doi.org/10.1016/S0378-7788(01)00058-5
- ABNT - Associação Brasileira de Normas Técnicas, ABNT NBR 15215 - 4: Verificação experimental das condições de iluminação natural interna, Rio de Janeiro, 2023.
- Inmetro, Instrução Normativa Inmetro para a Classificação de Eficiência Energética de Edificações Comerciais, de Serviços e Públicas, (2021) 139. http://www.inmetro.gov.br/legislacao/rtac/pdf/RTAC002707.pdf.
- I.E. Society, IES LM-83-23 SPATIAL DAYLIGHT AUTONOMY (sDA) AND ANNUAL SUNLIGHT EXPOSURE (ASE), New York, 2023.
- J. Mardaljevic, M. Andersen, N. Roy, J. Christoffersen, T. Gateway, E. Enac, I.A. Lipid, DAYLIGHTING METRICS : IS THERE A RELATION BETWEEN USEFUL DAYLIGHT ILLUMINANCE AND DAYLIGHT GLARE PROBABILITY ? VELUX A / S , Adalsvej, Proceedings of the Building Simulation and Optimization Conference BSO12. (2012). https://infoscience.epfl.ch/record/179939?ln=en.
- C.F. Reinhart, J. Wienold, The daylighting dashboard - A simulation-based design analysis for daylit spaces, Building and Environment. 46 (2011) 386-396. https://doi.org/10.1016/j.buildenv.2010.08.001
- E.C. for Standardization, EUROPEAN STANDARD 17037: Daylight of buildings, Brussels, 2018.
- International WELL Building Institute. Section L03: Circadian Lighting Design, WELL Building Standard v2, Q4 2022, 2022. https://v2.wellcertified.com/en/v/light/feature/3.
- U. Laboratory, Design guideline DG 24480: Design guideline for promoting circadian effective entrainment with light for day-active people, Northbrook, 2019. https://www.shopulstandards.com/ProductDetail.aspx?productId=UL24480_1_D_20191219.
- H. Xiao, H. Cai, X. Li, Non-visual effects of indoor light environment on humans: A review, Physiology and Behavior. 228 (2021). https://doi.org/10.1016/j.physbeh.2020.113195
- K. Brown, T.; Brainard, G.; Cajochen, C.; Czeisler, C.; Hanifin, J.; Lockley, S.; Lucas, R.; Munch, M.; O'Hagan, J.; Peirson, S.; Price, L.; Roenneberg, T.; Schlangen, L.; Skene, D.; Spitschan, M.; Vetter, C.; Zee, P.; Wright Jr., T.M. Brown, G.C. Brainard, C. Cajochen, C.A. Czeisler, J.P. Hanifin, S.W. Lockley, R.J. Lucas, M. Munch, J. O'Hagan, S.N. Peirson, L. Price, T. Roenneberg, L.J. Schlangen, D.J. Skene, M. Spitschan, C.C. Vetter, P.C. Zee, K.W. Jr., M. Münch, J.B. O, S.N. Peirson, L.L. A Price, T. Roenneberg, L.J. Schlangen, D.J. Skene, M. Spitschan, C.C. Vetter, P.C. Zee, K.P. Wright Jr, Recommendations for Healthy Daytime, Evening, and Night-Time Indoor Light Exposure, Preprints. (2020) 1-21. https://doi.org/10.20944/preprints202012.0037.v1
- L. Karlsen, P. Heiselberg, I. Bryn, H. Johra, Verification of simple illuminance based measures for indication of discomfort glare from windows, Building and Environment. 92 (2015) 615-626. https://doi.org/10.1016/j.buildenv.2015.05.040
- D. Carmon, S. Altomonte, Lighting for circadian well-being: a simulation-based workflow for the visual and non-visual lighting design of a nursing home, in: Building Simulation Conference Proceedings, International Building Performance Simulation Association, 2022: pp. 2911-2918. https://doi.org/10.26868/25222708.2021.31101
- A. Alight, J.A. Jakubiec, Evaluating the use of photobiology-driven alertness and health measures for circadian lighting design, in: Building Simulation Conference Proceedings, International Building Performance Simulation Association, 2022: pp. 2529-2537. https://doi.org/10.26868/25222708.2021.30463
- M. Englezou, A. Michael, Investigation of the daylight spectrum in an indoor environment using CIE S 026 melanopic metrics, Lighting Research and Technology. (2023) 690-711. https://doi.org/10.1177/14771535231204162
- C.N.D. Amorim, V. GARCIA-HANSEN, N. GENTILE, W. OSTERHAUS, K. PHAM, Evaluating integrated lighting projects: a Procedure to Post-Occupancy Evaluation of Daylight and Electrical Lighting Integrated Projects, Stuttgart, 2021. https://doi.org/10.18777/ieashc-task61-2021-0006
- ABNT - Associação Brasileira de Normas Técnicas, ABNT 15215 Part 2: Calculation procedures for daylighting and daylight spatial distribution, Rio de Janeiro, 2022.
- W.J. Stevenson, Business Statistics: concepts and Applications, Harpercollins College, New York, 1985.
- P.A. Barbetta, Estatística aplicada às ciências sociais, Editora da UFSC, Florianópolis, 2008.
Copyright © 2024 The Author(s). Published by solarlits.com.

SHARE ON


