Article Outline
Figures and tables
Volume 4 Issue 2 pp. 37-47 • doi: 10.15627/jd.2017.6
Effect of Window Glazing on Colour Quality of Transmitted Daylight
Rajendra Dangol,* Thijs Kruisselbrink, Alexander Rosemann
Author affiliations
Department of the Built Environment, Building Lighting Group, Eindhoven University of Technology, Eindhoven, The Netherlands
* Corresponding author.
r.dangol@tue.nl (R. Dangol)
t.w.kruisselbrink@tue.nl (T. Kruisselbrink)
A.L.P.Rosemann@tue.nl (A. Rosemann)
History: Received 16 August 2017 | Revised 12 October 2017 | Accepted 17 October 2017 | Published online 9 November 2017
Copyright: © 2017 The Author(s). Published by solarlits.com. This is an open access article under the CC BY license (http://creativecommons.org/licenses/by/4.0/).
Citation: Rajendra Dangol, Thijs Kruisselbrink, Alexander Rosemann, Effect of Window Glazing on Colour Quality of Transmitted Daylight, Journal of Daylighting 4 (2017) 37-47. http://dx.doi.org/10.15627/jd.2017.6
Figures and tables
Abstract
In this study, the colour quality of the daylight transmitted through different window glazing types is evaluated. The analysis considered four different types of window glazing: laminated, monolithic, coated and applied film glazing ranging in luminous transmittance from around 0.97 to <0.1. The spectral transmittance data of different window glazing types are taken from the International Glazing Data Base (IGDB), which is maintained by Lawrence Berkeley National Laboratories (LBNL). The study showed that the CIE CRI does not always seem to be the suitable method to predict the colour quality of daylight in building for particular situations. However, in the context of this study, the prediction of colour rendering properties of window glazing by other metrics such as Colour Quality Scale (version 9), Memory CRI, Ra,D65 (adjusted CRI metric with D65 as the reference illuminant) performed better. For most of the daylit situations inside the building, the chromaticity difference criterion was not met. Judging the colour quality of such situations requires different method.
Keywords
Colour rendering, Colour quality, CIE CRI, Window glazing
1. Introduction
Window glazing technologies are developing and improving rapidly. This applies to coated, laminated, applied film and monolithic glazing systems. Advanced glazing systems have a great potential to save energy, costs from heating, air-conditioning and lighting, when correctly integrated in the building’s façades to exploit the utilization of daylight. It plays a vital role in maintaining the visual and thermal comfort, view to outside, privacy and indoor air quality [1,2]. Window glazing enables the variation of the luminous transmittance, solar factor and spectrum of daylight within buildings. It has many benefits over conventional shading solutions such as less or unperceivable visual obstruction, lower maintenance requirements, the absence of movable parts and operation-related noises. Many studies have reported that window glazing types are capable of reducing energy consumption for cooling and lighting [3,6], increasing visual comfort [7,8] and glare protection [9,10]. However, the colour quality of daylight transmitted through smart glass is of serious concern.
For general lighting, the colour quality of a light source is a vital characteristic. To date, the colour quality of a light source does not have any rigorous definition. The word quality should be regarded as a general term. A dictionary defines the term quality as “the degree of excellence of something”. In the case of the colour quality, it means the degree of colour excellence. Colour cannot be measured directly; it is always based on a comparison [11] which then allows the formulation of a colorimetric system such as the one consisting of the components hue, chroma and lightness. Similarly, it is not possible to measure the colour quality of light sources without a reference or comparison. However, various components/aspects of colour quality such as colour fidelity (colour rendering), colour discrimination, colour harmony, colour preference, visual clarity, colour acceptability, and brightness [12] can be determined. Even though there are different aspects of colour quality, currently, the light source is judged with the help of Commission International de l’Eclairage (CIE) Colour Rendering Index (CRI). CIE CRI is the only internationally recognized metric to measure and specify the colour rendering properties of a light source [13]. It is widely accepted and has been used for over 40 years. However, many deficiencies are associated with the CIE CRI [14–16], including the use of relatively low saturation test samples and the use of outdated colorimetric tools. The same CIE CRI has been used to judge the colour quality of the luminous environment resulting from different smart glazing systems in various studies [17–19].
Ghosh and Norton [17] examined the colour rendering properties of daylight transmitted through a suspended particle device smart glass. They found that the CIE CRI values and correlated colour temperature (CCT) of daylight transmitted through smart glass change with the change in smart glass transmittance. They also reported that suspended particle device glazing with transmittance above 14% is only able to produce CIE CRI value of above 80. Gunde et al. [18] compared the colour rendering properties of the daylight transmitted through gasochromic and electrochromic smart glazing types. They found that the appearances of coloured objects are highly distorted at higher coloration states of the glass windows. Lynn et al. [19] studied the colour rendering properties of transmitted light through the semi-transparent building-integrated photovoltaic (STPV) at the incident angles of 0.8° and 45°. They reported that the transmitted light renders the colours well in laboratory conditions if CIE CRI values of transmitted illuminant were above 90. All these studies use CIE CRI to compare the colour rendering properties of light transmitted through different smart glazing. However, none of these studies reported neither Duv nor DC. Duv is the Euclidean difference of chromaticity coordinate uv between the test light source to the closest point on the Planckian locus in the u’, 2/3v’ coordinate system, whereas DC is the Euclidean difference of chromaticity coordinate uv between the test light source and the reference illuminant. DC is calculated using equation Eq. (1). A Duvv value also provides direction of colour shift; a positive Duv value indicates chromaticity coordinate of the light source is above the Planckian locus whereas a negative value indicates below the Planckian locus [20].
where, uk and vk are the chromaticity coordinate of test source, and ur and vr are the chromaticity coordinate of reference illuminant.
According to CIE [13], the absolute value of DC shall be less than 0.0054 if possible “as a practical limit of difference”. If the absolute DC value is greater than 0.0054, the resulting CIE CRI may not be accurate. For solid state lighting (SSL) products, the American National Standards Institute (ANSI) has defined the tolerances of Duv to be from 0.000 ± 0.006 to 0.003 ± 0.006 for nominal CCT categories that lie between 2700 K to 6500 K (for details see [20]). However, there is no such tolerance limit defined for the daylight transmitted through different glazing types.
Moreover, the European standard EN 410:2011 [21] states that the colour rendering properties of glazing in transmission shall be expressed by the CIE CRI, however, the reference illuminant shall always be CIE standard illuminant D65. In other words, the light transmitted through the glazing needs to be compared to D65 rather than to the reference illuminant resulting from the CIE CRI method. In this study, the method with the fixed reference illuminance D65 is called Ra,D65.
In this research work, the colour quality of the daylight transmitted through different window glazing types are evaluated with respect to different colour quality criteria such as CIE CRI, Ra,D65, Ra,2012, Duv, CCT, colour gamut area, and TM-30 [22].
2. Method
The spectral power distribution (SPD) of daylight transmitted through window glazing can be greatly affected by the spectral transmittance properties of the glazing. Next to the direct transmittance, there is a certain fraction of internal reflections occurring at the boundary layers between material and air as well as some absorbance and scattering. The internal reflections are typically in the order of 8% and may be reflected back out of the glazing system or undergo multiple internal reflections, as shown in Fig. 1.
Figure 1

Fig. 1. The impact of internal reflections on the luminous transmittance.
When absorption and scattering is neglected, the resulting luminous transmittance for a surface luminous reflectance ρ is:
The naïve luminous transmittance only assumes the direct transmittance without inter reflections:
The resulting error Errτ is a function of ρ:
For an assumed surface reflection of ρ=0.08, the error becomes 0.64%. Based on this, the resulting SPD of the transmitted daylight can calculated naïvely, i.e. by multiplying the SPD of daylight with the spectral transmittance of the glazing, without introducing a large error.
2.1. Window glazing transmittance
In this research, the four different types of window glazing are considered, namely; laminated, monolithic, coated and applied film glazing ranging in luminous transmittance from around 0.97 to < 0.1. These four types of window glazing cover a very wide range of glazing types. The spectral transmittance data of these window glazing are taken from international Glazing Data Base (IGDB) which is maintained by Lawrence Berkeley National Laboratories (LBNL). Each glazing type is identified by the NFRC_ID, the National Fenestration Rating Council Incorporated identification. It can be used to retrieve the product details from the Optics 6 [23] software by LBNL. The spectral transmittance curves of different window glazing types adopted in this study are shown in Fig. 2(a) (laminated), Fig. 2(b) (monolithic), Fig. 2(c) (coated), and Fig. 2(d) (applied film). Laminated glazing consists of a layer of uncoated laminate glazing without structure reference and a layer of laminate glazing coated on backside with structure reference. Laminated glazing is made by permanently bonding two or more pieces of glass together with interlayers. Laminated glazing is considered as A grade safety glass. In IGDB, Monolithic glazing types are refer to float glass, arcylic glazing and suspended film without coating. The coated glazing is a glazing type with low e-coating with(out) substrate reference and the glass coated with suspended film without substrate reference. Coated glazing can be used to lower the solar heat gain by increasing the surface reflectivity of the coating. Generally, the used coatings are metallic or metal oxide layers. Applied films glazing is a glazing type with substrate reference. Applied film can reduce the heat loss if low e-coating is applied in innermost exposed layer of the film. It can block ultraviolet radiation (UV) very effectively, and it also reduce glare and eye strain.
The luminous transmittance of the glazing types for the standard illuminant D65 (τD65) is calculated using Eq. (5).
Figure 2
![Spectral transmittance curves of (a) 22 different laminated, (b) 19 different monolithic, (c) 20 different coated, and (d) 19 different applied film glazing (adapted from [23]) in the visible range (380-780 nm) with different luminous transmittances shown in the legend.](figures/4-37-2.jpg)
Fig. 2. Spectral transmittance curves of (a) 22 different laminated, (b) 19 different monolithic, (c) 20 different coated, and (d) 19 different applied film glazing (adapted from [23]) in the visible range (380-780 nm) with different luminous transmittances shown in the legend.
where, D65(λ) is the spectral power distribution of CIE standard illuminant D65, V(λ) is the photopic spectral sensitivity function for human vision, τ(λ) is the spectral transmittance of the glazing.
2.2. Colour quality metrics
The colour quality of daylight transmitted through different window glazing types are evaluated with the help of eight different colour quality metrics. They are:
- CIE colour rendering index (CRI) [13]
- Ra,D65 (CRI taking constant reference illuminant i.e. CIE standard illuminant D65)
- Colour quality Scale (CQS) [24]
- Feeling of Contrast index (FCI) [25]
- Memory colour rendering index (MCRI) [26–28]
- Preference index of skin (PS) [29]
- Illuminating Engineering society Method for evaluating light source colour rendition (IES TM-30-15) [22]
- CRI2012 (Ra,2012)(Version n-CRI) [30]
2.2.1. CIE colour rendering index (CRI)
The CIE has defined colour rendering as “Effect of an illuminant on the colour appearance of objects by conscious or subconscious comparison with their colour appearance under a reference illuminant” [13]. The CIE CRI is calculated using the CIE Test Sample method, in which the tristimulus values of 14 Munsell test colour samples are calculated using the SPD of the test light source and the reference light source. The reference illuminant needs to have the same CCT as the test light source: either a Planckian radiator (for CCT < 4999 K) or a daylight phase (for CCT ≥ 5000 K). The von Kries transformation is used to account for chromatic adaptation. The colour difference between the two light sources is calculated in the CIE 1964 U*V*W* colour space for each sample. Then, the special colour rendering index (Ri) is calculated for each sample using Eq. (6) by
where, ∆E_i is the colour difference between the reference and test light source of ith colour sample.
The average of the first eight special colour rendering indices gives the general colour rendering index (Ra) or CIE CRI (for more detail see [13]).
2.2.2. Ra,D65
Ra,D65 is calculated in the same way as CIE CRI but keeping the reference illuminant constant to the CIE standard illuminant D65.
2.2.3. Colour quality scale
Colour quality scale (CQS) [24] is computed as CIE CRI with some modifications. Unlike in CIE CRI, it uses better chromatic adaptation model i.e., CMCCAT2000 and relatively uniform colour space i.e., CIELAB. In CQS version 9, 15 saturated test-colour samples were used. CQS has a range of 0-100. It uses the root-mean-square to combine the colour difference. (for more detail see [24]).
2.2.4. Feeling of contrast index
Feeling of contrast index (FCI) [25] estimates the effect of visual clarity or feeling of contrast quantitatively for the test illuminant to the reference illuminant. It is computed as the ratio between the gamut area formed by a four-colour combination in CIELAB under the test light source at illuminance of 1000 lux and under a CIE standard illuminant D65 at illuminance of 1000 lux. The four colour combination consists of Red (5R4/12), Blue (4.5PB3.2/6), Yellow (5Y8.2/10) and Green (5.5G5/8). It is computed using the CIECAT02 chromatic adaptation and CIECAM02 colour appearance model. FCI does not have an explicitly defined scale.
2.2.5. Feeling of contrast index
The memory colour rendering index (MCRI) is the index based on memory colours [26–28], which are associated with familiar objects in long term memory. MCI used ten familiar objects; a green apple, a banana, orange, dried lavender, a smurf figurine, strawberry yoghurt, a sliced cucumber, a cauliflower, Caucasian skin and grey sphere. Tristimulus values of these objects under D65 illumination are transformed using CIECAT02 and then transformed to the IPT colour space. It is a scale of 0-100. The geometric mean is used to obtain the general degree of memory colour similarity.
2.2.6. Preference index of skin
Preference index of skin (PS) [29] evaluates the colour-rendering properties of light sources based on preferred skin complexion. The tristimulus values of skin colour sample No. 15 defined by Japanese Industrial standard (JIS Z 8726) under test illuminant are transformed to corresponding colour under D65 illumination using CIE94 chromatic adaption and converted into CIE 1974 u’v’ chromaticity coordinates. Then, PS is computed by:
where,P=446.846+202u'+145u'2+8689u'3-4318v'-8719u' v'-1608u'2 v'+12260v'2+18608u' v'2-12579v'3
2.2.7. Illuminating engineering society method for evaluating light source colour rendition (IES TM-30-15)
IES TM-30-15 is a two-measure system that evaluate the colour rendition properties of light sources. This method compares the test light source to a reference illuminant having same CCT as that of test light source with the help of colour fidelity (Rf) index and the colour gamut (Rg). The reference illuminant for light sources with CCT below 4500 K shall be a planckian radiator, from 4501 K to 5499 K a proportional blend of Planckian radiation and the CIE Daylight illuminant, and from 5500 K a phase of the CIE Daylight illuminant. The method also generates a colour vector graphic which helps to interpret the values of Rf and Rg. A colour vector graphic indicates average hue and chroma shift. The method utilizes 99 real and natural colour evaluation samples (CES) and CAM02-UCS uniform colour space. Both, Rf and Rg, use same set of colour samples and colour space. Rf is computed as the arithmetic mean of the colour difference of each CES under the test light source and reference. Rf is a scale of 0-100. Rg is a relative measure that compare the CES under the test and the reference illuminant. It is defined as the area enclosed by the polygon created by 16 hue angle bins. It computes an average gamut area for all CES. (for more detail see [22])
2.2.8. CRI2012 (Ra,2012)
The computational procedure of CRI2012 [30] is similar to CIE CRI with fundamental improvements. It uses the same criteria to select the reference illuminant as CIE CRI. It uses 17 mathematically derived colour samples and computations are performed using CIECAM02-UCS. The colour differences are combined and rescaled with a root mean square and a sigmoid function respectively. CRI2012 has a range of 0-100 (for more detail see[30]).
These eight colour quality metrics were calculated using the test illuminant – that is, the daylight that passes through the glazing. The test illuminant, K_TD (λ) is determined by.
where, τ is the transmittance of glazing and D represents one of the spectral power distributions of CIE daylight illuminants. For this study, CIE standard illuminant D65 was considered.
3. Results
The calculated test illuminants using CIE standard illuminant D65 and the spectral transmittance functions of laminated glazing are shown in Figs. 2(a) and 3(a), respectively. The equivalent graphs for monolithic, coated and applied film window glazing types are respectively shown in Figs. 2(b) and 3(b), Figs. 2(c) and 2(c), and Figs. 2(d) and 3(d).
Figure 3
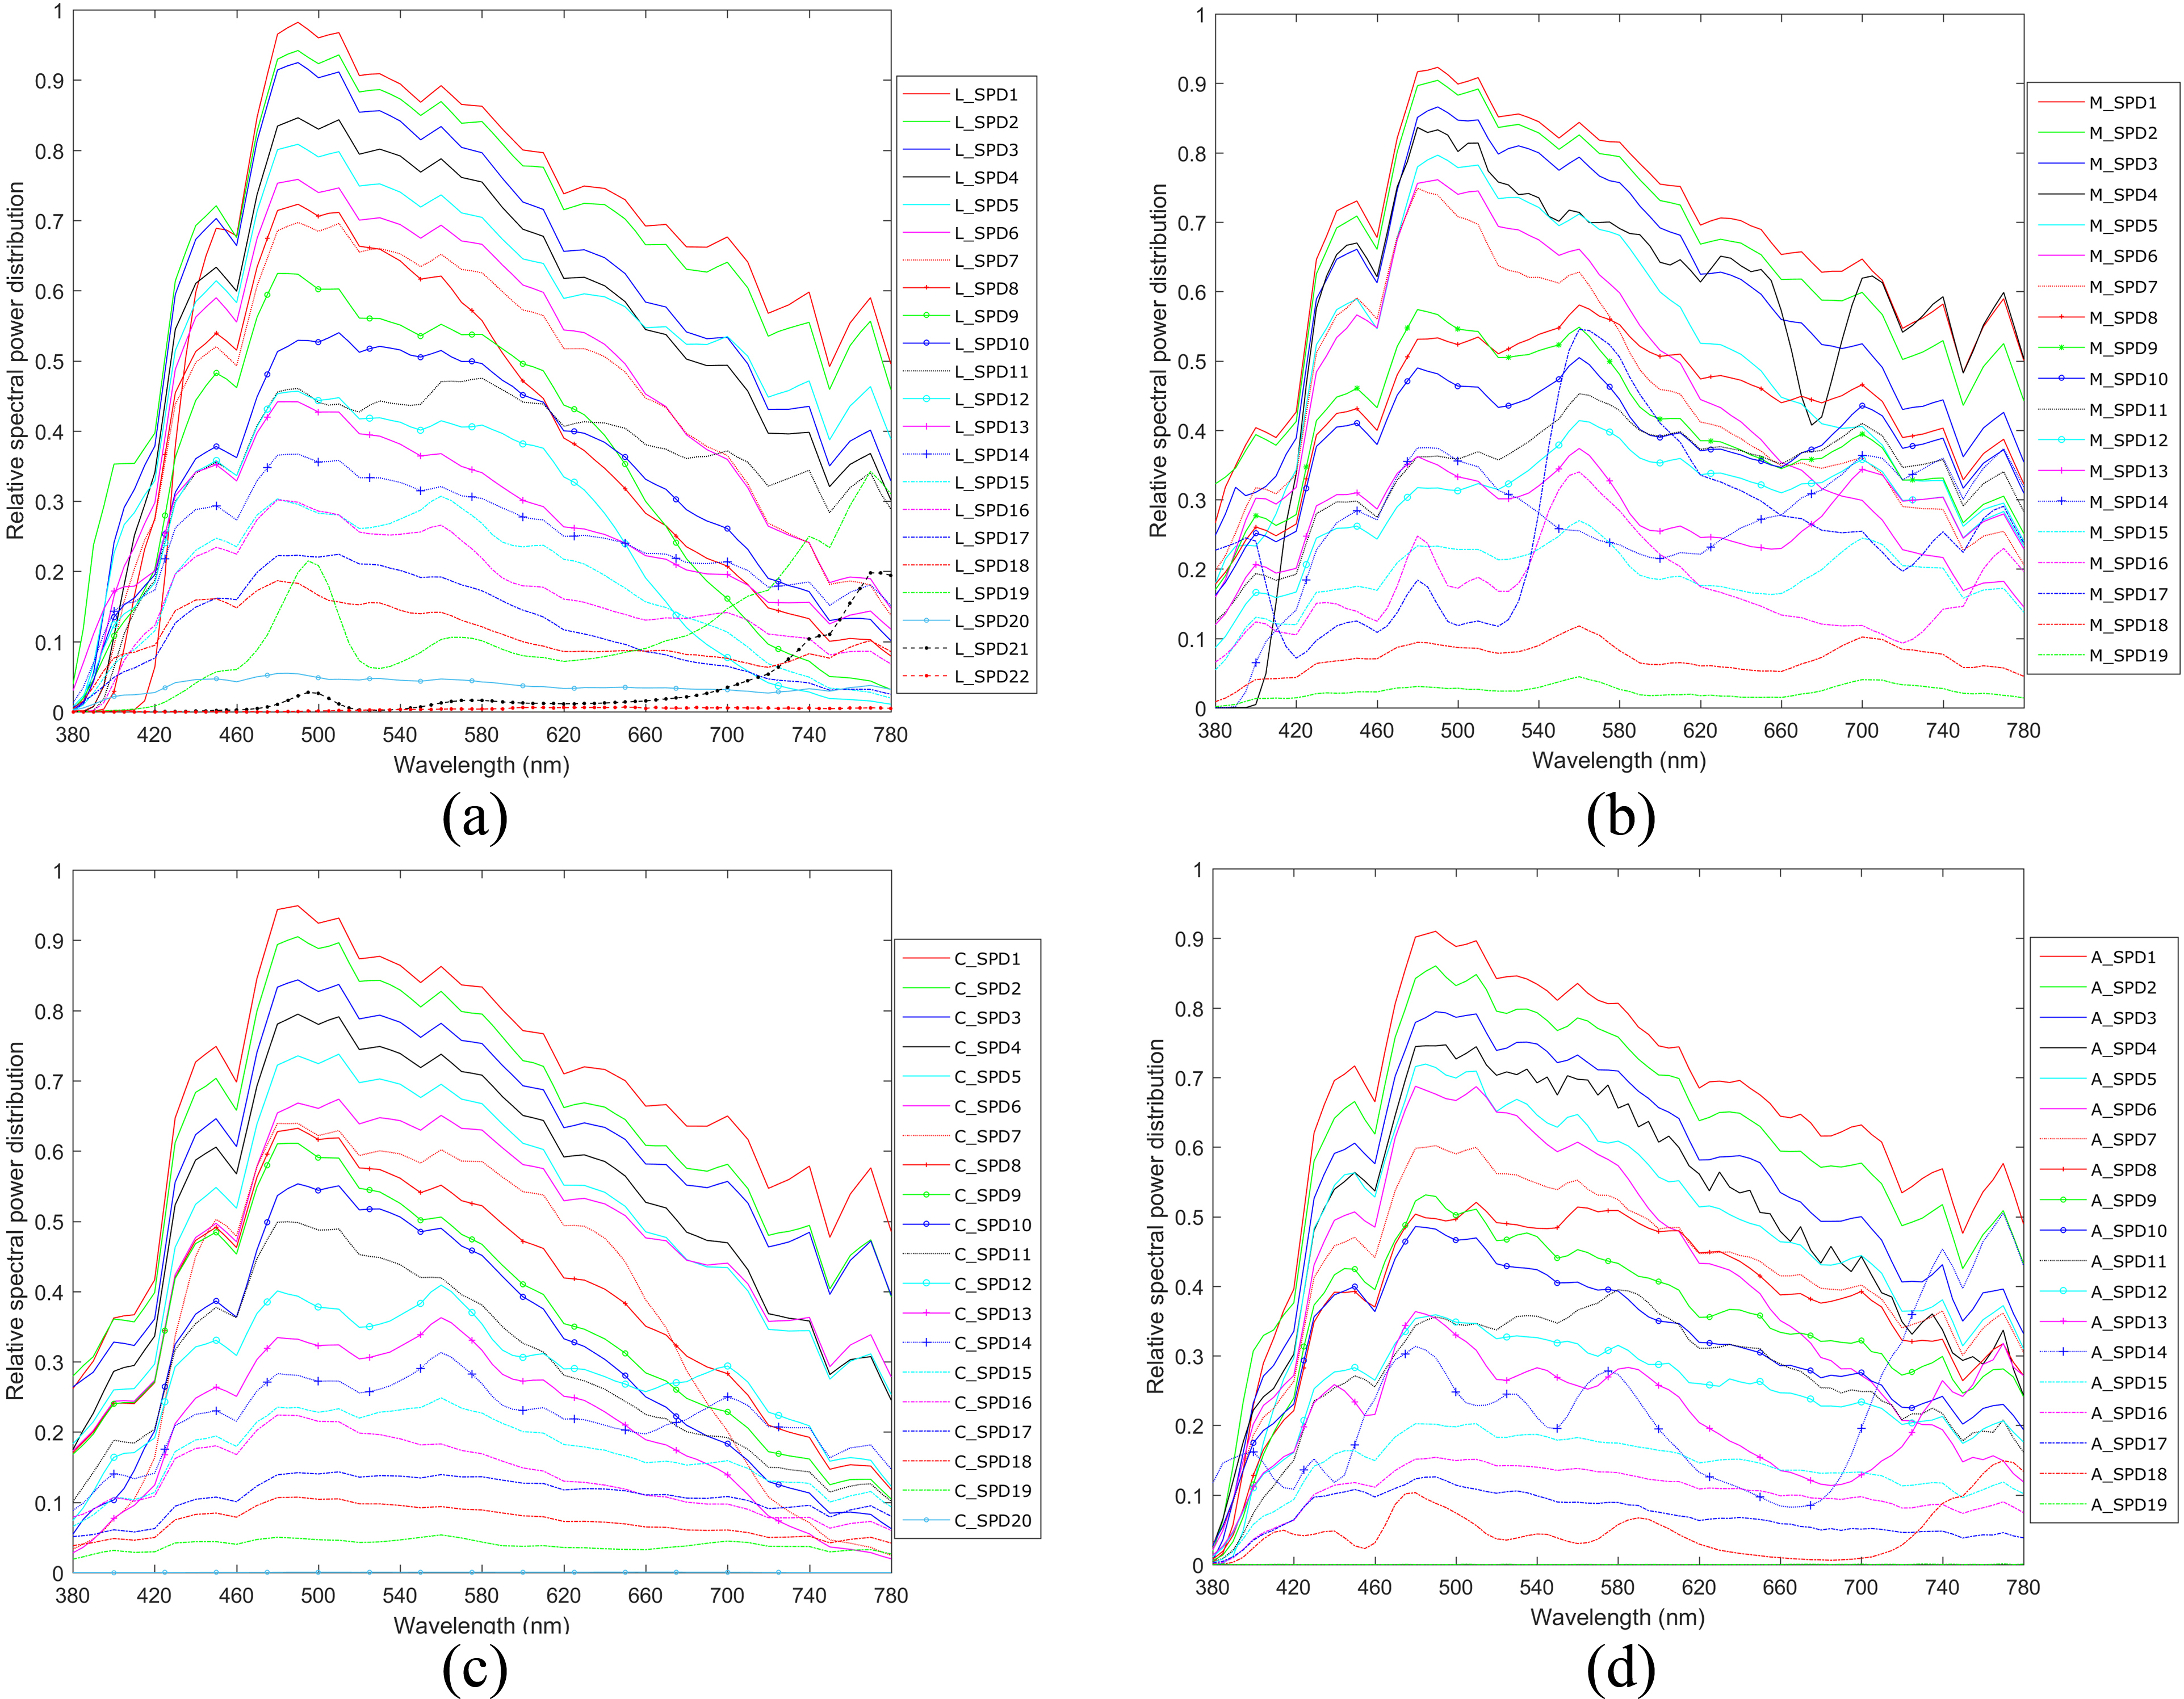
Fig. 3. Relative spectral power distribution of test illuminants (a) L_SPD1 to L_SPD22 (b) M_SPD1 to M_SPD19 (c) C_SPD1 to C_SPD20 (d) A_SPD1 to A_SPD19 determined using Eq. (5), the spectral transmittance of laminated glazing, monolithic glazing, coated glazing, and applied film glazing, respectively, and the standard illuminant D65.
Table 1 shows that the CIE CRI values for the daylight transmitted through different window glazing types with different luminous transmittance values vary from 80 to 95, except for NFRC_ID 16506. The respective CCT values range from 2339 to 7964 K. If we only considered CIE CRI values, all the window glazing types would be characterized to have very good colour rendering properties. However, nearly all DC values are greater than 0.0054 (only exception: NFRC_ID 16027). The daylight transmitted through window glazing NFRC ID 21542 (τD65 ≈ 0.004) has CIE CRI value of 80, whereas other metrics such as Ra,D65, CQS9 and MCRI values are much lower (< 17). It is worth to mention that the CQS9 and the MCRI both use 0 to 100 scale.
Table 1
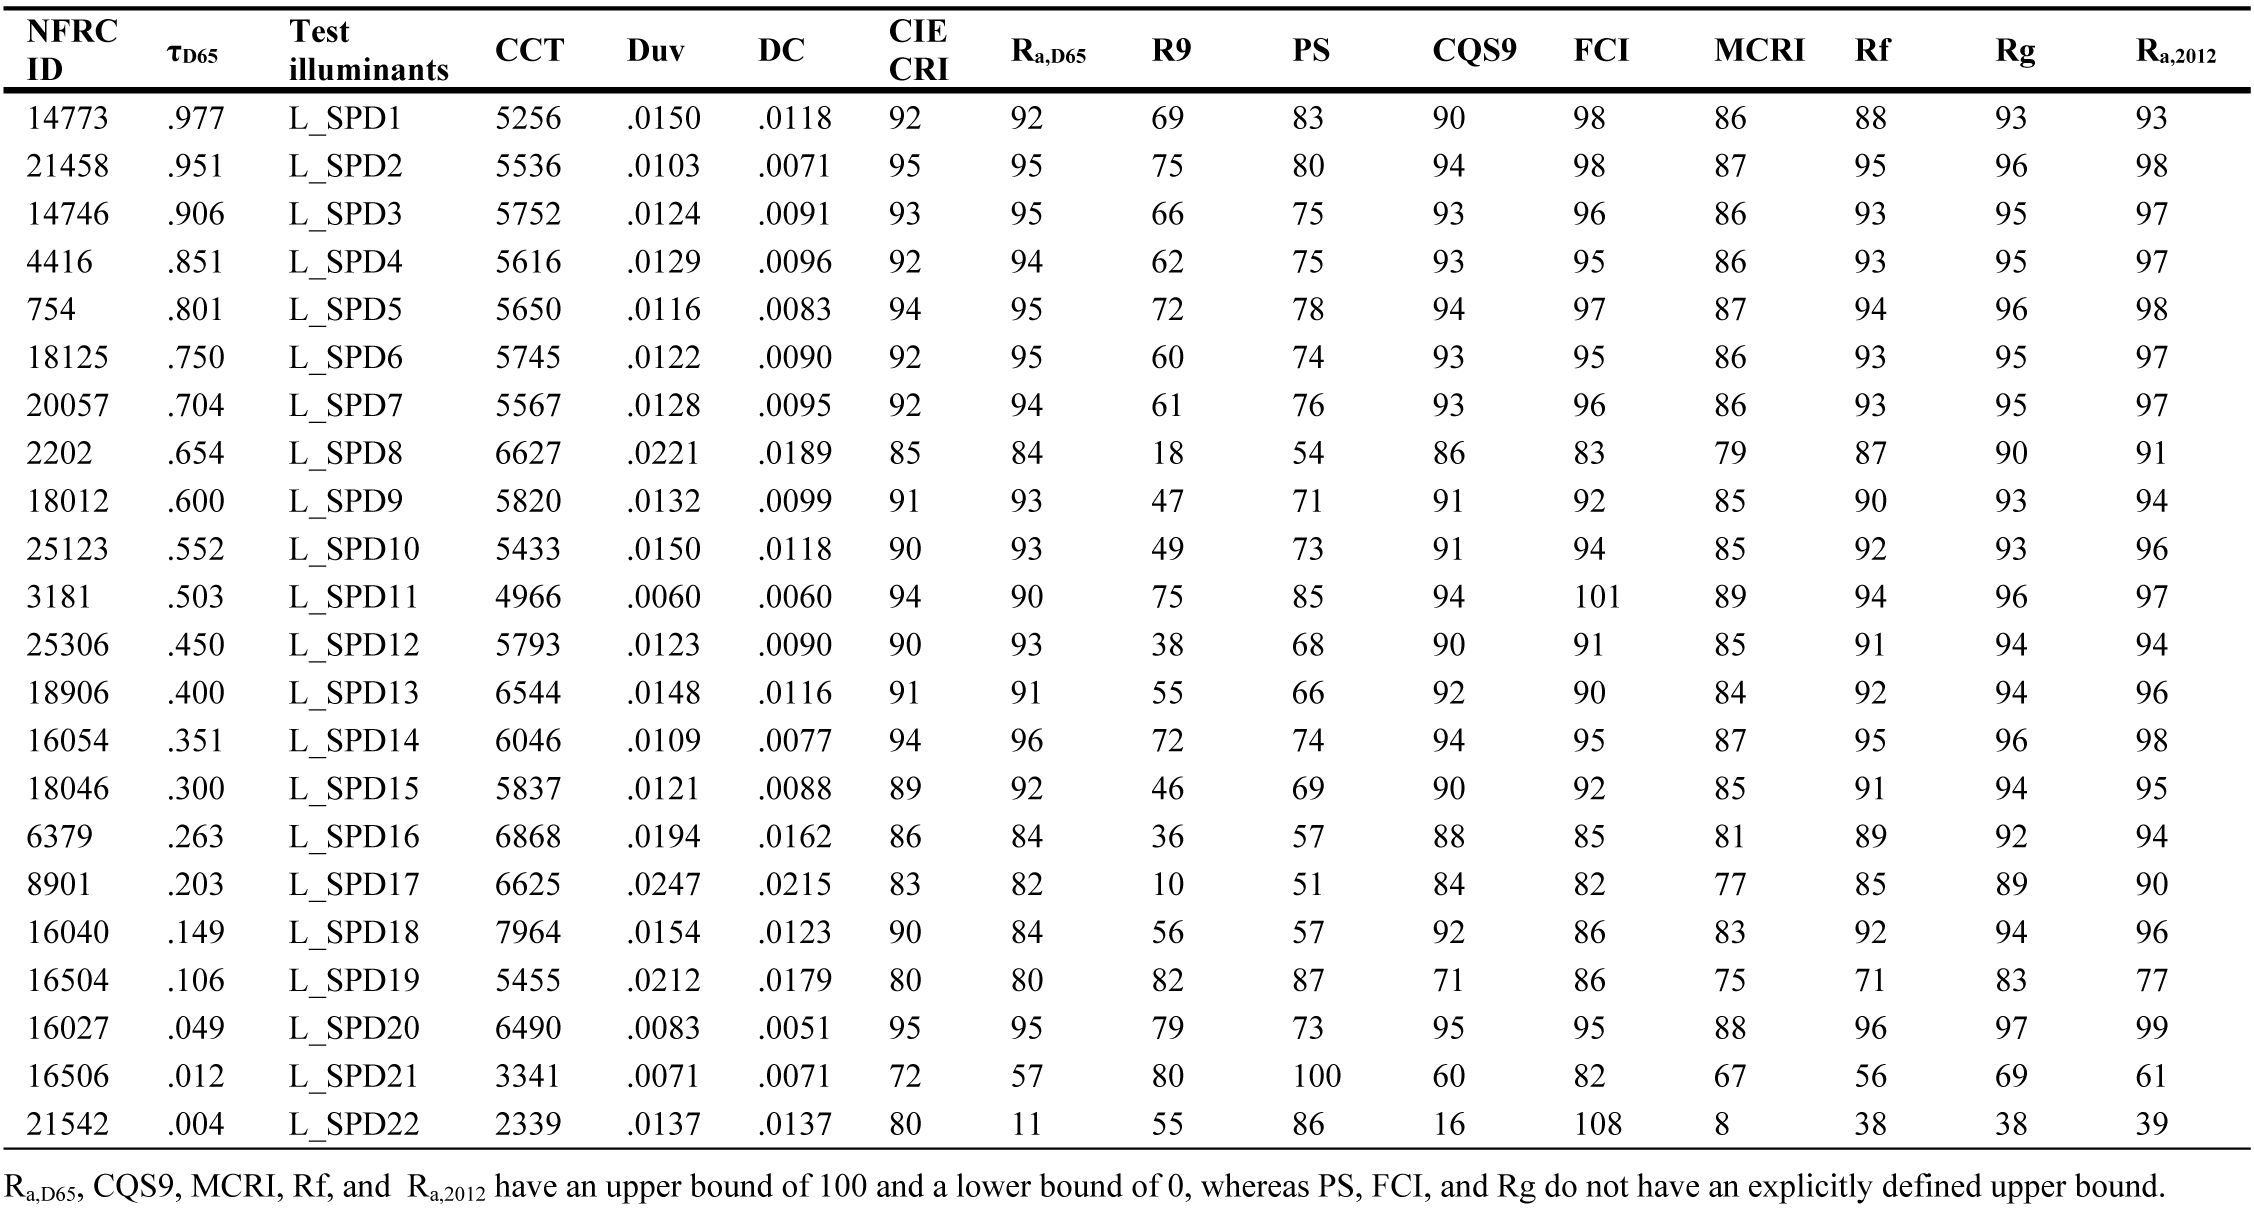
Table 1. Luminous Transmittance (τD65), NFRC_ID and Colour characteristics of the daylight transmitted through laminated window glazing. (R9 is the CIE special colour rendering index of RED sample. CQS9 is Colour Quality Scale version 9. Rf and Rg respectively indicate IES TM-30 Fidelity Index and colour gamut.)
4. Discussion and conclusions
The results presented in Table 1 show that the Duv values for daylight transmitted through different window glazing types have positive values, i.e. their chromaticity coordinates lie above the black body curve. Theoretically, this transmitted light will not be preferred by the user, as Dangol et al. [31] and Islam et al. [32] found that the observer preferred LED SPDs (spectral power distribution) with Duv values of the light sources were either negative or close to the black body locus. Duv values of light sources affect subjective preference. However, the influence of Duv value on the colour rendering properties of light is not clear yet.
The DC values of daylight transmitted through laminated window glazing types are greater than 0.0054 (see Table 1). As mentioned above, the CIE CRI method may not work correctly any more for DC values greater than 0.0054. Therefore, by only looking at CIE CRI values, it is hard to judge the colour rendering properties of transmitted light through different glazing types. DC values of daylight transmitted through monolithic, coated and applied film window glazing are closer to the black body curve than the ones transmitted through laminated window glazing types. Ghosh and Norton [17] found that when the transmittance of the switchable window glazing increases, the CIE CRI also increases and the CCT decreases. However, this study does not support these findings of Ghosh and Norton. Their conclusion may be based on observations collected from only one particular type of switchable window glazing. This study considered different types of window glazing and leads to different conclusions. The increment or decrement of CIE CRI and CCT values entirely depend upon the type of material used to manufacture the window glazing rather than the luminous transmittance value.
It is a well-known fact that the spectral transmittance of window glazing significantly affects the colour rendering properties of interior daylight. Almost all the window glazing types considered in this study fail to fulfil DC criterion to calculate CIE CRI. The daylight transmitted through laminated window glazing have higher Duv or DC value than the daylight transmitted through others window glazing (considered in this study). Even the daylight transmitted through laminated window glazing with luminous transmittance of 97% i.e. L_SPD1 can not match DC criterion, whereas, the daylight transmitted through other window glazing with luminous transmittance greater than 90% have comparably better DC values. Also, the colour vector graphic (from TM-30-15 [22]) (Fig. 4) shows that the L_SPD1 cover relatively less gamut than other SPDs. It was also seen that laminated window glazing which has a luminous transmittance nearly equal to zero (L_SPD22, Table 1) has a CIE CRI value of 80. However, if we considered other metrics the values are much lower (see Table 1). This shows that the light transmitted through laminated window glazing has comparatively low colour quality. Therefore, special care should be taken while designing the laminated window glazing as light transmitted through it might not be preferred by the occupants. There is no doubt that the CIE CRI has many deficiencies and should not be considered as design aspect not even DC criterion is matched.
Figure 4
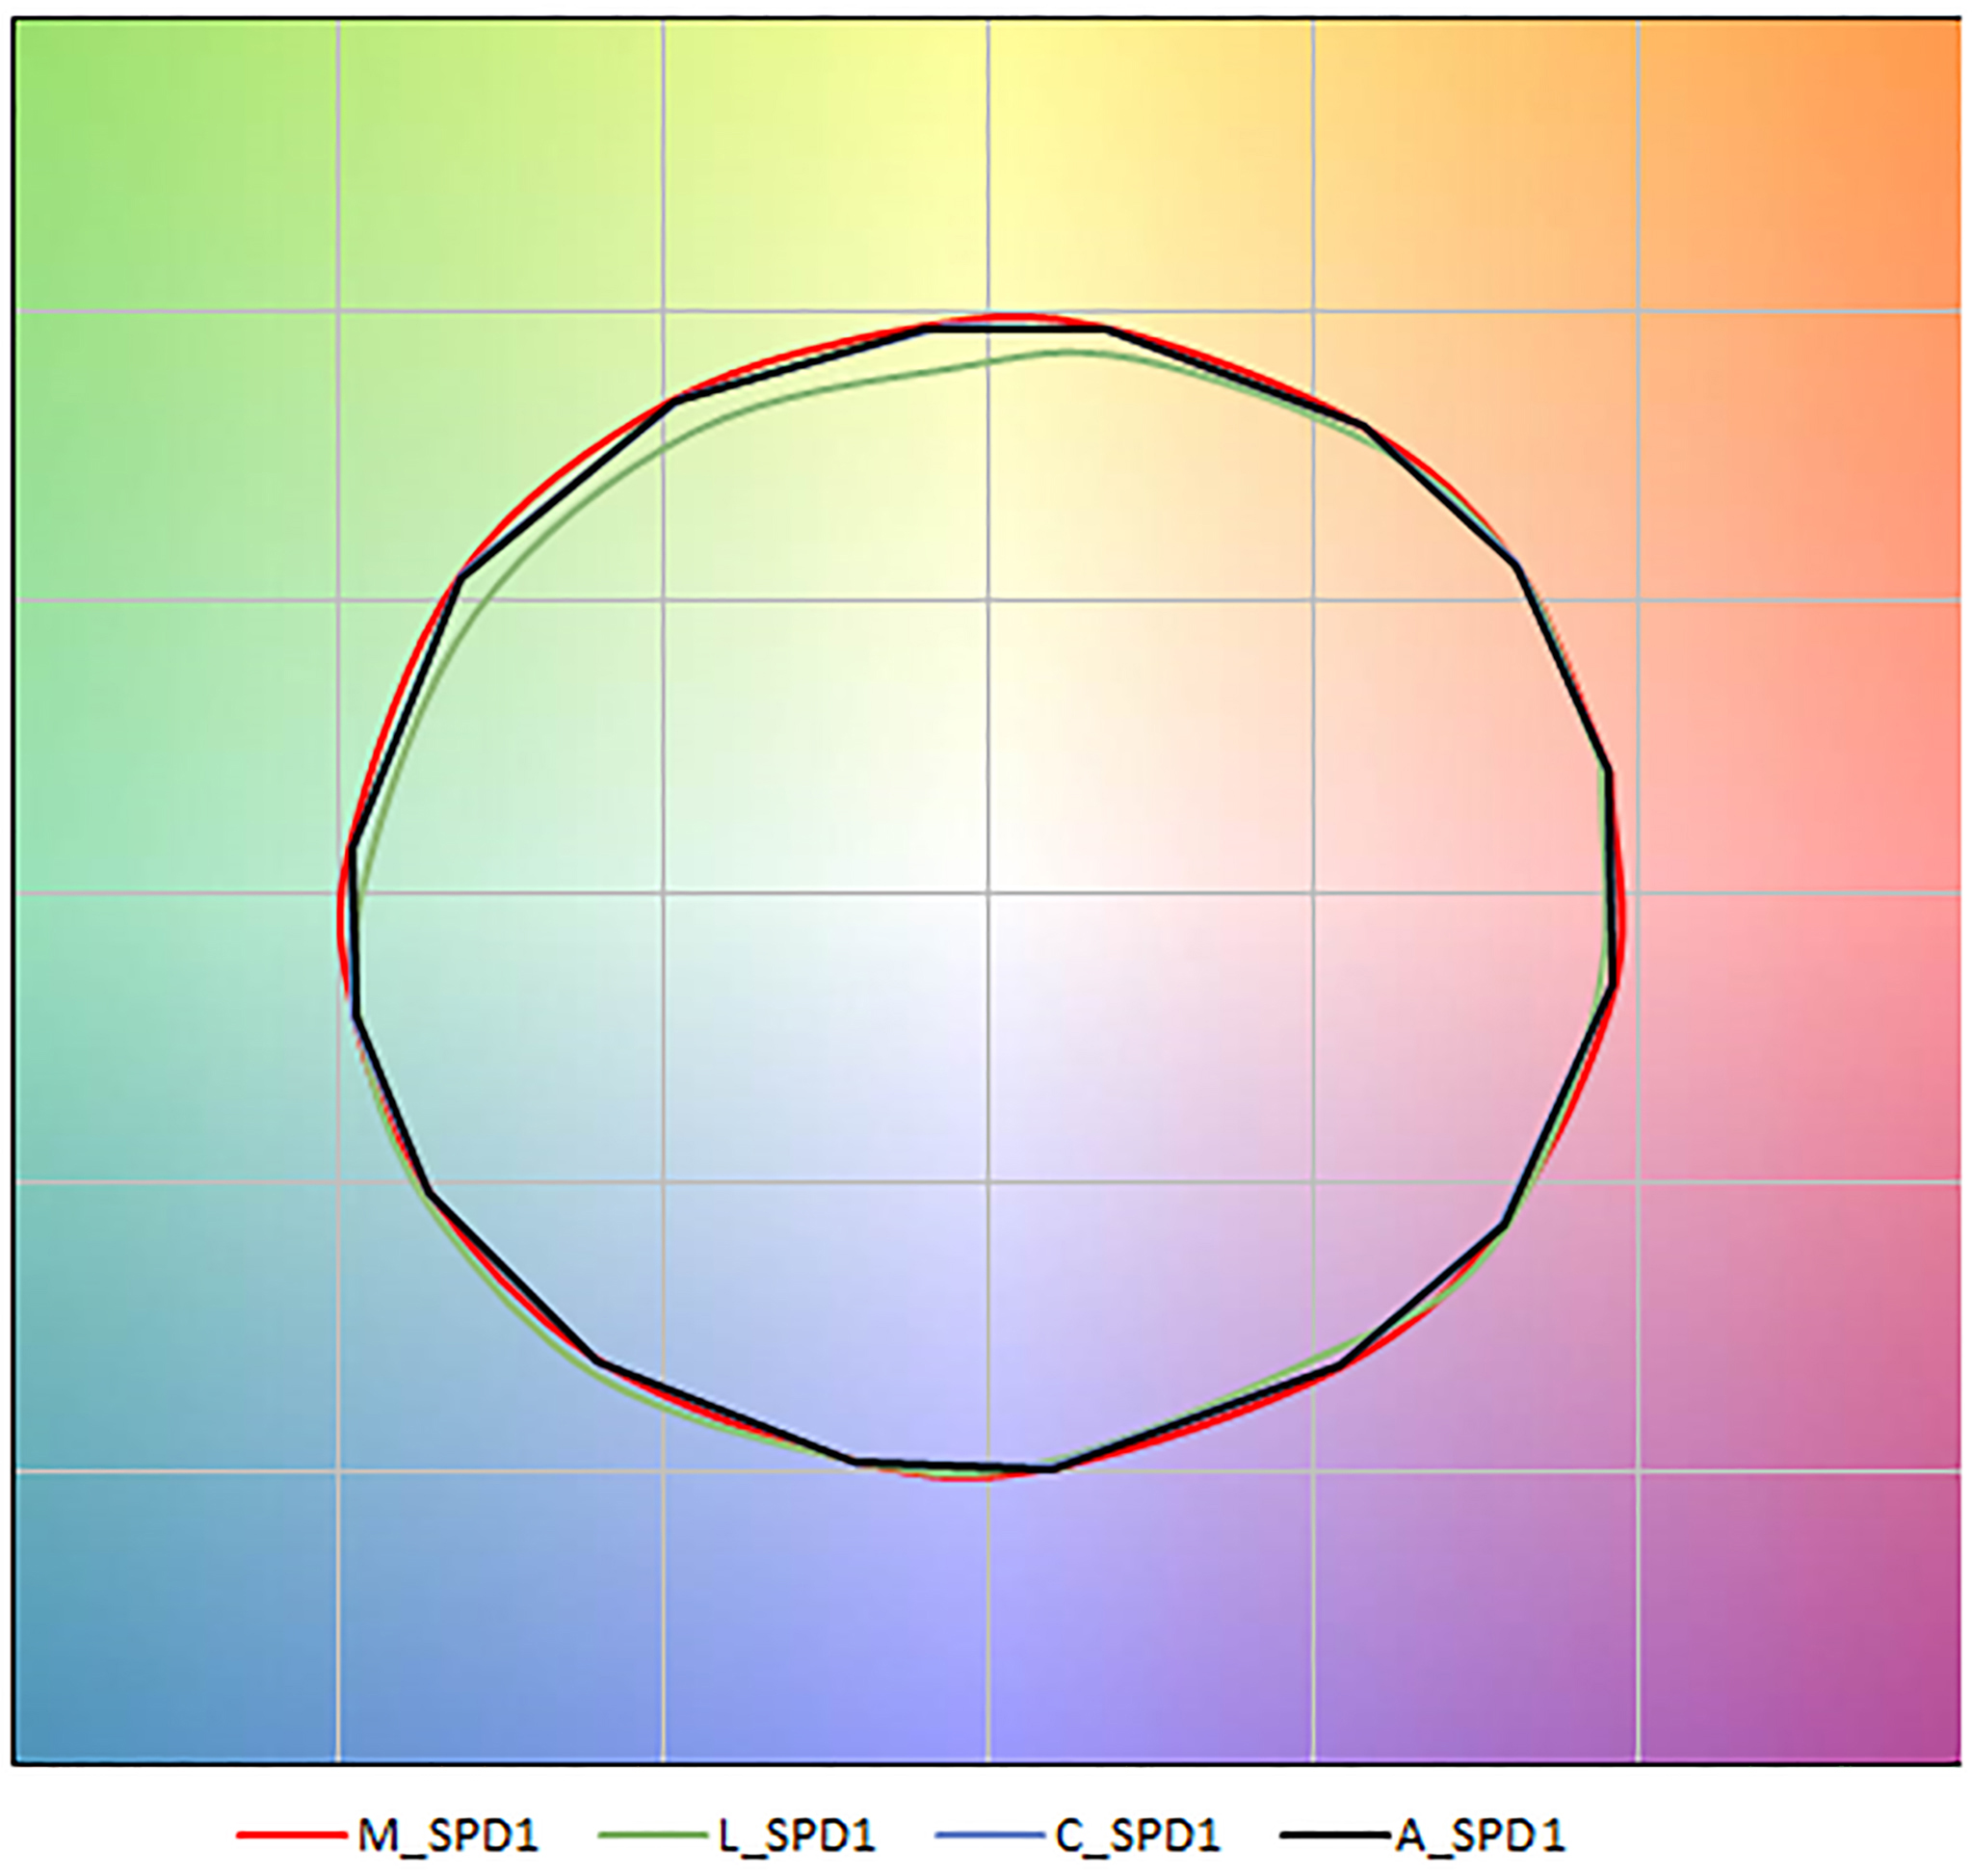
Fig. 4. Colour vector graphic of M_SPD1, L_SPD1, C_SPD1 and A_SPD1.
Moreover, from the studies [31–34], it was clear that R9 is not an indicator of subjective preference. However, the chroma and colourfulness values of object colours calculated using CAM02-UCS have a great influence on the subjective preferences, especially for the naturalness and colourfulness (subjective measure). The daylight transmitted through laminated glazing having luminous transmittance of 0.97 i.e. L_SPD1 have higher chroma and colourfulness values for Blue, Green and Yellow colour of Macbeth colour checker (MCC) than to L_SPD22 (see Table A5 in Appendix A). This a strong indication that even L_SPD22 have CIE CRI value of 80, it will not be preferred by the users. Under this test illuminant i.e.L_SPD22 (Table 1), the red objects will look very saturated and other colour objects such as blue, green or yellow will lose its actual colour property.
From Tables 1-4 and A5-A8, it is clear that when Duv values of test illuminant are greater than +0.015, the chroma and colourfulness values of Red colour of MCC chart under that illuminant are lower, which means such illuminant can’t preserve the colourfulness of red objects. Therefore, the higher value of CIE CRI or other metric does not by itself guarantee the good colour quality. If the Duv or DC values of the illuminants are not within the limit, the prediction provided by the colour quality metric(s) may not be correct. CIE is currently working on developing new metrics within their Technical Committees TC1-91 and TC1-90. Such new metric(s) need to be applicable not only to the electric light sources but also to daylight in buildings with clear criterion than DC.
Table 2
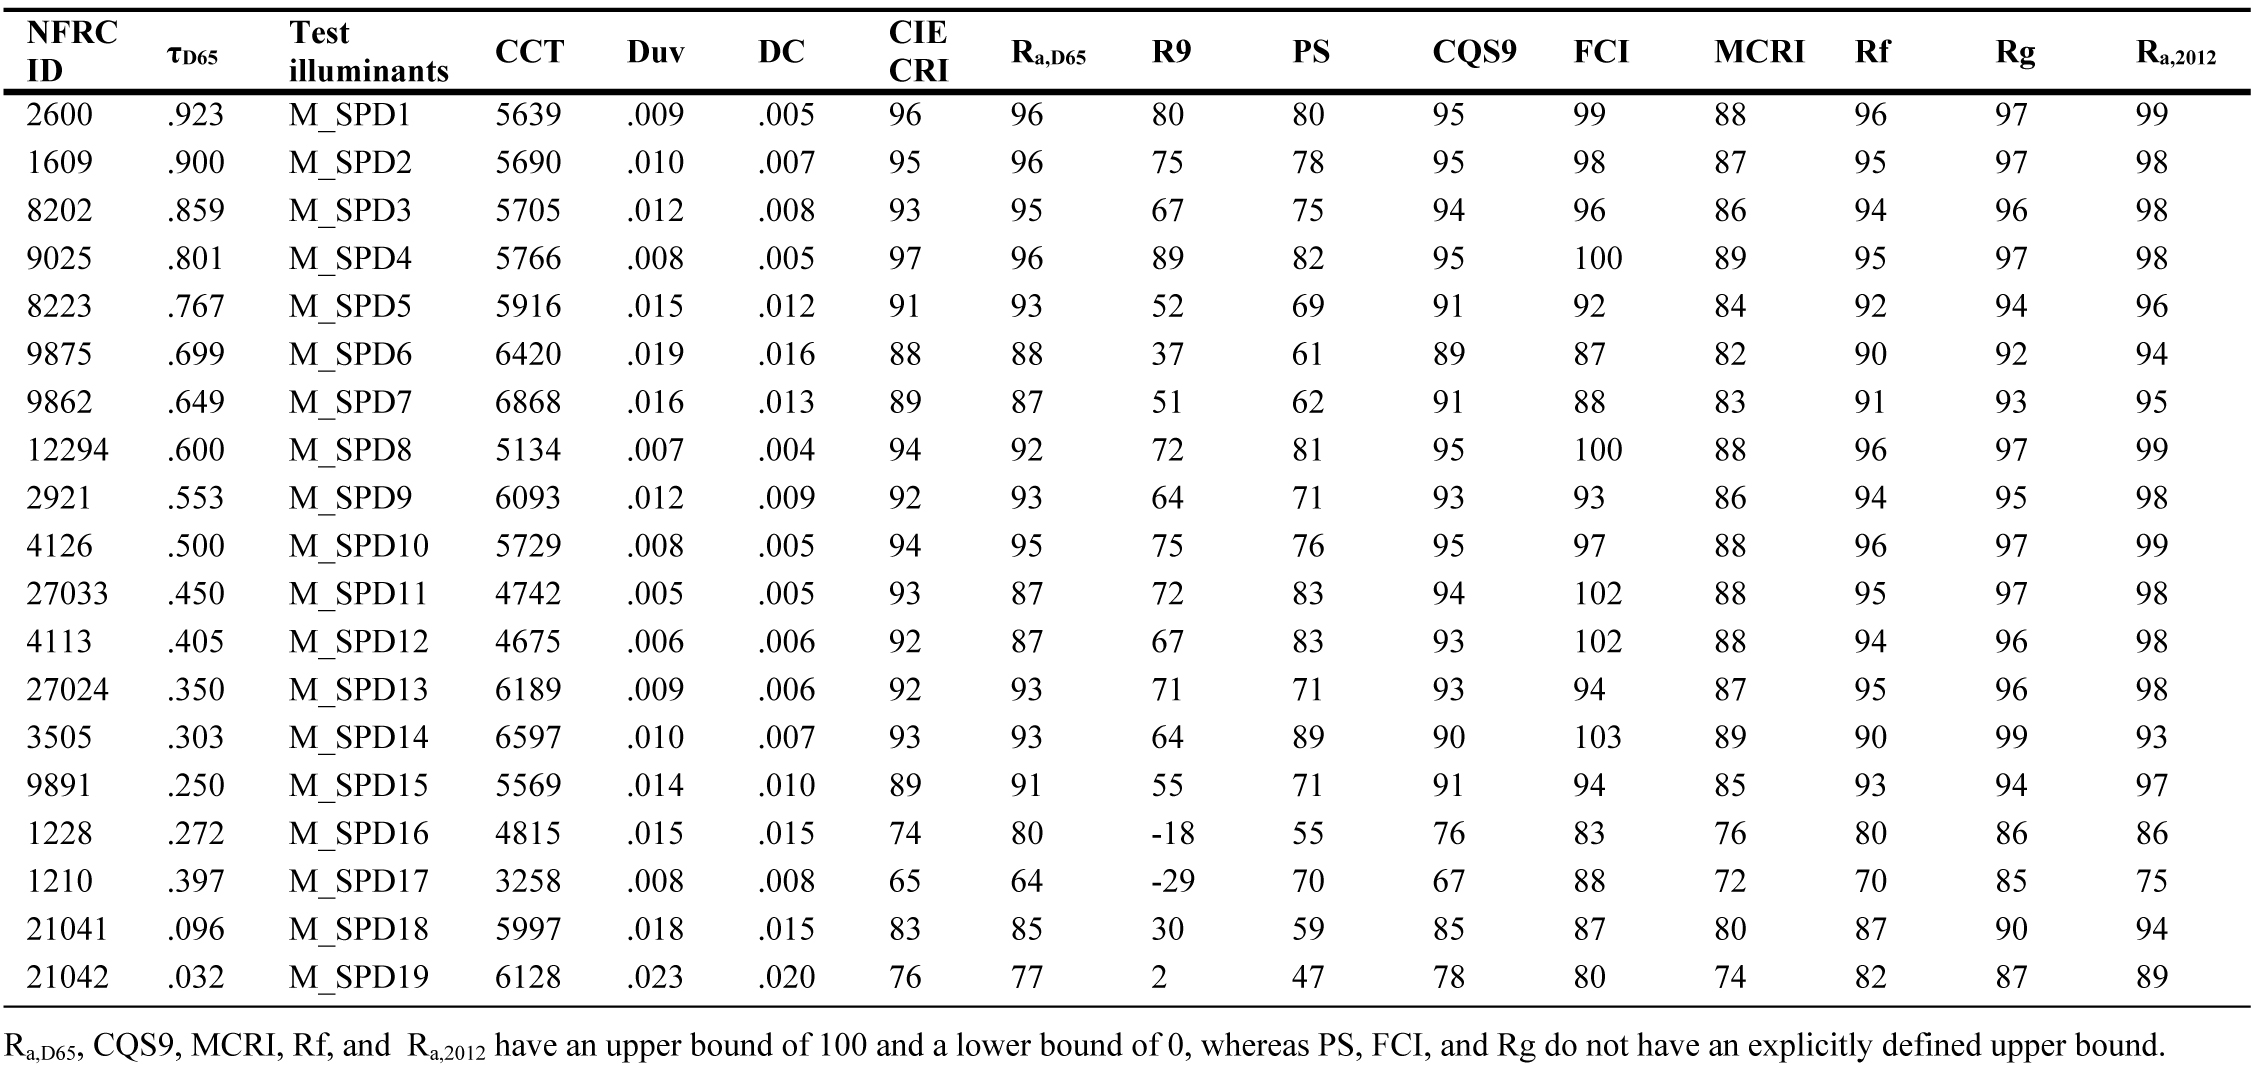
Table 2. Luminous Transmittance (τD65), NFRC_ID and Colour characteristics of the daylight transmitted through monolithic window glazing. (R9 is the CIE special colour rendering index of RED sample. CQS9 is Colour Quality Scale version 9. Rf and Rg respectively indicate IES TM-30 Fidelity Index and colour gamut.)
Table 3
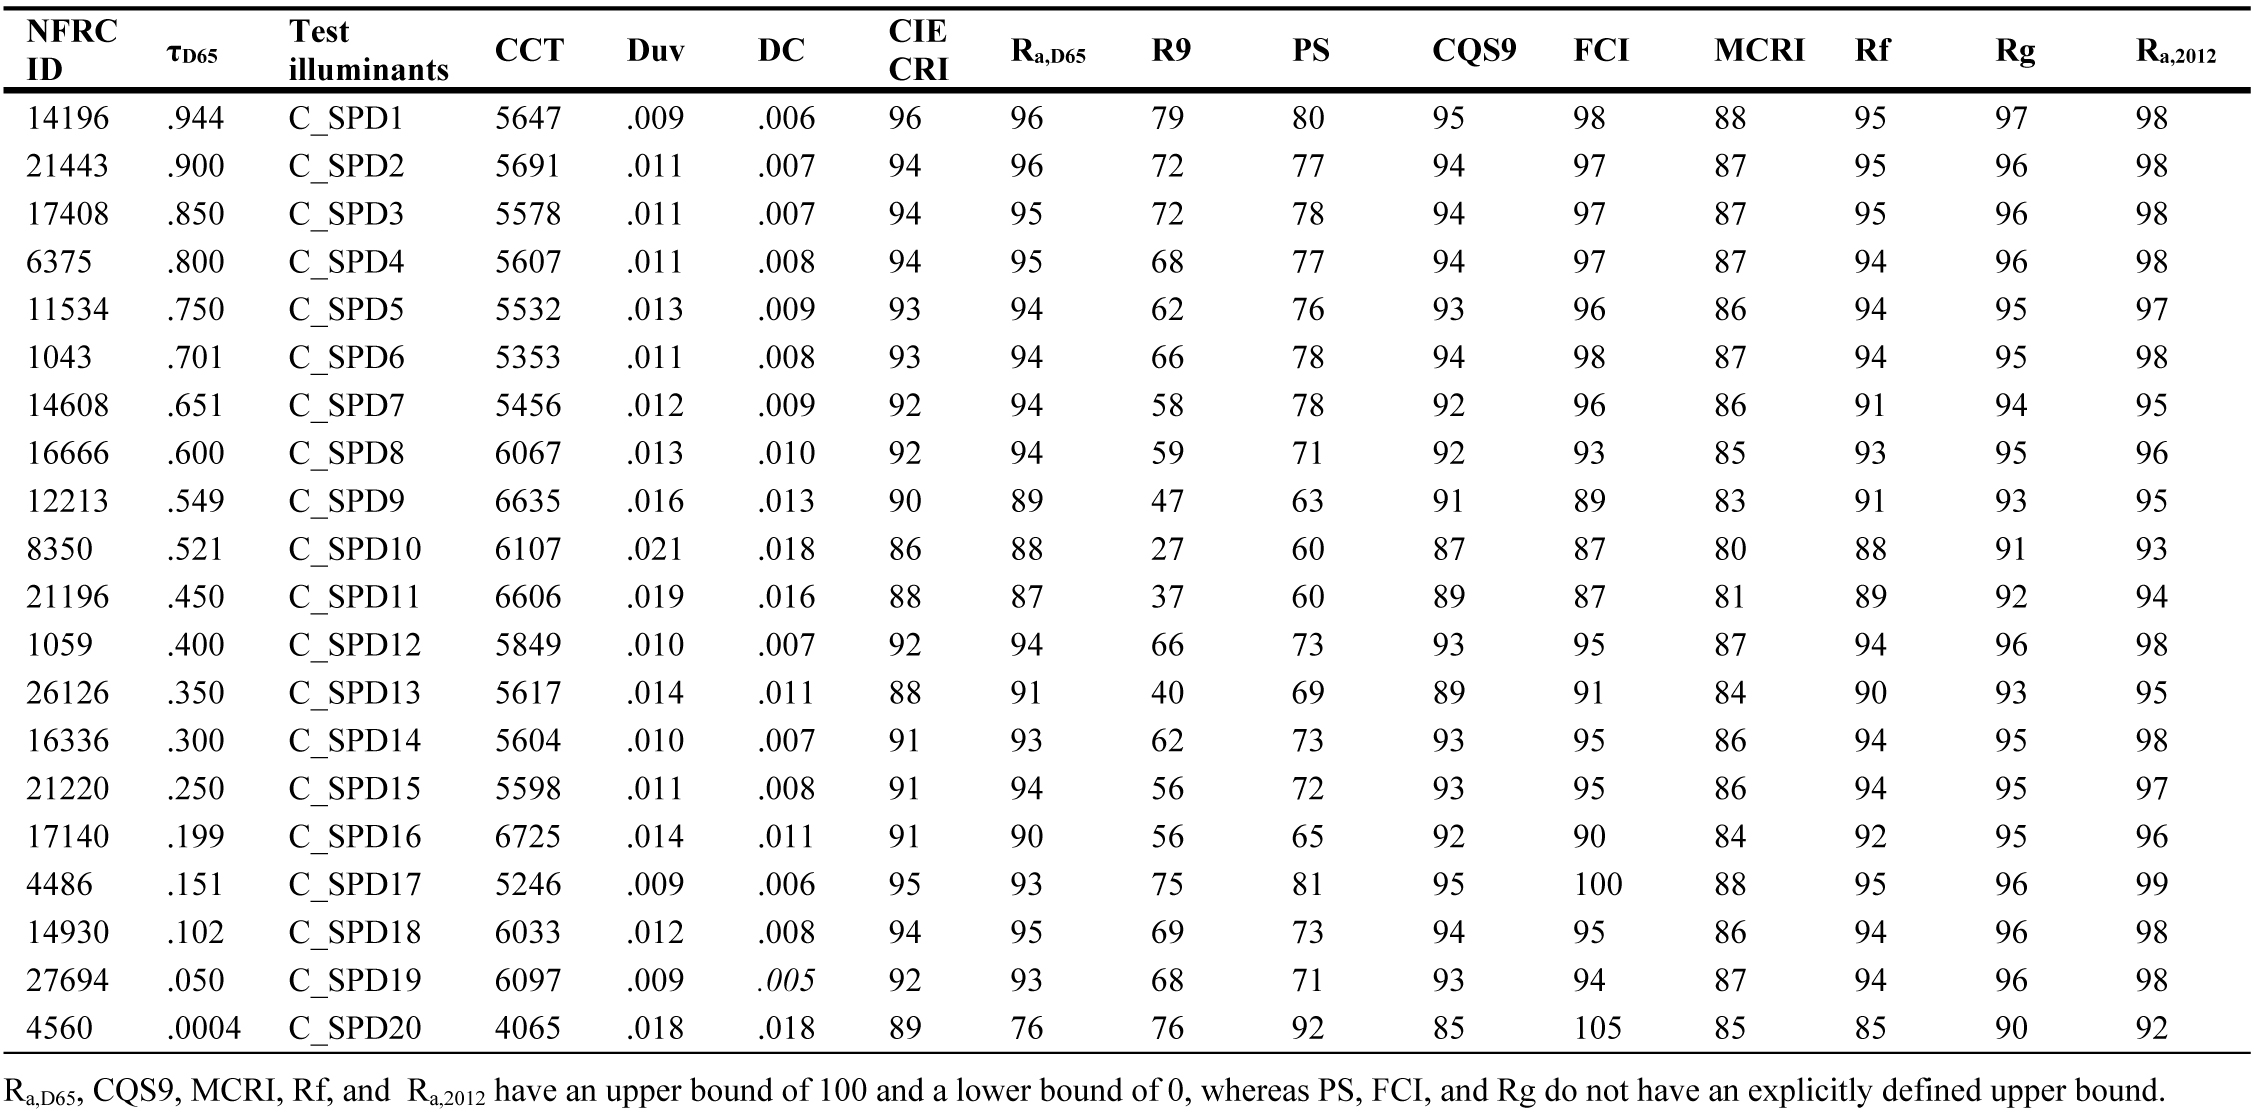
Table 3. Luminous Transmittance (τD65), NFRC_ID and Colour characteristics of the daylight transmitted through coating window glazing. (R9 is the CIE special colour rendering index of RED sample. CQS9 is Colour Quality Scale version 9. Rf and Rg respectively indicate IES TM-30 Fidelity Index and colour gamut.)
Table 4
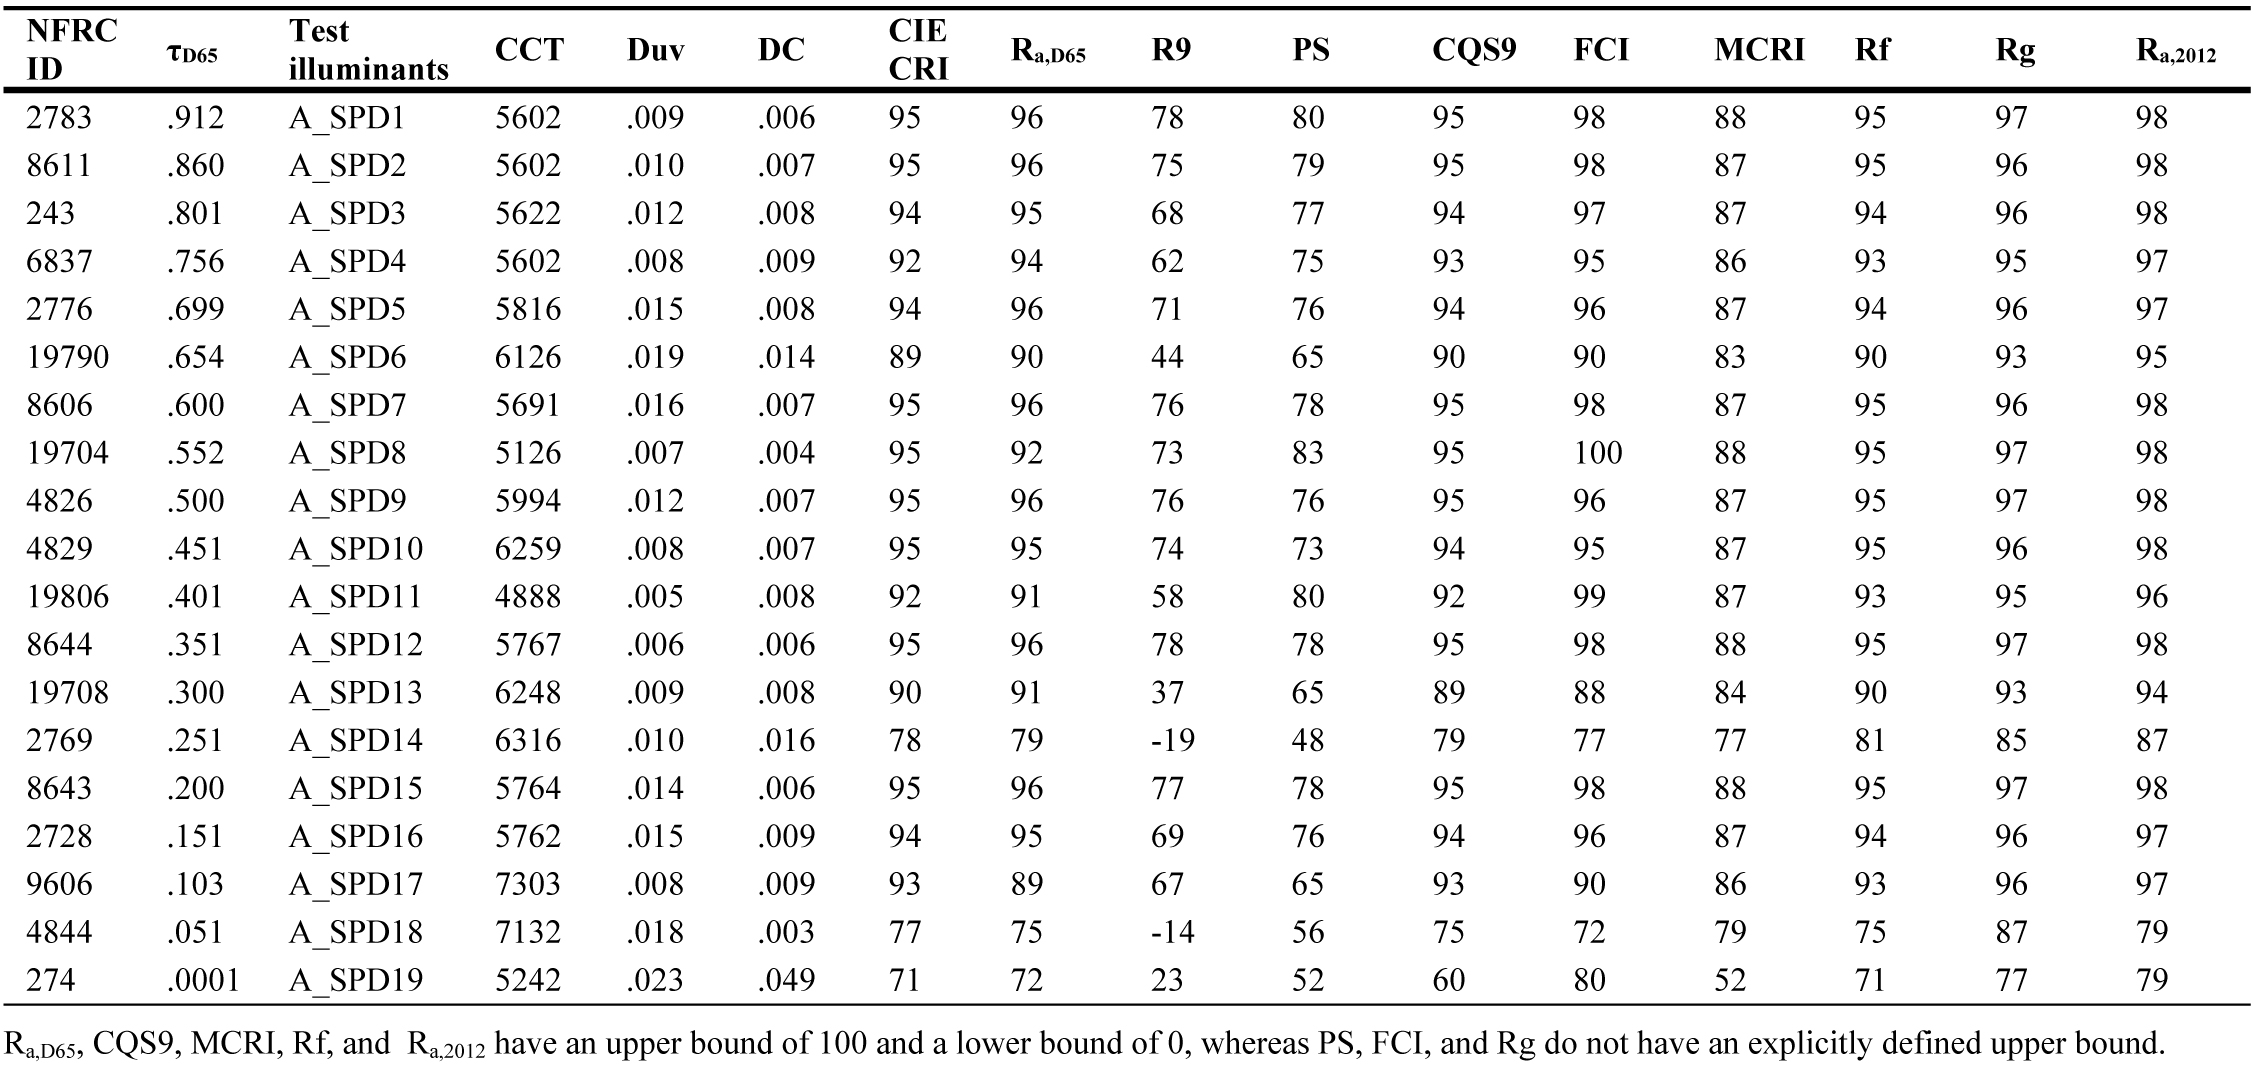
Table 4. Luminous Transmittance (τD65), NFRC_ID and Colour characteristics of the daylight transmitted through applied film window glazing. (R9 is the CIE special colour rendering index of RED sample. CQS9 is Colour Quality Scale version 9. Rf and Rg respectively indicate IES TM-30 Fidelity Index and colour gamut.)
To gain a better understanding on the overall impact of glazing types on the quality of transmitted daylight, it is essential to perform user-acceptance studies using lighting booths or a real room installed with different window glazing systems. A good colour quality metric for daylight systems will provide a quantifiable measure to describe the added value of a daylight system with regards to excellent colour rendering. It would complete the list of characteristics addressing other aspects such as energy savings potential and limitation of glare. While measures for these characteristics need to be defined such that they are applicable to all systems, they also need to take the annual variation of daylight at a specific location into account. Climate-based daylight simulation would not only be applicable to determine the energy savings but also the overall colour quality aspect of a system. Such insights will avoid daylighting designs that do not perform well for a significant fraction of the year.
Acknowledgements
This work is part of the research programme “OPTILIGHT: Mathematical Optimizations for Human Centric Lighting” with project number 14671, which is partly financed by the Netherlands Organisation for Scientific Research (NWO), and which is conducted in the context of a bilateral cooperation between TU/e and Philips Lighting B.V. in the Intelligent Lighting Institute (ILI). The authors would like to thank ir. R.C.G.M. (Roel) Loonen for providing valuable suggestions.
Contributions
R. D., T. K. and A. R. conceived the study. R. D. and T. K. collected & analysed the data and interpreted the results. A. R. supervised computational analyses and advised on all aspects of the study. R. D. wrote the manuscript with contributions from all authors. All authors discussed the results and commented on the manuscript.
Appendix A
The values of chroma and colourfulness presented in Tables A5-A8 were calculated in CAM02UCS using the reflectance of four main colours (red, green, blue and yellow) of MCC chart and different test illuminants.
Table A5
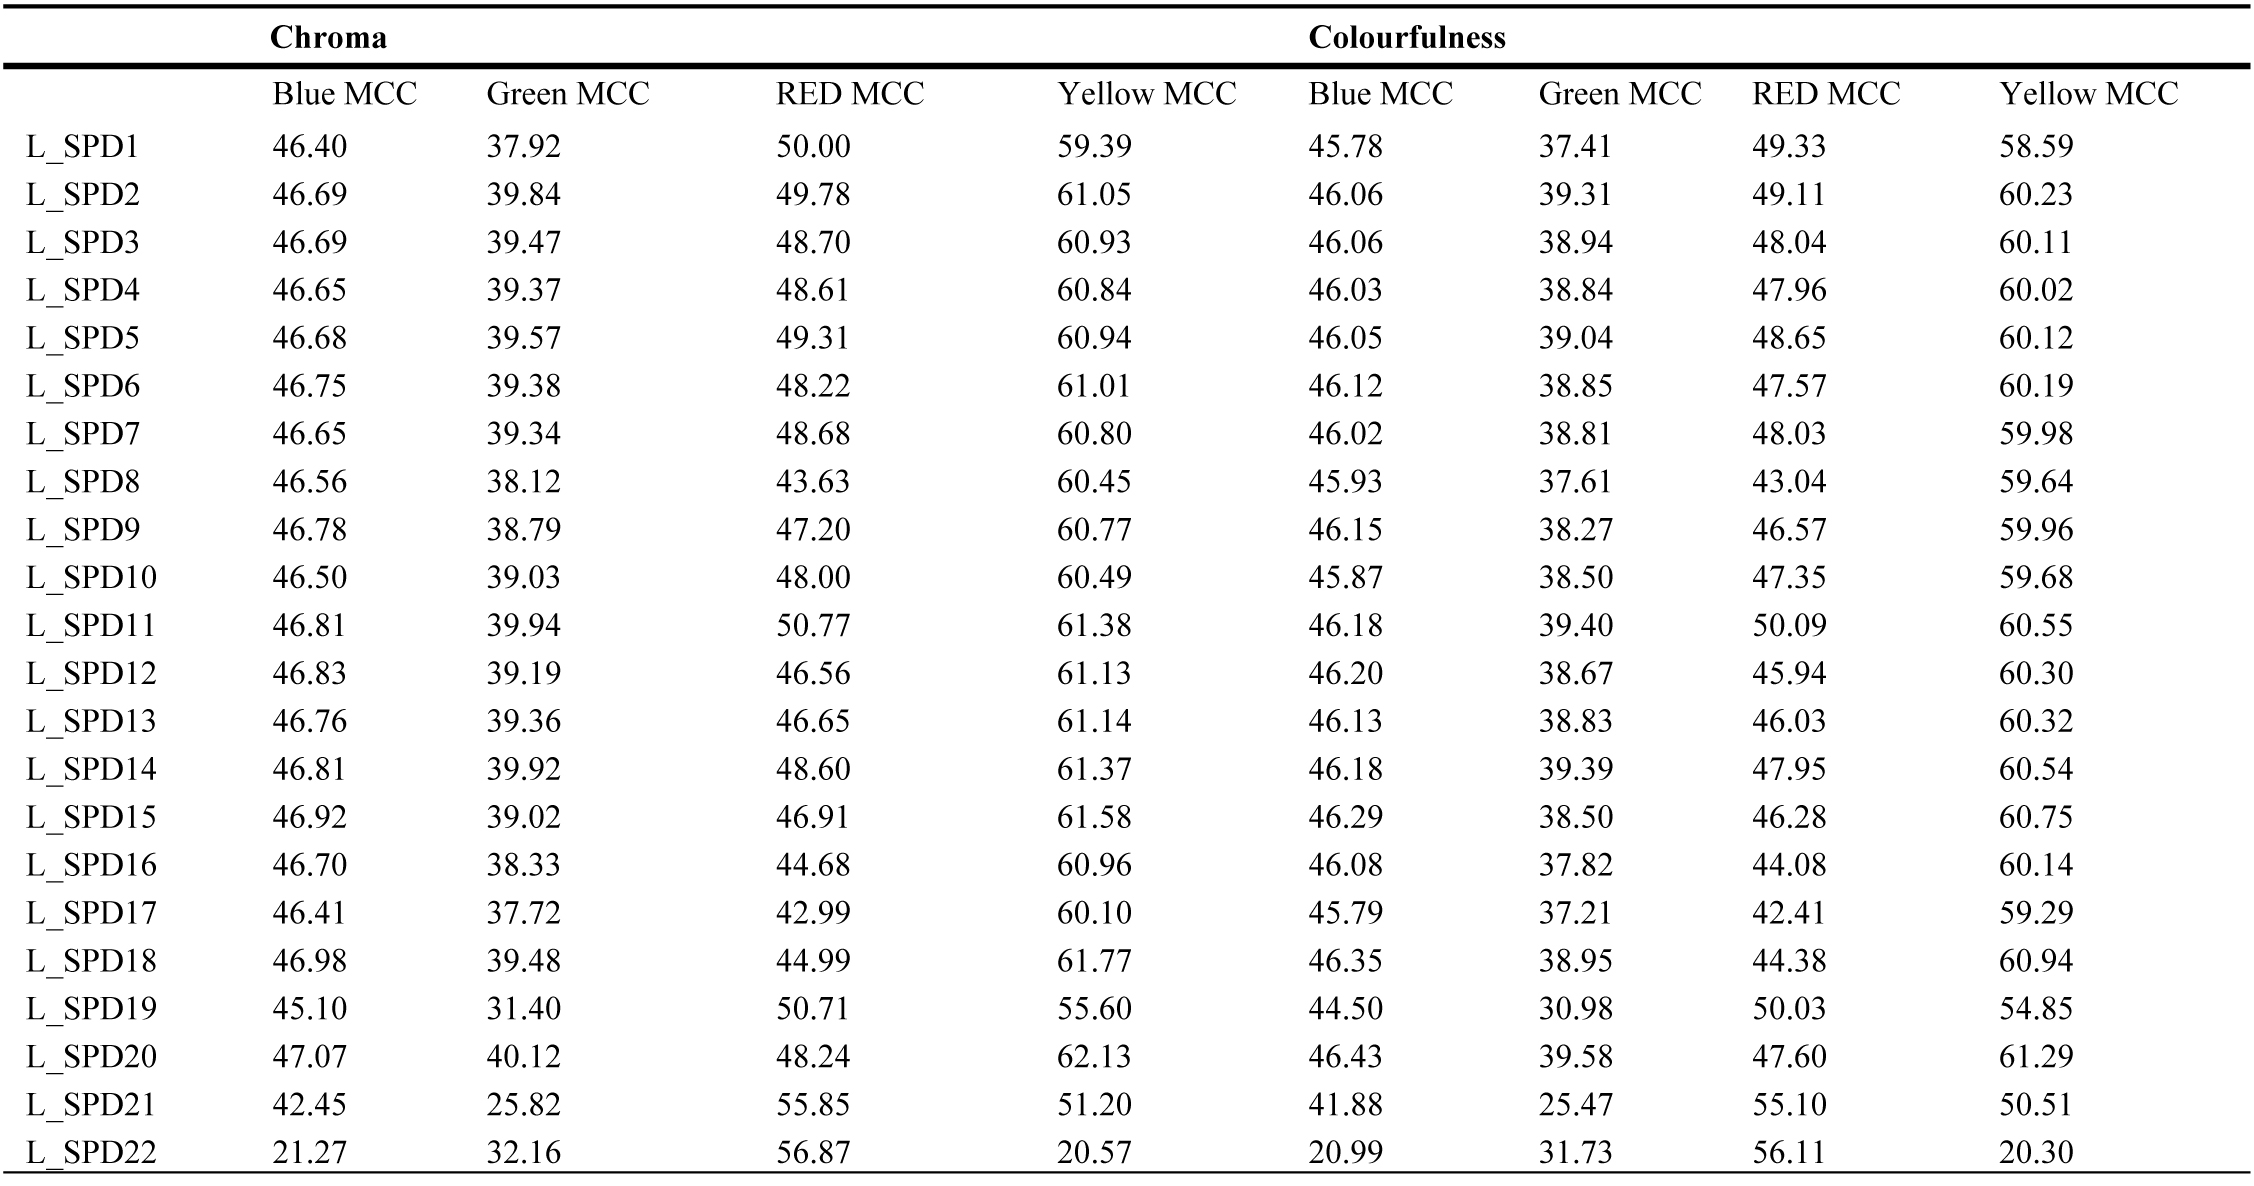
Table A5. Values of chroma and colourfulness of Blue, Green, Red and Yellow colour of Macbeth colour checker (MCC) under different test illuminant (Fig. 2(a)) generated using different laminated window glazing types and CIE standard illuminant D65.
Table A6
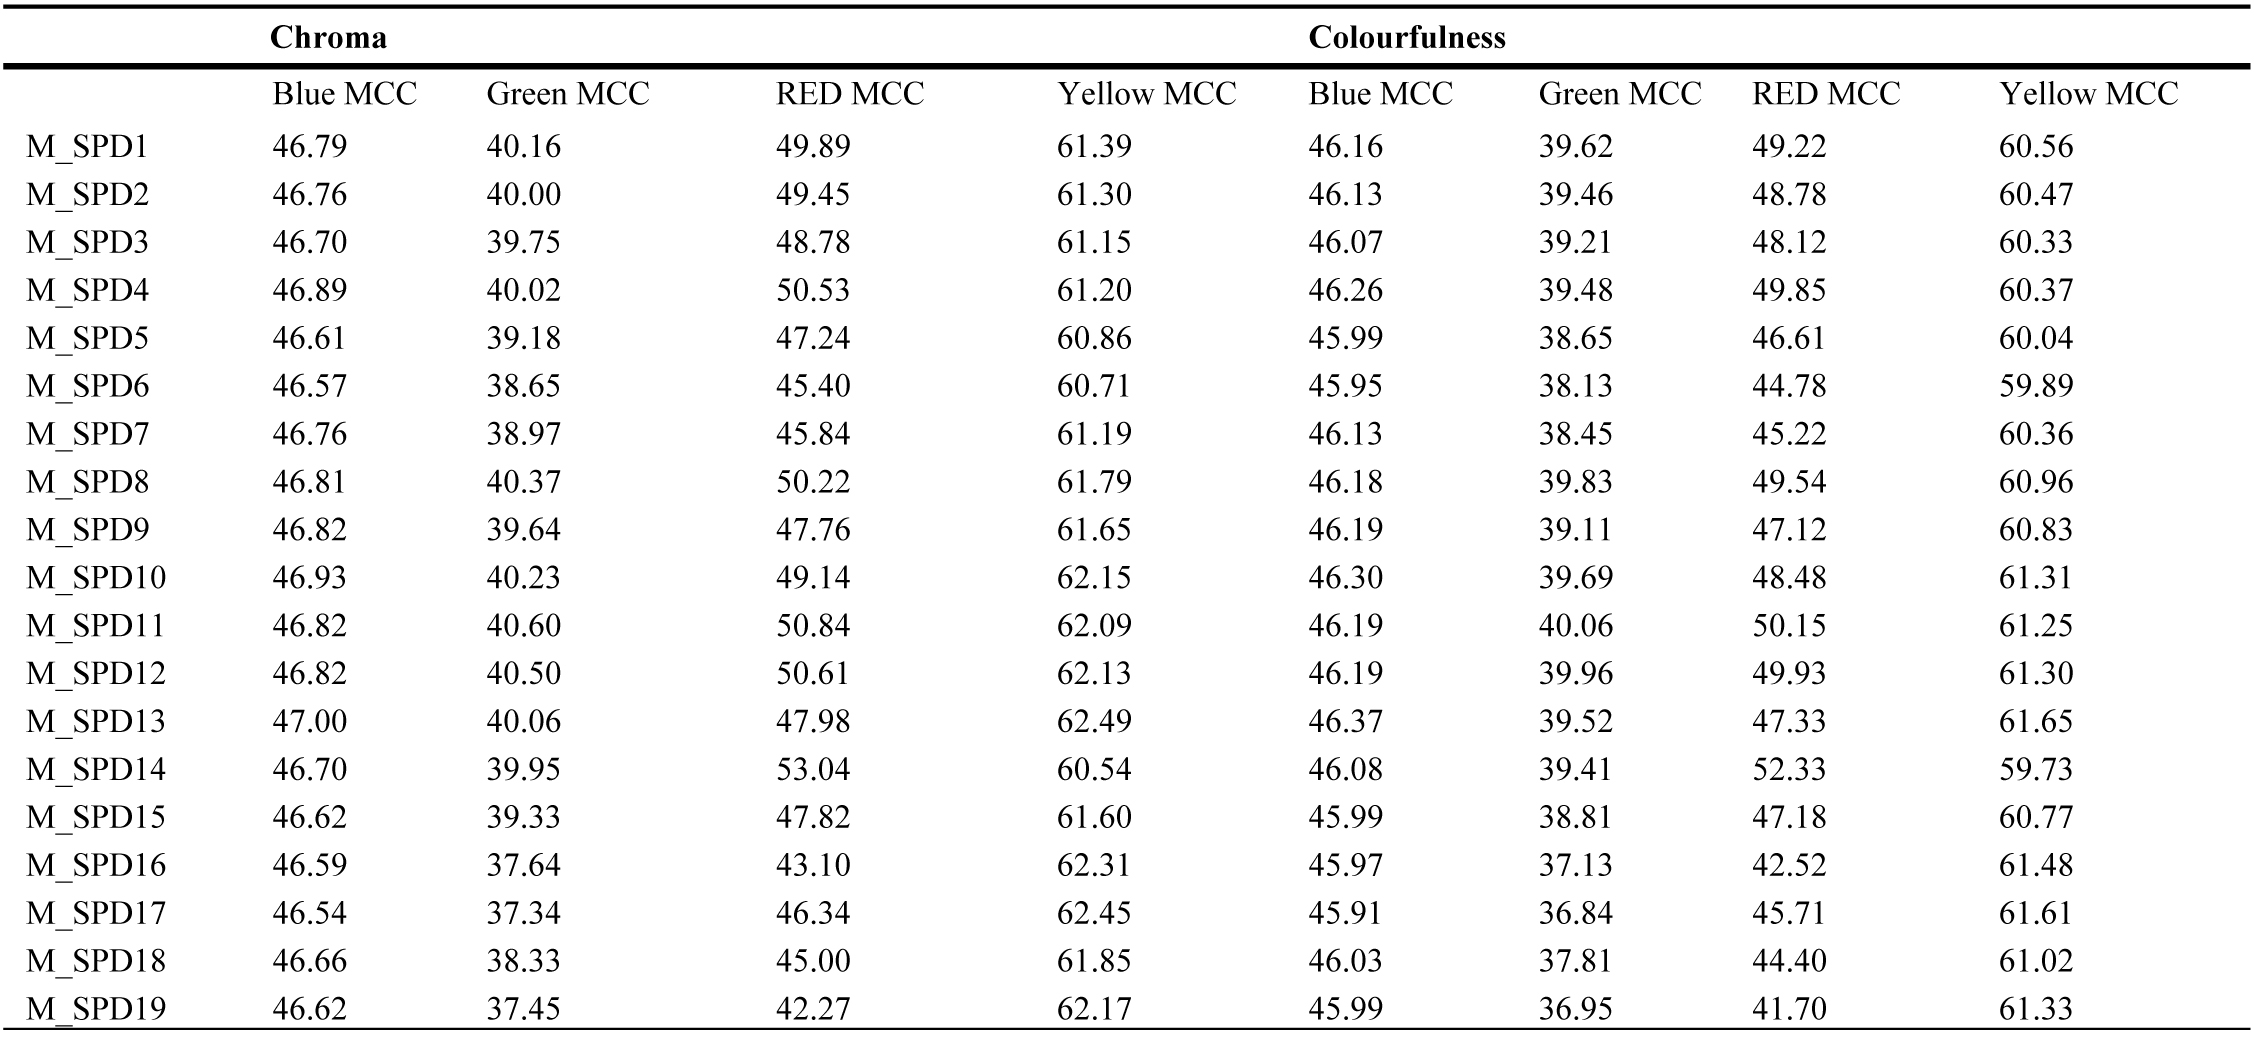
Table A6. Values of chroma and colourfulness of Macbeth colour checker (Blue, Green, Red and Yellow) under different test illuminant (Fig. 2(b)) generated using different Monolithic window glazing types and CIE standard illuminant D65.
Table A7
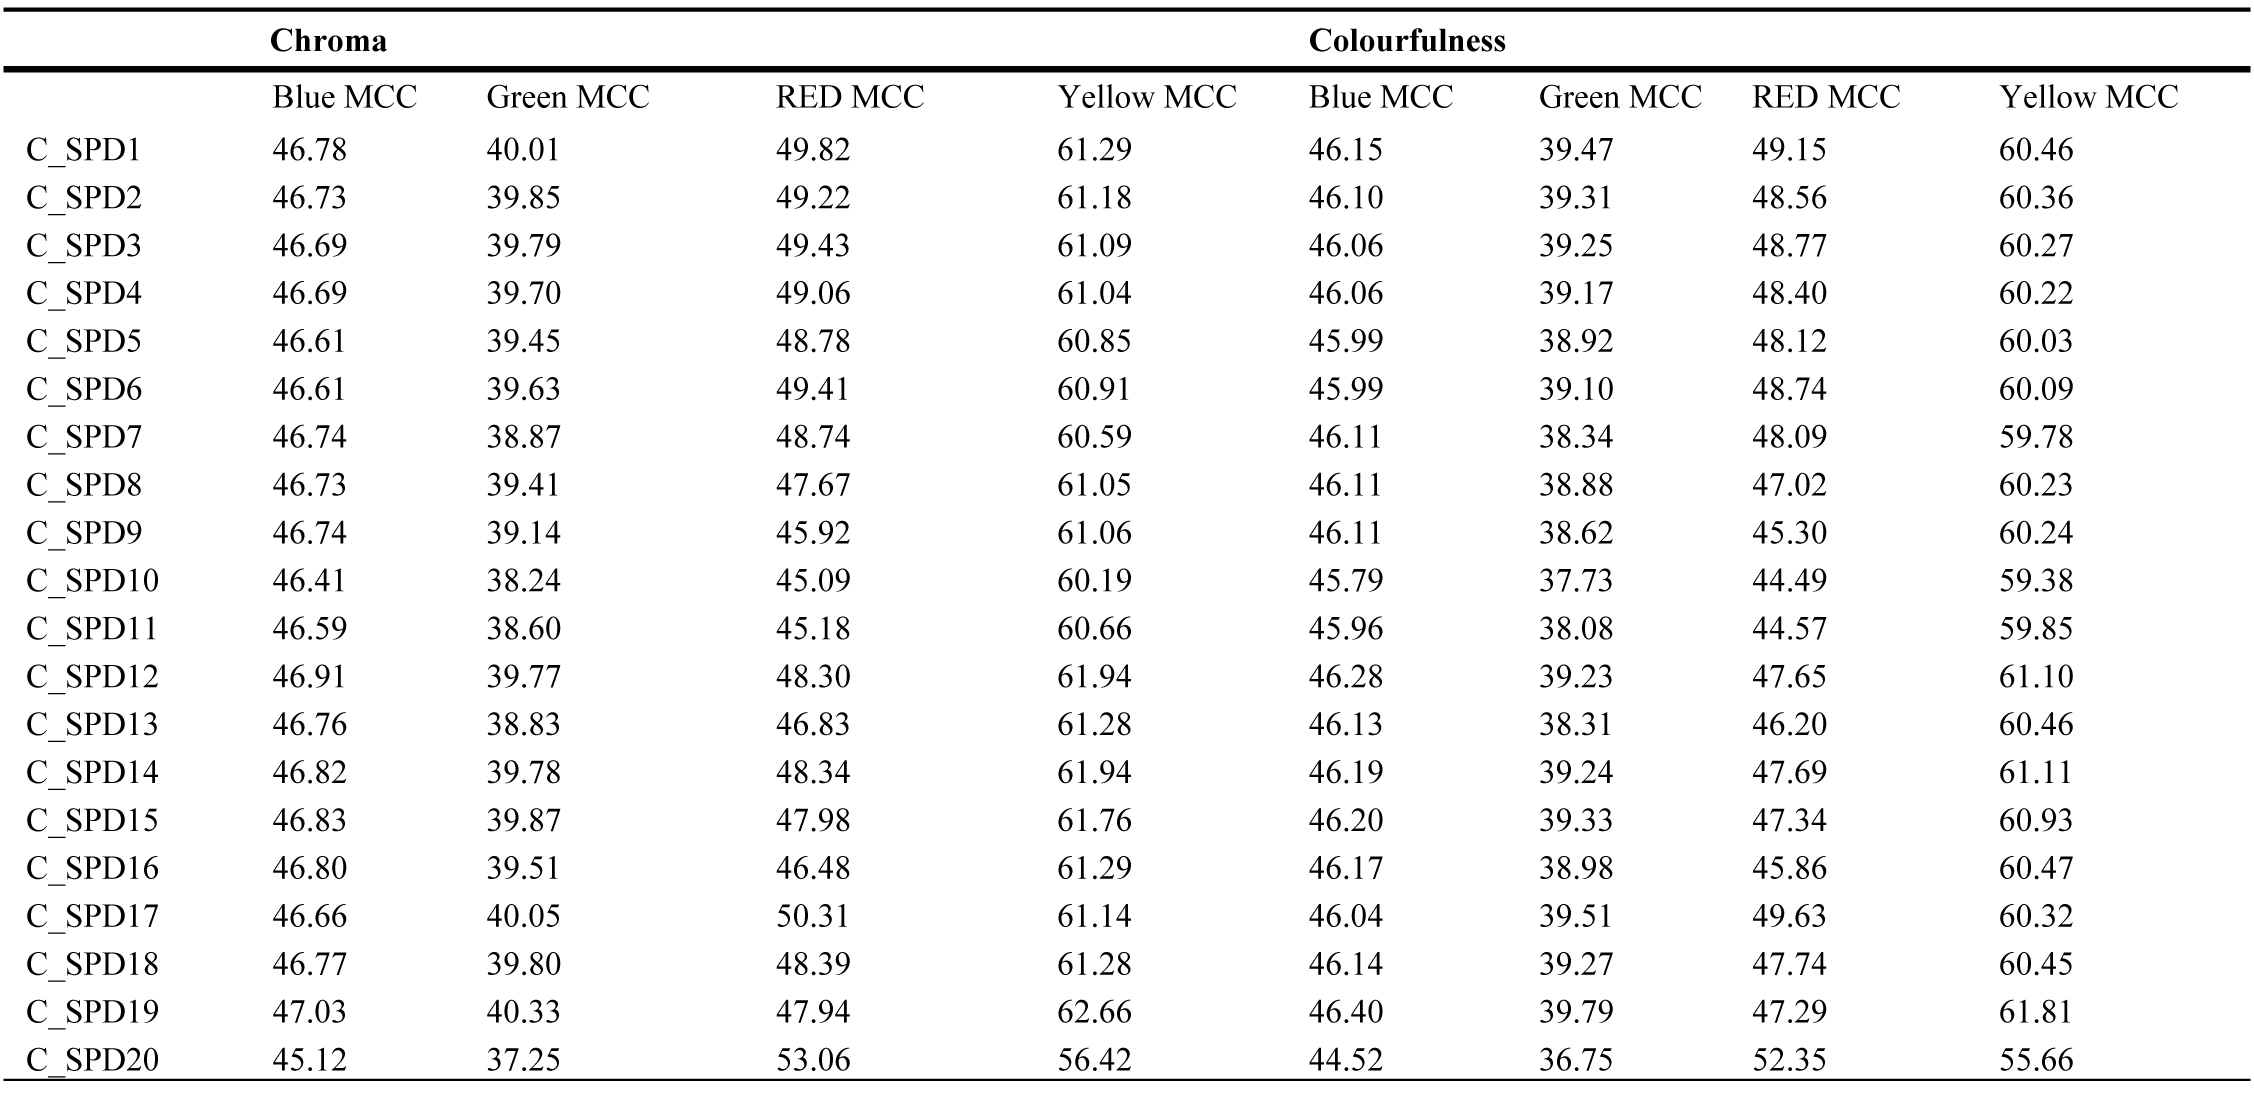
Table A7. Values of chroma and colourfulness of Macbeth colour checker (Blue, Green, Red and Yellow) under different test illuminant (Fig. 2(c)) generated using different coated window glazing types and CIE standard illuminant D65.
Table A8
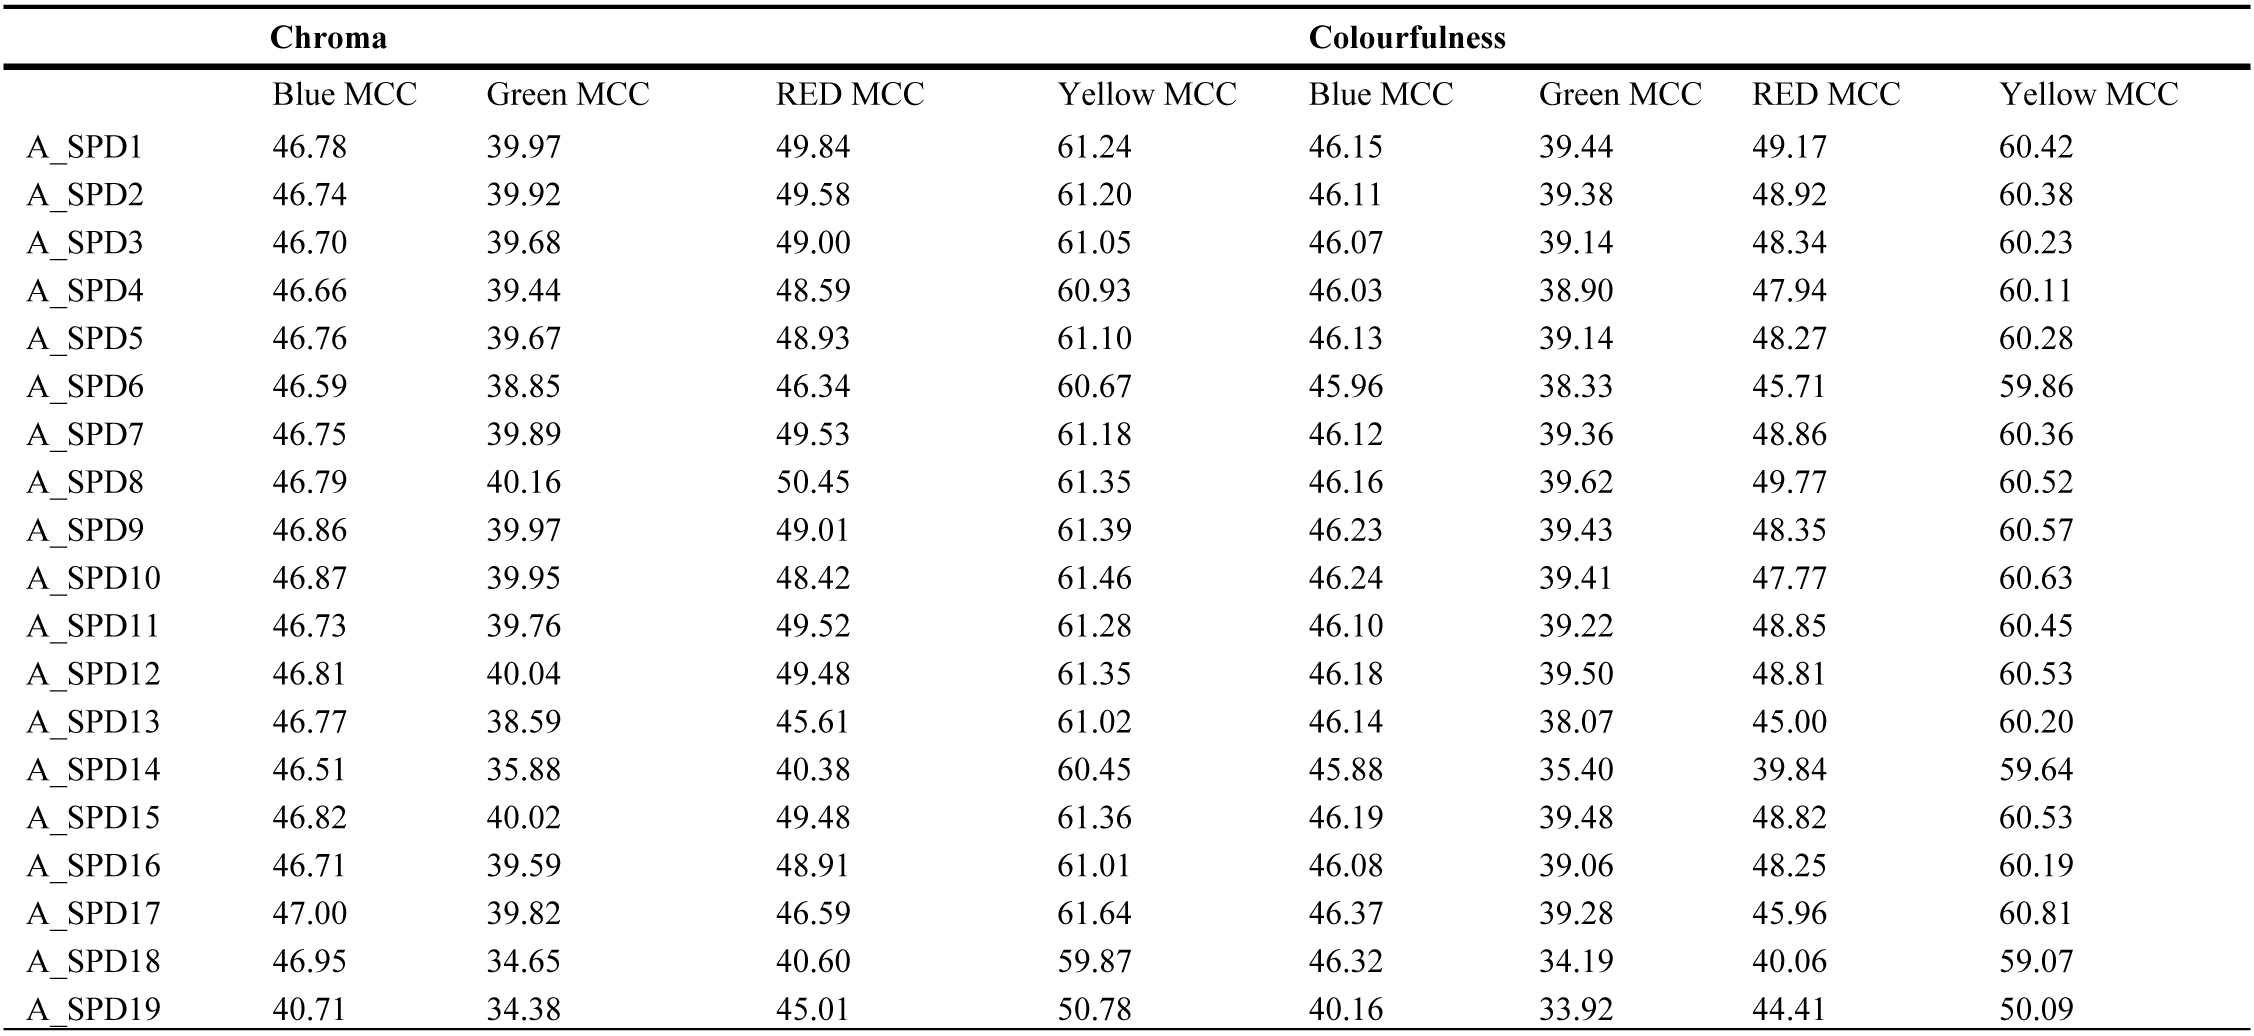
Table A8. Values of chroma and colourfulness of Macbeth colour checker (Blue, Green, Red and Yellow) under different test illuminant (Fig. 2(d)) generated using different applied film window glazing types and CIE standard illuminant D65.
References
- M. Davies, A Wall for All Seasons, RIBA J. 88 (1981) 55–57.
- M. Wigginton and J. Harris, Intelligent skins, Oxford, Butterworth-Heinemann, 2002.
- J.-M. Dussault, L. Gosselin, and T. Galstian, Integration of smart windows into building design for reduction of yearly overall energy consumption and peak loads, Solar Energy 86 (2012) 3405–3416. https://doi.org/10.1016%2Fj.solener.2012.07.016
- N. L. Sbar, L. Podbelski, H. M. Yang, and B. Pease, Electrochromic dynamic windows for office buildings,” International Journal of Sustainable Built Environment 1 (2012) 125–139. https://doi.org/10.1016%2Fj.ijsbe.2012.09.001
- A. Aldawoud, Conventional fixed shading devices in comparison to an electrochromic glazing system in hot, dry climate, Energy and Buildings 59 (2013) 104–110. https://doi.org/10.1016%2Fj.enbuild.2012.12.031
- A. Ghosh, B. Norton, and A. Duffy, Daylighting performance and glare calculation of a suspended particle device switchable glazing, Solar Energy 132 (2016) 114–128.https://doi.org/10.1016%2Fj.solener.2016.02.051
- L. L. Fernandes, E. S. Lee, and G. Ward, Lighting energy savings potential of split-pane electrochromic windows controlled for daylighting with visual comfort, Energy and Buildings 61 (2013) 8–20. https://doi.org/10.1016%2Fj.enbuild.2012.10.057
- A. Ghosh, B. Norton, and A. Duffy, Measured thermal performance of a combined suspended particle switchable device evacuated glazing, Applied Energy 169 (2016) 469–480.https://doi.org/10.1016%2Fj.apenergy.2016.02.031
- M. Zinzi, Office worker preferences of electrochromic windows: a pilot study, Building and Environment 41 (2006) 1262–1273. https://doi.org/10.1016%2Fj.buildenv.2005.05.010
- R. D. Clear, V. Inkarojrit, and E. S. Lee, Subject responses to electrochromic windows, Energy and Buildings 38 (2006) 758–779. https://doi.org/10.1016%2Fj.enbuild.2006.03.011
- M. Richter, Einführung in die Farmetrik, 2nd ed., Berlin, De Gruyter, New York, 1980.
- P. Bodrogi, S. Brückner, and T. Q. Khanh, Dimensions of light source colour quality, in: Conference on Colour in Graphics, Imaging, and Vision, 2010, pp. 155–159.
- Commission Internationale de l’Éclairage, “Method of Measuring and Specifying Colour Rendering Properties of Light Sources,” Vienna, Austria, CIE Technical Report, CIE 13.3: 1995, 1995.
- X. Guo and K. Houser, A review of colour rendering indices and their application to commercial light sources, Lighting Research & Technology 36 (2004) 183–197. https://doi.org/10.1191%2F1365782804li112oa
- M. S. Rea, The IESNA Lighting Handbook: Reference and Application, 9th ed., Illuminating Engineering Society of North America, New York, 2000.
- J. Schanda, Colour rendering of light sources, in Colorimetry: Understanding the CIE System, New York: John Wiley and Sons, Inc., 2007, pp. 207–215.
- A. Ghosh and B. Norton, Interior colour rendering of daylight transmitted through a suspended particle device switchable glazing, Solar Energy Materials and Solar Cells 163 (2017) 218–223. https://doi.org/10.1016%2Fj.solmat.2017.01.041
- M. K. Gunde, U. O. Krašovec, and W. J. Platzer, Color rendering properties of interior lighting influenced by a switchable window, Journal of the Optical Society of America A 22 (2005) 416. https://doi.org/10.1364%2Fjosaa.22.000416
- N. Lynn, L. Mohanty, and S. Wittkopf, Color rendering properties of semi-transparent thin-film PV modules, Building and Environment 54 (2012) 148–158. https://doi.org/10.1016%2Fj.buildenv.2012.02.010
- ANSI (American National Standards Institution), American National Standard for Electric Lamps—Specifications for the Chromaticity of Solid State Lighting (SSL) Products, ANSI C78.377, 2008.
- B. S. Institute(BSI), Glass in building — Determination of luminous and solar characteristics of glazing, BS EN 410:2011, 2011.
- Illuminating Engineering Society (IES), IES Method for Evaluating Light Source Color Rendition: IES TM-30-15, IES TM-30-. New York: The Illuminating Engineering Society of North America, 2015.
- Lawrence Berkeley National Laboratory (LBNL), Daylighting Software - Optics, 2013. Available online: https://windows.lbl.gov/software/optics (Accessed on 19 July 2017).
- W. Davis, “Color quality scale, Optical Engineering 49 (2010) 033602. https://doi.org/10.1117%2F1.3360335
- K. Hashimoto, T. Yano, M. Shimizu, and Y. Nayatani, New method for specifying color-rendering properties of light sources based on feeling of contrast, Color Research & Application 32 (2007) 361–371. https://doi.org/10.1002%2Fcol.20338
- K. A. G. Smet, W. R. Ryckaert, M. R. Pointer, G. Deconinck, and P. Hanselaer, Memory colours and colour quality evaluation of conventional and solid-state lamps, Optics Express 18 (2010) 26229. https://doi.org/10.1364%2Foe.18.026229
- K. Smeta, W. Ryckaerta, G. Deconinckb, and P. Hanselaera, A colour rendering metric based on memory colours (MCRI), in: The CREATE 2010 Conference, pp. 354-356, 2010, Gjøvik, Norway.
- K. Smet, W. Ryckaert, M. Pointer, G. Deconinck, and P. Hanselaer, Optimization of colour quality of LED lighting with reference to memory colours, Lighting Research & Technology 44 (2012) 7–15. https://doi.org/10.1177%2F1477153511432250
- T. Yano and K. Hashimoto, Preference index for Japanese complexion under illuminations, Color Research & Application 41 (2015) 143–153. https://doi.org/10.1002%2Fcol.21948
- K. Smet, J. Schanda, L. Whitehead, and R. Luo, CRI2012: A proposal for updating the CIE colour rendering index, Lighting Research & Technology 45 (2013) 689–709. https://doi.org/10.1177%2F1477153513481375
- R. Dangol, M. Islam, M. H. LiSc, P. Bhusal, M. Puolakka, and L. Halonen, Subjective preferences and colour quality metrics of LED light sources, Lighting Research & Technology 45 (2013) 666–688. https://doi.org/10.1177%2F1477153512471520
- M. Islam, R. Dangol, M. Hyvärinen, P. Bhusal, M. Puolakka, and L. Halonen, User preferences for LED lighting in terms of light spectrum, Lighting Research & Technology 45 (2013) 641–665. https://doi.org/10.1177%2F1477153513475913
- R. Dangol, M. Islam, M. Hyvärinen, P. Bhushal, M. Puolakka, and L. Halonen, User acceptance studies for LED office lighting: Preference, naturalness and colourfulness, Lighting Research & Technology 47 (2013) 36–53. https://doi.org/10.1177%2F1477153513514424
- M. Islam, R. Dangol, M. Hyvärinen, P. Bhusal, M. Puolakka, and L. Halonen, User acceptance studies for LED office lighting: Lamp spectrum, spatial brightness and illuminance, Lighting Research & Technology 47 (2013) 54–79. https://doi.org/10.1177%2F1477153513514425
Copyright © 2017 The Author(s). Published by solarlits.com.

466
Total views
Citations
SHARE ON


