Article Outline
Figures and tables
Volume 5 Issue 2 > pp. 21-33 • doi: 10.15627/jd.2018.5
Quantitative Investigation Through Climate-based Daylight Metrics of Visual Comfort Due to Colorful Glass and Orosi Windows in Iranian Architecture
Seyed Morteza Hosseini,a* Masi Mohammadi,a Alexander Rosemann,b Torsten Schröderc
Author affiliations
a Smart Architectural Technologies, Department of the Built Environment, Eindhoven University of Technology, Eindhoven, The Netherlands
b Building Lighting, Department of the Built Environment, Eindhoven University of Technology, Eindhoven, The Netherlands
c Architecture Design and Engineering Department of the Built Environment, Eindhoven University of Technology, Eindhoven, The Netherlandsironmental and Life Sciences, Wrocław, Poland
* Corresponding author.
s.m.hosseini@tue.nl (S. M. Hosseini)
m.mohammadi@bwk.tue.nl (M. Mohammadi)
A.L.P.Rosemann@tue.nl (A. Rosemann)
T.W.A.Schroeder@tue.nl (T. Schröder)
History: Received 6 July 2018 | Revised 16 August 2018 | Accepted 21 August 2018 | Published online 26 August 2018
Copyright: © 2018 The Author(s). Published by solarlits.com. This is an open access article under the CC BY license (http://creativecommons.org/licenses/by/4.0/).
Citation: Seyed Morteza Hosseini, Masi Mohammadi, Alexander Rosemann, Torsten Schröder, Quantitative Investigation Through Climate-based Daylight Metrics of Visual Comfort Due to Colorful Glass and Orosi Windows in Iranian Architecture , Journal of Daylighting 5 (2018) 21-33 http://dx.doi.org/10.15627/jd.2018.5
Figures and tables
Abstract
There are several alternatives to passive strategies in the early stages of the design process including orientation, window to wall ratio, shading device, material and colour that affect occupants’ visual comfort. However, applying simple traditional principles such as using colorful glasses for windows are effective in the optimizing of visual comfort at interior space. The main aim of the current research is investigating the appropriate colors to control direct sunlight for meeting visual comfort criteria based on climatic-luminance metrics. Which combination of them would be more effective for optimizing visual comfort in terms of daylight glare probability? In particular, how can combination of lattice frame and Iranian-Islamic pattern improve visual comfort based on aforementioned metrics? Quantitative approach for evaluating colorful glass daylight performance is relatively rare. Moreover, these studies applied laboratory measurements and numerical calculation for exploring colorful glass performance. However, parametric simulation provides an opportunity for investigating daylight performance of colored glass based on new perspectives. This research reintroduces the main application of colorful glass as a light controller in the window that considerably affects climatic-luminance based metrics containing daylight autonomy (DA), useful daylight illuminance (UDI), exceeded UDI and daylight glare probability (DGP). A combination of quantitative and qualitative research methods have been applied in order to generate hypotheses and then analyze them. Parametric simulation analysis proves that colored glass has the capability to improve occupant’s visual comfort during office time. Moreover, an appropriate combination of lattice frame and Iranian-Islamic patterns with colored glass in the Orosi window considerably depends on function, climate and occupant behaviour.
Keywords
Colorful glass; Visual comfort; Daylight parametric simulation; Controlling daylight
1. Introduction
Light has considerable effects on the physical and mental health of occupants. Furthermore, enhancing useful daylight of interior space, as much as possible, has been considered as a significant aim of architects, building engineers and designers. Therefore, intensity, color and direction of daylight have been involved in the spatial arrangements of building’s layout. However, the most essential issue, which affects occupant’s visual comfort, is the dynamic characteristic of the sun as a façade design complexity. In brief, adjusting occupants’ visual comfort to temporary daylight is a challenging work that is accomplished by investigating main features of daylight such as color and intensity.
The white light is the composition of rainbow colors which is ranged in the basic spectrum of red, orange, yellow, green, blue, indigo and violet [1]. Colors have specific effects on ergonomic design and perception as well as aesthetic and spirituality of space [2,3]. In particular, integrating daylight and colorful rays in the interior space has a considerable impact on the psychological and physical health of occupants and also resulting in a reduction of stresses and anxieties [2–9].
In Iranian traditional architecture, the interrelation of building and user focused on natural, cultural features and occupant’s requirement [10]. Cultural attitudes influenced Iranian traditional building, where the interior space followed hierarchy arrangement. In particular, based on privacy and lighting aspect, indoor spaces divided into three layers including of vicinity of façade (bright layer), intermediate space(semi-dark layer) and private space (dark layer) [9,10,12]. The first layer gets direct light, while the second layer gets indirect light. However, the private layer gets light from intermediate layers and small skylights. Iranian architecture demonstrates diversity of methods for admitting useful daylight in the interior spaces such as central courtyard, vestibule, veranda, multi-doors and Orosi. Moreover, daylight elements in the traditional building were local, well organized and purposeful [6,9,11,12]. The most of the daylight elements, were multifunctional. In the other words, there is, approximately, no single element only for decoration and beauty [8,10,12].
Orosi is one of the main architectural element in Iranian traditional building, which is a latticed window with colorful pieces of glass and Iranian-Islamic pattern (Fig. 1). Although, precedent researches emphasized the aesthetic aspect and psychological effects of Orosi, manifesting daylight rays in various colors by means of Orosi with colorful glasses, was the passive strategy for controlling light in the traditional architecture of Iran [3,5,7,9–13].
Figure 1
![Orosi window in Iranian traditional architecture (a) Tabatabaei House [14] and (b) Saheb Gharanieh Palace [15].](figures/5-21-1.jpg)
Fig. 1. Orosi window in Iranian traditional architecture (a) Tabatabaei House [14] and (b) Saheb Gharanieh Palace [15].
There are many studies, which applied qualitative methods and case study analysis for investigating Orosi and colorful glass. Javani et al [11], studied several Safavid palaces and inferred the main function of warm colors was decoration, while, grids of colorful glasses are used to balance light & heat. Arjmandi et al [4] reviewed several literature by descriptive analytical method to demonstrate psychological and physical aspects of colors and mentioned to blue, turquoise and golden as traditional colors. Furthermore, Mehrizi and Marasi [16] applied same methods to prove aesthetic aspect, beautiful view and repelling insect as functions of colorful glasses that are red, blue, green and yellow. Moreover, the most qualitative researches by case study analysis claimed that the main functions of colorful glasses, including of red, green, yellow and blue, had been aesthetic aspects, privacy and psychological effects, light controlling and insect repelling respectively [2,3,6,9,12]. In particular. Habib et al [6] explained the Iranian religious beliefs:” unity to plurality and plurality to unity” is a reason for applying colorful glasses. Nabavi et al [10] and Pirnia [13], by using qualitative methods, concluded the colorful glasses functions are light controlling, aesthetic aspects and repelling insects without mentioning to specific colors (Table 1).
However, quantitative approaches for evaluating colorful glass performance is relatively rare and its function as a light controller is completely neglected (Table 1). Recent scientific researches, which used quantitative methods, demonstrated laboratory measurements and numerical calculation have capability to reintroduce colorful glass as an element for balancing daylight [5, 7]. For instance, Haghshenas et al [7] measured solar transmittance factors, by spectrophotometers and numerical process, while, Feridonzadeh and Cyrus Sabri [5] applied numerical calculation for estimating the amount of light loss. Moreover, Giovannini et al. [17] calculated climate-based daylight metrics (CBDM) for shape variable Mashrabiya as an adaptive shading and daylighting system. Dangol et al. [18] investigated several window glazing types for improving visual comfort and avoid daylight glare. Specifically, the Color Quality Scale and Memory CRI have been applied for measuring quality of transmitted daylight. However, “judging the color quality of such situation requires different method.”
Table 1

Table 1. Researches methods and functions of colorful glass.
In summary, according to the literature review the most applied colors used to control light are red, blue, green, yellow, turquoise, purple and azure. Moreover, quantitative methods such as laboratory measurements and numerical calculation have ability to study colorful glasses function precisely as a light controller. In particular, simulation researches, based on climate-base metrics such as daylight autonomy, useful daylight illuminance and luminance-based metrics including daylight glare probability [19], have potential to prepare data for considering colorful glass performance from a new perspective regarding visual comfort aspects.
The main aim of the current research is exploring the appropriate colors to control direct sunlight for meeting visual comfort criteria based on climatic-luminance metrics. Furthermore, which combination of them would be more effective for optimizing visual comfort in terms of daylight glare probability? How can the combination of lattice frame and Iranian-Islamic pattern improve visual comfort based on the aforementioned metrics? In particular, this research aims to reintroduce the colorful glass as an effective passive strategy in the early stage of design for optimizing visual comfort in order to apply it in the building industry.
2. Method
Based on scopes and objectives of the research, combination of quantitative and qualitative research methods have been applied. As Bryman [18] mentioned "using qualitative data to generate hypotheses and using quantitative research to test them within a single project for confirming.” Accordingly, several researches, which have field survey for traditional case studies, are reviewed to discover proper colors by means of comparative assessments. Daylight parametric simulation, based on climatic metrics such as daylight autonomy, useful daylight illuminance and daylight glare probability has potential to prepare data for investigating colorful glass performance from new perspectives regarding visual comfort aspects [19, 21–23]. Consequently, simulation process are done for every single color to specify daylight performance of each colors. Finally, different pieces of colorful glasses are distributed in the Iranian-Islamic patterns of Orosi windows that are ranked by simulations feedbacks based on daylight climatic metrics and luminance based metrics [19]. This composition of colors has been analyzed for testing possibility of optimizing visual comfort in the parametric environment. Specifically, Rhino, Grasshopper and Diva as simulating and analyzing software are applied for evaluation level.
The design aim is to meet Daylight Autonomy (DA) criteria which mentions to “the percentage of the occupied hours of the year when a minimum illuminance threshold is met by daylit alone”, while keeping Useful Daylight Illuminance (UDI100-2000 Lux) in check that “suggests there is useful daylight in the back two thirds of the space and UDI>2000Lux metric flags on oversupply of daylight near the façade” [19]. In particular, all of simulation results are distinguished in the three different floor layers containing bright, semi-dark and dark layers. Also, Daylight Glare Probability (DGP) is used to predict glare for occupants.
Luminance based metric is applied for detecting an oversupply of daylight in the interior space. In addition, “HarperCollins identified Glare as a human sensation that describes light within the field of vision that is brighter than the brightness to which the eyes are adapted” [19]. Furthermore, predicting daylight discomfort has been specified by different indicators such as a daylight glare index (DGI) and unified glare rating (UGR). However, the recent metric, which proposed by Wienold and Christoffersen, is the daylight glare probability (DGP) that applied “CCD camera based luminance mapping technology”. In particular, daylight glare probability has been classified in the four groups containing imperceptible, perceptible, disturbing and intolerable that are ranged from 30-35, 35-40, 40-45 and 45-100 percentage respectively [19]. In current research, daylight glare probability has been calculated at the point, which is located in the center of the room 1 m far from the window.
2.1. Limitations
The limitations of this research mentions to case studies and analyzing attributes. Due to unavailability of traditional building, different case study researches from the famous traditional buildings in Iran are investigated. In addition, the simulation process is performed in the office located in Yazd, Iran which has Hot & arid climatic condition. Yazd has been classified in the (BWh) hot desert climate which has clear sky based on Koppen climate classification [24] Furthermore, Yazd weather data used for the simulation process is available from EnergyPlus website and arranged by World Meteorological Organization region and Country [25].
2.2. Colors and optical properties of surfaces
For creating a full range of colors, two types of color models, which named additive and subtractive, are applied. Furthermore, additive is used by the RGB system for monitors and subtractive is applied by CMYK model for printers. More specifically, RGB color models, as an additive system, combines red, green and blue to create a wide spectrum of colors [26]. Similarly, in the simulating process, Radiance engine, which performed daylight simulation uses the RGB system to create colors. In the next step, simulating the appropriate colors for glasses, is carried out based on the RGB model [27]. The appropriate colors for colorful glass in terms of controlling light are exploited from precedent filed studies of traditional building in Iran (Table 2). Blue, red, green and yellow are identified as the most important colors that applied in the Orosi window of Iranian traditional building. Optical properties of common material surfaces have been selected from high reputation references (Table 3).
Table 2
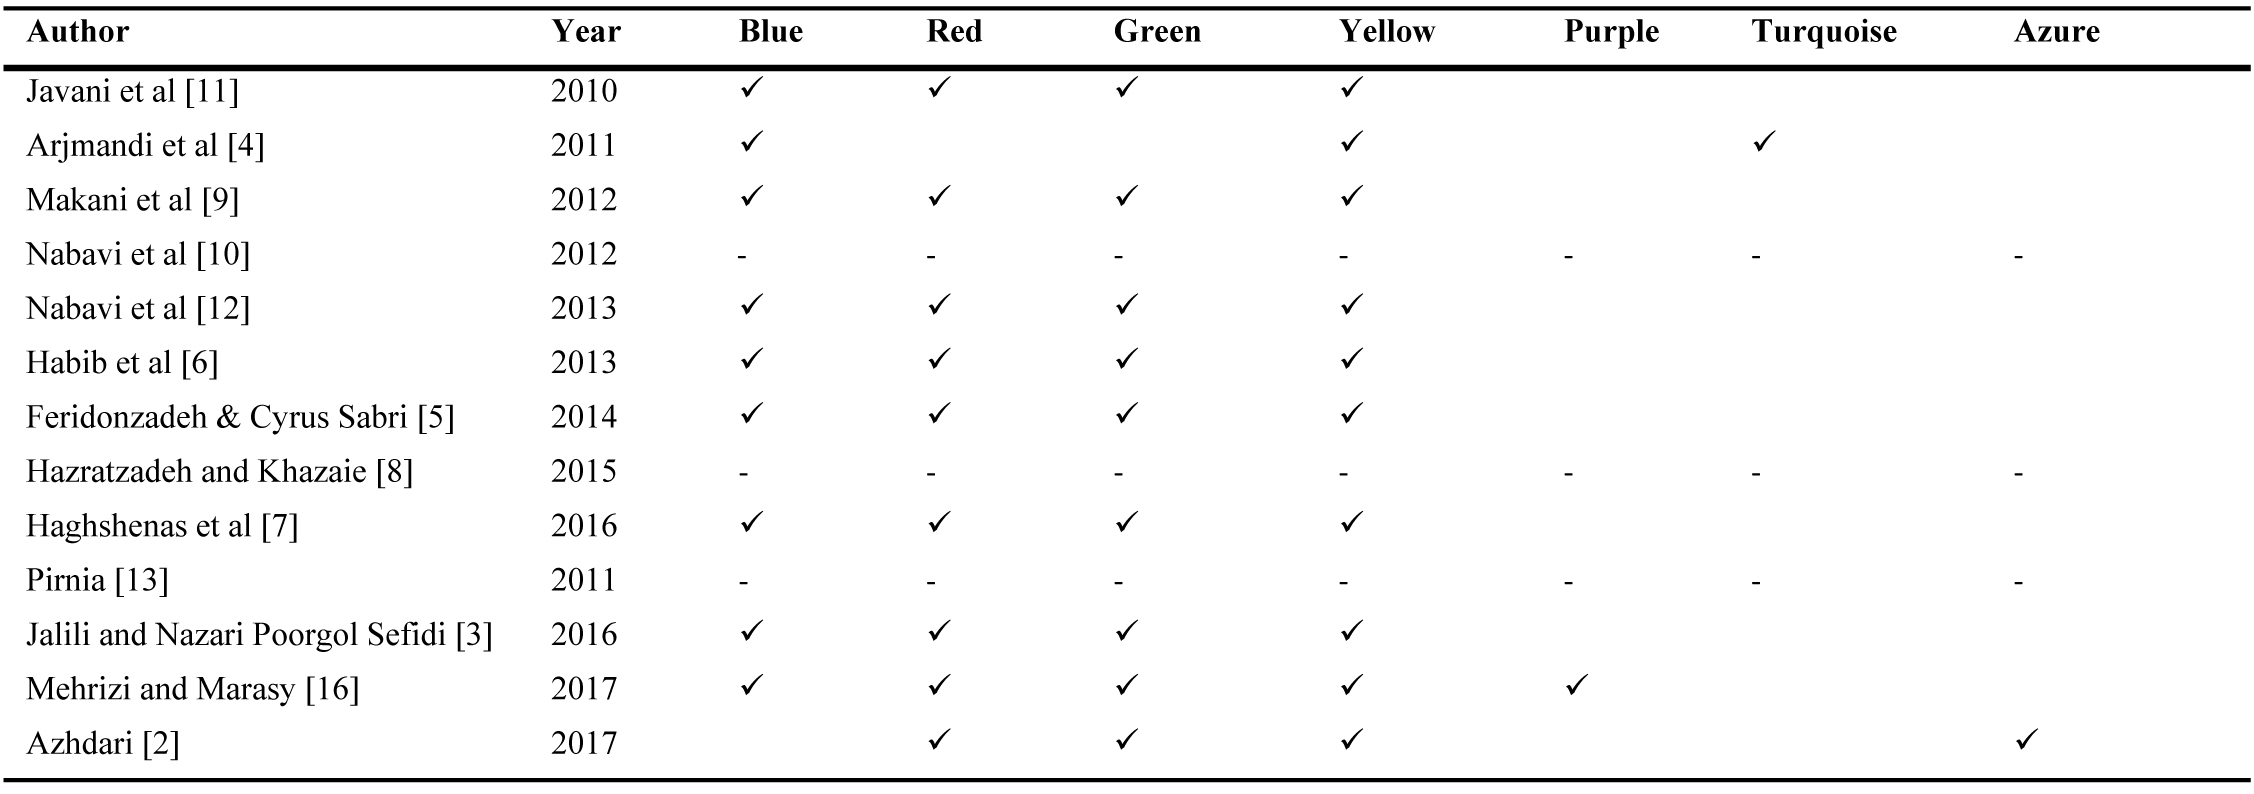
Table 2. Appropriate colors for controlling light in the Iranian traditional building.
Table 3
![Optical Properties of common material surfaces and RGB colors Ratio [19,26].](figures/5-21-20.jpg)
Table 3. Optical Properties of common material surfaces and RGB colors Ratio [19,26].
Iranian golden rectangle is applied for the test room plan that is drawn in a hexagonal [10], based on a common method for planning the rooms and courtyard in the Iranian traditional architecture. The width and depth of rectangular plan are respectively 3 m and 5 m. Building elements are modeled accurately with thickness of 0.2 m for walls, 0.3 meter for ceiling and floor. The height of the room from the top of the floor to the bottom of the ceiling is 2.8 m. Moreover, the window is located on the south façade with a ratio of 0.69 for window to wall (Fig. 2). Climatic and luminance based metric are simulated regarding colors and pattern alternatives on solstice and equinox days, containing 21 Dec, 21 Mar and 21 Jun [19]. In addition, basic elements for studying daylight performance simulation are set up in the Table 4.
Figure 2

Fig. 2. Test room model for daylight simulation with colorful glasses and Orosi.
Table 4
![Daylight performance simulation attributes [19].](figures/5-21-21.jpg)
Table 4. Daylight performance simulation attributes [19].
3. Result and discussion
3.1. Climate-based metric
Table 5 gives information about annual climate based calculation in three layers of floor containing bright, semi-dark and dark parts for the single colored glass of window with the specified window to wall ratio. Overall, the colored glass is significantly affected climate-based metric, including daylight autonomy and useful daylight illuminance. However, the effects of each color are different regarding individual indicator. Therefore, accurate understanding of simulation’s feedback depends on integrating results and interpreting them simultaneously.
Table 5
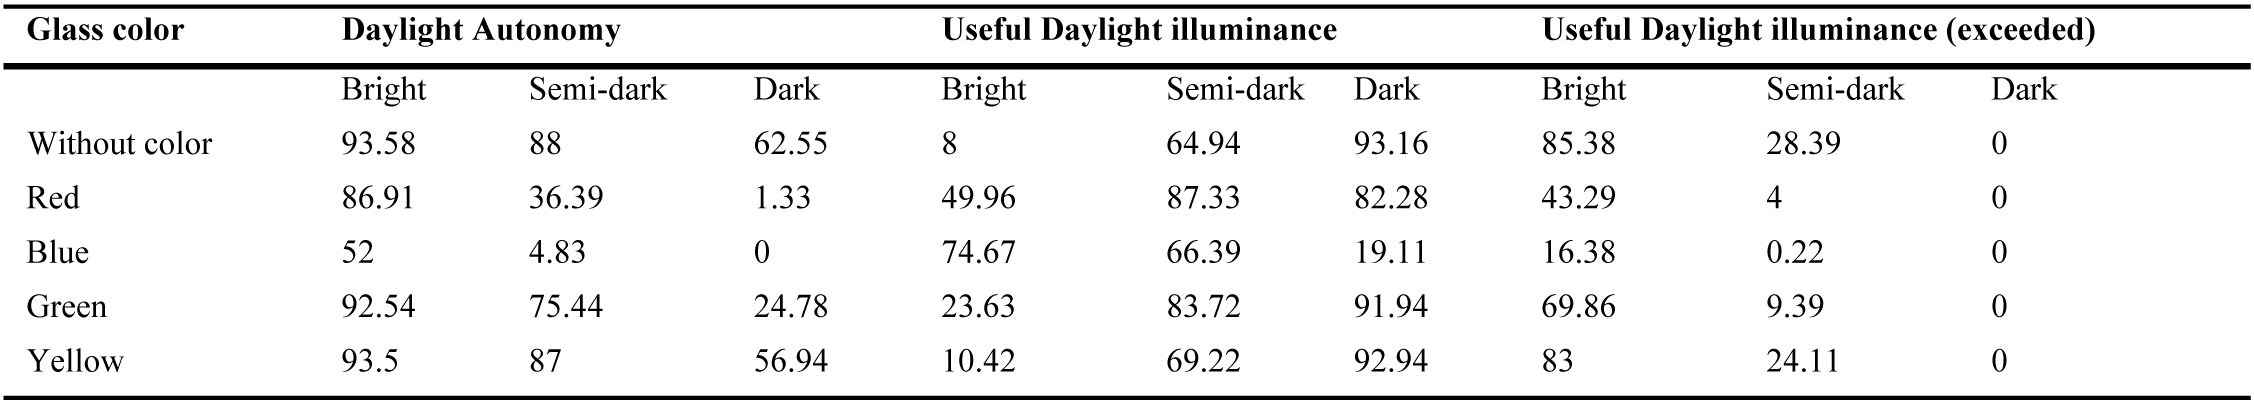
Table 5. Climate- based metric calculations/WWR= 0.69.
According to the Table 5, an optimal color for each layer is discerned by comparing DA and UDI values, meanwhile the exceeded UDI should be in check. In the bright layer, all cases meet the minimum amount of DA for an office function. However, UDI value distinguishes colors to two groups. First group, including of red and blue, has the lowest amount of DA, while, it provides sufficient and optimal UDI. On the other hand, second group, consist of green, yellow and without color, has higher value of DA, although UDI metric shows insufficient daylight illuminance for this group due to overload daylight irradiation. In summary, blue is the best choice for the first layer that could meet all of the basic daylight requirements and red might be the second one (Fig. 3).
Figure 3

Fig. 3. Floor plan diagram for climate based metric simulation including UDI and exceeded UDI (a) blue glass and (b) red glass.
Considering the semi-dark layer, briefly discerns same groups as well as bright layer. Furthermore, the second group meets DA requirements, while, the first group is under the minimum demand, specifically blue with the value of 4.83. However, UDI indicator shows the first group has higher amount of useful daylight illuminance than the second one and also lower exceeded metric value. Thus, choosing appropriate color for the semi-dark layer, depending on the space function, would be varied. For example, needing more daylight is resulting in the second group, while, more UDI with the least exceeded leads to select first group. It seems red is the best choice for the second layer that meets most of the requirements as much as possible (Fig. 3).
With respect to the dark layer feedback, similar to the previous layers, same two groups are distinguished. The second group has a more significant advantage than first group regard to DA and UDI metric values. Clearly, the best choice for third layer would be without color and yellow (Fig. 4).
Figure 4

Fig. 4. Floor plan diagram for climate based metric simulation including UDI and exceeded UDI (a) yellow glass and (b) Orosi.
Overall, applying appropriate color for glass, significantly, depends on space functions in different floor layers. Furthermore, the combination of colors in window, based on layers priorities, has the capability to propose several proportions of colors, for different architectural applications. Consequently, Colorful glass has the potential to be designed and implemented based on local climate and function of space. For instance, taking into account glare as a priority to daylight design, is leading to choose the blue color as the major portion of glass composition.
Assuming Orosi functions as a light controller that could significantly prevent glare. Therefore, Orosi colors are designated based on climatic metrics feedback in the previous part. As a result, color distribution is performed from the highest portion to the lowest one containing blue, red, yellow and green respectively. Islamic star patterns, which developed by Kaplan [28] generate the Orosi configuration. Accordingly, the opening area of the model, is portioned into 5 individual parts including Islamic star pattern as a frame, blue, red, yellow and green glass with precise percentage (Table 6).
Table 6

Table 6. Percentage of participation in the Orosi sample for simulation.
Climate based metrics simulation reveals Orosi high visual performance in the bright layer, which approximately meets DA minimum with highest UDI value. However, the semi-dark and dark layers have not been supplied by enough DA and UDI (Fig. 4). Therefore, current color composition provides visual comfort in the first layer by preventing exceeded UDI, while, it has not capability to transmit sufficient light for the second and third layers (Table 7).
Table 7

Table 7. Climate- based metric calculations for Orosi pattern / WWR= 0.69.
3.2. Luminance Based metric
Figures 5-7 illustrate how the different colors of glass affect the percentage of daylight glare probability (DGP) during office hours on the solstice and equinox days, containing 21 Dec, 21 Mar and 21 Jun. Clearly, daylight glare probability (DGP) is considerably influenced by the colored glass. Moreover, applying colored glass approximately decreases the DGP to optimal range for visual comfort in the most scheduled time. Nevertheless, the effect of each single color is varied in the different hours and days. For example, yellow has a minor effect on DGP, while, Blue significantly decreases DGP and makes it acceptable by occupants.
Figure 5

Fig. 5. Daylight glare probability during the office time 21-March.
Figure 6
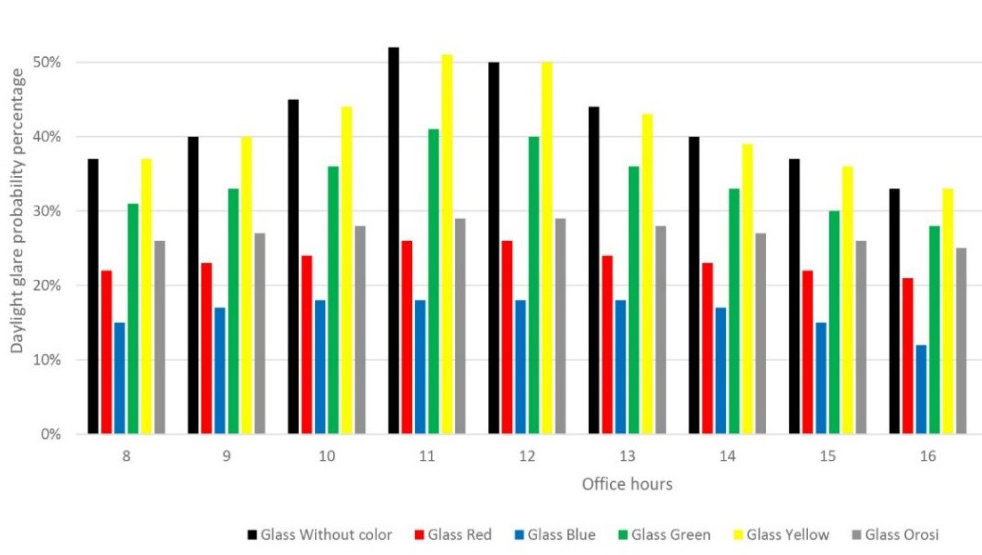
Fig. 6. Daylight glare probability during the office time 21-June.
Figure 7
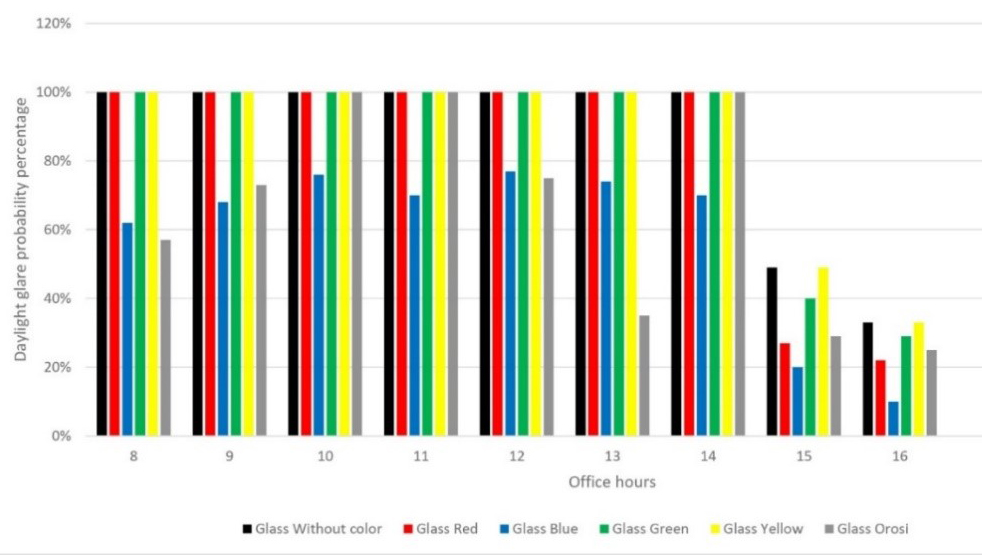
Fig. 7. Daylight glare probability during the office time 21-December.
A closer look at the Figs. 5-7 reveals that colors’ behavior regarding DGP has the capability to be classified in two main groups. First group, including blue, red and Orosi, makes important impacts on DGP value and also dramatically decreases the DGP during the office times. In contrast, second group constituted by yellow, without color and green, has a minor effect on DGP which is gradually changed for the periods of the time.
With respect to the first group, all of the colors have approximately met imperceptible rate for glare that is between the 30 to 35 percentages of DGP (Fig. 8). In particular, blue reduces DGP more than red and Orosi during the whole of the times. In addition, red decreases DGP more than Orosi in 21st March and June, while Orosi is better than red in the 21st of December. Although all of the first group colors haven’t met DGP visual requirements for 21st December, blue and Orosi indicate potential ability to decrease DGP, as much as possible, in comparison to the other colors.
Figure 8
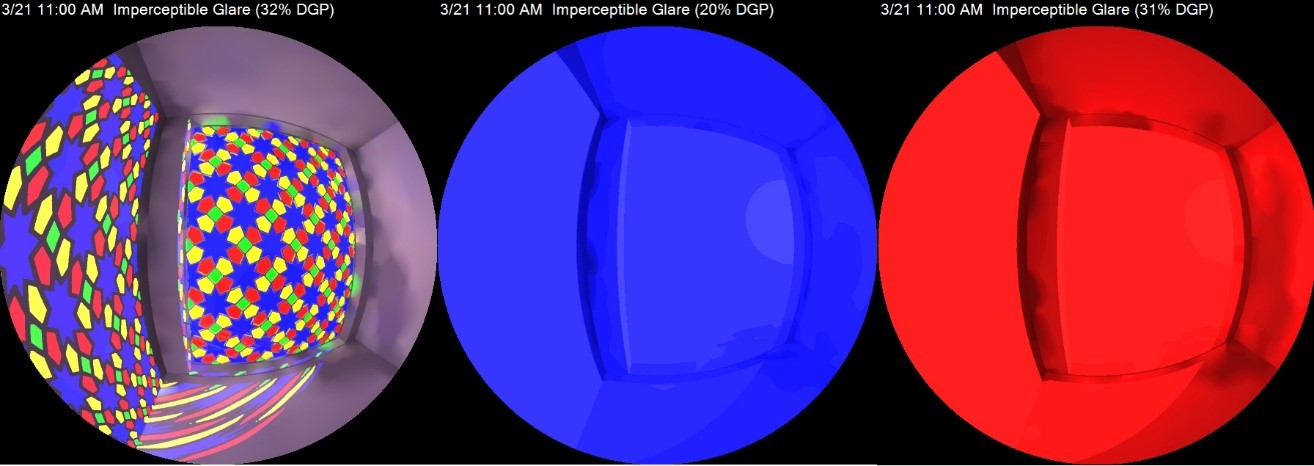
Fig. 8. Daylight glare probability for first group containing Orosi, blue and Red glasses.
The second group hasn’t met DGP visual requirements most of the time, specifically without color and yellow glass are almost placed in the intolerable area with DGP above than 45% (Fig. 9). Similarly, green occasionally placed in the intolerable and disturbing zone on 21st March. In contrast, on 21st June, green located between imperceptible and perceptible zone, while, yellow and without color glass placed among perceptible, disturbing and intolerable area.
Figure 9
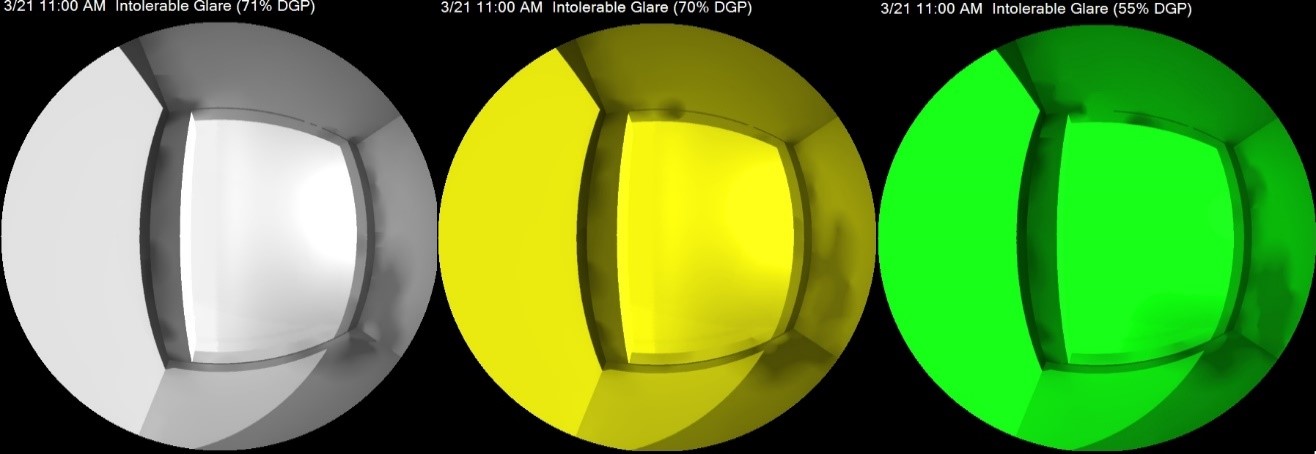
Fig. 9. Daylight glare probability for first group containing without color, yellow and green.
In summary, single colored glass and Multi color one (Orosi) have capability to control daylight. Furthermore, daylight glare probability (DGP) as a luminance based metric, has considerably affected by blue, red and Orosi. Although, the DGP visual requirements have not been met on 21st December, the blue, red and Orosi have potential to meet DGP in collaboration with other devices such as a canopy.
3.3. Within subjects analyses
Since the traditional window is formed by three individual elements including Iranian-Islamic pattern, grid frame and wooden cover, optimal combination of them with colorful glasses could be a new research subject. Table 8 gives information about different horizontal combination of lattice frame with simple glass and Iranian-Islamic patterns with colored glasses (Fig. 10). Overall, applying higher percentages of patterns with colorful glass in Orosi affect daylight performance metrics where the amount of UDI is risen up from 11.5 to 42 in bright layer.
Table 8
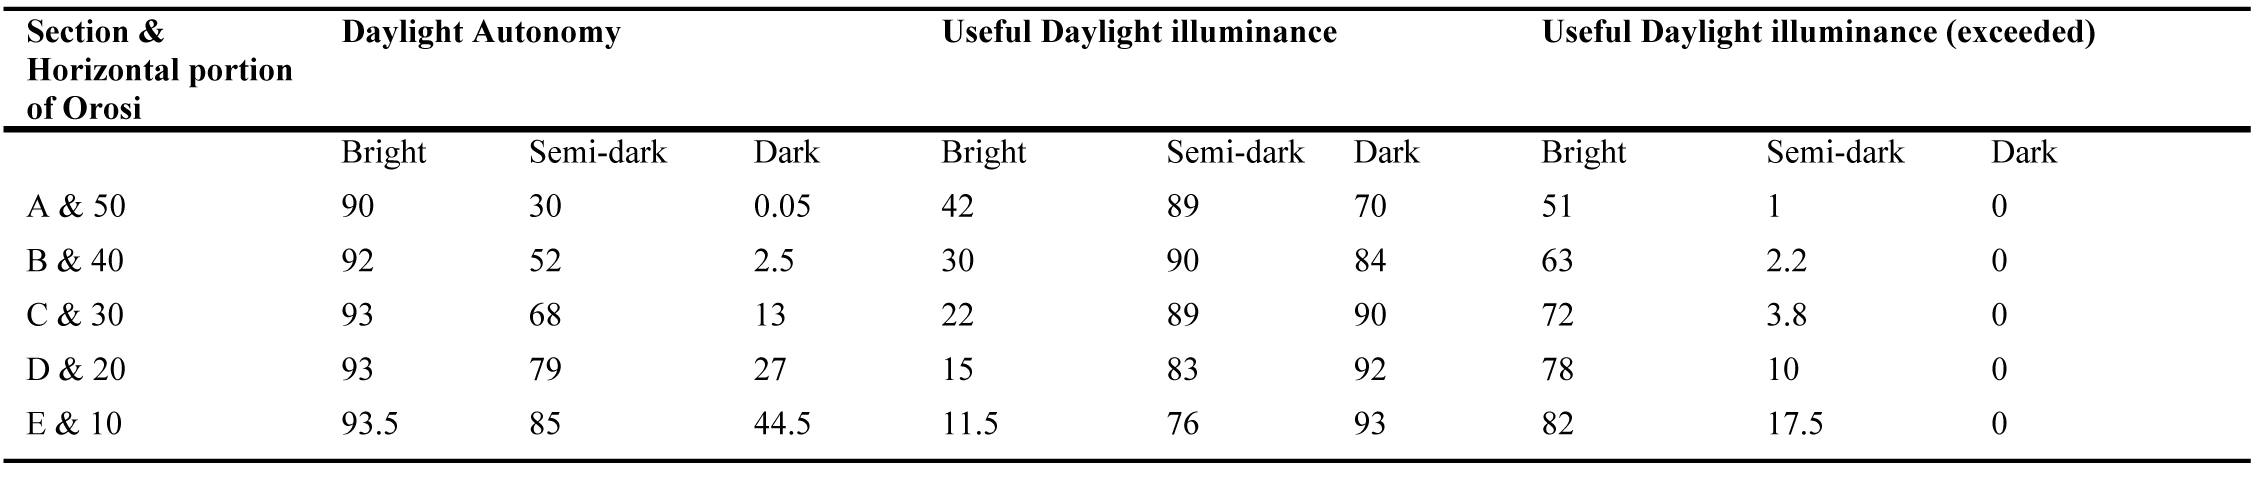
Table 8. Climate- based metric calculations for different Orosi window combinations/ WWR= 0.69.
Figure 10
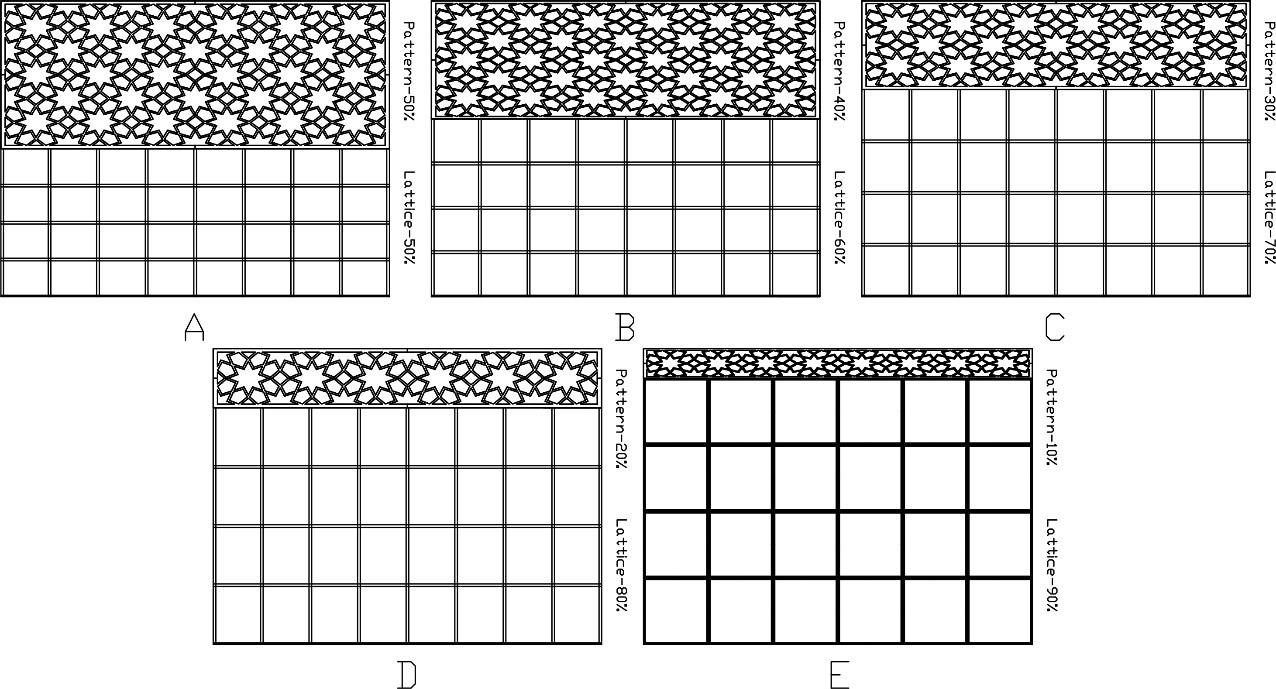
Fig. 10. Different elevations for Orosi window combinations (horizontal composition variants).
Considering floor diagrams based on climatic metrics distinguishes three groups, including elevations A and B in the first group, elevation C in the second group and elevations D & E in the third group. All groups demonstrate high daylight performance in the semi-dark and dark layers regard to useful daylight illuminance. However, considering UDI and exceeded UDI in the bright layer specify potential of elevations A, B and sometimes C for decreasing the overload of solar radiance in the interior space. Changing horizontal patterns with colored glass from 10 to 50 percentage decrease medium exceeded UDI from 82 to 51. Therefore, there is an opportunity for reducing glare zone in the bright layer by elevations A, B and C (Fig. 11).
Figure 11
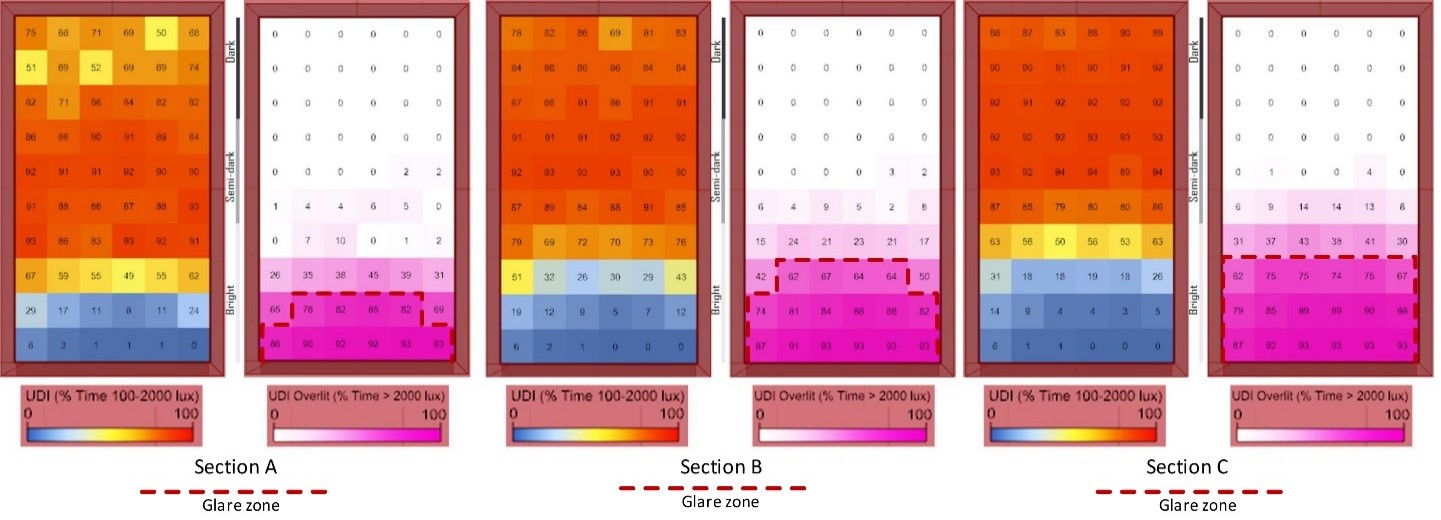
Fig. 11. Floor plan diagram for climate based metric simulation including UDI and exceeded UDI from left to right elevations A, B and C, respectively.
3.4. Applying Iranian-Islamic pattern based on furniture arrangment
Furniture arrangement in the plan could be adjusted with the Orosi formation to improve visual comfort in terms of UDI and DGP. Furniture plan in Fig. 12 is chosen for simulation test. New elevations for Orosi window are employed to be collaborated with furniture arrangement for providing visual comfort on the work plane. Accordingly, vertical patters are added to new elevations at Fig. 13.
Figure 12
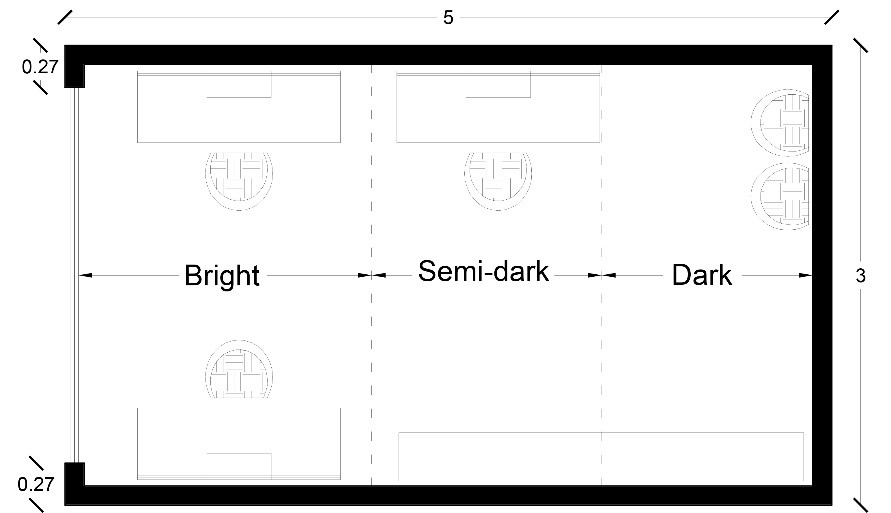
Fig. 12. Furniture arrangement in the plan..
Figure 13
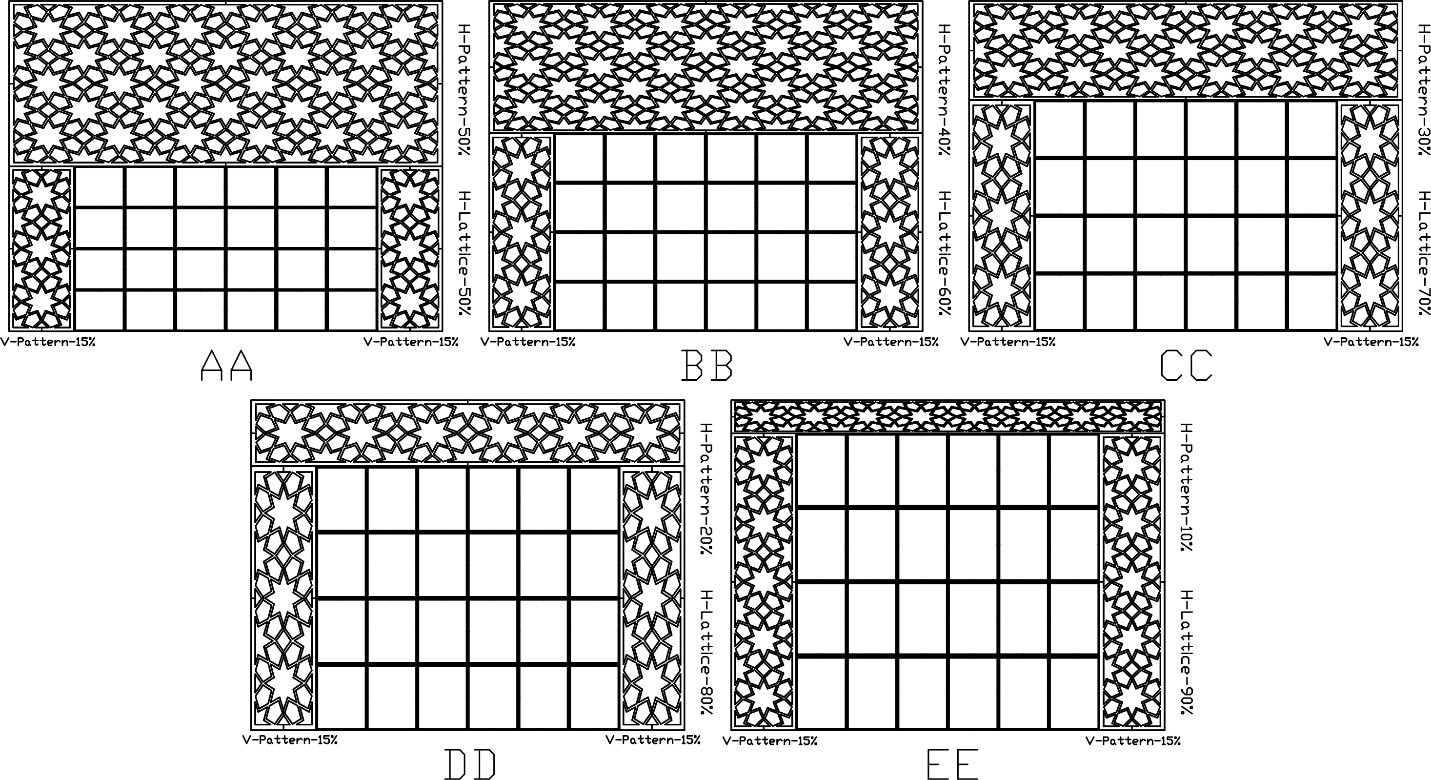
Fig. 13. Different elevations for Orosi window combinations based on furniture arrangement.
Furniture arrangement in the plan could be adjusted with the Orosi formation to improve visual comfort in terms of UDI and DGP. Furniture plan in Fig. 12 is chosen for simulation test. New elevations for Orosi window are employed to be collaborated with furniture arrangement for providing visual comfort on the work plane. Accordingly, vertical patters are added to new elevations which are demonstrated in Fig. 13.
With respect to climate based metrics (Table 9), two groups are discerned consist of elevations AA, BB and CC in the first group and elevations DD and EE in the second one. The first group demonstrates high daylight performance for optimizing visual comfort by means of increasing UDI and decreasing exceeded UDI. Furthermore, comparing Figs. 11 and 14 together displays the glare zones in the elevations AA, BB and CC are lessened respect to the horizontal elevations (A, B and C). In contrast, the second group enhances daylight penetration into interior spaces as much as possible, while it causes glare zones to be extended.
Table 9

Table 9. Climate- based metric calculations/ WWR= 0.69 /Applying 15% vertical Orosi in the left and right sides of window/ layouting furniture.
Overall, forming Orosi window based on furniture arrangement increases UDI on work-plane located in the bright layer from 2.2 to 3.7 times more than regular one (Figs. 11 and 14). In addition, the exceeded UDI is decreased more than 21%. Comparing simulation feedbacks in the test room with and without furniture shows the amount of daylight penetration into interior space decreases approximately of 10% in the room with furniture.
Figure 14
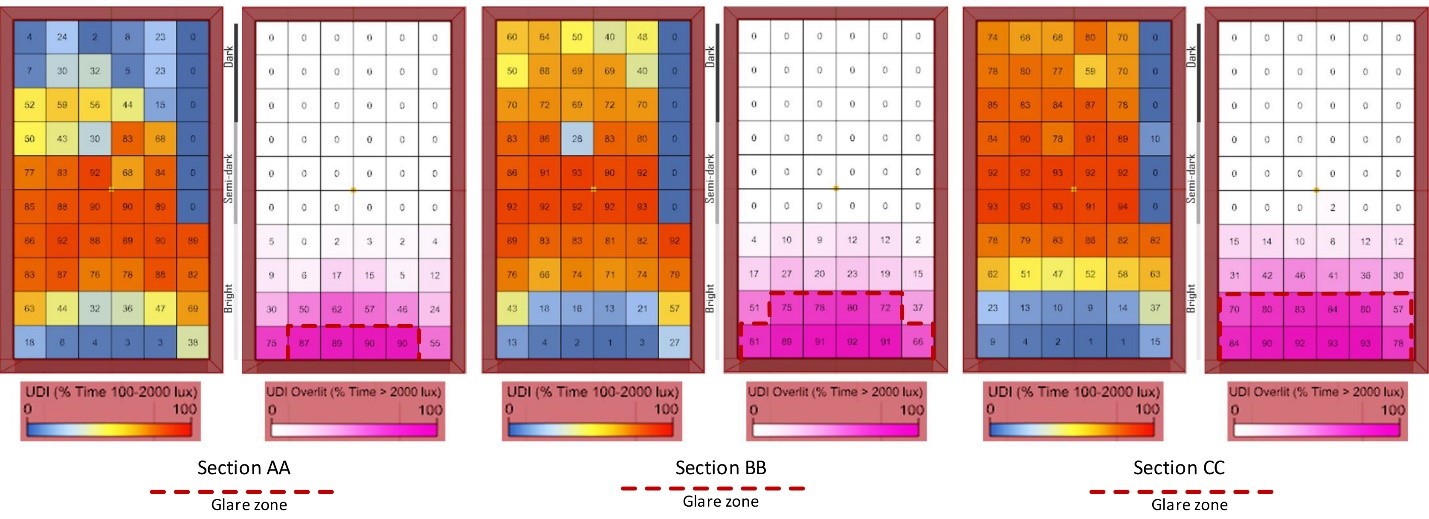
Fig. 14. Climate based metric simulation diagram including UDI and exceeded UDI from Left to right elevations AA, BB and CC, respectively.
Figure 15 illustrates how the different Orosi elevations affect the percentage of daylight glare probability during specific hours (9, 12 and 15) on the solstice and equinox days. The results show Orosi window, approximately, keeps DGP percentages in the acceptable ranges most of the times.
Figure 15
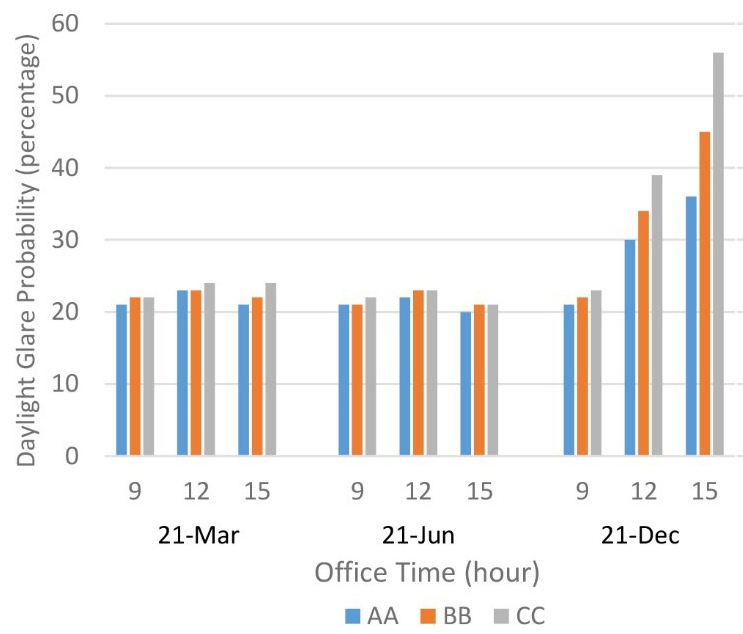
Fig. 15. Different elevations (AA, BB& CC) daylight glare probability (DGP) during the office time on the solstice and equinox days.
Figure 15 shows that in all elevations DGP is between 20 to 25 percentage (under imperceptible zone) on 21st June and March. However, in December, all elevations demonstrate different behavior (Figs. 15 and 16). The DGPs of elevation AA are ranged from 21 to 36 that placed between imperceptible and perceptible zones. The DGPs of elevation BB are 22, 34 and 45 at 9, 12 and 15 respectively that located on imperceptible and intolerable zones. In addition, the DGPs of elevation CC are ranged from 23 to 56 consist of 23 at 9 (imperceptible), 39 at 12(perceptible) and 56 at 15 (intolerable). Overall, the elevation AA exhibits the optimal daylight performance between all of aforementioned options regard to DGP metric. The elevations BB and CC have potential to combine with a shading device to meet DGP criteria on 21st December at 15:00 (Fig. 16).
Figure 16
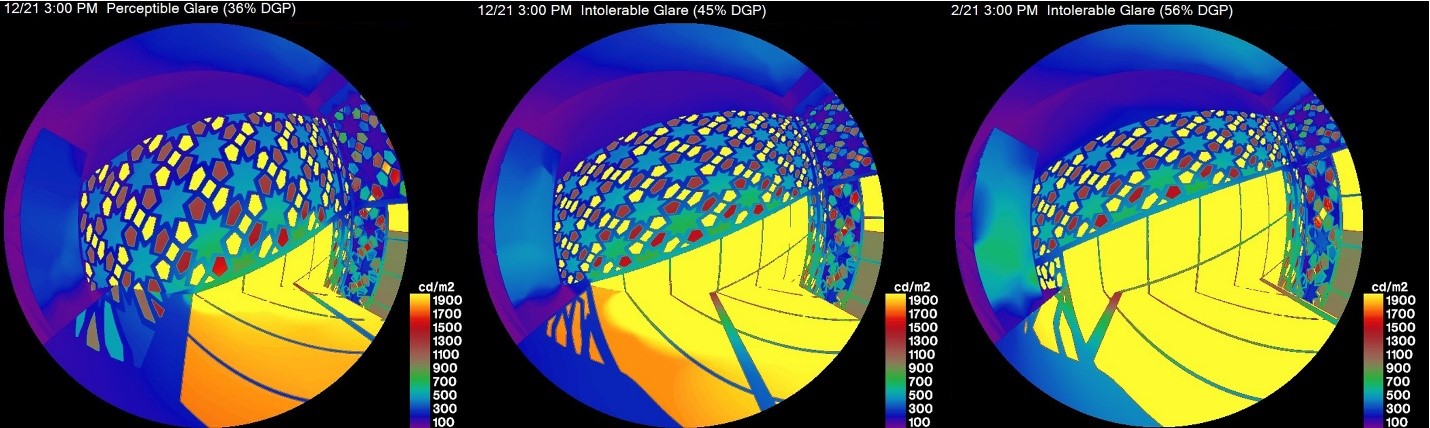
Fig. 16. Maximum daylight glare probability for the elevations AA, BB & CC from left to right, respectively, on December 21st at 15:00.
3. Conclusions
In summary, this research investigates colors effects on visual comfort based on climatic-luminance metrics with the aim to find appropriate colors to control daylight. Which combination of them is more effective for optimizing visual comfort with regard to DGP value? In particular, how can the combination of lattice frame and Iranian-Islamic pattern improve visual comfort based on aforementioned metrics? With respect to research method, quantitative approach for evaluating colorful glass daylight performance is relatively rare. Furthermore, these studies applied laboratory measurements and numerical calculation for exploring colorful glass performance. However, parametric simulation has the capability to explore daylight performance of colored glass based on new perspectives. This research reintroduces the main application of colorful glass as a light controller in the window that considerably affects climatic-luminance based metrics containing daylight autonomy (DA), useful daylight illuminance (UDI), exceeded UDI and daylight glare probability (DGP).
Overall, applying colorful glasses at the south window has the ability to increase occupant’s visual comfort. Spite of the fact that each color has different effects on climate and luminance based metrics, colors combination in the Orosi, based on floor layers (bright, semi-dark and dark) priorities, leads to propose optimal lighting design consist of daylight and artificial light for different layers.
Current research reveals that the main application of colored glass in the traditional window had been light controlling as well as aesthetic aspect. Indeed, blue and red prevent solar discomfort effects such as glare and overloading light (illuminance>2000lux) while, yellow, green and without color allow light to enter the room as much as possible. Using color combination in a window, creates opportunity for designers to control how deep the daylight penetrate into the spaces. Furthermore, designers could predict sufficient complementary artificial light for different floor layers. Moreover, similar to Haghshenas et al [7] outcomes, estimating the optimum percentage of each glass for using in the Orosi window, is challenging work that depends on space function, interior material properties and occupants clothing insulation.
The comprehensive literature review and simulation feedbacks demonstrate that blue color has the most significant effects on climatic-luminance based metrics, specifically on DGP. In contrast to Haghshenas et al [7] recommendation about inefficiency of blue glass in terms of transmitted light indices, using this color is necessary for adjusting transmitted light regard to visual comfort indicators. Applying colorful glass without canopy in Ebrahimi, Ershadi and Sadeghi’s house [5] confirms the role of them as a shading device in Tabriz..
The combination of lattice frame and Iranian-Islamic patterns with colored glass in Orosi window considerably affect the visual comfort based on climatic-luminance metrics (Fig. 17). With respect to objectives of designers regard to plan layers the composition of Orosi form could be varied. In particular, elevation AA is the most optimized shape between other alternatives in Figs. 10 and 13 for applying as an Orosi window in the Office. Nevertheless, this shape based on function, location and furniture layout could be changed. Regarding dynamic characteristic of the sun, the composition of the Orosi should be redesigned to be adapted with the local climate and occupants’ requirements. Therefore, applying dynamic configuration for window will be a solution for real-time adaptation and further research.
Figure 17
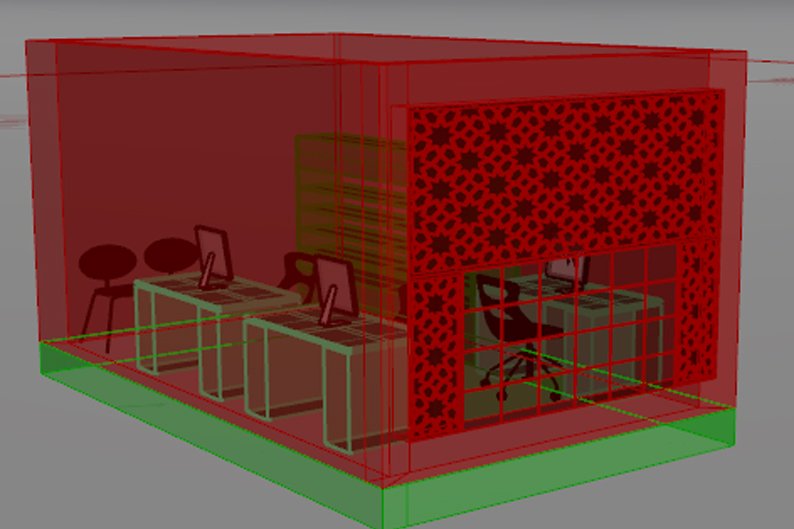
Fig. 17. Furniture arrangement and Orosi composition for optimizing visual comfort.
This research gives information regarding the performance of colorful glass in optimizing visual comfort and introducing it as an effective passive strategy in the early stage of design. However, there were some limitations and parameters that might change the simulation results, specifically color. Indeed, appropriate colors had been extracted based on the traditional architecture of Iran that could be varied from different locations and climates. In particular, there are several types of each single color that could have different effects on climatic-luminance based metrics. Furthermore, combination of colors and their portions in Orosi’s Islamic patterns affect the admitting daylight. Therefore, exploring several Iranian-Islamic patterns for Orosi makes opportunity for further researches.
Contributions
S. M. Hosseini conceived the study, designed and performed simulations, interpreted the results, and wrote the manuscript. M. Mohammadi, A. Rosemann, and T. W. A. Schroder supervised with help each stage of the project in terms of data collection, analysis and interpretation and provided constructive advice to shape the project.
References
- K. Dickinson, 8 - The use of colour in textile design, Textile Design, Woodhead Publishing, 2011, pp. 171-190. https://doi.org/10.1533/9780857092564.2.171
- M. Azhdari, Psychological Impact of Color or Residents of Shiraz’s Houses during Qajar Era (Case Study: Narenjestan Qavam), International Journal of Scientific Study 5 (2017) 40–43.
- T. Jalili, and L. Nazari Poorgol Sefidi, The Survey of the Color and Light Psychological Effects in Iranian Traditional Architecture (Case Study: Tabataba’ees House). IIOABJ 7 (2016) 469–483.
- H. Arjmandi, M. Mohd Tahir, H. Shabankareh, M. Mahdi Shabani and F. Mazaheri, Psychological and spiritual effects of light and color Iranian traditional houses on dwellers, E-BANGI 6 (2011) 288–301.
- H. Feridonzadeh and R. Cyrus Sabri, Window Design in Ardabil Traditional Houses for Conservation of Energy. Armanshahr Architecture & Urban Development 7 (2014) 1-11.
- F. Habib, F. Alborzi and I. Etessam, Light Processing in Iranian Houses; Manifestation of Meanings and Concepts. International Journal of Architecture and Urban Development 3 (2013) 11–20.
- M. Haghshenas, M. Bemanian and Z. Ghiabaklou, Analysis the Criteria of Solar Trasmittance from Stained Glasses Used in Some of the Orosis from Safavid Dynasty. Journal of Color Science and Technology 10 (2016) 55–64.
- M. Hazratzadeh and M. Khazaie, An Investigation into Contemporary Interior Spaces Considering the Concept of Space in Traditional Architecture 10 (2015) 397-403. http://dx.doi.org/10.12944/CWE.10.Special-Issue1.50
- V. Makani, A. Khorram and Z. Ahmadipur, Secrets of Light in Traditional Houses of Iran, International Journal of Architecture and Urban Development 2 (2012) 45–50.
- F. Nabavi, Y. Ahmad and A.T. GOH, Daylight and Openings in Traditional Houses in Yazd, Iran, 2012, accessed 13 March 2018, Available at: http://repository.um.edu.my/31434/.
- A. Javani, Z. Javani and M.R. Moshkforoush, Studying Relationship between Application of Light and Iranian Pattern of Thought (the Iranians ideology), in: Colour and Light in Architecture, 2010, pp. 39–46, Knemesi, Verona, Italy.
- F. Nabavi, Y. Ahmad and A. Tee Goh, Daylight design strategies: A lesson from Iranian traditional houses, Mediterranean Journal of Social Sciences 4 (2013) 97-103. https://doi.org/10.5901/mjss.2013.v4n9p97
- M. K. Pirnia, Iranian Style of Architecture, Collection and edition by Gholam Hossein Memarian, Tehran: Srush Danesh, 2011.
- F. F. Tehrani, Globalization, Multiculturalism and the Evolution of Suburban Toronto, Richmond Hill Iranian Community, UWSpace, 2015. http://hdl.handle.net/10012/9436
- N. Alipour, The Study of Orosies of Tehran Qajar Houses, NEGAREH, Journal of faculty of art Shahed university, 18 (2011) 5–21.
- Z. S. A. Mehrizi and M. Marasy, The Comparative Study of Art of Manufacturing Orosi and Stained Glass Windows in Iran and Europe, Journal of History Culture and Art Research 6 (2017) 233–243. https://doi.org/10.7596/taksad.v6i6.1231
- L. Giovannini, L., V.R.M. Lo Verso, B. Karamata, and M. Andersen, Lighting and energy performance of an adaptive shading and daylighting system for arid climates, Energy Procedia 78 (2015) 370-375. https://doi.org/10.1016/j.egypro.2015.11.675
- R. Dangol, T. Kruisselbrink and A. Rosemann, Effect of Window Glazing on Colour Quality of Transmitted Daylight, Journal of Daylighting 4 (2017) 37–47. https://doi.org/10.15627/jd.2017.6
- C. Reinhart, Daylight Performance Predictions, in: Building Performance Simulation for Design and Operation, Spon Press, 2011, pp. 536.
- A. Bryman, Integrating Quantitative and Qualitative Research: How Is It Done?, Qualitative Research 6 (2006) 97-113. https://doi.org/10.1177%2F1468794106058877
- N. Nasrollahi and E. Shokri, Daylight illuminance in urban environments for visual comfort and energy performance, Renewable and Sustainable Energy Reviews 66 (2016) 861–874. http://dx.doi.org/10.1016/j.rser.2016.08.052
- A. Michael and C. Heracleous, Assessment of natural lighting performance and visual comfort of educational architecture in Southern Europe: The case of typical educational school premises in Cyprus, Energy and Buildings 140 (2017) 443–457. http://dx.doi.org/10.1016/j.enbuild.2016.12.087
- A. Tzempelikos, Advances on daylighting and visual comfort research, Building and Environment 113 (2017) 1-4. https://doi.org/10.1016/j.buildenv.2016.12.002
- D. Chen and H. W. Chen, Using the Koppen classification to quantify climate variation and change: An example for 1901-2010, Environmental Development 6 (2013) 69-79. https://doi.org/10.1016/j.envdev.2013.03.007
- National Renewable Energy Laboratory, Weather Data by Location, Asia WMO Region 2 - Iran - Islamic Republic of, EnergyPlus, 2018, Available at: https://energyplus.net/weather-location/asia_wmo_region_2/IRN//IRN_Yazd.408210_ITMY
- Understanding Color Models and Spot Color Systems, Designers Insights, 2018, Accessed on: 27 March, 2018, Available at: https://www.designersinsights.com/designer-resources/understanding-color-models/.
- R. Shan, Optimization for Heating, Cooling and Lighting Load in Building Façade Design, Energy Procedia 57 (2014) 1716-1725. https://doi.org/10.1016/j.egypro.2014.10.142
- C. S. Kaplan, Islamic Star Patterns from Polygons in Contact, in: Proceedings of Graphics Interface 2005, 2005, pp. 177–185, Ontario, Canada.
Copyright © 2018 The Author(s). Published by solarlits.com.

1610
Total views
Citations
SHARE ON


