Volume 6 Issue 2 > pp. 131-147 • doi: 10.15627/jd.2019.13
Energy Saving Generated Through Automatic Lighting Control Systems According to the Estimation Method of the Standard EN 15193-1
Valerio R.M. Lo Verso,* Anna Pellegrino
Author affiliations
Department of Energy ‘Galileo Ferraris’, Politecnico di Torino, TEBE Research Group, corso Duca degli Abruzzi 24, 10129, Turin, Italy
* Corresponding author.
valerio.loverso@polito.it (V. R.M. Lo Verso)
anna.pellegrino@polito.it (A. Pellegrino)
History: Received 24 October 2019 | Revised 25 November 2019 | Accepted 2 December 2019 | Published online 6 December 2019
Copyright: © 2019 The Author(s). Published by solarlits.com. This is an open access article under the CC BY license (http://creativecommons.org/licenses/by/4.0/).
Citation: Valerio R.M. Lo Verso, Anna Pellegrino, Energy Saving Generated Through Automatic Lighting Control Systems According to the Estimation Method of the Standard EN 15193-1, Journal of Daylighting 6 (2019) 131-147. http://dx.doi.org/10.15627/jd.2019.13
Figures and tables
Abstract
The standard EN 15193-1:2017 “Energy performance of buildings - Energy requirements for lighting” introduced a detailed method to calculate the energy demand for lighting in buildings. The method contains a calculation of the daylight supply, which accounts for the impact of lighting control systems, both daylight-linked and occupancy-based. This paper presents the results of a study carried out to quantify, with respect to a manual on/off switch, the energy savings due to the four typologies of daylight-linked controls included in the standards, as well as their combination with an occupancy auto off control. To highlight the factors that affect the amount of saved electric energy, several spaces were considered, with different daylight availability, windows orientation and shading system, located in sites at different latitudes and climate conditions, and considering two types of building: offices and classrooms. A database of 2880 cases was built. As a second step of the study, for each site and type of control, the minimum window-to-wall ratio necessary to obtain a pre-defined saving was calculated. The results show for what combinations of variables two target savings of 20% and of 30% can be reached using the photodimming and occupancy controls contained in the standard.
Keywords
EN 15193-1:2017, Energy demand for lighting, LENI, Lighting controls
1. Introduction
It is widely known that the carbon dioxide CO2 footprints and the greenhouse gas emissions are among the main responsible factors for the worldwide global warming problem. The energy demand in the building sector is up to 40% of the global energy consumption in Europe and is responsible of 36% of the CO2 footprint [1]. In the European Union, 75% of the buildings is inefficient from an energy viewpoint: in spite of the fact that the building sector is expanding, the retrofitting and renovation interventions on inefficient buildings lies in the range 0.4% - 1.2% of the building stock, for the different Member States [2].
Following up the shared international agreements signed in the Kyoto Protocol (1997), the European Union released in January 2002 the Energy Performance Building Directive (EPBD) as the major regulation concerned with the energy performance of a building. The EPBD was intended as an instrument for enhancing the building regulations on energy performance of the building stock in the EU member states, through the creation of a synergy among all the Member States by a strengthening of energy policies. The shared goal was to pursue an increase both in the energy efficiency of a building, in the research and technology development as well as in the occupation development. The original version of the Directive was deeply reviewed in 2010, through the EPBD - Directive recast and later amendments [3,4]. According to the publication ‘Implementing the Energy Performance of Building Directive (EPBD)’, issued by the European Union [2], “with its recast, new challenges were faced by Member States (MSs). Foremost among them, the cost-optimal calculations for setting minimum requirements and the path towards Nearly Zero-Energy Buildings (NZEBs) by 2020. While the first issue seems to be well solved by almost every country by now, NZEB continues to be a major challenge and it is yet unclear how much progress will be reached by 2020, especially for the much needed renovation of the huge stock of existing buildings with poor energy performance”.
The EPBD adopts a holistic approach, which combines standard aspects and informative tools, and defines the energy performance of a building as “the energy amount needed to meet the energy demand due to a standard use of a building, especially including the energy use for heating, for cooling, to heat up the domestic hot water, and for lighting”.
The EPBD adopts a holistic approach, which combines standard aspects and informative tools, and defines the energy performance of a building as “the energy amount needed to meet the energy demand due to a standard use of a building, especially including the energy use for heating, for cooling, to heat up the domestic hot water, and for lighting”.
To define a common methodology to estimate the energy performance of buildings according to the EPBD, the European organization for standardization (CEN) elaborated a set of 59 standards [5]. One of them is specifically devoted to the estimation of the energy demand for lighting for a building: the EN 15193:2007 “Energy performance of buildings - Energy requirements for lighting” [6]. This standard was later deeply reviewed, which led to the issue of an updated document [7] to supersede the previous version.
As a matter of facts, it is widely acknowledged that the energy consumption for lighting plays a crucial role in the global energy use of a building, as it represents up to 15-20% of the total building electricity consumption [8,9], with a projected increase to up about 40% by year 2030 [10]. Energy conservation measures in the lighting field in buildings refer to different domains: from the energy efficiency of the luminaire’s components (lamps, optics and ballasts), to the energy efficiency of the lighting system (luminaires associated to control systems), up to and including occupant behavior with respect to lighting and energy conservation in general [11]
If on the one hand increasing the energy efficiency of each component of a lighting system is crucial (and many important innovations have been introduced in this field), it is important to also highlight that, on the other hand, this may be not sufficient to actually achieve energy saving, as shown by the studies carried out on the “rebound effect” [12-14]. However, a huge research has been addressed toward the development and the implementation of increasing the energy efficiency of the lighting system components and this has led to the definitions of a number of policies oriented toward the increase of energy efficiency of lighting systems.
In Europe, the release by the European Union of specific directives on Ecodesign of energy-using or energy-related products (Directive 2005/32/EC on Ecodesign of Energy-using Products – EuP [15] and Directive 2009/125/EC on Ecodesign of energy-related products – ErP [16]) and on energy labelling of such products (Directive 2010/30/UE [3]) has led to key pulse towards the technological development and to the evolution of the market. These directives have progressively led to canceling from the market low-energy products, along with the energy labelling of available products for a more conscious choice for end users.
Further measures have been adopted by developing countries, where the magnitude of efficiency gap is large. For instance, in China, India and Bangladesh programs have been set to encourage consumers to replace obsolete sources with more efficient LED-based systems [17]. A similar program has been adopted by the Iranian government, through a LED Replacement Lamps Program based on providing households with free of charge LED lamps to reduce household electricity demand [18]. Besides, the Qatari government commissioned a study on long-range forecasts of electricity consumption from 2017 to 2030 over different scenarios for the economic drivers, which showed the strong impact that electricity efficiency can have on the future development of electricity consumption [19].
Differently, Japan has chosen to set tax incentives to push producers toward LED products [20], while the Italian government has launched a number of initiatives in terms of tax deductions for private and public stakeholders who implement solutions that increase the energy efficiency in industries, transportation or into the civil sector [21].
Focusing on lighting issues, and particularly on lighting in buildings, it is important to refer not only to the efficiency of each single component of the lighting plant, but also to the plant itself as a whole. This means to include all the factors that contribute to determine how the plant is used, in terms of architectural features of the building (usage of spaces, orientation and window configurations, which in turn determine the daylight amount in the various spaces, and so forth), control systems and interaction between occupants and lighting systems. At a building scale, the global energy performance needs to be determined, according to the above mentioned EPBD: as far as lighting is concerned, the energy performance must account for all the influencing factors, linked to the efficiency of the components of the lighting systems and how they are used, in terms of occupancy-based or daylighting-based lighting controls.
Over the last years, an increasing research has been carried out by different building stakeholders (researchers, designers, manufactures) on developing and setting up automated lighting control systems, which are nowadays widespread components of a smart building. The implementation of these systems as integrated part of the lighting systems of a building can contribute to generate significant reductions in the electric energy use for lighting and enhance visual and thermal comfort conditions for the occupants. Particularly promising in this regard are the Daylight-Linked Control Systems (DLCSs): an extensive research has been carried out, over the last decade, to explore and establish robust relationship between the energy savings and optimized daylighting conditions inside a space.
Several studies addressed the issue of DLCSs performance, through a descriptive approach [22], or through simulations [23-28], or through monitoring [29-36]. Yu and Su [37] presented an overview on the estimation of potential energy saving associated with daylighting through simulations, field monitoring or empirical formulae. Moreover, Ihm et al. [38] developed a simplified mathematical model to evaluate the potential of daylighting to reduce the energy consumption for electric lighting in office buildings by using both continuous dimming and stepped daylighting controls.
Other studies focused on specific aspects of lighting controls: for instance, Doulos et al. [39] investigated the impact on energy saving of electronic ballast, while Valíček et al. [40] studied the behavior of lighting systems controlled at a constant illuminance level, and Clement et al. [41] quantified the impact of standby losses consumption of ten households in Belgium. Similarly, De Koster et al [42] showed that in five university buildings at Leuven, Belgium, useless electricity consumption (including the standby losses) accounts for 4 to 13% of the total electricity consumption. Moreover, Beccali et al. [43] carried out a study on the photo-sensor position for design and commissioning of DLCSs.
In spite of the increased research, the use of DLCSs remains limited, due to several factors, such as: lack of knowledge on the characteristics of the various systems and their operation, which makes their design quite hard also for specialists [43]; difficulties in predicting their functioning during the design process; difficulties and in evaluating their effective energy and economic advantages [44]; subjective preferences and beliefs of occupants [45]. The IEA report T50.D3 [46] highlights that the actual energy savings concerned with lighting control systems are often lower then what expected in principle or predicted through simulations. This is due to a combination of factors, such as a bed implementation, calibration or commissioning of the systems, or a too high complexity, low acceptance or understanding by end users, which may even lead to a complete deactivation of the control systems. Consequently, the study also highlights that there is a strong need for better guidance on the installation, commissioning and operation of controls systems. Gentile et al. [47] stress that during the design and commissioning of a DLCS, technical robustness, architectural integration and human acceptance are critical aspects to address that can limit the effectiveness of these controls in achieving energy saving and comfort. To overcome these obstacles, some researchers have proposed new assessment methodology and metrics to estimate the energy saving performance of DLCSs: these include the work by Bonomolo et al. [48] and by Bellia and Fragliasso [49,50].
Beside DLCSs, also occupancy-based controls can contribute to energy savings and comfort for occupants, especially when they are combined with DLCSs [51-54]. The above mentioned review by Gentile et al. [47] described a relationship between the energy saving concerned with different types of controls and the occupancy profile of a space. In detail, higher energy savings can be obtained when the occupancy is around 27-44% of the total time, while in the presence of a higher occupancy ratio (over 44%), the best saving can be obtained with occupancy-based lighting control strategies, such as presence sensing [23]). For occupancy ratios lower than 27%, a manual switch with absence sensor seems to be the best better strategy, as parasitic losses for the sensors and control modules might be sizeable in comparison to the total electricity used for lighting [55,56]. For both DLCS and occupancy control, a limited acceptance by the occupant was also highlighted [47].
The topic of how to predict the performances of lighting control systems since the earliest design stages onward has become of crucial importance to address designers and buildings owners towards the use of systems that will actually reduce lighting energy consumption while preserving comfort conditions and occupant satisfaction.
1.1. The European standard 15193-1:2017
As mentioned earlier, the standard EN 15193 was initially released in 2007 [6] to complete the set of European standards for the implementation of EPBD directives. In the standard, the LENI index (Lighting Energy Numeric Indicator) was introduced as a metric to quantify the annual energy performance for lighting of a building and an analytical method to calculate the energy demand for lighting of a building is defined. The method considers, with different levels of detail, all the main factors that affect the energy consumption for electric lighting in a building: power of the lighting systems, including the parasitic power of control systems and the power for recharging the emergency lamps; type of control system (manual or automatically controlled according to daylight availability or spaces’ occupancy); daylight penetration into the indoor spaces through both vertical glazing and roof lighting systems; building usage and corresponding lighting requirements; occupancy profile (occupancy time and probability). The method is intended for new, existing or refurbished buildings.
The calculation method originally introduced in the standard has recently gone through a revision that led to the release of the EN 15193-1:2017 [7]. Two key novelties were introduced in the revised document: on the one hand, the method to calculate the LENI was expanded, especially for what concerns the approach to calculate the daylighting contribution; on the other hand, the “Expenditure Factor of lighting systems” was introduced, to quantify the efficiency of the lighting systems with respect to a standard system. Other differences and implementations can be pointed out: the new standard applies also to residential buildings, provides a calculation method to define the power of the lighting systems and implements the informative parts for the definition of the input data. Furthermore, a technical report was developed to assist practitioners in the application of the LENI calculation method according to the new standard [57].
According to the standard, the calculation of the LENI index is based on the sum of two terms:
- the estimated lighting energy required to fulfill the illumination function in a zone of the building (WL), in [kWh];
- the estimated standby energy required during non-lighting periods to provide charging energy for emergency lighting and the activation energy for lighting controls in that zone of the building (WP), in [kWh].
where: W = annual energy required for lighting [kWh]; WL,t = energy for illumination [kWh]; WP,t = energy for standby [kWh]; A = useful area of the building [m2]; Pn = total power for luminaires [W]; Ppc = power for controls’ standby [W]; Pem = power for emergency battery recharge [W]; FC = constant illuminance factor [-]; FD = daylight dependency factor [-]; FO = occupancy dependency factor [-]; tD = daylight time, that is the number of hour during the occupancy profile of the considered space that are in the presence of daylight [h]; tN = daylight absence time, that is the number of hour during the occupancy profile of the considered space that are in the absence of daylight [h]; te = battery charge time [h].
Figure 1 visualizes the various factors that concur to the determination of LENI.
Figure 1
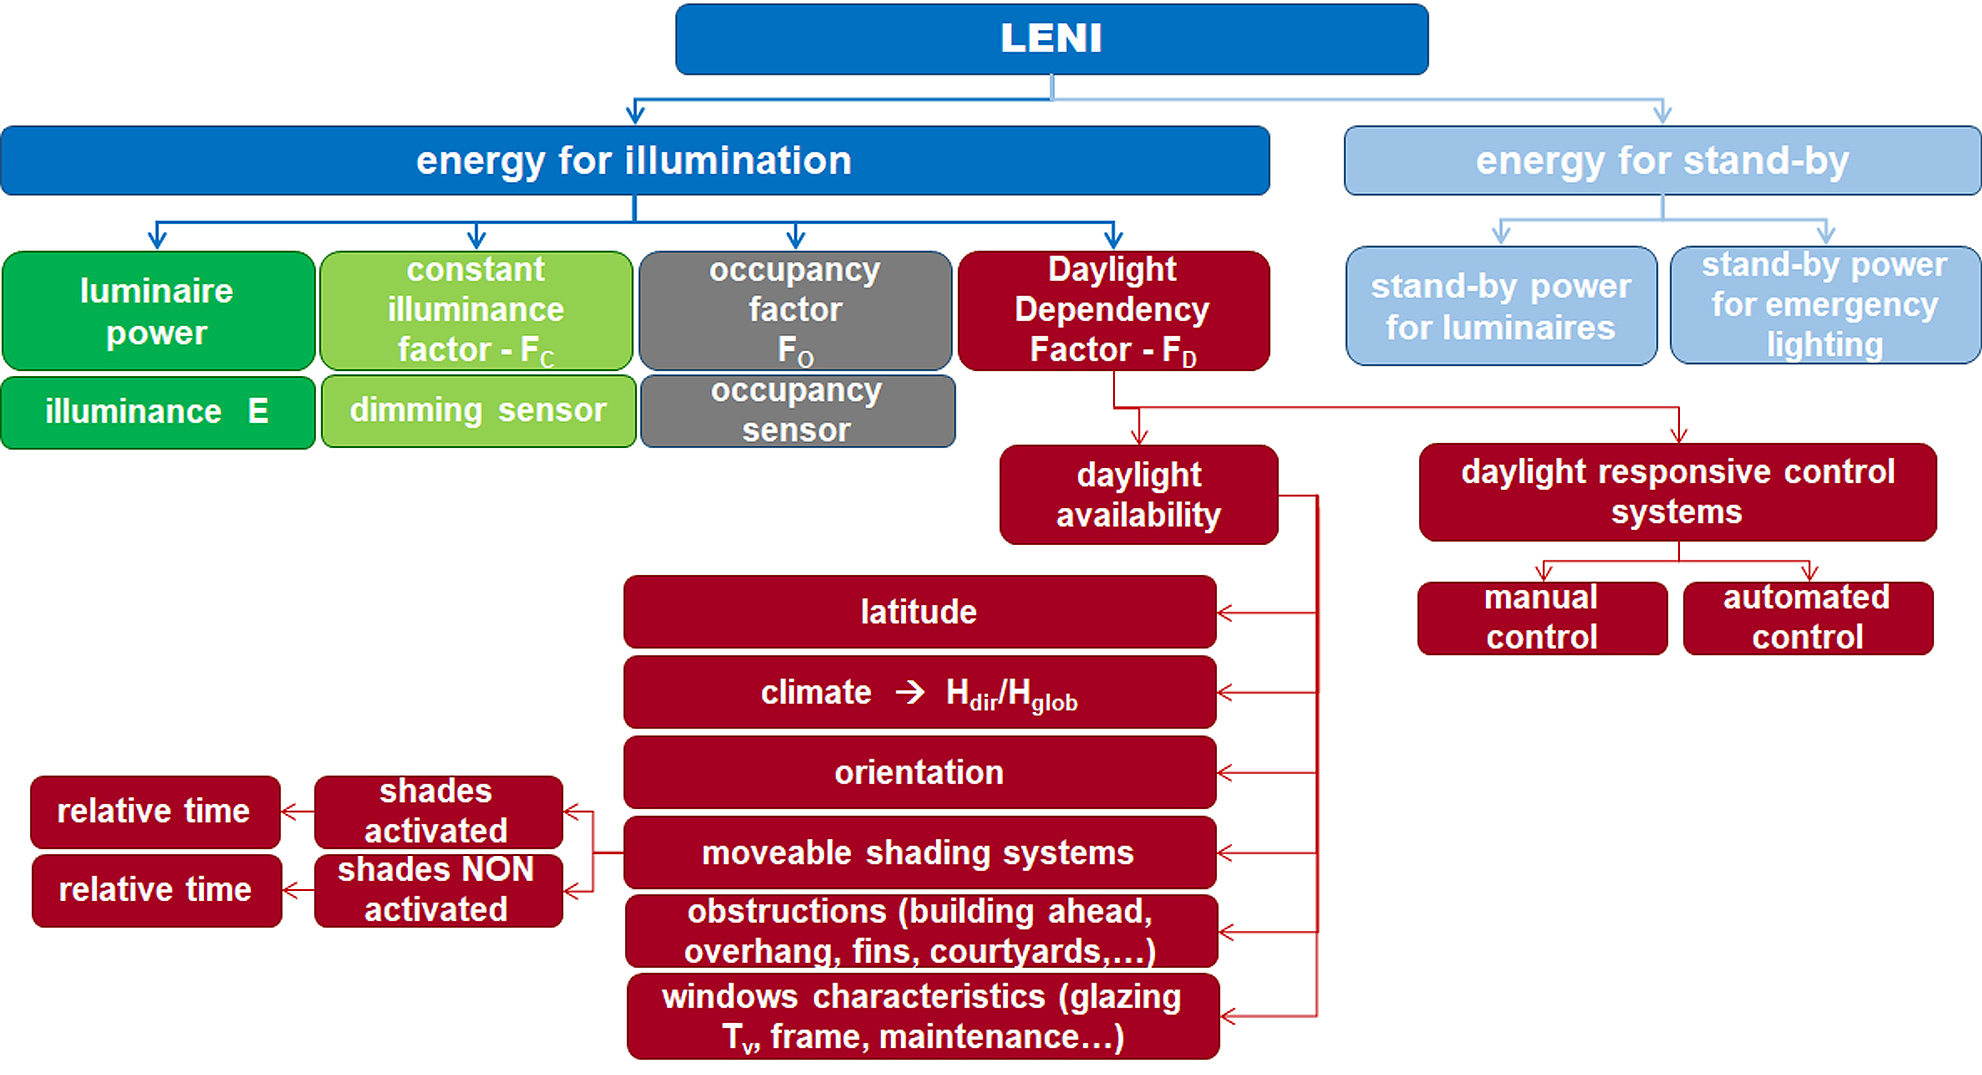
Fig. 1. Visualization of factors that are involved for the determination of LENI.
The terms WL and WP need to be calculated for each zone of the building for the specific time-step selected by the users: an hour, a month, a full year. Therefore the building is segmented into a number of areas (‘zones’), that can coincide with a room or be a part of space within a room. For each zone, the LENI, usually determined for a whole year, is calculated as the energy demand (WL + WP) referred to the floor area of the zone, in [kWh/m2yr]. The LENI of the building is calculated as the sum of the energy consumptions of all the building zones, referred to the corresponding area.
In detail, the analytical method of the standard relies on the following factors to calculate the LENI:
-
daylight dependency factor FD, to quantify the daylight contribution. This is calculated through two other factors: the daylight supply factor FD,S, and the lighting control factor FD,C.
The first one is the factor that estimates the “daylight autonomy” of the zone under consideration, the second one accounts for the effectiveness of the type of lighting control system in exploiting daylight. Two different façade states are considered in the calculation of FD,S: with activated and not-activated solar and/or glare protections. The method accounts for the time during which shadings are activated or de-activated as well as for the corresponding relative daylight supply factor (FD,S,SNA, and FD,S,SA, respectively, where the subscripts SNA stand for “shade not activated” and SA for “shade activated”). In other words, FD,S is calculated as a weighted average of the daylight availability in the presence and in the absence of a shading system (the two values FD,S,SNA and FD,S,SA), using the annual relative time of usage (trel,SA) or non-usage (trel,SNA) of the shading system as weighting factors.
The relative time trel,SNA is determined as a function of site location (through its latitude) and the façade orientation. The climate is also taken into account, through the ‘luminous exposure’: this is the ratio of direct to global solar exposure - Hdir/Hglob – each term being calculated by summing up the direct and global horizontal illuminances of the considered site from 8:00 h to 17:00 h over the whole year. Consequently, FD,S,SNA is provided as a function of site (latitude), climate (Hdir/Hglob), façade orientation, daylight availability without shading (in terms of Daylight Factor - D) and target maintained illuminance Em. Instead, FD,S,SA is determined as a function of the type of shading and of the daylight availability class (D), that in turn depends on the daylight factor of the carcass opening (DCA).
As far as the term FD,C is concerned, this is determined as a function of D, the type of lighting control system and the maintained illuminance required for the zone.
To calculate FD, each building space is divided into a ‘Daylit Area - AD’, which receive daylight and for which FD < 1, and ‘Non-Daylit Areas - AND’ for which no significant daylight contribution can be considered and FD is assumed equal to 1. Figure 2 visualizes the workflow to calculate the term FD. - occupancy dependent factor FO, to consider the effect of the presence of occupants in a space. FO considers the fraction of time when the space is unoccupied (absence factor FA) and the type of occupancy control system installed.
- constant illuminance factor FC, to estimate the reduction of energy consumption that can be achieved with control systems designed to maintain the target illuminance during the overall lighting plant life.
Figure 2
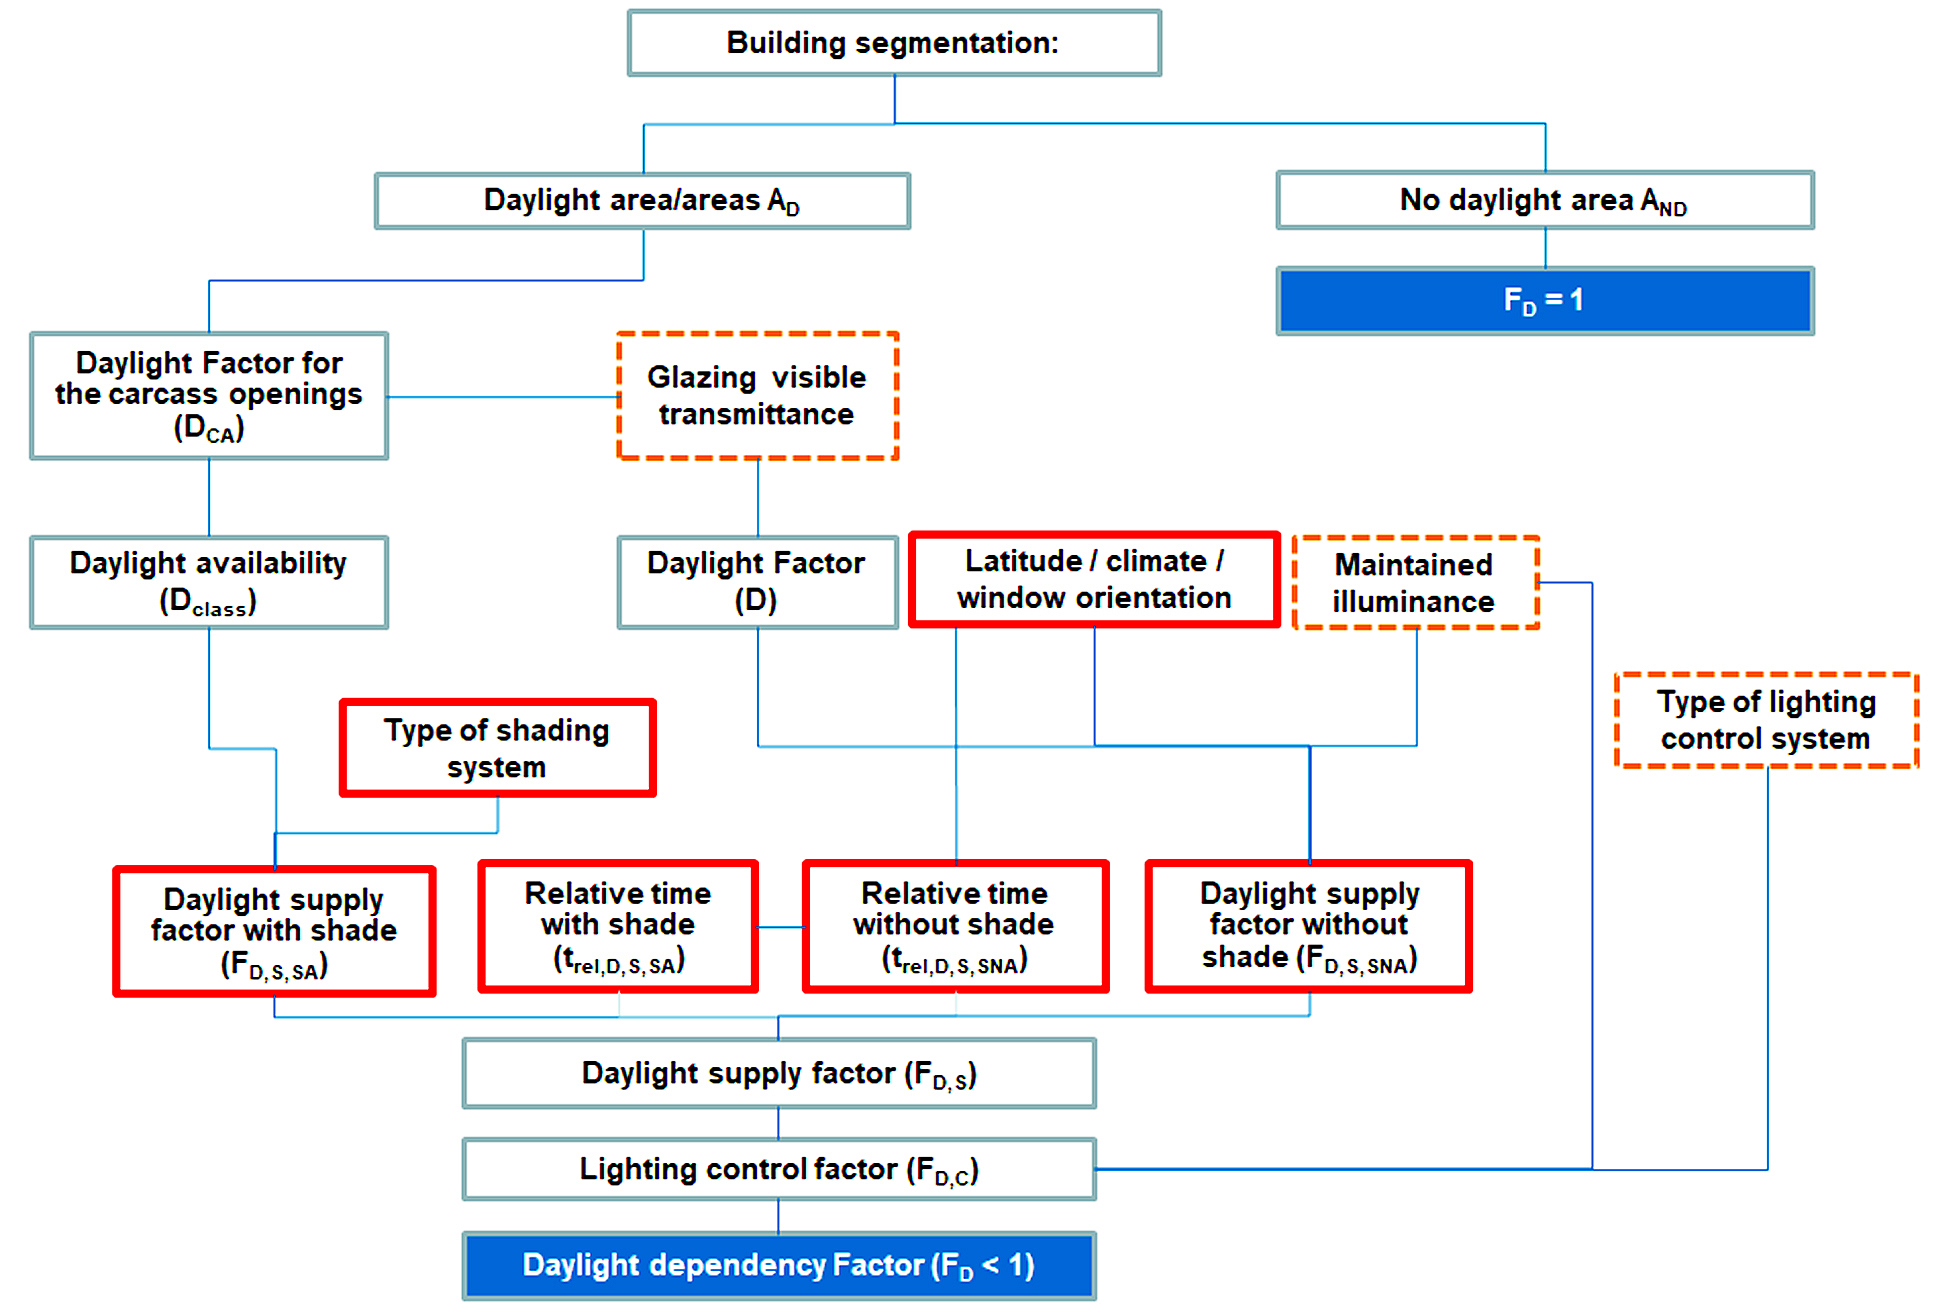
Fig. 2. Visualization of factors that are involved for the determination of the FD.
Different types of lighting controls are considered in the calculation method: beside a manual control, eight types of DLCSs (manual, stepped, dimmed) and four types of occupancy based controls (manual, auto switch off, auto switch on/off, dimmed). The type of DLCS determines the FD,C value and then FD, while the occupancy control determines FO. A more detailed description of the features of the standard can be found in previous papers from the Authors [58,59].
Among the various factors included in the EN15193-1:2017, this paper focuses on the controls systems that can reduce and optimize the consumption for lighting, controls that dim and/or switch the luminaires as a function of the daylighting availability inside a space (‘photodimming controls’) or of the presence of the occupants (‘occupancy controls’). The role played by daylight responsive and occupancy controls on the reduction in the energy demand for a building was addressed in a number of study. An exhaustive literature review can be found in Williams et al. [60] and in Dubois and Blomsterberg [61]. In their review, Williams et al. [60] point out that in office buildings energy savings for lighting can range from 20% to 35% in the presence of switch- off occupancy sensors, and in the range 30%–60 in the presence of DLCSs such as automatic on/off and continuous dimming.
However, they also point out that meaningful differences can be observed between actual savings and estimated savings. In their review, Dubois and Blomsterberg [61] highlight that the lowest energy intensity values can be obtained through a combination of occupancy-based and daylight dimming sensors, but also that post-occupancy studies carried out in real buildings have shown that the actual energy performance of daylit buildings is generally worse than that predicted at the design stage. The Authors also attribute such worse performance, among various reasons, to the low reliability of predictive methods proposed by standards to account for realistic conditions.
1.2. Goal of the study
In this frame, the study presented in this paper is aimed at estimating, through the simplified analytical calculation method defined in the EN 15193-1:2017, the differences in the lighting energy performance that can be obtained using different lighting controls with respect to a manual on/off switch. Daylight-linked and daylight-linked combined with occupancy-based controls were analyzed. In order to evaluate how building features might affect the savings achievable through lighting controls, the analysis was carried out for a reference space located at sites with different climate conditions, window dimensions, orientations and shading configurations. As a last step, the results were used to calculate the minimum window-to-wall ratio WWR (given a sample room configuration) that guaranteed target energy savings.
The topic was initially explored in a preliminary study [62], where the potential saving of four types of daylight-linked lighting controls were analyzed with regard to a target illuminance of 500 lx (referred to an office room). The present paper expands the earlier study to increase the detail of information provided to building practitioners. In more detail, the following two aspects were implemented: (i) each of the four types of daylight-linked lighting controls was coupled with an occupancy control that automatically switches the lights off (‘dimming+occupancy off’) when no presence is detected in the considered space (ii) a second target illuminance, 300 lx (referred to a classroom) was used as reference value to control the daylight-linked systems. Consequently, the databases of configurations analyzed was increased from 720 cases (earlier study) to 2880 cases (present study).
2. Methods
In principle, a DLCS (also referred to as ‘photosensor dimming control’) needs a high daylight availability in the space where it is installed to be effective: the higher the daylight amount, the higher the energy savings that can be obtained. Differently, an occupancy control refers to the actual occupancy of the considered room and it is therefore particularly suitable for spaces with sporadic or dynamic occupant presence. About such controls, Pandharipande and Newsham [63] highlight that in the presence of older systems, the illuminance level was typically restored when occupancy was detected again, while current energy codes promote auto-off/manual-on controls, which provide at a time energy savings and higher satisfaction and acceptance by the occupants. The best performance in terms of energy saving is typically observed for systems that automatically switch off the lighting systems when no presence is detected, rather than for systems that also automatically switch on the lights when the occupants enter the room. The energy saving performance is enhanced if dimming and occupancy off controls are combined. Consistently, the effectiveness of dimming and/or occupancy lighting controls depends on the mutual effect of a number of parameters, such as: climate, architectural and photometric characteristics of the considered room, which determine the daylight supply in the space; room usage, which determines the required illuminance and the potential presence/absence of occupants in the space, etc.
In this study, the analysis of the energy saving performances of lighting controls is carried out through two steps considering two different aspects. On the one hand, the energy saving for different types of controls (DLCSs and DLCS+occupancy auto off) were quantified, with respect to a manual control for 2880 configurations and the number of cases with energy saving over the thresholds of 20% and 30% were calculated. On the other hand, for a given room configuration (with given Tv values and obstruction settings), the minimum window-to-wall ratio (WWR) able to guarantee the previous target energy savings was calculated.
2.1. Step 1: determination of energy saving for different lighting controls
In the analytical method of the standard EN15193-1:2017, the daylight supply is calculated through 2 concepts:
- the daylight factor D, which accounts for the window size, the room size, the presence of external obstructions, the glazing visible transmittance and its maintenance conditions;
- the daylight supply factor FD,S, that, based on the daylight factor of the space, accounts for the site latitude and luminous exposure (defined as the ratio between the annual direct to global illuminance- Hdir/Hglob), the window orientation, the target illuminance, and the presence of moveable shading systems.
In this study, the following variables were considered:
- Daylight Factor D. Five daylight factor values were identified: D=1%, D=2%, D=3%, D=5%, D=7%. For the purpose, a reference room was defined, whose characteristics were able to produce the five above D values. The room was assumed 4.5 m in width and 4.5 m in depth, with a net ceiling-to-height distance of 3 m. The room has an unobstructed window in one wall, equipped with a glazing with a visible transmittance Tv of 70% and whose area was sized in a suitable way to produce the five target D values: in more detail, the height of the window sill and head was kept constantly equal to 1 m and 2.7, respectively, so the window width was varied to produce the target D values. Figure 3 shows the resulting five architectural configurations.
It is worth stressing that the daylit area AD turned out to coincide with the whole floor area for the rooms with D ≥ 3%, while it was lower than the floor area for the rooms yielding D = 1% (AD = 11.97 m2, that corresponds to 0.59 of floor area) and D = 2% (AD = 17.78 m2, that corresponds to 0.87 of floor area). Accordingly, the five D values assumed for the study are, for each geometry, the D values inside the daylight area AD (see Fig. 3); - Climate. Four sites across Europe were chosen, to represent two latitudes L and, for each latitude, two different climates (in terms of Hdir/Hglob values). In detail:
- L=38.7° North and Hdir/Hglob=0.58 (data of Lisbon, but also representative of, f.i., Madrid, Palermo, Catania, Athens)
- L=39.9° North and Hdir/Hglob=0.44 (data of Ankara)
- L=52.5° North and Hdir/Hglob=0.37 (data of Berlin, but also representative of, f.i., London, Amsterdam, Warsaw)
- L=53.9° North and Hdir/Hglob=0.29 (data of Minsk, but also representative of, f.i., Kaunas - Lithuania);
- Orientation. For the above sites, the daylight supply factor FD,S was then calculated for three orientations: South, West/East, North. These are the orientations included in the standard 15193-1:2017, that provided the same tabular values (hence providing the same LENI values for a room with the same characteristics) for the West and East orientation;
- Moveable shading system. Three different shading conditions were assumed in the study: (i) absence of blinds (‘no sun light protection’); (ii) presence of a manually controlled blind for glare protection; (iii) presence of an automatically controlled sunlight protection system. It is worth pointing out that also for the case ‘no protection system’, the standard practically accounts for a presence of shading system used by the occupants (less frequently than glare protection systems);
- room usage (target illuminance and occupancy profile). The reference room was assumed with two alternative functions:
- single-user office, with a target workplane illuminance of 500 lx. According to the specifications of the standard 15193-1:2017, the annual occupancy profile is of 2500 h (TD = 2250 and TN = 250 h), and the absence factor FA is 0.4
- classroom/teaching space, with a target illuminance of 300 lx, used for 2000 h (TD = 1800 and TN = 200 h) with a lower FA of 0.25.
In order to proceed to the calculation of LENI, the following data were used to represent the properties of the lighting systems: (i) lighting power density of 10 W/m2, to guarantee 500 lx on the workplane (office), and of 6 W/m2, to produce an illuminance of 300 lx (classroom); (ii) standby energy density for automated lighting controls: 1% of the lighting power density (consistently with typical data reported in technical datasheet provided by luminaires manufacturers); (iii) all luminaires were assumed to be equipped with a constant lumen output system. The standby energy density for battery charging of emergency light was not considered in this study; - lighting control systems. The following eight typologies of controls were used in the study, in accordance with the list of controls included in the EN15193-1:2017:
- daylight-linked controls (photodimming controls):
- ‘DLCS-V’: dimmed, standby losses, switch-on. The electric lighting is dimmed to the lowest level during usage periods with adequate daylight without being switched off (i.e. with electrical power consumption – ‘stand-by losses’). The electric lighting system is turned on again automatically
- ‘DLCS-VI’: dimmed, no standby losses, switch-on. The electric lighting is dimmed to the lowest level during usage periods (periods with adequate daylight) and switched off (i.e. with no electrical power consumption). The electric lighting system is turned on again automatically
- ‘DLCS-VII’: dimmed, standby losses, no switch-on. The electric lighting is dimmed but is not switched off nor turned back on); like system type V, except that the electric lighting system is not turned on again automatically
- ‘DLCS-VIII’: dimmed, no standby losses, no switch-on. The electric lighting is dimmed and switched off; like system type VI, except that the electric lighting system is not turned on again automatically;
- combined photodimming and occupancy sensors that automatically switch lights off when no presence is detected in the considered room. They are labeled as: ‘DLCS-V + occ auto off’; ‘DLCS-VI + occ auto off’; ‘DLCS-VII + occ auto off; ‘DLCS-VIII + occ auto off’.
- daylight-linked controls (photodimming controls):
Figure 3
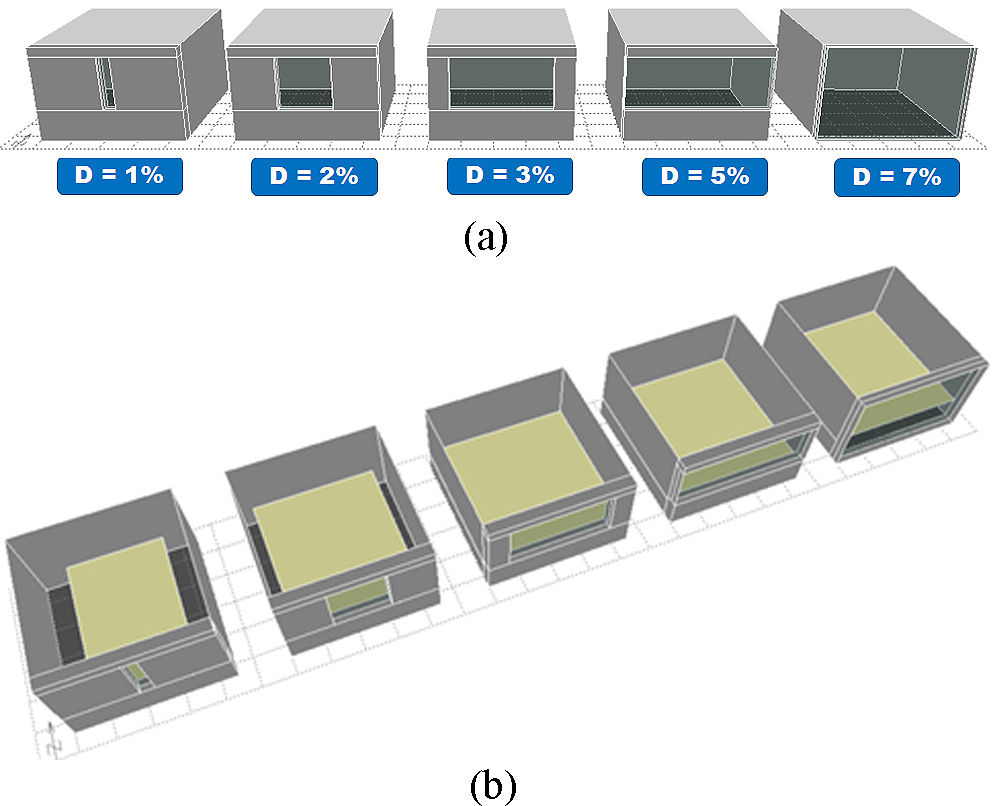
Fig. 3. (a) Room configurations that produce D values of 1%, 2%, 3%, 5%, and 7% and (b) representation of the extension of the dayligt area AD for each configuration.
As the objective of the study was to quantify the potential energy saving of different lighting controls with respect to a baseline manual on/off switch, the following equations were used for the purpose:
where LENIdim,i is the LENI value in the space where a given (‘type i’) DLCS is installed, LENIdim+occ off,i is the LENI value in the presence of a combined DLCS with occupancy-based control, and LENIman switch is the LENI value in the same space where a manual on/off switch is installed.
Two targets were assumed for the energy savings:
- saving = 30%, set based on literature review [60]. In this study, the Authors investigated 88 papers that dealt with energy savings due to lighting controls and calculated an average saving for DLCSs of 28%. 30% is also the most recurring and mentioned value in the lighting practice;
- saving = 20%, which is somewhat more realistically achievable for conditions where an optimal daylight is not available (due to presence of obstructions, reduced window area or transparency, etc.).
In conclusion, the goal of this phase was to find a correlation between a minimum daylight factor D and the energy savings of 20% and of 30%, for different control systems.
Figure 4 visualizes the workflow of the method.
Figure 4
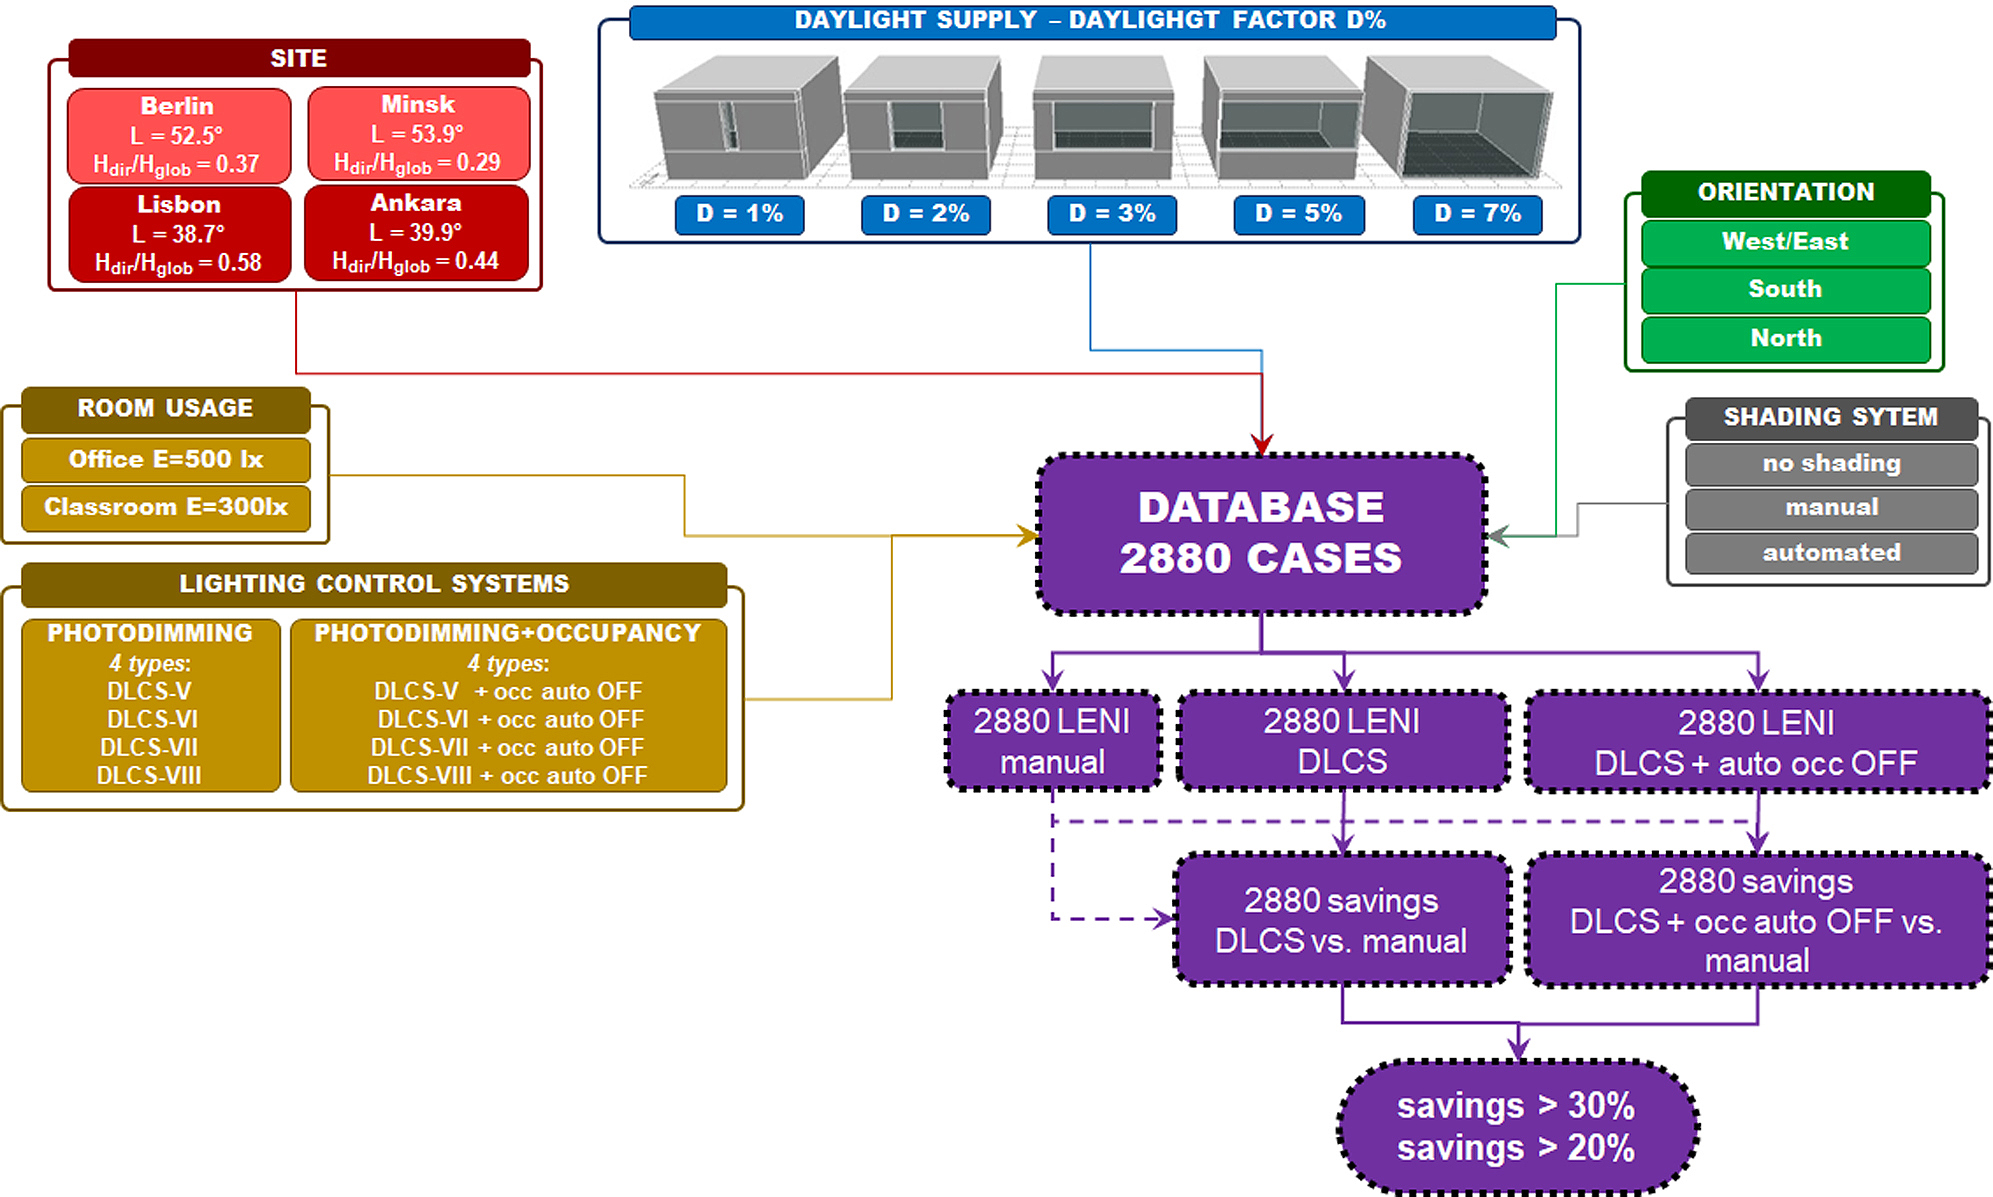
Fig. 4. Workflow of the method, which shows how a database of 2880 cases is generated by combining the different variables assumed in the study.
2.2. Step 2: determination of sample configurations that produce the energy saving calculated in step 1
As a following step, three configurations of the office room were identified and the minimum WWR values, able to guarantee the target savings of 20% and of 30%, were calculated, In detail, the three configurations were assumed as follows:
- room with an unobstructed window equipped with a glazing with a Tv of 70%;
- room with an unobstructed window equipped with a glazing with a Tv of 50%;
- room with a window equipped with a glazing with a Tv of 70%, in the presence of a building ahead whose height produced an obstruction angle of 30°.
For each configuration, the minimum WWR to guarantee the minimum target savings of 20% and of 30% was identified. Actually, the goal of this part of the study was to show which types of DLCSs and which conditions are effective to obtain target energy savings. In this regard, for configurations b) and c), which admit less daylight into a space, an increased WWRmin is expected. Results are referred to the latitudes and climates considered in the study.
3. Results
3.1. Energy savings obtained from pre-determined values of the daylight factor
The analyses that were carried out by combining all the variables considered in the study produced a database of 2880 values of energy saving. The data was synthetized with a series of representations in terms of cumulative frequencies. For each graph, the cumulative frequency of cases that correspond to different classes of energy saving are reported and the thresholds of -20% and -30% highlighted.
The overall results are presented in Fig. 5. As shown in the figure, with regard to the whole dataset, 69% of all the 2880 cases showed a saving over 20% and 41% a saving over 30%. The results are quite different if the sub-dataset of DLCS cases is compared to the sub-dataset of cases with DLCS and occupancy-based auto off controls: for DLCS, 39% of cases show savings > 20% and only 8% of cases show savings > 30%. With DLCS + occupancy off controls, the target saving of at least 20% is always achieved, while savings greater than 30% are obtained for 74% of cases. The combination of photodimming and occupancy off controls has therefore a big impact on the saving that can be estimated by applying the calculation method of the standard EN 15193:1, enhancing the energy performance by a significant amount. This is in line with the findings reported in the literature [60-61].
Figure 5
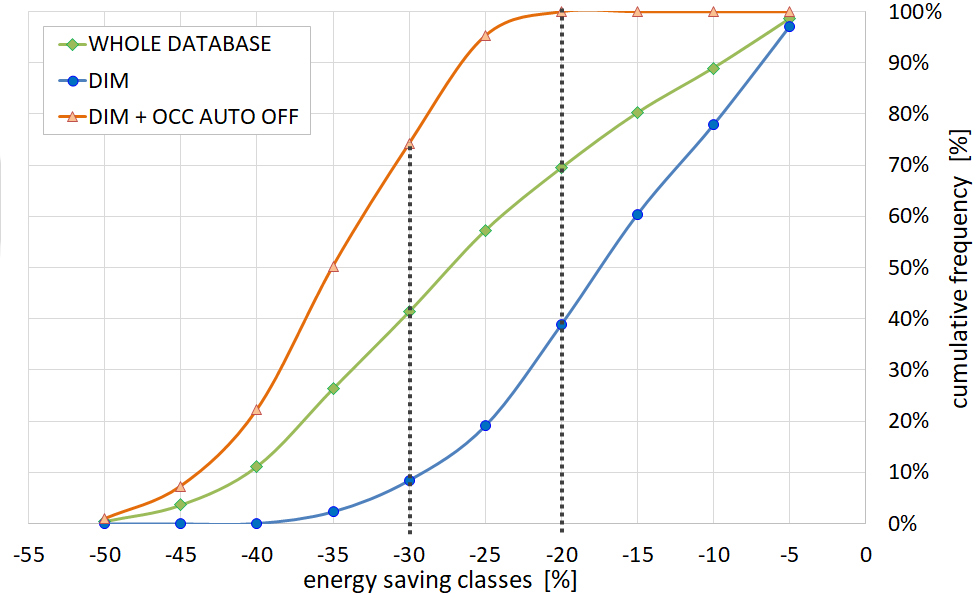
Fig. 5. Cumulative frequencies of cases for energy saving above min. thresholds: results for the whole database.
Further analyses are presented in Figs. 6-10, to present a more in-depth view into the result dataset for the different variables considered in the study. Figure 6 shows a comparison between the results that were obtained for the single office room and for the classroom. In spite of the different target workplane illuminance (500 lx vs. 300 lx, respectively), occupancy profile (2500 h vs. 2000 h), and absence factor (FA=0.4 vs. FA=0.25), the results are quite similar for the two types of spaces: 70% of offices and 69% of classrooms show savings ≥ 20%. The gap increases for the target saving of 30%: 45% of offices and 37% of classrooms show savings ≥ 30%. However, the two trends remain comparable.
Figure 6
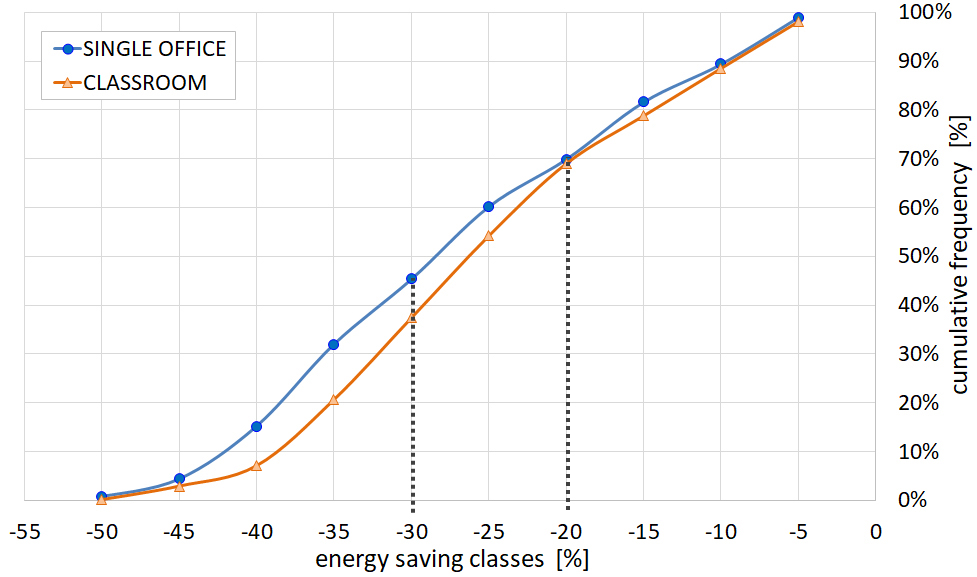
Fig. 6. Cumulative frequencies of cases for energy saving above min. thresholds: comparison of single offices and classrooms.
Figure 7 analyses the impact of the different sites that were considered (in terms of latitude and climate). Compared to the other three sites, Lisbon shows the lowest number of cases that achieve the two minimum target savings. 16% of cases in Lisbon guarantee savings ≥ 20%, versus 44% of cases in Ankara, 45% of cases in Berlin, and 50% of cases in Minsk, while only 2% of cases guarantee savings ≥ 30% (versus 9% in Ankara, 10% in Berlin, and 13% in Minsk). Ankara and Berlin have practically the same trend, while Minsk shows the best energy saving performance. The difference between the best (Minsk) and the worst performance (Lisbon) is due to the quite different climate conditions: Minsk has a higher latitude (L=53.9°) compared to Lisbon (L=38.7%), but half the value of the luminous exposure Hdir/Hglob (0.29 vs. 0.58). This means that Lisbon has a much more significant presence of direct solar radiation during the course of a year, which results, in the analytical calculation method of the standard, in a significantly more frequent use of the blinds, with a consequent drop in the daylight supply and in the performances of DLCSs.
Figure 7
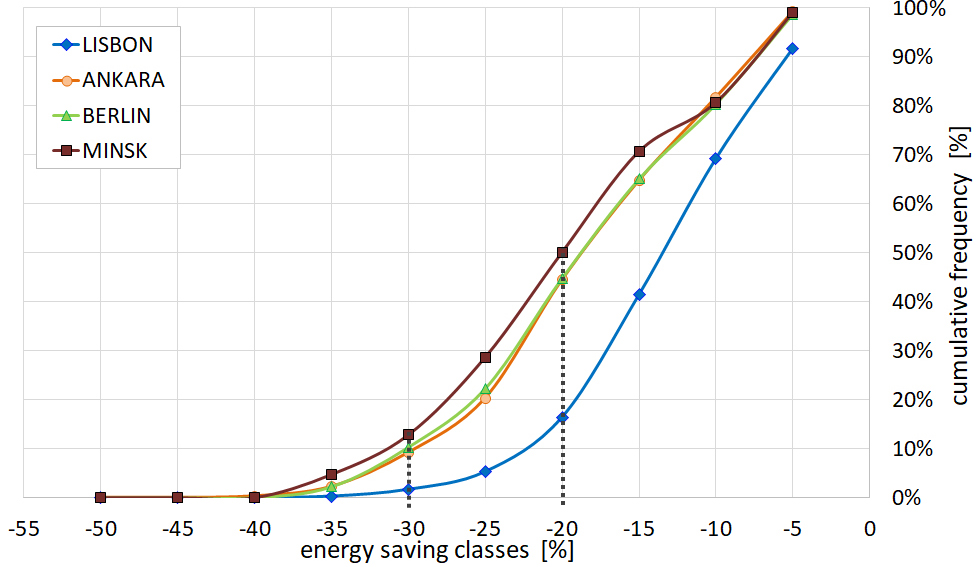
Fig. 7. Cumulative frequencies of cases for energy saving above min. thresholds: comparison of sites and climates.
This aspect is analyzed in more detail in Figs. 8 and 9, which focus on the effect of the orientation (Fig. 8) and of the presence/absence of moveable shading systems (Fig. 9) on the energy saving. For these analyses, as for the following ones, the cases with the four DLCSs only were considered.
Figure 8
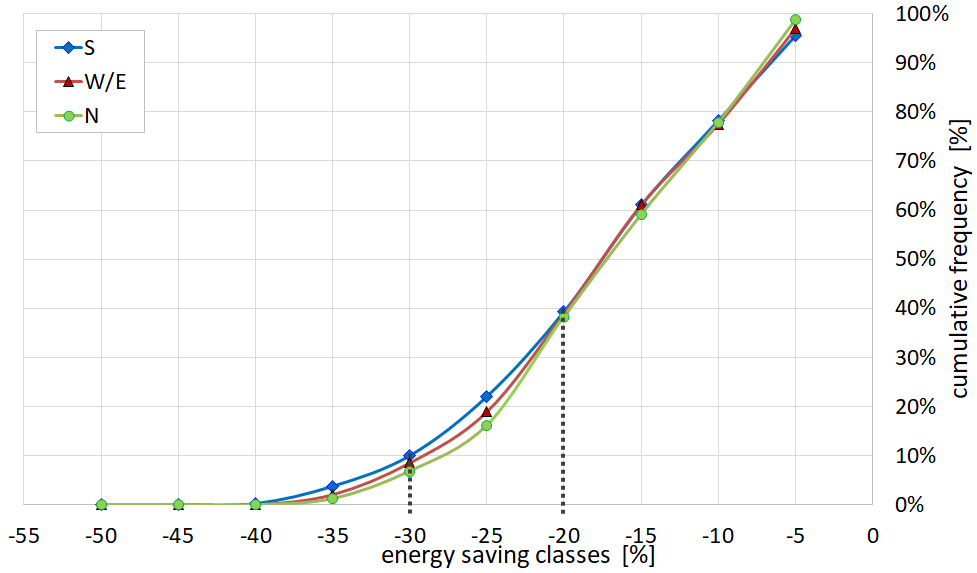
Fig. 8. Cumulative frequencies of cases for energy saving above min. thresholds: comparison of orientations.
Figure 9
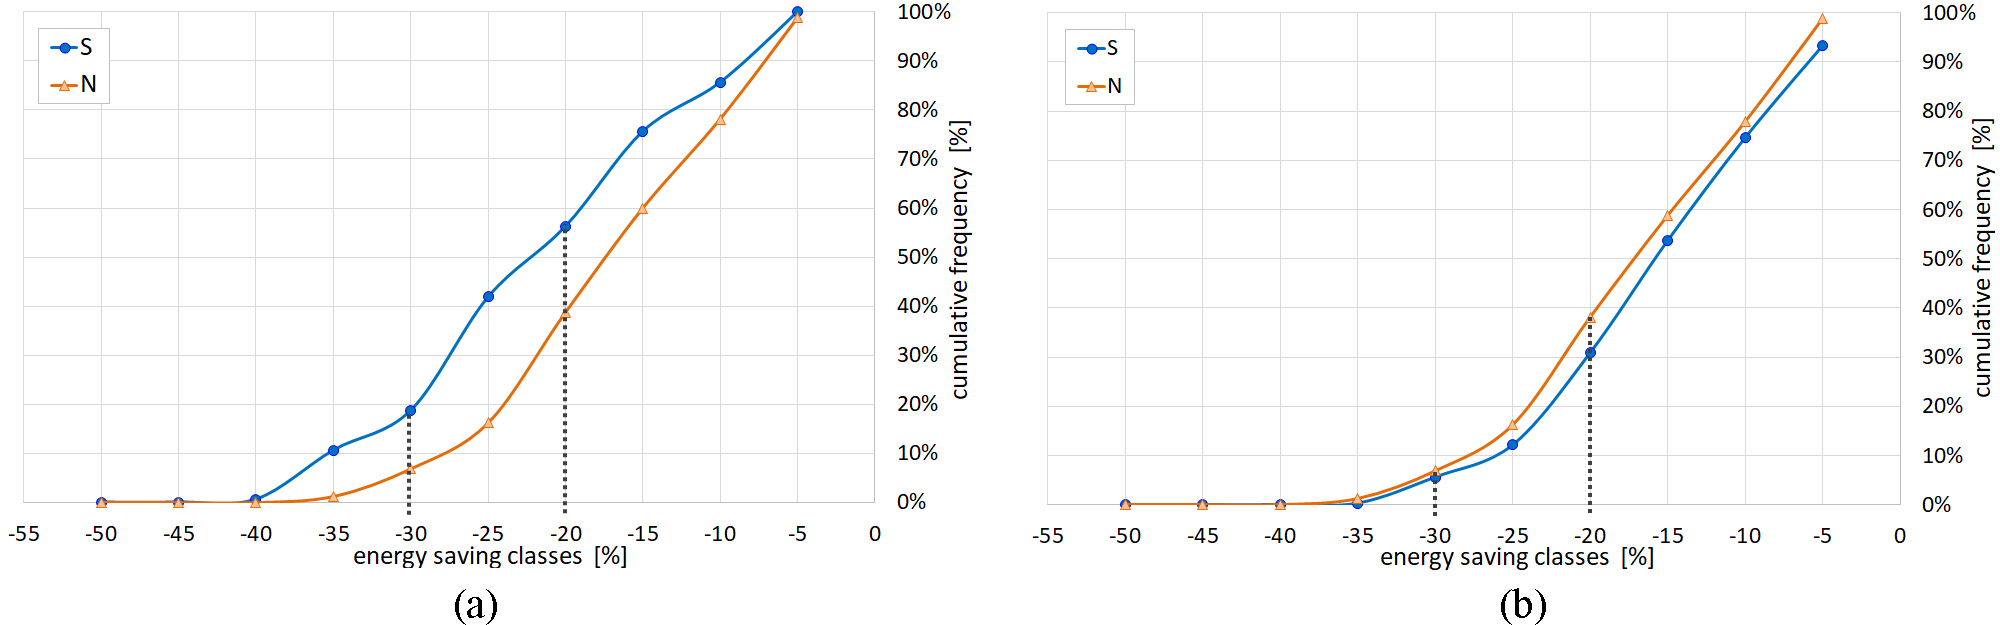
Fig. 9. Cumulative frequencies of cases for energy saving above minimum thresholds, (a) in the absence and (b) in the presence of a moveable shade (manual+automated).
The effect of the orientation does not appear to be significant. The energy savings are practically the same for the three considered orientations: savings ≥ 20% are achieved by 39% of both S-cases and W/E-cases, and by 38% of N-cases, while savings ≥ 30% are guaranteed by 7% of N-cases, 9% of W/E-cases and 10% of S-cases.
The presence/absence of a moveable shade results in an opposite trend for spaces facing S or N. In the absence of a blind, higher savings are observed for spaces facing S, as 56% of cases guarantee savings ≥ 20% (compared to 39% of cases facing N) and 19% of cases guarantee savings ≥ 30% (compared to 7% of cases facing N). the opposite applies for spaces equipped with a moveable blind (manual or automated): better savings were obtained for N-spaces (38% and 7% of cases with savings ≥ 20% and ≥ 30%, respectively, versus 31% and 6% of cases registered for spaces facing S).
As a further analysis, the effect of the various DCLSs was analyzed (Fig. 10). The control ‘DLCS-V’ shows the worst performance: it allows saving ≥ 20% to be hardly achieved by 4% of cases, while savings ≥ 30% are never achieved. The controls labeled as ‘DLCS-VI’ and ‘DLCS-VII’ yield a better performance compared to the system ‘DLCS-V’. The performance of DCLSs-VI and -VII is practically the same, with 41% and 45% of cases with savings ≥ 20%. However, these systems cannot guarantee savings ≥ 30% (0% of cases for the ‘DLCS type VI’, 2% of cases for the ‘DLCS type VII). The best performance were obtained for the control labeled ‘DLCS type VIII’, which assures savings ≥ 20% for two third of cases (66%,) and ≥ 30% for almost one third of cases (32%).
Figure 10
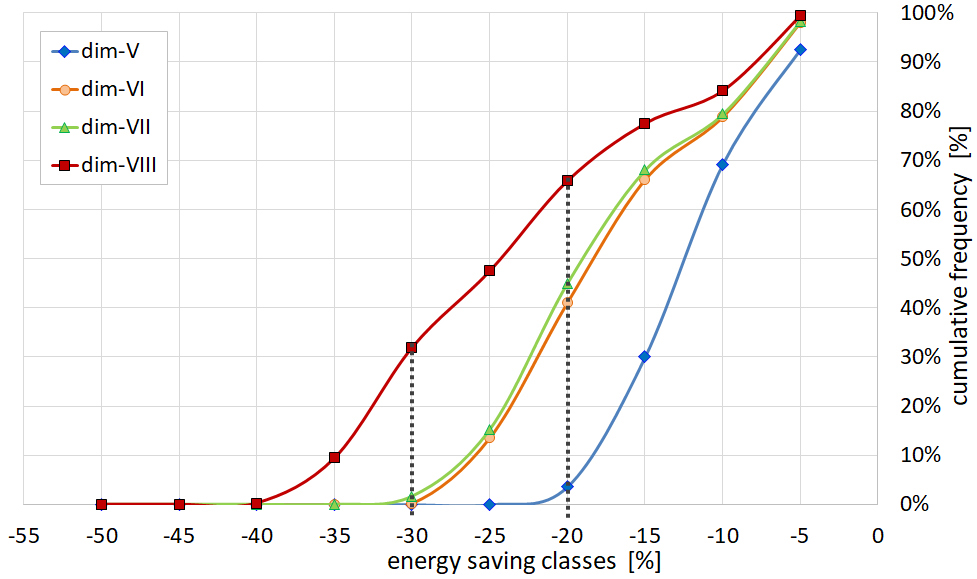
Fig. 10. Cumulative frequencies of cases for energy saving above min. thresholds: comparison of the four DLCSs.
Figure 11 shows in detail the energy savings that were obtained for single office rooms facing S and N, for both DLCSs and DLCS+occupancy auto off controls. Results for the classrooms are not shown, as they are similar to single offices. Data are plotted for the five daylight factor D values considered, distinguished for the use/no use of a glare protection system. Such representation supplements the results synthetically shown earlier in terms of cumulative frequencies. Actually, through the histograms of Fig. 11, the absolute energy saving of each case are displayed. This makes it possible, for instance, to appreciate the important role played by the Daylight Factor D on the energy savings. In more detail, the savings increase as the D values increase. This show that a minimum D needs to be guaranteed in a room to sustain the installation of a daylight-linked dimming controls. As an example, the case of Lisbon appears peculiar: no DLCS allows savings ≥ 30% to be achieved, while savings ≥ 20% can be obtained in one case only: a room with windows facing N with te dimmed lighting control-type VIII, for daylight factor values D ≥ 4.2%.
Figure 11
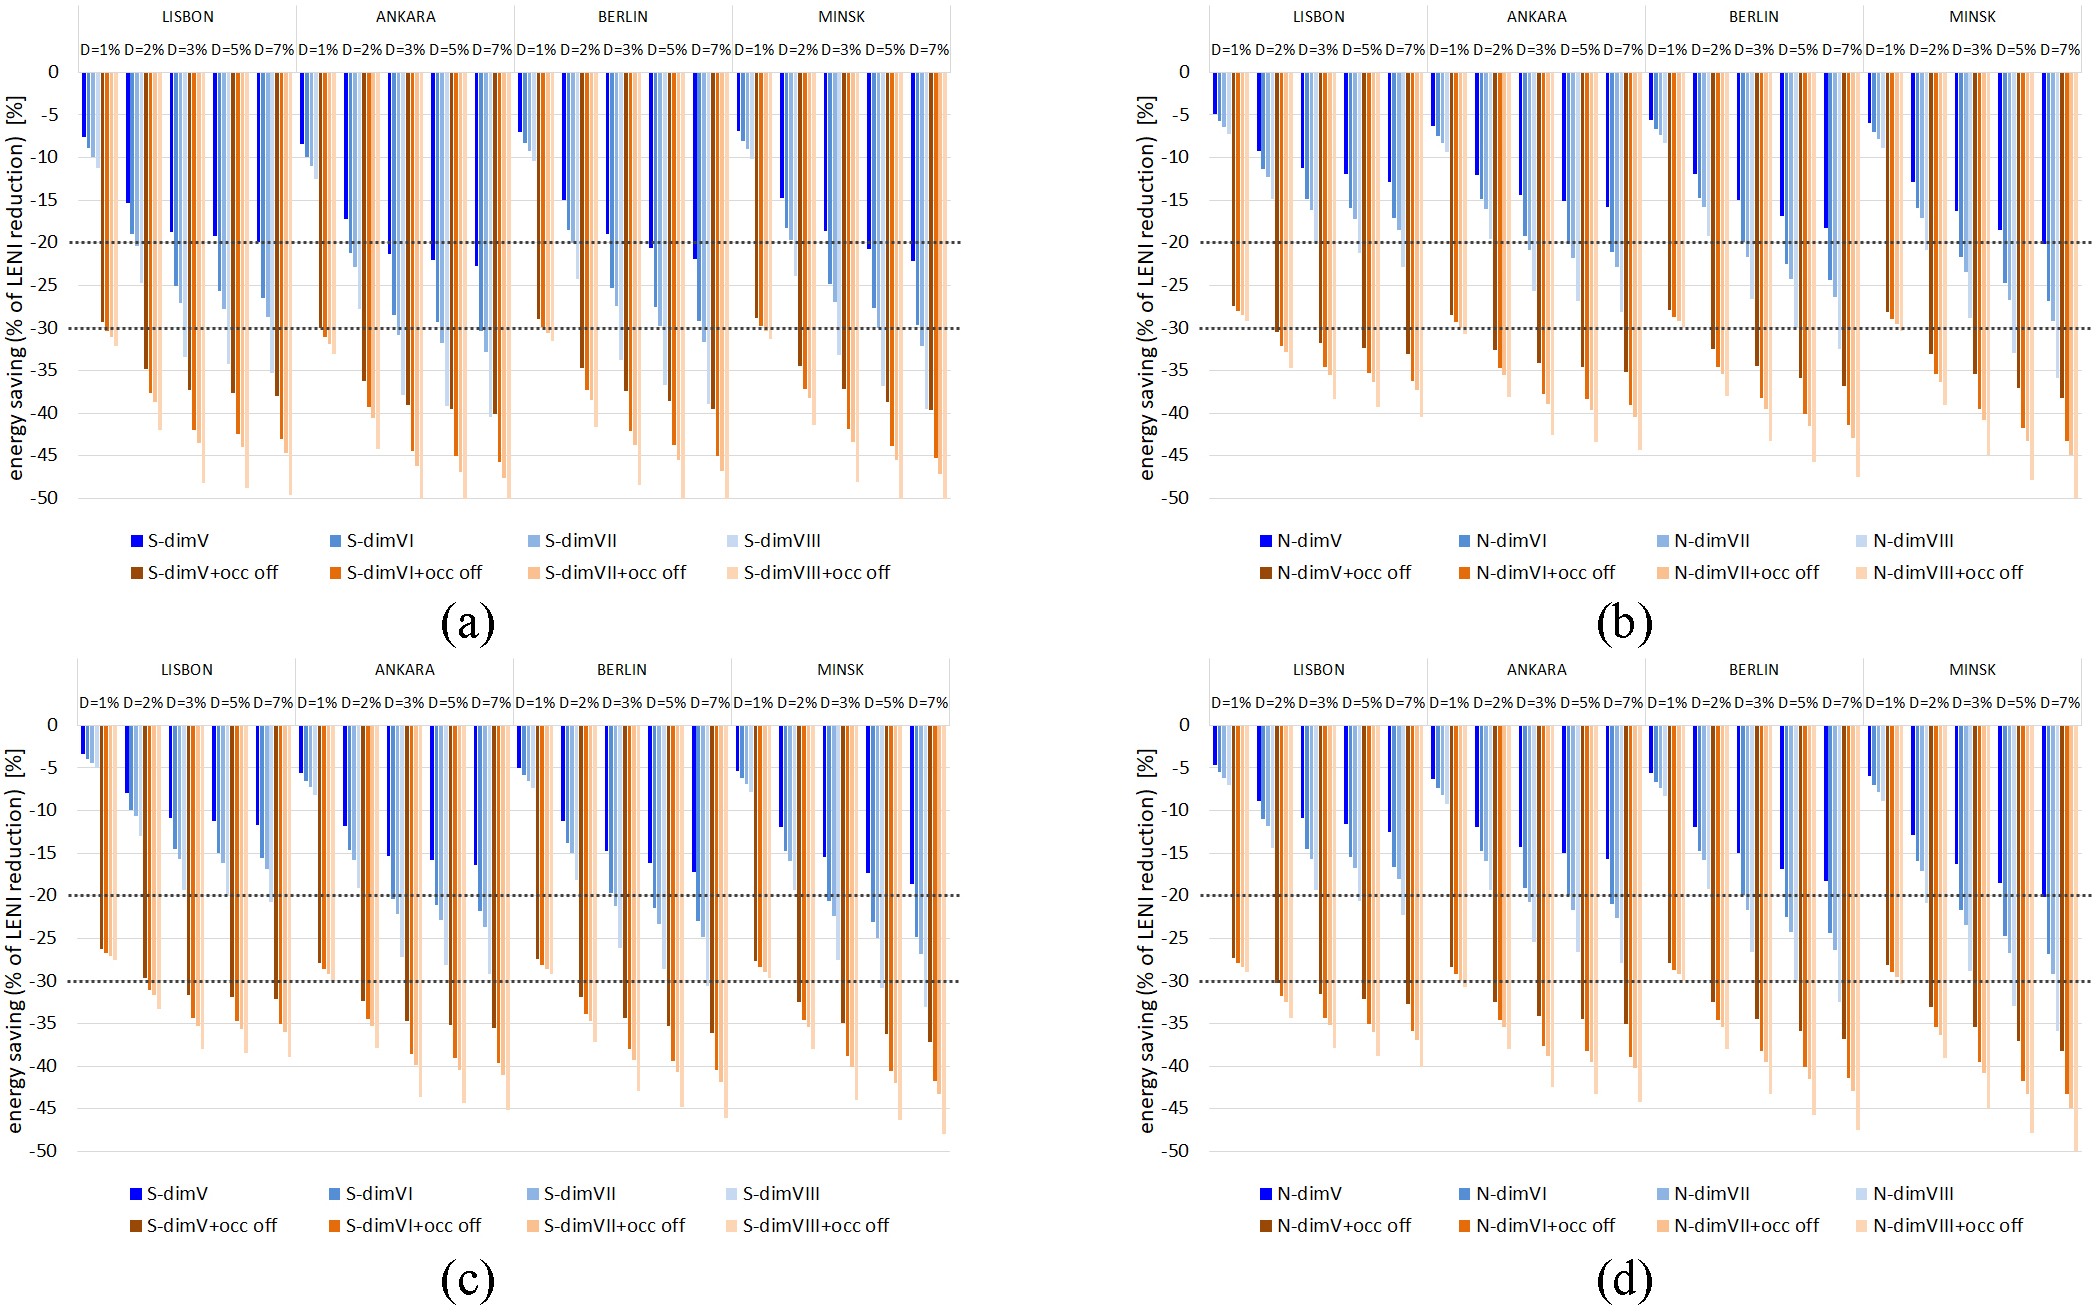
Fig. 11. Frequency of cases that guarantee a given energy saving threshold: results for (a) S-facing spaces without moveable blinds, (b) N-facing spaces without moveable blinds, (c) S-facing spaces with moveable blinds, and (d) N-facing spaces with moveable blinds.
Table I summarizes the energy savings, averaged for DLCS or DLCS+occupancy off controls, which were calculated for each Daylight Factor D.
Table 1
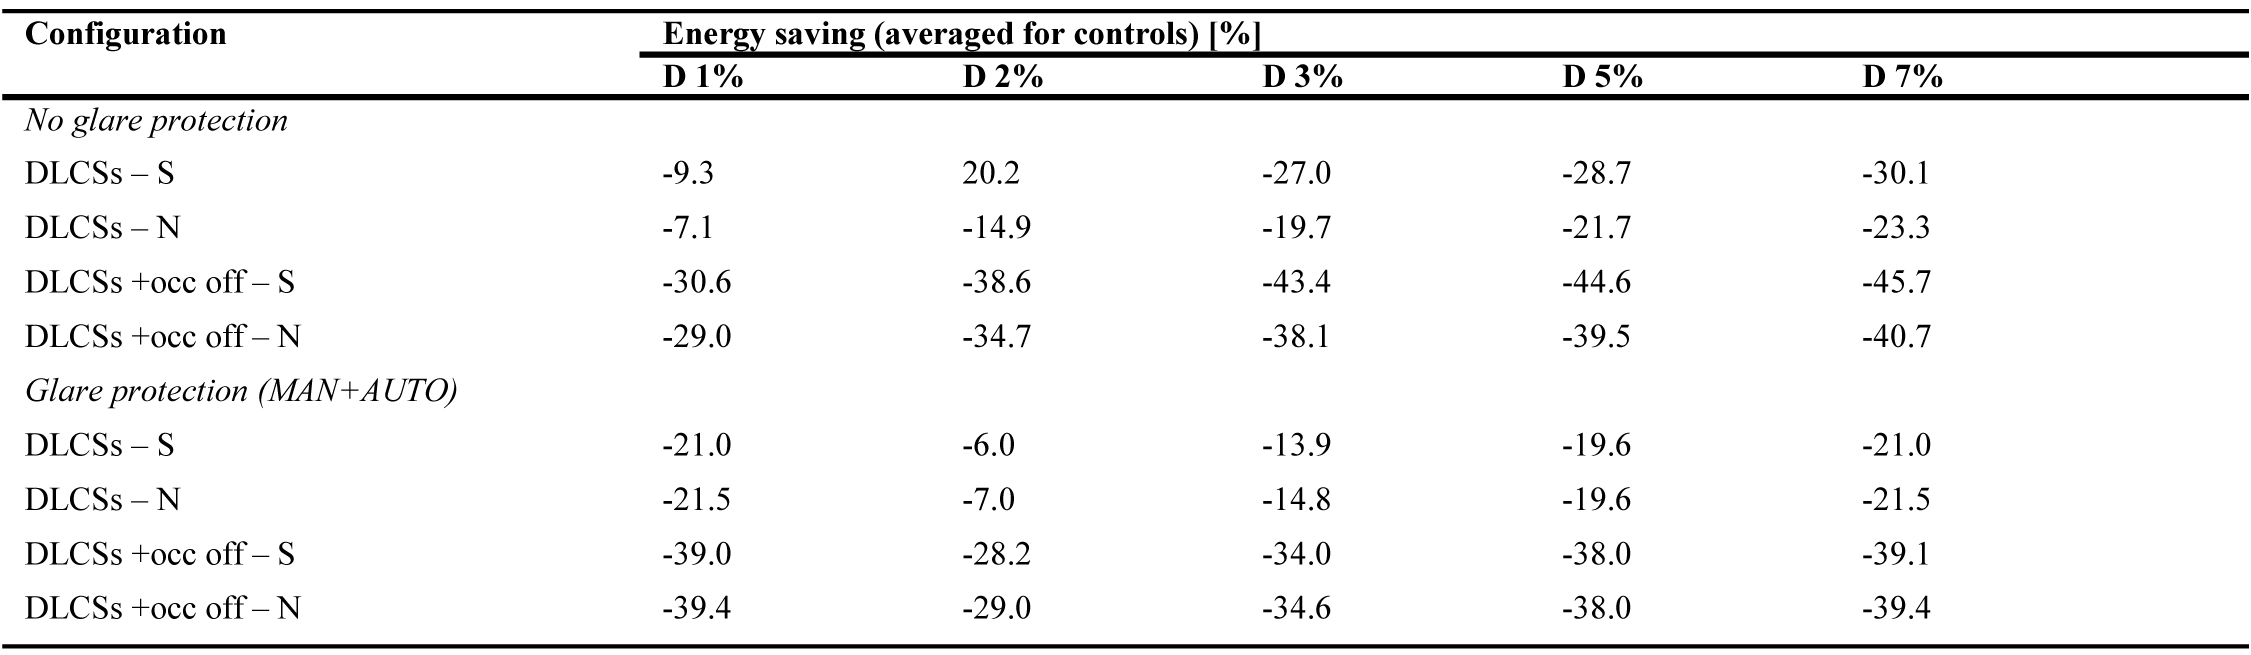
Table 1. Average energy saving for different daylight factors.
3.2. Room Configuration To Determine The Target Savings
Figure 12 shows the minimum WWR values that were determined to achieve the two target energy savings.
Data refer to the single office space, for three configurations: i) a glazing with Tv = 70%; ii) a glazing with Tv = 50%; iii) a glazing with Tv = 70% and a building ahead producing an obstruction angle of 30°. In the histograms, if a bar is missing, this means that reaching the target for that case is not possible (not even with a fully glazed façade – WWR=1 – and with an ideally totally transparent glazing – Tv=1). The results for an automated sun protection system are displayed, for the three sites of Ankara, Berlin, and Minsk.
Figure 12
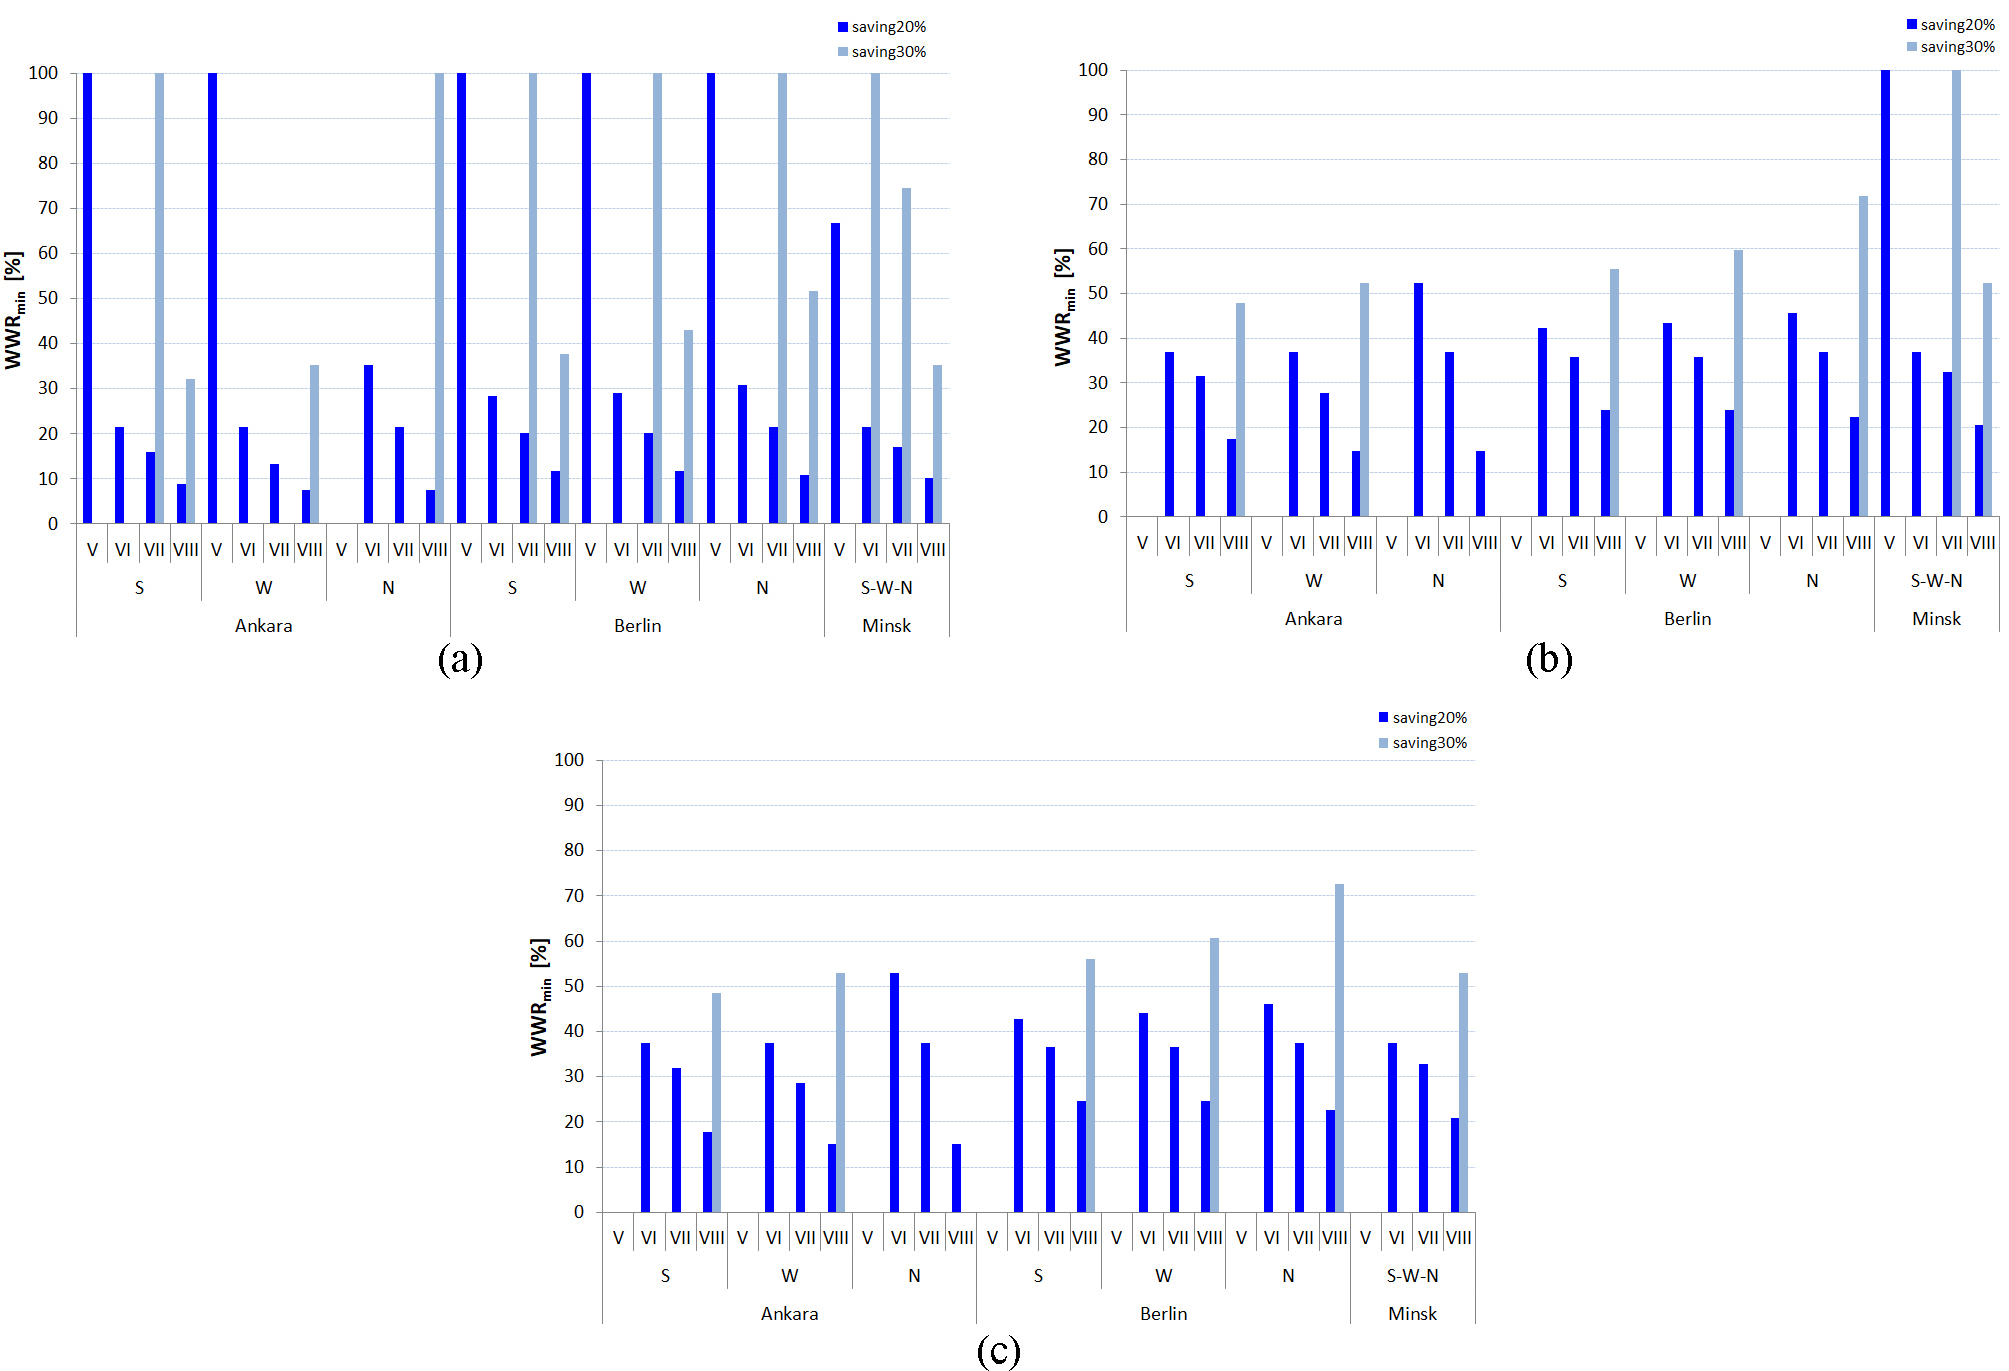
Fig. 12. Minimum WWR values to achieve the two target energy savings of 20% and 30%: (a) cases with a glazing of Tv = 70%, (b) cases with a glazing of Tv = 50%, and (c) cases with a glazing of Tv = 50% and in the presence of an obstruction that produces an obstruction angle of 30°.
As shown in the figures, the DLCS type V, that is the control system with stand-by losses, can never guarantee the target saving of 30%, and also reducing the target saving to 20%, this target is achieved only in the presence of a fully glazed façade (WWR=1). In the case of a un unobstructed façade with a glazing Tv of 70%, the DLCS type VIII (the control system with no stand-by losses) is suitable to achieve both target savings, while for DLCS types VI and VII, an energy saving of 30% cannot be achieved (with the only exception of Minsk, for which a fully glazed façade – WWR=1 – is needed). Types VI and VII are suitable to guarantee an energy saving of 20%.
When the glazing Tv is lowered to 50% or the window is obstructed, the daylight amount in the room decreases and the number of cases for which the target savings are not achieved increases. The highest number of ‘non-achievable’ savings were observed for the rooms with an obstructing building ahead (51.8% of cases, against 48.2% of cases with Tv=50% and 28.8% of cases with Tv=70%, unobstructed).
4. Discussion
The analytical method proposed in the standard EN15193-1:2017 was used in this study to calculate the reduction in the energy demand for lighting (quantified through the LENI index, which was purposely introduced in the standard) due to the use of the four typologies of DLCSs or DLCSs+occupancy off controls included in the standard. Each saving was calculated by comparing the resulting LENI value to the LENI value due to a manual on/off switch. Starting from a set of Daylight Factor D values (in the range 1%-7%), the savings were calculated for a total database of 2880 cases, resulting from the combination of different variables: climate, orientations, absence/presence of a moveable shade, and room usage. The results were then visualized to show which configurations were able to allow the minimum target savings of 20% and 30% (values assumed from a literature review) to be achieved. The results were also summarized to quantify, through cumulative frequencies, the percentage of cases that guaranteed the minimum savings.
The analysis that was carried out proved that the analytical procedure of the standard has the merit to allow the energy consumption for lighting (and hence the potential energy savings for lighting) to be calculated taking all the main variables that influence the integration of daylighting and electric lighting into account. Building practitioners have therefore a simplified but detailed method to predict the lighting energy demand for a building, which can be used since the earlier design stages onward, when the use of advanced dynamic simulation tools may be still premature. Furthermore, the method is standardized and can be used for the energy certification process of a building. It also allows comparison between different buildings to be done. On the other hand, all the factors included in the standard are somewhat simplified, as the method is tabular, while the most advanced simulations tools allow any value of the involved variables (climate, geometries, light and control sensors) to be implemented in the calculation of the energy demand for lighting. It is also worth stressing that the results that were obtained are valid for the specific typologies of DLCS and occupancy-based controls that are implemented in the standard. Focusing on DLCSs, the standard includes four typologies of control systems, but clearly other control strategies or control architectures can be used in the lighting practice. Accordingly, the LENI values and the potential savings could be different. On the other hand, if a different approach was used, for instance based on a dynamic simulation tool (such as DIVA-for-Rhino or SPOT) different results in terms of energy saving would be obtained [59].
Compared to other literature studies, which are mainly focused on quantifying the energy savings of lighting control systems through advanced simulations or through monitoring of systems installed in real building (see section ‘Introduction’), the peculiarity and originality of the study presented in the paper is concerned with using the methods and systems contained in the EN 15193 standard. At the Authors’ knowledge, no similar attempt has been done in the literature. Using the method proposed in the standard, the potential energy saving due to lighting controls were calculated for all the dimming and dimming+occupancy off types provided by the standard, through the LENI index, which was purposely introduced. This means that the study assumed the viewpoint of a designer or building practitioner, potentially not even an expert in the lighting field, who approach the calculation of the energy demand for lighting relying solely on the standard approach. In this context, a difficulty the design team can have is to ‘recognize’ how to match a control system available in the market to one of the control types reported in the limited list contained in the standard. Indeed, the practical difficulty in matching the data reported in the standard (particularly for the lighting controls) with data of existing products is one of the most important lessons learned in the study. Consequently, an effort could be requested to manufactures of lighting controls and systems to declare in technical datasheet which control types their product could correspond to, with respect to the typologies reported in the standard. On the other hand, the standard itself should be revised to expand the list of available types to better match what is being offered on the market.
As mentioned earlier, the study presented in the paper explored the potential energy savings due to DLCSs and occupancy-based controls for various climates and buildings features, which determine the indoor daylight availability. The results are therefore representative of the variables assumed in the study. However, it would be worthwhile to expand the study to include a higher number of locations and cover a wider range of climate conditions, or different building types, which yield different occupancy profiles. In this latter case, changing the occupancy schedule would affect the duration of TD and TN, with a different energy demand for lighting for the considered space in the presence of the different controls assumed in the study.
As a final, general comment, it is worth stressing that the whole paper focuses on the energy savings that can be achieved through lighting controls, as a function of the daylight supply in a room, as well as on occupancy sensors. On the other hand, it should be noted that the presence of daylighting in a space, and its exploitation through light controls, has an influence not only on the energy demand for lighting, but also on the energy demand for heating and for cooling, that is on the global energy consumption of a building. As an example, an increased presence of daylighting in an indoor space (through larger windows, for instance, keeping constancy of all the other variables) may result in higher solar gains in summer, with an increased energy demand for cooling, and in higher losses in winter, with an increased energy demand for heating. The Authors of the study have explored the mutual influence between daylighting and the corresponding energy demand for lighting, cooling, and heating in a previous paper [64]. In more detail, the variation of the energy consumption for lighting, heating, and cooling changed as the daylight supply in a room increased, quantified through the spatial Daylight Autonomy (sDA300,50%), in the presence of a DLCS. The results were obtained through a simulation-based parametric study that involved a database of over 1600 cases (i.e. rooms with different architectural features, such as window area, orientations, and presence of external obstructions). It was observed that a lower daylight availability in a room (sDA300,50% < 55%), the energy demand for lighting was the highest consumption, higher than the consumption for heating and for cooling. As the daylight availability increased (sDA300,50% > 75%), the energy demand for lighting decreased, while the energy demand for heating and for cooling increased, in such a way that the three consumptions showed a comparable amount. Following up the approach adopted in the previous study, a future development of the present study could aim to correlate the energy consumption and saving through daylighting and light controls systems as per the standard EN 15193-1 to energy consumptions for heating and cooling according to other standards of the EPBD set.
5. Conclusions and policy implications
A study on the potential energy saving on the energy demand for lighting for an office room and a classroom due to the use of DLCSs and occupancy off controls is presented. The energy saving was calculated as percent difference between the LENI value obtained with an automatic lighting control system and the LENI value obtained with a manual on/off switch. All the LENI values were calculated using the analytical method included in the standard EN15193-1, issued in 2017. The four typologies of DLCSs included in the standard were used in the study: dimmed, standby losses, switch-on (DLCS-V); dimmed, no standby losses, switch-on (DLCS-VI); dimmed, standby losses, no switch-on (DLCS-VII); dimmed, no standby losses, no switch-on (DLCS-VIII). Each system was also coupled with an automatic occupancy off control. Two minimum values of energy savings of 20% and of 30% were identified as target, based on common assumptions in the lighting practice. The energy savings for a huge number of architectural variables were quantified, as a function of four sites across Europe (whose latitude and climate data are also representative of a number of other similar sites), three orientations (South, West, North) and three configurations in terms of sun protection systems: absence of the protection system, manual system and automated system. Furthermore, two room types, a single office and a classroom, were considered. A large database for 2880 cases was built. Results were then processed to show which percent of cases was able to guarantee the two minimum target savings, distinguishing the results for each variable.
The results showed that the typology of lighting control system can greatly influence the savings that can be achieved. To summarize, the following main considerations can be drawn:
- for DLCSs used stand-alone, the target minimum saving of 30% is reached for 8% only of cases, while the minimum saving of 20% for 39% of cases;
- for DLCSs + occupancy auto off controls, savings that were obtained significantly higher: the minimum target saving of 20% is always achieved, while savings ≥ 30% are obtained for 74% of cases;
- as for the climate, the best saving performance was observed for Minsk (13% of cases with savings ≥ 30%, 50% of savings ≥ 20%), while the worst performance was found for Lisbon (2% of cases with savings ≥ 30%, 16% of savings ≥ 20%). This difference seems to be linked to the more frequent use, on an annual basis, of a glare protection system in Lisbon, a site with the double annual direct radiation compared to Minsk;
- without a moveable shade, S-facing cases showed better savings compared to N-facing cases: 56% of cases guarantee savings ≥ 20% (39% for N-facing cases) and 19% of cases guarantee savings ≥ 30% (7% of cases facing N); when a glare protection system, the best performance is observed for cases facing N;
- DLCS-VIII (dimming+switch off, no standby power) showed the best savings: the LENI values were found to be 92% lower (on average) than for cases with a DLCS-V (dimming, no switch off, with stand-by), 46.1% lower than cases with Type VI (dimming, no switch off, no stand-by), 42.3% lower than cases with DLCS-VII (dimming+switch off, with standby power) ;
- DLCS-V fails to achieve the minimum target saving of 30%, and can hardly achieve the minimum saving of 20%, only in the presence of a fully glazed façade (WWR=1). DLCS-VIII allows both targets of 20% and of 30% to be achieved for most cases (savings ≥ 20% for 66% of cases, savings ≥ 30% for 32% of cases;
- among DLCSs, the energy savings vary with the daylight supply, from -7.3% for rooms with D=1% (average of the four DLCSs) to -24.1% for D = 7%.
From a policy viewpoint, it is worth stressing that the standard EN 15193-1 is a European standard that belongs to the set of standards included in the EBPD. It has the merit to have introduced the LENI index, along with a simplified but detailed analytical method for its calculation. This means that building practitioners are therefore provided with an estimation method to predict the lighting energy demand for a building, to be used since the earlier design stages onward, as an alternative to advanced simulation tools, still premature at this stage.
Furthermore, the LENI index is meant to allow the energy consumption for lighting of a building to be quantified and used for the energy certification process of a building, along with the other indices commonly used (energy demand for heating, cooling and domestic hot water). Consequently, the global energy performance of a building can be calculated through the same method for the Member States of EU, thus allowing comparison between different buildings located in different countries across Europe to be done.
In spite of the merits of the standard, on the other hand there still is the need for a dedicated legislation at a local level (i.e. within each MS) to implement the calculation of LENI into the common design practice. Actually, a designer needs to cope with a large and non-homogeneous number of local standards (for instance, regional standards that supplement state standards) as well as technical regulations. As a result, there is a risk is that the calculation of LENI remains undressed. Specific regulations are therefore needed.
Contributions
The authors have contributed equally.
References
- Eurostat (European Commission). Energy – yearly statistics 2008. ISSN: 1830-7833. Luxembourg: Publications Office of the European Union, 2010.
- European Union,– Implementing the Energy Performance of Building Directive (EPBD), Lisbon, 2016. ISBN 978‐972‐8646‐32‐5, available at: https://www.epbd-ca.eu/outcomes/2011-2015/CA3-BOOK-2016-A-web.pdf (last retrieved: March 2018).
- European Union. Directive 2010/30/EU of the European Parliament and of the Council of 19 May 2010 on the indication by labelling and standard product information of the consumption of energy and other resources by energy-related products (recast) (Text with EEA relevance). 2010. Available at: https://eur-lex.europa.eu/legal-content/EN/TXT/PDF/?uri=CELEX:32010L0030&from=EN (last access: August 15, 2019).
- European Union. Directive 2012/27/EU. Directive of the European Parliament and of the Council of 25 October 2012 on energy efficiency, amending Directives 2009/125/EC and 2010/30/EU and repealing Directives 2004/8/EC and 2006/32/EC (Text with EEA relevance). 2012.
- CEN (Comité Européen de Normalisation). CEN M 343 – EN, Mandate to CEN, CENELEC and ETSI for the elaboration and adoption of standards for a methodology calculating the integrated energy performance of buildings and estimating the environmental impact, in accordance with the terms set forth in Directive 2002/91/EC. 2004.
- CEN (Comité Européen de Normalisation). European Standard EN 15193:2007. “Energy performance of buildings. Energy requirements for lighting”. Brussels. 2007.
- CEN (Comité Européen de Normalisation). European Standard EN 15193-1:2017. “Energy performance of buildings - Energy requirements for lighting - Part 1: Specifications, Module M9”. Brussels. 2017.
- IEA (International Energy Agency). Guidebook on energy efficient electric lighting for buildings. ANNEX 45 Report. ECBCS - Energy Conservation in Buildings and Community Systems, Edited by Liisa Halonen, Eino Tetri & Pramod Bhusal. 2010.
- US Department of Energy DOE. “2011 Buildings Energy Data Book”, prepared for the Buildings Technologies Program Energy Efficiency and Renewable Energy, U.S. Department of Energy. 2012.
- IEA (International Energy Agency). Light’s labour’s lost: Policies for Energy-Efficient Lighting, vol. Light's labour's lost: Policies for Energy-Efficient Lighting. Paris: OECD Publishing. 2006.
- S. Wang, J. Wang, X. Ru, J. Li, D. Zhao, Understanding employee’s electricity conservation behavior in workplace: Do normative, emotional and habitual factors matter?, Journal of Cleaner Production 215 (2019) 1070-1077. https://doi.org/10.1016/j.eneco.2013.07.006
- L.A. Greening, D.L. Greene, C. Difiglio.. Energy efficiency and consumption — the rebound effect — a survey, Energy Policy 28 (2000) 389–409. https://doi.org/10.1016/s0301-4215(00)00021-5
- K. Gillingham, D. Rapson, G. Wagner. The Rebound Effect and Energy Efficiency Policy, Review of Environmental economics and policy 10 (2016) 68–88. https://doi.org/10.1093/reep/rev017
- A. Guerra, F. Sancho, Rethinking economy-wide rebound measures: an unbiased proposal, Energy Policy 38 (2010) 6684–6694. https://doi.org/10.1016/j.enpol.2010.06.038
- European Union. Directive 2005/32/EC of The European Parliament and of The Council of 6 July 2005, establishing a framework for the setting of ecodesign requirements for energy-using products and amending Council Directive 92/42/EEC and Directives 96/57/EC and 2000/55/EC of the European Parliament and of the Council. 2005. Available at: https://eur-lex.europa.eu/LexUriServ/LexUriServ.do?uri=OJ:L:2005:191:0029:0058:en:PDF (last access: August 15, 2019).
- European Union. Directive 2009/125/EC of the European Parliament and of The Council of 21 October 2009, establishing a framework for the setting of ecodesign requirements for energy-related products (recast). 2009. Available at: https://eur-lex.europa.eu/LexUriServ/LexUriServ.do?uri=OJ:L:2009:285:0010:0035:en:PDF (last access: August 15, 2019).
- N. Chun, Y. Jiang, How households in Pakistan take on energy efficient lighting technology, Energy Economics 40 (2013) 277–284. https://doi.org/10.1016/j.eneco.2013.07.006
- Z.A. Barkhordar, Evaluating the economy-wide effects of energy efficient lighting in the household sector of Iran, Energy Policy 127 (2019) 125–133. https://doi.org/10.1016/j.enpol.2018.11.053
- A. Khalifa, M. Caporin, T. Di Fonzo. Scenario-based forecast for the electricity demand in Qatar and the role of energy efficiency improvements Ahmed. Energy Policy 127 (2019) 155–164. https://doi.org/10.1016/j.enpol.2018.11.047
- N. Li. Which Country Has the Best LED Policy Among Japan, India, and Malaysia?, LEDinside, 2015.
- Italian government, Ministry of Economic Development: https://www.mise.gov.it/index.php/en/. Last access: August 5, 2019.
- G. Parise, L. Martirano, Combined Electric Light and Daylight Systems Ecodesign, IEEE Transactions on industry applications 49 (2013) 1062-1070. https://doi.org/10.1109/tia.2013.2253534
- B. Roisin, M. Bodart, A. Deneyer, P. D’herdt, Lighting energy savings in offices using different control systems and their real consumption, Energy Build. 40 (2008) 514–523. https://doi.org/10.1016/j.enbuild.2007.04.006
- Y. Chen, J. Liu, J. Pei, X. Cao, Q. Chen, Y. Jiang, Experimental and simulation study on the performance of daylighting in an industrial building and energy saving potential, Energy and Buildings 73 (2014) 184–191. https://doi.org/10.1016/j.enbuild.2014.01.030
- I.H. Yang, E.J. Nam, Economic analysis of the daylight-linked lighting control system in office buildings, Solar Energy 84 (2010) 1513–1525. https://doi.org/10.1016/j.solener.2010.05.014
- M. Bodart, A. De Herde, Global energy savings in offices buildings by the use of daylighting, Energy and Buildings 34 (2002) 421–429. https://doi.org/10.1016/s0378-7788(01)00117-7
- L. Bellia, F. Fragliasso, A. Pedace, Evaluation of daylight availability for energy savings, Journal of Daylighting 2 (2015) 12–20. https://doi.org/10.15627/jd.2015.2
- G. Boscarino, M. Moallem, Daylighting Control and Simulation for LED-Based Energy-Efficient Lighting Systems, IEEE Transactions on Industrial Informatics 12 (2016) 301 – 309. https://doi.org/10.1109/tii.2015.2509423
- D.H.W. Li, J.C. Lam, Evaluation of lighting performance in office buildings with daylighting controls, Energy and Buildings 33 (2001) 793–803. https://doi.org/10.1016/s0378-7788(01)00067-6
- M.R. Atif, A.D. Galasiu, Energy performance of daylight-linked automatic lighting control systems in large atrium spaces: report on two field-monitored case studies, Energy and Buildings 35 (2003) 441–461. https://doi.org/10.1016/s0378-7788(02)00142-1
- E.S. Lee, S.E. Selkowitz, The New York Times Headquarters daylighting mockup: monitored performance of the daylighting control system, Energy and Buildings 38 (2006) 914–929. https://doi.org/10.1016/j.enbuild.2006.03.019
- R.G. Mistrick, C.A. Casey, Performance modeling of daylight integrated photosensor-controlled lighting systems, In: Proc. of 2011 Winter Simulation Conference (WSC), 2011, 903-914, USA. https://doi.org/10.1109/wsc.2011.6147816
- L. Parise, F. Lamonaca, D.L. Carnì, Interior lighting control system: A practical case using daylight harvesting control strategy, In: Proc. of 2015 IEEE 15th International Conference on Environment and Electrical Engineering (EEEIC), 2015, 719–724, Italy. https://doi.org/10.1109/eeeic.2015.7165253
- A. Pellegrino, V.R.M. Lo Verso, L. Blaso, A. Acquaviva, E. Patti, A. Osello, Lighting Control and Monitoring for Energy Efficiency: A Case Study Focused on the Interoperability of Building Management Systems, IEEE Transactions on Industry Applications 52 (2016) 2627-2637. https://doi.org/10.1109/tia.2016.2526969
- R. Delvaeye, W. Ryckaert, L. Stroobant, P. Hanselaer, R. Klein, B. Breesch, Analysis of energy savings of three daylight control systems in a school building by means of monitoring, Energy and Buildings 127 (2016) 969–979. https://doi.org/10.1016/j.enbuild.2016.06.033
- IEA SHC Task 50. Lessons learned from monitoring lighting and daylighting in retrofit projects − Technical Report T50.D5. 2016.
- X. Yu, Y. Su, Daylight availability assessment and its potential energy saving estimation –A literature review, Renewable and Sustainable Energy Reviews 52 (2015) 494–503. https://doi.org/10.1016/j.rser.2015.07.142
- P. Ihm, A. Nemri, M. Krarti, Estimation of lighting energy savings from daylighting, Building and Environment 44 (2009) 509–514. https://doi.org/10.1016/j.buildenv.2008.04.016
- L. Doulos, A. Tsangrassoulis, F. Topalis, Quantifying energy savings in daylight responsive systems: the role of dimming electronic ballasts, Energy and Buildings 40 (2008) 36–50. https://doi.org/10.1016/j.enbuild.2007.01.019
- P. Valíček, T. Novášk, J. Beseda, K. Sokanský, Modelling the Behavior of Lighting Systems Controlled at a Constant Level of Illuminance, In. Proc. of 2018 VII. Lighting Conference of the Visegrad Countries (Lumen V4) 2018, 1-5, Czech Republic. https://doi.org/10.1109/lumenv.2018.8520993
- K. Clement, I. Pardon, J. Driesen, Standby Power Consumption in Belgium, In: Proc. of 9th International Conference on Electrical Power Quality and Utilisation, 2007, 1-4, Spain. https://doi.org/10.1109/epqu.2007.4424225
- R. De Koster, J. Van Roy, J. Driesen, A Profile-Based Identification of Standby and Useless Electricity Consumption in Buildings, In: Proc. of 2013 IEEE Green Technologies Conference, 2013, 1-6, USA. https://doi.org/10.1109/greentech.2013.54
- M. Beccali, M. Bonomolo, G. Ciulla, V. Lo Brano, Assessment of indoor illuminance and study on best photosensors' position for design and commissioning of Daylight Linked Control systems. A new method based on artificial neural networks, Energy 154 (2018) 466-476. https://doi.org/10.1016/j.energy.2018.04.106
- L. Bellia, F. Fragliasso, E. Stefanizzi, Why are daylight-linked controls (DLCs) not so spread? A literature review, Building and Environment 106 (2016) 301-3121. https://doi.org/10.1016/j.buildenv.2016.06.040
- D. Shi, L. Wang, Z. Wang, What affects individual energy conservation behavior: Personal habits, external conditions or values? An empirical study based on a survey of college students, Energy Policy 128 (2019) 150–161. https://doi.org/10.1016/j.enpol.2018.12.061
- IEA SHC Task 50. Monitoring protocol for lighting and daylighting retrofits. Technical Report T50.D3. 2016.
- N. Gentile, M.-C. Dubois, T. Laike, Daylight harvesting control systems design recommendations based on a literature review, In: Proc. of 2015 IEEE 15th International Conference on Environment and Electrical Engineering (EEEIC), 2015, 632-637, Italy. https://doi.org/10.1109/eeeic.2015.7165237
- M. Bonomolo, M. Beccali, V. Lo Brano, G. Zizzo, A set of indices to assess the real performance of daylight-linked control systems, Energy and Buildings 149 (2017) 235–245. https://doi.org/10.1016/j.enbuild.2017.05.065
- L. Bellia, F. Fragliasso, New parameters to evaluate the capability of a daylight-linked control system in complementing daylight, Building and Environment 123 (2017) 223-242. https://doi.org/10.1016/j.buildenv.2017.07.001
- L. Bellia, F. Fragliasso, Evaluating performance of daylight-linked building controls during preliminary design, Automation in Construction 93 (2018) 293–314. https://doi.org/10.1016/j.autcon.2018.05.026
- G.Y. Yun, H. Kim, J.T. Kim, Effects of occupancy and lighting use patterns on lighting energy consumption, Energy and Buildings 46 (2012) 152–158. https://doi.org/10.1016/j.enbuild.2011.10.034
- C. de Bakker, M. Aries, H. Kort, A. Rosemann, Occupancy-based lighting control in open-plan office spaces: A state-of-the-art review, Building and Environment 112 (2017) 308-321. https://doi.org/10.1016/j.buildenv.2016.11.042
- O.K. Larsen, R.L. Jensen, T. Antonsen, I. Strømberg, Estimation methodology for the electricity consumption with daylight- and occupancy-controlled artificial lighting, Energy Procedia 122 (2017) 733-738. https://doi.org/10.1016/j.egypro.2017.07.388
- C.P Kurian, V.I. George, K. Pallavi, M. Varghese, Office Lighting Simulation: Energy implications with scheduled occupancy and daylight harvesting, In: Proc. of 2018 International Conference on Control, Power, Communication and Computing Technologies (ICCPCCT), 2018, 129–135, India. https://doi.org/10.1109/iccpcct.2018.8574337
- N. Gentile, T. Laike, M.-C. Dubois, Lighting control systems in peripheral offices rooms at high latitude: measurements of electricity savings and users Preferences, Energy Procedia 57 (2013) 1987–1996. https://doi.org/10.1016/j.egypro.2014.10.063
- C. Aghemo, L. Blaso, and A. Pellegrino, Building automation and control systems: A case study to evaluate the energy and environmental performances of a lighting control system in offices, Automation in Constructions 43 (2014) 10–22. https://doi.org/10.1016/j.autcon.2014.02.015
- CEN (Comité Européen de Normalisation),. Energy performance of buildings — Energy requirements for lighting - Part 2: Explanation and justification of EN 15193-1, Module M9. Technical Report FprCEN/TR 15193-2:2017 Brussels. 2017. https://doi.org/10.3403/30292861
- C. Aghemo, L. Blaso, S. Fumagalli, V.R.M. Lo Verso, A. Pellegrino, The new prEN 15193-1 to calculate the energy requirements for lighting in buildings: comparison to the previous standard and sensitivity analysis on the new influencing factors, Energy Procedia 101 (2016) 232–239. https://doi.org/10.1016/j.egypro.2016.11.030
- A. Pellegrino, V.R.M. Lo Verso, A. Paragamyan, Validation of the EN 15193:2017 calculation method to estimate the daylight supply in a building: comparison with dynamic climate-based simulations, In: Proc. of IBPC 2018 International Building Physics Conference, 2018, 1-6, USA. https://doi.org/10.14305/ibpc.2018.ms-2.06
- A. Williams, B. Atkinson, K. Garbesi, E. Page, F. Rubinstein, Lighting Controls in Commercial Buildings, Leukos 8 (2013) 161-180. https://doi.org/10.1582/leukos.2012.08.03.001
- M-C. Dubois, Å. Blomsterberg, Energy saving potential and strategies for electric lighting in future North European, low energy office buildings: A literature review, Energy and Building 43 (2011) 2572–2582. https://doi.org/10.1016/j.enbuild.2011.07.001
- V.R.M. Lo Verso, A. Pellegrino, C. Aghemo, The energy performance for lighting in buildings according to the new EN 15193-1: potential energy saving due to different photodimming controls, In: Proc. of 2018 IEEE International Conference on Environment and Electrical Engineering and 2018 IEEE Industrial and Commercial Power Systems Europe, 2018, 1-6, Italy. https://doi.org/10.1109/eeeic.2018.8494448
- A. Pandharipande, GR. Newsham, Lighting controls: Evolution and revolution, Lighting Research and Technology 50 (2018) 115–128. https://doi.org/10.1177/1477153517731909
- A. Pellegrino, S. Cammarano, V.R.M. Lo Verso, V. Corrado, Impact of daylighting on total energy use in offices of varying architectural features in Italy: Results from a parametric study, Building and Environment 113 (2017) 151-162. https://doi.org/10.1016/j.buildenv.2016.09.012
Copyright © 2019 The Author(s). Published by solarlits.com.

4159
Total views
Citations
SHARE ON


