Article Outline
Figures and tables
Volume 6 Issue 1 > pp. 23-41 • doi: 10.15627/jd.2019.3
Experimental Investigation of Overall Energy Performance in Algerian Office Building Integrated Photovoltaic Window under Semi-Arid Climate
Mesloub Abdelhakim,*a Mohd Zin Kandar,a Yaik-Wah Limb
Author affiliations
a Faculty of Built Environment and Surveying, Universiti Teknologi Malaysia (UTM), Johor, Malaysia
b Centre for the Study of Built Environment in the Malay World (KALAM), Institute for Smart Infrastructures and Innovative Construction, UTM, Johor, Malaysia
* Corresponding author.
h.mesloub@yahoo.com (M. Abdelhakim)
mzin@utm.my (M. Z. Kandar)
lywah@utm.my (Y.-W. Lim)
History: Received 24 April 2019 | Revised 31 May 2019 | Accepted 4 June 2019 | Published online 9 June 2019
Copyright: © 2019 The Author(s). Published by solarlits.com. This is an open access article under the CC BY license (http://creativecommons.org/licenses/by/4.0/).
Citation: Mesloub Abdelhakim, Mohd Zin Kandar, Yaik-Wah Lim, Experimental Investigation of Overall Energy Performance in Algerian Office Building Integrated Photovoltaic Window under Semi-Arid Climate, Journal of Daylighting 6 (2019) 23-41 http://dx.doi.org/10.15627/jd.2019.3
Figures and tables
Abstract
Building integrated photovoltaic (BIPV) energy has now become one of the most significant renewable energy alternatives for providing natural daylight and clean energy. As such, this study was conducted for the first time in Algeria to experimentally evaluate the BIPV window energy and lighting energy savings of a typical office building under the semi-arid climate condition. Apart from using the Energy Plus and Integrated Environment Solution-Virtual environment (IES-VE) energy simulation tools in the experimental validation, the daylighting control method and the dynamic Useful Daylight Illuminance (UDI) were also utilized to analyse the daylighting performance as well as the lighting energy of BIPV windows with different transparency levels at various cardinal orientations. The field measurements had revealed the overall energy model to be consistent and in good agreement with the EnergyPlus and the IESVE simulation models, where the tested PV module was found to have provided not only a 20% Visible Light Transmittance (VLT) of uniformed daylight with low illuminance level, but also thermal comfort and a considerable amount of clean energy. The simulated results had demonstrated a substantial improvement in cooling energy and glare reduction of the PV modules as compared to the base-model, where the only BIPV window configuration was achieved good area of UDI 300-700 lux is facing the South orientation and 30% VLT. In conclusion, the application of the thin film BIPV windows with different transparency and orientation levels can thus be regarded as an effective solution for minimizing the lighting energy consumption through its energy production instead of daylighting utilization.
Keywords
BIPV window, Overall energy, Daylight, Simulation
1. Introduction
Sustainable development has been rapidly gaining importance in the field of architecture, particularly in the renewable energy and energy consumption usage [1]. For that reason, the ability to fully utilize renewable energy innovation in a building has now been viewed as humanity’s target goal of achieving human-ecosystem equilibrium. In Algeria, the building sector is known for being the largest energy consumer, where it takes up almost 42% of the entire energy consumption with the electric lighting occupying 25% of the total energy consumption, thus making it one of the main electricity consumers brought about by its poor building window designs [2]. While Algeria had supported this new sector by supplanting fossil fuels and natural gas with renewable energy resources [3], the government had still faced certain challenges in terms of improving the energy efficiency and renewable energy solutions of its buildings [4]. As such, the Solar Photovoltaic (PV) technology through the use of solar power is thus seen as the most promising method to be used for this purpose [1]. Photovoltaic energy is the electrical current produced by light in the solar cells of a solar module and is considered to be an integral component in the BIPV system, where the modules serve as both the outer layer of a structure and generate electricity for on-site use or export to the local electric utility grid [5]. For this reason, the use of Building Integrated Photovoltaic (BIPV) windows is found to be an ideal solution for not only providing natural daylight, but also in achieving near ‘zero-energy’ buildings [6].
The merits of energy consumption for both simulated and monitored buildings however, had been subjected to much dispute. Since the current building simulation had generally involved the designing, operating, diagnosing and commissioning stages [7], a major concern was then brought up on the possibility of the operational diagnostics and monitoring of buildings as resulting in additional energy assessment applications. With this in mind, a validation approach was therefore suggested to be included in the building simulation tool as a way of producing the correct results required in the prediction of its actual consumption usage. Therefore, this study had incorporated the Integrated Environment Solution Virtual Environment (IESVE) as the building performance [8] and daylighting analysis tools because of its high accuracy and interoperability levels [9,10], where its dynamic building energy simulation software had been likened to twenty simulation programs with multiple functions. EnergyPlus, which is a type of building energy simulation software that is used to model the performance of individual buildings or big communities and their mechanical systems too was utilized in the modelling and simulation of the BIPV windows [11].
However, despite a long history of using daylighting as a design strategy, this energy source is still being radically underused in modern architecture. Since buildings consume a large amount of energy, the types of BIPV window used coupled with its position and light transmittance factors are seen to have the potential for achieving energy-savings effect [12]. As such, the investigations that were conducted on the impact of BIPV façades on the daylight’s visual and non-visual effects of an office building [13] had implied a strong correlation between visual comfort and lighting conditions [14], where lightings that had been properly tailored according to work activities were shown to have resulted in higher employees’ productivity. The most common method used for measuring daylight provision is the illuminance-based metric [15]. Under this circumstance, illuminance is defined as the amount of light reaching the surface or at a specific point in a work plane within a specific point in time, which is normally determined by using a lux meter [16] and expressed in lux (lm/m2) [17]. However, a far more realistic account on the true daylighting conditions can be achieved by using a more dynamic daylight metric, which is the Useful Daylight Illuminance (UDI) that uses the hourly sun and sky condition data hence, providing a more complete and accurate information than the daylight factor approach.
The benefits of using BIPV windows had thus spurred several researchers to conduct experimental studies on its energy performance. In one of their studies, [18] had used a mock-up model to analyse the effect of the thin film PV module’s power output with different tilting angles and azimuths under the Korean climate, while [19] had compared the surface temperature influence of the BIPV window and that of a conventional glass in different angles during the winter and summer seasons. In another study, [20] had examined the usage of the BIPV windows in a ventilation flow design. Recently, most studies have begun focused on the overall energy performance, Peng et al. employed the EnergyPlus to investigate the daylighting performance, power and integrated thermal of applying a semi-transparent amorphous silicon PV module on double skin façade under the climate of Hong Kong [21,22], another research used a thin film Cadmium Telluride (CdTe) window system with 10% transparency to develop and evaluate an overall energy model in China [23]. Few studies concentrate on the influence of BIPV window transparency, a study carried out in China and recommended that the PV cells coverage ratio should be smaller than 60% to satisfy the indoor daylighting requirements. Also, Huang found that using double-skin STPV facades could achieve better daylighting quality [24]. However, the validated simulation studies to measure the overall energy performance (energy output, daylighting, heat gain, and loss) that is rarely reported for the BIPV window under a semi-arid climate. As such, this paper had aimed (1) to experimentally investigate the application of the thin film BIPV window in an Algerian mock-up office building, (2) to establish an appropriate design methodology and comprehensive validation of the overall energy performance through the use of EnergyPlus and IES-VE tools under a semi-arid environment, and (3) to determine the effects on the daylighting performance and lighting energy savings of the different BIPV windows used.
2. Methods and materials
The field observations that were conducted in a semi-arid environment had included measuring the direct current (DC power output), indoor and outdoor air temperature, daylighting performance as well as the heat gain/loss at critical summer periods of the thin filmed BIPV window that was placed at the east façade of the mock-up office building (Fig. 1). While the accuracy of these models (power output, heat gain/loss) was validated by the use of EnergyPlus, the daylighting model on the other hand, was substantiated by the IES-VE, where it had compared the mean bias error (MBE) and the coefficient of variation of root mean square error (RMSE) indicators of the experimental data and the simulated results. According to the ASHRAE14 Guideline, the model is only considered acceptable if it exhibits less than 10% and 30% of the MBE and RMSE, respectively [25]. The lighting energy simulation that is modelled by the IESVE software will be explained in detail under the 2.2.3 heading.
Figure 1
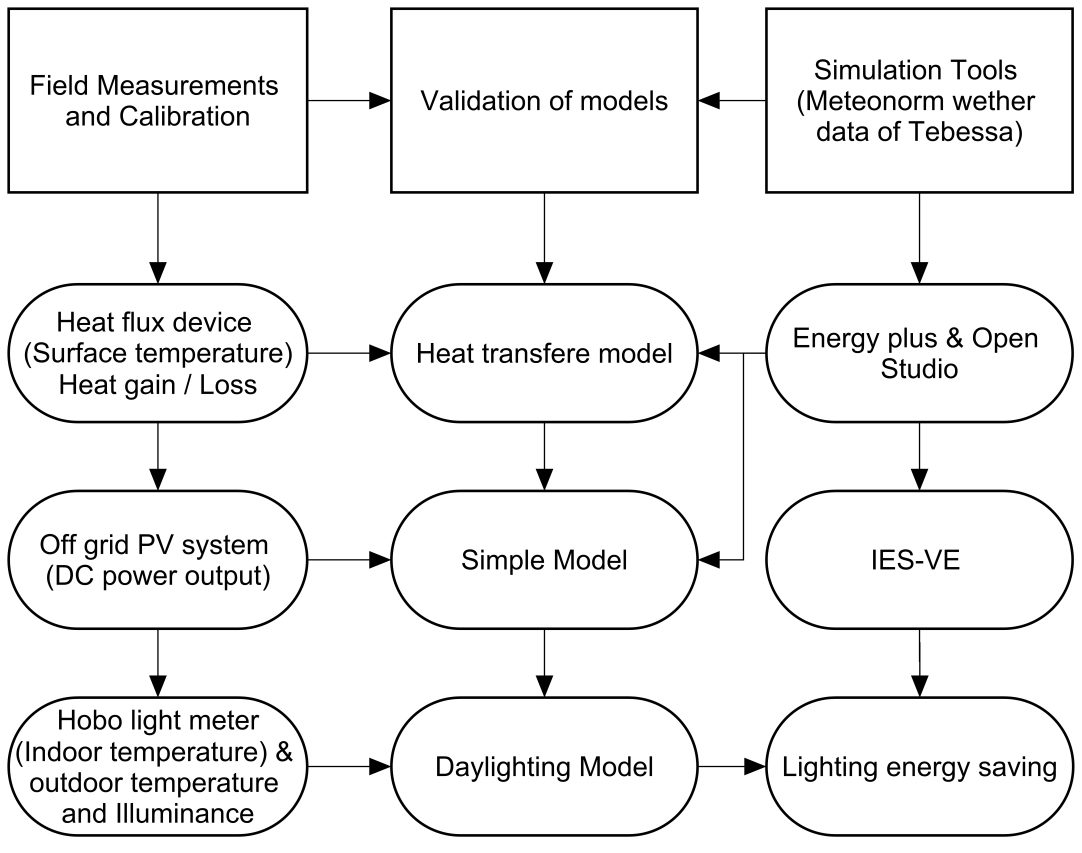
Fig. 1. Methodology framework of this study.
2.1. Field measurement
2.1.1. Location, climate data, and general considerations
The office building that was chosen for this experiment is located in Tebessa, where its semi-arid climate [26] is characterized by hot, fairly dry summers and mild, somewhat wetter winters (Fig. 2). Tébessa experiences extreme occurrences of weather phenomena that had a range of less than 0 degrees Celsius in January to 40 degrees Celsius in the month of July. The mock-up experiment was also subjected to the following conditions: (1) the mock-up office had been located in an unsheltered area; (2) the PV glaze had been fixed on the East façade to obtain the maximum amount of solar irradiance and (3) the experiment had been conducted during the critical summer period with a systematic recording of field-measured data at proper interval times.
Figure 2
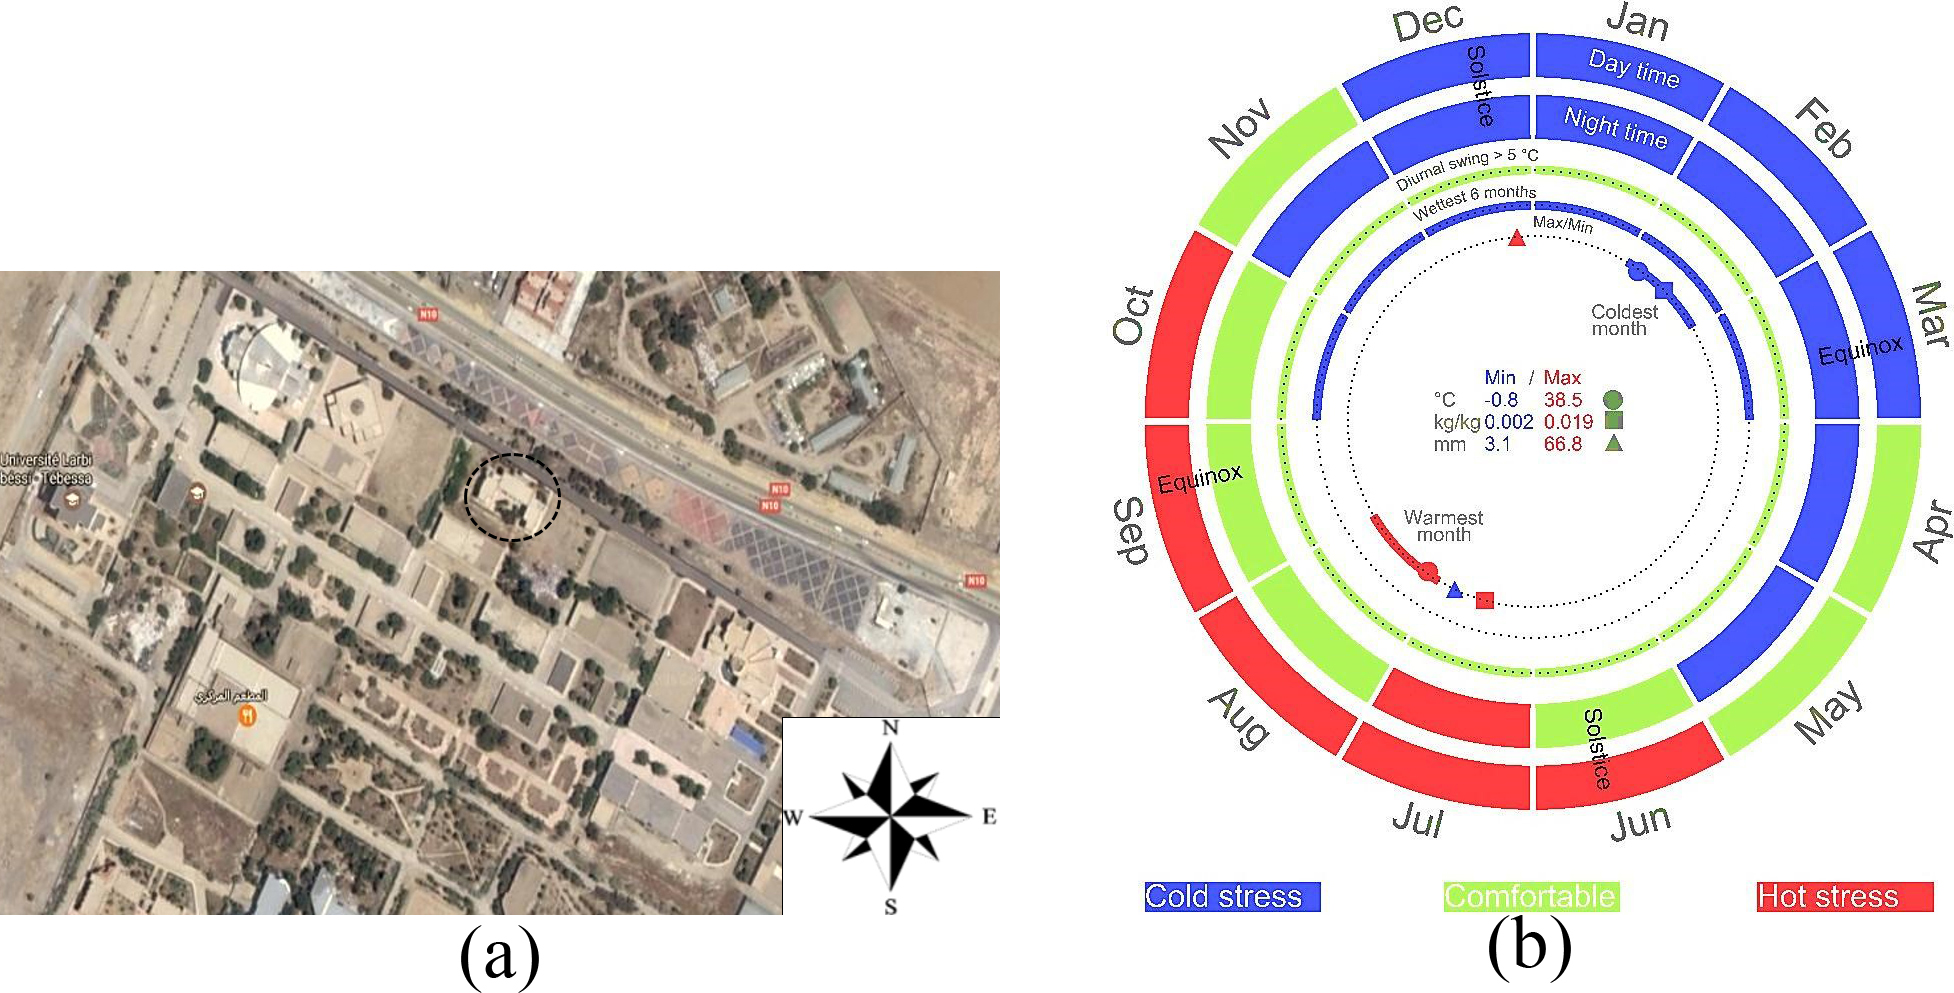
Fig. 2. (a) Site location of test office building (Tebessa University) and (b) climate data of Tebessa City by IES-VE 2016.
2.1.2. Design concept of tested office building (Base-model)
In Algeria, although the limited academic references on energy baseline models for commercial buildings had restricted the data required for comparison research, this experiment had based on certain architectural codes and building dimensions that were set by the DLEP and DUC. In terms of its geometric aspect, the office that was chosen for this experiment had been a typical single office, which is usually occupied from 8.00 am to 12.00 pm and 13.00 pm to 17.00pm with a base area of 4m×3m and a height of 3m and 20% Window to Wall Ratio (WWR) [27]. The office was laterally illuminated by square and horizontal windows that were oriented toward the eastern part of the building (Fig. 3). A single glazed window was used for the base model and an artificial lighting system without dimming controls and photoelectric sensors had been turned off throughout the occupancy period.
Figure 3
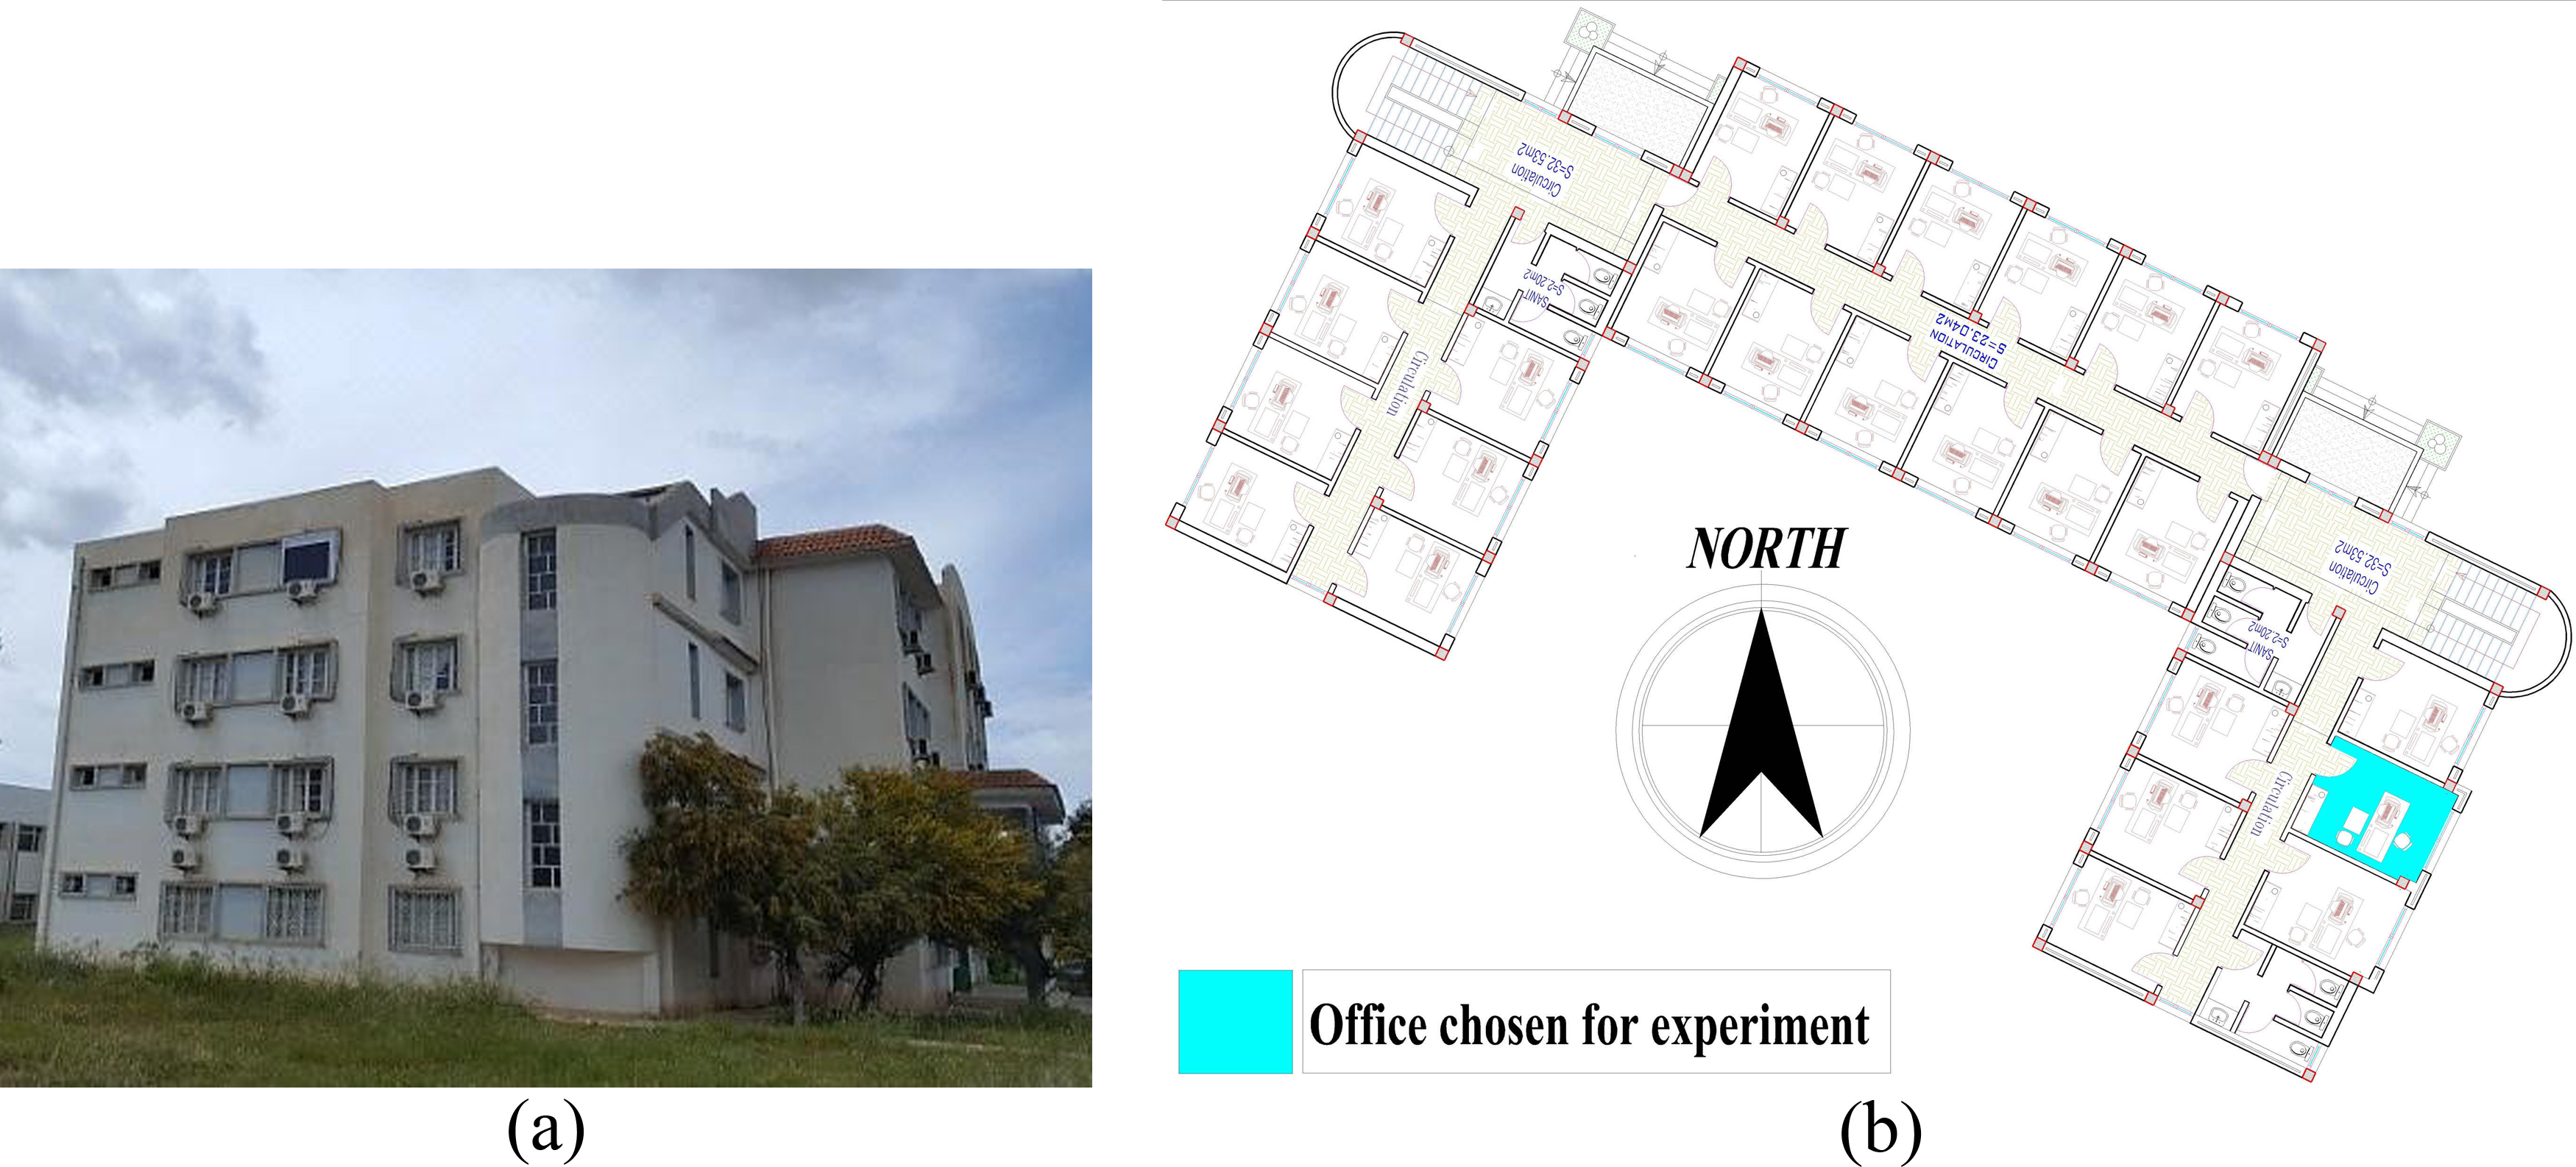
Fig. 3. (a) Design concept of office building chosen for experiment Exterior 3D model (b) Typical floor plan.
2.1.3. PV module selected for experiment
The common BIPV window was found to have demonstrated a range of 10% to 50% light transmittance (visible light), which is considered to be relatively low for building residents with an excellent outdoor view, while those of the ordinary a-Si PV thin film modules had only exhibited less than 6% of visible light. As such, changes were then made in the energy and daylighting performances as a way of maximizing its energy usage, where a better PV module transmittance will not only result in a decline of energy conversion efficiency, but also an improved solar heat benefit coefficient. For this reason, the BIPV window amorphous silicon (a-Si) module with 20% transmittance was chosen over the 50% transmittance for better energy and solar control performances as well as its better daylighting attribute.
2.1.4. Daylighting measurement
By using a light meter (HOBO Pendant Temperature/Light Data Logger), a 10-minute interval measurement of the illuminance levels was thus conducted in and outside the selected office building with the following devices:
- An external sensor was placed about 0.20 meter away from the external wall to measure the work plane illuminance (WPI) as well as the outdoor temperature.
- The WPI of the inner office was measured on the third floor with a 75cm work plan by using several grid points that had depended on the room’s index equation.
Based on the room index [28], the minimum number of illuminance measurement points is decided as per the following Eq. (1) and Table 1.
where L is the length, W is the width, and Hm is the height of the luminaires above the plane of measurement.
As for the daylight illuminance quality (visual comfort), this is usually assessed by gauging its uniformity across the space [29] through the use of an illumination factor, which is the ratio of the minimum (E'min) and medium illuminance (E'med) on the workspace [30].
where according to the international standards, a uniformity that is higher than 0.6 should be placed for the working plane or >0.5 for the surroundings [31].
Table 1
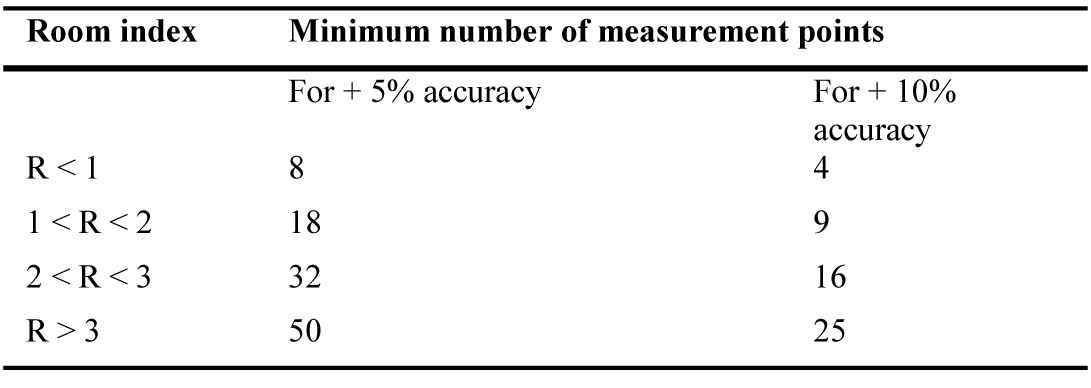
Table 1. Room index measurement points norms.
2.1.5. Heating transfer (heat flux) measurement
The measurement of the heat transfer from the PV module was performed with the heat flux meter, which is a low-cost Arduino based data acquisition system that is designed to accurately measure the small analogue DC voltage output signals from PHFS heat flux sensors as well as the integrated and independent thermocouple-based temperature sensors (Fig. 4). As a way of obtaining more accurate results, this study had conducted a 5-minute interval measurement on the PV module’s back-surface temperature during the summer period with a heat flux sensor and a thermocouple data reader.
Figure 4
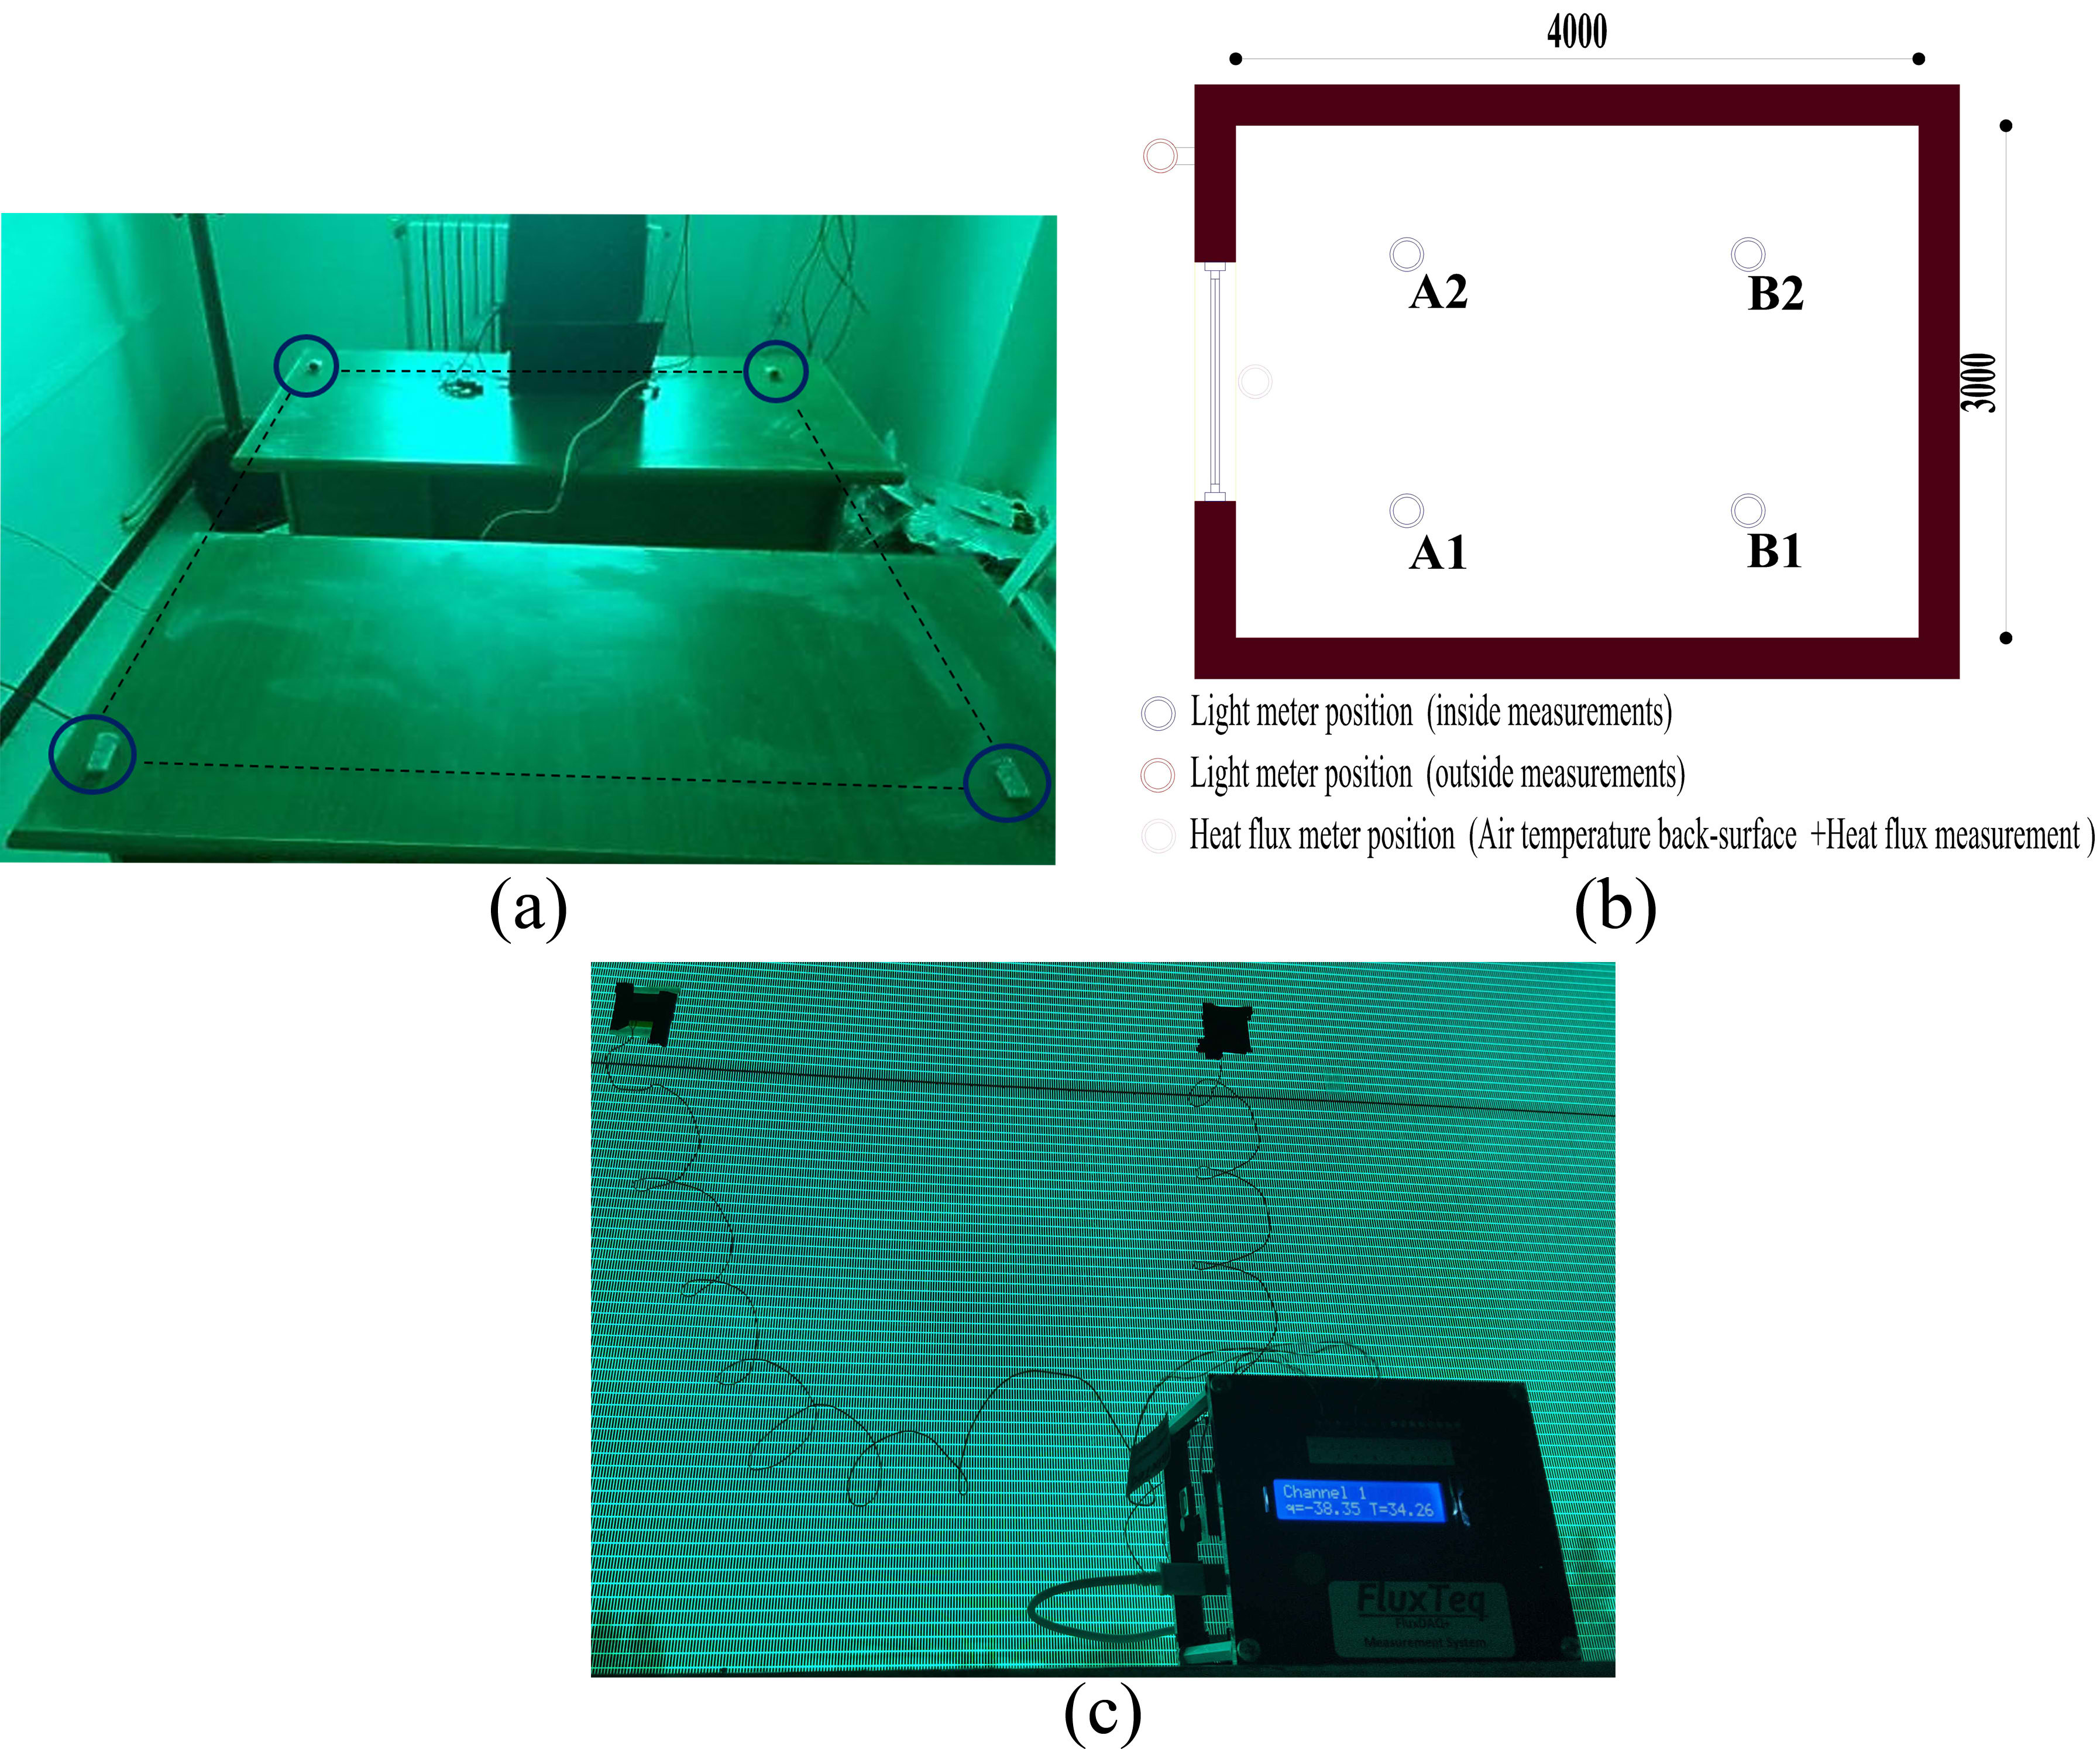
Fig. 4. (a) Grids of measurements and sensor position, (b) Heat flux and air temperature position, and (c) FluxTeq data reader and heat flux sensor placed on an inside window surface.
2.1.6. Electrical measurement's instruments
As shown in Fig. 5, an off-grid PV windows system, which had consisted of the photovoltaic window, solar charge controller (MPPT) with a built-in data logger (DC power output), battery and load element was designed and used to measure, evaluate, and validate the maximum DC power from a PV window module. Since the maximum power output of the photovoltaic window was found to have been influenced by the solar irradiance quantity of different weather conditions, an embedded algorithm with the MPPT systems was then used to attain a more accurate measurement level. Apart from coordinating the solar panel, battery and load operations, the solar charge controller (ML4860) that is equipped with the solar station monitoring software was also used to monitor and track the respective daily generated power as well as the highest voltage and current power output values of the BIPV throughout the measurement period.
Figure 5
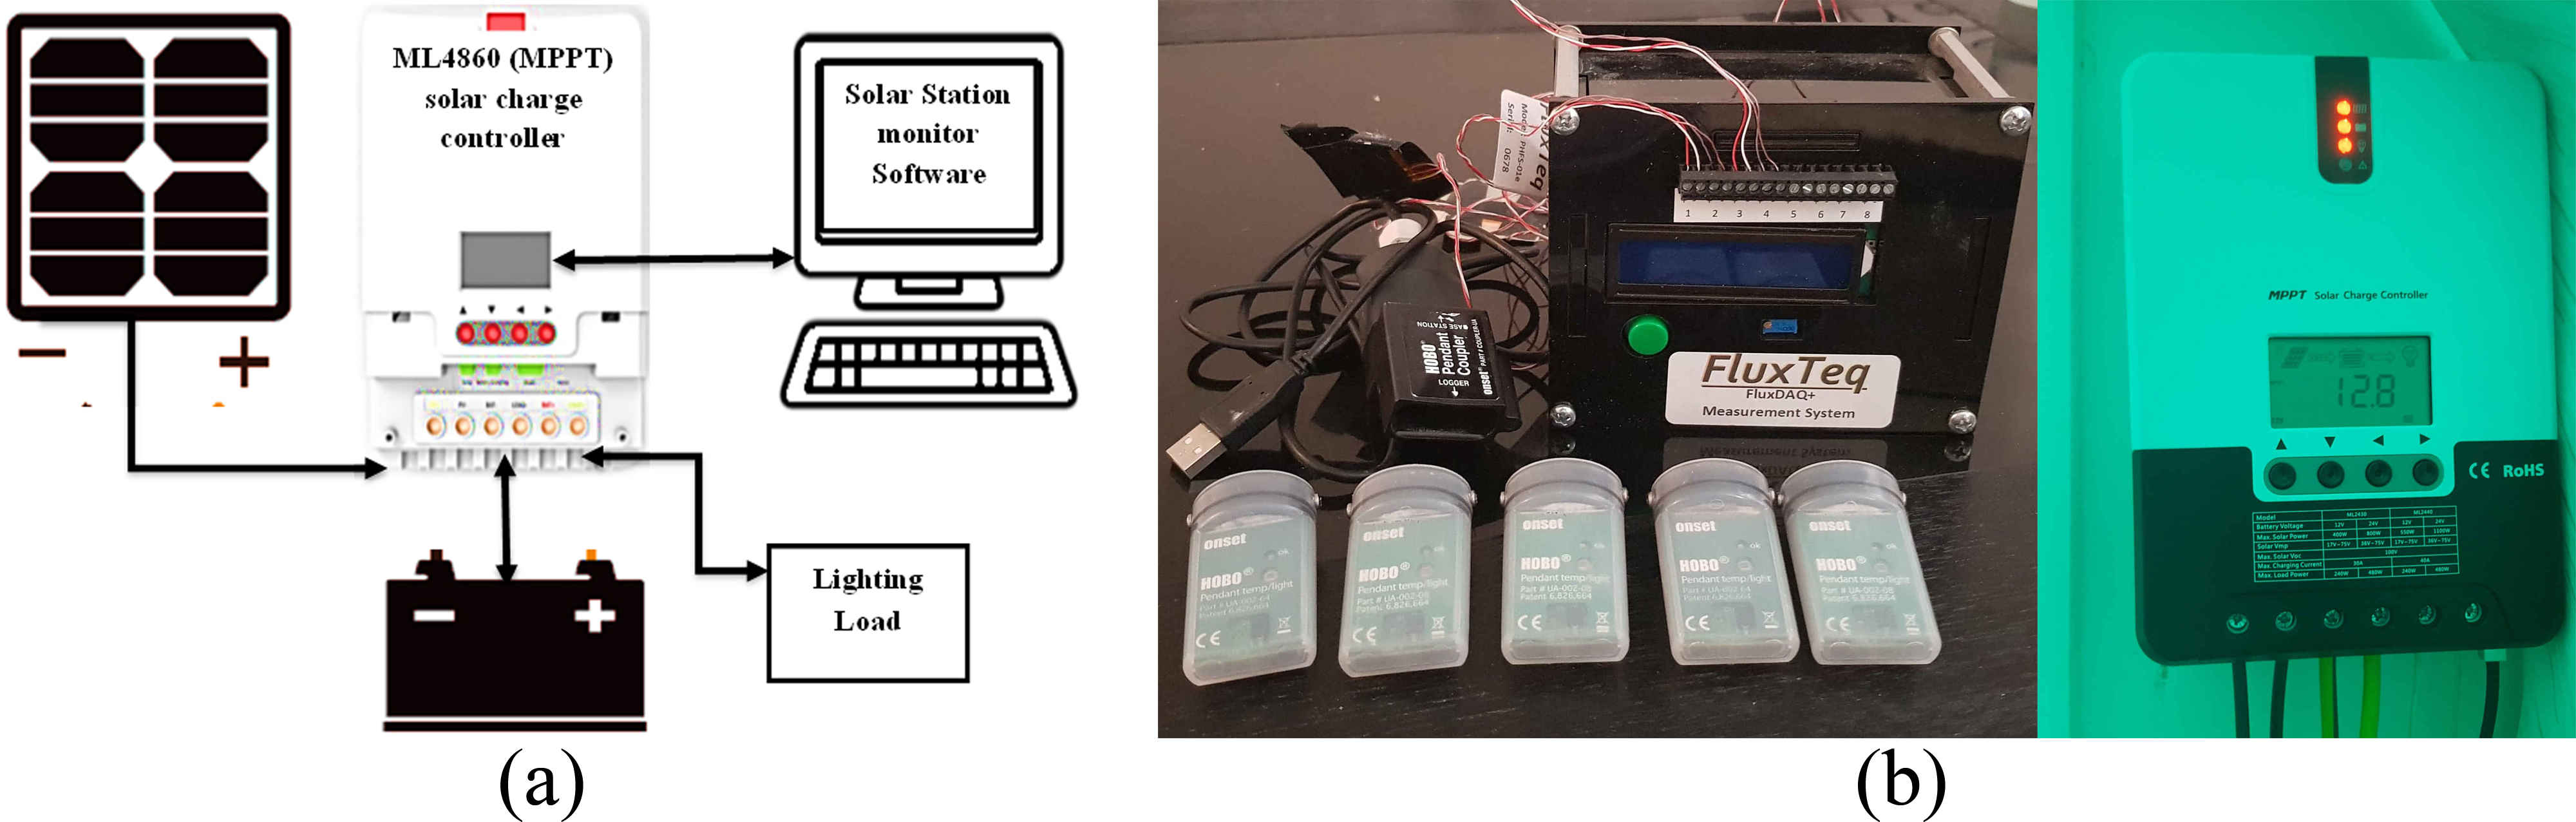
Fig. 5. (a) System used to evaluate the maximum power output of BIPV windows under real condition and (b) the instruments used in the measurements stage.
2.2. Simulation of overall energy performance
2.2.1. Power output model simulation
The energy modelling engine or EnergyPlus has the ability for providing several distinctive simulations in forecasting the energy output of the photovoltaic (PV) systems. Given that the power output had been based on the quasi-steady state of heat transfer processes concept, the simple model that was used in this study had therefore aimed to provide the users with an absolute control over the PV performance. As such, this simple simulation had applied the randomized user-defined type conversion efficiencies, where it had allowed the comparison of the photovoltaic array and inverter modelling efficiencies at operating conditions [32]. Due to its importance in the initial design stage, this model had required the user to perform an initial simulation on the annual results and maximum energy level, but without the detailed performance coefficients of the selected PV model. The power output of the PV surface is thus obtained from the following equation
here Asurf is the net area of surface, factive is the fraction of surface area with active solar cells, GT is the total solar radiation incident on PV array, and ncell is the module conversion efficiency.
A building integrated design is then considered by eliminating the electrical power from the construction surfaces through the PV modules, where the heat transfer to its surroundings is characterized by the thermal resistance and configuration of the materials used to encapsulate the solar cells. The whole electrical system process was managed comprehensively with the modules presumed to be operating continuously at the highest energy level.
2.2.2. Thermal simulation
The heat transfer from the BIPV window was calculated by using the incident solar radiation that was obtained from the various electrical performance models of the PV module as well as the solar heat gain coefficient (SHGC) and U-value inputs that were incorporated in the EnergyPlus software. While the vertical incident solar radiation was extracted from the Meteonorm data-base, the SHGC value on the other hand, was measured through the use of a calorimetric hot box and solar simulator [33] that were provided from the factory. The corresponding SHGC and U-values are shown in Table 2.
Table 2
Table 2. Room index measurement points norms.
2.2.3. Daylighting simulation
The daylighting model demonstrates the amount of daylight received and the lighting performances under both cloudy and clear sky conditions that could be similarly performed as those of a uniformed glass material [34]. By referring to the International Standard performance indicator of the daylighting quantity and using the IES-VE approach in describing the daylighting potential of the BIPV windows utilization model, this study had discovered the visible light transmittance (VLT) to be the most fitting element for estimating the WPI of the thin film BIPV window in the tested office [35]. The daylighting model had also employed the daylight control strategy by placing a specified sensor at 0.75m above the floor level in the middle area of the tested office to estimate the artificial lighting consumption of the base-model and the three different PV modules with different VLT values (10% to 30%). By assuming that there had been no other buildings within the vicinity obstructing the direct light from entering the BIPV window, the final value of the daylight illuminance was thus set to be at least 300 lux with a respective 25%, 70%, 90% and 30% of floor, walls, ceiling and ground covering reflection coefficients.
2.3. Calibration of experimental instruments
Since well-calibrated measuring instruments are essential for producing accurate measurements, the HOBO Pendant Temperature/Light Data Logger that had been fully tested and calibrated according to the NIST-traceable standards, was thus selected to be used for this study. To ensure a more specific level of calibration, four simultaneous Hobo light meters were thus set up in the tested office to measure the indoor air temperature from 1 June until 14 June, while the back-surface temperature of the BIPV window in the first week in June was calibrated with the FluxDAQ+ and two PHFS-01 sensors. The precise resolution measurements as shown by the sensors are depicted in Fig. 6. Although the maximum surface temperature recorded during this period had been that of 50oC, the indoor air temperature however, was found to be mostly constant, while the slight two degree difference between the lower and higher temperature values was discovered to be resulted from the BIPV window insulation, which had been slightly higher than the recommended thermal comfort as described in ANSI/ASHRAE, 1995 [36].
Figure 6
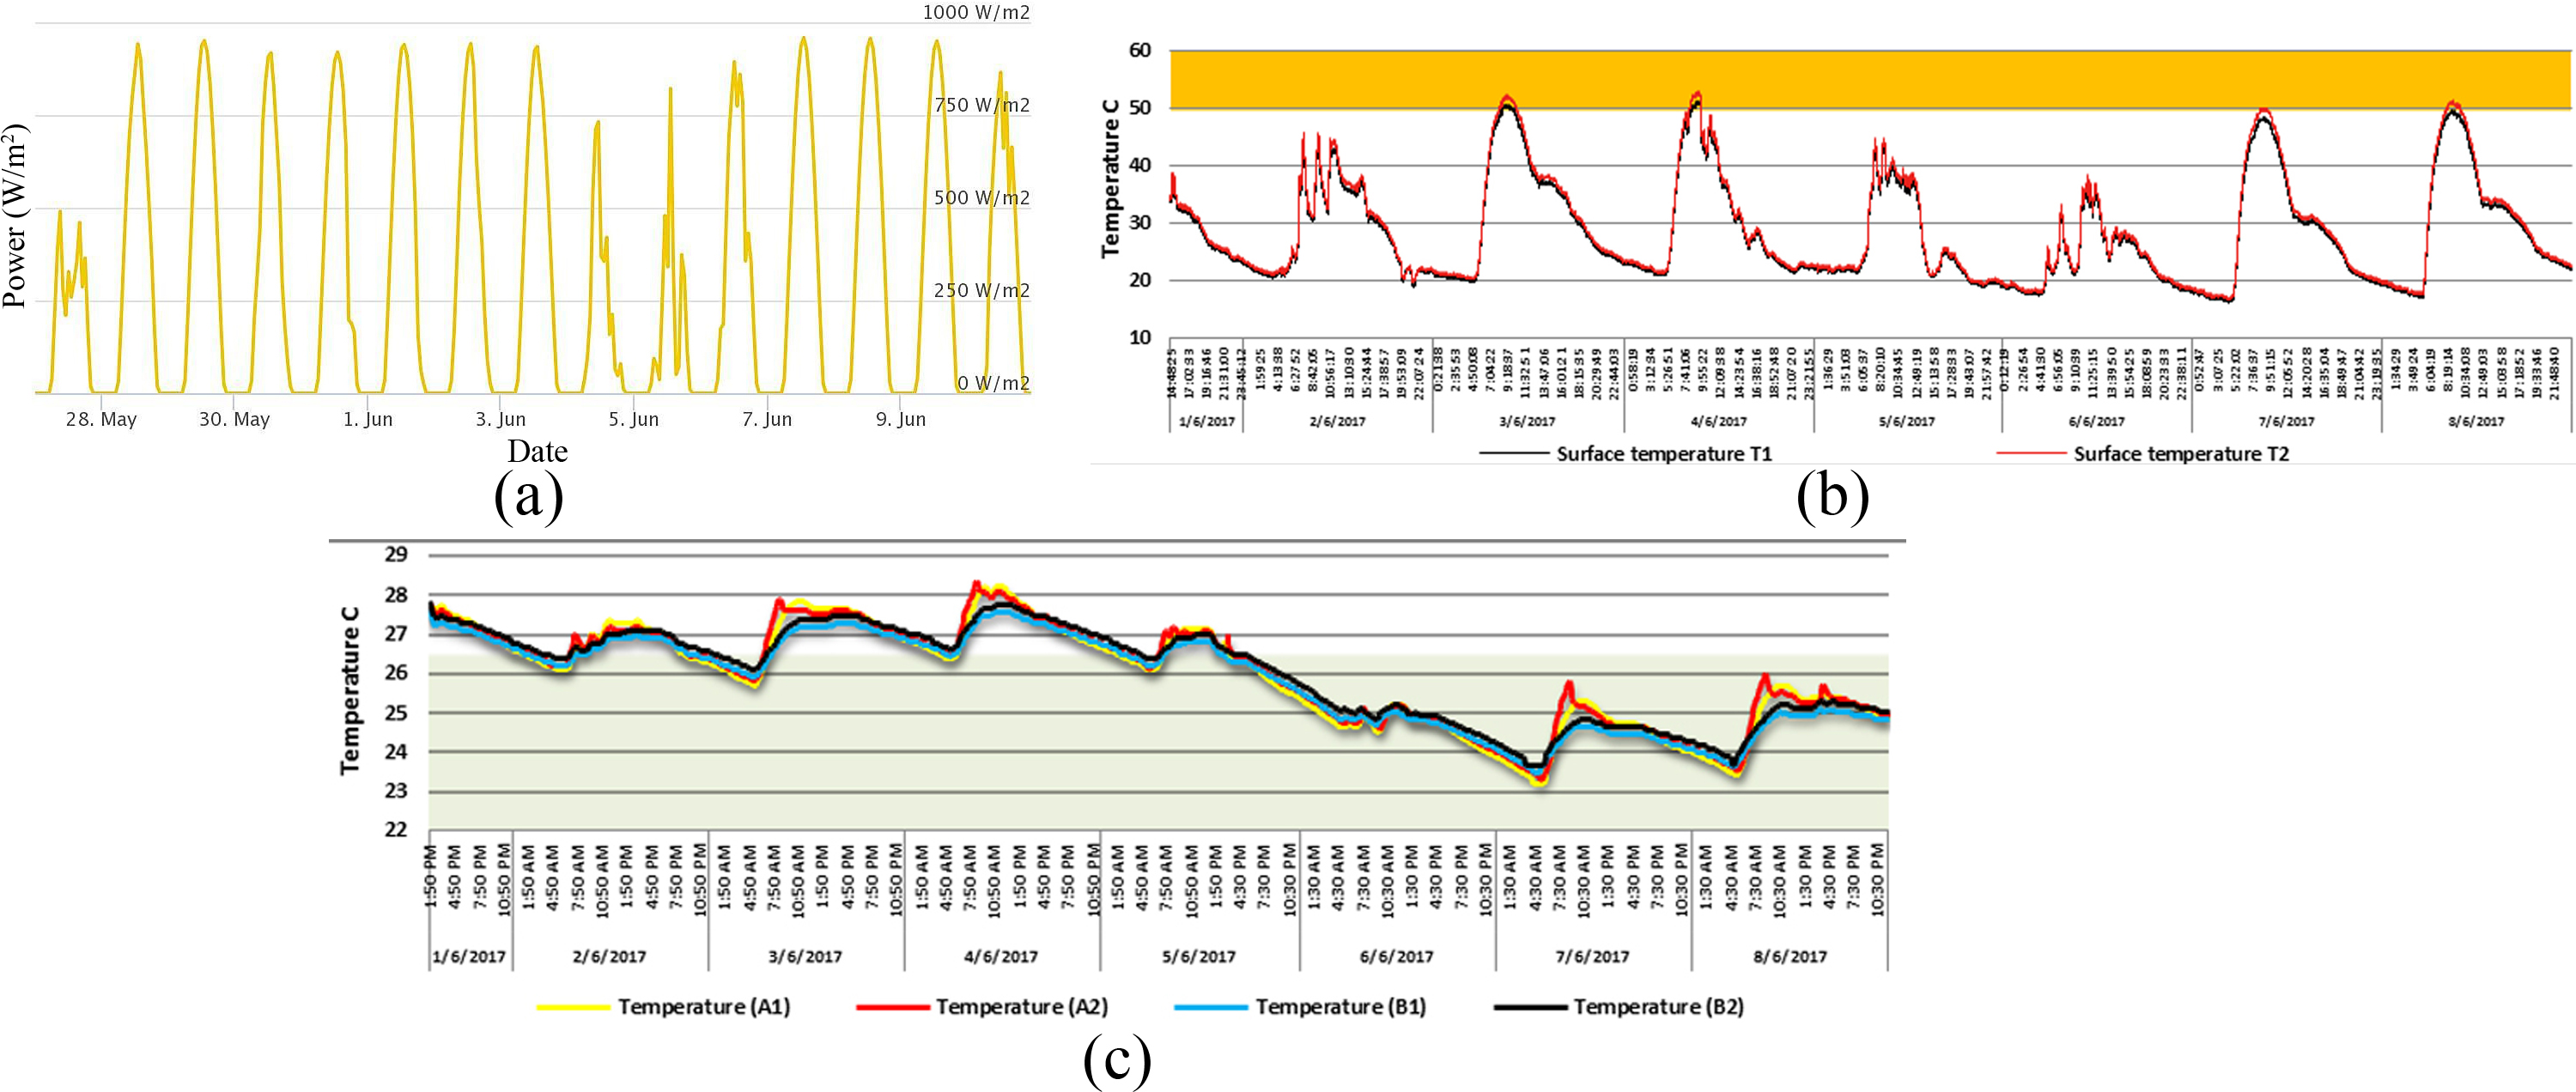
Fig. 6. (a) Global Horizontal radiance distribution and (b,c) measurements and calibration of HOBO light meters (air temperature) and PHFS-01 (surface temperature) used in the experiment.
3. Results and discussion
3.1. Validation of the power output model
Apart from the data limitation in the DC output without the usage of an inverter, there were also many differences observed between the measured and the controlled data shown in the maximum power peak tracking (MPPT). After the monthly and daily simulations of the model had been performed by using the typical hourly meteorological year data for Tebessa, Algeria, the data collected from the PV window module with a vertical angle were then compared with the simulated power output data that were obtained in the months of May (6,452kW), June (4,574kW), July (7,565kW) and August (6,741kW). By comparing these two data, the results had indicated that the tested PV module had exhibited a significant 4.5% efficiency level of reducing the energy demand [37] with the computed data as demonstrating a reasonable error tolerance of 2.03% mean bias error and 1.90% RMSE (Table 3). Since the increasing solar radiance rate was found to have led to a higher power output, as shown in Fig. 7, this therefore implies that a positive correlation had existed between the solar irradiance of the PV module and the DC power output of the simulated model. However, the uniformity that was observed between the measured power output and the tilted solar radiance had not reflected the genuine situation of the case with the use of the average Meteonorm weather data. Despite being subjected to the same consequence, the daily power output of the total monthly power output was found to have differed slightly as shown from the graph below.
Figure 7
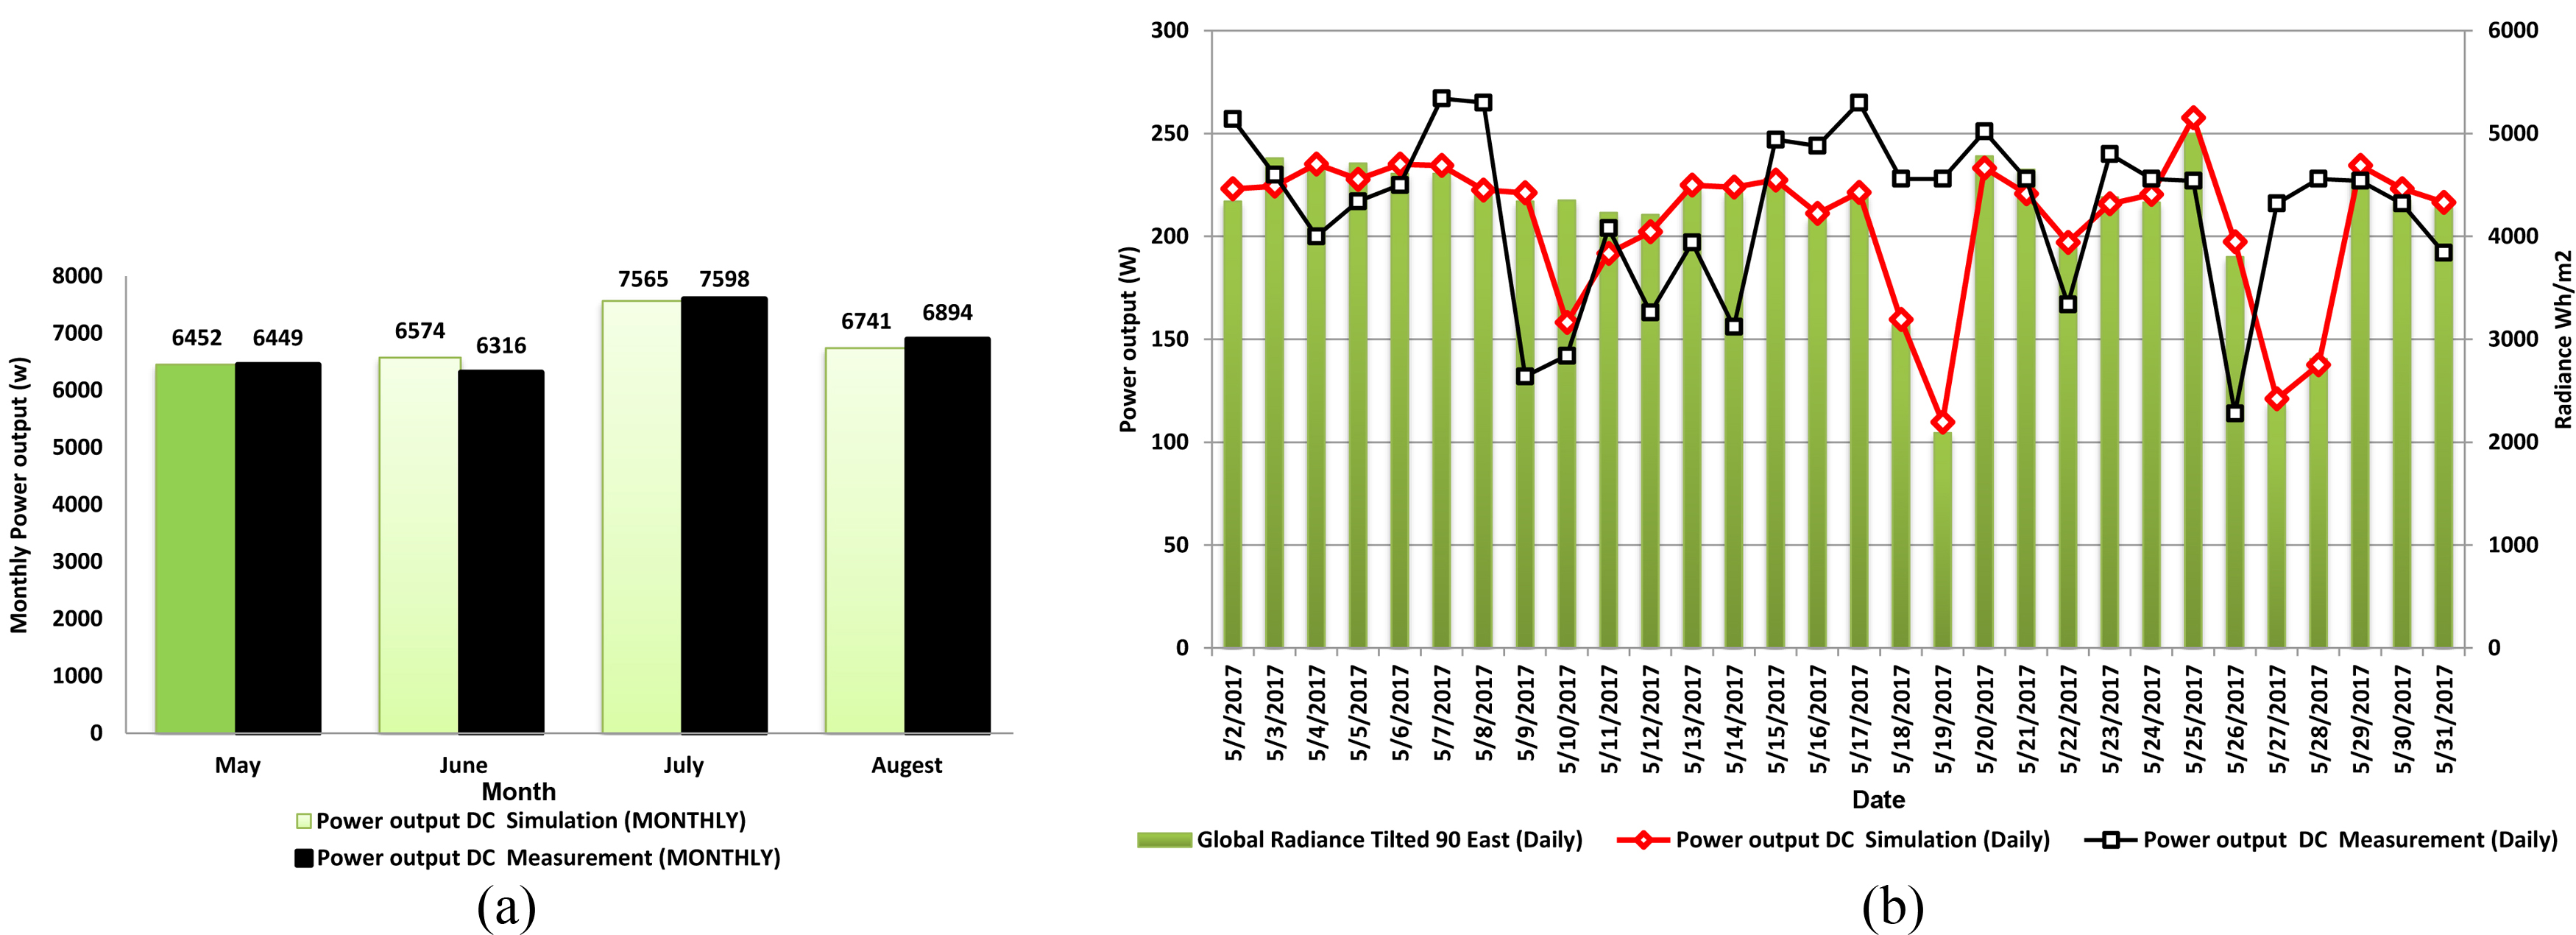
Fig. 7. (a) Comparison between monitoring data and simulated model of PV module through the mock-up model: monthly-accumulated data of power output. (b) Relationship between solar radiance and power output in May (spring season).
Table 3
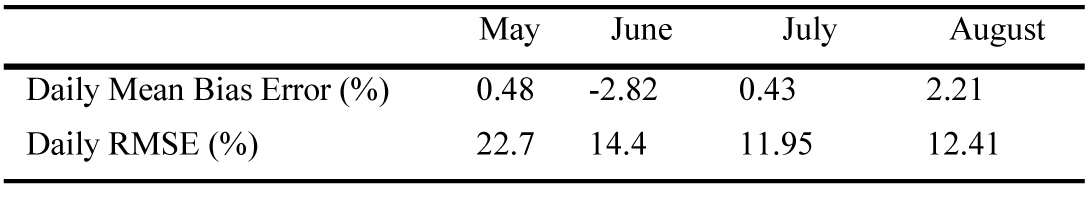
Table 3. MBE and RMSE of daily power output model used in the experiment.
Although the Meteonorm solar radiation database is being used extensively in the PV and building simulation, [38] had however, discovered the uncertainty sources in satellite-derived direct normal irradiance as causing well-tuned solar radiation models for producing a small bias of between 3% and 6% irrespective of climatic conditions. For this reason, this study had utilized the Meteosat satellite images of Tebessa, Algeria that were obtained from MeteoSwiss, a national weather service provider. By using these images, the quantity of the global solar radiance tilted at 90º at an eastern orientation during the summer season was found to have a monthly range of between 123-140 kWh/m2, while the diffuse solar radiance tilted at 90º was revealed to have reached 60 kWh/m2 (representing more than 40% of the tilted global radiance), although the daily diffuse radiance quantity of the four months had demonstrated an almost constant value of 1.7 kWh/m2. While the trend fluctuation of the power generated in spring (May) had been due to its variable sky conditions, as shown in Fig. 8, the daily average energy output for this month and July had nevertheless exhibited values of between 213 Wh and 245 Wh. By comparing the daily power output data exhibited by the simulated and tilted solar radiance, this model was thus found to be reliable for validating the power output.
Figure 8
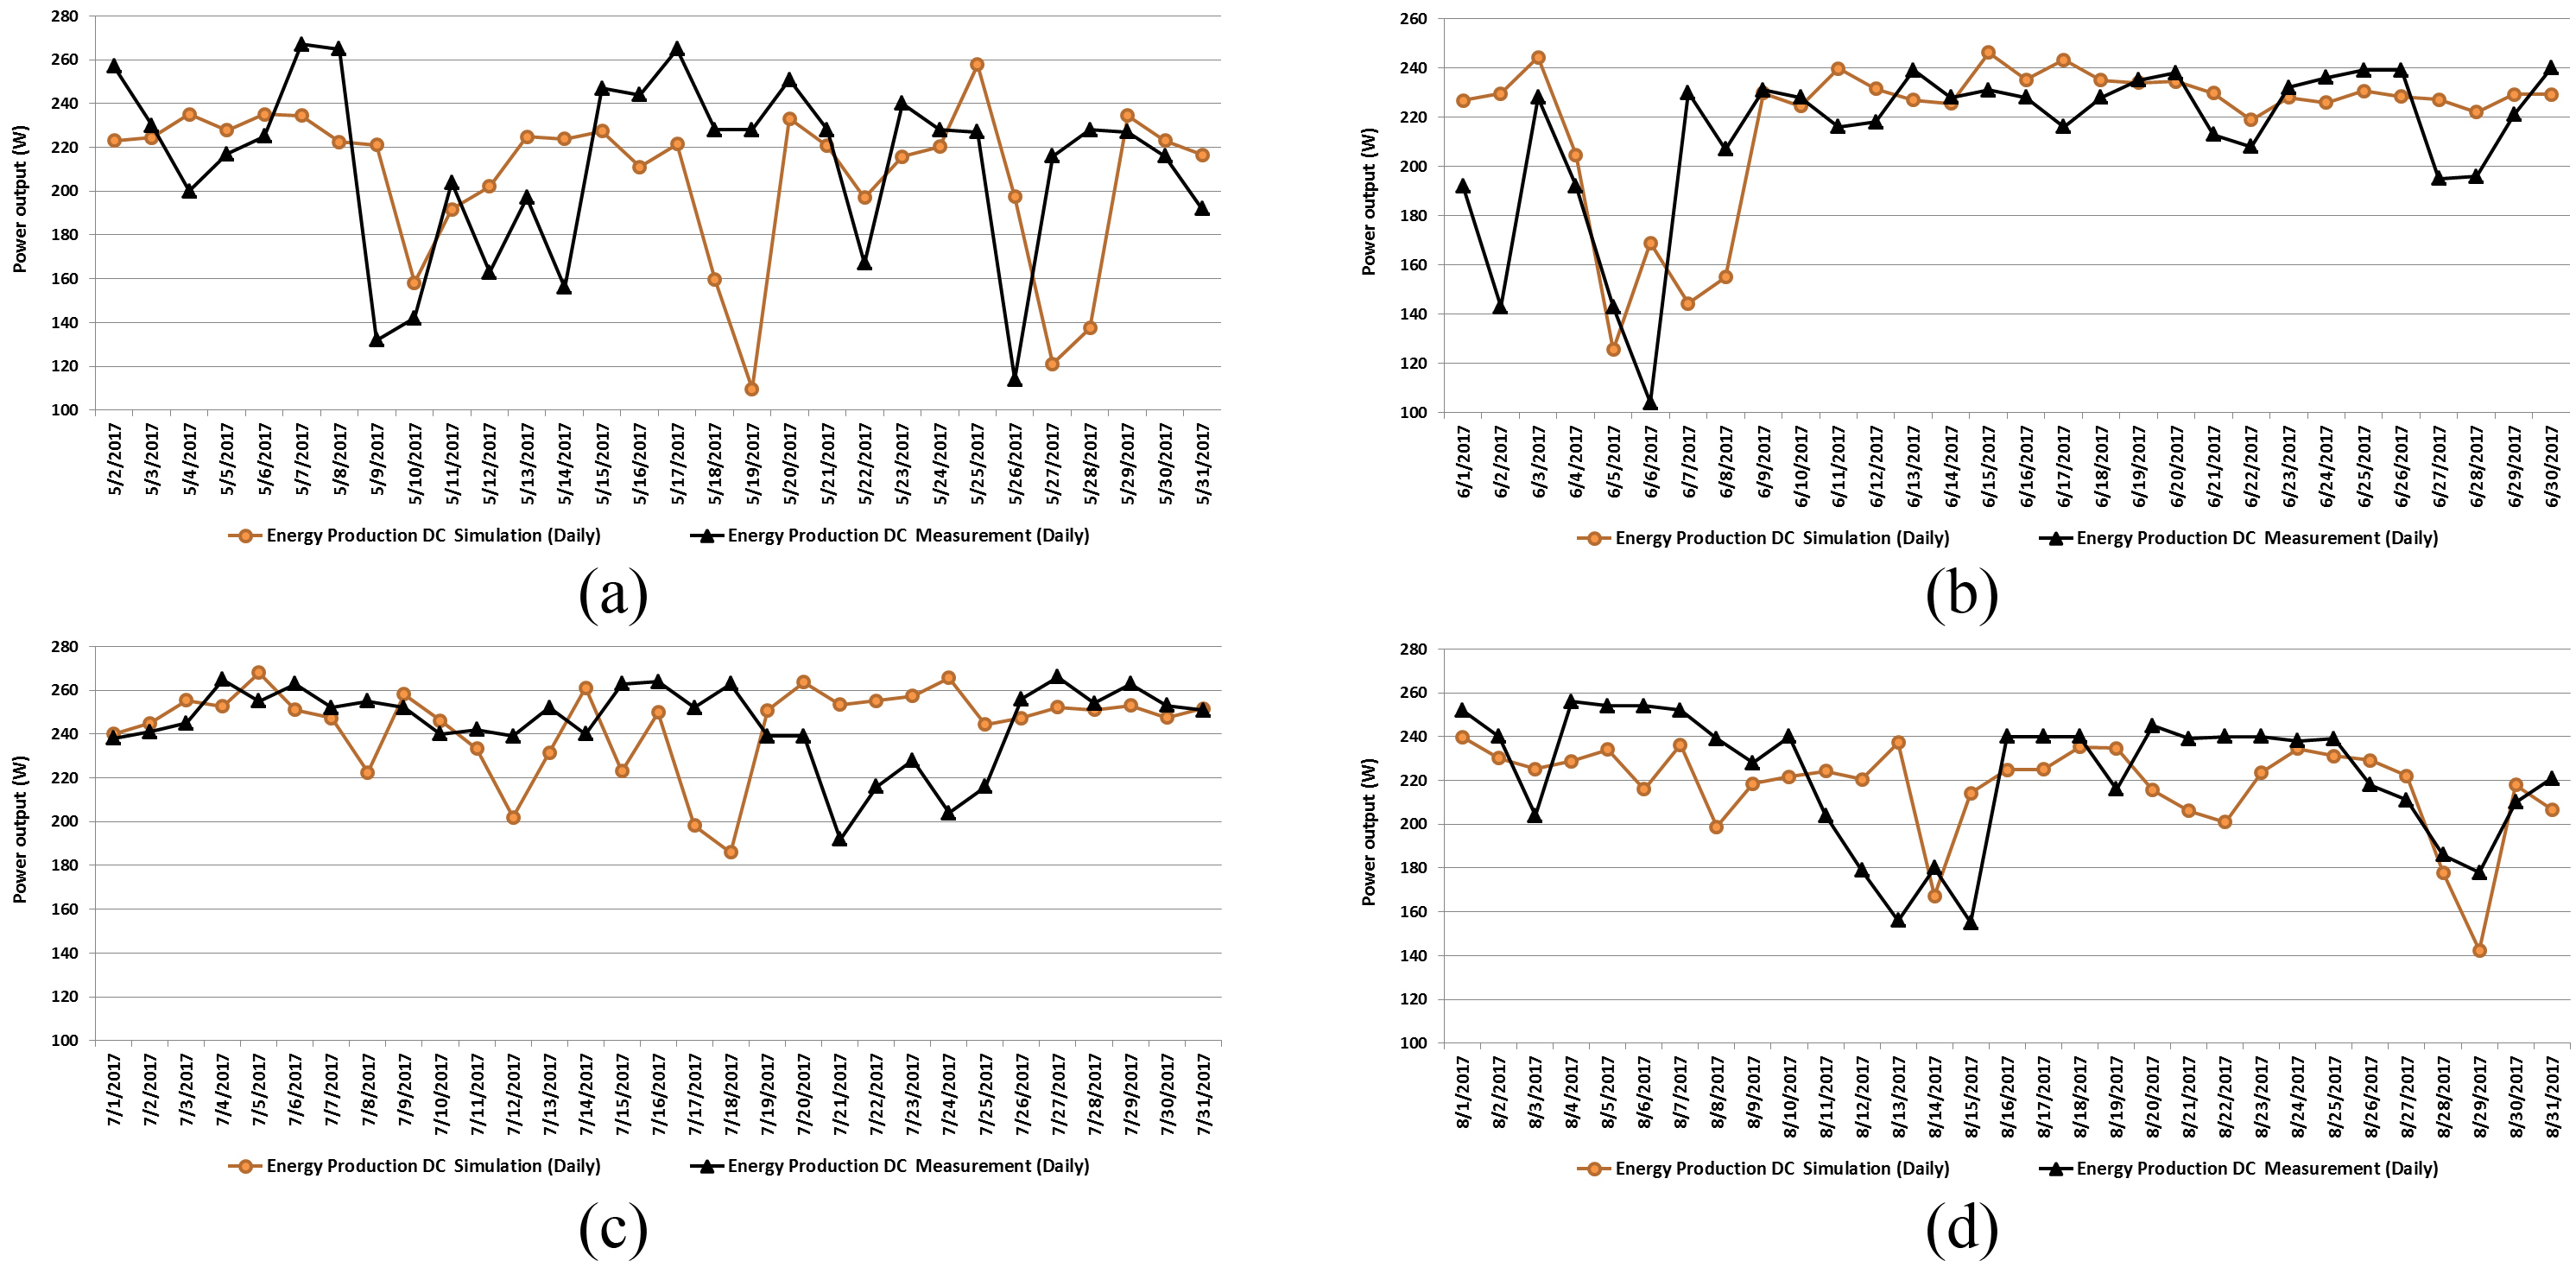
Fig. 8. (a-d) comparison of measured and simulated daily power out of the BIPV window in spring.
3.2. Validation of the heat gain and loss
This stage had involved the implementation of the dynamic heat improvement model in a common office building. In ensuring a warm atmosphere in the factory, the model had thus used the U-value and solar heat gain coefficient of the PV module as the simulation inputs, while the outcomes were derived from the EnergyPlus such as the hourly heat gains and losses and the performance shown by the BIPV window. However, the results were shown to have depended greatly on the experiment model, where it had demonstrated a mean bias error of heat gain and loss of 2.61% and 8.64%, respectively. During the investigation period, the measured heat gain value was found to have reached up to 300 watts during the summer season (Fig. 9), thus leading to a higher requirement of cooling energy, while the heat loss was observed to have occurred during the late afternoon, which had been beyond the scope of this investigation.
Figure 9
Fig. 9. Hourly heat gain/loss of measurement data in June compare with simulated data, heat flux device.
3.3. Validation of indoor air temperature
The temperature data collected in the tested office building was taken into account both: (1) indoor air temperature, (2) inside surface cells temperature. The indoor air temperature is an essential factor related to the energy consumption of heating and cooling. Therefore, the validation of indoor air temperature of BIPV window was performed in summer season (critical period) from 1 to 15 june. The maximum difference between measured room temperature and simulation were less than 3oC (Fig. 10). The consistency of indoor temperature is less than 2.3%, which lead to achieve a good prediction of cooling and heating loads on the next part of simulation.
Figure 10
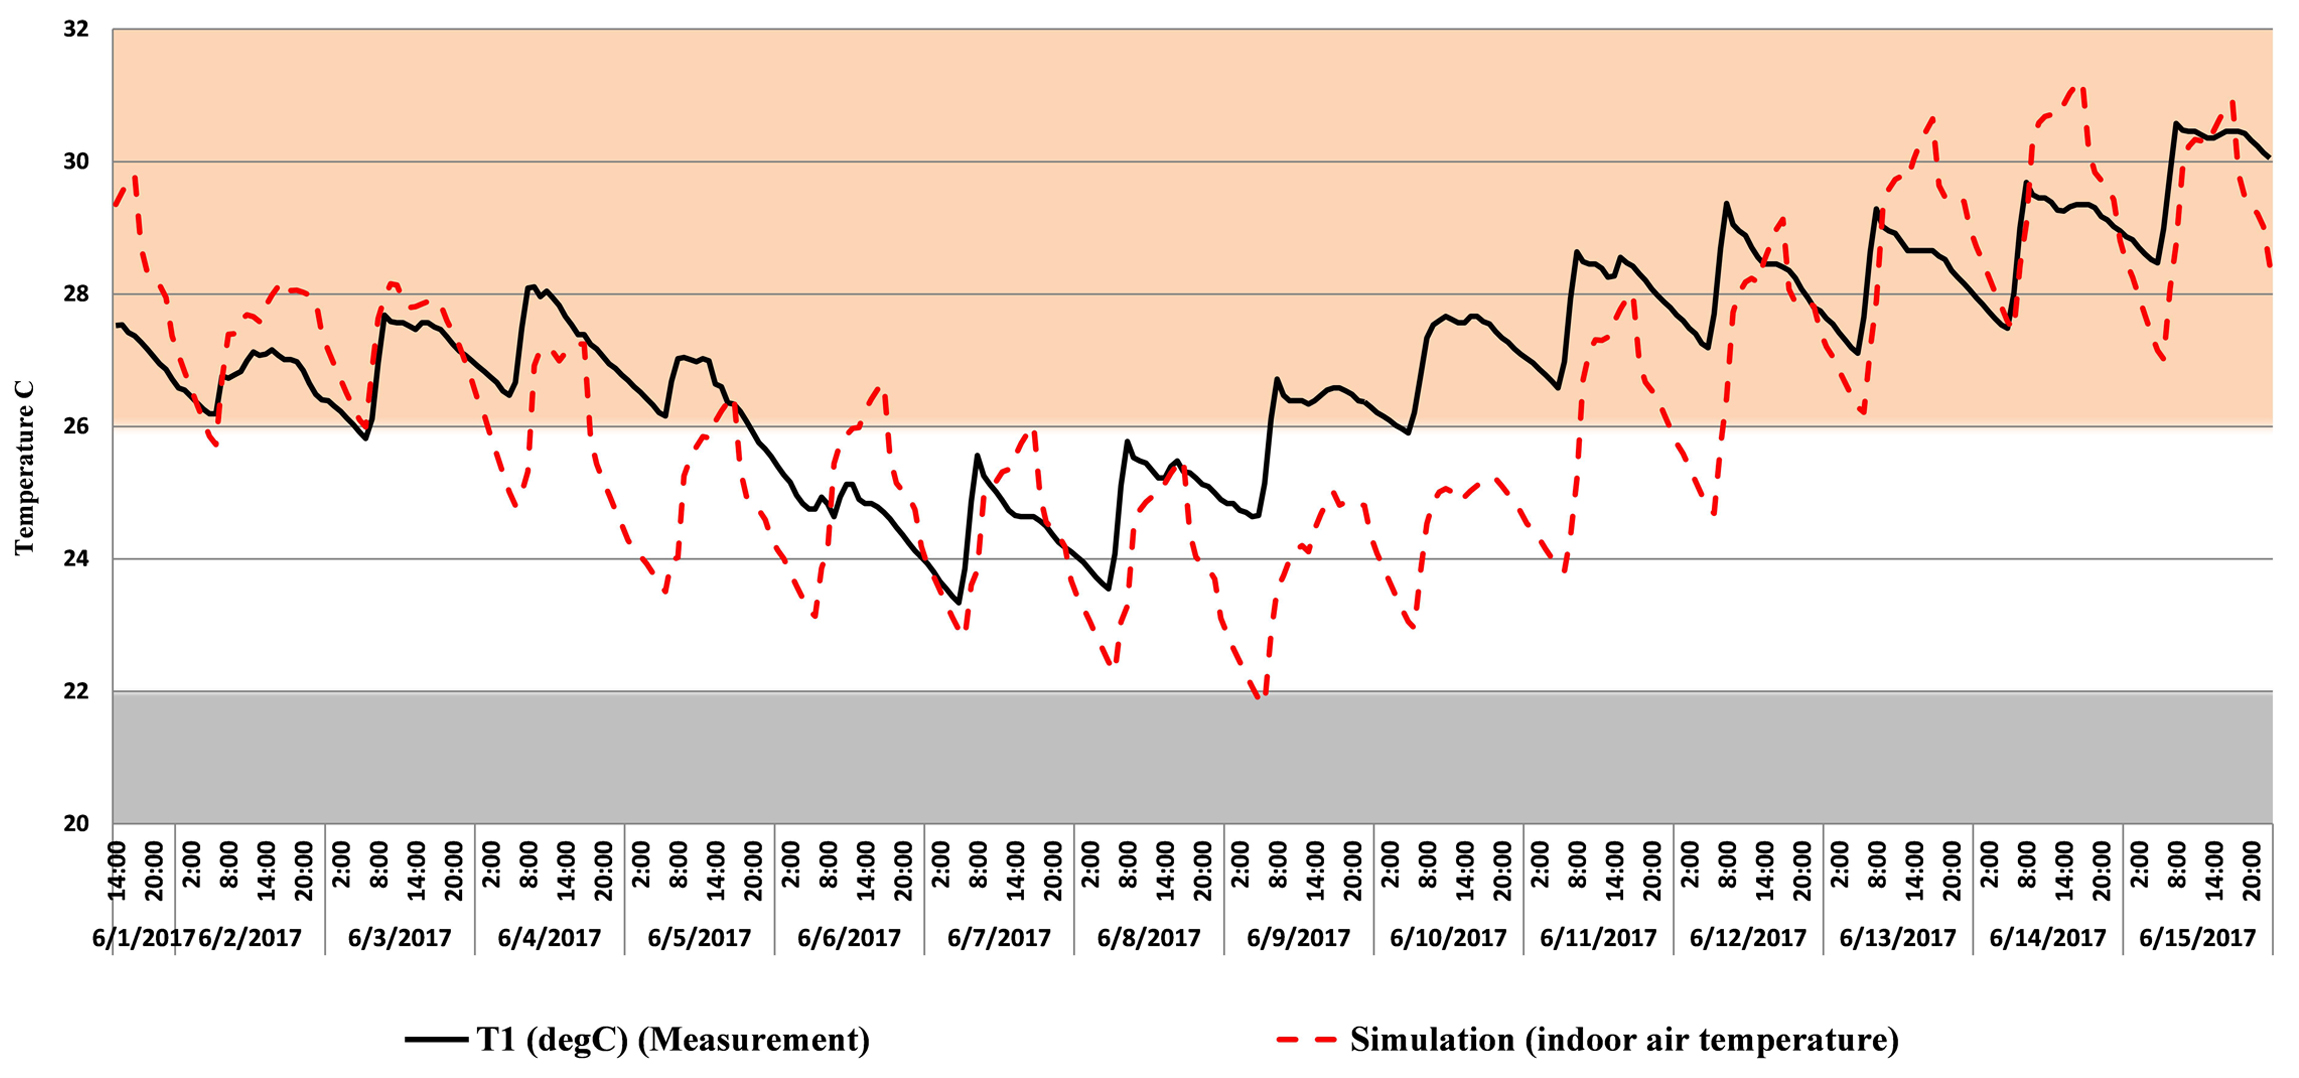
Fig. 10. Validation of measured indoor air temperature and simulation by using Energyplus in, summer season (1 to 15 June).
It is observed that there was a clear variation of temperature at summer season; its values above 29oC can be up to 35oC, this high temperature lead to thermal discomfort and low productivity for employee in office. However, the diurnal internal temperature variation mostly was small that did not exceed 1.5oC. On the hottest days, the peak internal temperature in summer is through a four or five below that outside. Hence, the internal temperature occurred from the use of BIPV window at summer season was considered higher than the thermal comfort recommended 22.5oC to 26oC, by ANSI/ASHRAE55, 1995. Although PV module has a higher insulation characteristic, this was because of the high outdoor temperature at summer season that reaches to 45oC and high intensity of solar radiance above 900 W/m2.
3.4. Validation of outdoor air temperature
Verification of external Hobo instrument used to measure the outdoor air temperature was compared with TMY collected from the Algerian weather station (Meteonorm version 7.1). The instrument was placed inside a sheltered wooden box open from both sides, designed to be an including space for the Hobo, which is always under shadow and not exposed to direct radiation, as -Steven Screen design- [39]. It is not affected by the surface placed above, because the thermal conductivity of wood is relatively low [40], and the small gap between the wooden box and the surface isolated the thermal conduction, as shown in Fig. 11. It is found that the maximum temperature deviation is about 7 degrees Celsius, occurring mid-day. At other times, the MBE and RMSE between the simulated and measured temperature results are 3.18% and 14.86%, respectively. Therefore, the graph shows a good agreement of the simulations with the measurements.
Figure 11
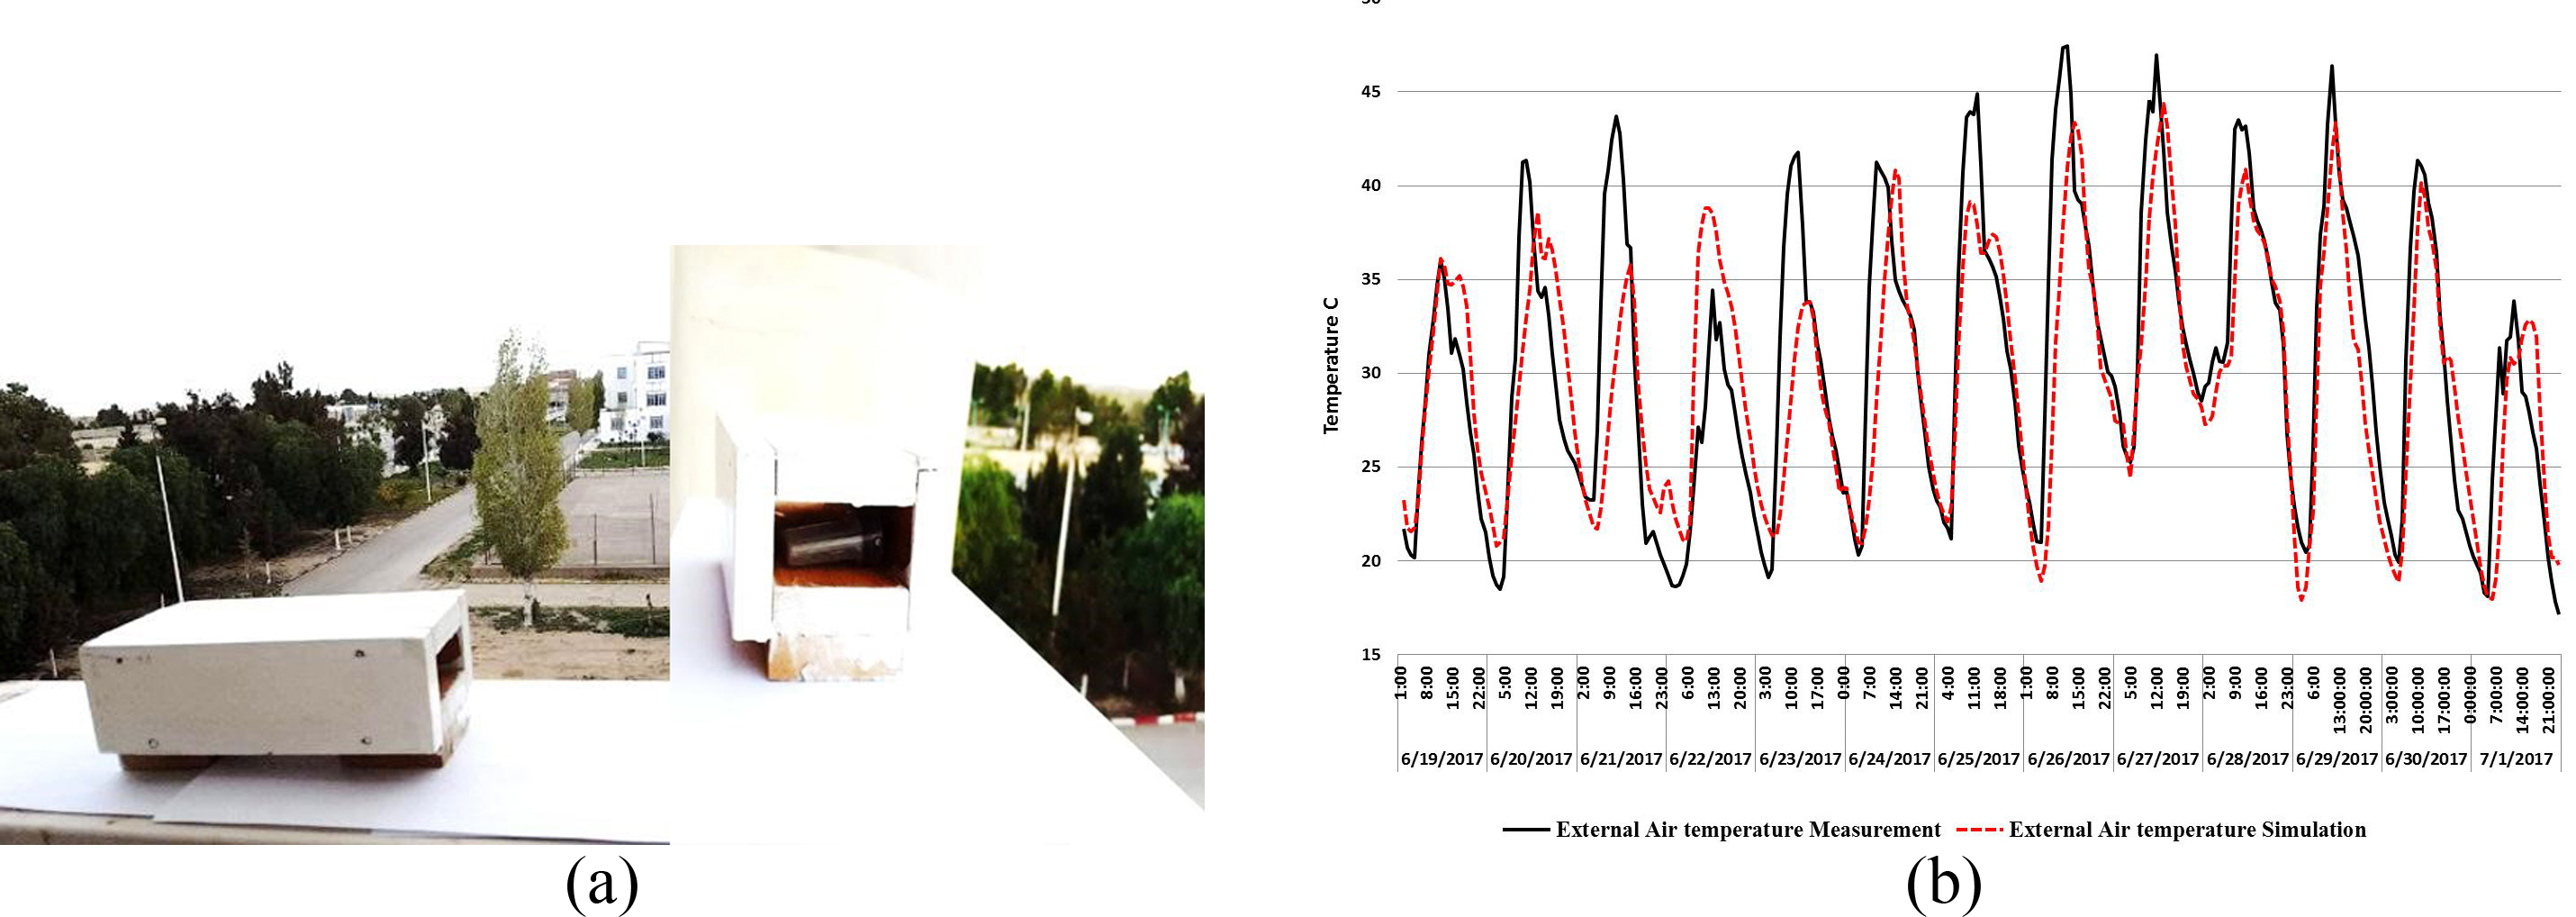
Fig. 11. (a) Sheltered wooden box design used to measure external air temperature. (b) Comparison of outdoor temperature in measurement and TMY used in simulation.
3.5. Evaluation of heating and cooling energy consumption
The heating and cooling energy consumption were found to be strongly related to climatic conditions. As shown in Fig. 12, a higher cooling energy consumption level (with the exception of the northern orientation) was observed from the comparison of the yearly cooling and heating energy consumption between the clear glass base-model and the 20% transparent BIPV window, while the BIPV window was discovered to have the potential for reducing the cooling energy in cardinal orientations of up to 17% (as depicted by its eastern orientation). As for the heating energy consumption of the base-model, its consumption in the southern orientation was revealed to have been 27% lesser than that of the BIPV because of the non-existent solar transmission. As such, the use of a 20% transparent BIPV window is then regarded as an effective solution for reducing the cooling energy consumption, but not so for the heating energy.
Figure 12
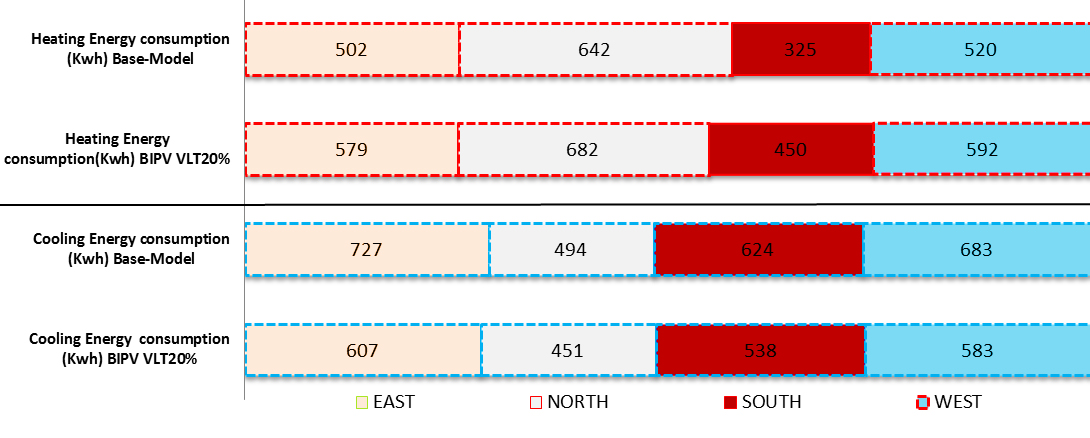
Fig. 12. The yearly heating and cooling energy consumption of BIPV window with 20% VLT and base-model.
3.6. Daylighting validation
The indoor illuminance referred to as A1, A2, B1, and B2 points are compared separately with simulation data by replacing sensors at the same source (Figs. 13 and 14). The outcome at point element A1 and A2, which are near the window, demonstrated that the level of illuminance, for the most part, meets the standard of 300 lux and the pattern of the diagram is generally similar (A1). The sensor at reference point A2 shows an extra illuminance achieved towards 4300 lux from 7.00 a.m. to 9.00 a.m., because of a full extent of illuminance and glare. Meanwhile, the sensors at points B1 and B2 are set in the inverse of a window exhibit lacking illuminance which did not meet the standard of 300 lux, aside from B2 at 7 a.m. getting excessive lighting due to direct sunlight. The graph below revealed that sky condition in spring and summer seasons include both overcast and clear sky which affects the quantity of illuminance distribution inside the office as shown in the appendix. This reliable result with measurements of sky condition carried out in [2]. It was found that clear sky provides much higher indoor illuminance levels than the overcast sky; the light level difference between overcast and clear skies was significant near the BIPV window module at reference point A2 and should be considered in daylighting calculations. The mean bias error between the simulated and the measured daylighting are 0.48%, 10%, 7.78%, and 6.46%, respectively. There is a little overestimation for the level of illuminance, particularly at point A2 because of the direct exposition of sunlight as clearly shown in Fig. 15. The reproduced daylighting model concurred well with the deliberate daylight illuminance of the BIPV window module with a transparency of 20% by utilising IES-VE under a semi-arid climate.
Figure 13
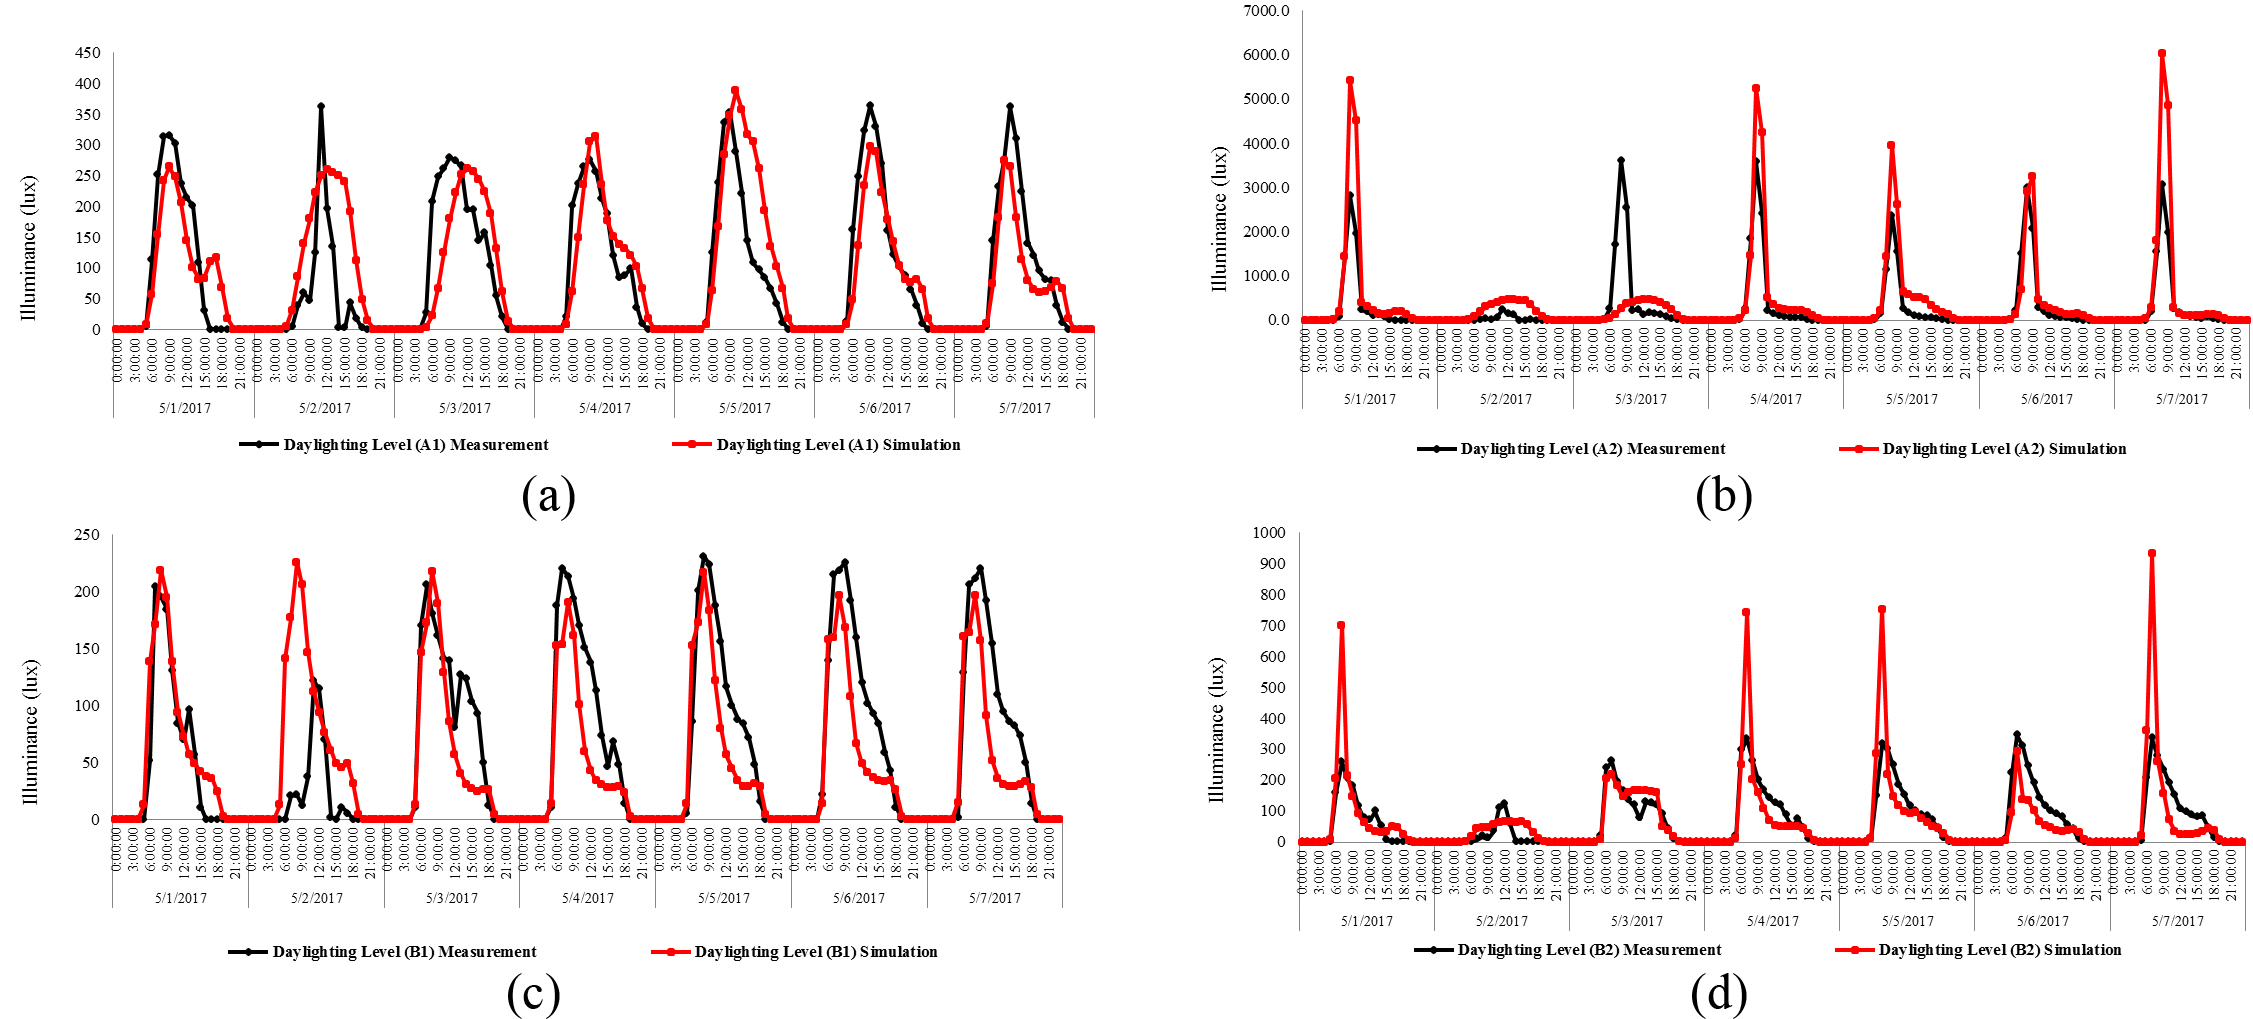
Fig. 13. (a-d)Comparison between level of illuminance at references points (A1, A2, B1, and B2) in spring.
Figure 14
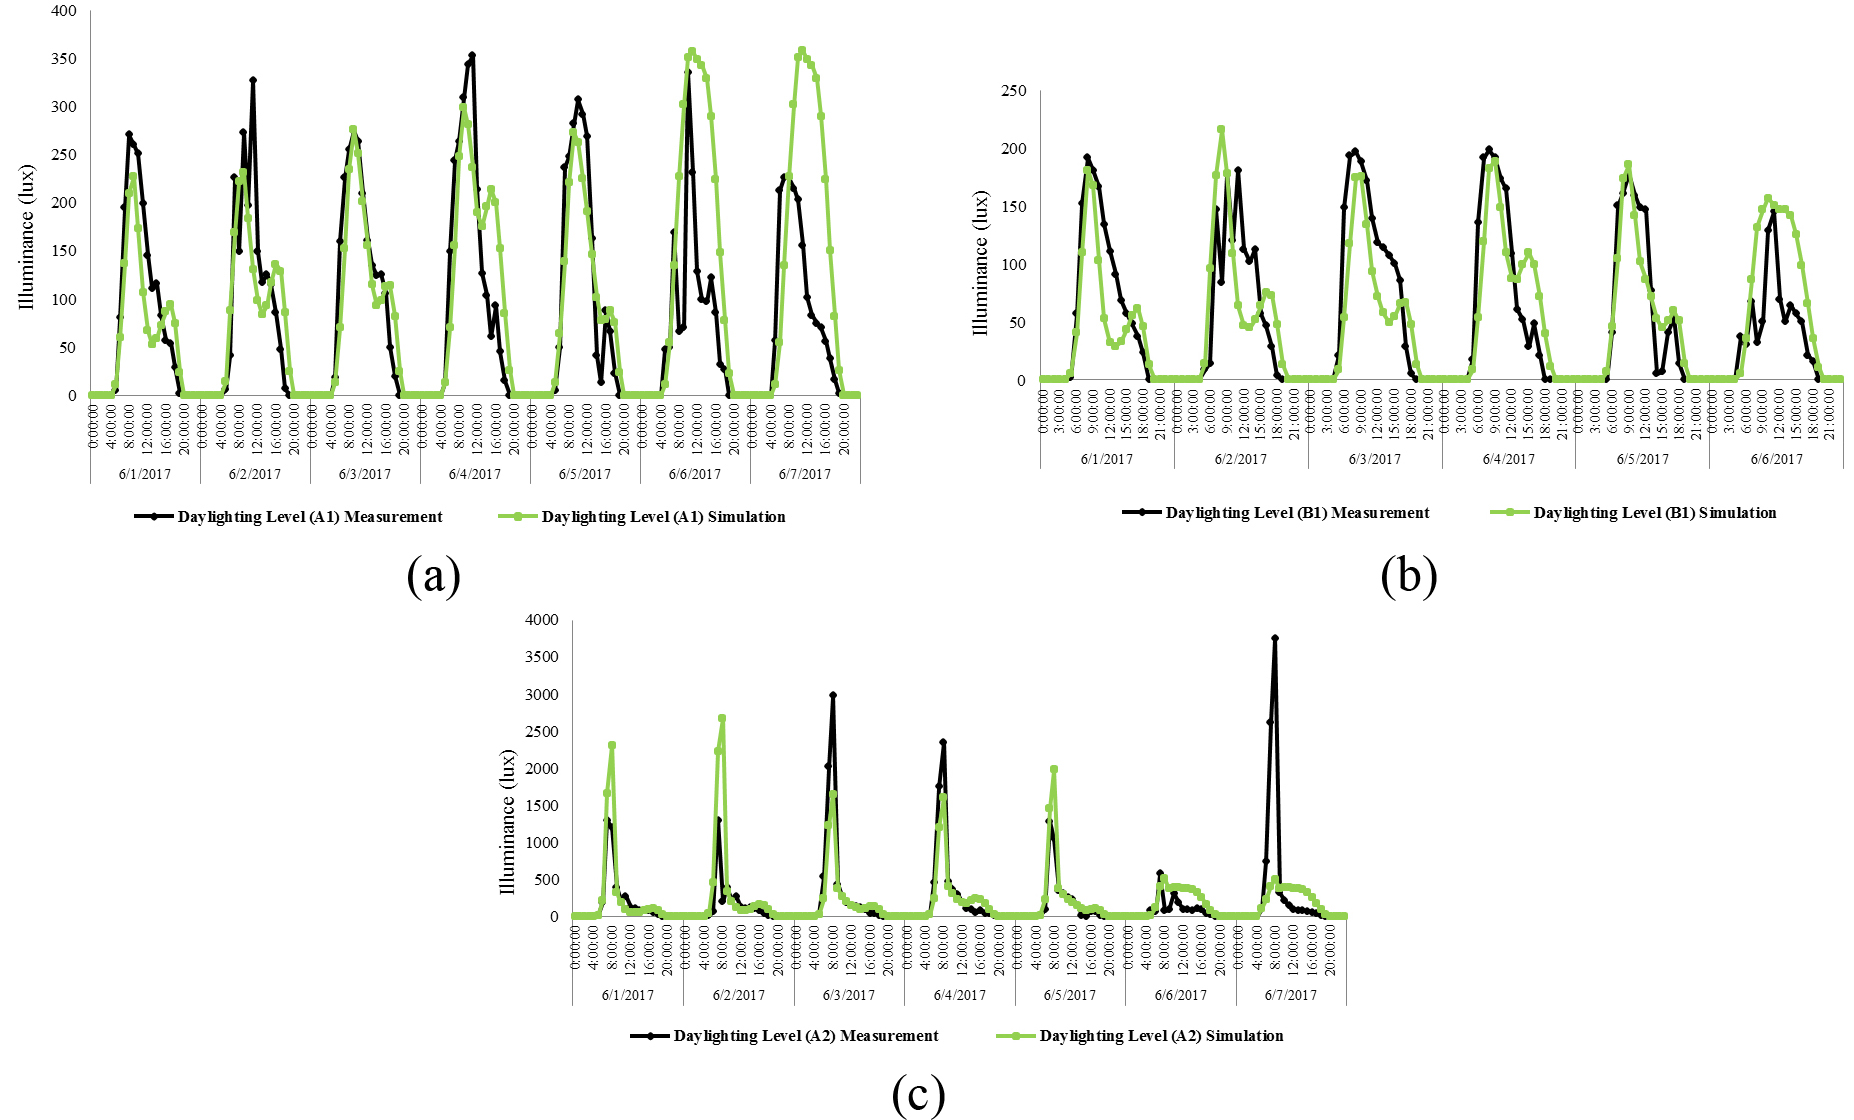
Fig. 14. (a-c) Showing level of illuminance at references points (A1, A2, B1, and B2) in summer.
Figure 15
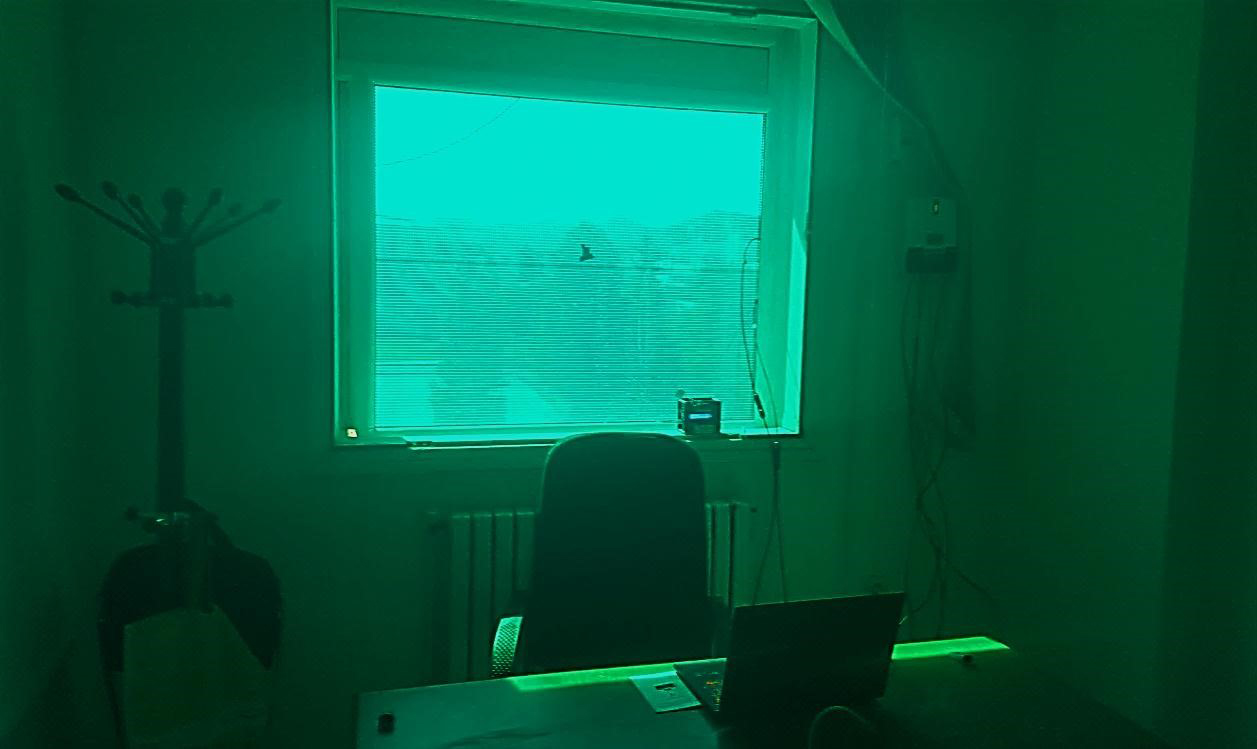
Fig. 15. The light meter reference (A2) exposed to direct sunlight at 8am, morning period.
The most critical characteristic of unilateral lighting is that it provides less uniform daylight into the office space. When reviewing the daylight uniformity using thin film PV module, in both cases with a clear and overcast sky, it could be seen that the office mostly achieved uniformity greater than 0.6, which is clearly observed in Fig. 16. This occurs mainly because the depth of the general office in Algeria is not deep, commonly less than four meters. The uniformity under an overcast sky is better than under a cloudless sky. Only the morning period between 8.00am and 9.00am generated low uniformity, as can be seen in the graph, providing the greatest contrast, particularly on the line (A2, B2), while direct sunlight penetrates to point A2.
Figure 16
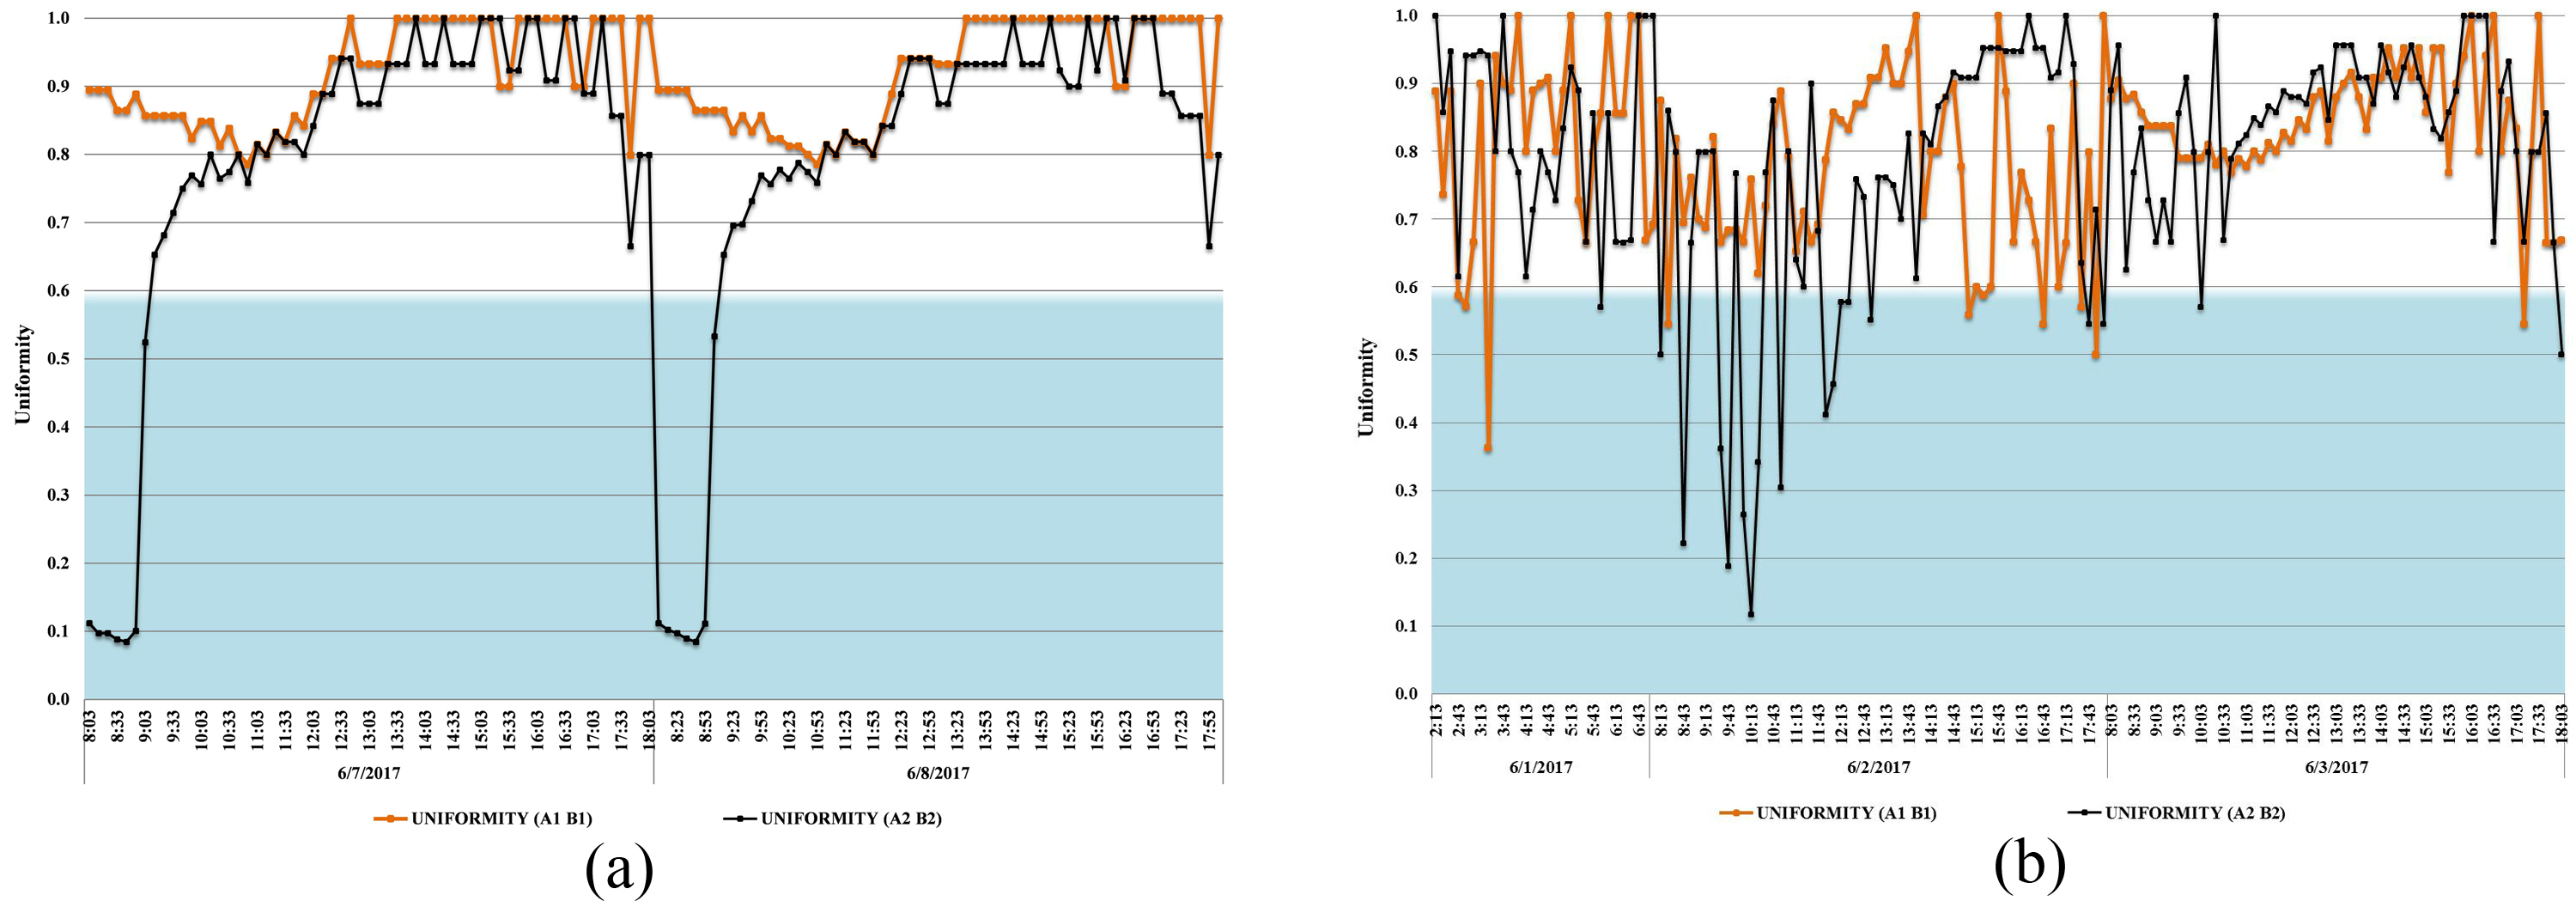
Fig. 16. (a) and ( b) Uniformity of test office under clear and overcast skies condition.
The quantitative results derived from the radiance simulation program IES-VE depend significantly on the successful configuration of the input parameters for this program, according to the specification/parameters and weather data for design in Algeria. This study supports and verifies by doing an additional measurement of outdoor daylight, carried out in May 2017, as shown in Fig. 17. From this study, the measured outdoor illuminance under the skies of Algeria was somewhat higher when compared to the simulated data under the CIE standard sky. The highest outdoor illuminance was captured in morning between 6.00 a.m and 7 a.m. As a result, the outdoor illuminance is mostly similar during the experiment.
Figure 17
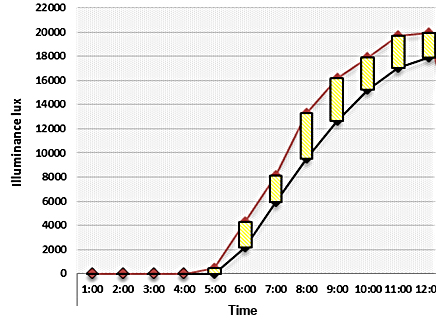
Fig. 17. Comparison between measured global outdoor illuminance and simulation (IES-VE, 2016).
3.7. Evaluation of lighting energy consumption
Figure 18 shows the lighting electricity consumption as a function of the 10% to 30% solar cell transmittance and reference glazing model (clear glass) in cardinal orientations. As depicted from the results, the lowest yearly energy consumption for the BIPV windows of 124Kwh was found to have occurred in the southern orientation with 30% of VLT, while the East and West facades had shown almost similar values and although the former had demonstrated a slightly higher figure, its maximum difference percentage was found to have not exceeded that of 5%. The highest lighting energy consumption on the other hand, was discovered to have occurred in the northern orientation of 10% VLT with 280 Kwh. Based on the above results, the reduction in the annual total lighting consumption can be said as causing the increased solar cell transmittance at all orientation levels, albeit at varying percentages as depicted by the corresponding 59% and 48% of the East and North facades as well as up to 70% for the southern façade.
Figure 18
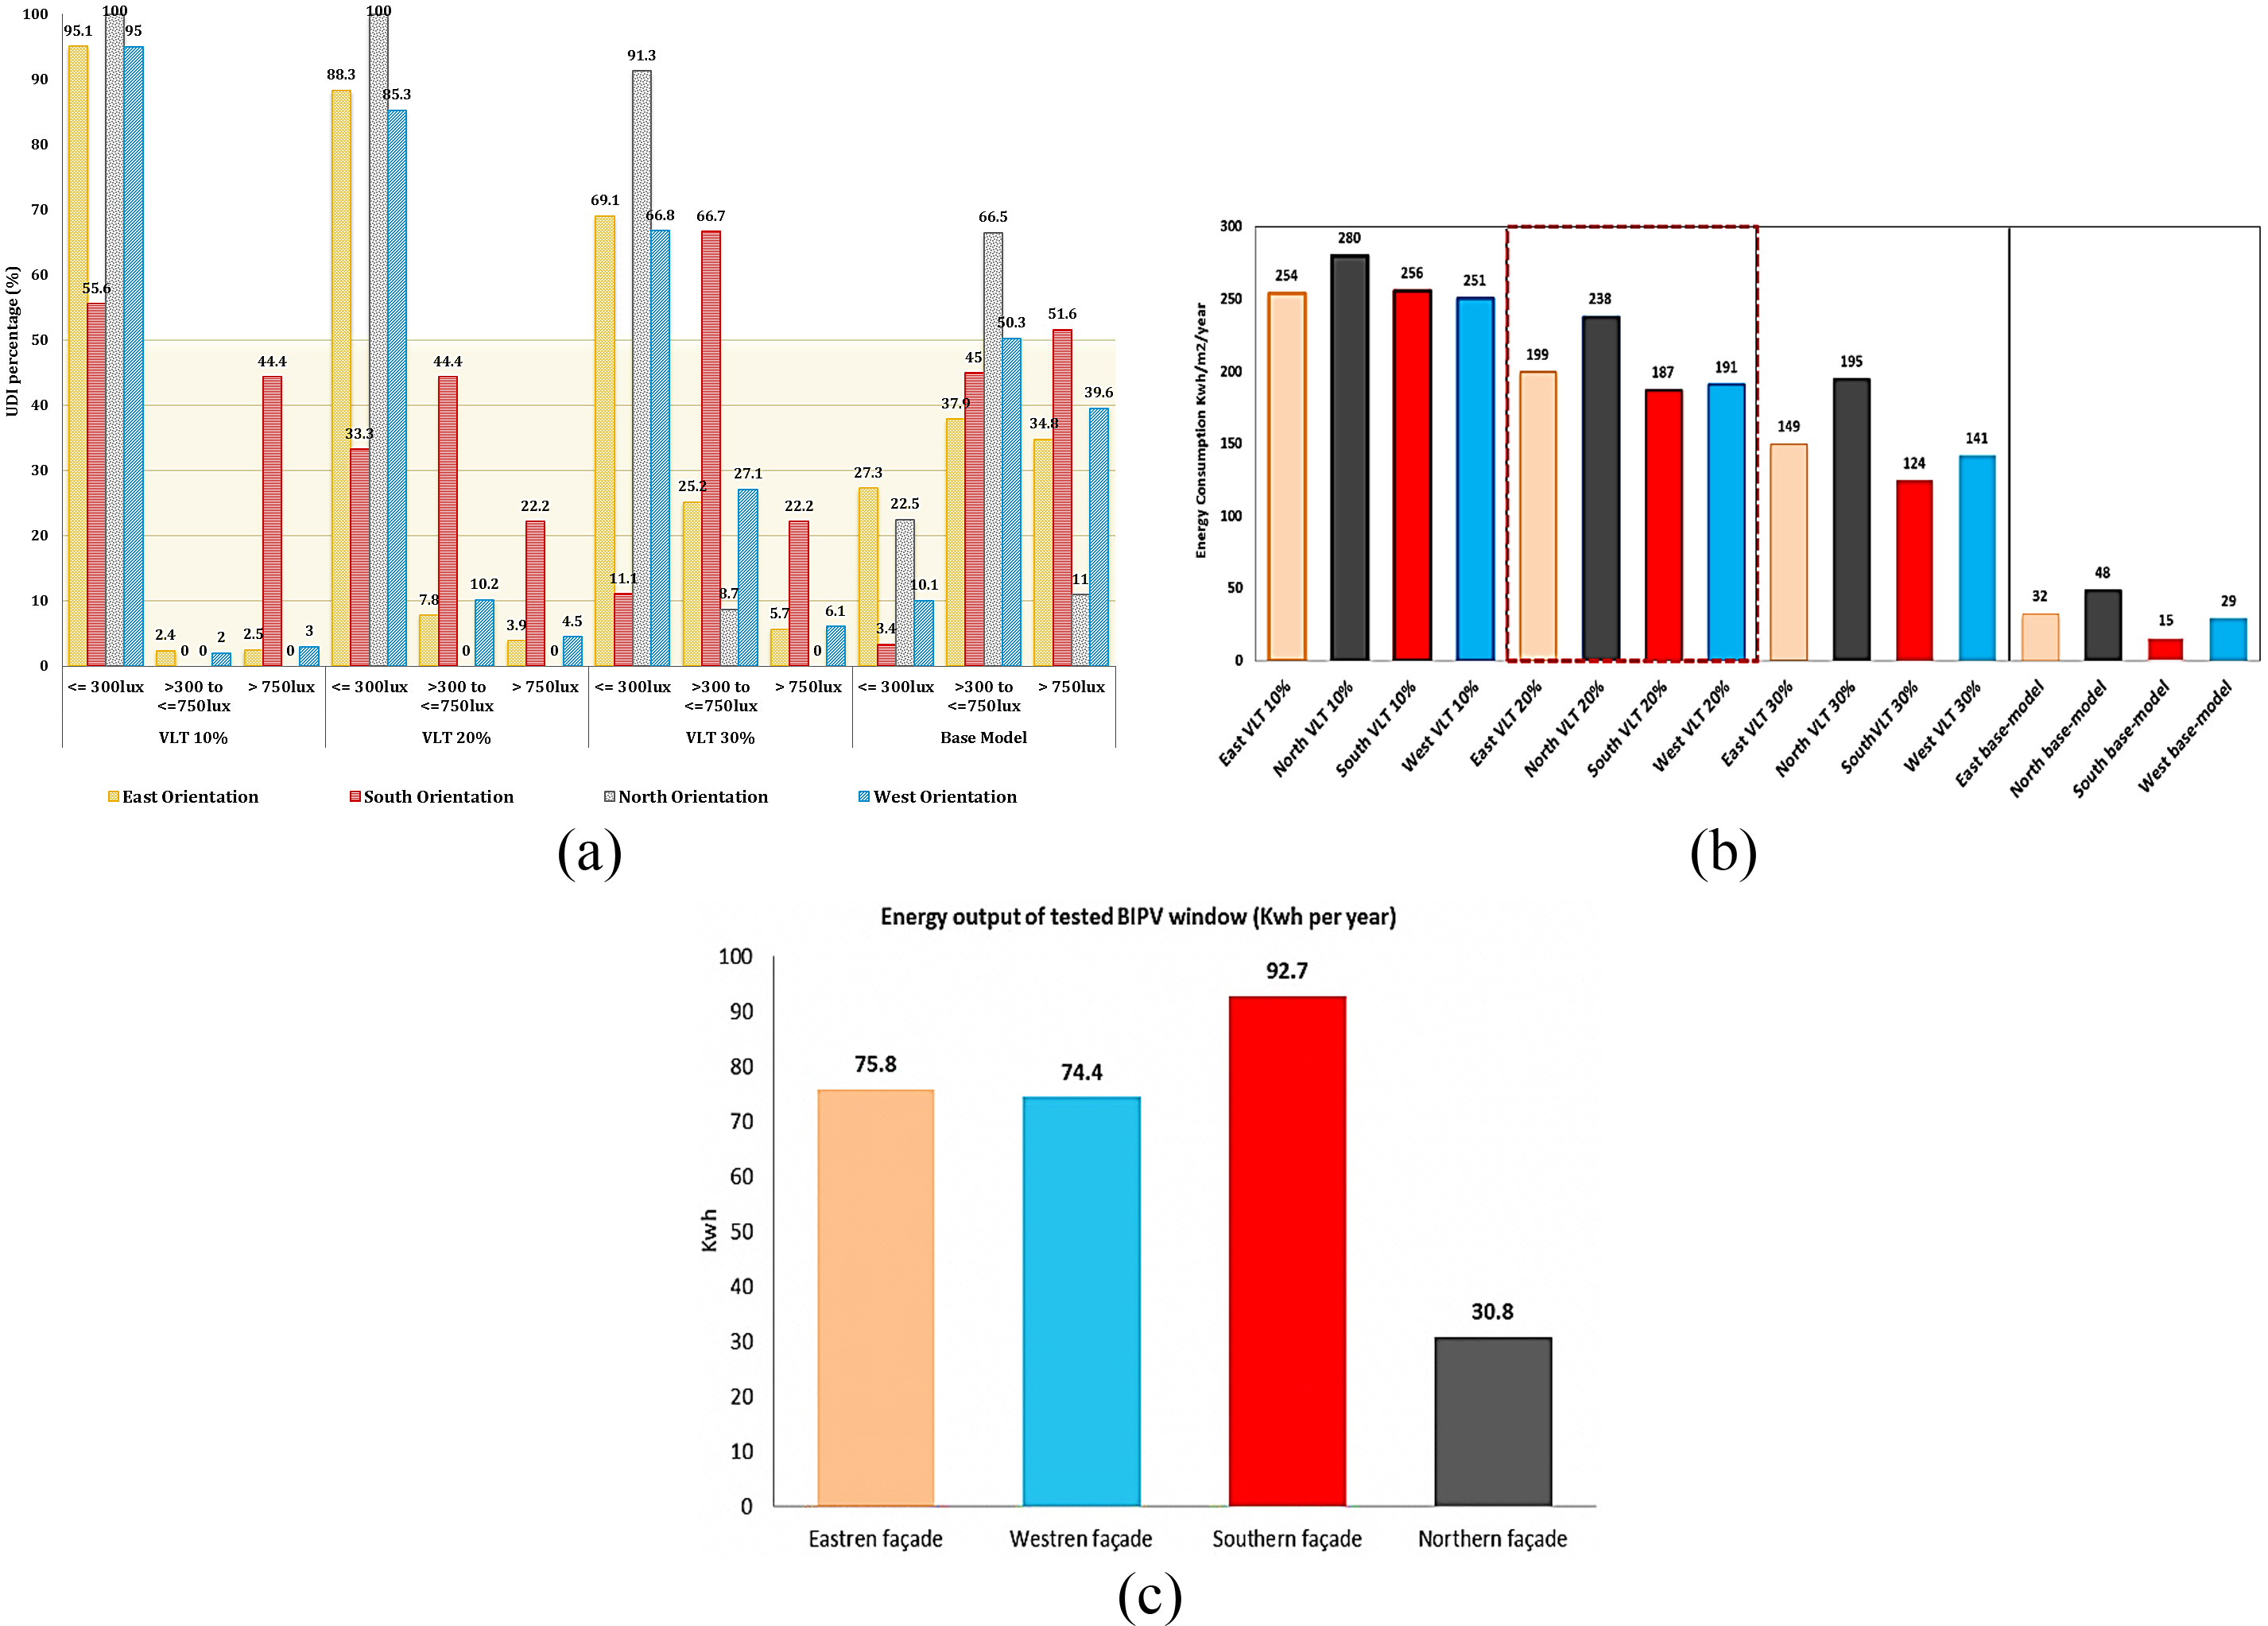
Fig. 18. (a) Useful daylight illuminance and (b) lighting energy consumption performance of different BIPV visible light transmittance (10%, 20%, and 30%) compared with base-model in cardinal orientations (c) the yearly energy output of tested PV module in cardinal orientation.
As for the annual performance comparison of the base-model (clear glass) with different BIPV transparency windows, the lighting energy savings was discovered to have increased dramatically in the base-model, particularly at the eastern and western orientations, where it had received more sunlight and glare because of the sun path and high transparency level. A further illustration on the daylighting performance of the different windows with the use of UDI dynamic metric as shown in Fig. 18(a) had also shown the UDI>700 of the base-model to be much higher than the PV modules, thus confirming those of the previous results. However, the room that was simulated with the 10% VLT BIPV window had demonstrated its maximum UDI 300-700 lux to be 2.5% hence, implying that all the PV modules with 10% and 30% of WWR as not meeting the daylighting requirements and subsequently led to its high lighting energy consumption level. Based on the daylighting performance and energy output, the use of BIPV windows with different transparency levels was found to be not suited for the Northern orientation, but was proven otherwise by the base-model as shown by its 66.5% achievement from the UDI 300-700 lux. Since the highest percentage of good UDI300-700lux with 66.7% was achieved by the BIPV window with 30% VLT that was installed in the southern façade, this therefore indicates that the BIPV window transparency had been an ineffective solution for minimizing the lighting energy consumption through daylight utilization.
Conclusions
This study had experimentally investigated the effect of the BIPV window’s overall energy performance and the potential of EnergyPlus and IES-VE tools for evaluating the lighting energy savings of different PV modules under a semi-arid climate. By subjecting the calibrating instruments under the same conditions (surface and indoor temperature), a comprehensive validation was then conducted on a range of factors (heat gain/loss, daylighting, power output) of a typical Algerian office building with a-Si semi-transparent PV module (U-value, Solar Heat Gain Coefficient SHGC, visible light transparency, efficiency) before ending with a comparative study of the simulated and measured results.
The main conclusions of this study can thus be described as follows. Apart from improving the sustainable design research methodology and practice of the BIPV window’s overall energy under a semi-arid climate, this study, which had been applied for the first time in Algeria, had also shown the reliability of using EnergyPlus and IES-VE in the measurement and simulation of the overall energy factors in facilitating the future development of an overall energy model for BIPV window design with different architectural characteristics. Since the daylighting model is found to be very sensitive to outdoor illuminance, the BIPV window with 20% transparency was thus found to have provided a lesser amount of illuminance and more uniformly-distributed daylight at the eastern part of the office. In this study, the use of BIPV window was revealed to have reduced the cooling energy consumption as well as providing thermal comfort during the summer season, where the external air temperature had been higher than 40oC. Despite demonstrating a low efficiency of 4.5%ȵ, the thin filmed BIPV window (amorphous silicon) was revealed to have produced a monthly power output of more than 6.4 kwh, which is a reasonable amount as compared to those of a common office in Algeria, while the highest power output of 7.8 kwh was observed to have been generated in July because of the quantity of solar radiance received at mostly above 0.8 kw/m2. Lastly, besides demonstrating the usage of BIPV windows with transparency levels (10%, 20%, and 30%) as increasing the lighting energy consumption than those of the base-model, the findings from this research can also be used in the development of a sustainable energy policy as well as creating a healthy environment for all.
Acknowledgment
This research was financed by Professor Mesloub Said Department Mathematics King Saud University, College of Sciences P. O. Box 2455; Riyadh 11451 Saudi Arabia.
Contributions
M. Abdelhakim conceived the study, performed all measurements and simulations, interpreted the results, and wrote the manuscript. M. Z. Kandar supervised with help each stage of the project in terms of data collection, analysis and interpretation. Y.-W. Lim provided constructive advice to shape the final manuscript.
Appendix A
Figure A1 shows the percentage of total cloud covers. In Fig. A2, the monthly distribution of the WPI is shown.
Figure A1

Fig. A1. The percentage of total cloud covers in spring and summer season.
Figure A2
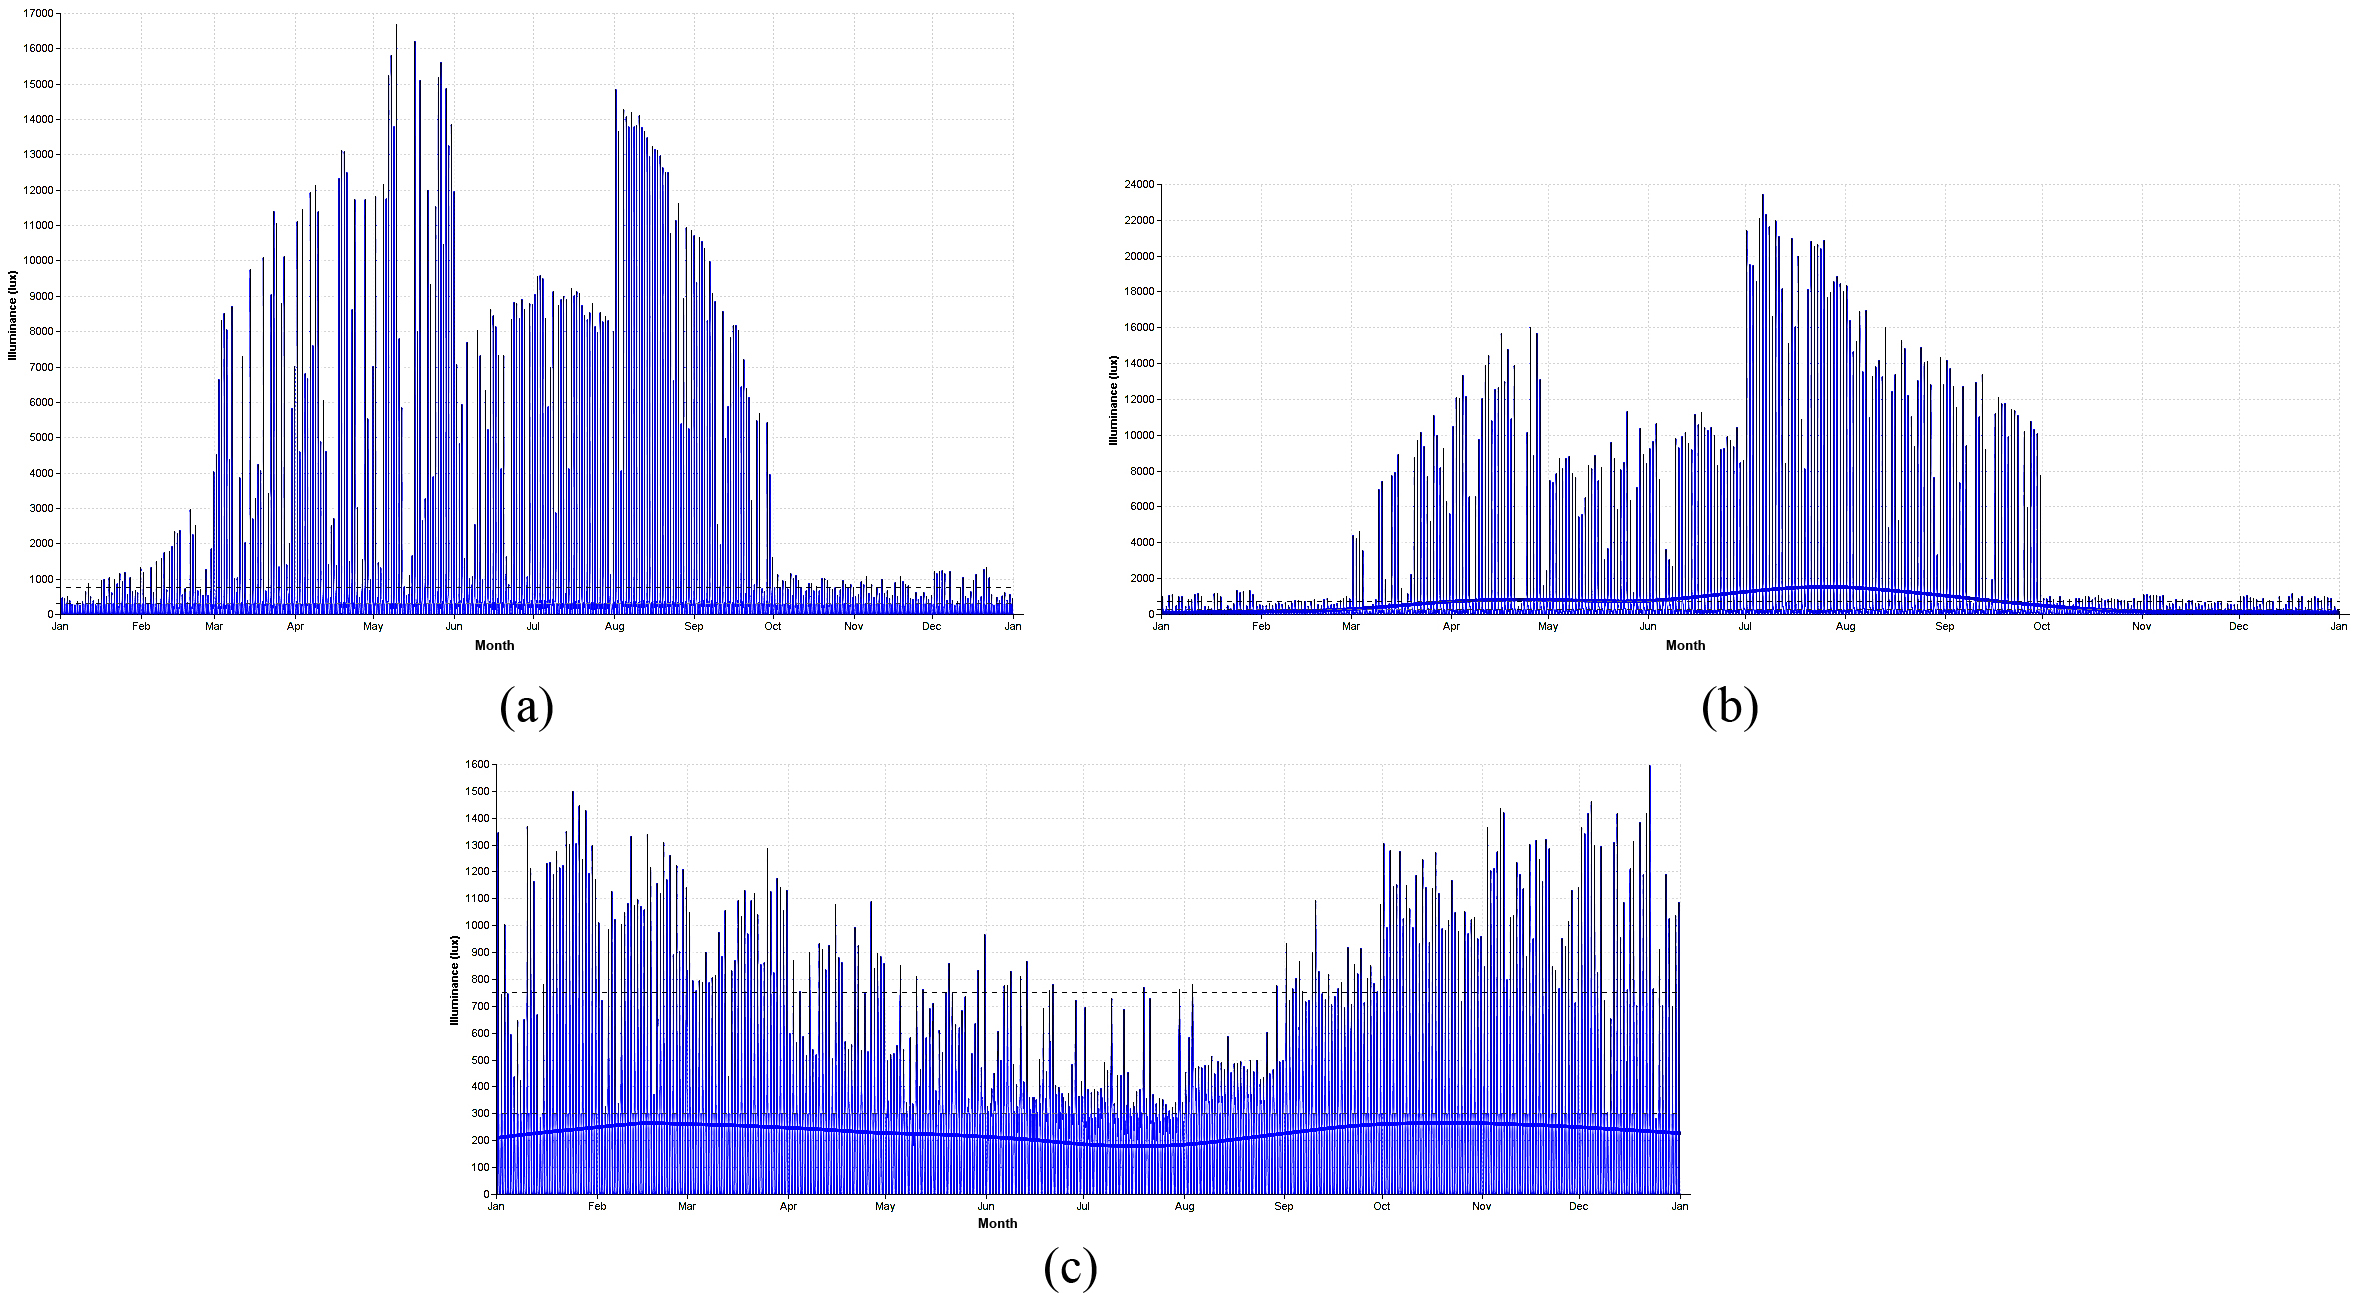
Fig. A2. The monthly distribution of the WPI of 20% WWR for the (a) West, (b) East, and (c) Southern office orientation.
References
- Guoqiang Hao, Xiaotong Yu, Yong Huang, Ying Xu, Xinkan Zhao, Hongbo Li, Mingbo Chen, Application and Development of Building-Integrated Photovoltaics(BIPV) System in China, in: Proceedings of ISES World Congress, 2007, pp. 1685-1689, Berlin, Heidelberg. http://dx.doi.org/10.1007/978-3-540-75997-3_346
- M. Amirat and S. El Hassar, Economies d'energie dans le secteur de l'habitat consommation electrique des ménages: Cas d'un foyer algérien typique en période d'hiver, Revue des énergies renouvelables 8 (2005) 27-37.
- M. Abdelhakim, J.D. Jibril, M. Z. Kandar, andY.A. Dodo, Low Carbon Emission through the Use of BIPV Windows in Algerian Mid-Rise Buildings, Chemical Engineering Transactions 56 (2017) 541-546.
- A. B. Stambouli, Z. Khiat, S. Flazi, and Y. Kitamura, A review on the renewable energy development in Algeria: Current perspective, energy scenario and sustainability issues, Renewable and Sustainable Energy Reviews 16 (2012) 4445–4460. https://doi.org/10.1016%2Fj.rser.2012.04.031
- P. Heinstein, C. Ballif, and L.-E. Perret-Aebi, Building Integrated Photovoltaics (BIPV): Review, Potentials, Barriers and Myths, ENERGYO, Mar. 2018. https://doi.org/10.1515%2Fenergyo.0028.00060
- S. A. Kalogirou, Building integration of solar renewable energy systems towards zero or nearly zero energy buildings, International Journal of Low-Carbon Technologies 10 (2013) 379–385. https://doi.org/10.1093%2Fijlct%2Fctt071
- V. Monetti, E. Davin, E. Fabrizio, P. André, and M. Filippi, Calibration of Building Energy Simulation Models Based on Optimization: A Case Study, Energy Procedia 78 (2015) 2971–2976. https://doi.org/10.1016%2Fj.egypro.2015.11.693
- M. Nikpour, M. Kandar, and M. Roshan, Empirical vof IES< VE> simulation in term of daylight in self-shading office room in Malaysia, Journal of Basic Applied Science Research 3 (2013) 106-112.
- D. B. Crawley, C. O. Pedersen, L. Lawrie, F. C. Winkelmann, Energy Plus: Energy Simulation Program. ASHRAE journal 42 (2000) 49-56.
- M. Abdelhakim, Y.-W. Lim, M. Zin Kandar, Optimum Glazing Configurations for Visual Performance in Algerian Classrooms under Mediterranean Climate, Journal of Daylighting 6 (2019) 11-22. http://dx.doi.org/10.15627/jd.2019.2
- C. Hachem, P. Fazio, and A. Athienitis, Solar optimized residential neighborhoods: Evaluation and design methodology, Solar Energy 95 (2013) 42–64. https://doi.org/10.1016%2Fj.solener.2013.06.002
- J. A. Wright, A. Brownlee, M. M. Mourshed, and M. Wang, Multi-objective optimization of cellular fenestration by an evolutionary algorithm, Journal of Building Performance Simulation 7 (2013) pp. 33–51. https://doi.org/10.1080%2F19401493.2012.762808
- K. Kapsis, V. Dermardiros, and A. K. Athienitis, Daylight Performance of Perimeter Office Façades utilizing Semi-transparent Photovoltaic Windows: A Simulation Study, Energy Procedia 78 (2015) 334–339. https://doi.org/10.1016%2Fj.egypro.2015.11.657
- C. P. Moscoso, Daylighting and Architectural Quality: Aesthetic Perception of Daylit Indoor Environments, 2016.
- J.L. Hensen and R. Lamberts, Building performance simulation for design and operation, 2012, Routledge.
- K.-W. Park and A. K. Athienitis, Workplane illuminance prediction method for daylighting control systems, Solar Energy 75 (2003) 277–284. https://doi.org/10.1016%2Fj.solener.2003.08.013
- Andersen, D. and R. Foldbjerg, Daylight, Energy and Indoor Climate–Basic Book. Editorial team: Daylight Energy and Indoor Climate (DEIC), VELUX A/S, 2012.
- J.-H. Song, Y.-S. An, S.-G. Kim, S.-J. Lee, J.-H. Yoon, and Y.-K. Choung, Power output analysis of transparent thin-film module in building integrated photovoltaic system (BIPV), Energy and Buildings 40 (2008) 2067–2075. https://doi.org/10.1016%2Fj.enbuild.2008.05.013
- J.-H. Yoon, S.-R. Shim, Y. S. An, and K. H. Lee, An experimental study on the annual surface temperature characteristics of amorphous silicon BIPV window, Energy and Buildings 62 (2013) 166–175. https://doi.org/10.1016%2Fj.enbuild.2013.01.020
- Agathokleous, R. and S. Kalogirou, Simulation-Based Investigation of the Air Velocity in a Naturally Ventilated BIPV System, 2018, Springer International Publishing.
- M. Wang, J. Peng, N. Li, H. Yang, C. Wang, X. Li, and T. Lu, Comparison of energy performance between PV double skin facades and PV insulating glass units, Applied Energy 194 (2017) 148–160. https://doi.org/10.1016%2Fj.apenergy.2017.03.019
- W. Zhang, L. Lu, J. Peng, and A. Song, Comparison of the overall energy performance of semi-transparent photovoltaic windows and common energy-efficient windows in Hong Kong, Energy and Buildings 128 (2016) 511–518. https://doi.org/10.1016%2Fj.enbuild.2016.07.016
- Y. Sun, K. Shanks, H. Baig, W. Zhang, X. Hao, Y. Li, B. He, R. Wilson, H. Liu, S. Sundaram, J. Zhang, L. Xie, T. Mallick, and Y. Wu, Integrated semi-transparent cadmium telluride photovoltaic glazing into windows: Energy and daylight performance for different architecture designs, Applied Energy 231 (2018) 972–984. https://doi.org/10.1016%2Fj.apenergy.2018.09.133
- Q. Huang, Study on thermal and daylighting performance of a double-glazed PV ventilated window in cold areas, Chengdu, Southwest Jiaotong University, 2014.
- R. Simson, J. Kurnitski, and K. Kuusk, Experimental validation of simulation and measurement-based overheating assessment approaches for residential buildings, Architectural Science Review 60 (2017) 192–204. https://doi.org/10.1080%2F00038628.2017.1300130
- D. Djalel, and G. Moatezbillah, Optimal Exploitation of a Solar Power System for a Semi-Arid Zone (Case Study: Ferkène, Algeria), International Journal Of Renewable Energy Research 4 (2014) 389-400.
- Z. Djamel and Z. Noureddine, The Impact of Window Configuration on the Overall Building Energy Consumption under Specific Climate Conditions, Energy Procedia 115 (2017) 162–172. https://doi.org/10.1016/j.egypro.2017.05.016
- M. Hajibabaei, S. kord, and E. Rasooli, Comparison of Different Methods of Measuring Illuminance in the Indoor of Office and Educational Buildings, Jundishapur Journal of Health Sciences 6 (2014). https://doi.org/10.5812%2Fjjhs.21720
- S. Carlucci, F. Causone, F. De Rosa, and L. Pagliano, A review of indices for assessing visual comfort with a view to their use in optimization processes to support building integrated design, Renewable and Sustainable Energy Reviews 47 (2015) 1016–1033. https://doi.org/10.1016%2Fj.rser.2015.03.062
- Y. Luo, Z. Feng, Y. Han, and H. Li, Design of compact and smooth free-form optical system with uniform illuminance for LED source, Optics Express 18 (2010) 9055. https://doi.org/10.1364%2Foe.18.009055
- C.-M. Chiang and C.-M. Lai, A study on the comprehensive indicator of indoor environment assessment for occupants’ health in Taiwan, Building and Environment 37 (2002) 387–392. https://doi.org/10.1016%2Fs0360-1323%2801%2900034-8
- D. P. Yadav, Energy Saving Assessment for Building Envelope of Supermarket Based on EnergyPlus and Openstudio, American Journal of Civil Engineering 5 (2017) 141. https://doi.org/10.11648%2Fj.ajce.20170503.13
- F. Chen, S. K. Wittkopf, P. Khai Ng, and H. Du, Solar heat gain coefficient measurement of semi-transparent photovoltaic modules with indoor calorimetric hot box and solar simulator, Energy and Buildings 53 (2012) 74–84. https://doi.org/10.1016%2Fj.enbuild.2012.06.005
- W. P. Wah, Y. Shimoda, M. Nonaka, M. Inoue, and M. Mizuno, Field Study and Modeling of Semi-Transparent PV in Power, Thermal and Optical Aspects, Journal of Asian Architecture and Building Engineering 4 (2005) 549–556. https://doi.org/10.3130%2Fjaabe.4.549
- S. Barman, A. Chowdhury, S. Mathur, and J. Mathur, Assessment of the efficiency of window integrated CdTe based semi-transparent photovoltaic module, Sustainable Cities and Society 37 (2018) 250–262. https://doi.org/10.1016%2Fj.scs.2017.09.036
- S. Ghani, E. M. Bialy, F. Bakochristou, S. M. A. Gamaledin, M. M. Rashwan, and B. Hughes, Thermal comfort investigation of an outdoor air-conditioned area in a hot and arid environment, Science and Technology for the Built Environment 23 (2017) 1113–1131. https://doi.org/10.1080%2F23744731.2016.1267490
- Y.B. Mounira Badeche, Energy Demand Reduction Applying Different Window sizes for an office building in semi-arid climate, Journal of Buildings and Sustainability, 1 (2018) 1-10.
- J. Remund, and S.C. Müller, Solar radiation and uncertainty information of Meteonorm 7, in: Proceedings of 26th European Photovoltaic Solar Energy Conference and Exhibition, pp. 4388-4390, 2011.
- M. Pidwirny, Introduction to the Biosphere: Single chapter from the eBook Understanding Physical Geography, 2014, Our Planet Earth Publishing.
- G. Xue, K. Liu, Q. Chen, P. Yang, J. Li, T. Ding, J. Duan, B. Qi, and J. Zhou, Robust and Low-Cost Flame-Treated Wood for High-Performance Solar Steam Generation, ACS Applied Materials & Interfaces 9 (2017) 15052–15057.
Copyright © 2019 The Author(s). Published by solarlits.com.

2295
Total views
Citations
SHARE ON


