Article Outline
Figures and tables
Volume 6 Issue 2 > pp. 97-111 • doi: 10.15627/jd.2019.10
A Comprehensive Evaluation of Perforated Façades for Daylighting and Solar Shading Performance: Effects of Matrix, Thickness and Separation Distance
Doris Abigail Chi Pool*
Author affiliations
Department of Architecture, Universidad de las Americas Puebla, ExHacienda Santa Catarina Martir S/N, San Andres Cholula, 72810, Mexico
* Corresponding author.
doris.chi@udlap.mx (D. A. Chi Pool)
History: Received 9 October 2019 | Revised 9 November 2019 | Accepted 12 November 2019 | Published online 15 November 2019
Copyright: © 2019 The Author(s). Published by solarlits.com. This is an open access article under the CC BY license (http://creativecommons.org/licenses/by/4.0/).
Citation: Doris Abigail Chi Pool, A Comprehensive Evaluation of Perforated Façades for Daylighting and Solar Shading Performance: Effects of Matrix, Thickness and Separation Distance, Journal of Daylighting 6 (2019) 97-111. http://dx.doi.org/10.15627/jd.2019.10
Figures and tables
Abstract
New design tools have enabled architects to explore complex geometries for building envelopes. Perforated Screens (PS) have gained popularity but their design is still intuitive, often focused on aesthetic and morphological criteria. Yet, there is a lack of guidelines or quantitative standards for designing optimal PS, in terms of their daylight provision, views outside, solar shading or energy performance. Since PS can greatly influence the interior conditions, it is essential to understand the effect of screen parameters, such as thickness, perforation percentage, separation distance, and others that are often manipulated by designers. This paper analyses the daylighting and shading performance of thick PS in office buildings. Five design parameters were simultaneously tested in terms of the annual daylight and solar irradiance contribution. Simulations were performed with DIVA-for-Grasshopper and the following metrics were accounted: useful daylight illuminance, actual daylight availability, and shading coefficients. Three orthogonal arrays allowed the selection of 64 PS configurations as representatives. The overall average of every metric was used as an approach to select all factors having a mean significantly different. The mean values were then established as ‘Preferable’ targets. Finally, design guidelines to plan thick PS used in front of South, East, and West glazed façades, in a Mediterranean climate, were proposed. The results highlighted the importance of selecting appropriate values for every design parameter to enhance the integrated performance of thick PS.
Keywords
Thick perforated façades, Daylighting, Solar shading, Multi-factor analysis
1. Introduction
During the last decades, glazed façades have been predominant among office buildings in different latitudes and climates all over the world. Now, there are numerous examples of buildings, which have ignored their climatic conditions by extending the use of highly glazed façades. However, glazed buildings can produce excessive solar radiation, leading to thermal discomfort and rising demand for energy. Present concerns with energy conservation have induced to implement solar shadings to reduce yearly heat gains and to improve energy efficiency [1]. It should be pointed out that solar shadings also affect daylight provision at indoors and visual contact to outside. Evidence shows that daylight stimulates the visual and circadian systems [2]; it also produces a positive psychological effect on workers at office spaces [3]. Moreover, daylighting is a way to reduce the use of artificial lighting and active thermal conditioning systems [4].
New design tools and advances in computer-aided programs have enabled architects to explore complex geometries and patterns for building envelopes. Consequently, semi-standardized shading devices such as louvers or overhangs have often been disregarded due to the difficulty of integration of these forms with contemporary building design [5]. Within this framework, Perforated Screens (PS) have gained popularity. PS are opaque lattices with perforations that vary in shape, size, number and distribution of holes. They can be thin or thick, depending on the construction material, which is usually metal, composite resins, ceramic or brick. PS are usually placed in front of windows or glazed façades, adopting a wide variety of designs to provide a contemporary look and to meet the expectations for the visual image of building envelopes. Moreover, these screens should be implemented not only for solar control but also to provide adequate daylight indoors.
1.1. Background: solar screens study
Previous research has addressed the performance of solar screens to take into account their influence on daylight and thermal performance from the initial building design process. The screens were either located in front of, or integrated with window glazing. Aljofi [6] examined the potential of reflected sunlight from Egyptian screens: devices made of wood strips with different holes shapes were tested, concluding that for all screens shapes, the highest value of the daylight factor was experienced at the middle central zone of the tested space. From the same study, the daylight factor was lower in the case of rounded shapes than in the other tested shapes and the contributed reflected light was found higher in screens with large diameters than those with small ratios.
Sherif et al. [7], studied the daylighting performance of screens used in front of windows, concluding that perforations with a shape ratio (vertical: horizontal) of 18:1 to North and 1:1 to South, can help obtain 200 lux on at least 70% of the working plane. The previous authors ran other several studies related to the daylight provision or the energy performance of screens used on windows of residential buildings located in extreme desert environments. In [8], different perforation ratios of quadrangular screens were tested, concluding that percentages of 40-90% were useful to obtain 200 lux during 50% of the yearly occupied hours, over at least 30% of the tested space. In [9], optimum ranges of perforation ratios were recommended to reduce air conditioning by 30%. These ratios were 80% to windows oriented towards West and North, and 90% to windows facing East and South. In [10], the horizontal axial rotation angle of screens was tested, concluding that the mean illuminance in the tested space was directly proportional to the rotation angle.
In general, the previous works focused on studying quadrangular shaped holes of screens used on windows. Instead, Etman, Tolba and Ezzeldin [11] analysed the parametric design of an outer skin placed in front of a West façade. The aim was to maintain acceptable illumination levels within a prototypical office space. The authors concluded that perforated screens with small repetitive modules, assembled as an outer skin and developed from the traditional mashrabiya, improved the distribution of acceptable indoor illumination levels from 54% to 78% during the occupied hours set from 9 am to 4 pm. Furthermore, Azadeh [5] assessed complex geometries to optimize the performance of indoor environments in terms of daylight and energy. It was concluded that the Daylight Autonomy (DA) of the screened space was significantly higher than the 30% Window-to-Wall-Ratio spaces, almost as high as that of the un-shaded fully glazed space. Besides, the optimized screen reached a 35-40% reduction in annual energy use.
As can be seen, the previous works focused on different screen characteristics, but every characteristic was addressed separately in different tests. Findings from this type of approach could be limited since they omit the combined effects of changing all parameters together. More recently, Chi, Moreno, Esquivias and Navarro [12] proposed an optimization method named Design through Orthogonal Arrays (DOA) to analyse the simultaneous influence of several design characteristics of thin PS on annual daylight conditions. Through the DOA method, it was concluded that perforation ratios, distribution, shape of holes and orientation must be addressed simultaneously to increase the daylit area by 33% and to reduce the overlit area by 35%. In [13], the DOA method was also applied to investigate the thermal performance of thin PS. Four design characteristics were simultaneously evaluated, concluding that thin screens can achieve a 55% reduction in the total annual energy use. It should be emphasized that the two previous studies addressed flat screens, assuming a zero thickness.
Nevertheless, PS design parameters such as the distance between the glazing system and the inner face of the screen is also a prominent factor to enhance screen performance. A first overview [14] of the mentioned parameter showed that inter-reflections within the PS-glazing system constituted a large portion of the total irradiation falling on the glazing when a thin PS was placed 60 cm from the glazing. From the previous work, it was also found that inter-reflections within the PS-glazing system accounted from 5% to 16% of the total annual irradiation, so they should not be ignored when analyzing the energy performance of thin screens. From the finding, it can be inferred that light inter-reflections bouncing within the inner face of the screen holes as well as between the screen and glazing surface must not be disregarded. Yet, both distance and thickness are design parameters that remain as pending research tasks.
In brief, the literature review showed the usefulness of using PS in enhancing daylighting performance and reducing energy consumption. However, a limited number of studies addressed several characteristics of perforated screens at the same time. Besides, most of them were focused on daylight provision or on thermal performance, and only a few of them investigated both domains.
1.2. Metrics used for performance evaluation
Different metrics and indicators have been used to evaluate the daylighting and energy performance of PS. As regards the daylight evaluation, Climate-based daylight metrics seem to be the more confident indicators since Radiance is a validated software, widely used nowadays. Regarding the thermal performance, lighting and cooling energy demand were used as the principal energy indicators. However, EnergyPlus cannot deal, at present, with complex geometries within its energy calculation engine [15]. This situation has widely limited the study of the energy performance of complex shading systems.
Due to the fact that daylighting and solar radiation are largely related, both domains are often revised at the same time. As a result, solar shadings have also been evaluated in terms of their solar radiation transmission. This last indicator has been one of the most cited parameters driving shading control [16]. At present, there is a variety of parameters identified as primary to characterize the impact of choosing a given shading system and the related control pattern. The criteria were usually based on physical parameters, such as direct solar radiation, incident or transmitted solar radiation, global radiation, etc. [16,17]. A method to assess the solar shading performance was through the Shading Coefficient (SC), an index proposed by Garde [18]. This index allowed determination of the performance of the solar protection at glazing. In the end, SC was successfully linked to the solar radiation load inside the room.
Other studies have also evaluated the shading performance of different architectural devices. Cheng, Liao and Chou [19] analysed the shading effect of a horizontal-shading device and showed a correlation based on the shading ratio and SC, via the simulation of shading variables. After that, optimal designs and strategy regulations were chosen to enable more suitable utilization and peak effectiveness of shading device systems for energy-savings buildings. Perez et al. [20] evaluated the solar efficiency of solar shadings and the illuminance level at different points within a space. The experiment was successful thanks to the combination of the radiation models and the lighting raytracing method Radiance. Huang and Wu [21] used the SC index to investigate the daylighting and solar shading performance of splayed windows used in hot climates. Results from the cited study showed a strong positive correlation between the ratio of DA to SC and the incident solar radiation.
David, Donn, Garde and Lenoir [22] assessed the SC along with the Useful Daylight Illuminance (UDI) metric, to investigate the thermal and visual efficacy of different solar shadings in non-residential buildings. They concluded that all indices used in the investigation permit the comparison of the energy and the visual behavior of the case study under different sizing regimes of four types of solar shades. In the end, their comparison made obvious the choice and the sizing of specific solar shadings. Chi, Moreno and Navarro [23] showed that the UDI metric has a strong linear correlation with the total annual energy consumption, so UDI was considered a feasible metric and a proxy for overall building energy consumption. Furthermore, Mardaljevic, Andersen, Roy and Christoffersen [24], evaluated 8 European climates and 4 building orientations and determined that the UDI metric could serve as a proxy for the probability of daylight glare.
1.3. Objective of current research
This work aims to investigate and estimate, based on results from annual daylight and solar irradiance simulations, the daylighting and shading performance of thick PS used in front of fully glazed façades in office buildings. Five design characteristics of thick PS, which are usually specified during the first stages of the building design process, are revised simultaneously through a multi-factor analysis. The objective is to understand the statistical significance and the influence of varying all design parameters together. It should be pointed out that, at present, these parameters have not been systematically reviewed due to the complexity of addressing these types of studies that are time-consuming. Design criteria are therefore proposed to plan and to specify thick PS in three main orientations at a Mediterranean Climate.
2. Methodology
The setting for the study and the design parameters explored are described in this section together with an overview of the simulation setup and the performance metrics assessed.
2.1. Case building description
The case study is an office space with 49 m2 and 3 m in height, as shown in Fig. 1. It has a fully glazed façade with double-clear glazing with a 78.1% visual transmittance and a 60.4% solar transmittance. Reflectance and other characteristics of the case study are summarized in Table 1.
Figure 1
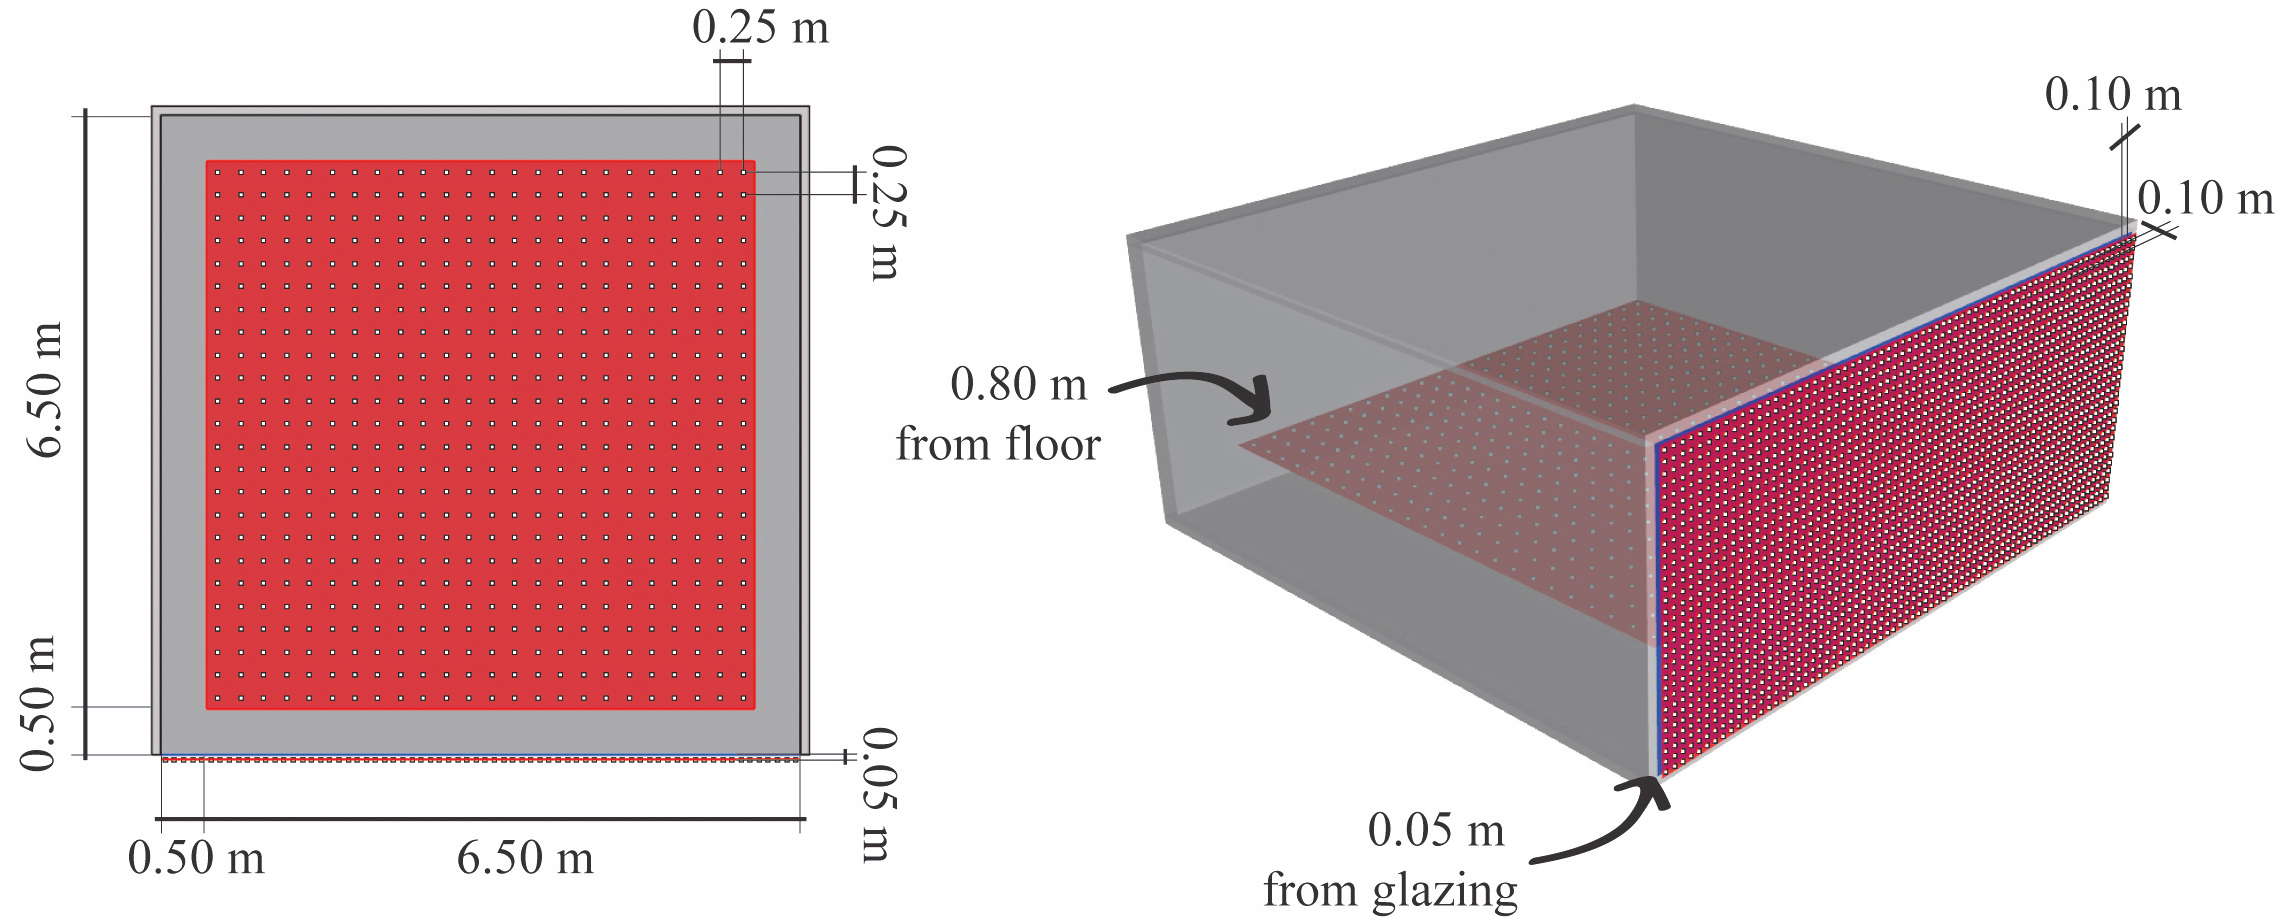
Fig. 1. Plan and perspective views of the case study. The calculation planes are highlighted in red.
Table 1
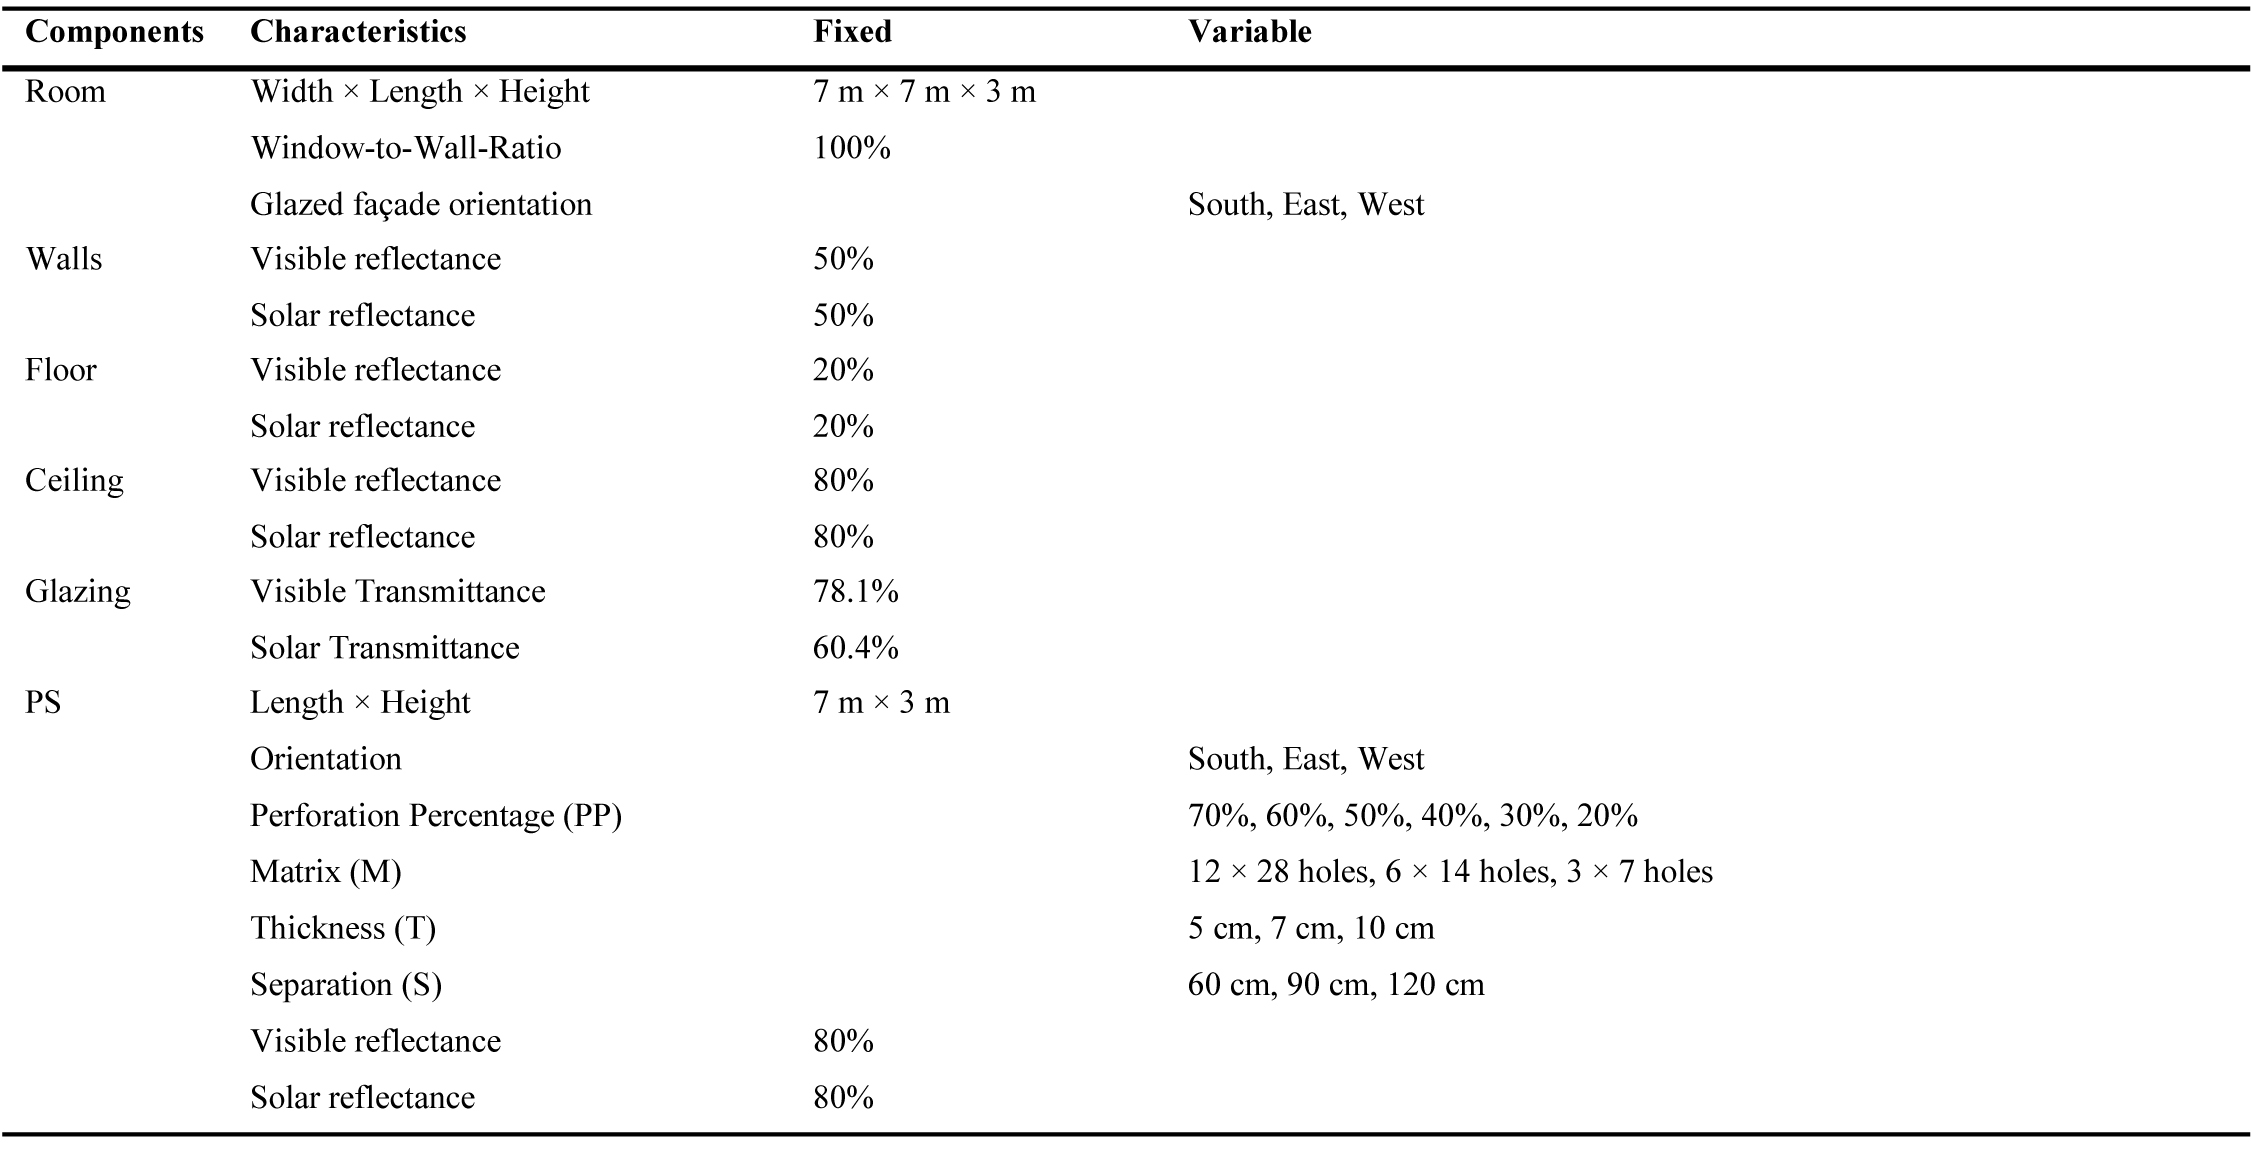
Table 1. Characteristics of the case study.
2.2. Parameters studied for perforated façade design
A thick PS is externally mounted in front of the fully glazed façade. Its dimensions are 7 m in length and 3 m in height. Material reflectance and other PS characteristics are summarized in Table 1. To understand the effect of thick PS design on both daylighting transmission and solar shading, certain parameters that are usually specified during the first stages of the building design process, are selected and examined in this study.
First, orientation is considered as the prominent parameter since it influences the amount of solar radiation received by building surfaces, and consequently, it determines the distribution and collection of solar radiation through windows and glazed façades. Then, the perforation ratio is also planned as a key because it directly impacts the amount of daylight transmitted through all screen holes. Similarly, the organization and distribution of the holes in the opaque part of a screen are relevant because they filter out incident direct sunlight. Besides, the organization of the holes is perceived as one of the parameters most regularly changed by designers. Then, the shape of the screen holes is disregarded for this experiment, since previous studies reported that the most common shapes used in flat PS (rounded, quadrangular, hexagonal, etc.) produced barely significant changes in the provision of daylight [12], and no significant variations in the energy performance [13].
Lastly, thickness and distance (between the screen and the glazing system) are considered indispensable since they determine the character of thick screens. Besides, these two parameters have not been systematically evaluated in other works as the literature review showed. In this work, thickness values are based on the width of the materials most commonly used in the manufacture and sale of thick panels and lattices for modern architectural market (e.g. composite, resins and brick). Besides, distance values are based on designers’ personal experience, as well as on the widths of the glazing-screen cavity most commonly built in office buildings, which are generally used for cleaning purposes or even as hallways or balconies.
In brief, the following five parameters for designing thick PS are evaluated, each taking different values:
- Orientation (O) refers to the position of the glazed façade with respect to the sun. South (S), West (W), and East (E) orientations were evaluated.
- Perforation Percentage (PP) represents the ratio of the total surface of the openings to the opaque surface. Six values were studied: 70%, 60%, 50%, 40%, 30%, and 20%.
- Matrix (M) represents the distribution of the holes (vertical×horizontal) on the lattice. Three different matrices were tested: 12×28, 6×14 and 3×7.
- Thickness (T) represents the width of the lattice. Three values were analysed: 10 cm, 7 cm and 3 cm.
- Distance (D) represents the distance between the inside surface of the lattice and the outside surface of the glazing system. Three distances were studied: 60 cm, 90 cm and 120 cm.
The simulation experiment involves a transverse comparison of the design parameters with respect to the performance of daylighting and solar irradiation. The order of importance and the significance of the factors are the focus of the study. Therefore, an orthogonal experiment design is employed, which uses only a fraction of all possible factorial combinations and can significantly reduce the number of experimental runs while providing detailed information for each factor [25]. The orthogonal array follows two properties: on each column, the number of occurrences is the same for each factor on different levels; the combination of factor levels is complete and balanced on every row. Therefore, all combinations are uniformly dispersed and regularly comparable [26]. In other words, any factor on any level is compared with all other factors on different levels. Here, it should be noticed that orthogonal arrays have been implemented in different investigations focused on optimizing window and building envelope design, passive strategies, construction processes, etc. These investigations concluded that orthogonal arrays are highly efficient in achieving the optimal combination of factor levels.
Taguchi and Yokohama [27] tabulated many standard orthogonal arrays that can be applied directly in planning the simulation cases. Figure 2 and Table 2 explain the L18 (61)(33) orthogonal array design selected for this experiment. It is used three times since three different orientations are tested in the experiment. PP, M, T and D are considered as experimental factors with different levels each: the first is assigned with six levels whereas the other parameters are ascribed with three levels each (refer to Fig. 2 and Table 2). Thus, from the full combination of factors and levels (that is to say, 6 PPlevels×3 Mlevels×3 Tlevels×3 Dlevels=162 PS configurations), only 18 combinations are required to analyse each particular orientation. Other specifications for the selected PS are summarized in Fig. 3, where each PS configuration is named by a red number ranging from 1 to 18, followed by a red letter representing the orientation: S to South, E to East and W to West. To sum up, 64 PS configurations (that is to say, 18 combinations from L18 (61)(33) × 3orientations) are required for the overall analysis and they effectively represent the all-486 possible combinations.
Figure 2
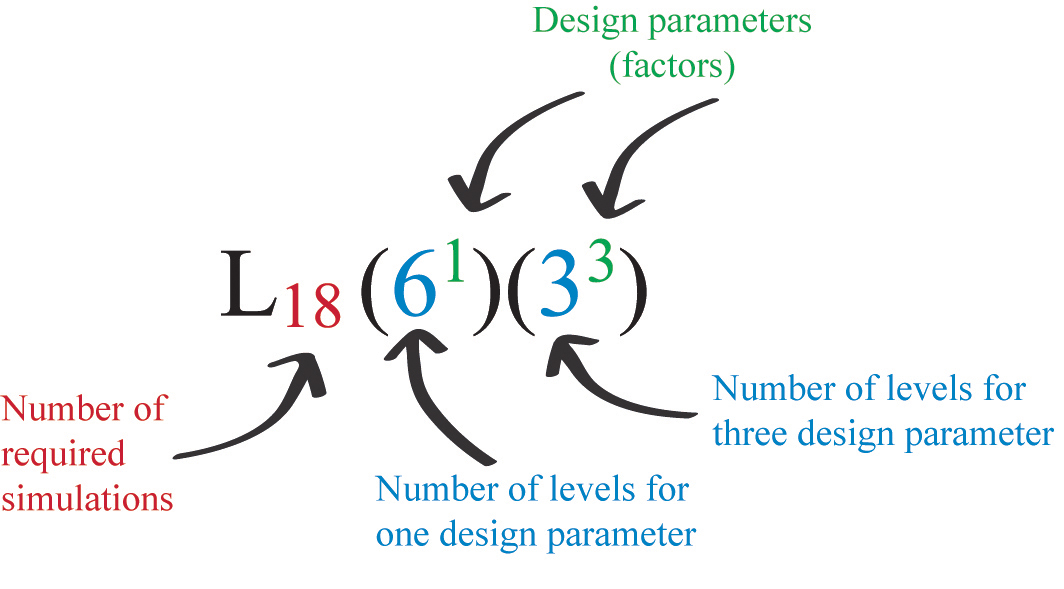
Fig. 2. Explanation of the orthogonal array design used in this study.
Table 2
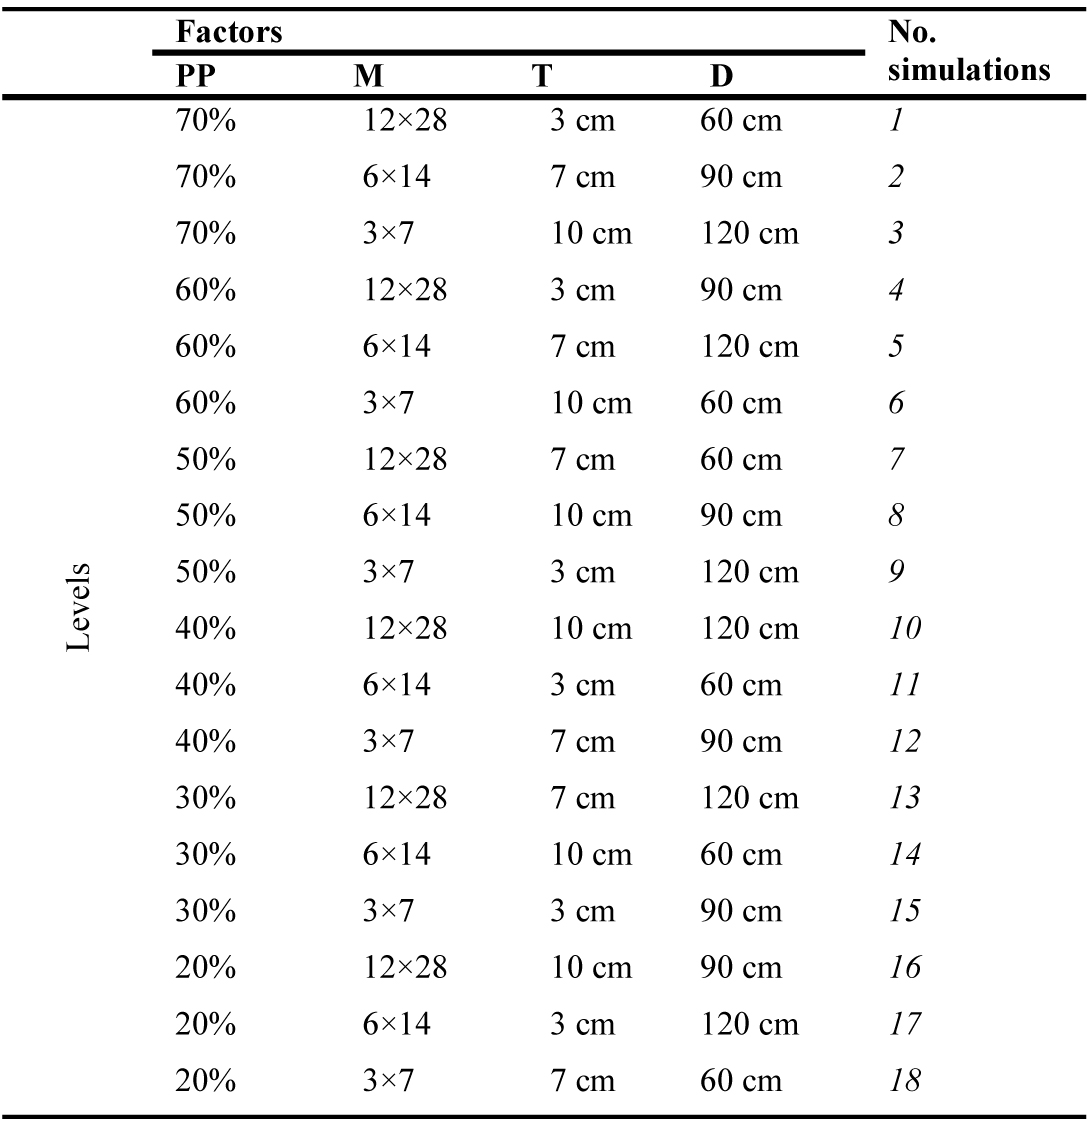
Table 2. L18 (61)(33) orthogonal experimental design: Factors and levels.
Figure 3
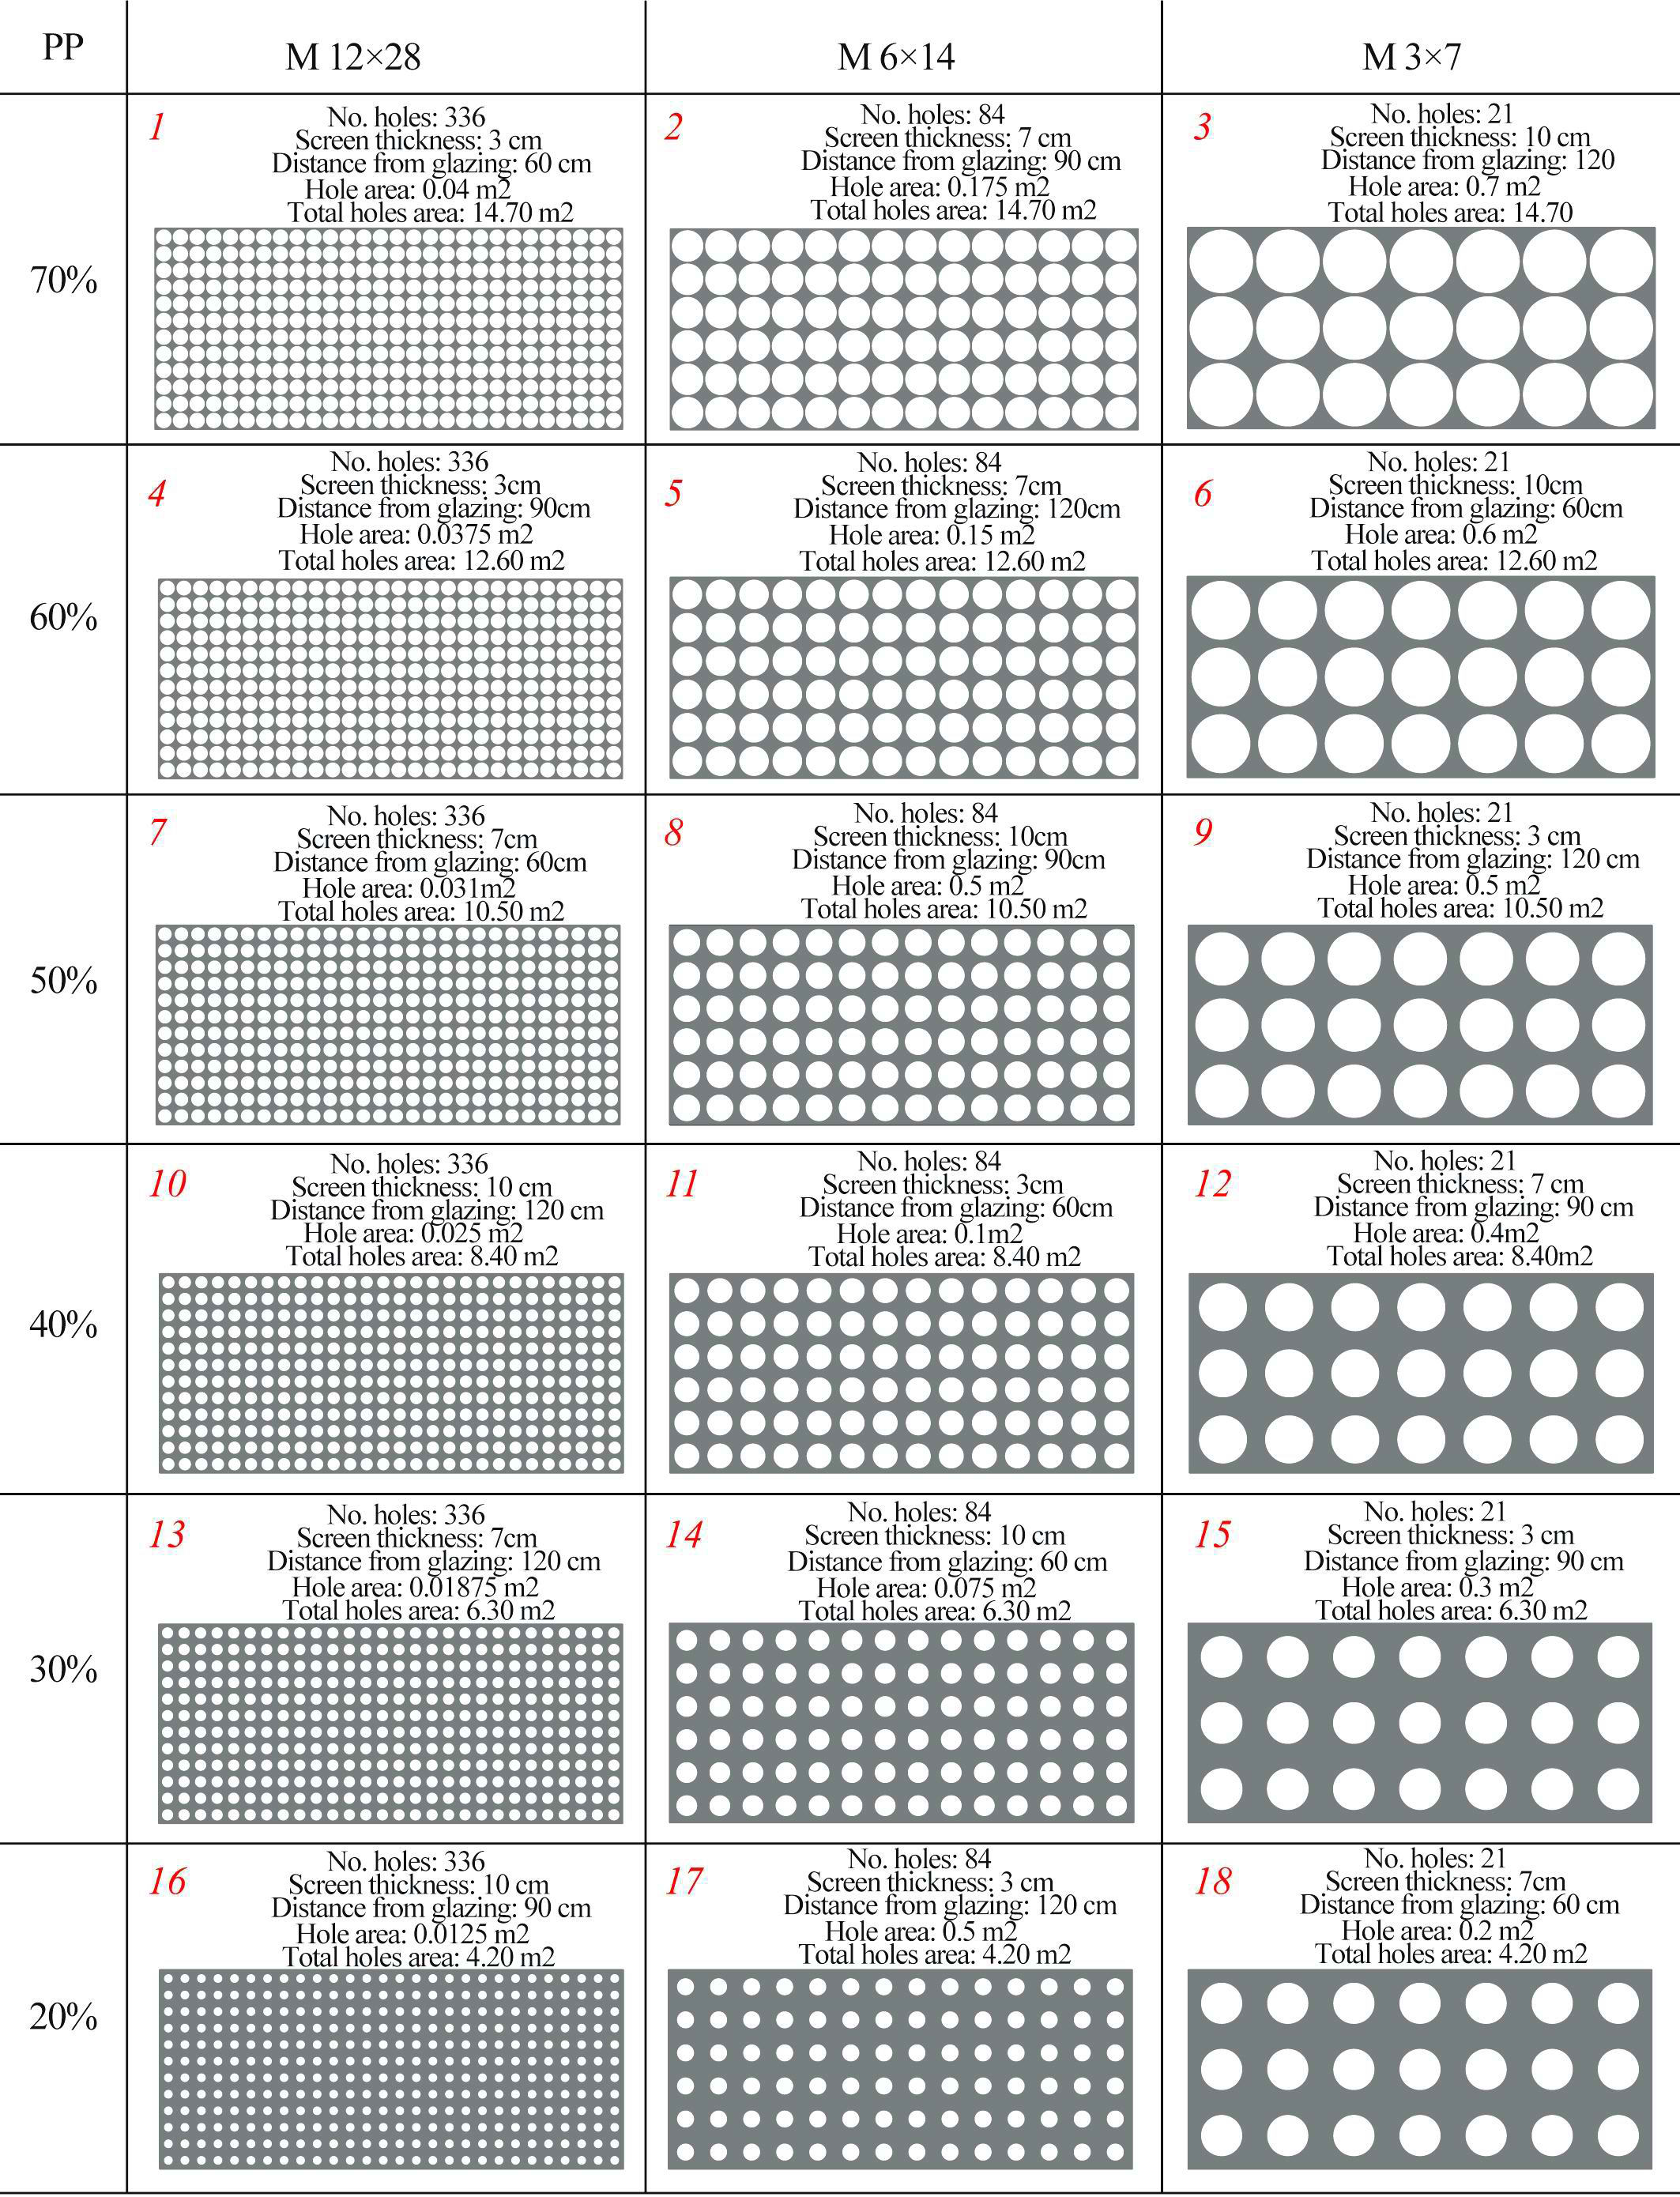
Fig. 3. PS configurations derived from the orthogonal array L18 (61)(33). The set of 18 PS is simulated three times, at: South (S), East (E) and West (W). Cursive red numbers represent every single configuration and the initial letter of the orientation will follow them, for example, 10E refers to the configuration number 10th facing towards East.
Once the selected 64 PS have been modelled and simulated, their results can be tested through Analysis of Means (ANOM) tests. The ANOM is a graphical that tests the equality of population means and displays both each factor level mean and the overall mean. It provides a confidence interval that allows determining which factor level has a mean significantly different from the overall average of all the factor levels combined. In this study, the ANOM is used to select the optimal level of each factor according to particular targets of the performance metrics, which are described in the next section. For more detailed information about the considered methods and the use of orthogonal arrays in the building design process, please refer to a more extensive evaluation by Chi [28].
2.3. Performance assessment metrics
Daylight quantity metrics, UDI and DAv, as well as shading performance metric, SC, which were obtained using dynamic annual simulations, are summarized below. Furthermore, an index proposed to evaluate the dual performance of perforated façades is also specified in this section.
2.3.1. Useful daylight illuminance (UDI)
UDI is founded on a measure of how often in the year daylight illuminances within a range are achieved. Thus, UDI expresses the percentage of the occupied hours when daylight levels on the horizontal working plane fall within certain ranges that define the UDI bins [29]. In this work, the following ranges are considered:
- UDI<150 lx to represent the portion of time during which the illuminance is non-sufficient.
- UDI 150-300 lx to show the transition time between non-useful range and useful range.
- UDI 300-3000 lx to define the portion in which the daylight is autonomous for the task.
- UDI >3000 lx to represent the times in which the daylight might be excessive, causing overheating or glare problems [23,24].
2.3.2. Actual daylight availability (DAv)
This metric divides the horizontal working plane into four areas lit exclusively with appropriate daylight illuminance levels, as it is expressed below:
- Nondaylit area represents the portion of the working plane that accounts UDI<150 lx for at least 50% of the working year.
- Actual partially daylit area shows the transition area between the nondaylit and fully daylit areas. It is also used to start accounting for the subjective nature of light evaluations of spaces [30]. In this study, it includes the illuminances within 150-300 lx when they do not reach the time percentages for either the nondaylit or fully daylit areas.
- Actual fully daylit area represents the portion of the working plane that meets UDI 300-3000 lx during at least 50% of the occupied hours plus UDI>3000 lx for less than 5%.
- Overlit area shows the area that accounts UDI>3000 lx for at least 5% of the working year.
2.3.3. Solar shading coefficient (SC)
SC is used to represent the solar shading performance over a glazing. It is the ratio of the solar radiation that impacts the glazing with and without the use of solar shading; the closer the SC to 0, the more effective the solar protection is [18]. In this work, SC is calculated for every hour over the year and is the ratio of the solar radiation falling on the vertical grid with and without PS (refer to Fig. 1). Each hourly SC considers the mean across all sensors in the grid. Then, 8760 hourly SC are averaged to get an annual SC.
2.3.4. Ratio of DAvfully to SC (RDAVfully/SC)
The ratio of the actual fully daylit area (DAvfully) to the annual SC is proposed as an index of both solar shading and daylighting performance of thick perforated façades. Then, a high value of the actual fully daylit area corresponds to better daylighting performance, and a lower value of SC corresponds to better solar shading performance. Thus, high values of this index represent better integrated performance of solar shading and daylighting.
2.4. Simulation setup
The case study described in Fig. 1 and the PS configurations detailed in Fig. 3 are explicitly modelled in Rhinoceros. Then, daylight and irradiance simulations are performed in a 2-step process by using Radiance-based software DIVA-for Grasshopper. The workflow is summarized in Fig. 4 and explained in more detail below.
- First step involves annual daylight calculations on a horizontal plane placed 0.80 m above ground level, with 576 sensors placed 0.25 m apart and 0.50 m from walls (refer to Fig. 1). The occupancy profile corresponds to working hours from 8:00 to 18:00 h with Daylight Saving Time (DST). Every PS configuration required a specific daylight simulation that gets its annual illuminance profile (*.xlsx) containing the hourly illuminances for all the sensors. This file is then processed mathematically to account for the four UDI bins (%) and the four DAv areas (%).
- Second step involves annual solar irradiation simulations with the DAYSIM-based hourly method, which is embedded in DIVA-for-Grasshopper. The irradiances are calculated on a vertical plane placed 0.05 m in front of the glazing system, with 2100 sensors placed 0.10 m apart (refer to Fig. 1). For every PS configuration, two irradiance simulations are required: the model with PS in place and the model without PS. The two resulting irradiance profiles (*.csv) are then processed mathematically to obtain the SC value, that is to say, the yearly average ratio of the irradiation falling on the vertical grid with and without PS.
Figure 4
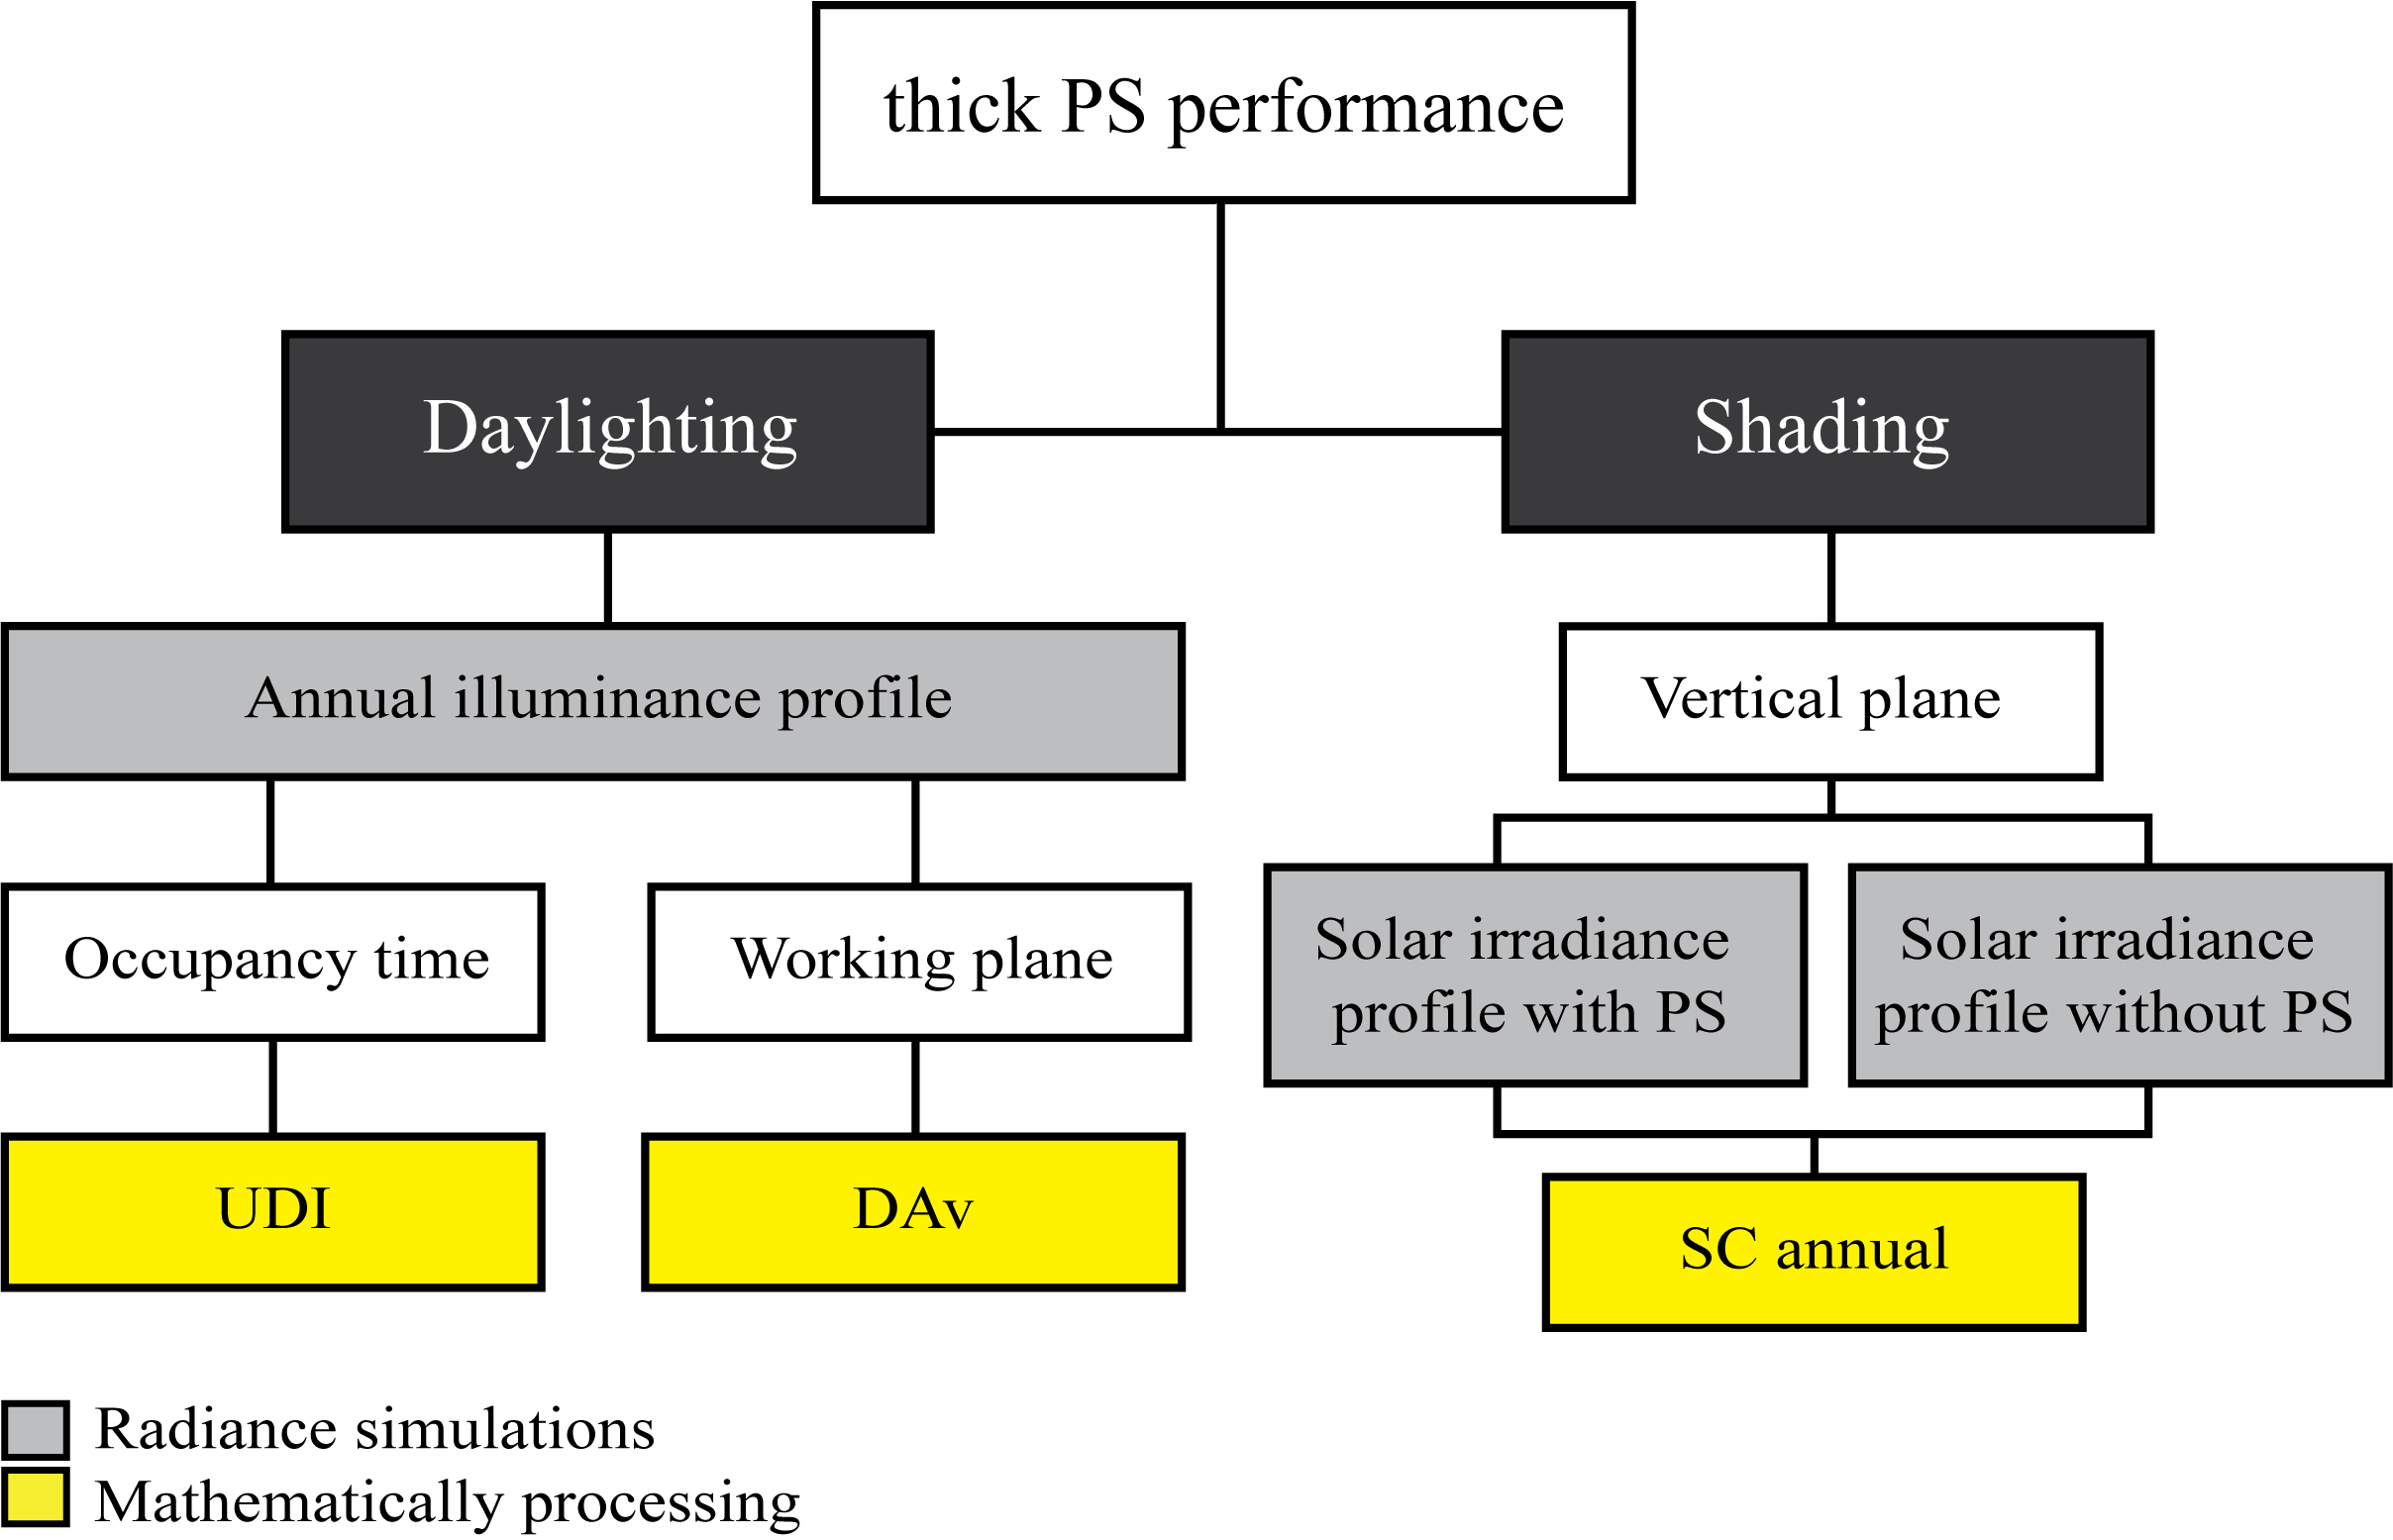
Fig. 4. Workflow for predicting the daylighting and shading performance of thick PS.
A convergence test, that is to say, a calibration of the Radiance ambient settings was previously run to define the ambient parameters used for the PS simulations: -aa .1 -ab 5 -ad 4096 -ar 128 -as 256 -dr 2 -ds .2 -lr 12 -lw .004 -dj 0 -lr 6 -sj 1 -st 0.15. A general procedure to calibrate the Radiance parameters can be found in [31]. The weather file used is the EPW for Seville, Spain
3. Results
This section presents the daylighting and shading performance metrics obtained from the simulations. First, the main effects of all design parameters are transversally evaluated through the three L18 (61)(33) orthogonal arrays (Sections 3.1, 3.2, 3.3 and 3.4). Then, the effects of every design parameter are tested in relation to the case study with no PS, to understand their particular influence on PS performance (Section 3.5). The findings drawn from this analysis are presented in the following ‘Summary and Discussion’ section.
3.1. Daylight during the occupancy time: UDI
Figure 5 shows the simulation results for all UDI bins. As can be seen, most PS configurations achieve significant improvements over the case study with a fully glazed façade (R). For instance, South facing PS numbered from 1 to 9, 11 and 12 provide illuminances between 300 lx and 3000 lx during more than 70% of working hours, and illuminances over 3000 lx during less than 20% of occupied hours. Similarly, East and West facing PS numbered from 1 to 6, and 9 achieve autonomous illuminances during more than 70% of the occupancy time. Furthermore, the mentioned East facing PS get less than 16% of working year with excessive illuminances while the cited West facing PS achieve less than 9%.
Figure 5
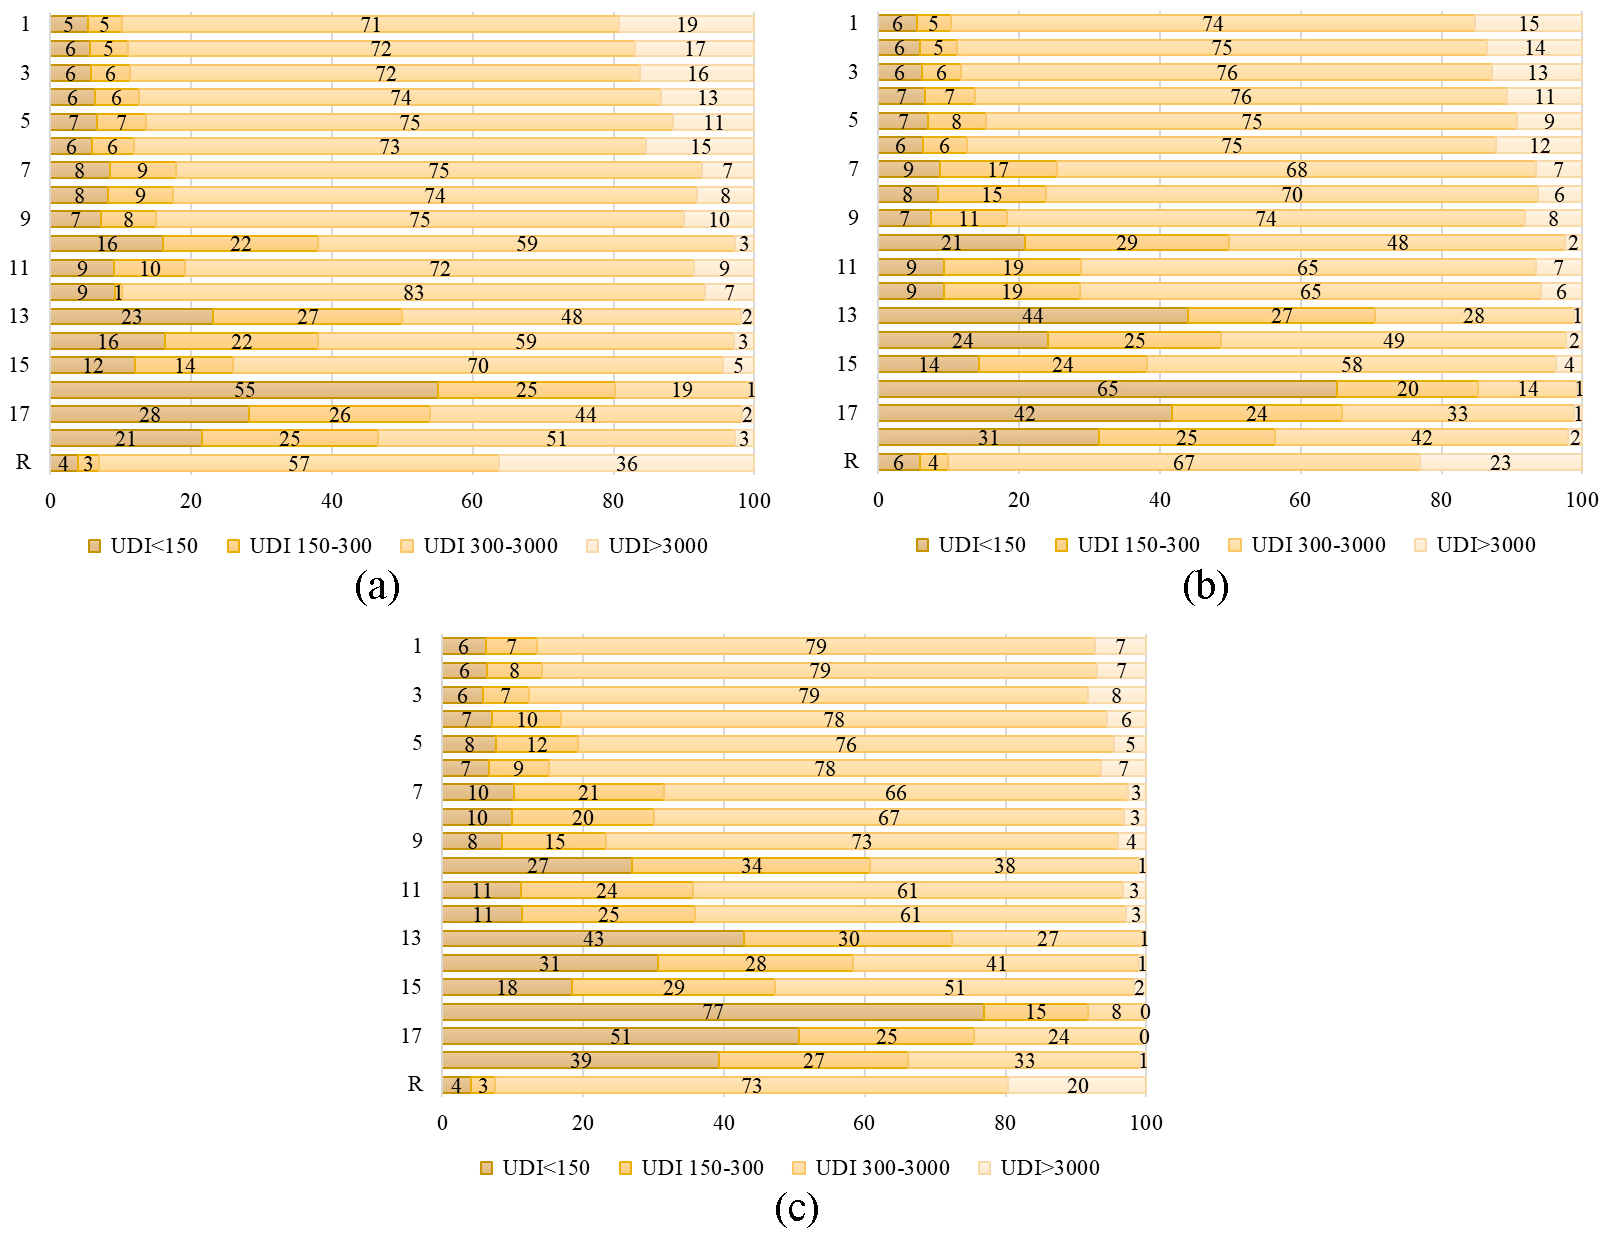
Fig. 5. UDI results from daylight simulations (a) South, (b) East, and (c) West. All four bins are reported with different colour hues. Numbers in the vertical axis refer to the PS numeration in Fig. 3. R refers to the case study facing towards a specific orientation.
To better understand the influence of every factor level in the improvement of daylight throughout the year, the ANOM of the L18 (61)(33) orthogonal arrays are performed below. Figure 6 displays each factor level mean for all four UDI bins at South (a), East (b) and West (c). It also shows the overall mean of UDI 300-3000 lx (with a red dashed line), that henceforth is established as the ‘occupancy target’ for the optimal factor levels at every orientation. For South and East facing PS, the overall means are 65% and 59% of the occupied hours, respectively. Thus, the optimal factor levels for these two orientations are those that reach the reported mean percentages: PP 40-70%, M 3×7 and 6×14, T 3-7 cm and D 60-90 cm. As regards the overall mean for West facing PS, it is 57% and the optimal factor levels are therefore the following: PP 50-70%, M 3×7 and 6×14, T 3-7 cm and D 60-90 cm.
Figure 6
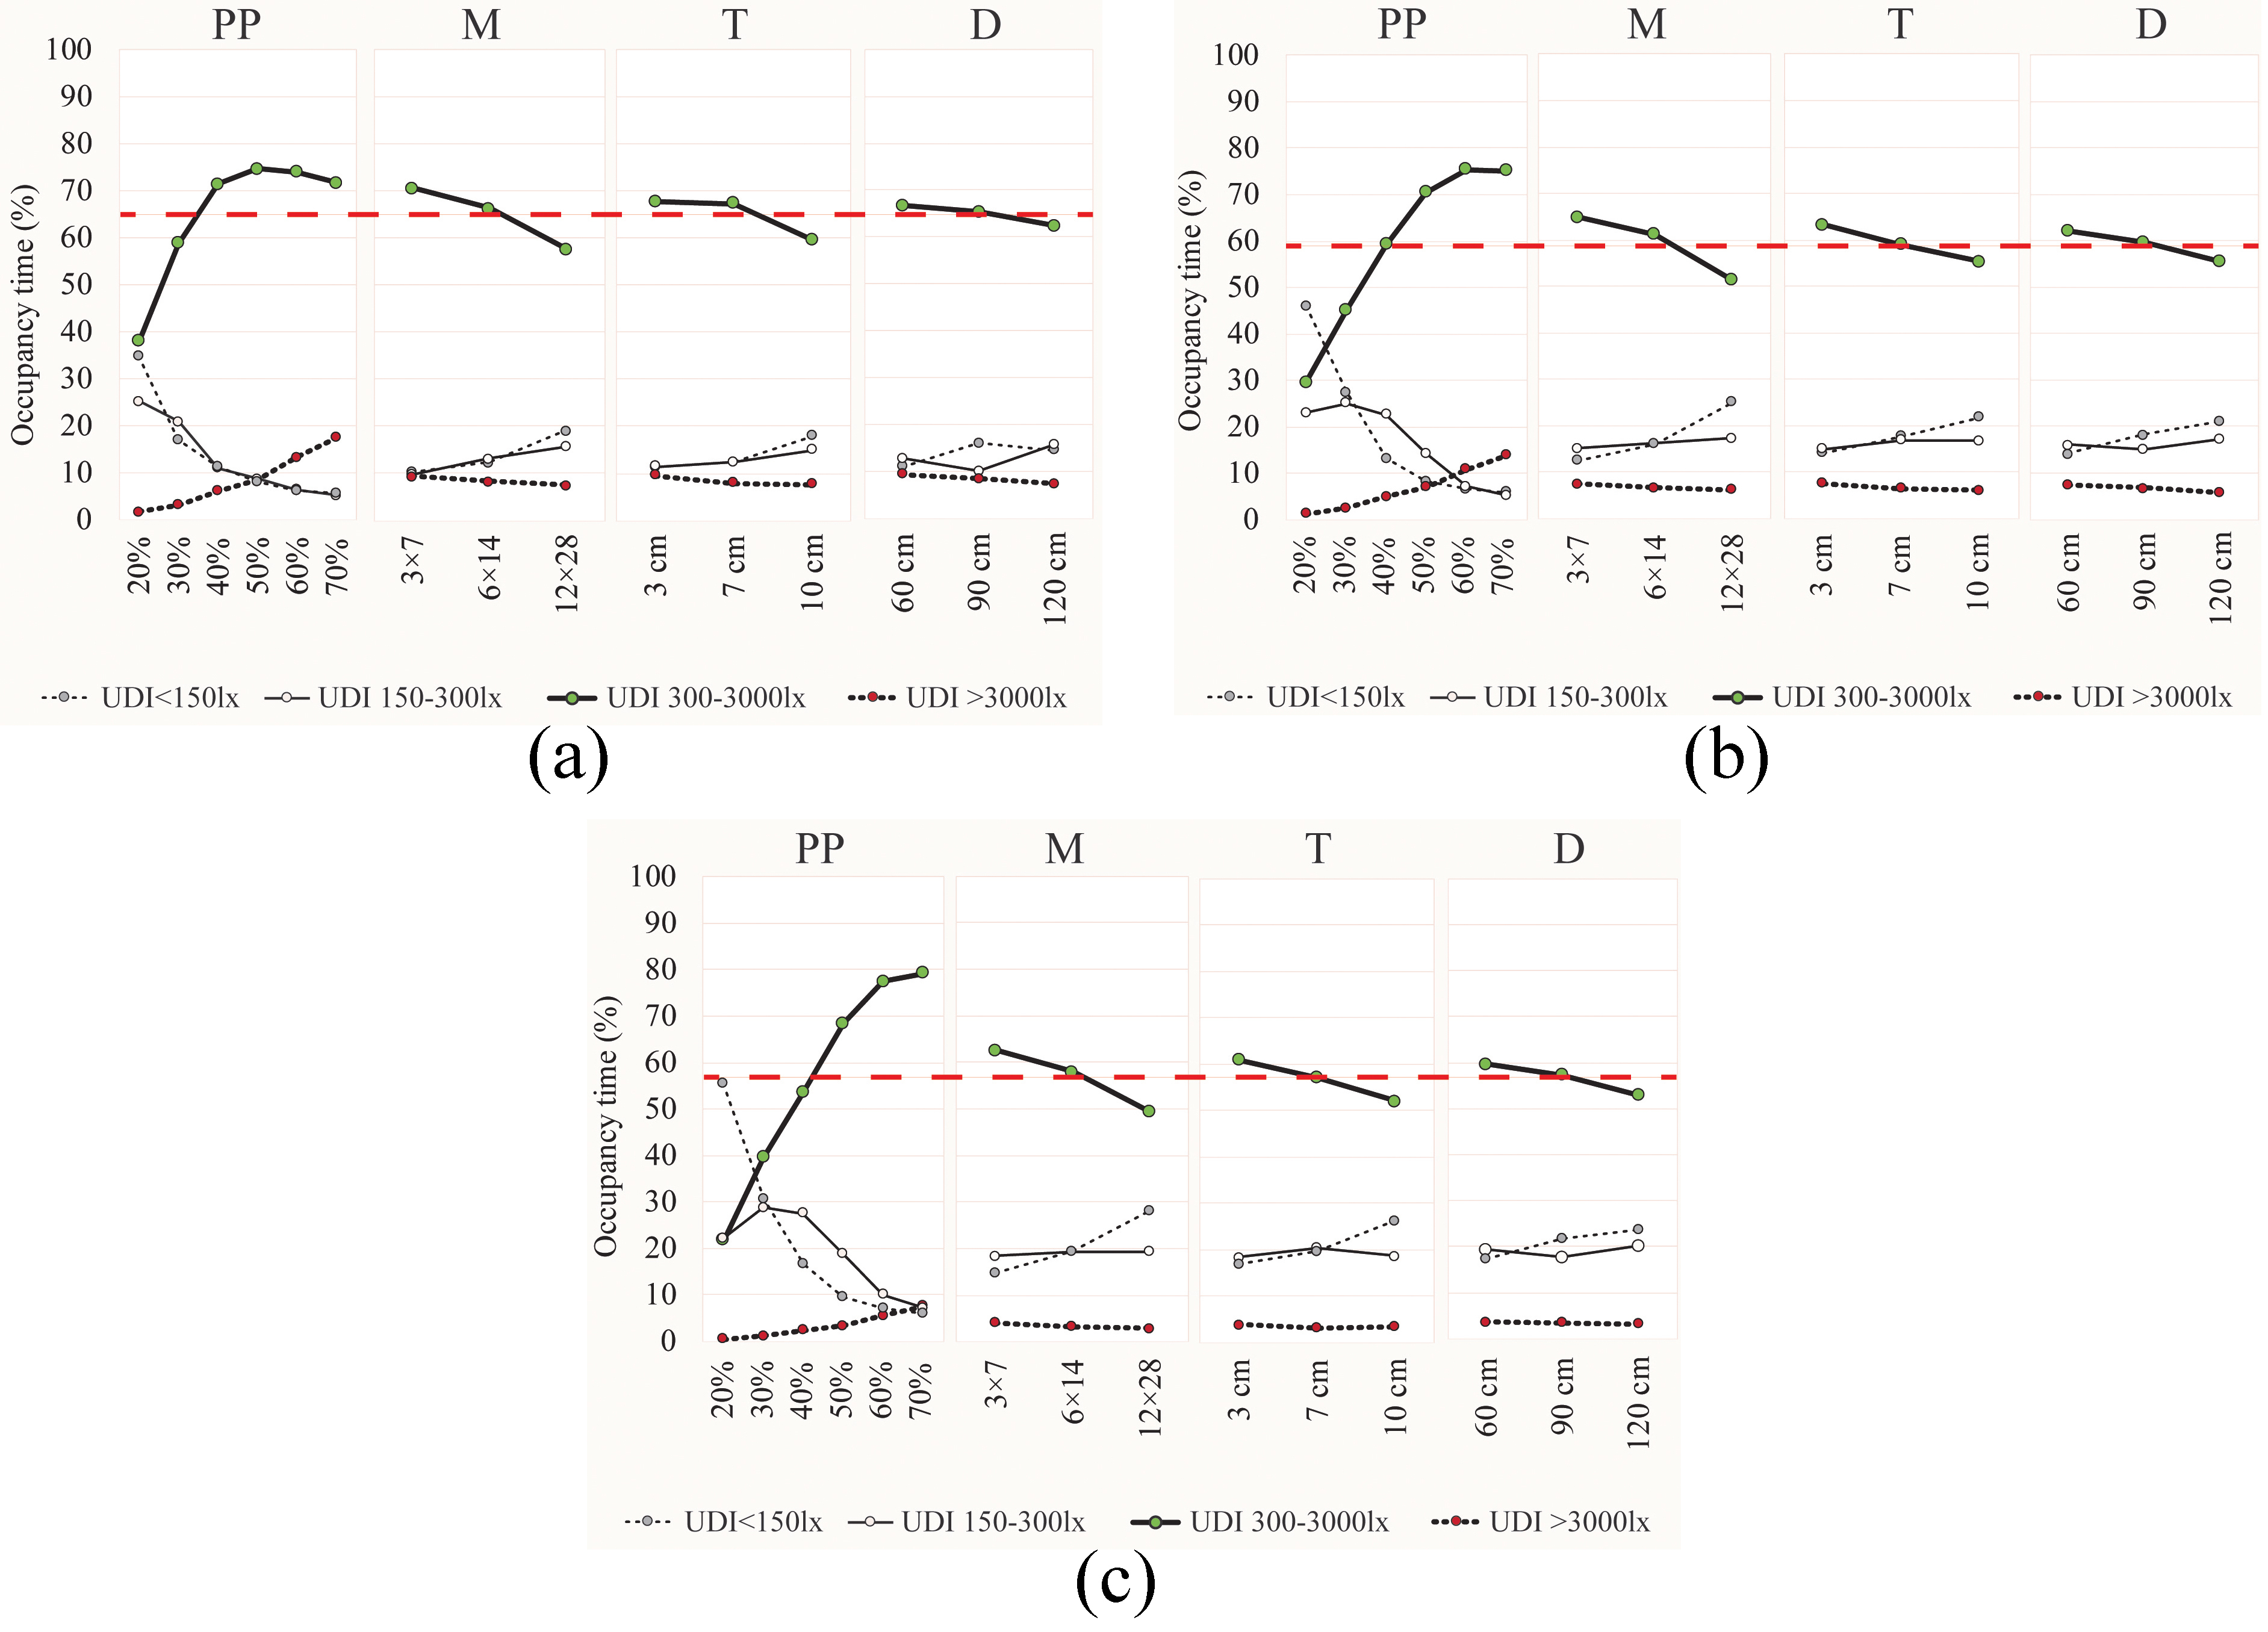
Fig. 6. Main effects plot for UDI means (a) South, (b) East, and (c) West. The red dashed line shows the overall mean of UDI 300-3000 lx at every orientation.
3.2. Daylight on the working plane: DAv
Figure 7 summarizes the simulation results for all four areas in the DAv metric. In comparison to the case study (R), some PS get better results due to the fully daylit area increase and the overlit area reduction. However, some specific PS get worst results since they considerably increase the nondaylit and partially daylit areas. Hence, the ANOM is helpful to understand each factor level effect on the DAv areas.
Figure 7
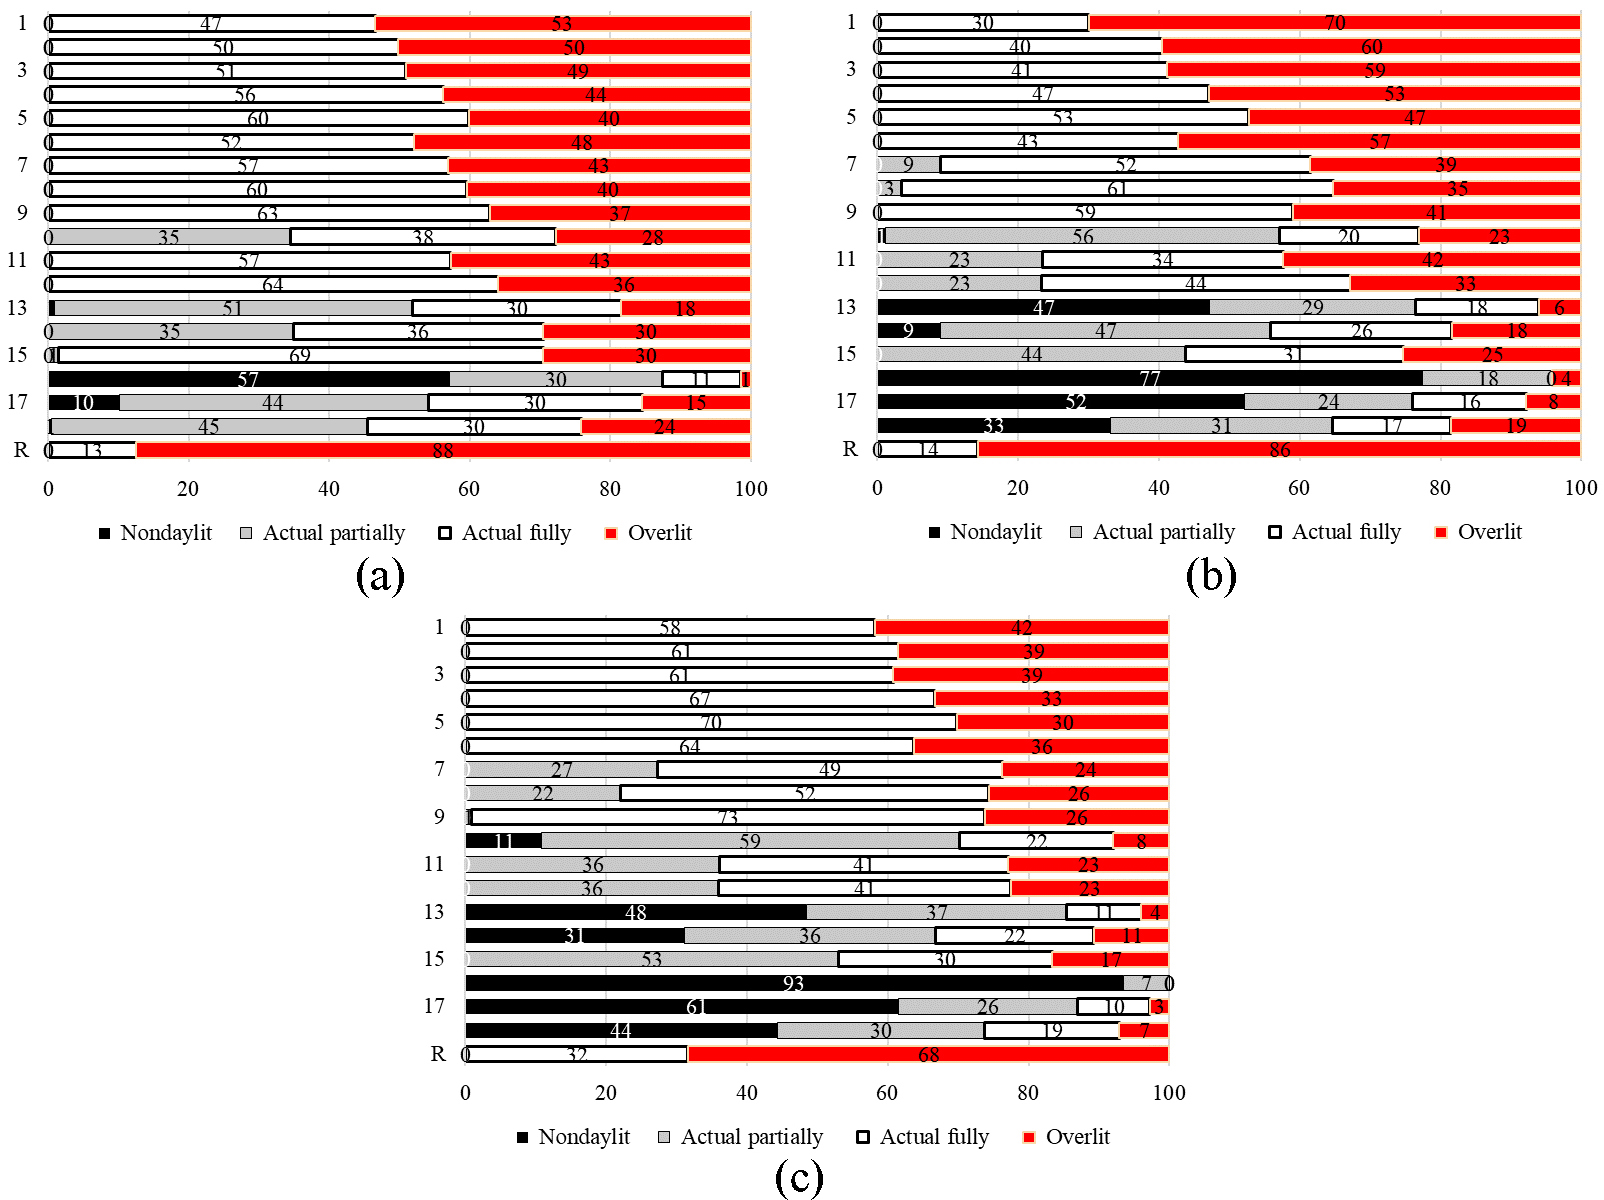
Fig. 7. DAv results from daylight simulations (a) South, (b) East, and (c) West. Numbers in the vertical axis refer to the PS numeration in Fig. 3. R refers to the case study facing towards a specific orientation.
The main effects of the ANOM of the L18 (61)(33) are summarized below. Figure 8 displays each factor level mean for all four DAv areas at South (a), East (b) and West (c). It also shows the overall mean of the actual fully daylit area (with a long red dashed line), that henceforth is established as the ‘workplane target’ for the optimal factor levels at every orientation. For South facing PS, the overall mean is 48% of the working plane, so the optimal factor levels at South are those that exceed that percentage.
Figure 8
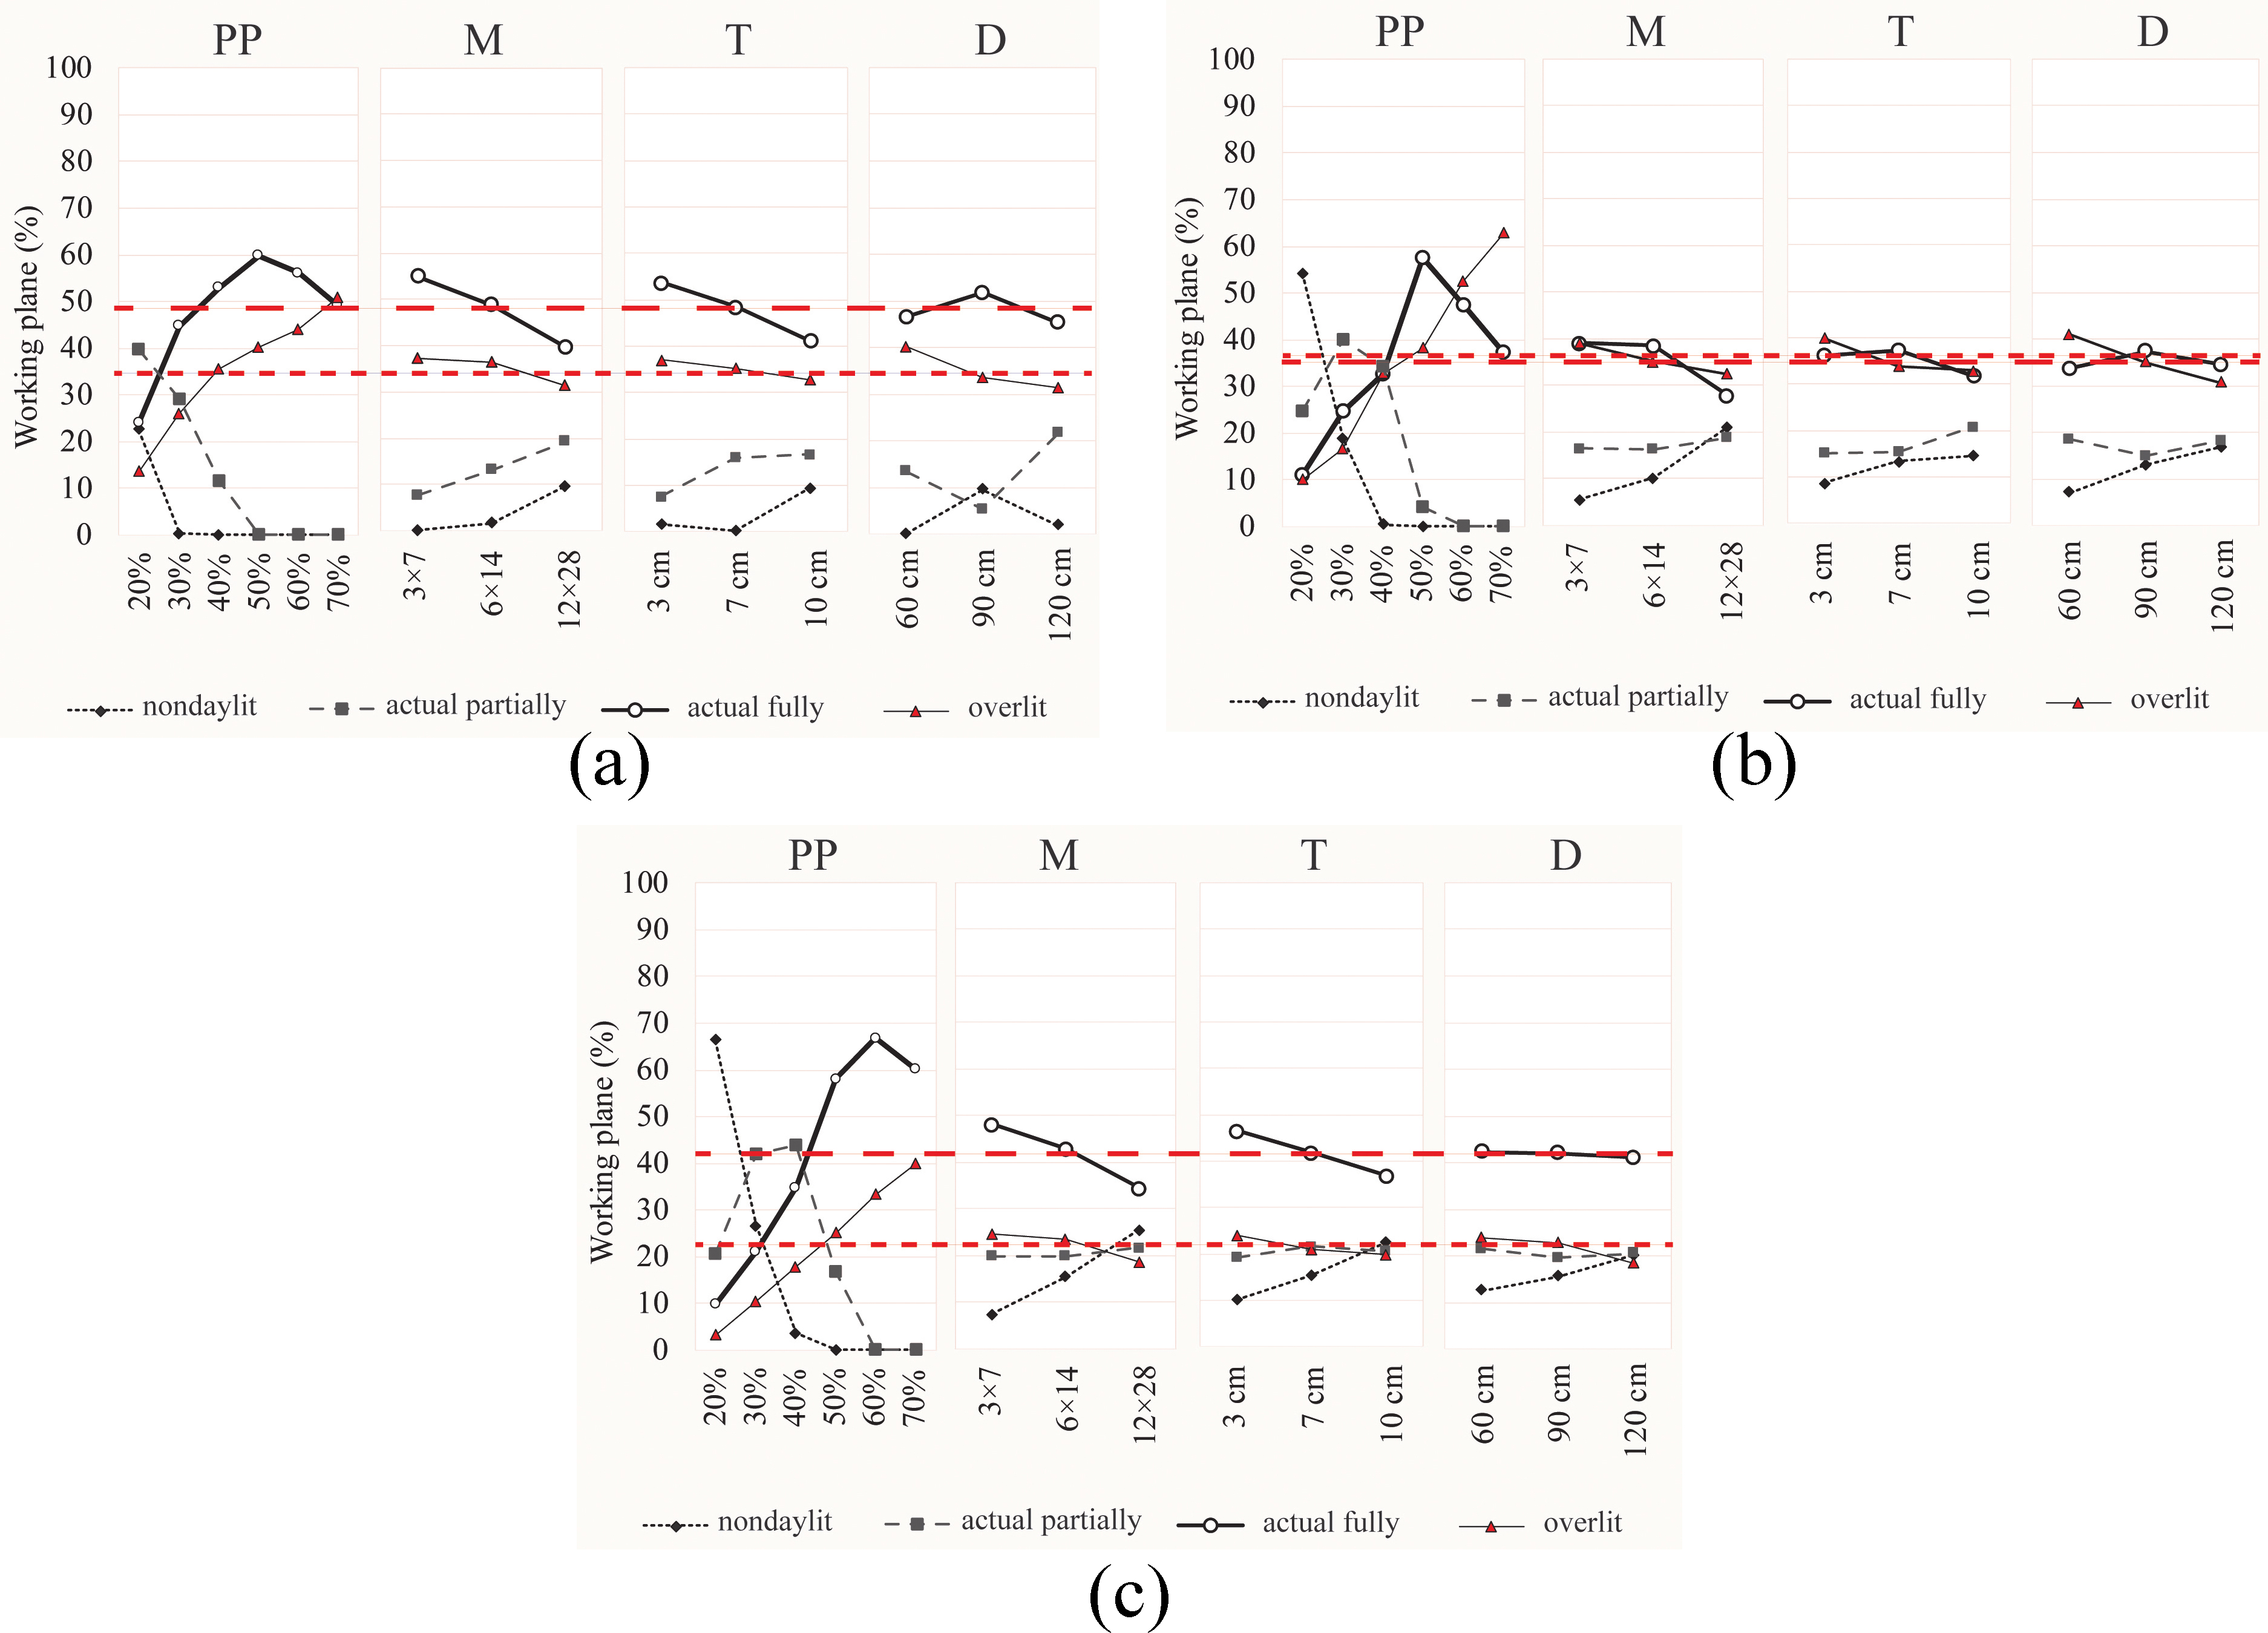
Fig. 8. Main effects plot for DAv means (a) South, (b) East, and (c) West. The long red dashed line shows the overall mean of the actual fully daylit area at every orientation. The short red dashed line shows the overall mean of the overlit area at every orientation.
From highest to lowest, the optimal PS at South are: PP 50%, 60%, 40% and 70%; M 3×7 and 6×14; T 3 cm and 7 cm; D 90 cm. As regards East facing PS, the overall mean is 35% for the actual fully daylit area, so the optimal factor levels are those that exceed that percentage in the following order: PP 50%, 60% and 70%; M 3×7 and 6×14; T 7 cm and 3 cm; D 90 cm. Regarding the West facing PS, the overall mean for the target metric is 42%, so the optimal factor levels are sorted in descending order: PP 60%, 70% and 50%; M 3×7 and 6×14; T 3 cm and 7 cm; D 60 cm and 90 cm. It should be noticed that the relationship between the fully daylit area and PP is curvilinear at the three orientations. Moreover, the relationships between the fully daylit area and M, T or D are weak negative at the three orientations.
Figure 8 also displays the overall mean of the overlit area (with a short red dashed line), that is established as the ‘daylight limit’ on the working plane which should not be exceeded because an oversupply of daylight might lead to visual and/or thermal discomfort [24,32]. Accordingly, the optimal levels of every factor can be depicted. For South facing PS, the overall mean for the overlit area is 35%, thus the following levels below this percentage are considered as optimal: PP 20-30%, M 12×28, T 10 cm and D 120-90 cm. Regarding East facing PS, the target limit is 36%, so the optimal factor levels are sorted as follows: PP 20-40%, M 6×14 and 12×28, T 7-10 cm and D 120-90 cm. For West facing PS, the overall mean is 22%, thus factor levels under that limit are chosen as optimal: PP 20-40%, M 12×28, T 7-10 cm and D 120 cm.
3.3. Shading performance
To explore the shading performance through thick PS, SC for the 64 PS configurations from the three L18 (61)(33) orthogonal arrays (each array for each orientation) are plotted on a radar chart, as shown in Fig. 9. As can be seen, South facing PS get the most effective solar protection since SC is closer to zero in all South cases. It is also observed that East and West facing PS have very close SC values between their corresponding PS.
Figure 9
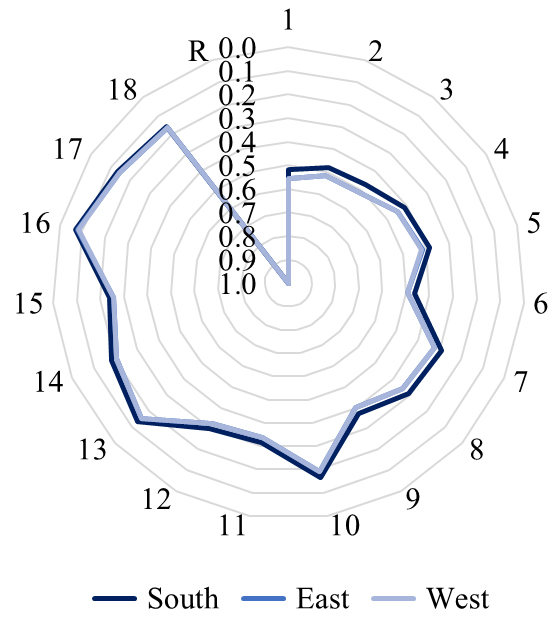
Fig. 9. Annual Shading Coefficient (SC) resulted from irradiance calculations at the vertical plane. All three orientations are reported with different colour hues. Numbers in the perimeter reference line refer to the PS numeration in Fig. 3.
Furthermore, it is clear that some PS configurations get better performance. Hence, the ANOM in Fig. 10 displays the influence of each factor level on SC at every orientation. It also shows the overall mean of the annual SC (with a red dashed line), which is established as the ‘shading limit’ to select the optimal factor levels at every orientation. Therefore, all PS configurations that get less than this limit are considered optimal since low SC values represent better shading performance. For South facing PS, the overall mean for SC is 0.30 while the overall mean for both East and West facing PS is 0.33. Consequently, the optimal levels that do not exceed the shading limits are PP 20-40%, M 12×28, T 7-10 cm and D 120 cm.
Figure 10
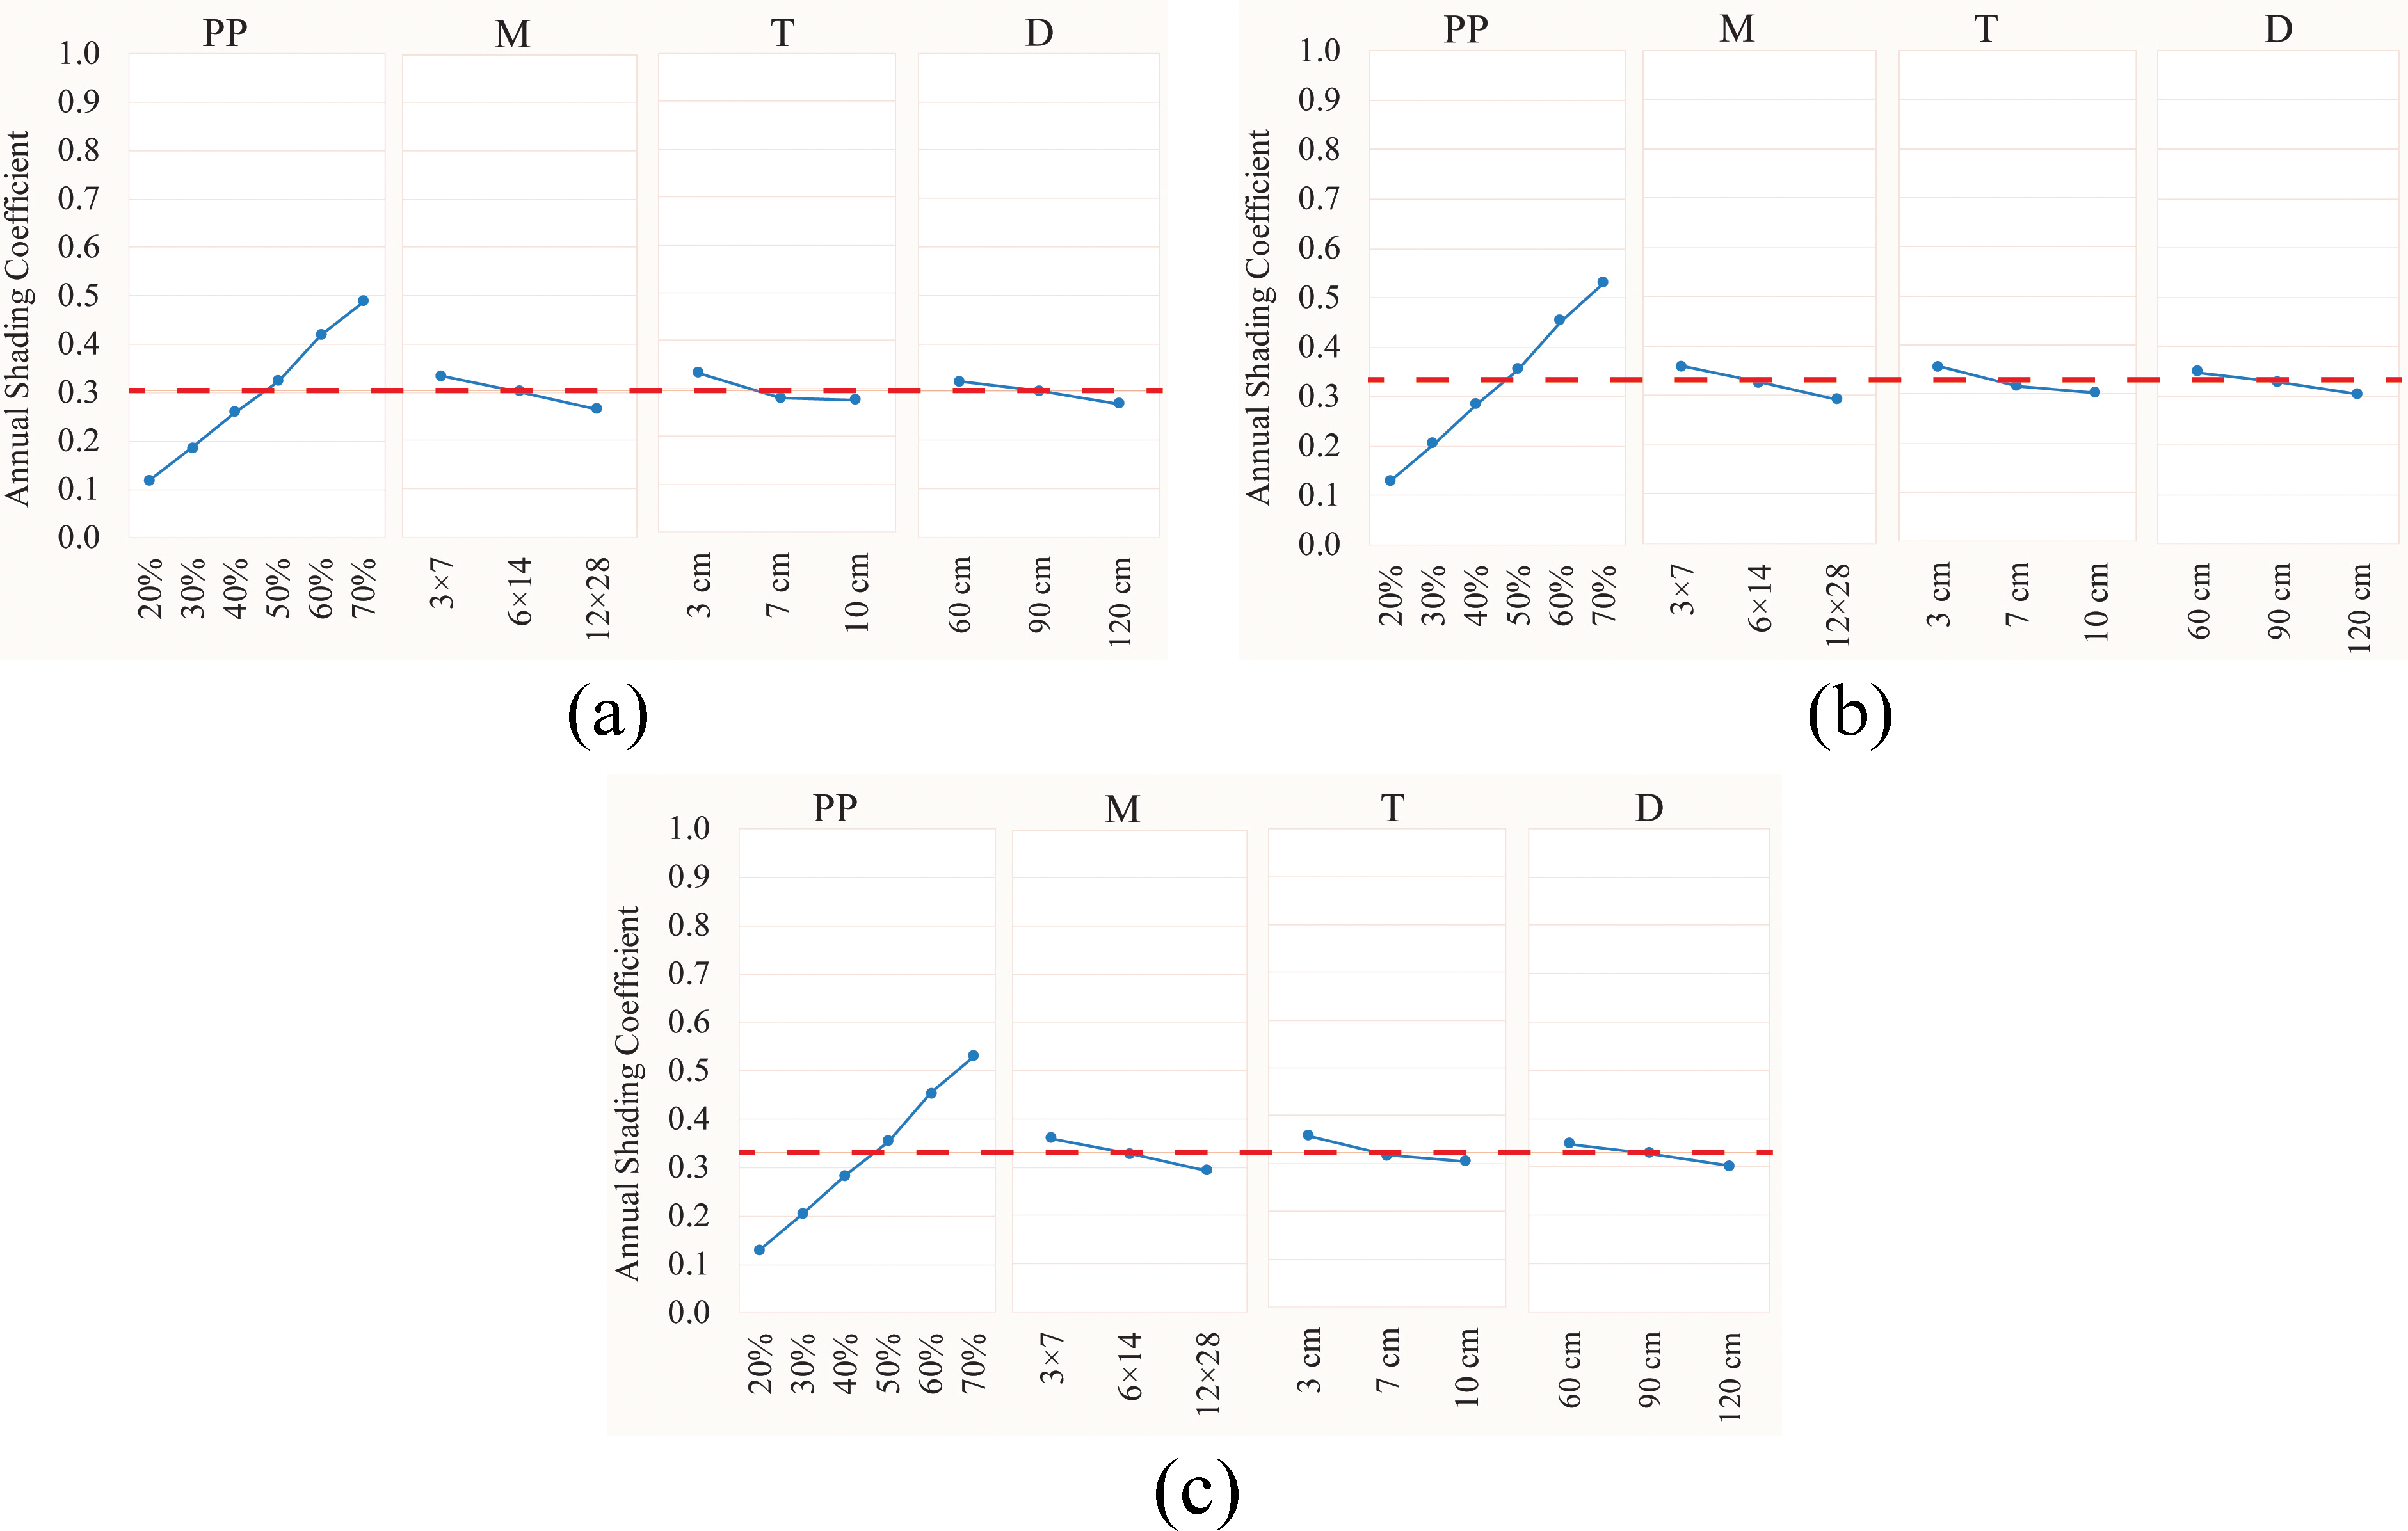
Fig. 10. Main effects plot for SC means (a) South, (b) East, and (c) West. The red dashed line shows the overall mean of annual SC at every orientation.
3.4. Integrated performance: Ratio of DAvfully to SC
To understand the integrated performance of PS in terms of daylighting and solar shading, RDAVfully/SC values for the 64 PS configurations are plotted in a radar chart, as shown in Fig. 11. Since high values of this ratio represent better integrated performance of thick PS, it is clear that some configurations are more suitable.
Figure 11
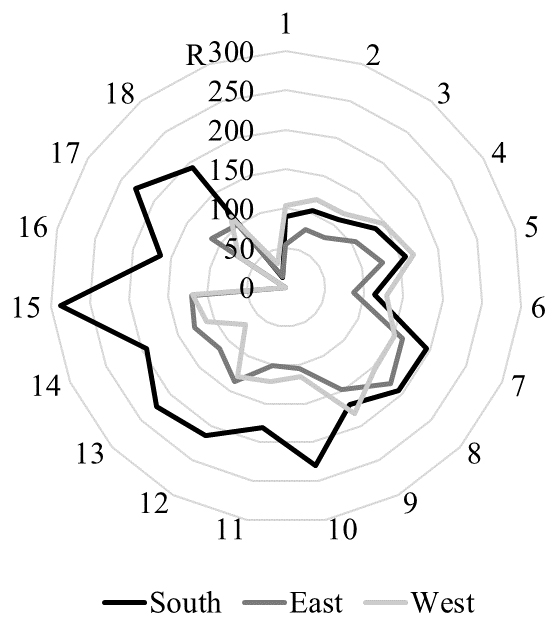
Fig. 11. Ratio of DAvfully to SC. All three orientations are reported with different colour hues. Numbers in the perimeter reference line refer to the PS numeration in Fig. 3.
The ANOM in Fig. 12 displays each factor level mean for RDAVfully/SC values at South (a), East (b) and West (c). Figure 12 also shows the overall mean of RDAVfully/SC (with a red dashed line), that henceforth is established as the ‘integrated performance target’ for the optimal factor levels at the three orientations. In the case of South facing PS, the overall mean for the target is 177. Thus, levels rising this percentage can be considered optimal. From highest to lowest, the optimal PS at South are the following: PP 30%, 40%, 20% and 50%; M 3×7; T 3 cm and 7 cm; D 120 cm and 90 cm. Regarding East facing PS, the overall mean is 108 for RDAVfully/SC, so the optimal factor levels are those that exceed that percentage in the following order: PP 50%, 30% and 40%; M 6×14 and 3×7; T 7 cm; D 90 cm. As regards West facing PS, the overall mean for the target metric is 118, so the optimal factor levels are sorted as follows: PP 50%, 60% and 40%; M 3×7 and 6×14; T 3 cm and 7 cm; D 60 cm and 120 cm.
Figure 12
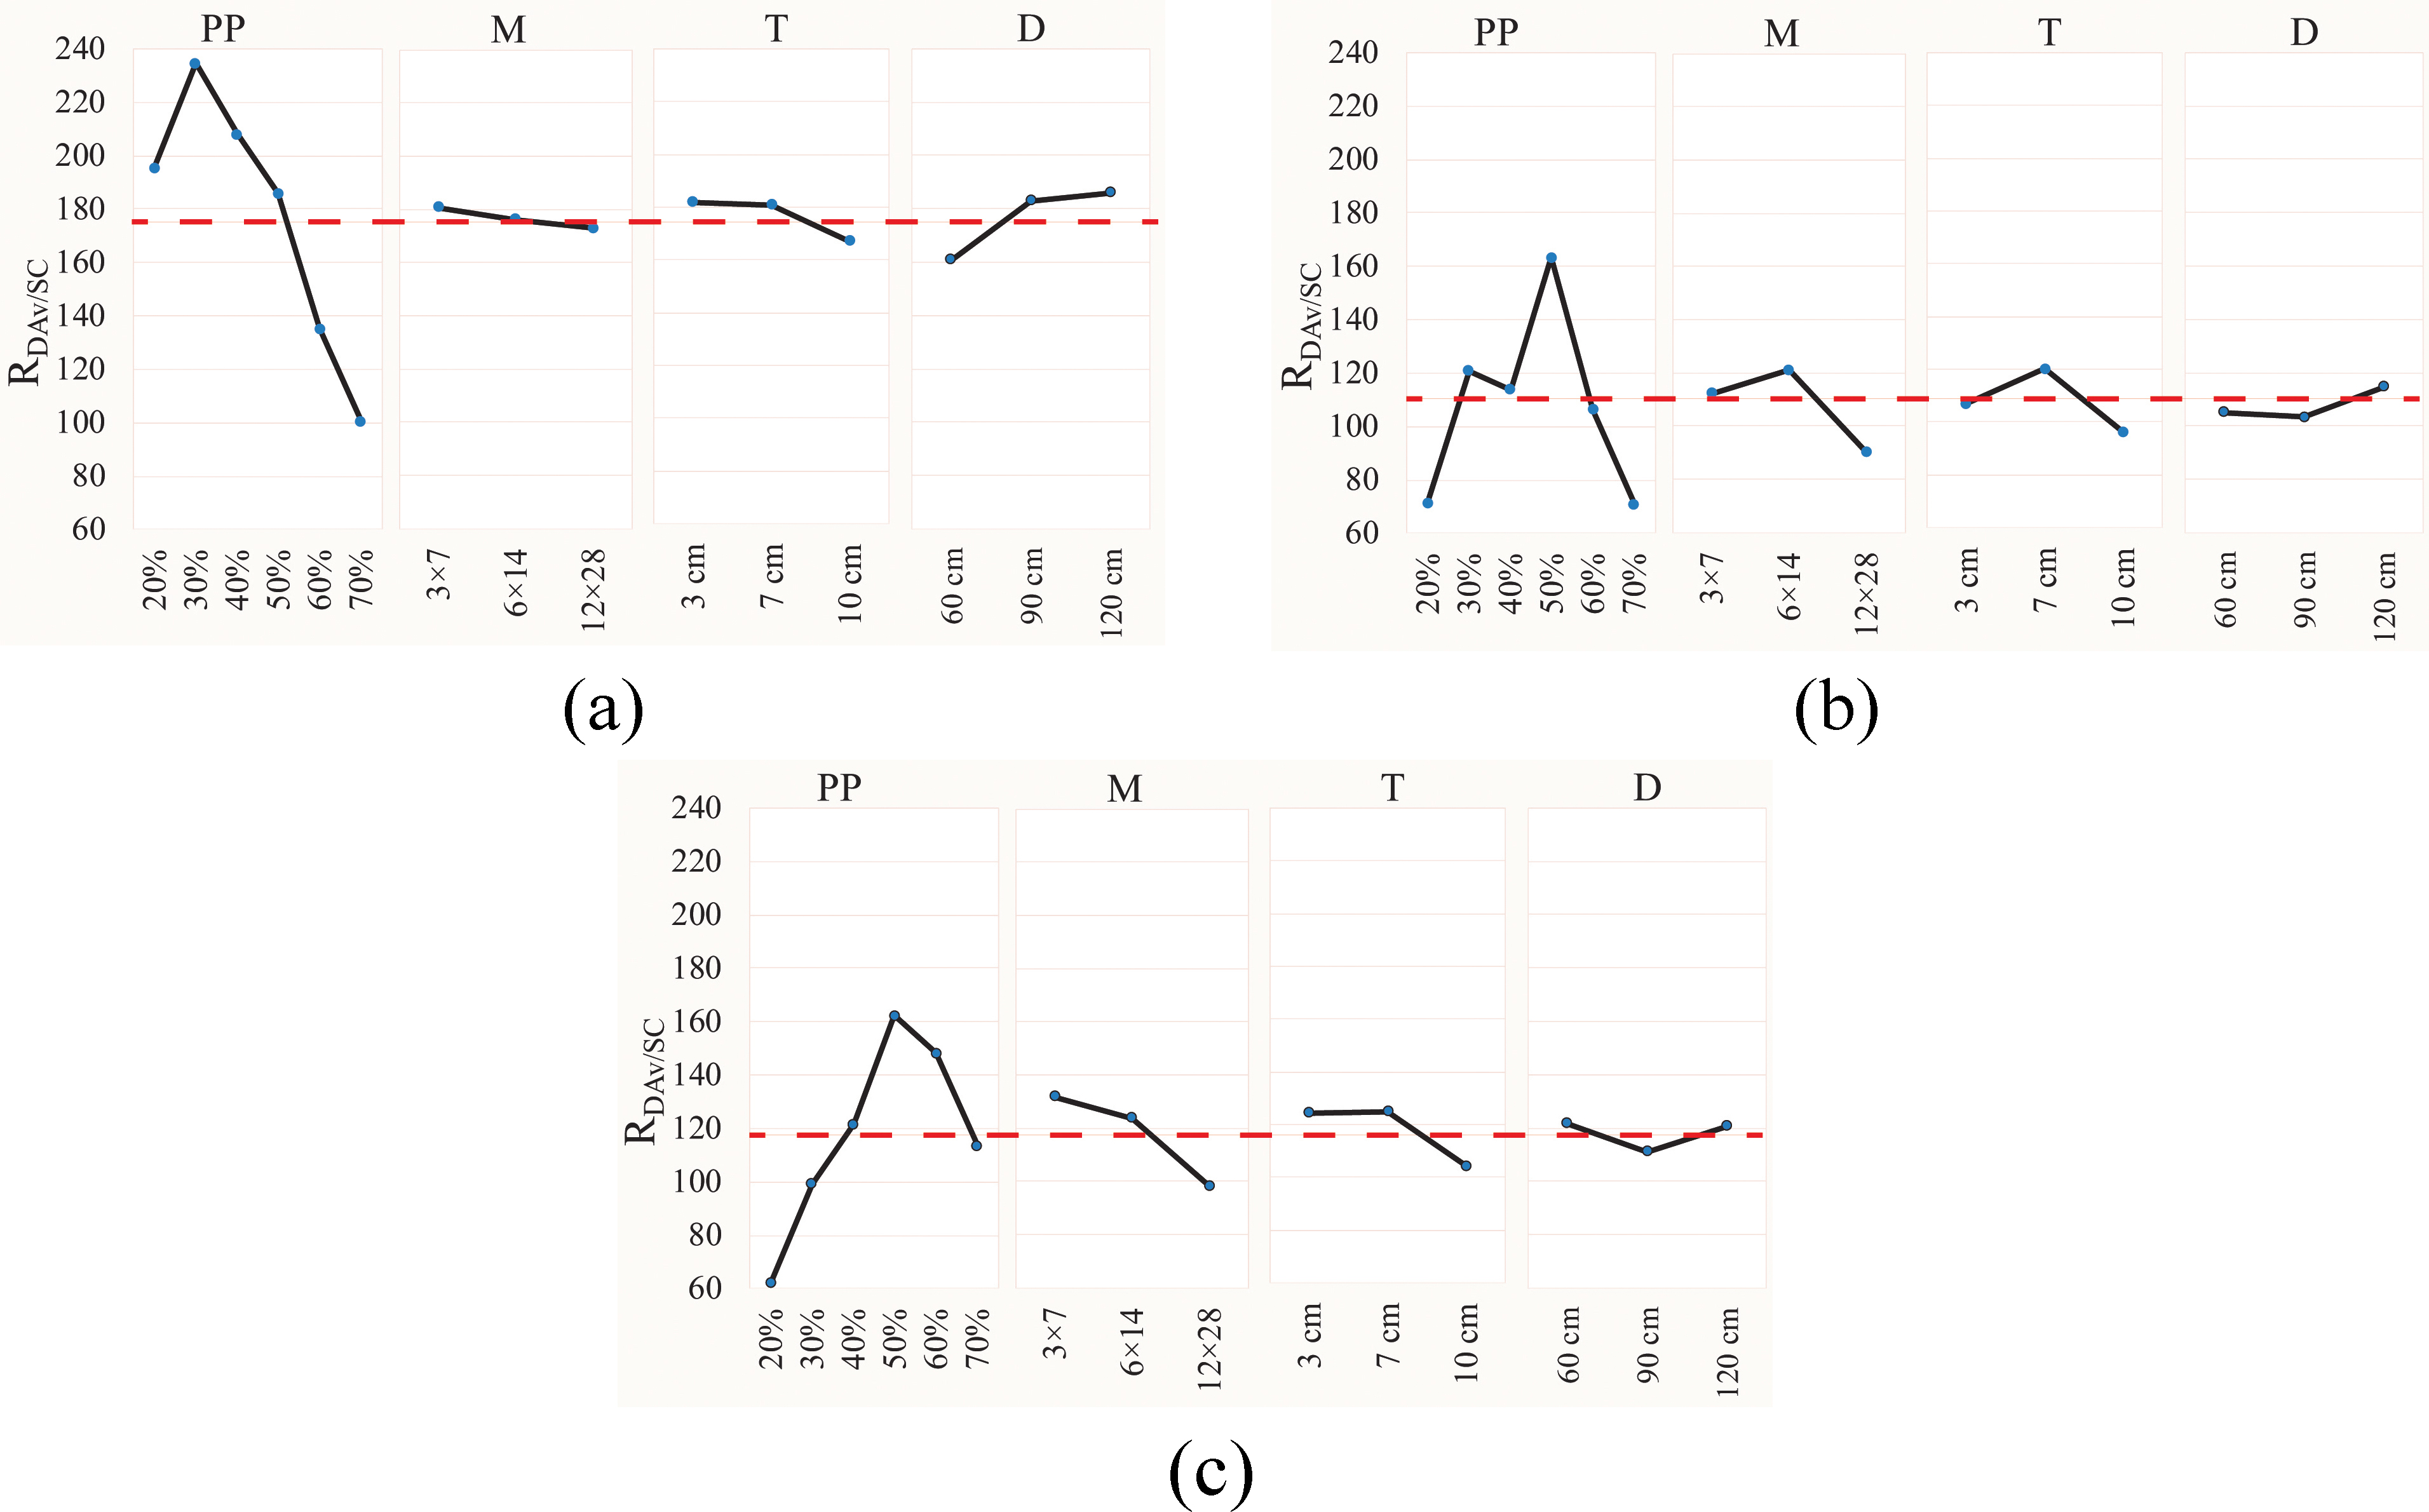
Fig. 12. Main effects plot for RDAVfully/SC (a) South, (b) East, and (c) West. The red dashed line shows the overall mean of RDAVfully/SC at every orientation.
3.5. Effects of matrix, distance and thickness on PS performance
To understand the effect of every design factor in the daylighting and shading performance of PS, the factor levels are investigated relative to the case study without PS. It should be noticed that the PS arranged in Figs. 13, 14, and 15 resulted from the combinations selected through the orthogonal arrays (refer to Fig. 3). Thus, any factor on any level was compared with all other factors on different levels. This means that no factor was set fixed to test the influence of changing others. Notwithstanding, general findings can be inferred from the comparisons in Figs. 13, 14, and 15, which summarize the simulation results for specific metrics chosen as representative: UDI 300-3000 lx, actual fully daylit area, overlit area, SC and Ratio DAvfully/SC. Essentially, most PS configurations get better performance than that of the case study (R). To clarify, the PS increase the fully daylit area and the UDI 300-3000 lx. Besides, all PS reduce the overlit area and get better performance for the SC and Ratio indexes. A profound revision is described below.
Figure 13
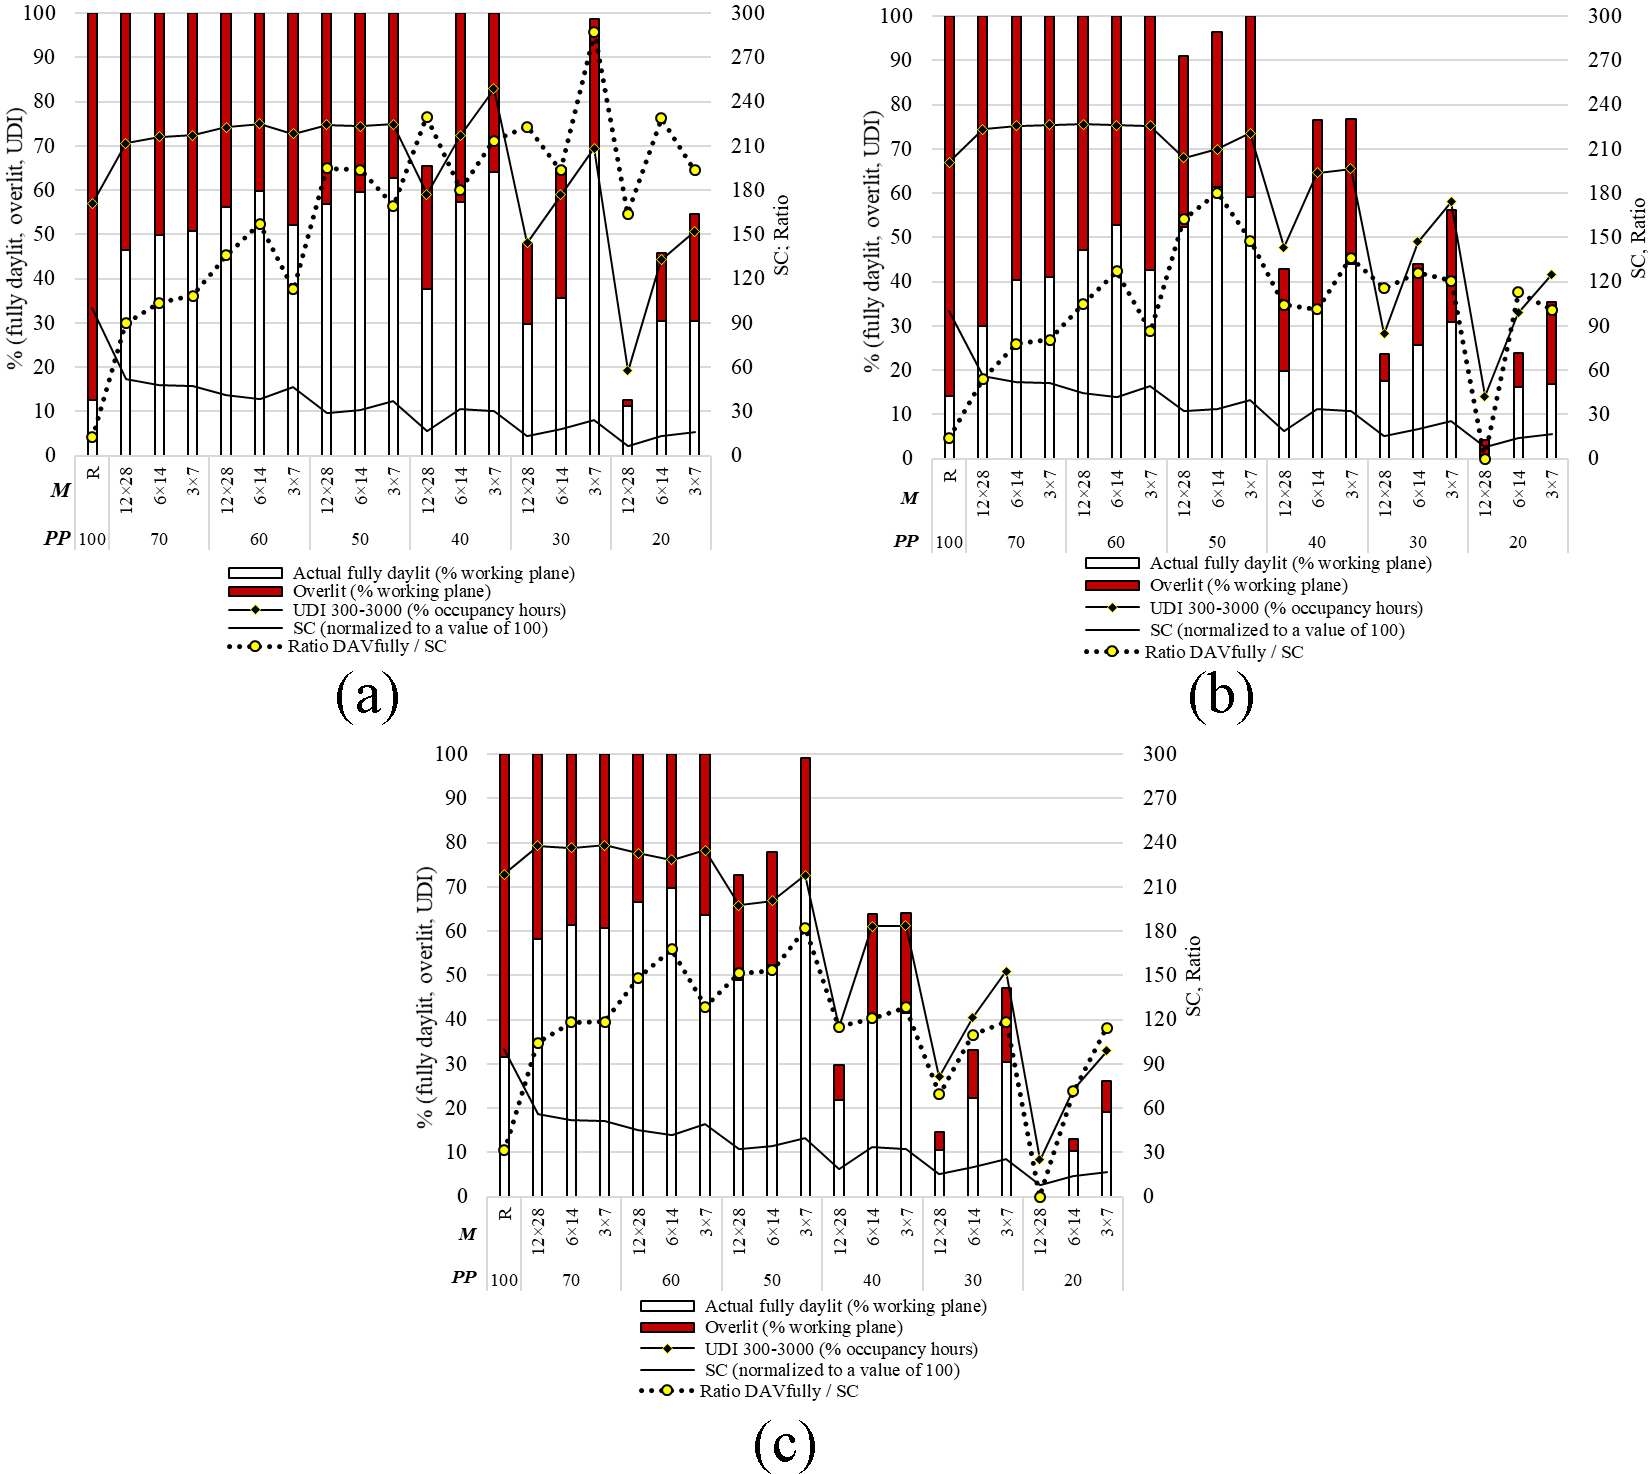
Fig. 13. Comparison as a function of the matrix (M) and perforation percentage (PP), relative to the case study with no PS (R) (a) South, (b) East, and (c) West.
Figure 14
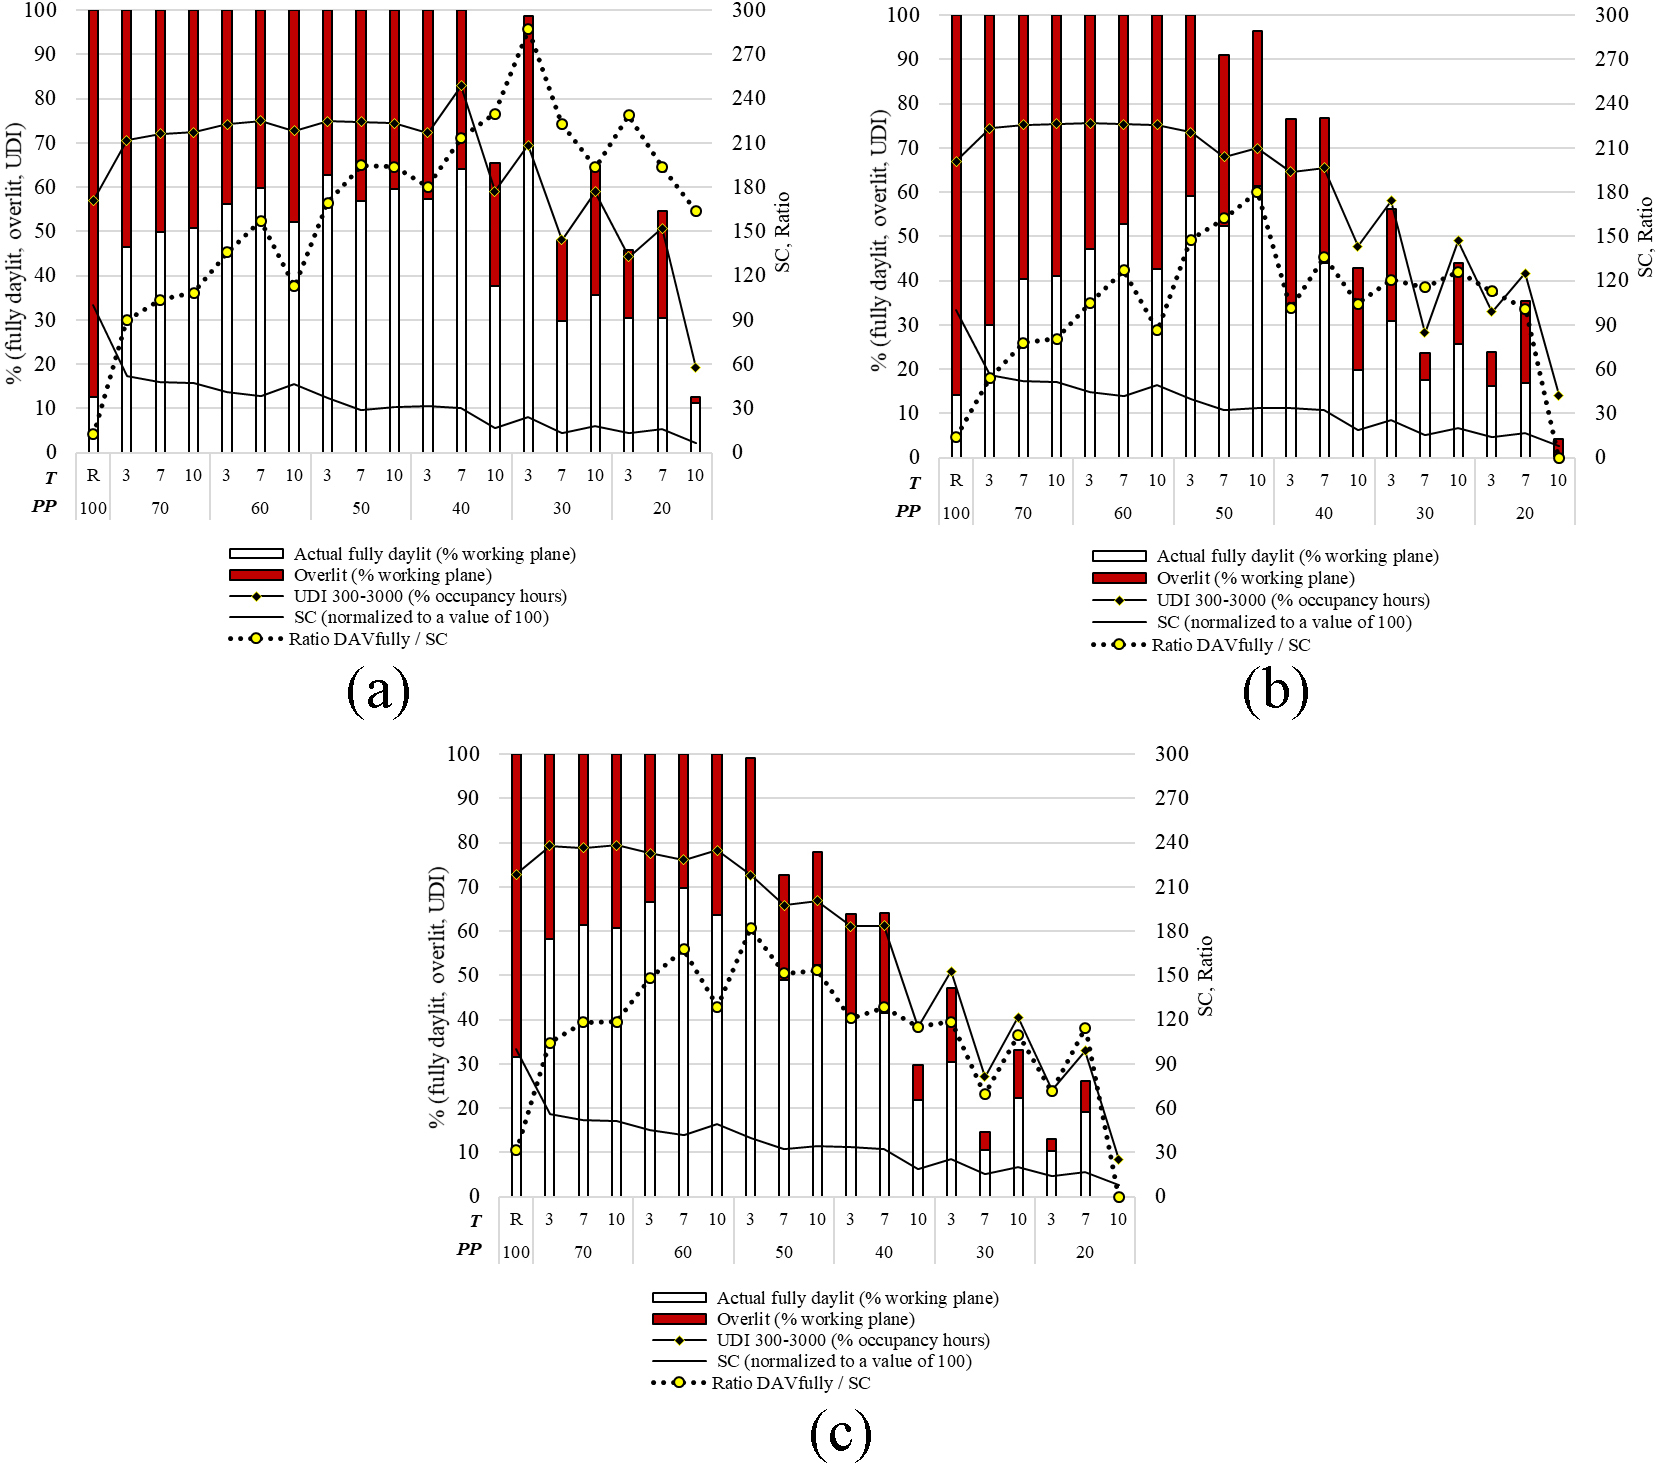
Fig. 14. Comparison as a function of the thickness (T) and perforation percentage (PP), relative to the case study with no PS (R) (a) South, (b) East, and (c) West.
Figure 15
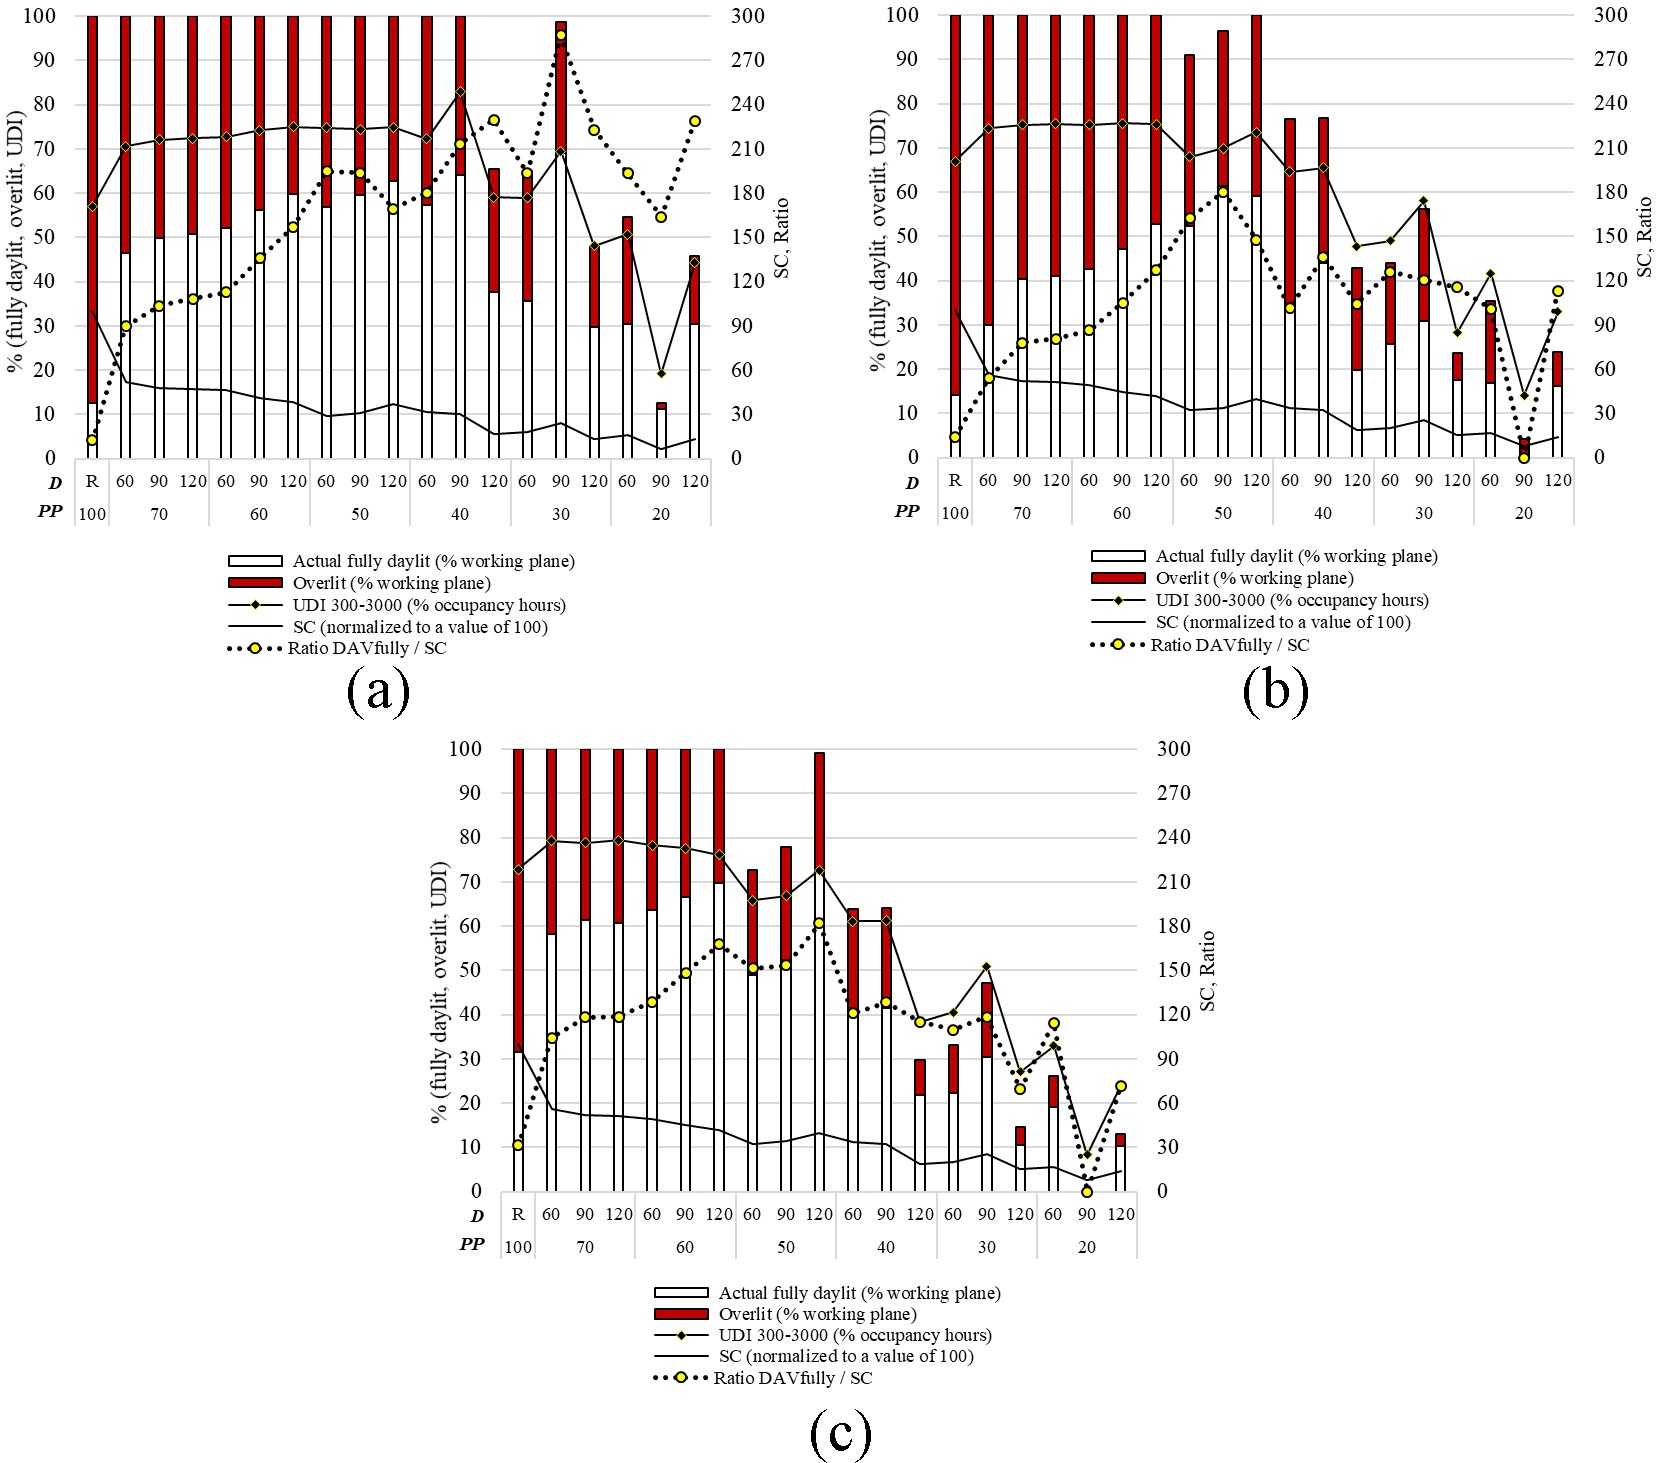
Fig. 15. Comparison as a function of the separation distance (D) and perforation percentage (PP), relative to the case study with no PS (R) (a) South, (b) East, and (c) West.
The main effects in previous sections pointed out that PP produced the most significant changes in PS performance. Therefore, this section presents the testing of the PP with each of the other three factors to comprehend their concurrent influence. The aim is to identify overall tendencies for the PS design parameters. First, the effects of the three different matrices are evaluated at every orientation. Figure 13 shows all PS grouped by their matrix and PP, in descending order. Hence, it is possible to notice that the fully daylit area increases with small hole density (small number, but large diameter holes: M 3×7), especially when using low perforation ratios (PP<50%). In contrast, SC decreases with big hole density (big number, but small diameter holes: M 12×28) and low perforation ratios (PP<50%). Therefore, the best overall performance can be inferred from the ratio DAvfully/SC, so the matrices 3×7 and 6×14 can be categorized as the optimal levels.
Then, a comparison among the thickness levels at the three orientations is presented in Fig. 14. All PS are grouped by their PP and thickness, in descending order. From the ratio at South, medium-thick screens (7 cm) appear better suited for high perforation ratios (PP>40%) whereas thin screens (3 cm) show better performance for PP<40%. The ratios at East and West show a seemingly random tendency. However, it can be attributed to the interaction of the thickness with the hole density. Hence, the anom results can better clarify the issue.
Lastly, the effects of the three distances are evaluated at every orientation. Similar to the previous graphs, Fig. 15 shows all PS grouped by their distance and PP, in descending order. From the ratio results, it can be depicted that a longer distance (120 cm) is more useful for high perforation ratios. To be specific, PP>50% at South and East, and PP>40% at West. However, it is also clear that the distance parameter is strongly related to the hole density. Thus, the main effects show clearer findings for this factor.
4. Summary and discussion
Table 3 summarizes the overall assessments of each factor level under all metrics targets. Besides, it displays the design criteria proposed for optimal thick PS, which consist of two categories, ‘Preferable’ and ‘Not recommendable’. The approach adopted here is to draw upon the mean overall PS performance to develop categories for each performance metric to allow easy comparison of all of the metrics. The criteria are applied in a ‘positive mode’ for the following performance metrics: UDI 300-300 lx, Actual daylit area and RDAVfully/SC. Hence, those factor levels that achieve a mean higher than the overall average of all the factor levels combined are set within the ‘Preferable’ category. In contrast, those factor levels that achieve a mean lower than the overall average are classified within the ‘Not recommendable’ category. In brief, the ‘positive mode’ aims to improve daylighting and the integrated performance of PS.
Figure 18
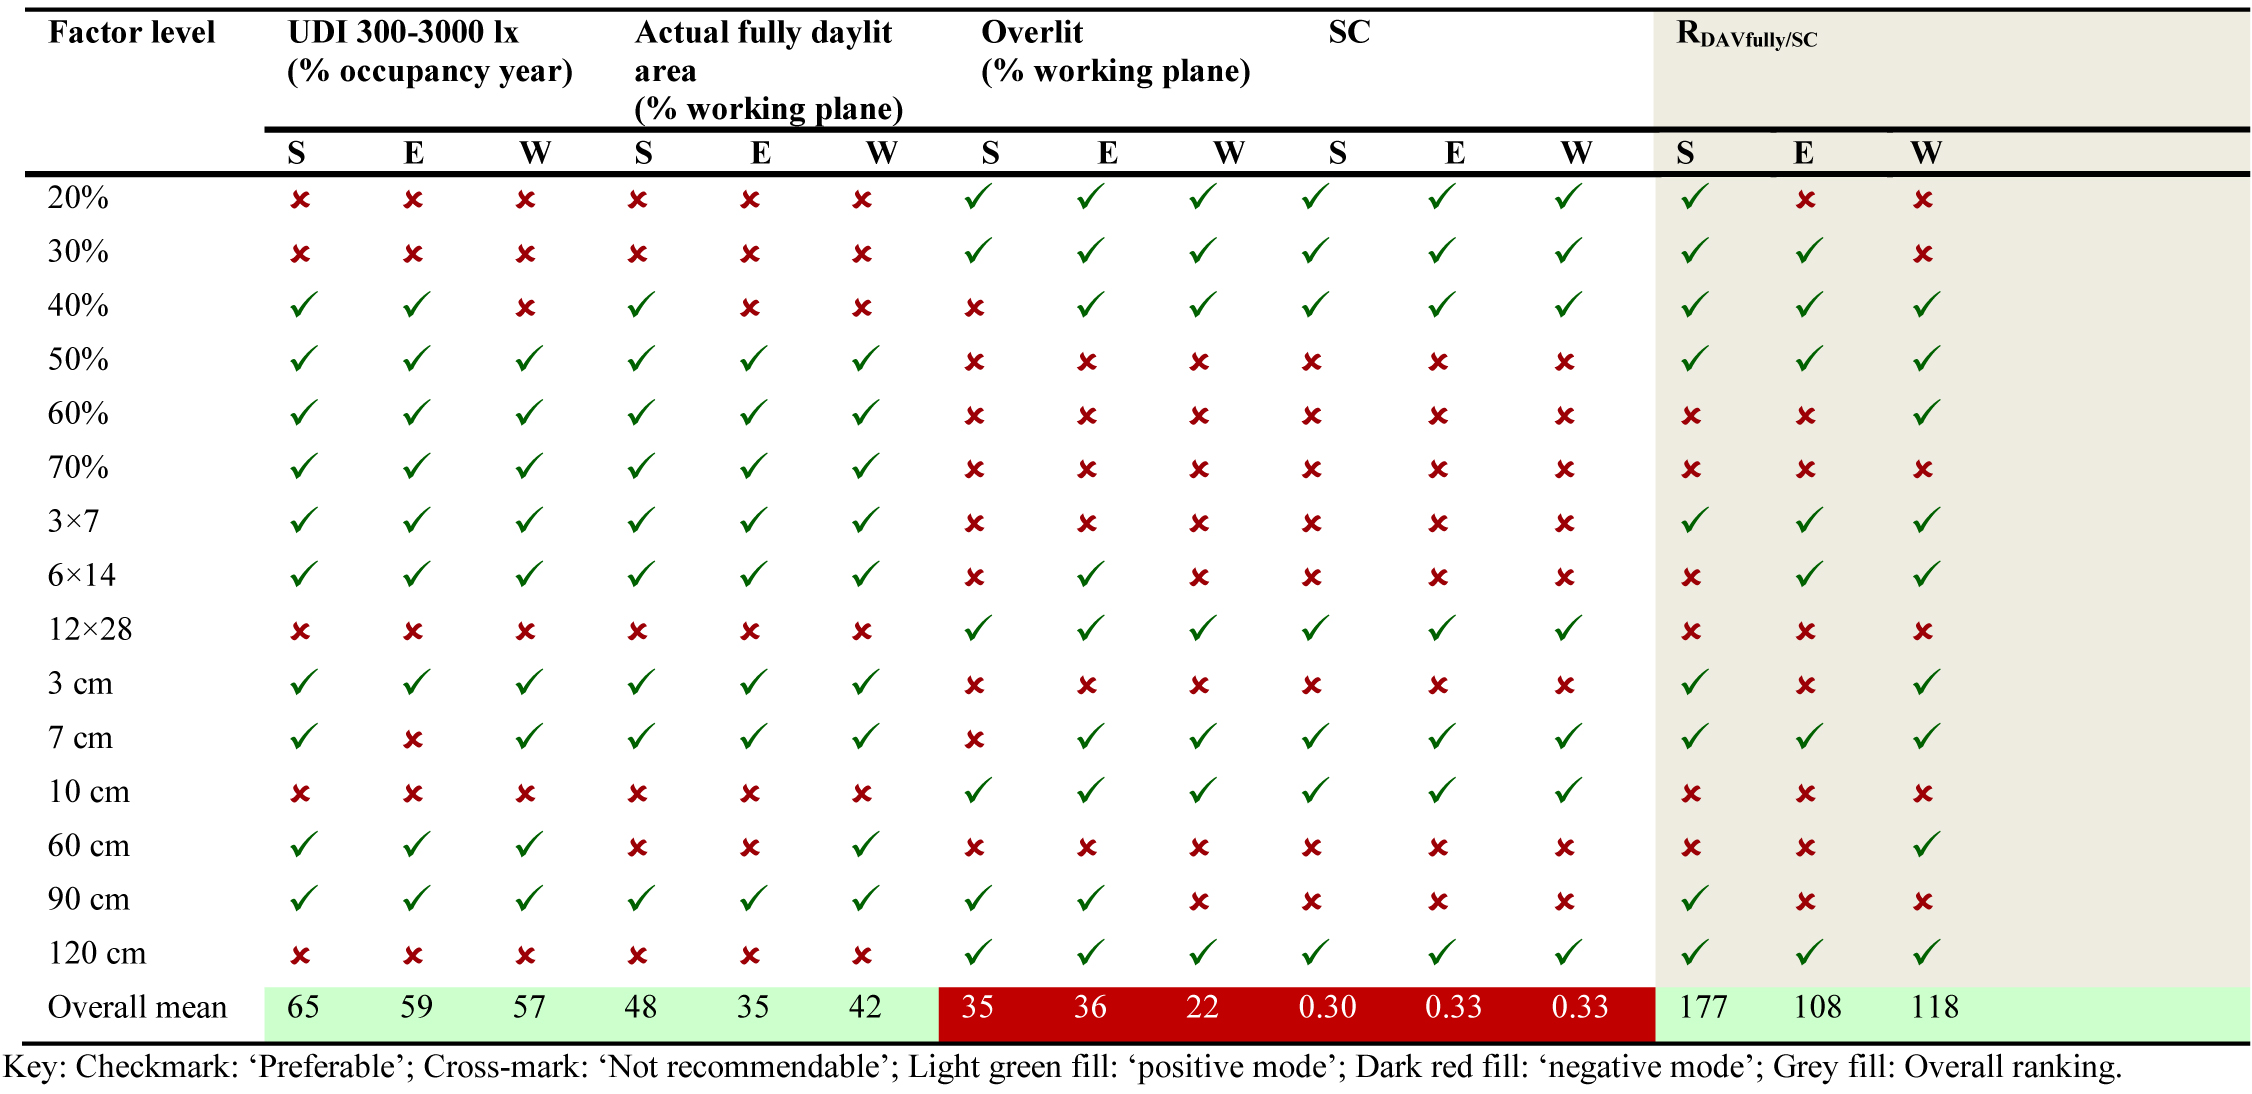
Fig. 18. Design criteria for thick PS in terms of daylighting and solar shading performance.
In addition, the criteria are applied in a ‘negative mode’ for the following two performance metrics: overlit area and SC. Hence, those factor levels that get a mean lower than the overall average of all the factor levels combined are set within the ‘Preferable’ category. In contrast, those factor levels that achieve a mean higher than the overall average are set within the ‘Not recommendable’ category. Then, the ‘negative mode’ aims to avoid an oversupply of daylight and solar radiation.
As expected, most factor levels classified as ‘Preferable’ in terms of daylight provision, exceeded the overall mean of both UDI 300-3000 lx and the actual fully daylit area. This result is understandable since both metrics accounted for the same range of autonomous illuminances, the first during the occupancy time while the second on the working plane.
Examining the two categories resultant from both the overlit area and SC, most factor levels are found to be in good agreement with their classification, ‘Preferable’ or ‘Not recommendable’. It appears that the overlit area has a linear relationship with the shading performance metric. Therefore, it is feasible to recommend design guidelines that limit the overlit area to less than 35% at South in order to improve the shading performance and to get an SC lower than 0.30. Similarly, confining the overlit area to less than 36% and 22% at East and West, respectively, could help improve the shading performance of thick PS at these two orientations and achieve an SC lower than 0.33.
As regards the overall ranking based on RDAVfully/SC, it can be inferred that this ratio largely weights both daylight provision and solar shading performance simultaneously. In some cases, the weight of the overlit area was higher than that of the fully daylit area, and vice versa. To sum up, the following design guidelines for thick PS are proposed:
- Optimal PP: 20-50% at South, 30-50% at East, and 40-50% at West. Hence, it is observed that smaller perforation ratios should be specified at South, since they provide better solar protection and limit the oversupply of daylight. Differences between East and West recommended PP are attributed to the ten-hour working day that includes more daylight hours during morning than during afternoon, throughout year.
- Optimal M: 3×7 at South, 3×7 and 6 × 14 at both East and West. From here, it is inferred that matrices with big holes and less number of them should be specified for thick PS since they are more suitable to balance daylighting with solar shading.
- Optimal T: 3-7 cm at both South and West, and 7 cm at East. Hence, it is observed that thick screens should be designed with less than 7 cm thickness at the three orientations. It should be pointed out since PS with more centimeters thickness are very common nowadays, mainly due to the assumption that they look quite similar to thicker screens and because many designs are developed through a merely intuitive design process. However, the findings presented here show that thicker PS can reduce the autonomous illuminances below the overall mean performance.
- Optimal D: 90-120 cm at South, 120 cm at East, and 60 cm and 120 cm at West. More generally, shorter distances contribute to enhance daylighting whereas longer distances help to improve solar shading. A balance must be reached.
5. Conclusions
This paper investigated the effect of simultaneously changing five design parameters for thick PS in terms of their daylight provision and solar shading performance. Orientation, perforation percentage, matrix, thickness and separation distance were all tested together through a multi-factor analysis based on orthogonal arrays. The last two listed variables were key design parameters to understand the effect of thick PS since they have not been systematically tested before.
The following five performance targets were planned as an approach to understanding the behavior of thick PS: the occupancy target, the workplane target, a daylighting limit, a shading limit and the integrated target. All these targets aimed to provide a confidence interval that allows determining which factor level had a mean significantly different from the overall average of all the factor levels combined. Therefore, those factor levels arising the overall occupancy, the workplane and the integrated targets were chosen as ‘Preferable’. Besides, those factor levels reaching less than the overall overlit and shading limits were also classified as ‘Preferable’. On the contrary, those factor levels that did not comply with the mentioned performance targets were set as ‘Not recommendable’.
In brief, the statistical method and the ANOM test allowed the simultaneous comparison of every factor and the optimal level selection. Then, optimal or ‘preferable’ levels were summarized as design guidelines to plan thick PS used in front of South, East and West glazed façades, in a Mediterranean climate. In general, PP 20-50% were considered optimal; also, M 3×7 and 6 × 14, T 3-7cm and D 90-120 cm. To close, all PS configurations derived from the combination of the optimal factor levels are expected to be optimal for daylighting and shading performance through thick PS. Therefore, it is expected that these guidelines could help architects to make early design-stage decisions when integrating thick PS in building projects. The method implemented here also could be applied to evaluate thick PS design in other localities and latitudes, saving time considerably when looking for optimal solutions.
Furthermore, new relationships between metrics were depicted in this work. The statistical analysis showed that avoiding excessive illuminances had a significant and positive impact on shading performance. Therefore, it is feasible to recommend limiting the overlit area to less than 35% at South in order to improve the shading performance and to get an SC lower than 0.30. Similarly, confining the overlit area to less than 36% and 22% at East and West, respectively, could help improve the shading performance of thick PS at these two orientations and achieve an SC lower than 0.33. To sum up, complying with the performance targets for the overlit area or the SC index, can ensure a good daylighting and shading performance of PS.
The investigation reported here is an extension to a much wider study into multi-factorial design and their influence on the interior office environments. The findings presented here reinforce the need for further research on the identification of best design alternatives for complex shading devices since they are widely implemented nowadays in building design. Considerations of heat loss through glazing façades and therefore the overall energy consumption need to be further explored to identify the optimal factors of the thick PS for the indoor environment. Influencing factors such as daylight glare and view quality should also be addressed in future studies to better understand the overall performance of PS.
Acknowledgements
The author acknowledges the support of Universidad de las Americas Puebla and CONACYT.
References
- H. Poirazis, A. Blometerberg, M. Wall, Energy Simulations for Glazed Office Buildings in Sweden, Energy and Buildings 40 (2008) 1161–1170. https://doi.org/10.1016/j.enbuild.2007.10.011
- P. Boyce, C. Hunter, O. Howlett, The Benefits of Daylight through Windows, Lighting Research Center - Rensselaer Polytechnic Institute, Available at: http://www.ibo.at/documents/Licht_TB07_Andersent.pdf.
- M. Aries, J. Veitch, G. Newsham, Windows, View and Office Characteristics Predict Physical and Psychological Discomfort., Journal of Environmental Psychology 30 (2010) 533–541. https://doi.org/10.1016/j.jenvp.2009.12.004
- M. Bodart, A. De Herde, Global Energy Savings in Office Buildings by the Use of Daylighting, Energy and Buildings 34 (2002) 412–429. https://doi.org/10.1016/S0378-7788(01)00117-7
- O. Azadeh, Design Optimization of a Contemporary High Performance Shading Screen – Integration of ‘Form’ and Simulation Tools, in: Proceedings of Building Simulation 2011: 12th Conference of International Building Performance Simulation Association, IBPSA (International Building Performance Simulation Association), pp. 2491–2498, 2011, Sydney.
- E. Aljofi, Effect of the Rawshan on the Provision of Daylight for Shopping Precints, [Phd thesis] University of Wales, Cardiff, 1995.
- A. Sherif, H. Sabry, A. El-Zafarany, R. Arafa, T. Rakha, M. Anees, Balancing the Energy Savings and Daylighting Performance of External Perforated Solar Screens, in: Proceedings of the 27th International Conference on Passive and Low Energy Architecture PLEA 2011: Architecture and Sustainable Development, Presses Universitaires de Louvain, pp. 807–812, 2011, Louvain-la-Neuve, Belgium.
- A. Sherif, H. Sabry, T. Rakha, External Perforated Solar Screens for Daylighting in Residential Desert Buildings: Identification of Minimum Perforation Percentages, Solar Energy 86 (2012) 1929–1940. https://doi.org/10.1016/j.solener.2012.02.029
- A. Sherif, A. El-Zafarany, R. Arafa, External Perforated Window Solar Screens: The Effect of Screen Depth and Perforation Ratio on Energy Performance in Extreme Desert Environments, Energy and Buildings 52 (2012) 1–10. http://dx.doi.org/10.1016/j.enbuild.2012.05.025
- A. Sherif, H. Sabry, M. Gadelhak, The Impact of Changing Solar Screen Rotation Angle and Its Opening Aspect Ratios on Daylight Availability in Residential Desert Buildings, Solar Energy 86 (2012) 3353–3363. https://doi.org/10.1016/j.solener.2012.09.006
- O. Etman, O. Tolba, S. Ezzeldin, Double-Skin Façades in Egypt between Parametric and Climatic Approaches, in: Computation and Performance-Proceedings of the 31 St ECAADe Conference, pp. 459–465, 2014, Delft, The Netherlands.
- D.A. Chi, D. Moreno, P.M. Esquivias, J. Navarro, Optimization Method for Perforated Solar Screen Design to Improve Daylighting Using Orthogonal Arrays and Climate-Based Daylight Modelling, Journal of Building Performance Simulation 10 (2017) 144–160. https://doi.org/10.1080/19401493.2016.1197969
- D.A. Chi, D. Moreno, J. Navarro, Design Optimisation of Perforated Solar Facades in Order to Balance Daylighting with Thermal Performance, Building and Environment In press (2017) 383–400. https://doi.org/10.1016/j.buildenv.2017.09.007
- D.A. Chi, E. Brembilla, Using Radiance to Estimate Transmitted Solar Radiation Energy for Thin Perforated Screens, in: Proceedings of the 29th CIE SESSION, International Commission on Illumination, pp. 363–372, 2019. https://doi.org/10.25039/x46.2019.op50
- D.W. Kim, C.S. Park, Difficulties and Limitations in Performance Simulation of a Double Skin Façade with EnergyPlus, Energy and Buildings 43 (2011) 3635–3645. http://dx.doi.org/10.1016/j.enbuild.2011.09.038
- P.C. Da Silva, V. Leal, M. Andersen, Influence of Shading Control Patterns on the Energy Assessment of Office Spaces, Energy and Buildings 50 (2012) 35–48. https://doi.org/10.1016/j.enbuild.2012.03.019
- S. Selkowitz, M. Rubin, E. Lee, R. Sullivan, A Review of Electrochromic Window Performance Factors, in: Proceedings of the SPIE International Symposium on Optical Materials Technology for Energy Efficiency and Solar Energy Conversion XIII, pp. 1–23, 1994, Freiburg, Germany.
- F. Garde, M. David, L. Adelard, E. Ottenwelter, Elaboration of Thermal Standards for French Tropical Islands: Presentation of the PERENE Project, in: Proceedings of Clima 2005, pp. 71–83, 2005, Lausanne, Switzerland.
- C.L. Cheng, L.M. Liao, C.P. Chou, A Study of Summarized Correlation with Shading Performance for Horizontal Shading Devices in Taiwan, Solar Energy 90 (2013) 1–16. https://doi.org/10.1016/j.solener.2013.01.007
- R. Perez, P. Ineichen, R. Seals, J. Michalsky, R. Stewart, Modelling Daylight Availability and Irradiance Components from Direct and Global Irradiance, Solar Energy 44 (1990) 271–289. https://doi.org/10.1016/0038-092x(90)90055-h
- L. Huang, J. Wu, Effects of the Splayed Window Type on Daylighting and Solar Shading, Building and Environment 81 (2014) 436–447. https://doi.org/10.1016/j.buildenv.2014.07.026
- M. David, M. Donn, F. Garde, A. Lenoir, Assessment of the Thermal and Visual Efficiency of Solar Shades, Building and Environment 46 (2011) 1489–1496. http://dx.doi.org/10.1016/j.buildenv.2011.01.022
- D.A. Chi, D. Moreno, J. Navarro, Correlating Daylight Availability Metric with Lighting , Heating and Cooling Energy Consumptions, Building and Environment 132 (2018) 170–180. https://doi.org/10.1016/j.buildenv.2018.01.048
- J. Mardaljevic, M. Andersen, N. Roy, J. Christoffersen, Daylighting Metrics: Is There a Relation between Useful Daylight Illuminance and Daylight Glare Probability?, in: Proceedings of the Building Simulation and Optimization Conference BSO12, IBPSA, pp. 189–196, 2012, Loughborough, UK.
- G.-J. Park, Analytic Methods for Design Practice, Springer London. https://doi.org/10.1007/978-1-84628-473-1
- J. Zhu, D. Chew, S. Lv, W. Wu, Optimization Method for Building Envelope Design to Minimize Carbon Emissions of Building Operational Energy Consumption Using Orthogonal Experimental Design (OED), Habitat International 37 (2013) 148–154. https://doi.org/10.1016/j.habitatint.2011.12.006
- G. Taguchi, Y. Yokoyama, Taguchi Methods: Design of Experiments (TAGUCHI METHODS SERIES), Amer Supplier Inst, 1993.
- D.A. Chi, Daylight through Perforated Solar Screens over Glazed Façades: Design Guidelines, [Phd thesis] University of Seville, 2017.
- A. Nabil, J. Mardaljevic, Useful Daylight Illuminance: A New Paradigm for Assessing Daylight in Buildings, Lighting Research and Technology 37 (2005) 41–59. https://doi.org/10.1191/1365782805li128oa
- C. Reinhart, T. Rakha, D. Weissman, Predicting the Daylit Area — A Comparison of Students Assessments and Simulations at Eleven Schools of Architecture, Leukos 10 (2014) 193–206. https://doi.org/10.1080/15502724.2014.929007
- D.A. Chi, E. Brembilla, J. Mardaljevic, Evaluation of Daylighting Performance in a Retrofitted Building Facade, in: L. Brotas, S. Roaf, N. Fergus (Eds.), Proceedings of 33rd PLEA International Conference, NCEUB (Network for Comfort and Energy Use in Buildings), pp. 3340–3347, 2017, Edinburg.
- C. Reinhart, J. Wienold, The Daylighting Dashboard - A Simulation-Based Design Analysis for Daylit Spaces, Building and Environment 46 (2011) 386–396. https://doi.org/10.1016/j.buildenv.2010.08.001
Copyright © 2019 The Author(s). Published by solarlits.com.

328
Total views
Citations
SHARE ON


