Volume 7 Issue 1 pp. 107-121 • doi: 10.15627/jd.2020.9
Optimisation of Passive Solar Design Strategies in Side-lit Offices: Maximising Daylight Penetration While Reducing the Risk of Glare in Different Chilean Climate Contexts
Cecilia Palarino, María Beatriz Piderit*
Author affiliations
Department of Design and Architecture Theory. University of Bio-Bio, Av. Collao 1202, Concepción, Chile
* Corresponding author.
arq.ceciliapalarino@gmail.com (C. Palarino)
mpiderit@ubiobio.cl (M. Beatriz Piderit)
History: Received 28 February 2020 | Revised 6 May 2020 | Accepted 19 May 2020 | Published online 8 June 2020
Copyright: © 2020 The Author(s). Published by solarlits.com. This is an open access article under the CC BY license (http://creativecommons.org/licenses/by/4.0/).
Citation: Cecilia Palarino, María Beatriz Piderit, Optimisation of Passive Solar Design Strategies in Side-lit Offices: Maximising Daylight Penetration While Reducing the Risk of Glare in Different Chilean Climate Contexts , Journal of Daylighting 7 (2020) 107-121. http://dx.doi.org/10.15627/jd.2020.9
Figures and tables
Abstract
It has been shown that in buildings with fully glazed facades designed to save electricity and increase daylight, overheating due to excessive solar gains and glare have become recurrent problems, affecting the quality of the indoor environment in office buildings. Likewise, the focus should not only be on reducing energy consumption but also on providing comfort by applying daylight strategies appropriate to each context. In contexts such as Chile, where there is significant variability of daylight due to the extension of the territory, (17°29'57" S - 56°32'12" S) designing with the correct passive solar strategies can become a challenge. The main purpose of this study is to investigate the application of passive solar strategies in side-lit office spaces, focusing on designs that maximise daylight penetration while protecting occupants from the risks of direct solar glare, and on methods to predict the daylight performance. A theoretical model is the prototype of an experimental office, located in three Chilean cities with different prevailing sky conditions, but adapted to the different contexts by integrating the design strategies recommended by the leading entities in advanced energy and daylight design. Daylight performance was evaluated using climate-based daylight modelling, with spatial daylight autonomy, annual sunlight exposure, and useful daylight illuminance metrics, which can integrate the daylight provision and potential glare prediction into a combined approach. This analysis was complemented by using a daylight glare probability index to verify the upper-lit thresholds of the applied methods. This paper provides an easy-to-apply daylight strategies guide for designers and the comparison of the daylight metrics in different climate contexts.
Keywords
Passive solar design, Side-lit office, Dynamic daylight performance metric, Daylighting
1. Introduction
Daylight is a very valued resource to manage the energy efficiency of the buildings and to create a productive-visually stimulating environment for occupants [1,2]. For high rise office buildings, the primary source of daylight is vertical fenestration and is often the only visual connection with the outdoor environment. The glazed facade is the most widely used technology in the design of office buildings, looking to maximise daylight in interiors because its availability is limited in side-lit spaces, depending on the depth of the floorplan. Even so, the distribution of light is non-uniform, with a high level of illumination near the windows that decreases as the distance from the perimeter increases, and it may perceive direct sunlight in the first area [3].
As Simmler, H. (2008) noted, studies carried out have shown that energy demand by overheating has become a recurring problem in fully glazed facades due to excessive solar gains [4-6]. In Chile, a study conducted by Bodart et al. (2010) in districts of Santiago, showed that the predominant typology of the office building is the fully glazed façade with selective double glazing (68% of the sample analysed), and presents severe problems in terms of thermal and visual comfort caused by overheating and glare [7]. Other studies determined the same results due to overexposure of the indoors to direct sunlight [8]. It is common the use of standardised dynamic shading devices operated by users to counteract the problem. However, its use for extended periods compromises the lighting potential and often blocks the view out.
Therefore, the fenestration area has a significant impact on the indoor visual environment quality. The implementation of optimal combination strategies -such as glazed, sizing, window-wall ratio, and the use of external shading devices-, represents an opportunity in the future response of the building to reduce overheating and glare problems [9-11]. Passive solar design strategies are highly sensitive to local climate factors and have a critical influence while controlling the admission of daylight, direct sunlight, and diffused skylight into a building [12-14].
The design of daylight devices becomes complex in territories with different skies and significant variability of available daylight. There are many passive strategies developed for advanced energy and daylight design. In this context, the first research question is, Do these developed strategies allow the designer to respond effectively to different climate contexts and are they easy to implement? For this purpose, the study aims to assess the applicability of passive solar design strategies focusing on those recommendations that maximise the penetration of daylight while protecting the occupants from the risks of direct solar glare. They are applied in predominant skies with different daylight conditions; to verify their effectiveness in each context.
Moreover, when evaluating daylight, several dynamic metrics use the CBDM method and are often optional for assessing visual comfort. The second research question is: Which of these metrics predict the required daylight and simultaneously evaluate overlit levels to control the risks from direct sunlight? The study provides a valuable comparison of the daylighting metrics in the different contexts, to determine which evaluation method and parameters offer the best daylight prediction to relate illuminance and glare control.
1.1. Climate context of the study
Given the wide light spectrum of daylight and the variations of the skies is defined the use of CIE skies, which allows building a skydome and provide real context to 3D models for the simulations. It is considered three types of skies -overcast, intermediate, and clear- of the ASRC-CIE model [15,16].
A previous study by Piderit et al. [17], applies high dynamic range imaging techniques to characterise the spatial distribution of daylight in Chile defined by CIE standard skies. The skies of Chilean cities analysed showed different predominance conditions. The TMY2 weather data provide the mean horizontal illuminance for these sky types and the percentage of probability that each sky type occurs in each given period [18].
The following cities were selected from research in the Chilean climate context. Calama (Lat. -22.47°, Long. -68.92°) in the extreme north of Chile, its predominance is clear (50%) and clear turbid (23%) sky with a frequency of 73% in a year. Santiago (Lat. -33.45°, Long. -70.67°) it is a central situation with a slight tendency towards 30% intermediate skies over the year; and Puerto Montt (Lat. -41.47°, Long. -72.94°) in southern Chile with predominantly overcast skies with a frequency of 46%, almost all year. Further, a detailed review of the climate data of the three study cities is carried out, considering the Köppen Geiger climate classification, average temperatures (T°Avg.) and solar altitude described in Table 1. These inputs help to define the devices to be applied, such as fixed and dynamic shading, horizontal overhangs, light shelves, diffusion screens used in each optimised office prototype presented in section 3.1.
Table 1
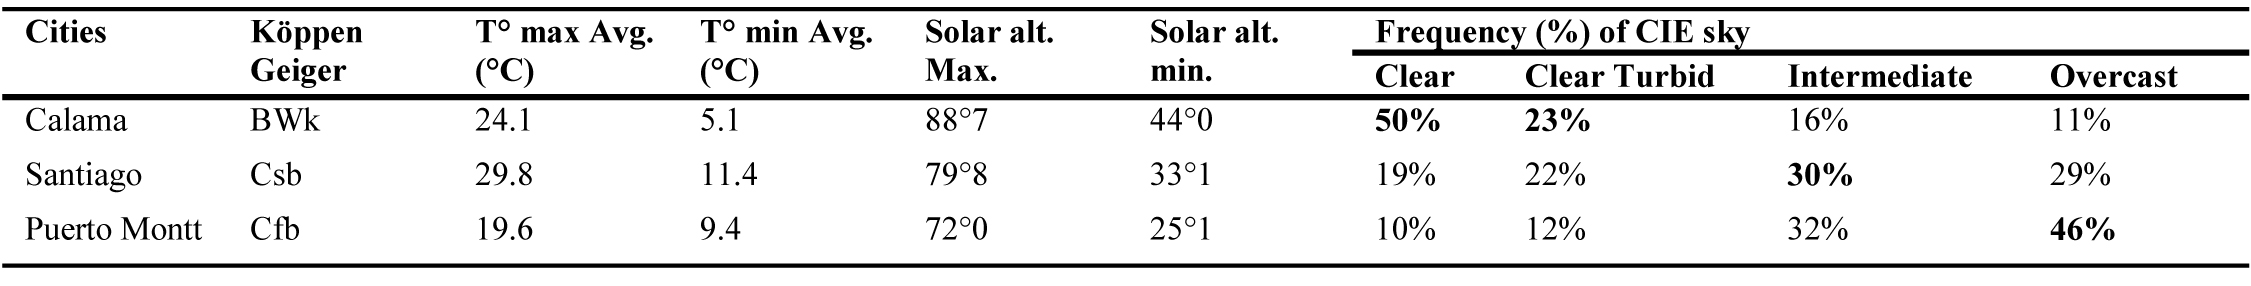
Table 1. Climate data of cities of Chile.
2. Methodology
The proposed methodology focuses on four aspects: measures to quantify daylight, design criteria for side-lit office spaces, application in the context of the study, and validation of the passive strategies involved in each context; as shown in the flux diagram in Fig. 1. The first step is the review of daylight metrics looking at dynamic metrics that maximise daylight while controlling glare risks, also the definition of under-lit and upper-lit target values to achieve a balanced daylight provision and the development of the daylight simulation method for the study. Then, the review of the design criteria for daylight and low-energy buildings, developed by leading advanced energy entities; focusing on approaches to improve side-lit spaces.
Figure 1
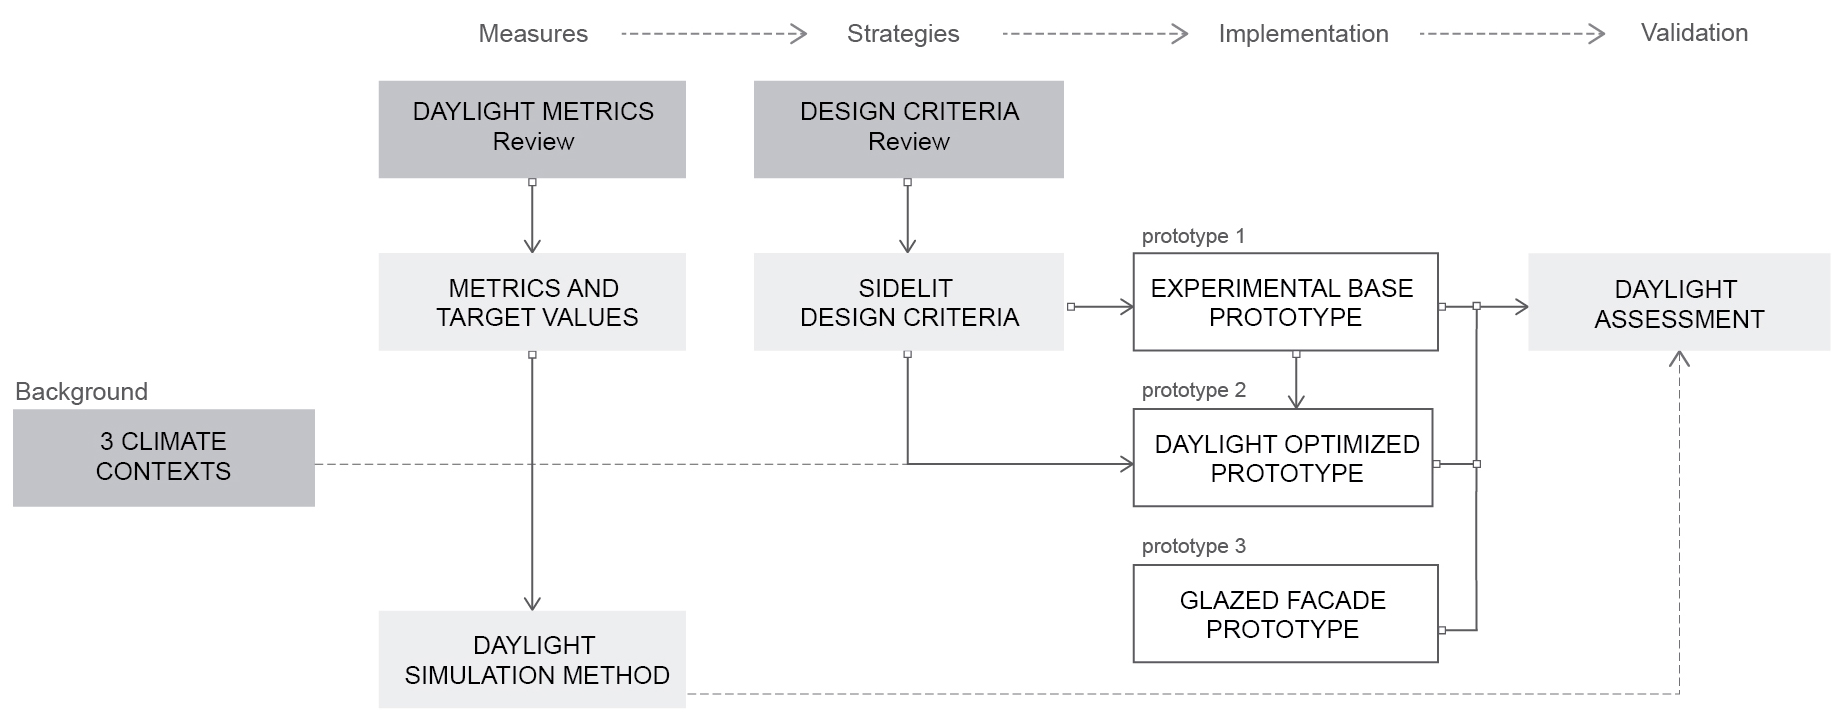
Fig. 1. Flux diagram of the methodology for this research.
This selection helps to develop an experimental base prototype as a theoretical office model (prototype 1) and to select suitable passive strategies to optimise it in different climatic contexts in the next stage: implementation. Based on the study of the three climates, strategies are integrated into the office prototype to improve daylight, resulting in a 'prototype 2' for each environment. The prototypes proposed by climatic context are validated when the results of the daylight assessment meet the expectations of the target values. Finally, a third model of fully glazed façade 'prototype 3 'is evaluated by climate context, to compare the performance of the three models and conclude about the strategies applied and which method offers the best daylight prediction in the contexts.
2.1. Review of daylight performance metrics
Daylight evaluation methods now integrate dynamic coefficients using climate data to evaluate illuminances and luminance time series effectively. Therefore, daylight provision approaches the annual dynamic interaction between a building, its occupants, and the surrounding climate to lead superior daylight designs [19,20]. There are several dynamic daylight metrics, but the review focuses on the current metrics developed to ensure an acceptable minimum and maximum illuminance, predicting the potential risk of glare from direct sunlight in a combined approach.
Useful Daylight Illuminance (UDI) index, introduces the estimation of daylight levels in a range considered "useful" by the occupants. According to the evolution of recent studies, the useful range is set between 100 and 3.000 lux [21]. However, the range has a four-level scheme. UDI-autonomous (UDI-a) between 300 to 3.000 lux; it is preferred to perform visual tasks. UDI-supplementary (UDI-s) between 100 to 300 lux, enough for low visual requirements and may be needed to supplement with artificial light for common tasks-. And then the illuminance out of range, is the UDI fell-short (UDI-f) less than 100lux, and the UDI exceeded (UDI-e) when illuminance is over 3.000 lux and may cause visual discomfort. As such, the metric measures the occurrence when a given area is in an effective useful illuminance range from 100 to 3000 lux, named UDI-combined (UDI-c=UDI-s + UDI-a), reporting a percentage acceptance target value when UDI-c > 80% [22,23]. At the same time, UDI-e helps to control the over-lit areas.
On the other hand, the IES-LM-83-12 Standard used in the latest version of LEED rating system (LEED v4), introduces the evaluation for a one-year period, of the sufficiency of daylight illuminance and the potential risk of excessive sunlight penetration by using two dynamic metrics, the spatial Daylight Autonomy (sDA) and the Annual Sunlight Exposure (ASE). The method shows the daylight performance in space and helps to understand if the strategies developed to meet expectations or should be redefined [24]. The SDA metric measures the daylight sufficiency for a given area, reporting a percentage of the area that exceeds a target illuminance value (300 lux), for a specified amount of time a year (50% of the annual hours); for acceptance sDA>55%. The ASE metric measures the potential visual discomfort caused by direct sunlight, reporting the percentage of the area which exceeds a specific direct sunlight illuminance level (1.000 lux) more than a specific number of hours per year (250 hs), not exceeding 10%. Reinhart presents a critical opinion about the 1.000 lux upper limit threshold, considering it very stringent compared to studies about the occupant's preference for higher daylight levels. Also, the admittance of direct sunlight if no interferes with visual requirements [25-28]; and the non-visual benefits for human health-related with the dynamic variation of daylight and the maintenance of the circadian rhythm [29]. As noted by Webb (2006) [30], studies suggest that occasional exposure to lighting above 3.000 lux is beneficial for occupant's productivity and health and, therefore, should not be completely eliminated. Then a LEED Addenda ratifies a maximum accepted percentage of 20% if the design includes a sun control system to address the glare [31-33].
The two methods propose different criteria to delimit the upper thresholds, and there are evaluated in a grid analysis on a horizontal work plane. Therefore, the complementary approach is assessing the risk of glare in the perceptual field-of-view of the visual scene and conclude on the accuracy of maximum thresholds prediction in the daylight methods.
The Daylight Glare Probability (DGP) index is the select method to calculate the prediction of glare discomfort. It is the most common method to compare the subjective glare index calculated by using the evalglare developed by Wienold, which calculates the discomfort glare from the detected glare sources [34]. The DGP index is defined as the probability of an occupant is dissatisfied with the visual environment due to differences between bright and dark areas caused by the direct sunlight or high luminance of a bright light source. It reports a percentage of time or space a person probably be disturbed by glare in a 4-point scale: imperceptible (DGP<35%); perceptible (35%≤DGP<40%); disturbing (40%≤DGP<45%); intolerable (DGP≥45%) on a scale between 20% to 80% [35,36]. In the standard EN 17037 for the assessment of daylight in interior spaces, indicates the DGP threshold levels for the prevention of glare. Glare protection is defined as a minimum 45%, medium 40%, and high 0.35%; while DGP does not exceed a maximum value of DGP 45% in more than 5% of the occupation time of the relevant space [37]. See the acceptance and preference values for the daylight metrics set to this study in Table 2.
Table 2
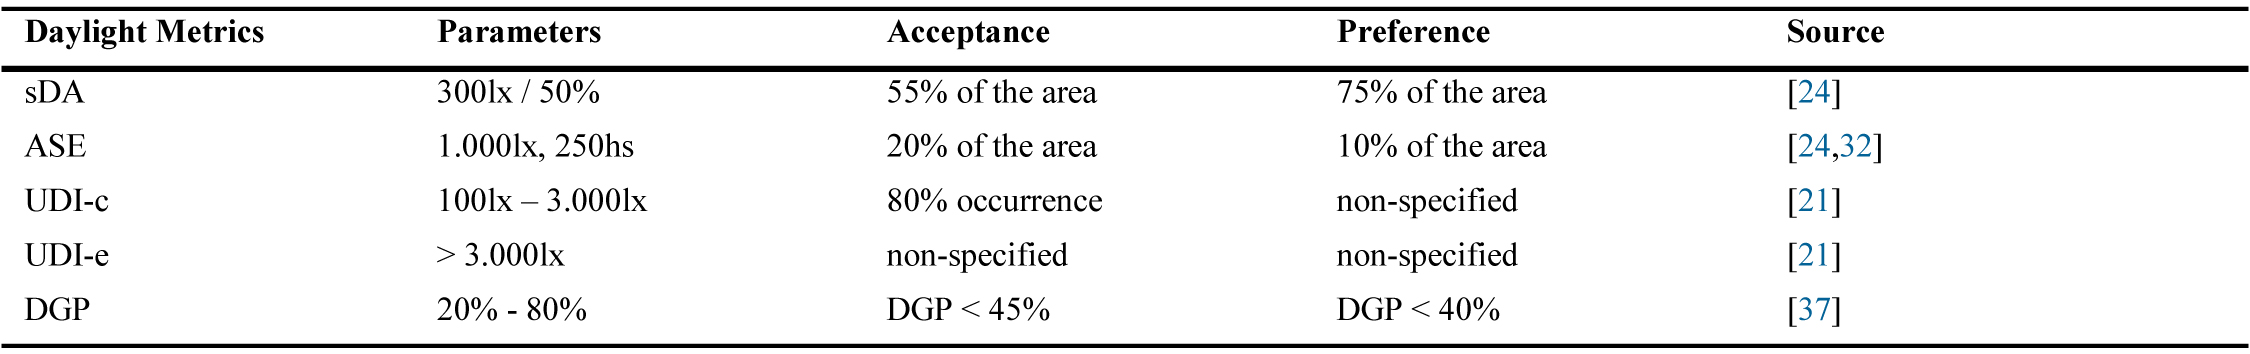
Table 2. Summary of daylight metrics to be used for evaluation and target values.
2.2. Daylight simulation method
The daylight calculation method is based on simulation modelling using the DIVA-for-Rhino version 4.0 software [38], a highly optimized plug-in for Rhinoceros and Grasshopper based on Radiance. The method 'DIVA-Rhino-Grasshopper', combines the three components to run simulations of the metrics simultaneously.
In Rhino, the main surfaces of the prototype office are modelled with fixed obstructions and external shading devices, but dynamic interior shading is not included. Then the model location and materials are assigned using the Rhino-DIVA plugin. The location input using TMY2 weather data, which provides hourly solar insolation to simulate the hourly condition of the sky and the sun for each climate context. The inputs of the material components reflectance/transmissivity coefficients are customised using a radiance material file according to the design requirements; being the same in all simulations run. Then in Grasshopper-DIVA sets the daylight evaluation parameters. The sensor grid height is at 0.80m from the floor surface, and the node distance is 0.50m from each other (256 sensors). The annual occupation schedule from 8h00 to 18h00 as a typical office in Chile, and the real Perez Sky-Weather model of the city is used to run the dynamic simulation in each context. Furthermore, the inputs parameters for SDA, ASE, and UDI metrics, are configured following the scheme review in Table 2.
The output data of the dynamic simulation represents the average annual illuminance of the 256 sensors, quantified according to the SDA, ASE, or UDI criteria of each simulated case. Also provide the illuminance distribution map for each metric, where the daylight pattern of the proposed designs can be analysed in terms of daylight provision and overlit areas. In reference to the upper limits ASE / UDI-e, the illuminance maps show possible unfavourable positions to analyse the glare of a point-in-time.
DGP index simulation in the Diva-for-Rhino software analysed the subject's field of view of a seated position at 1.20m height from the floor surface. The evaluation should preferably be done annually, but in the study is performed a point-in-time glare analysis in critical moments of the year. On a typical winter day (June 21), summer day (December 21), spring day (September 21), and autumn day (March 21); since the interest is to visualise the risks of glare in a visual scene, and thus validate the results provided by the upper-lits ASE and UDI-e measured in the horizontal work plane.
2.3. Definition of design criteria for daylighting
Passive design strategies are related to many aspects of the building, such as the form and orientation, the opaque envelope components, the windows-to-wall area, glazing type, shading devices [39]. The design recommendations developed by leading entities in advanced energy and daylight design have been thoroughly reviewed documentation, with their main contribution to the definition of criteria for side-lit office spaces, are numbered below.
- Advanced energy design guide for small and medium-sized office buildings [40] provides recommendations to achieve significant energy-savings. In the daylight section address criteria for different climate zones.
- Daylighting guide for commercial office [41] focuses on criteria to optimise daylighting in office interiors.
- Manual of passive design and energy efficiency in public buildings in Chile [42] contextualise criteria in local climates.
- Daylighting pattern guide [43] and Ilumina Chile [44], are extensively reviewed as design tools with daylight performance of different solutions applied in vertical fenestrations under various sky conditions.
- C. Robbins, Daylighting Design and Analysis, Van Nostrand Reinhold Company, New York, 1986.
- HMG, Heschong Mahone Group, "Windows and offices: A study of office worker performance and the indoor environment. Technical Report," California Energy Commission, California, 2003.
- IDAE, Guía Técnica de Aprovechamiento de la Luz Natural en la Iluminación de Edificios, Madrid: Comité Español De Iluminación, 2005.
- F. Nicol, M. Wilson and C. Chianccarella, Using field measurements of desktop illuminance in European Offices to investigate its dependence on outdoor conditions and its effects on occupant's satisfaction, and the use of lights and blinds, Energy and Buildings 7 (2006) 802-8013. https://doi.org/10.1016/j.enbuild.2006.03.014
- K. Konis, Evaluating daylight effectiveness and occupant visual comfort in a side-lit open-plan office building in San Francisco, Building and Environment 59 (2013) 662-677. https://doi.org/10.1016/j.buildenv.2012.09.017
- S. Grynning, N. Lollli, S. Wagø and B. Risholt, Solar Shading in Low Energy Office Buildings - Design Strategy and User Perception, Journal of Daylighting 4 (2017) 1–14. https://doi.org/10.15627/jd.2017.1
- M. Bodart, W. Bustamante and F. Encinas, Iluminación Natural de Edificios de Oficina, ARQ. 76 (2010) 44-49. https://dx.doi.org/10.4067/S0717-69962010000300007
- W. Bustamante, S. Vera, A. Prieto and C. Vásquez, Solar and Lighting Transmission through Complex Fenestration Systems of Office Buildings in a Warm and Dry Climate of Chile, Sustainability 6 (2014) 2786-2801. https://doi.org/10.3390/su6052786
- W. Bustamante, F. Encinas, A. Pino and R. Otárola, Strategies for improving thermal performance and visual comfort in office buildings of Central Chile, in: Proceedings of the 27th International Conference on Passive and Low Energy Architecture, Louvain la Neuve, 2011.
- A. Pino, W. Bustamante, F. Encinas and R. Escobar, Thermal and lighting behaviour of office buildings in Santiago of Chile, Energy and Buildings 38 (2012) 661-672. https://doi.org/10.1016/j.enbuild.2011.12.016
- S. Stevanović, Optimisation of passive solar design strategies: A review, Renewable and Sustainable Energy Reviews 25 (2013) 177-196. https://doi.org/10.1016/j.rser.2013.04.028
- H. Poirazis, Å. Blomsterberg and M. Wall, Energy simulations for glazed office buildings in Sweden, Energy and Buildings 40 (2008) 1161-1170. zzzzzz
- T. Kolås, Performance of Daylight Redirecting Venetian Blinds for Sidelighted Spaces at High Latitudes, Trongheim, 2013.
- P. Zambrano Prado, Control Solar e Iluminación Natural en la Arquitectura Dispositivos de Control Solar Fijos en Clima Semicálido-Subhúmedo, 2013.
- R. Perez, R. Seals and J. Michalsky, Modeling Sky Luminance Angular Distribution for Real Sky Conditions: Experimental Evaluation of Existing Algorithms, Journal of the Illumination Engineering Society 21 (1992) 84–92. https://doi.org/10.1080/00994480.1992.10748005
- CIE, Commission International de l'Eclairage, Spatial Distribution of Daylight––CIE Standard General Sky, CIE Publication No. S 011/E, 2003. https://doi.org/10.3403/03017584
- M. B. Piderit, C. Cauwerts and M. Diaz, Definition of The CIE Standard Skies and Application of High Dynamic Range Imaging Technique to Characterise the Spatial Distribution of Daylight in Chile, Journal of Construction 13 (2014) 22-30. https://doi.org/10.4067/s0718-915x2014000200003
- S. Kleindienst, M. Andersen and M. Bodart, Graphical Representation of Climate-Based Daylight Performance to Support Architectural, LEUKOS The Journal of the Illuminating Engineering Society of North America 5 (2013) 39–61. https://doi.org/10.1080/15502724.2008.10747628
- A. Nabil and J. Mardaljevic, Useful daylight illuminances: A replacement for daylight factors, Energy and Buildings 38 (2006) 905-913. https://doi.org/10.1016/j.enbuild.2006.03.013
- C. Reinhart and O. Walkenhorst, Validation of dynamic RADIANCE-based daylight simulations for a test office with external blinds, Energy and Buildings 33 (2001) 687-697. https://doi.org/10.1016/s0378-7788(01)00058-5
- EFA, Education Finance Agency, Priority School Building Programme (PSBP). PSBP 2: Documents and Overview. Gov.Uk. 2° ed., 2015.
- J. Mardaljevic, Daylight, Indoor Illumination, and Human Behavior, Encyclopedia of Sustainability Science and Technology Springer-Verlag New York Inc., pp. 2804-2846, 2012. https://doi.org/10.1007/978-1-4419-0851-3_456
- J. Mardaljevic, M. Andersen, N. Roy and J. Christoffersen, "Daylighting Metrics: Is There a Relation Between Useful Daylight Illuminance and Daylight Glare Probability?" Building Simulation and Optimization Conference BSO12, 2009.
- IESNA, Illuminating Engineering Society, "Approved Method: IES Spatial Daylight Autonomy (SDA) and Annual Sunlight Exposure (ASE), IES Document LM-83," Illuminating Engineering Society, New York, 2012.
- C. Reinhart, Opinion: Climate-Based Daylighting Metrics in Leedv4 - A Fragile Progress, Lighting Research and Technology 47 (2015) 388-388. https://doi.org/10.1177/1477153515587613
- J. A. Veitch, K. E. Charles, G. R. Newsham, C. J. Marquardt and J. Geerts, Environmental Satisfaction in Open-Plan Environments: 5. Workstation and Physical Condition Effects, Ottawa, Canada, 2003.
- T. Leung, P. Rajagopalan and R. Fuller, Performance of A Daylight Guiding System in an-Office Building, Solar Energy 94 (2013) 253-265. https://doi.org/10.1016/j.solener.2013.05.004
- M. Trudeau, C. Li and A. Frisque, Modeling for Daylight Autonomy for LEED V4 – Implications for Cities in Northern Latitudes, in Conference Paper IBPSA, Vancouver, 2016.
- E. Brembilla, J. Mardaljevic and C. Hopfe, Sensitivity Analysis Studying the Impact of Reflectance Values Assigned in Climate-Based Daylight Modelling, in: Proceedings of Building Simulation Conference 2015, Hyderabad.
- A. R. Webb, Considerations for Lighting in The Built Environment: Non-Visual Effects of Light, Energy and Buildings 38 (2006) 721 727. https://doi.org/10.1016/j.enbuild.2006.03.004
- USGBC, U.S. Green Building Council, LEEDv4 Reference Guide for Building Design and Construction, Washington DC, 2013.
- USGBC, LEED Interpretation, ID#100002149, U.S. Green Building Council, 2017, Available: https://www.usgbc.org/leedaddenda/100002149, Accessed: 18 June 2019.
- Spain GBC, LEEDv4 Diseño y Construcción de Edificios, 2014, retrieved 18 June 2019.
- C. Pierson, J. Wienold and M. Bodart, Daylight Discomfort Glare Evaluation with Evalglare: Influence of Parameters and Methods on the Accuracy of Discomfort Glare Prediction, Buildings 8 (2018) 94 1-33. https://doi.org/10.3390/buildings8080094
- J. Wienold and J. Christoffersen, Evaluation methods and development of a new glare prediction model for daylight environments with the use of CCD cameras, Energy and Buildings 38 (2006) 743-757. https://doi.org/10.1016/j.enbuild.2006.03.017
- V. Costanzo, G. Evola, L. Marletta and F. Pistone Nascone, Application of climate-based daylight modelling to the refurbishment of a school building in Sicily, Sustainability 10 (2018) 2653. https://doi.org/10.3390/su10082653
- CEN European Daylight Standard, BS/EN 17037:2018 Daylight in buildings, 2018.
- Diva-For-Rhino, Version 5.0, [Online]. Available: http://diva4rhino.com/. [Accessed 18 06 2019].
- S. Stevanović, Optimisation of passive solar design strategies: A review., Renewable and Sustainable Energy Reviews 25 (2013) 177-196. https://doi.org/10.1016/j.rser.2013.04.028
- ANSI/ASHRAE/IESNA, Advanced Energy Design Guide for small to medium office buildings, ISBN 978-1-936504-05-3, Atlanta, 2011, Reposted with errata dated 2014.
- AEO/NBI/IDL/IA, Daylighting Guide for the Commercial Office, United States, 2011, Retrieved June 18 2019.
- IC/CITEC UBB, Manual de Diseño Pasivo y Eficiencia Energética en Edificios Públicos, Instituto de la Construcción. 1° Ed. ISBN: 978-956-8070-04-5, Santiago, 2012.
- NBI/IDL, Advanced Buildings Daylighting Pattern Guide Fact Sheet, University of Idaho, University of Washington, 2012. [Online]. Available: https://patternguide.advancedbuildings.net/. [Accessed June 18 2019].
- UBB, Ilumina Chile, Proyecto FONDECYT No. 11121608-2012. Universidad del Bio-Bio, Facultad de Arquitectura, Construcción y Diseño, 2014. [Online]. Available: http://iluminachile.ubiobio.cl/. [Accessed 18 June 2019].
- N. Ruck, Ø. Aschehoug , J. Christoffersen and S. Aydinli, Daylight in Buildings - A source book on daylighting systems and components, Berkeley: Lawrence Berkeley National Laboratory support from Energy Design Resources., 2000.
- G. Faisal and P. Aldy, Typology of building shading elements on Jalan Sudirman corridor in Pekanbaru, IOP Conference Series: Materials Science and Engineering 128 (2016) 012029. https://doi.org/10.1088/1757-899x/128/1/012029
- H. Alibaba, Determination of Optimum Window to External Wall Ratio for Offices in a Hot and Humid Climate, Sustainability 8 (2016) 187. https://doi.org/10.3390/su8020187
- EN, European Committee for Standardization, Light and lighting - Lighting of workplaces, in EN 12464-1:2002 (E) Part 1 : Indoor work, 2011, pp. 1-43.
- N. Makaremi, S. Schiavoni, A. L. Pisello and F. Cotana, Effects of surface reflectance and lighting design strategies on energy consumption and visual comfort, Indoor and Built Environment 28 (2018) 552-563. https://doi.org/10.1177/1420326x18793170
- H. Sabry, A. Sherif, S. Shawky and T. Rakha, "Assessing the Effect of External Obstruction Parameters on Indoor Daylighting Performance in Desert Clear Sky Conditions," 2010.
- MOP/DECON/CITEC, Términos de Referencia Estandarizados TDRe Confort Ambiental y Eficiencia Energética. Guía Técnica de Apoyo Confort Lumínico N°8, 2° ed., Santiago, 2015.
- IC, Instituto de la Construcción, Manual Evaluación y Calificación CES V1, Santiago De Chile: ISBN: 978-956-8070-11-3, 2014.
Four main daylight strategies are classified to capture, transmit, control, and distribute daylight, as shown in Fig. 2. Then, the application areas are identified to address strategies during the design process, and then classify the different components of the building to design the daylight strategies.
Figure 2
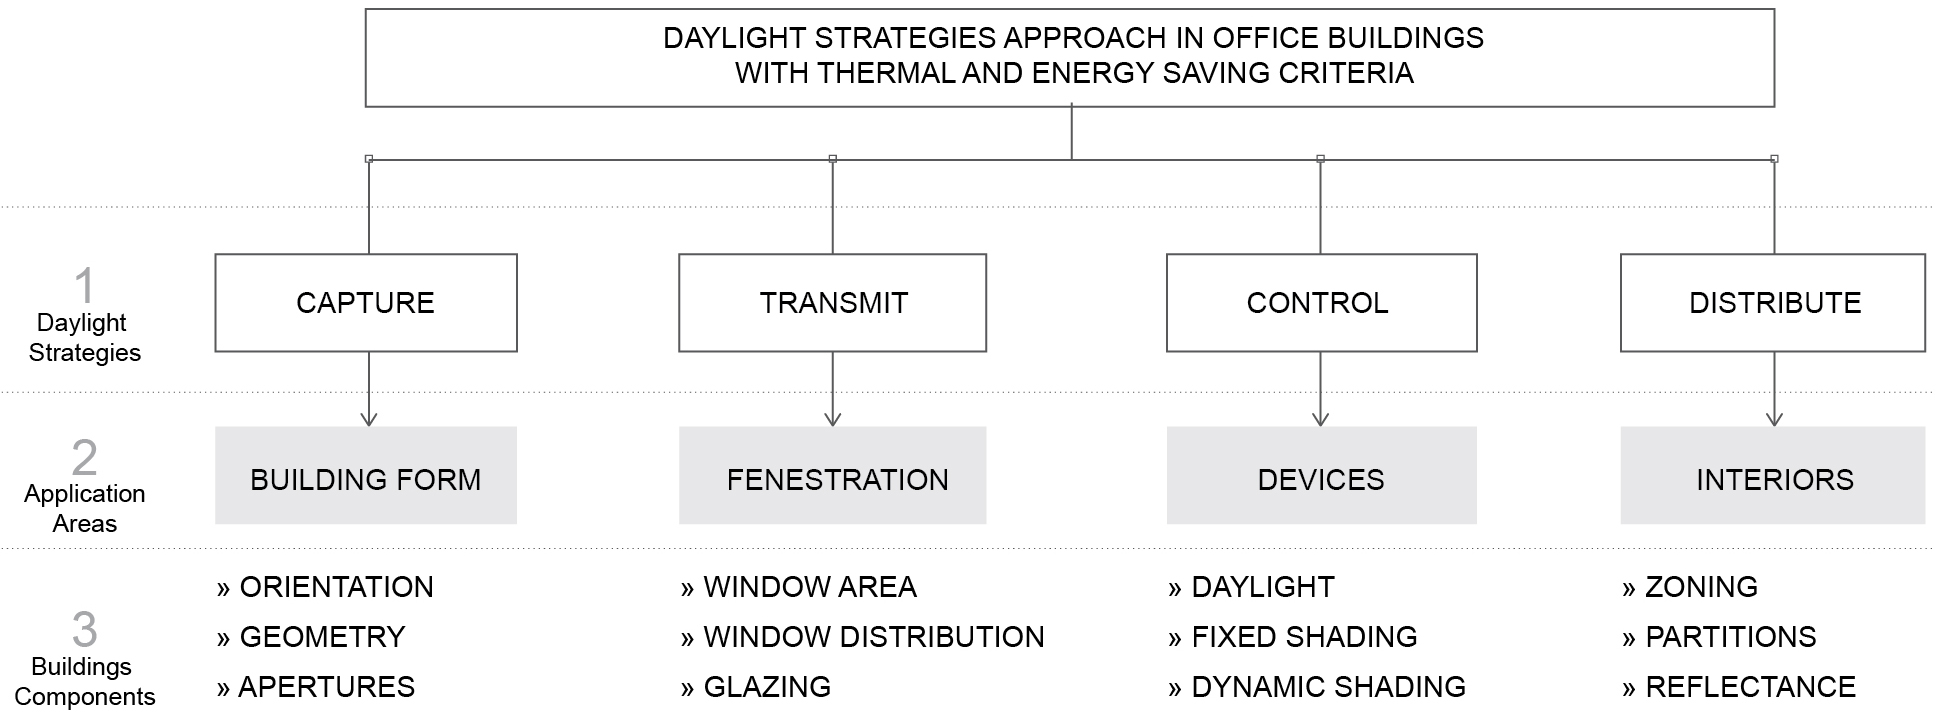
Fig. 2. Daylight strategies approach in the office building.
Table 3 shows the preferable design criteria for office spaces with side lighting. These recommendations are suggested as a guide to achieving a base design with energy savings since energy and thermal simulations are not part of the evaluation of this study. The keys are to minimise the distance between the core and the perimeter, to ensure visual access to outdoors and proper levels of daylighting, coordinate the spatiality as per daylight requirements, and optimise the envelope developing strategies to capture, transmit, and control the daylight/sunlight. The aperture location criteria for daylight capture are not analysed, as this study focuses on lateral illumination in vertical fenestration as an initial hypothesis.
Table 3
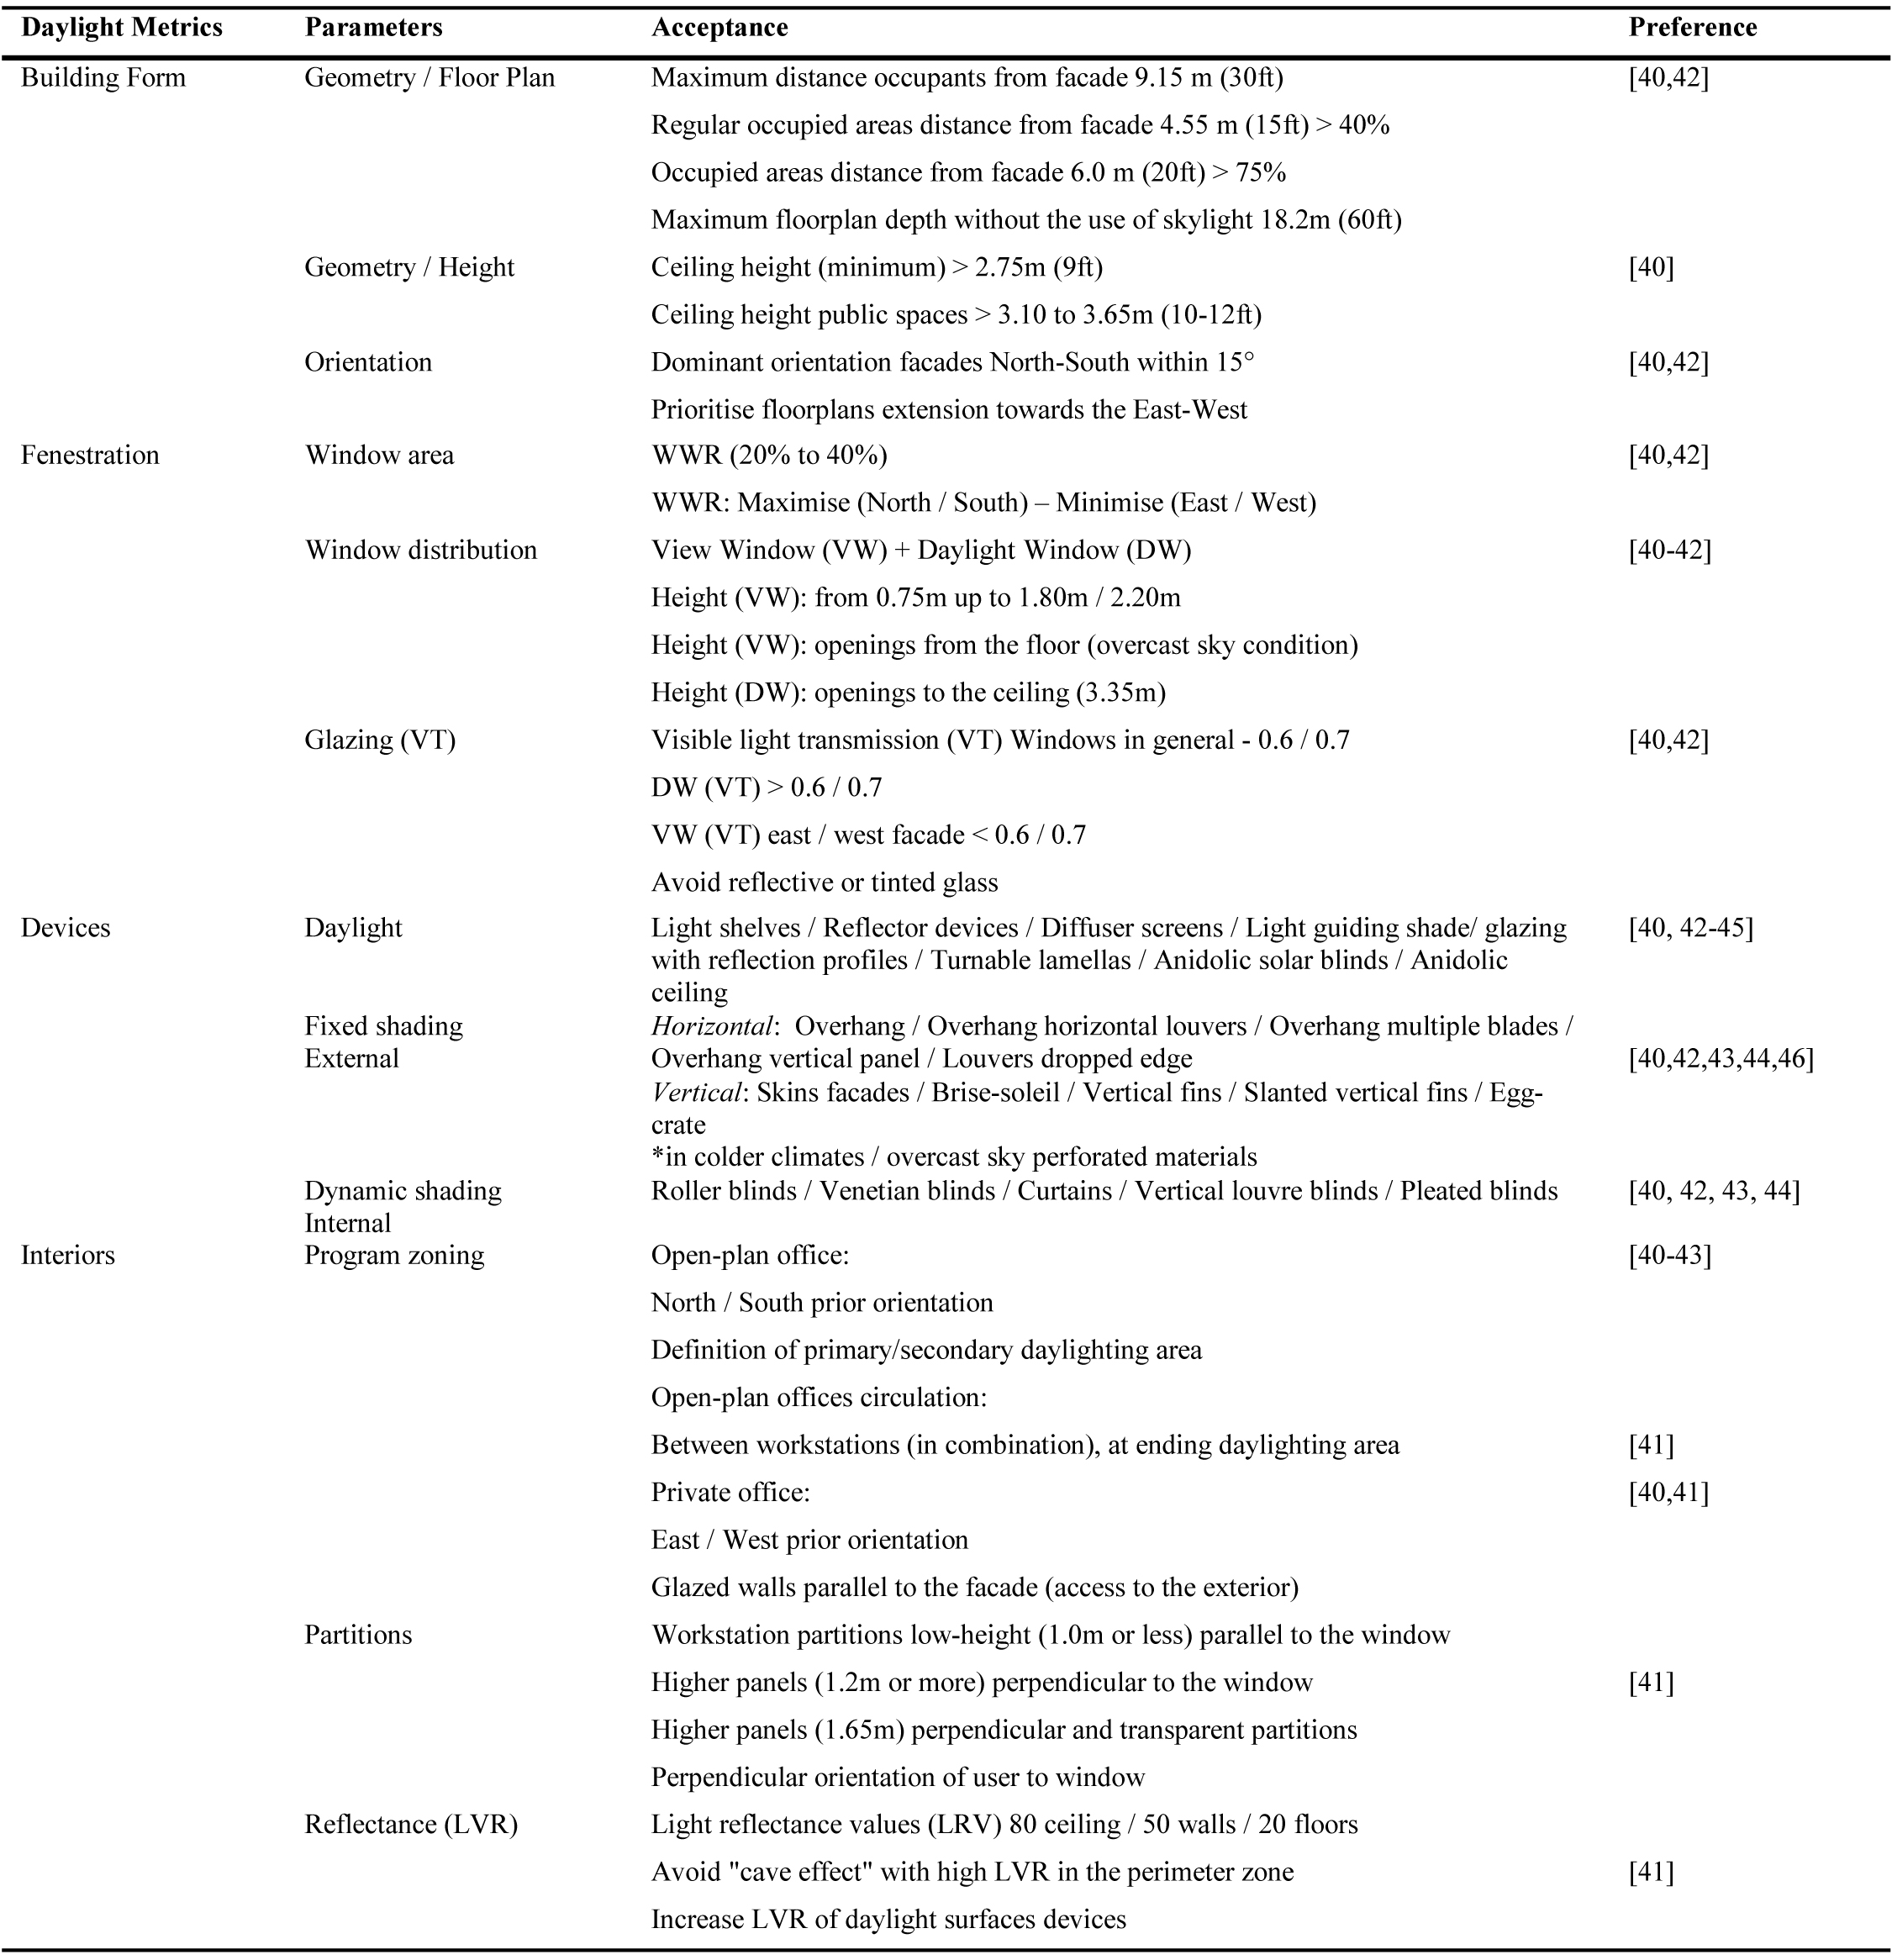
Table 3. Design criteria for side-lit office spaces: applications areas and building components.
3. Evaluation of strategies in side-lit office spaces
3.1. Experimental side-lit office prototype
The experimental office prototype is a theoretical model designed following the criteria in Table 3, meant to be prototype 1. As shown in Fig. 3, it has a simplified geometry as a fixed variable, with a square floor plan with 9.15 m along the sides based on the maximum distance from the occupant to the window to guarantee outside view and daylight provision. The height is 3.00 m increasing the ceiling in the perimeter near the windows to 3.35 m, to improve daylight with a reflective surface.
Figure 3
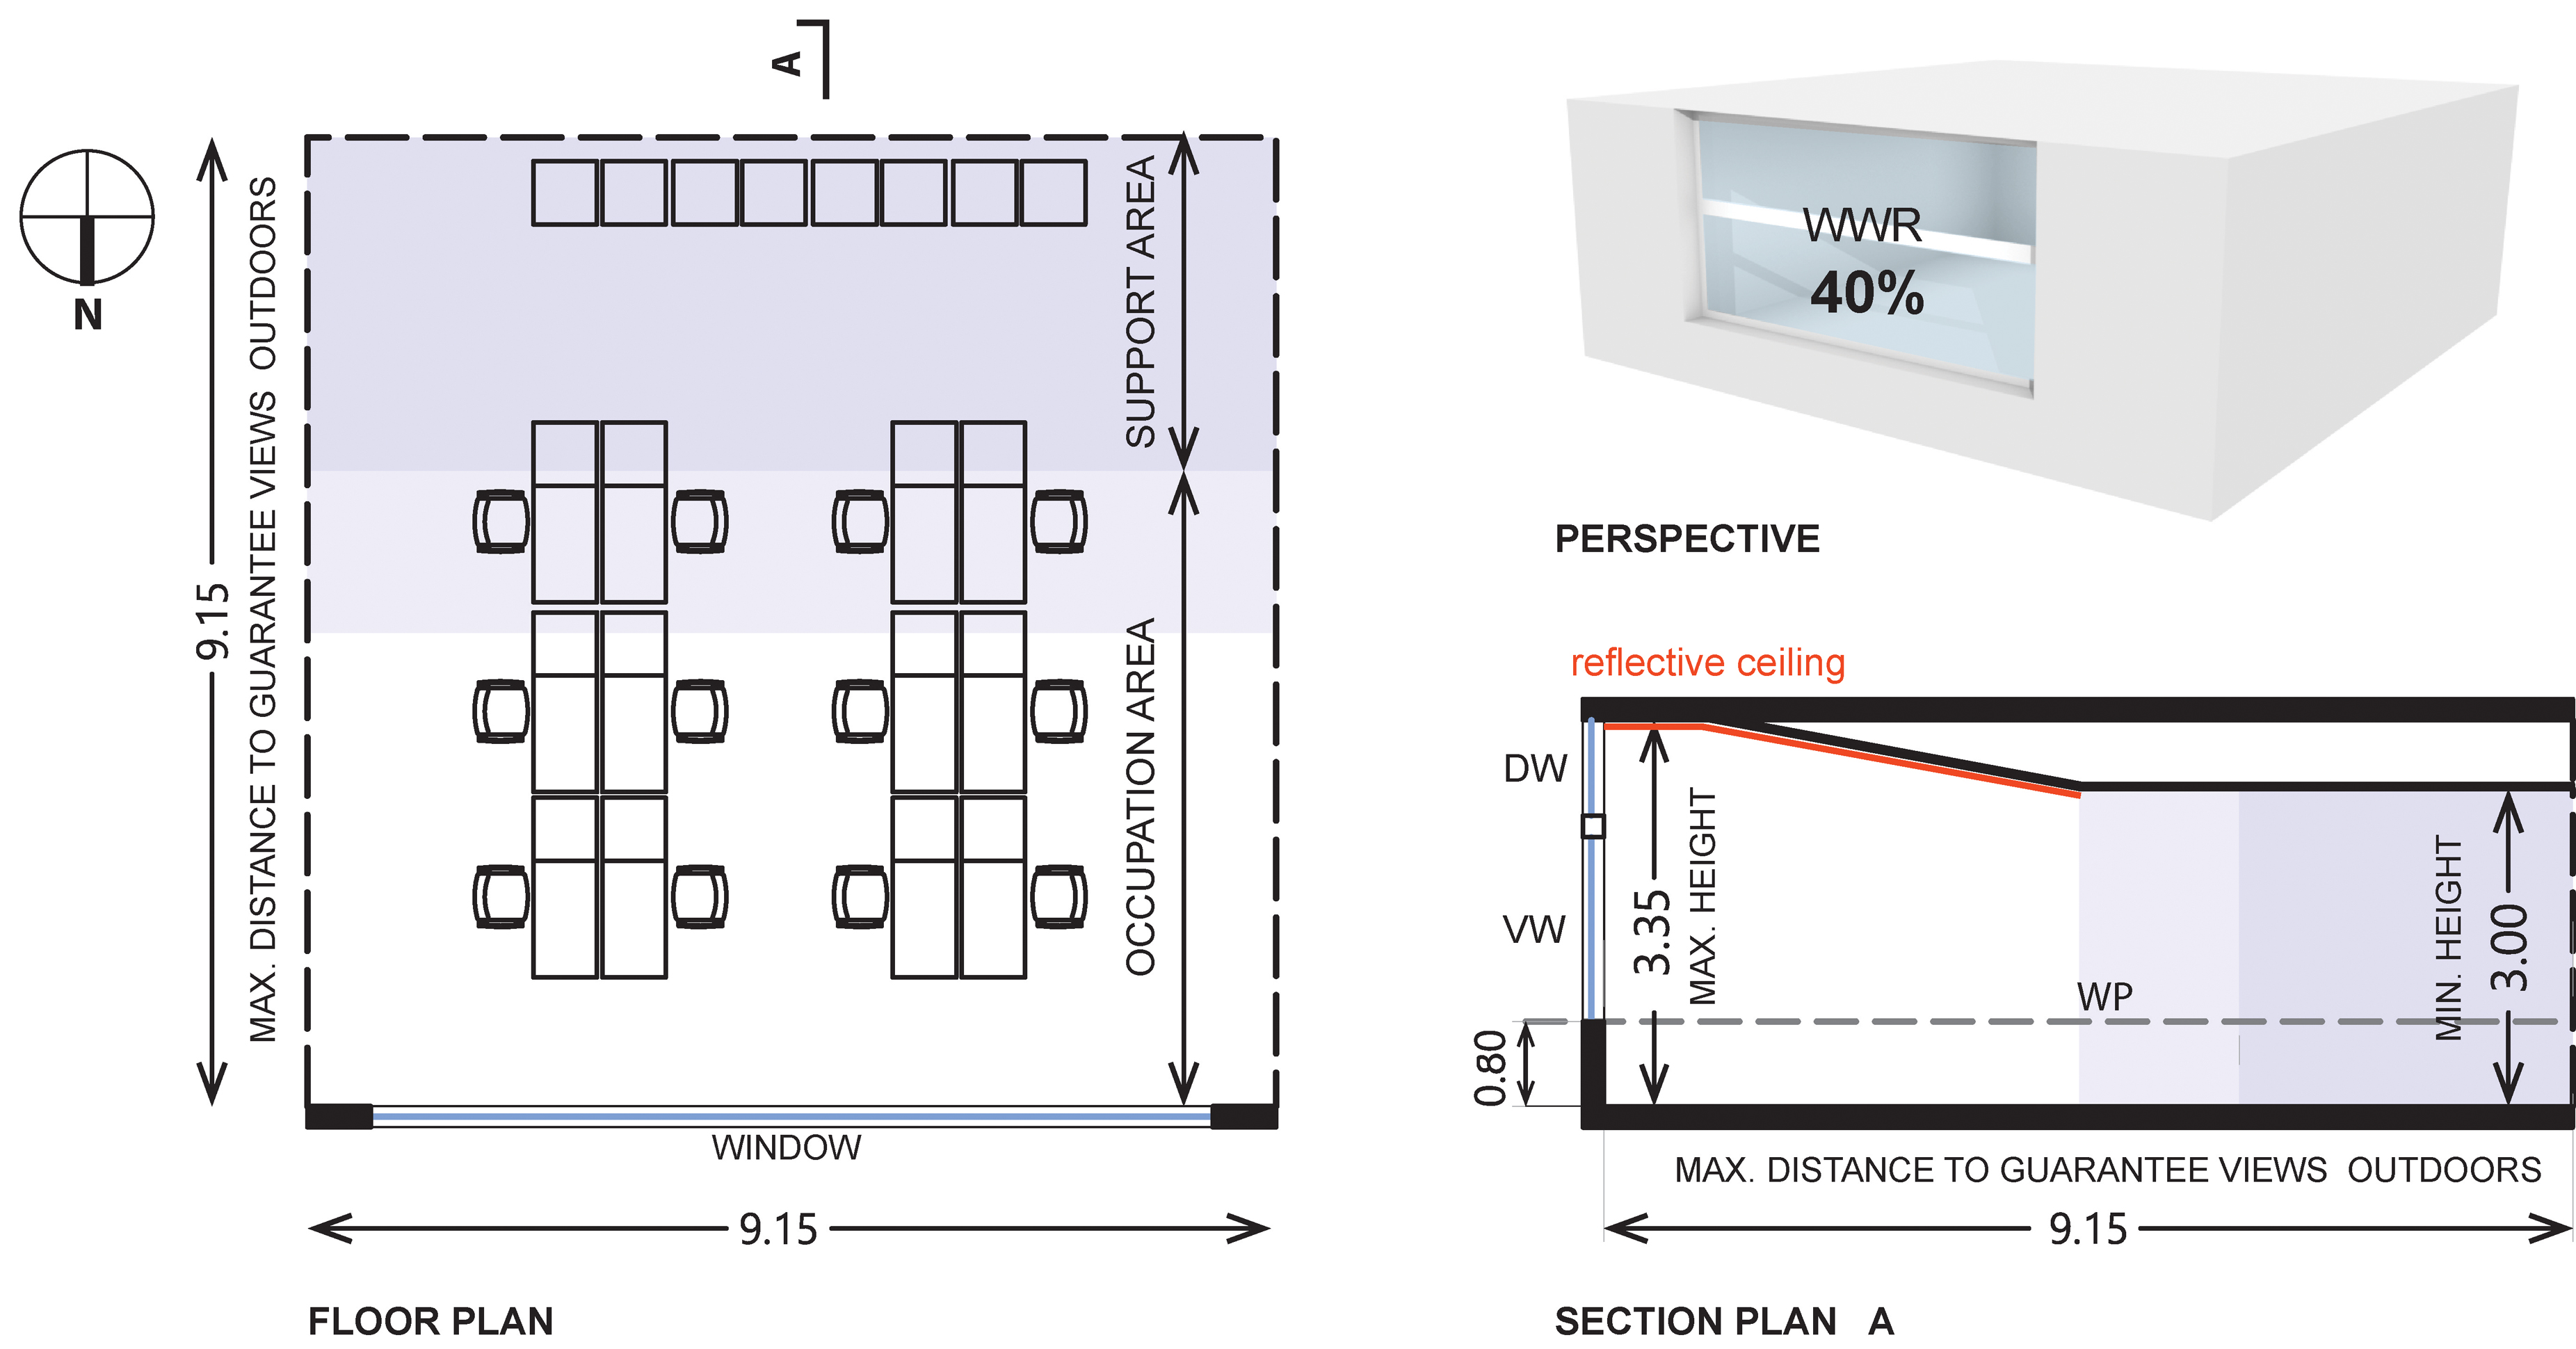
Fig. 3. Design criteria for side-lit office spaces: applications areas and building components.
The orientation of the opening is in the wall facing north, as the recommendations for buildings with energy savings indicate a preferring window oriented to the north and south [40,47] and considering that the development of this work is in the southern hemisphere. The window-wall ratio is WWR 40%, and it is in the centre of the wall. The window size is 5.0 m wide, and 2.5 m high and vertically is divided into two sections: a view window (VW) between 0.8 m and 1.4 m high and a daylight window (DW) from 2.2 m to the ceiling. The beginning of the window at 0.8 m guarantee views out. In the prototype does not consider internal partitions because it is a standard office. Neither solar control nor daylighting devices, because it is a base unit that will be optimised with passive strategies applied in different contexts in the following section.
The surface reflectance values were defined according to the European Standard EN 12464-1:2011 ceiling 0.60-0.90; wall 0.50-0.80; and floor 0.10-0.50 [48]. Other reference values are 0.50 for wall and 0.70 for the ceiling in the case of Low reflective surfaces (Lr) or 0.70 for the ceiling; 0.80 for high reflective ceiling and 0.40 the floor in the case of High reflectance surfaces (Hr) [49]. For fixed external obstructions, 0.50-0.60 equivalent to concrete reflectance measured in other investigations is considered [50]. For the windows, the visible light transmittance is 0.70-0.79 according to the Chilean standardisation codes [51]. The resulting values used as input are listed in Table 4.
Table 4
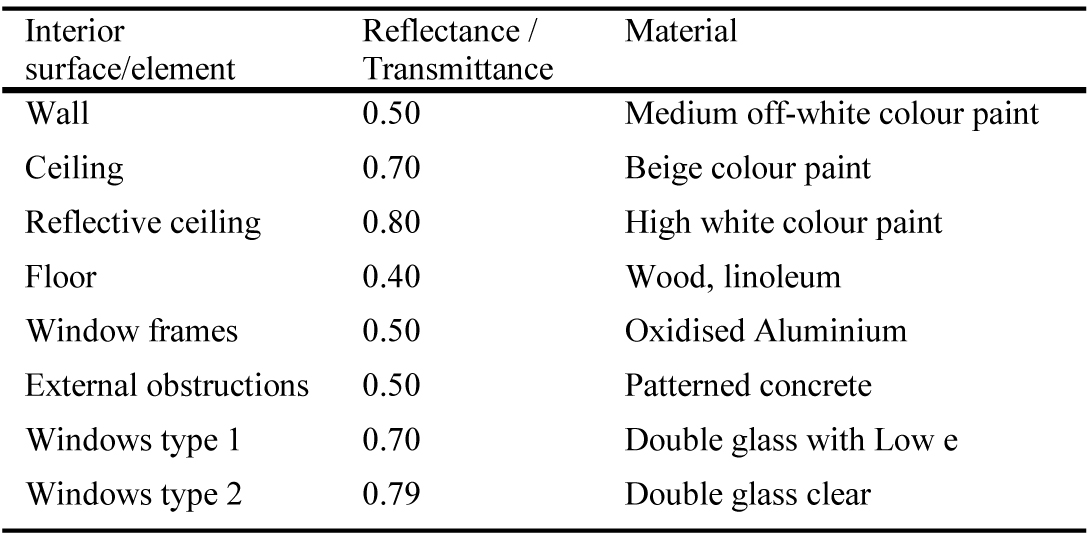
Table 4. Surface reflectance values for office building prototype.
3.2. Optimised daylight strategies for climate contexts
This section develops the optimisation of prototype applying passive strategies in the three cities of Chile. As a result, three models are proposed (one for each city). The optimisation method prioritised the performance of daylight designers to select effective strategies, based on the design tools reviewed [43,44,17]. The criteria depend primarily on the evaluation of the prevailing skies, lighting conditions and the needs for daylight control or distribution.
In the city of Calama, where radiation carries a potential risk of overheating and glare, the goal is to control direct sunlight throughout the year. In Santiago, the focus is on seasonal solar regulation to limit direct sunlight during summer and equinoxes periods; and allowing winter sunlight for passive gain. In Puerto Montt, the criterion is to maximise daylight and capture sunlight in winter and equinoxes periods and limit direct sunlight during summer. Figure 4 shows strategies for each optimised case in an architectural section.
Figure 4
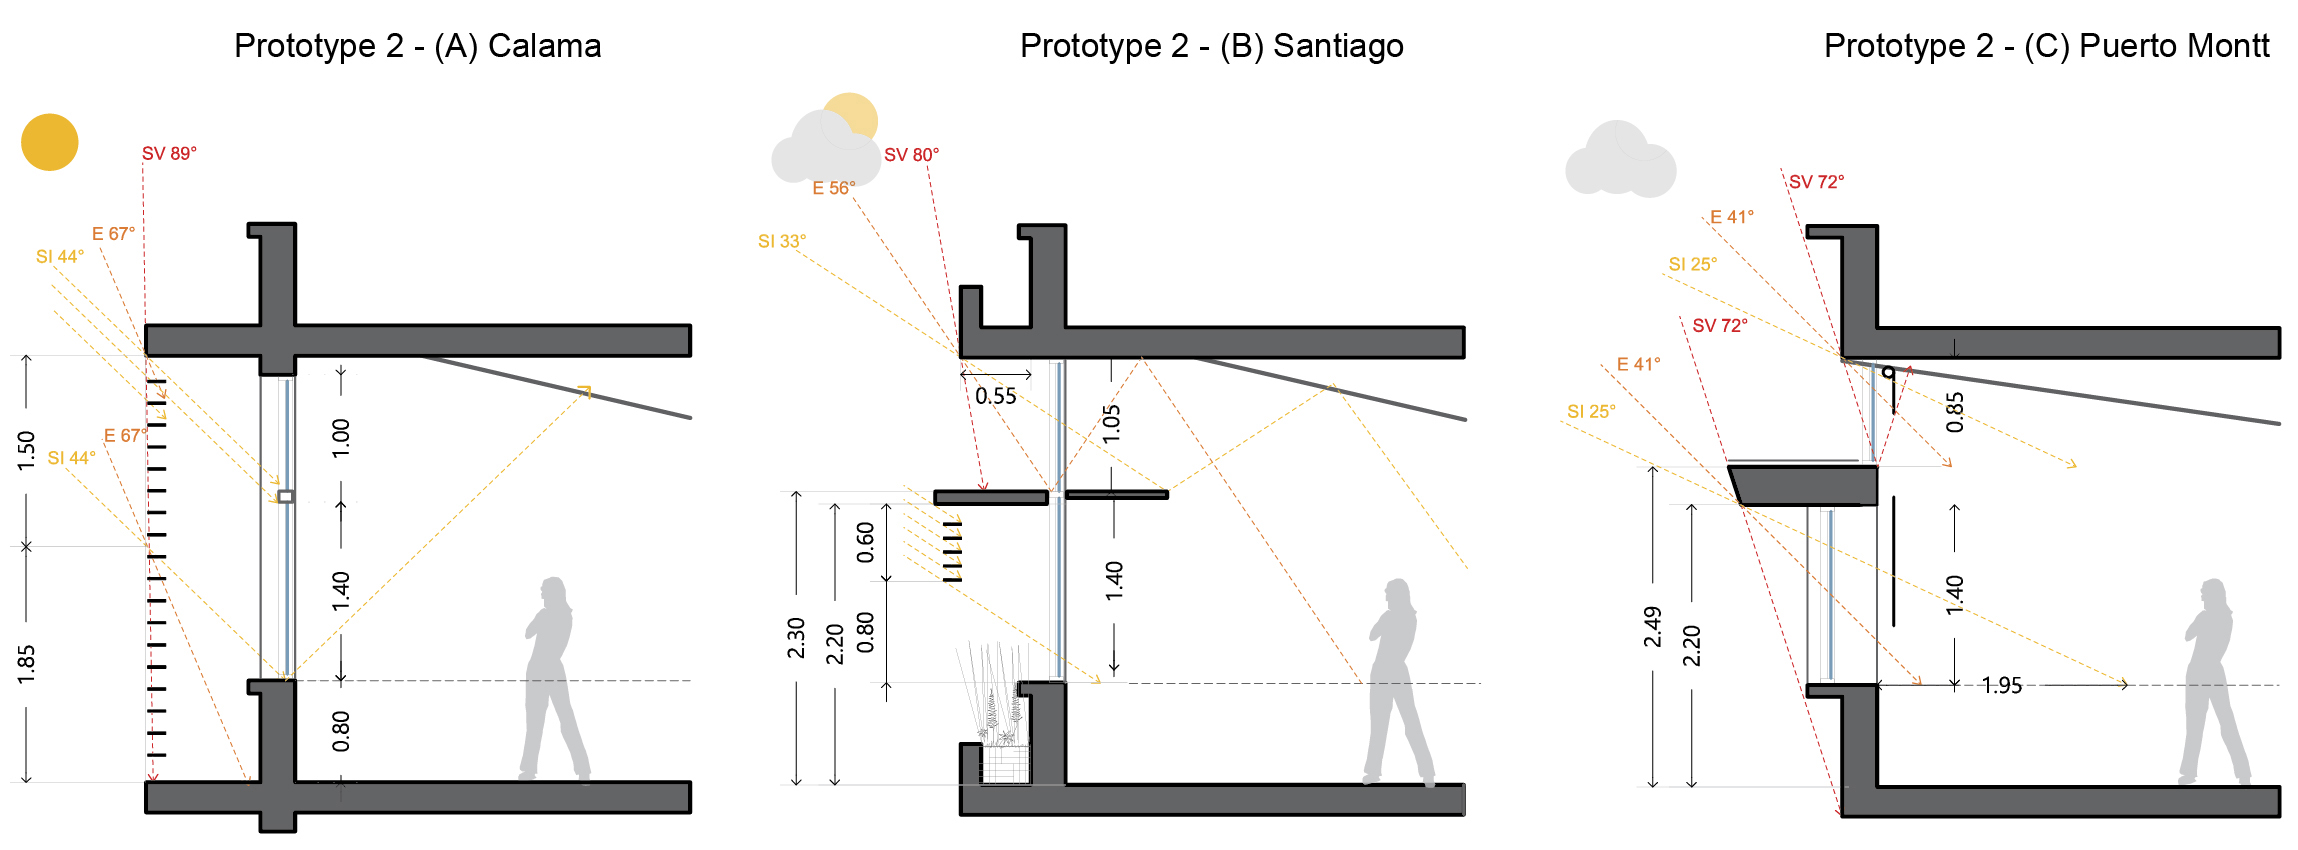
Fig. 4. Prototype 2: optimised models with passive solar strategies in different climate contexts.
Table 5 shows the strategies for each case study. They are classified according to sunlight control, daylight distribution, and special considerations for the reflectance of materials or windows. Each one details solutions or devices to apply as fixed and dynamic shading, horizontal overhang, light shelves, diffuser screens, indicating whether the strategy is recommended or not for the context.
Table 5
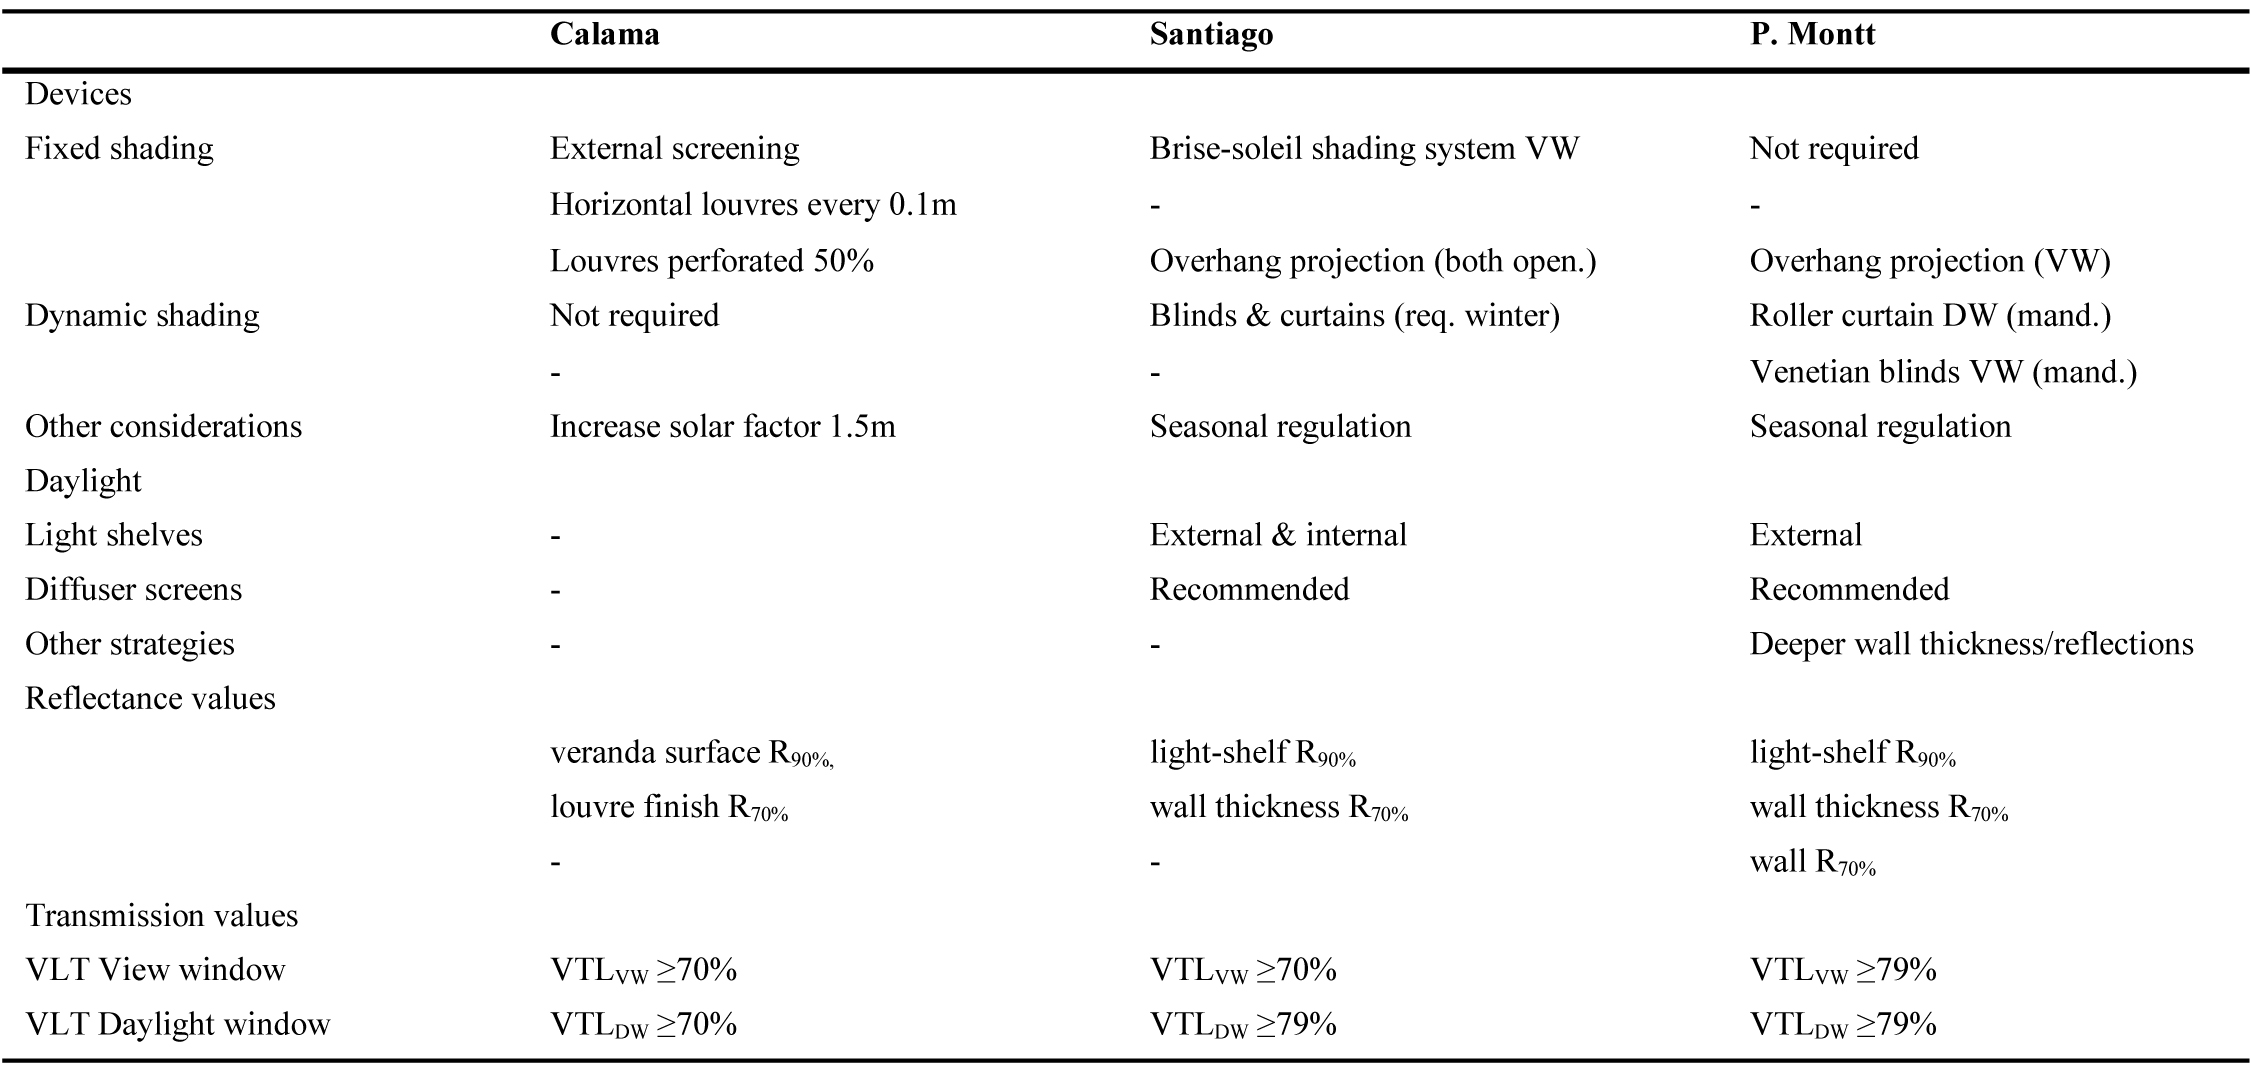
Table 5. Description of strategies applied for the definition of prototype 2 in the different climate contexts.
In the following section, the simulation results of the three 'prototypes 2' models for each climate, are presented and discussed. Also, the experimental office 'prototype 1' and the fully glazed façade 'prototype 3 'are simulated in each context. A total of 9 dynamic simulations are presented (3 prototypes in the 3 study contexts), to compare and discuss the performance of the metrics.
4. Results
4.1. Daylight assessment of optimised models
Daylight results show a false colour scheme with the daylight pattern measured at sensor grid height 0.80m and sensors every 0.50m x 0.50m. Each grid shows the average annual value measured at the sensor during the occupancy hours, representing the annual illuminance sufficiency in SDA300lx, 50%; the direct sunlight more than a specific number of hours per year in ASE1000lx, 250h; and the annual occurrence of daylight quality in the range UDI100-3000lx. Also, the assessment provides a total annual average of the grid values, analysed to determine the compliance with the target values set out in Table 2.
Prototypes 2 mostly achieve the objectives defined for compliance with the metrics, summarised in Table 6.
Table 6
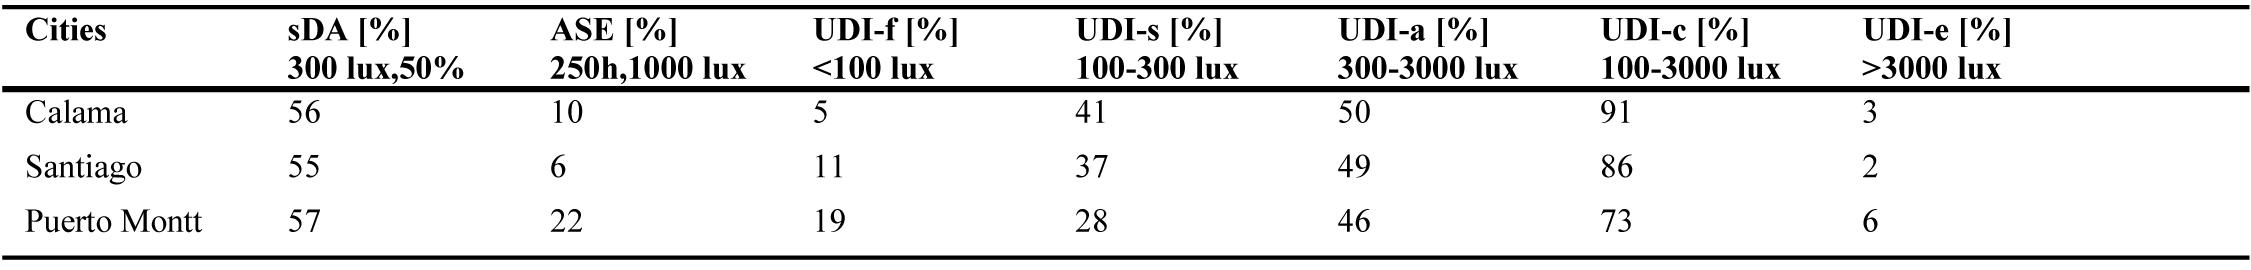
Table 6. Summary of the daylight simulation results of 'prototype 2' by city. (Source: Own elaboration).
Regarding daylight performance prototypes 2, the case of Calama presents an annual average SDA of 56% and ASE of 10%, the range UDI-c indicates 91% and UDI-e is 3%, meeting in all cases the target values. The prototype optimised for Santiago presents an annual average SDA of 55% and ASE of 6%, the range UDI-c indicates 86%, and UDI-e is 2%, fulfilling the target values. The prototype optimised for Puerto Montt presents an annual average SDA of 57% and ASE of 22%, meeting the SDA values but not effectively controlling sunlight. The annual average in the range UDI-c is 73% not meeting the targets, and UDI-e is 6%. This last percentage shows that if other devices were added to control excessive illuminance, UDI-c still below the 80% required, and compliance would not be achieved either.
Regarding the dynamic metrics performance, in all cases, SDA> 55% but not ASE <20% as it does not meet in the Puerto Montt case. It is consistent with the strategies implemented to take advantage of passive solar gains because no dynamic solar devices have been configured in the simulation model. As for the UDI scheme, the Calama and Santiago cases reach a UDI-c > 80% of the given area, but it is not enough for Puerto Montt. It is not caused by excessive illuminance. It is key to see the behaviour of the UDI scheme, where it is noted that there is a large percentage of the area (UDI-f 19%) that does not reach the minimum levels of illumination for comfortable visual environments. Probably because in the diffuse overcast sky, the lighting is low to provide adequate levels of illumination in spaces with side lighting. In this case, the percentage out of range is configured with UDI-f > UDI-e, so to increase UDI-c, it would be necessary to capture more daylight instead of limit glare.
Concerning excessive lighting, false-colour schemes ASE and UDI-e are indicated in the immediate area of the window, being higher in ASE than in UDI-e. Although they show the tendency, it seems that the boundary in ASE is more restricted and accurate to define overlit areas.
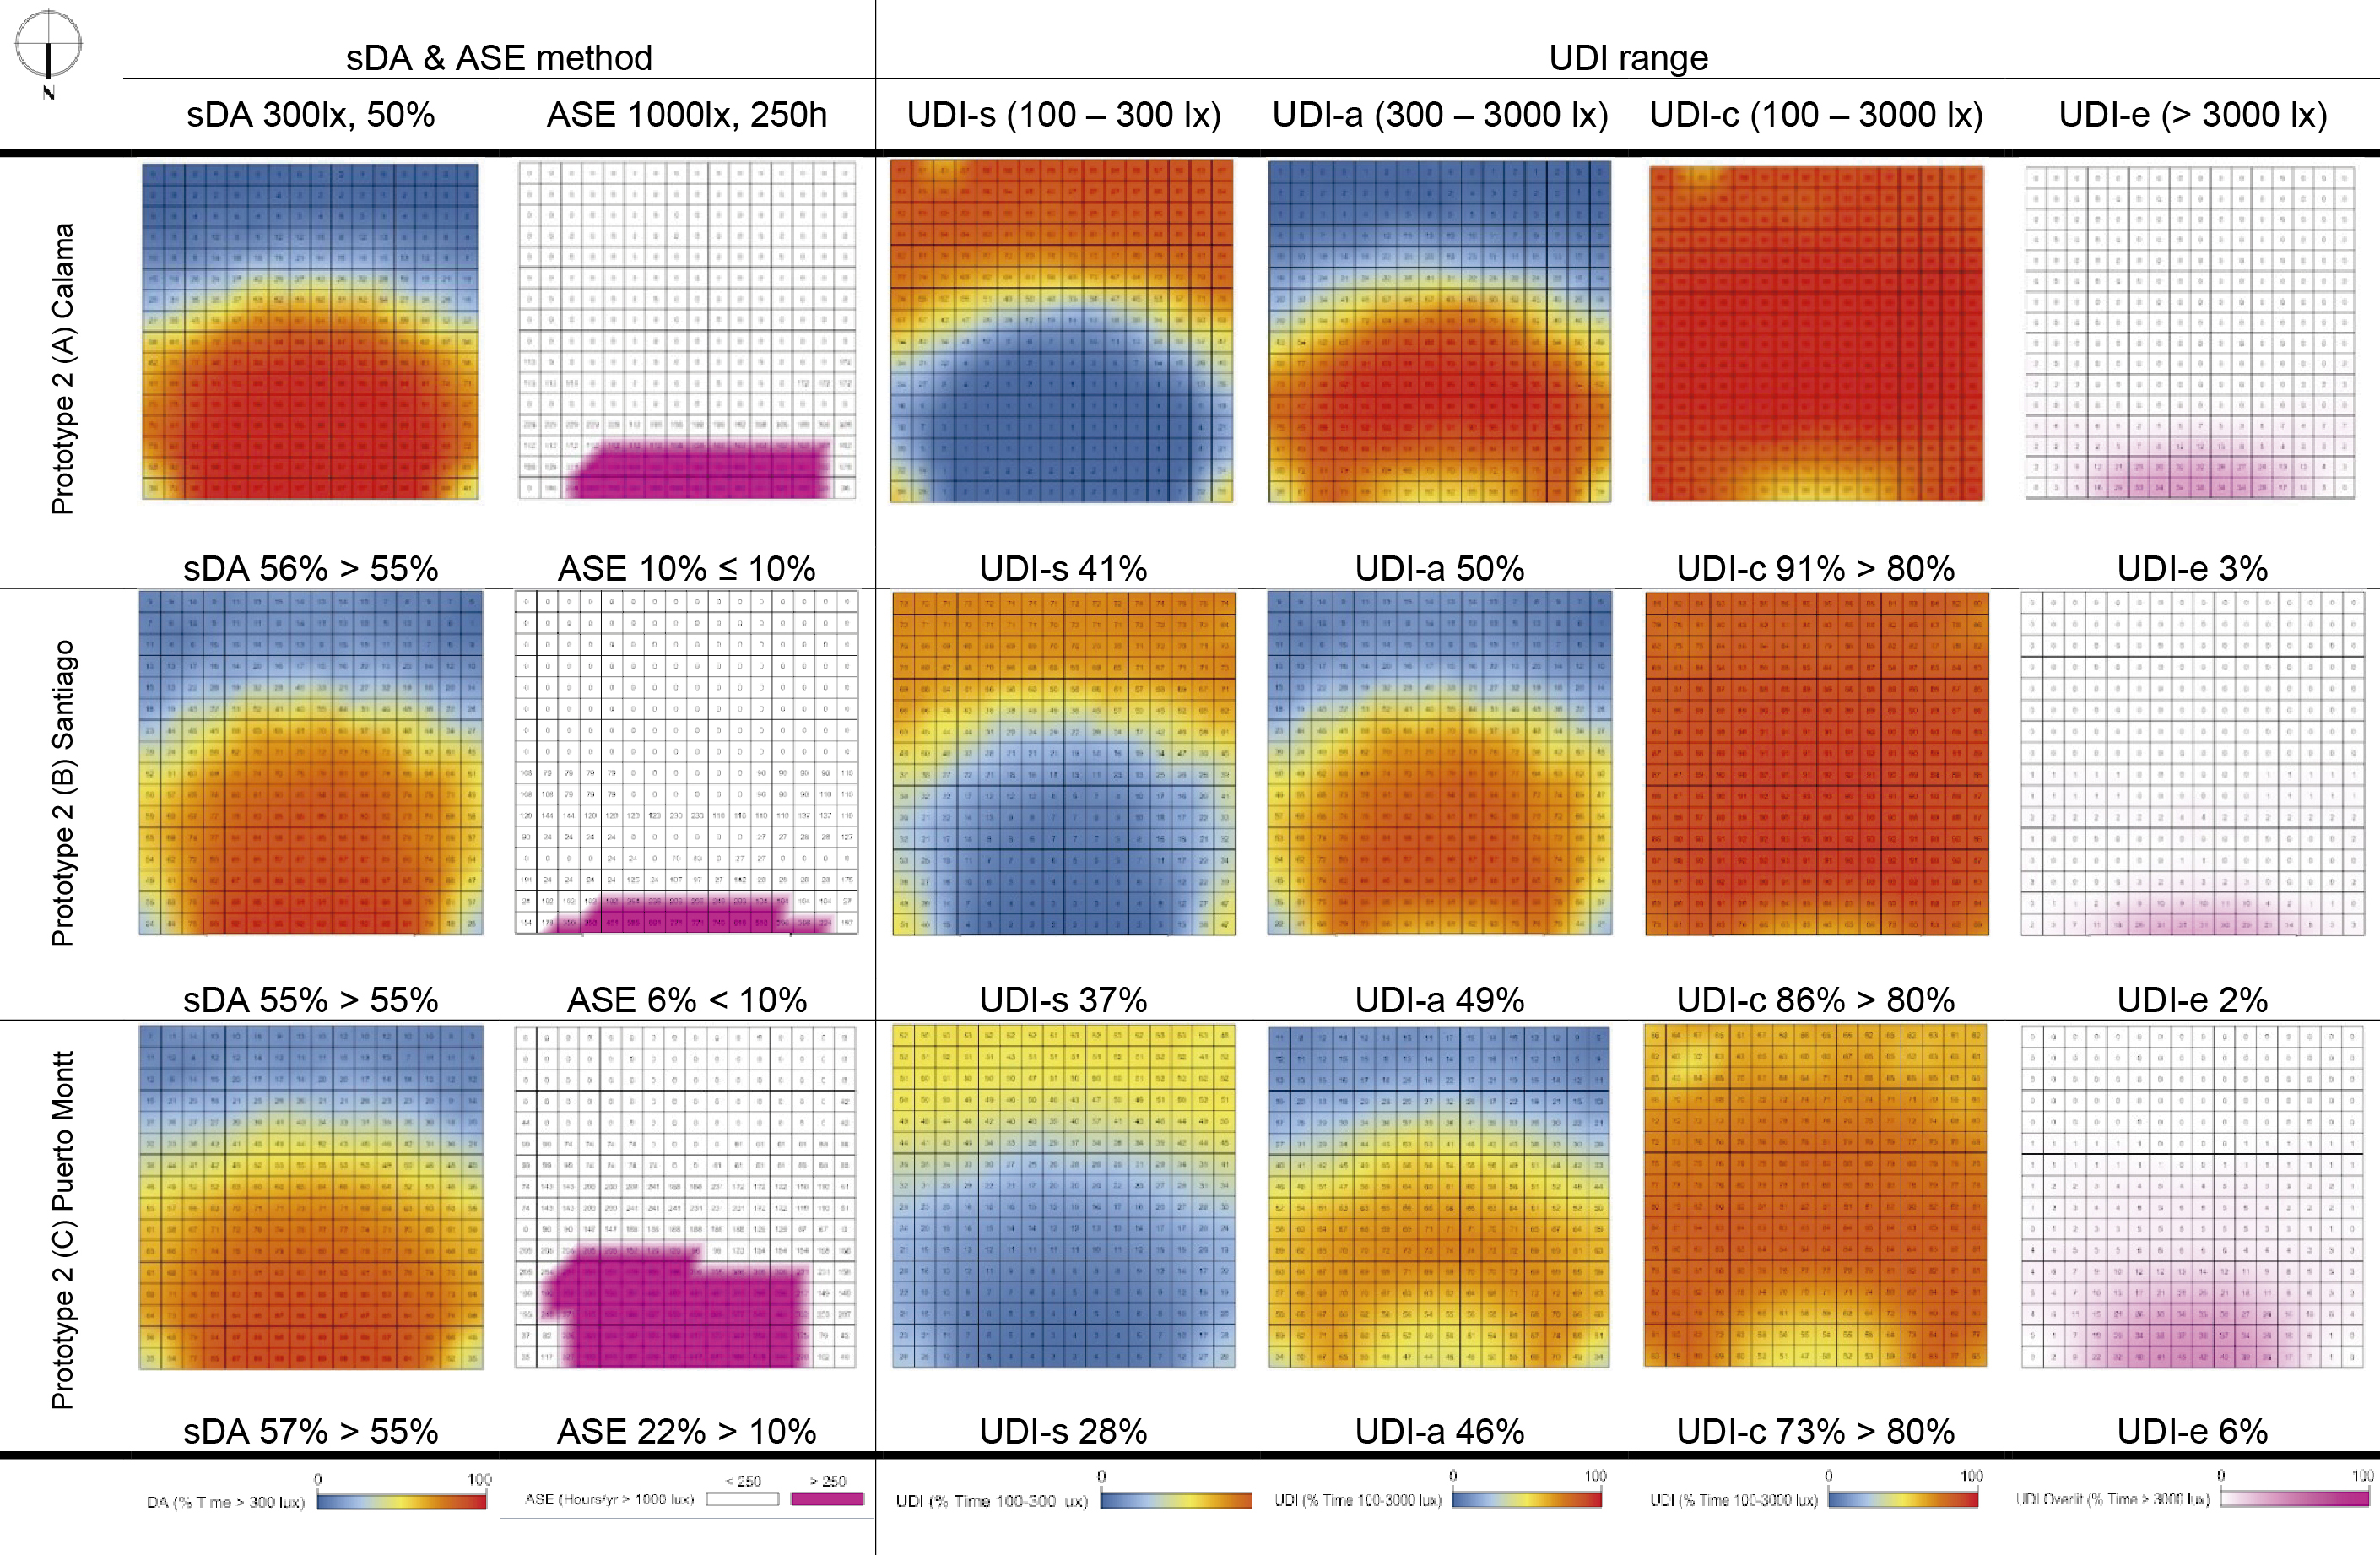
Figure 5 shows the false-colour schemes for the metrics sDA, ASE, UDI-c, UDI-a, UDI-f, and UDI-e resulting from the dynamic simulation for Santiago prototype, indicating the percentage achieved in the optimised model. The complete set of false colours of the six dynamic metrics analysed for each context is given in Appendix A.1.
Figure 5
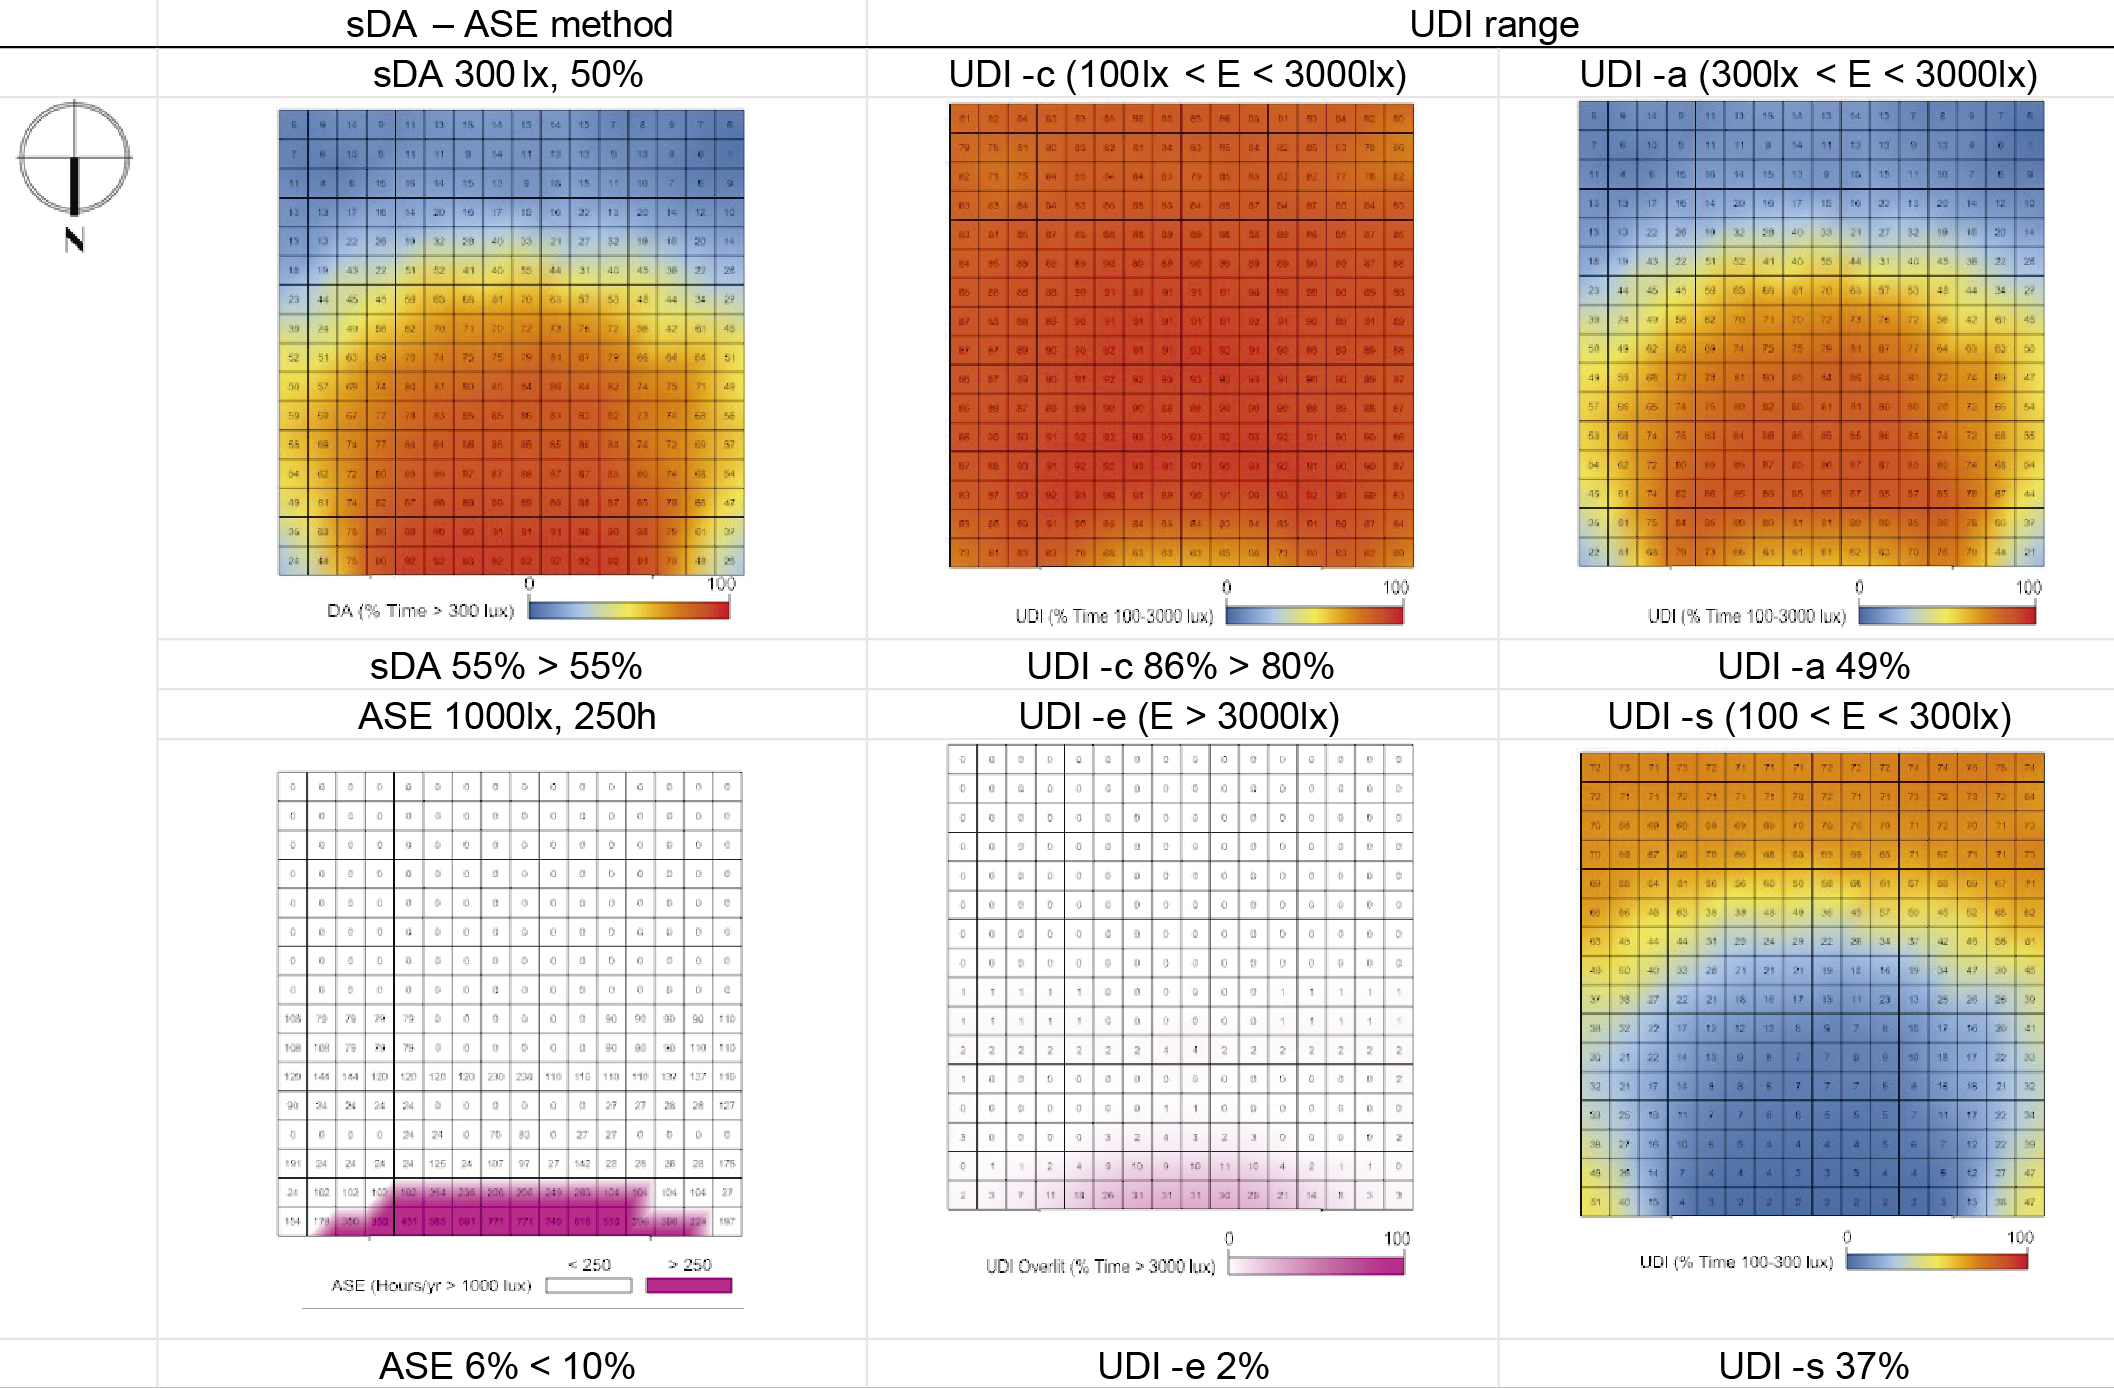
Fig. 5. False-colour schemes of the dynamic simulation for prototype 2- Santiago.
4.2. Daylight glare probability verification
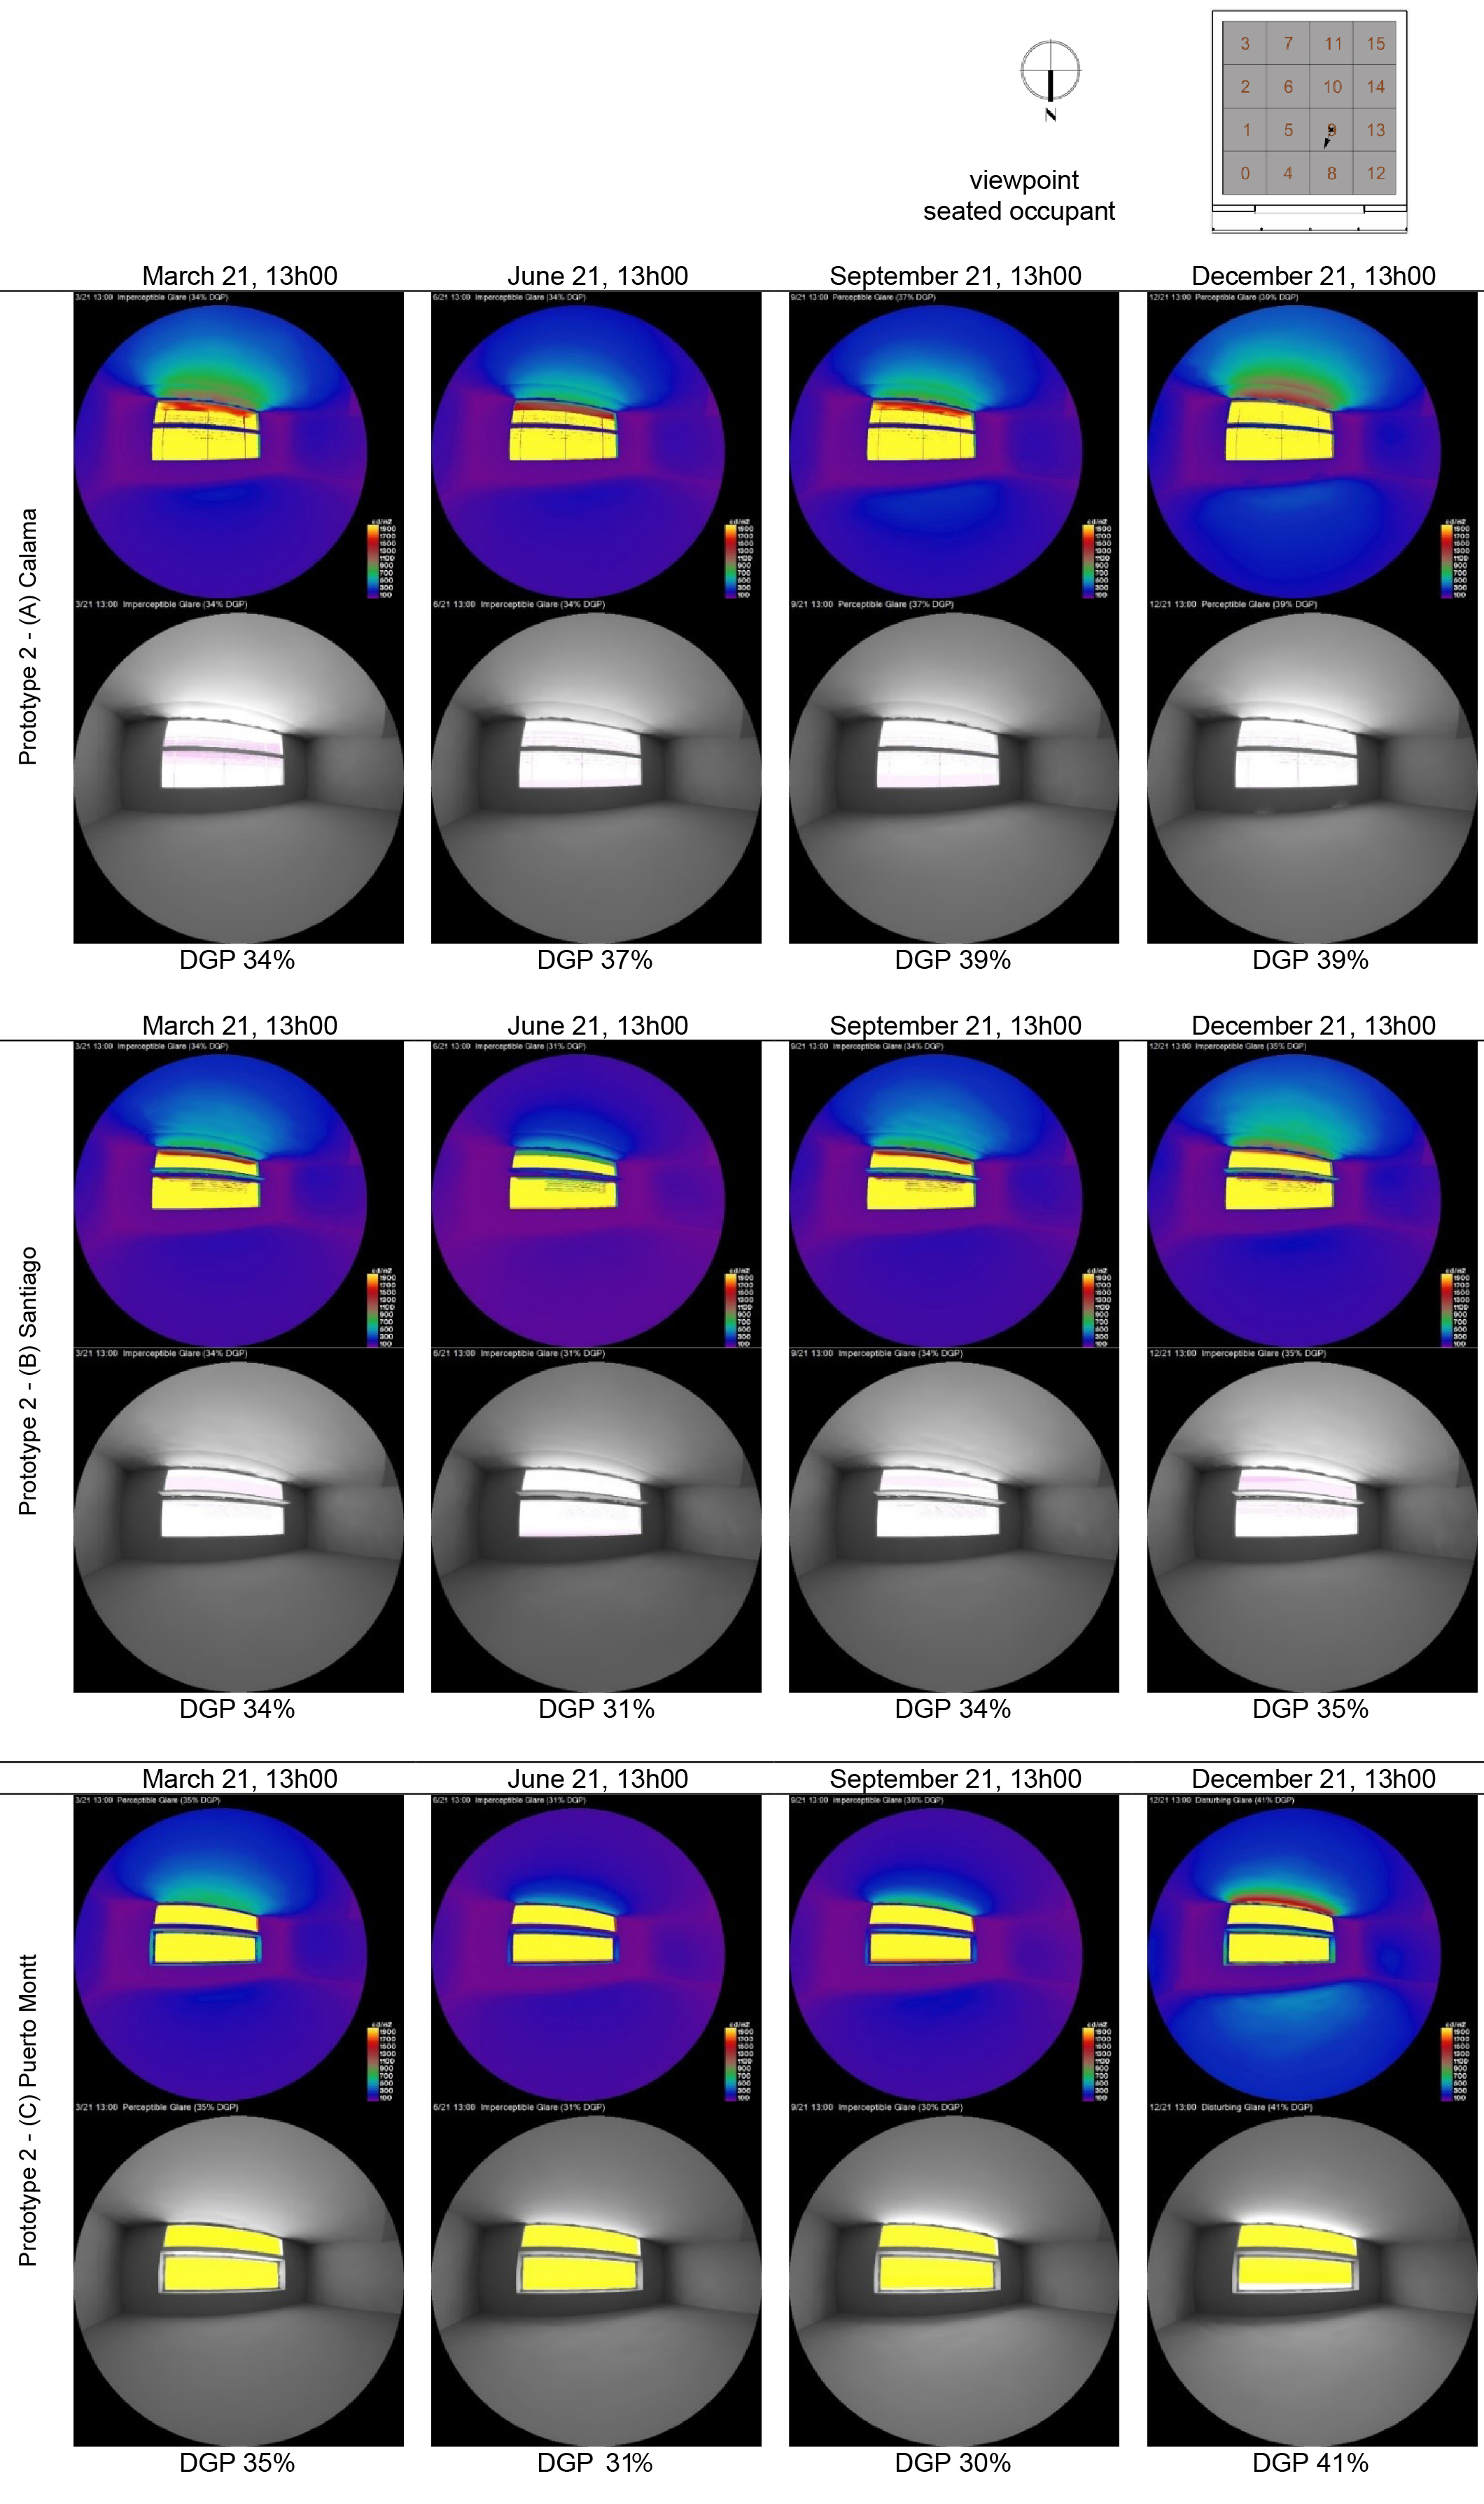
The glare probability is calculated using the DGP index, to detect if discomfort glare occurs in the visual scene and verify the accuracy of the results provided by the upper-lit methods calculated in the previous section. The subject's field of view most unfavourable is objectively analysed as a seat position near the window. It is performed in a point-in-time glare analysis on the 21st day at 13h00 (as it is oriented to the north) in the seasonal periods on the prototypes optimised context. The subject's position and results are summarised in Table 7.
Table 7
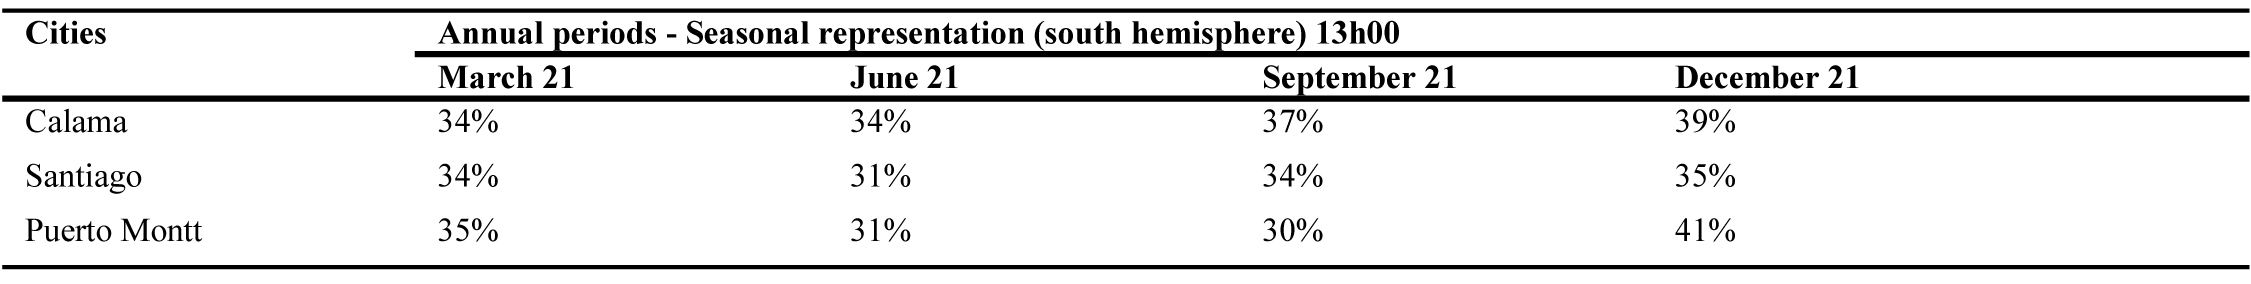
Table 7. DGP results of prototype study 2 in the different climate context.
In Calama and Santiago, the occurrence of glare is imperceptible or perceptible (DGP<40%), so there is no direct sunburst in the field of view, and it is consistent with the prediction results of previous assessment methods. In Puerto Montt, the glare is imperceptible in three seasonal periods, but distorting in December (summer) with DGP 41%. Although in no case exceeds the maximum target defined for verification, DGP<40% is preferable to the efficiency of sunlight control strategies. It is also consistent with previous evaluation methods but permits to identify the period in which distorted high values occur. It is assumed that dynamic solar control devices will be useful to reduce the brightness of direct sunlight exposure in this period.
Figure 6 shows the luminance maps and evalglare scene for 'prototype 2' located in Santiago, indicating the point in time glare probability from the subject's position. The complete set of visual scenes can be found in Appendix A.2.
Figure 6
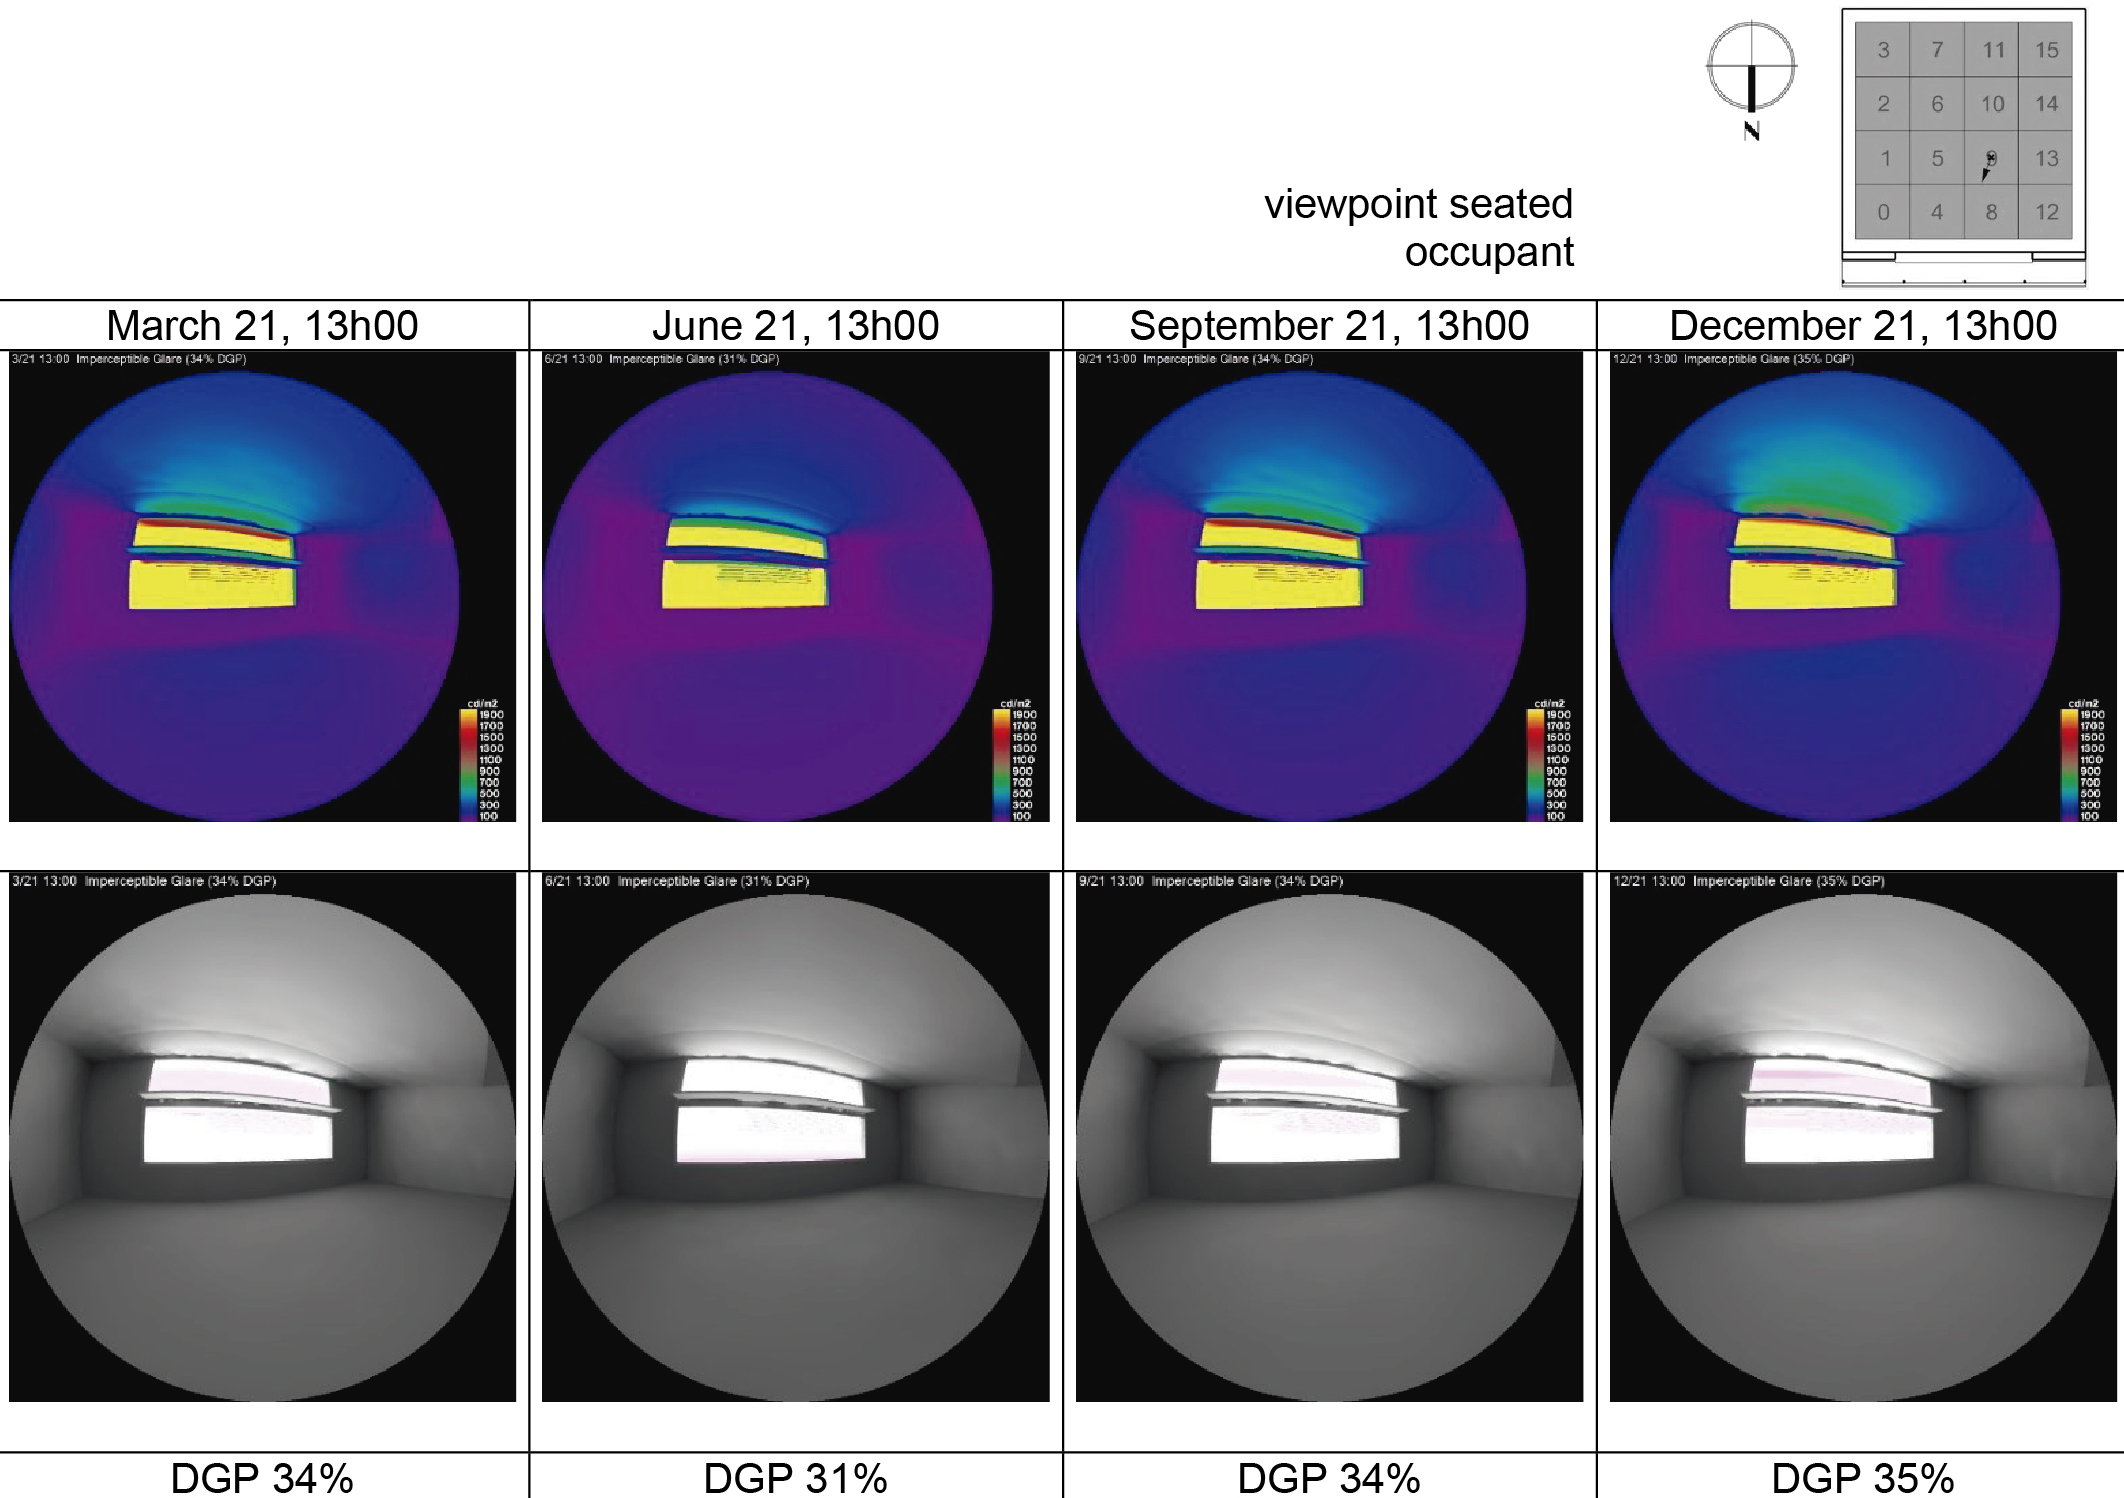
Fig. 6. Glare probability for prototype 2- Santiago.
4.3. Evaluation of the passive daylight strategies optimised for climate contexts
This section presents and discusses the results of the 9 dynamic simulations resulting from the three prototypes defined in the three climatic contexts. The results of the simulations are summarised in Table 8, while the complete set of false-colour shades for each climate is found in Appendix A.3.
Table 8
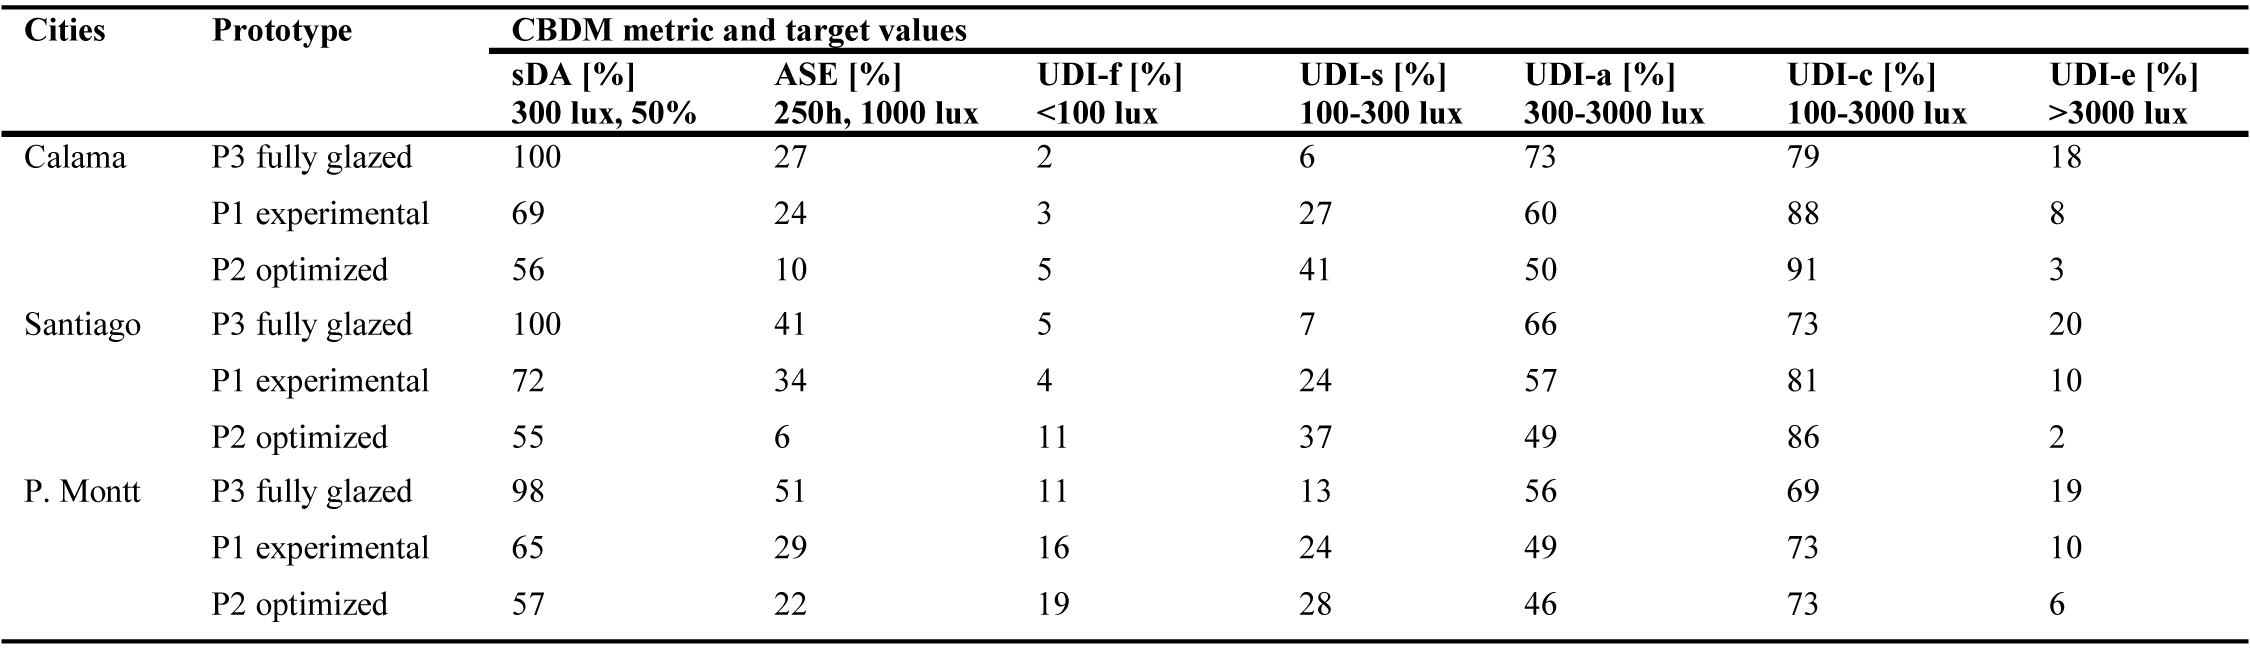
Table 8. Summary of daylight results comparisons of three prototype models in three contexts. (Source: Own elaboration).
Prototype 3, glazed facades models have shown high levels of illuminance in all contexts with SDA 100%>55%. Also, values exceeded ASE>20% in a range between 27% to 51% depending on the context - increases at higher latitudes when the solar angle is lower and lighting deeper in space. In terms of UDI, do not comply with UDI-c 80%. The false-colour scheme shows the area closer to the window is excluded from the range for being overlit, keeping constant in 20% for all contexts. The values outside range are unbalanced, UDI-e > UDI-f, and suggests the space is too bright and may cause discomfort. The results are consistent with previous studies in Chile [7,8].
Prototype 1, experimental base models with reduction of windows sizing as recommended for energy-saving, shows a decrease of general lighting levels. However, sDA still meets the goals of achieving >55%. Although ASE levels decreased concerning prototype 3 – mainly in Puerto Montt-, continue exhibiting over-lit. In terms of UDI, the UDI-c improved the values >80% in Calama and Santiago but is insufficient in Puerto Montt, achieving 73%. The results show the sizing window as a daylight impact strategy, mainly in an overcast sky. However, passive solar optimisation is required in all contexts.
Prototype 2, optimised architectural models are closer to goals. In all locations, there is a significant reduction of sDA, particularly in the back of the space; however, the occurrence of illuminances higher than 3000lx and the sunlight exposure are significantly reduced, meeting goals. Besides, UDI-c predicts a highly favourable optimisation in the regularly occupied area, according to UDI-e optimisation, from 20% to less than 6% in all cases. The passive strategies applied reduces the exceeded illuminance, and it is captured within the useful range of 100-3000 lux.
As expected, indicators referring to high illuminance (ASE and UDI-e), which are potential generators of overheating or glare, show the most significant variation in the cases depending on the predominant CIE sky and the availability of solar radiation from different climates.
5. Discussion
In previous sections, the improvement of daylight is shown to achieve a balance between illuminance levels and glare control through the integration of passive strategies. Also, different dynamic metrics are analysed to evaluate the performance of strategies, exposing how the parameters are related to each other and on different sky conditions, showing their potential as a proxy for glare during the design process.
On the one hand, the use of SDA, ASE suggests that there is a proportional relationship between them, and the illuminance levels decrease as the direct sunlight decreases. Consequently, in side-lit north-facing spaces, the application of fixed external shade devices to achieve an ASE below 20% decreases the illuminance levels, being more feasible to achieve an acceptable SDA level of 55% than superior levels of 75%. The UDI scheme is not such linear but provides definitions to balance daylight. When UDI-f > UDI-e suggests that more daylight would be required, so the strategies will focus on increasing daylight. But when UDI-f < UDI-e, the suggestion is that direct sunlight can cause glare problems and the strategy will be to control the overlit. Therefore, the objective should be set to keep UDI-f and UDI-e proportional to achieve an equal illuminance.
On the other hand, the difficulty of overcast sky designs to meet the goals of the proposed methods. Therefore, it leads to a discussion on the need to review the validation thresholds of illuminance and sunlight exposure, regarding the location and impact of latitude and climate on compliance. Looking at the ASE metric and returning to the opinion about its very restrictive threshold, quantitative results and illuminance distribution maps found a correlation between ASE and UDI-e range; it suggests that the ASE threshold is correctly delimited. However, when passive solar gain strategies are proposed with user-operated dynamic control devices (as in Puerto Montt case), it is a challenge to achieve the right balance of SDA - ASE, since the method only considers fixed devices. Therefore, an additional evaluation through DGP is justified to identify the periods in which the sunlight affects or, a further investigation on the ASE threshold to accept the exceeded illuminance, is warranted [25].
Regarding the UDI results, at higher latitudes such as Puerto Montt, the illuminance values do not meet the requirements of the UDI-c and the value of the UDI-f increases, because there is less daylight available in a predominantly overcast sky. A study conducted in cities in Canada, in northern latitudes, analyses the degree to which daylight performance is affected by latitude and climate. The IES method LM-83-12 is used, and in most cases, the requirements of SDA in the LEED v4 rating system are not met. It exposes the impossibility of all locations to adapt, in a practical sense, to the same lighting values, and therefore suggests the need for an alternative compliance path [28]. Moreover, many studies have concluded that a luminous environment of a place influences the tolerance of people to lighting levels. It suggests that an adequation of thresholds according to sky conditions, would be more useful for users than the Standard. As an example, the CES sustainable building qualification method of Chile proposes three differential compliance values associated with climatic zones and different sky conditions. For clear sky sDA 60% and UDI60%; for intermediate sky sDA 55% and UDI 50%; for overcast sky sDA 50% UDI 40% [52]. It is an approach to refining in the next stages; however, the authors value the exploration of an alternative path of compliance, to more opportunities to encourage adequate designs of daylight.
6. Conclusions
The revision of three cities of Chile under different sky conditions shows that daylights requirements vary in each location depending on daylight availability and sunlight incidence, but overlit remains in all the climates in the glazed façade models, suggesting potential problems as overheating and glare.
Regarding the design criteria to climate-adapt fenestration, it has been found that several documents focus on passive strategies and have been a fundamental guide for the development of this research. This work provided an opportunity for testing its implementation in different sky conditions in Chile, and subsequent optimisation according to the climates, was necessary to improve daylight performance further. The fundamental contribution of this research is the selection of the most important strategies, classifying them and organising them in a checklist for easy application by designers.
A key aspect for optimising the criteria was around the observation of how strategies impact in the amount and distribution of daylight in space through the CBDM methods, through UDI, SDA, and ASE metrics. It is conclusive that methods are effective in relating illuminance and sunlight exposure. The results suggest that the upper limits of both daylight methods are close to controlling glare by regulating over-illumination during the design process. Although overlit target values present the main difference between them, the prediction of possible visual disturbances is consistent with each other and as a glare proxy indicator. It is concluded that since there is a relationship between the results of DGP with ASE and UDI-e, these are equally predictive to apply a design process where less simulation time is required.
However, the study opens a reflection for future research about the target values. Should the thresholds propose in the design methods be the same in all climate contexts? Considering the variety of available daylight and the requirement of passive gains in cold climates the proposed thresholds are unlikely to be reached.
Acknowledgment
This research was developed within the framework of Sustainable Habitat and Energy Efficiency Master of the University of Bio-Bio in Concepción Chile. The authors would like to acknowledge the support provided by the team of academics of the program. The authors also thank the support provided by the Environmental Comfort and Energy Poverty 194503 GI/C research group.
Contributions
Cecilia Palarino (CP) and Beatriz Piderit (BP) designed the research. CP design the office prototypes and simulations. CP and BP analysed and discussed the data. CP wrote the original draft preparation. CP and BP reviewed and edited the final paper.
Declaration of competing interest
The authors report no conflicts of interest. The authors alone are responsible for the content and writing of this article.
Appendix
A.1
A.1. False-colour schemes of the dynamic simulation sDA, ASE and UDI for prototype 2 all climates
A.2
A.2. Daylight glare probability evaluation
A.3
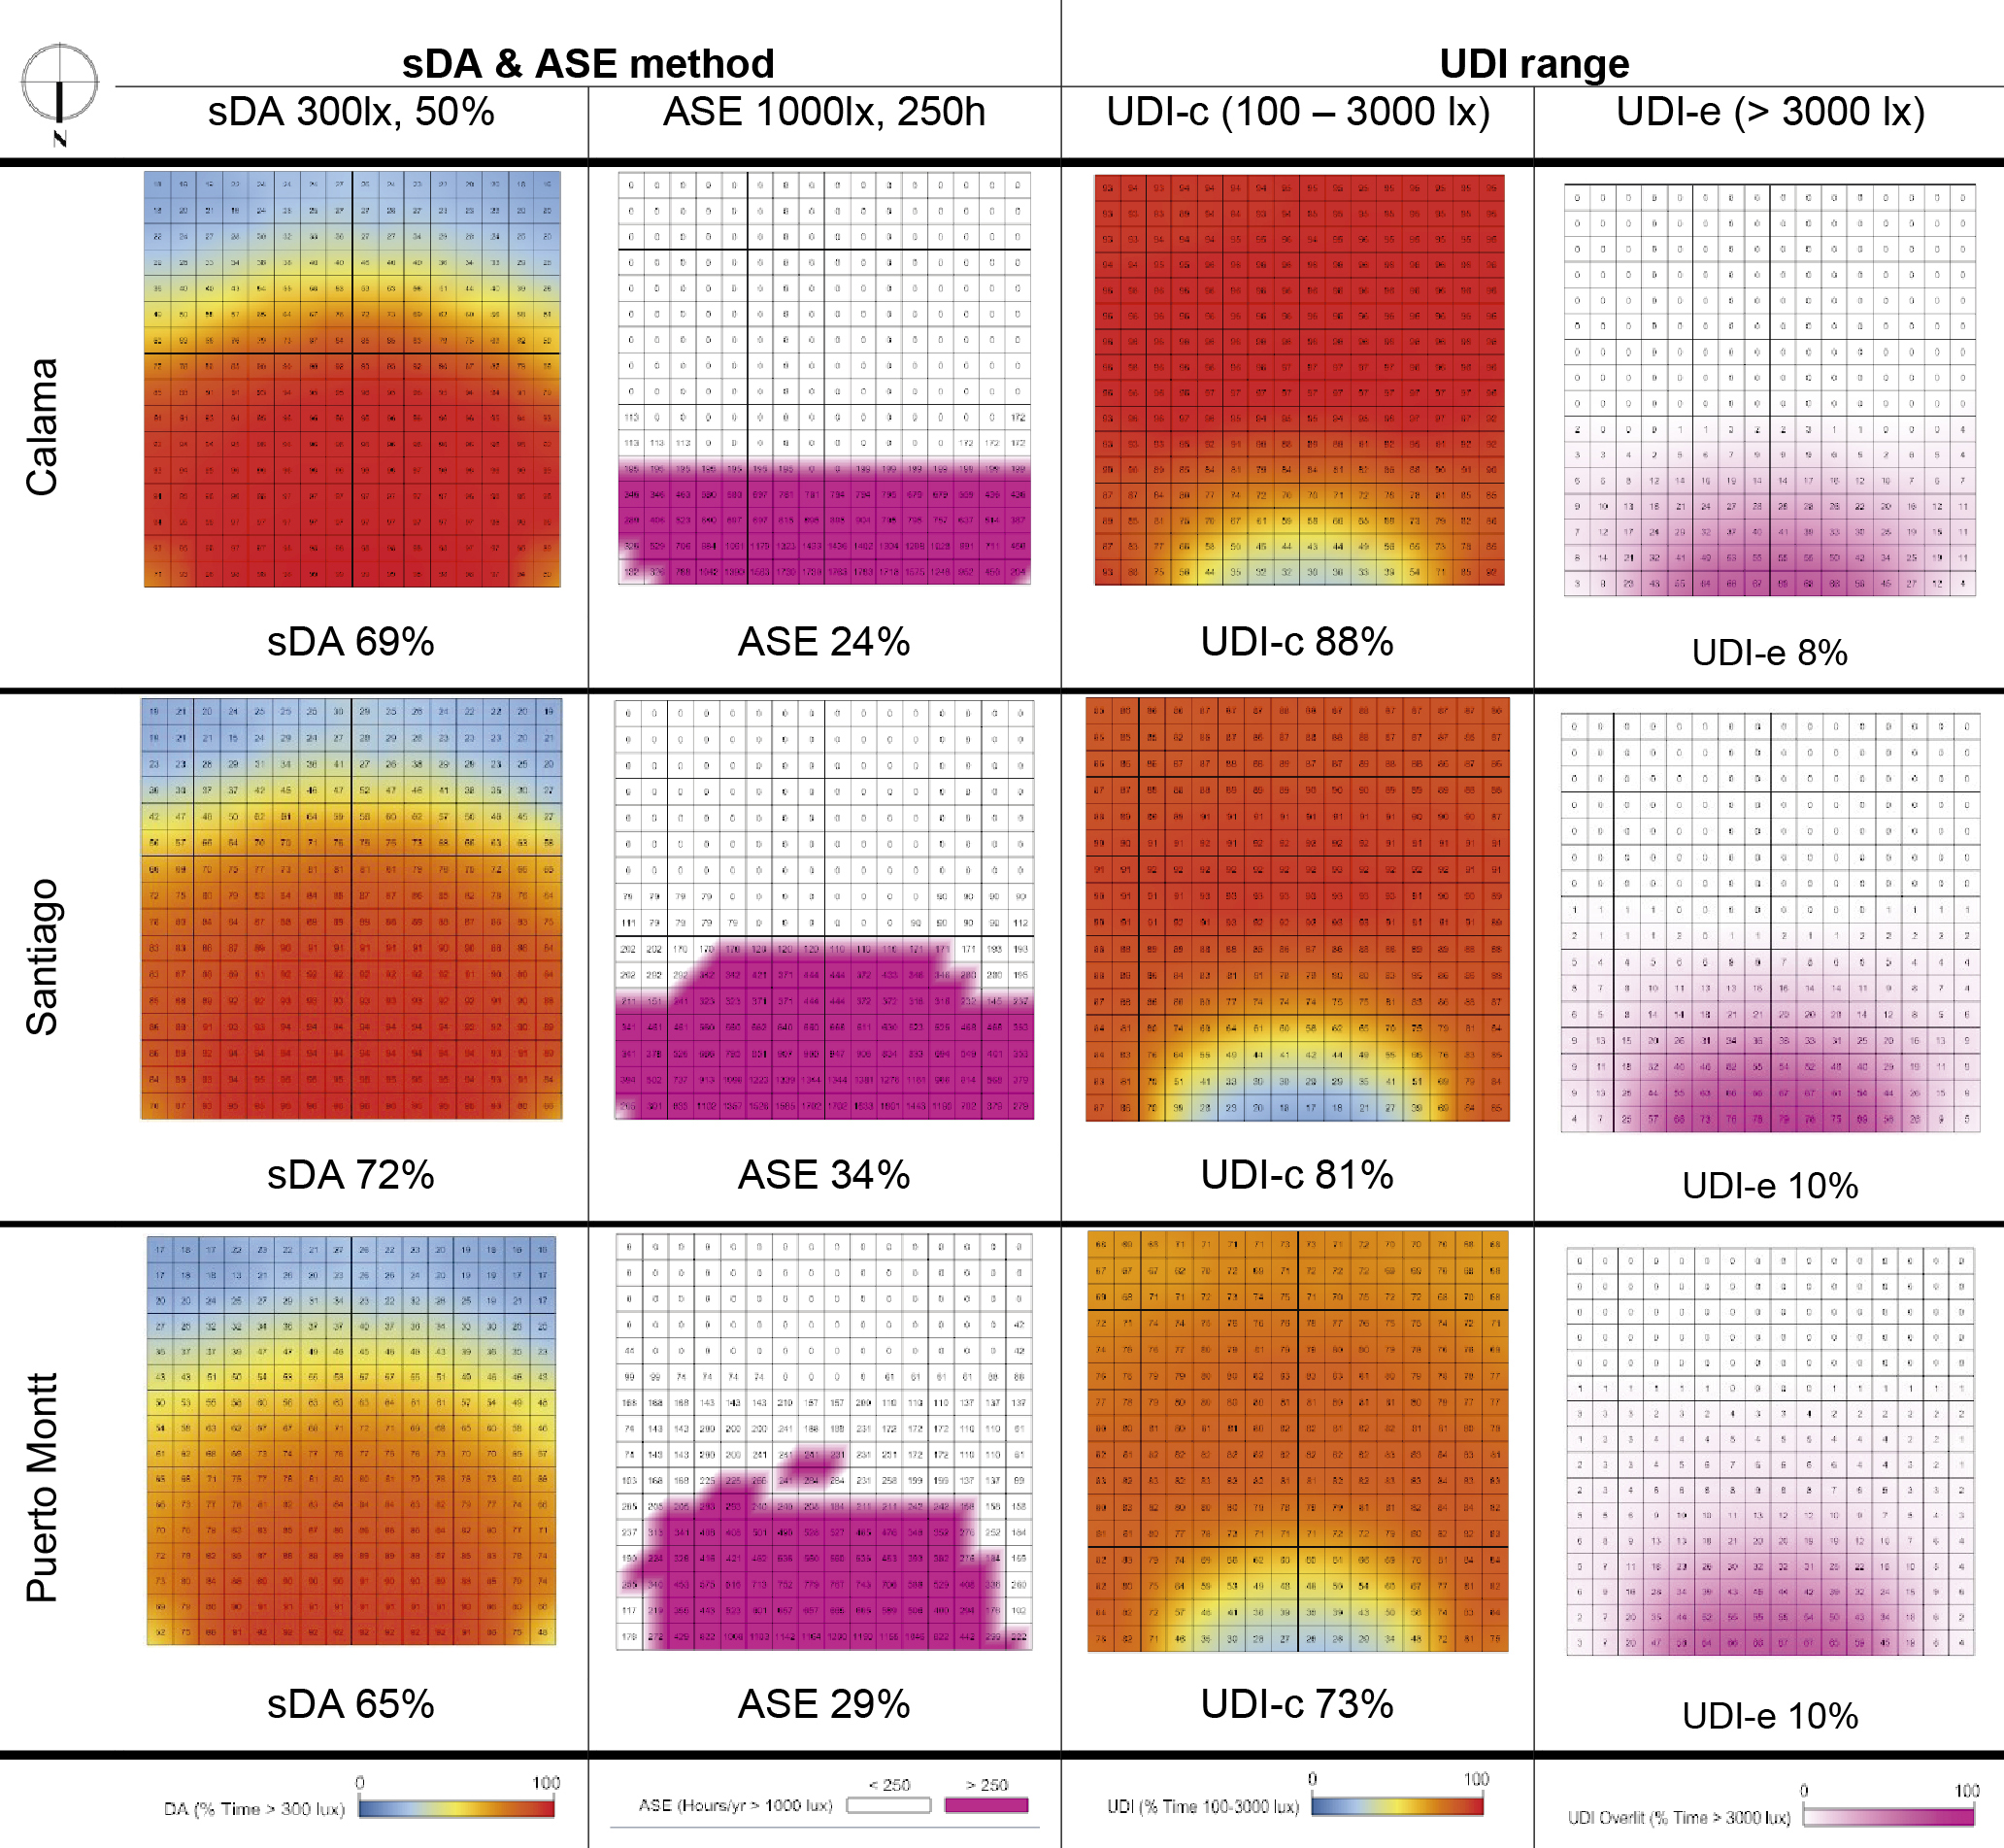
A.3. Prototype 1. Experimental base model illuminance distribution maps sDA & ASE and UDI range, all climates
A.4.
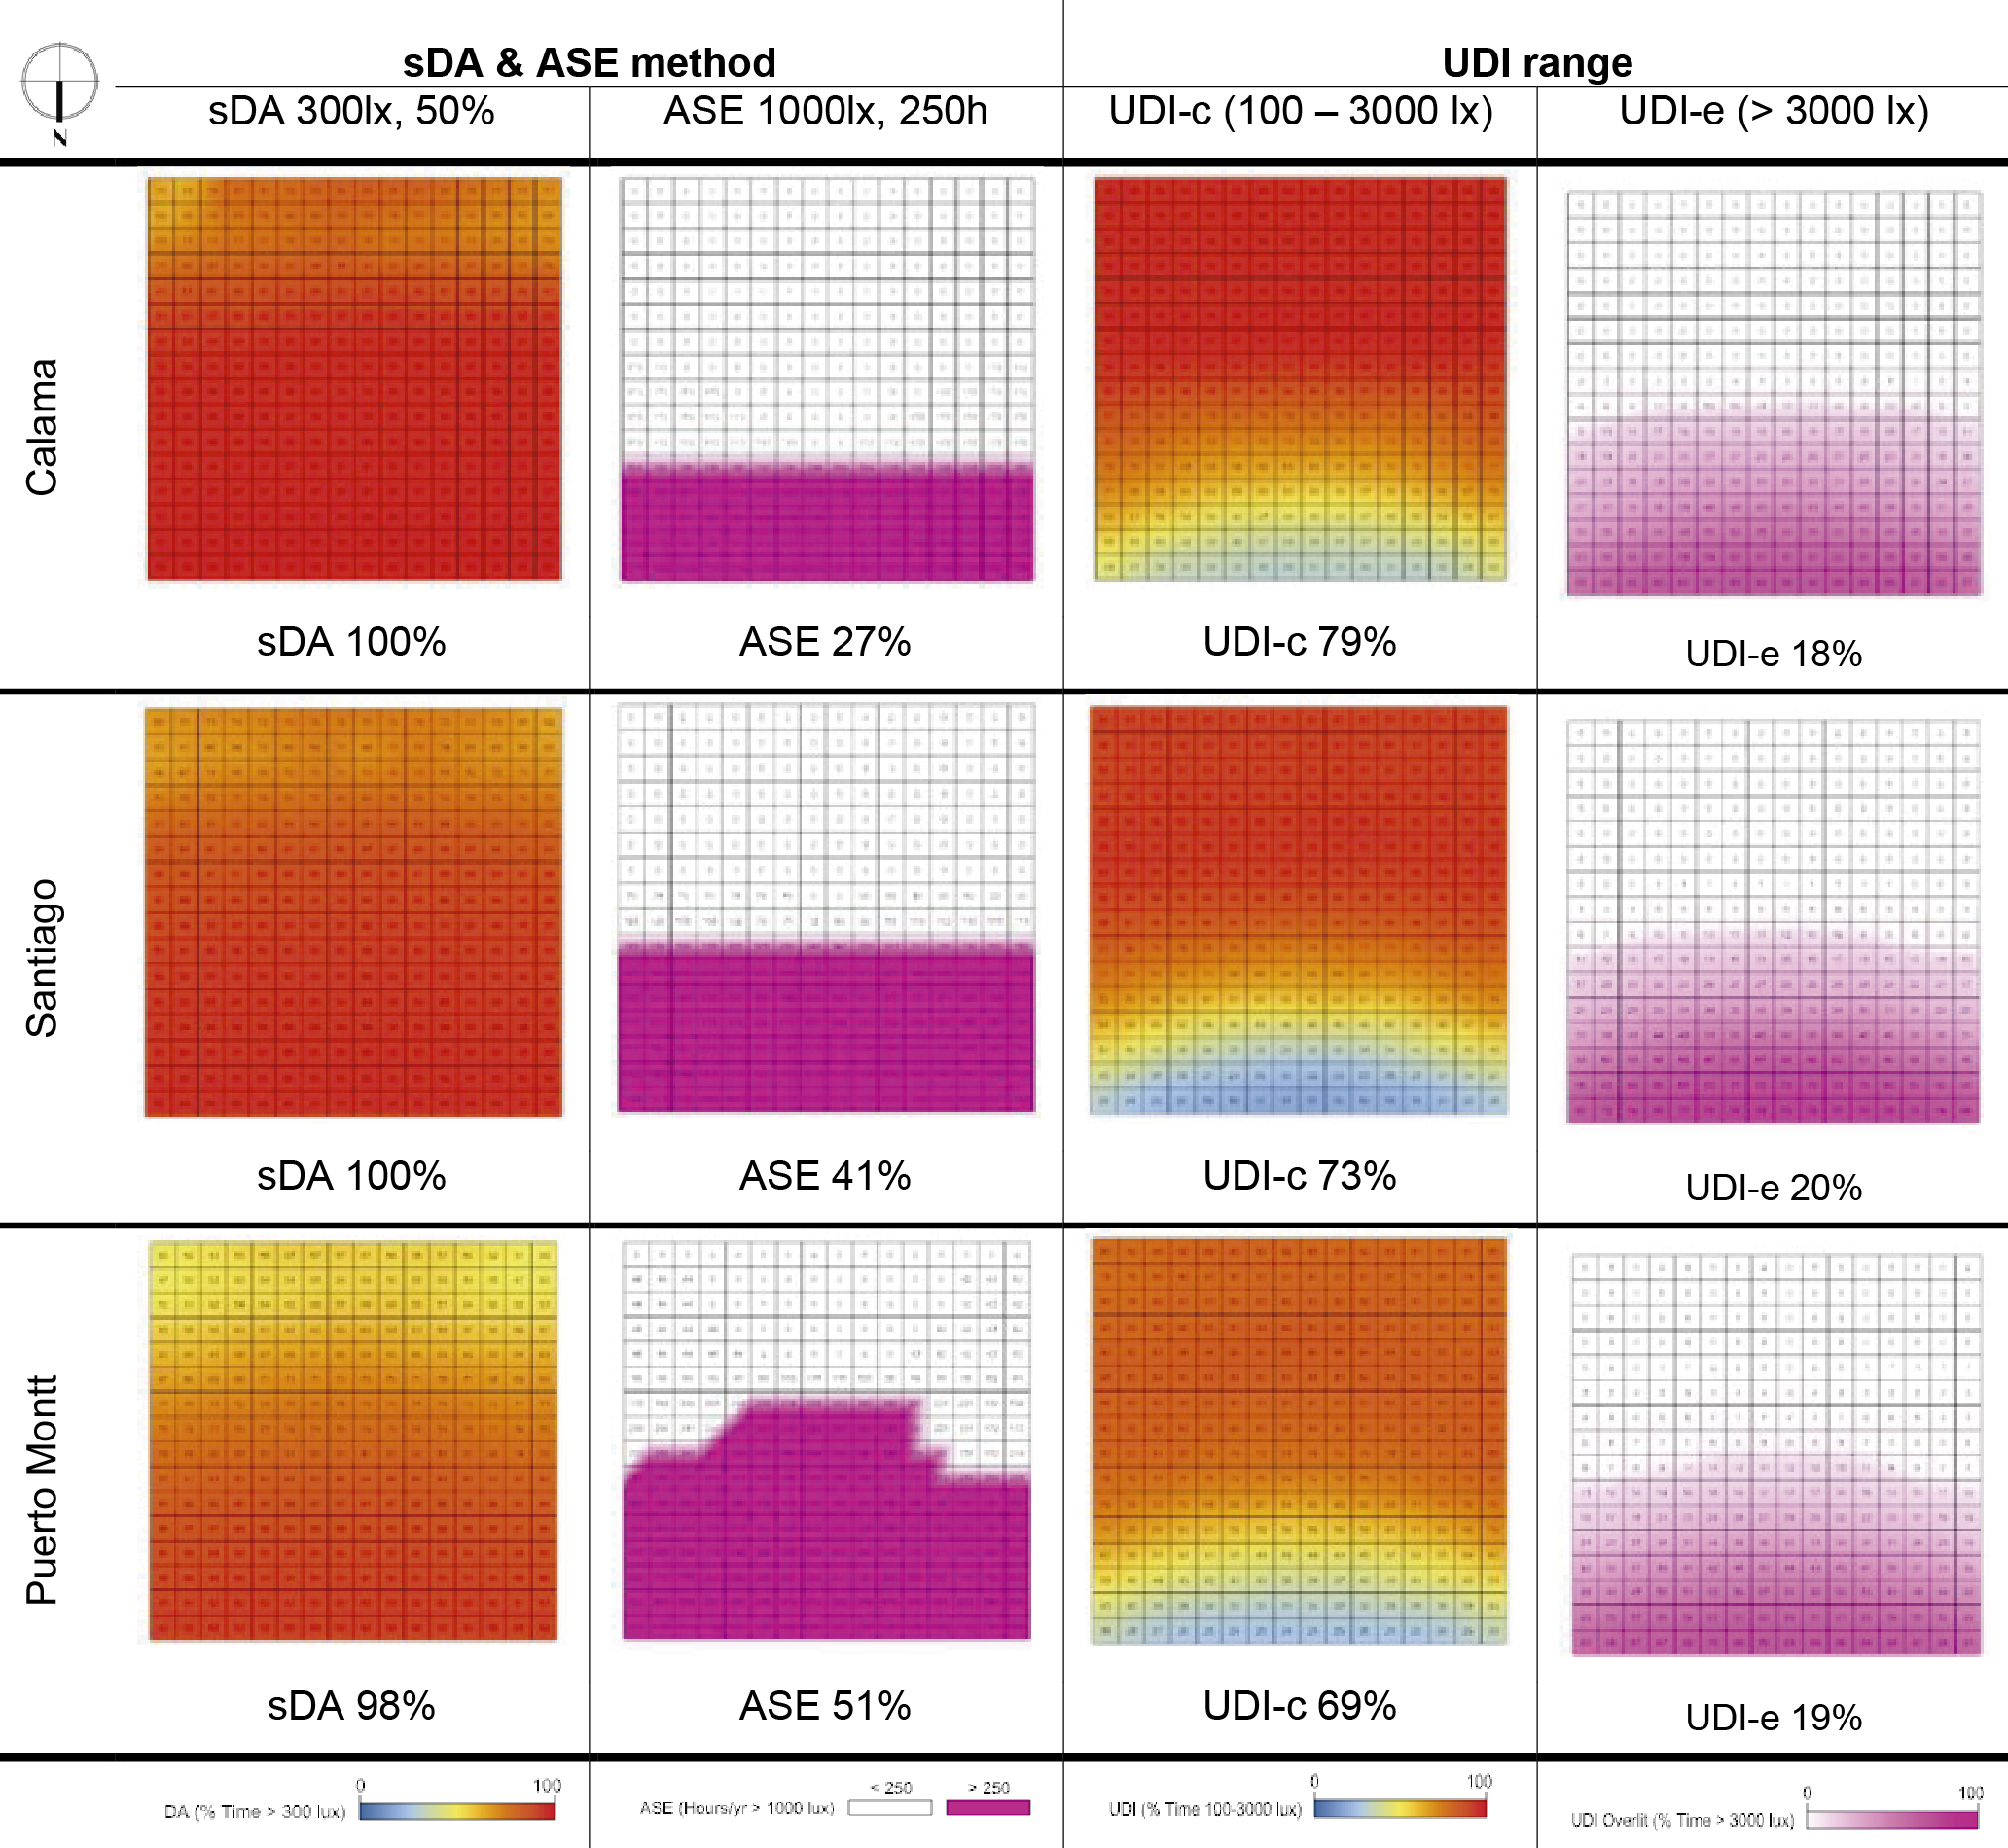
A.4. Prototype 3- Glazed facade illuminance distribution maps sDA & ASE and UDI range, all climates
References
Copyright © 2020 The Author(s). Published by solarlits.com.

401
Total views
Citations
SHARE ON


