Volume 7 Issue 1 > pp. 57-72 • doi: 10.15627/jd.2020.5
Parametric Analysis of Architectural Elements on Daylight, Visual Comfort, and Electrical Energy Performance in the Study Spaces
Nazanin Nasrollahi,* Elham Shokry
Author affiliations
Architecture Department, Faculty of Technology and Engineering, Ilam University, Ilam, Iran
* Corresponding author.
nazanin_n_a@yahoo.com (N. Nasrollahi)
shokry_elham@yahoo.com (E. Shokry)
History: Received 22 October 2019 | Revised 12 February 2020 | Accepted 2 March 2020 | Published online 24 March 2020
Copyright: © 2020 The Author(s). Published by solarlits.com. This is an open access article under the CC BY license (http://creativecommons.org/licenses/by/4.0/).
Citation: Nazanin Nasrollahi, Elham Shokry, Parametric Analysis of Architectural Elements on Daylight, Visual Comfort, and Electrical Energy Performance in the Study Spaces, Journal of Daylighting 7 (2020) 57-72. http://dx.doi.org/10.15627/jd.2020.5
Figures and tables
Abstract
The quality of visual comfort has always been an essential element considering human comfort. Providing visual comfort in a living environment reduces the need for artificial lighting, which subsequently has a direct relationship with energy consumptions and its expenses. Besides, the maximum possible usage of daylight instead of artificial lighting significantly contributes to providing a favourable condition in terms of visual comfort for the residents. This essential factor is manifested in public spaces, such as libraries that are associated with students and the quality of their study time. The main aim of this paper is to provide applied solutions to use more natural lighting strategies as an alternative for artificial lighting, which helps to reduce electric energy consumption while providing visual comfort for users. The role of architectural elements, such as the position and dimensions of the windows, reflectivity of materials, layout of surfaces, and appropriateness of space in line with the objectives as mentioned earlier are examined thoroughly. For this purpose, literature studies, as well as computer simulations via Relux software, are utilized to investigate the set research objectives. Finally, the simulation results suggest that the best orientation to achieve the optimal model using daylight in study spaces is northern-southern orientation. In addition, using windows with maximum height in the middle of the transverse front of buildings with window to wall ratio of 35 to 45 percent along the vertical and horizontal divisions (grid) is suitable for such places. Design criteria include the higher access to daylight, visual comfort, and reduction of electrical energy consumption. The reflectivity coefficients for roof materials, floor, and walls are 0.6, 0.4, 0.4, and 0.6, respectively, and transparency for windows is 80%. The obtained results also suggest the length-to-width ratio and height-to-width ratio are 6-to-5 while horizontal and vertical surfaces in near windows and in middle space along the longitudinal direction are optimal for research purposes.
Keywords
Visual comfort, Energy consumption, Study spaces, Daylight
1. Introduction
The interest in investigating the issue as well as using of daylight began to rise after the oil crisis in 1970. However, implementing this strategy started to decline again between 1980 and 1990 [1]. Considering the importance of such an architectural technique, there are increased efforts by designers and architects to construct and design daylight spaces [2]. The daylight is a sustainable development strategy to increase visual comfort, energy optimization, and development of green buildings. The openings that are the main elements for receiving daylight, not only allow the light for the internal environment to create a pleasant atmosphere, but also, they provide a way for the residents to maintain their visual interaction with the outside [3-5]. The daylight has been recognized as an essential factor in architecture and a significant strategy for the energy optimization of buildings [6]. Besides, daylight can also significantly reduce overall energy consumption [7]. Considering the benefits of such a strategy, a moderate level of sunlight can contribute to human health on many different levels [8].
Besides, it is also a method for increasing the amount of light in a room and enlarging the dimensions of the openings in a design that turns the light apertures optimal, while creating a balance between visual comfort and proper lighting altogether. However, if the apertures are designed inappropriately, the daylight will not only be a visual obstacle but also it will be a reason for lack of comfort for the residents [9]. A proper design must allow an appropriate amount of sunlight into space, and guiding the entering light for creating a balance in lightings. The main goal of such designs is to control the amount of inbound light [10]. The presence of light in interior spaces increases the human spirit while reduces eye and body fatigue. One of the important psychological aspects of the daylight is allowing the ongoing interaction with the outdoor environment [11]. The daylight also plays an essential role in minimizing the consumption of electrical energy [12]. In this regard, libraries as centers of development, learning, study, and research in different societies become the center of attention. Therefore, study halls considering their space, operation time and performance can make maximum use of natural sources of energy including sunlight to meet the visual needs of the users. Factors are affecting the efficiency of the process of learning and studying [13].
To understand these factors and their effects, several selected articles regarding this topic are examined thoroughly. In a study by Alrubaih et al., 2013 [14], the distribution of lighting in an architectural space is assessed using the Relux, which acts as a starting point for more development of energy optimization and daylight design. Yu et al. [15] examined the efficiency of daylight and electrical energy consumption in a space with geometric and physical factors via field measurement and computer simulations. Koo et al. [16] also found a new control method for automatic roller curtains to create the highest level of comfort for the residents in buildings. Their proposed method not only protects residents from direct sunlight glaring but also allows in the highest daylight according to the needs of the residents. Per the subject of this study, Zomorodian et al. in 2016 [17] explored the visual comfort within classrooms in the city of Kashan using questionnaires and computer simulations.
Another article in the same year by Zomorodian and Tahsildust [18] investigated the role of the windows in the classrooms on visual comfort and satisfaction of space users in Tehran. Fonseca et al. [19], stated that when the light is used as a supplement for artificial lighting, it will have an appropriate ability to store electrical energy. In fact, by using more natural lighting, it is possible to reduce energy consumption in buildings. In 2012, Tagliabue et al. [20] investigated the daylight positive impact on employee satisfaction and energy consumption reduction in residential areas via computer simulations and questionnaires. There are also conducted researches on daylights having insufficient space to mention this issue, which referred to briefly [21-23].
Chen and et al [24] also in 2014 in a study addressed that the proper use of daylight not only improves the visual comfort of the interior but also effectively reduces the energy consumption of the building. These studies relate largely to office buildings, but are limited to industrial buildings, where light is the major consumer of electrical energy. Daylight is also simulated by Ecotect and Radiance software to compare with field measurements. The distribution of simulated daylight was well correlated with the measurements. Also, in 2016, Jian Yao [25] discusses the effect of moving solar shadings on energy consumption, improving visual comfort using Energy Plus Simulation software. This study examines the performance of moving canopies in the south elevation of a residential building by field measurements. The results show that the outdoor movable solar shadings have a good shading efficiency and can reduce the sun's passage by at least 8%. Another article by Choi et al has investigated the properties of photosensors and electrical energy in daylight responsive systems [26]. Another study by Sarith also conducted a study on daylight-responsive lighting control systems [27]. In addition, another research has investigated the role of photosensors in lighting control systems [28]. An article by Biljana in 2019 also discussed visual comfort and daylight transmission systems at high latitudes [29]. Other studies have been done on daylight, energy consumption, windows in Iranian architecture, and visual comfort, including study spaces that have been cited here [30-37].
Also, according to the research background, it is evident that conducted studies have not examined the functioning of daylight in study areas under the influence of variables considered in this study to create visual comfort for users and the efficiency of electrical energy consumption. This scientific study analyzes the impact of various architectural elements including the geometry of space, reflectivity of surface materials, internal layouts, dimensions and position of the windows as independent variables on the dependent variables such as uniformity rate [38] daylight factor [29] while contributing to closing the scientific gap in this regard and playing significant role in provision of architectural standards in this field.
This research is a parametric study that examines the order and impact of independent variables on dependent variables with respect to the goals pursued through rational reasoning and simulation tools. To this end, the title of the article has also been amended. In fact, the role and influence of architectural elements in a study space has been investigated for a better and more balanced distribution of natural light. The aim is not to achieve an optimal Lego, but to evaluate the role of these elements in order to facilitate work and study logical order.
Therefore, this research aims to investigate the dimensions of the issue to provide better solutions for increasing visual comfort and ultimately the satisfaction of users, while reducing the use of artificial lighting in study spaces. This scientific study analyzes the impact of various architectural elements including the geometry of space, reflectivity of surface materials, internal layouts, dimensions and position of the windows as independent variables on the dependent variables such as uniformity rate [38], daylight factor [29] while contributing to closing the scientific gap in this regard and playing significant role in provision of architectural standards in this field.
2. Methodology
For daylight and electrical energy consumption rate analysis, the computer simulation method through Relux software is used. There is already examination of the room factor k, the dimension of the windows, energy efficient integration of daylight and artificial light, select the optimum position and proper field of view of a photosensor and the energy performance [39-41] .The reason for using Relux is mainly due to Relux’s ability [13] to model illuminance, accurate internal daylights for sky conditions, type of geometry and room configuration. Also, a wide range of reflections of real surfaces of wall and materials, outputs such as display of three-dimensions and evaluation, illuminance distribution, the output of tables, three-dimensional mountain chart of illuminance, sun altitude, and charts are supported by Relux. This advanced illuminance simulation tool is used to investigate and analyze the daylight behavior buildings. Subsequently, the obtained simulation results of the proposed models' (approximately 400 architecture models) using Relux are analyzed and compared with obtained data considering and according to the desired standards to achieve the suitable architectural model to present the importance of this research. Moreover, various stages of this research such as data analysis and computer simulations, include descriptive and inferential analysis using MS EXCEL and SPSS. For a better understanding, the research process and its different stages are shown in Fig. 1.
Figure 1
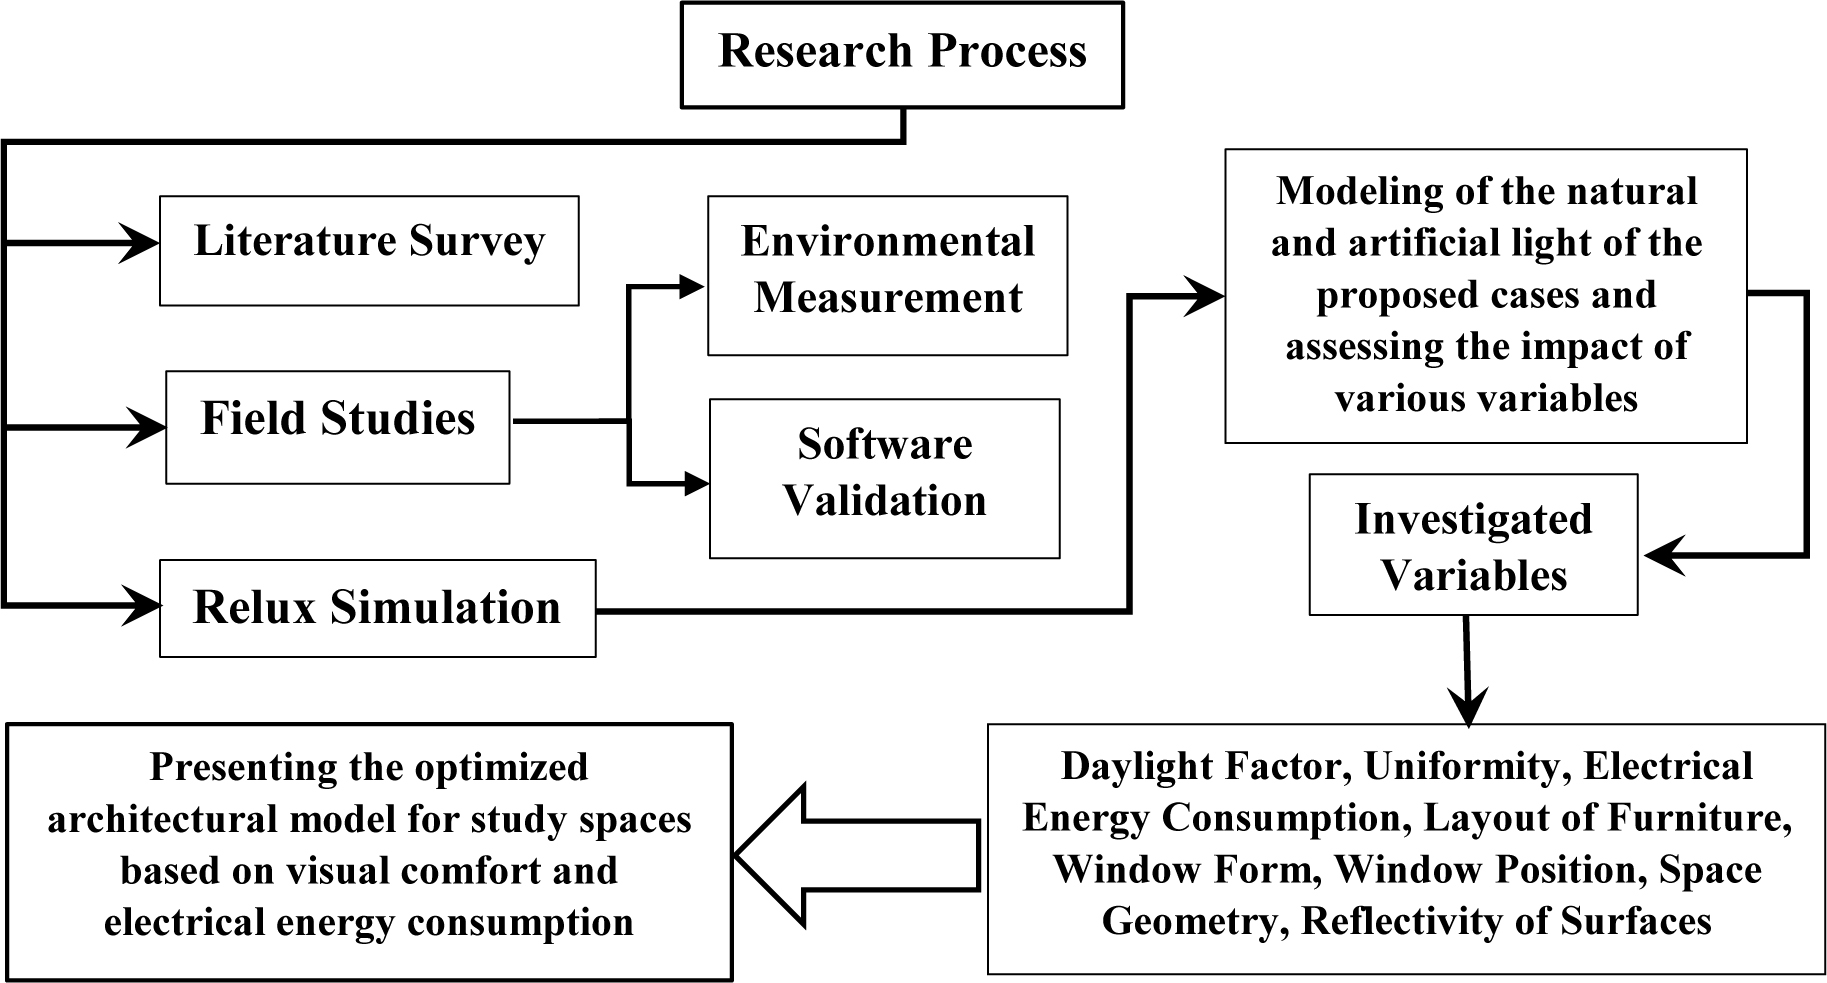
Fig. 1. The process of research.
The Relux software is a computational program based on the daylight of the interior rooms in a clear and cloudy sky. Relux outputs include: the 3 D information of the room, 3 D and 2 D information for the distribution of brightness in all walls, minimum, average and maximum daylight factor and intensity of light, distribution of light of the interior spaces in sky conditions, geometry type and chamber configuration [40]. Also, a wide range of reflections and real-surface transitions, outputs including 3D representation, Isolux curve, brightness distribution, output tables, 3D mountain diagram of sunlight and altitude, and results list for all evaluated points [41]. The computational engine of this software is based on Radiance software, which uses the process of simulating radiation tracking lighting to produce high-quality, realistic images. It also applies radiosity techniques [15]. In order to validate this software in a research [42] the Relux software was compared with SPOT and DAYSIM software and it was found that the Relax calculation process is very fast while the SPOT and DAYSIM calculations are costly and time consuming and other Relux error rates are lower. In fact, according to Table 1, the lighting process and detail of Relux software [40] uses the Radiosity method and in some cases also uses the Ray tracing method. Light process for this software is RADIANCE engine supplemented with Radiosity Method. Also detail Salient features for it is in built with Relux CAD, energy calculation by EN15193 and DIN8599 standards.
2.1. Validation
To validate the simulation results, a room sample of 4×3 m2 is modelled according to Table 1. The measurements have been done at 11:30 AM on 26 January with checkered reticulation at intervals of 0.5 m in length and width of the room, as shown in Fig. 2, performed using the lux meter device. Simulations are performed in a coldest day of the year. In addition, surveys allow for the least number of sunny hours to achieve optimal results. Also due to the high number of variables and time-consuming work, one day a year, January 16th, has been investigated as the basis of simulations Thus, illuminance in 40 points inside the room is measured using a lux meter. The sky in the desired climate is considered cloudy. For validation, as the measurement of the data was in the closed space of the room with neighborhoods, the shadings in the cold seasons of the year, the type of sky is considered to be cloudy, which also gives more realistic results. After collecting the measurement results, the model simulation is performed via Relux. For simulation purposes, the same geographical location with a temperate mountain climate in Kermanshah, Iran is used. Finally, the simulation and measurement results are compared in Fig. 2.
Table 1
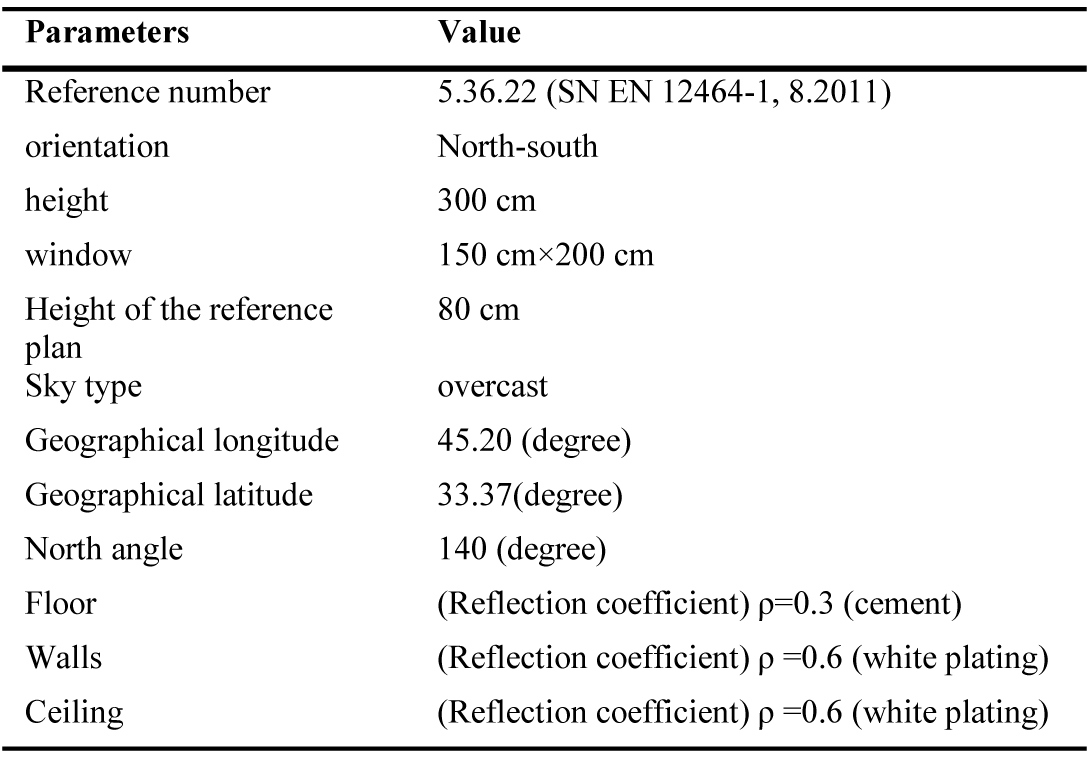
Table 1. Details of the real model simulated in software validation.
Figure 2
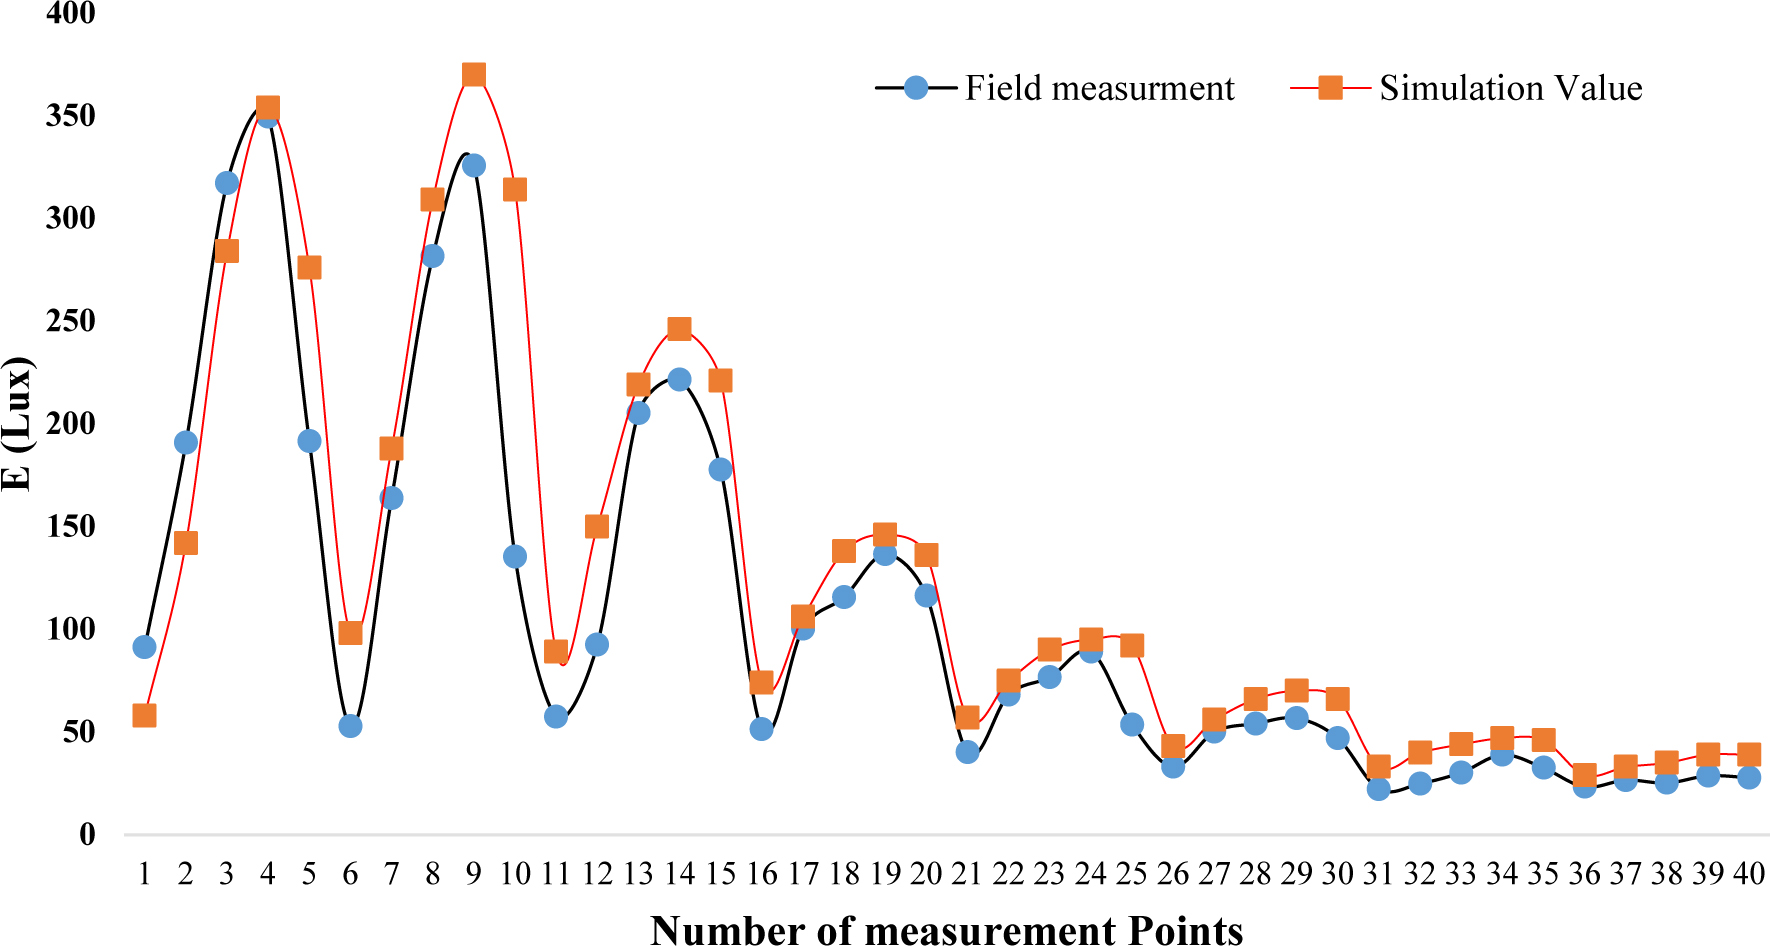
Fig. 2. Comparison of illuminance values obtained by simulation and measurement in real samples.
The comparison results show that both simulation and field measurements almost have an identical pattern of behavior if the minor difference is neglected. By comparing the values shown in Table 2, it is evident that the difference between dependent variables studied in the measured and simulated samples is highly close to each other. To validate and obtain accurate and precise results, the obtained data from the simulations must be equated with the collected results in this section.
The standard deviation (SD) can be calculated by
Standard error of the mean (SEM) is determined by
Table 2
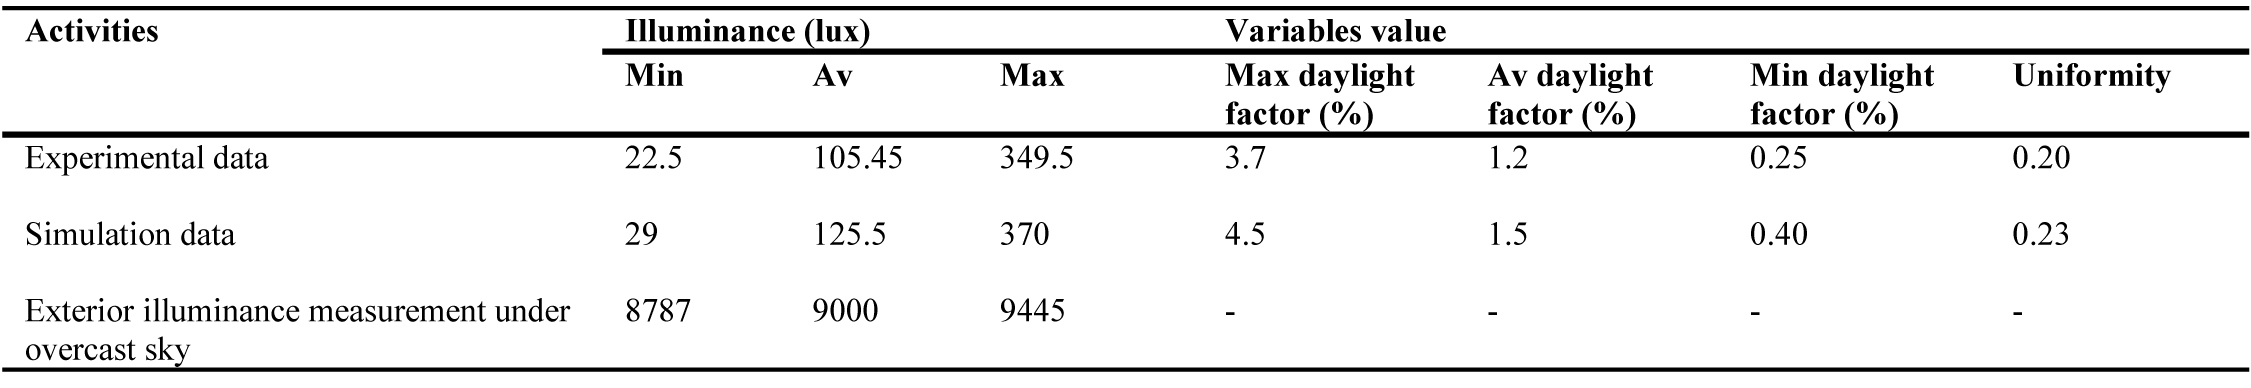
Table 2. Comparison of values obtained from measurements and simulations.
To emphasize the validity of the results, the correlation coefficient between experimental data and simulation was calculated using Pearson test. If P value> 0.05 is assumed H0 is rejected at the 0.05 error level, otherwise H0 is accepted. In fact, H0 is the hypothesis. If the level of significance is less than 0.05, there is a statistically significant relationship between the variables. Here, the hypothesis is that there is a significant relationship between the two datasets. The correlation coefficient R between the two experimental intensity and simulation data is about 0.5. Also, the significance level is around zero which indicates the significance relationship of the two variables. That is, the changes in both datasets have been the same. This indicates that the standard error rate is within the range of 0.5 and the significance level is zero and acceptable.
3. Theoretical foundations
3.1. Daylight factor (DF)
DF is the most dominant daylight metric used today due to its simplicity [41]. DF is the ratio of the light level inside a building to the light level outdoors during an overcast sky condition:
where Einterior is the horizontal illuminance of reference point indoor (Lux) and Eexterior is the horizontal illuminance of unobstructed point outdoor (Lux).
Using the equation above with an internal lux of 400 and outdoor lux of 20000 would equate the daylight factor to 2%. Currently, most rating tools adopt this metric for daylight assessment due to its simplicity while producing reasonably accurate results. Rating tools that use this metric are GBI, Green Mark and many others. In order to obtain the amount of daylight indoors, the intensity of the outdoor lighting needs to be calculated to be aware of the amount of outdoor light received indoors. Exterior light can reach the building through window glass, skylights or other openings, in three ways [42].
- Direct light from a point in the sky called the sky component (SC) [43].
- Reflected light from an outer surface reaching a building point called Externally Reflected Component (ERC) [44].
- Light entering through a window or light reaching a point in space after reflection from the interior surfaces called the Internally Reflected Component (IRC).
The sum of these three components is obtained according to DF formula [45] at one point inside the room (Eq. (4)). All of this can affect the amount and type of daylight factor in an architectural space.
3.2. Visual comfort
Comfort is a complex perception that reflects the interaction between objective and subjective stimuli. Accordingly, the feeling of general comfort is the result of the evaluation of the human senses. Visual comfort in the environment depends on the vision, perception, shape of the space and its adaptation to the different activities of the residents. Proper light distribution creates an exciting environment that does not cause physiological problems, distractions, and inappropriate conditions [46]. Overall, optimizing the visual properties of indoor areas is the primary goal of achieving visual comfort. Visual comfort improves when visual messages are clearly received from the visual environment [9]. The design of the building should help to achieve comfort. Visual comfort conditions are achieved by providing the required illumination level, preventing dazzle and uniform light distribution. If these values are not achieved by daylight, artificial light sources are needed [47]. Visual comfort in a space is directly related to the contrast of surfaces and the variability of space lighting. In lighting design, glare is a key cause of visual discomfort. The glare caused by the infinite contradiction in a given field causes our eyes to scratch or sting. In order to create visual comfort, there must be a rating from the public to the local medium-intensity light level.
3.3. Uniformity rate
An indicator that influences the quality of daylight and visual comfort and determines how brightness is distributed in space is the uniformity rate, which is the ratio of the minimum daylight to average daylight in space. For uniform visual conditions in a space, the uniformity rate must not be less than 0.6. Despite a uniformity rate of 0.6, the daylight factor also falls within the standard 2-6 range. If the uniformity of the daylight factor is lower, it is out of the standard range in space, resulting in dullness, visual discomfort, inadequate distribution of daylight and eventually the use of artificial light in space. Given that daylight has a direct impact on users' energy efficiency and energy consumption, adequate lighting for daylight should be a priority in the study halls, so visually and psychologically satisfying individuals will have increased visual and mental satisfaction due to proper daylight distribution. Found. Therefore, the location of the window and its dimensions should be designed in such a way that at least a 2% daylight factor, the amount of illumination received on the work surface is between 300-500 lux and the uniformity rate is at least 0.6. Also, the influence of geometry and orientation of space, the reflectivity of surfaces and the layout of tables are important and should be studied in order to achieve optimum conditions of visual comfort and reduce the use of artificial light in space [47].
4. Simulation and data analysis
The effect of the independent variables on the dependent variables of daylight factor and uniformity rate in this study is examined through proposed samples modelled in Relux. The investigations show that scenarios in terms of two variables related to visual comfort, daylight factor and uniformity rate, are at the standard range and have a tendency towards optimization. Besides, the reduction in the amount of electrical energy consumption is also evident. The standard values are considered in the examinations for the minimum, maximum and average daylight factors are 2%, 4%-5%, and 6%, respectively and the minimum uniformity rate is considered as 0.6. The average horizontal illumination level required to be provided in the room is 300 Lux. Having such conditions in space, illuminance is at its standard range of 300 Lux for study halls [48] The average day light factor is 2-5%. According to SN EN 12464-1, 8.2011 standard for study areas [48] these percentages are standard and balanced. Currently, most rating tools adopt this metric for daylight assessment due to its simplicity while producing reasonably accurate results. Rating tools that use this metric are GBI, Green Mark and many others. Figure 3 shows Specifications of the base model in Relux Software. The north-south orientation is selected as the type of orientation concerning the emphasis on the existence of openings in the north and the south of the building. The type of openings is selected in two situations including the middle and corners of the wall, with the possibility of viewing outside, inbounding light and as well as light penetration into a depth of room in three forms with the maximum height, width, horizontal and vertical divisions. Considering the space proportions, length to width and height ratio is examined by increasing and decreasing their values. The placement of vertical and horizontal surfaces of this study is analyzed in space on the occupied area of 28%. Finally, the appropriate reflectivity coefficient for the inner surfaces materials is obtained. The main goal of investigating these items is to create the optimal distribution of daylight and achieving the desired visual comfort for space users, as well as reducing the use of artificial lighting in the space. These discussed cases are analyzed for the climate, as mentioned earlier of Kermanshah, and it certainly will vary in different climates and solar conditions. Climate and architecture are highly dependent on each other and designers and architectures must pay full attention when designing such models in different climates. For instance, an appropriate design must consider both warm and cold seasons in a way that forbids the warm and cold air entering space through windows during summer and winter, respectively.
Figure 3
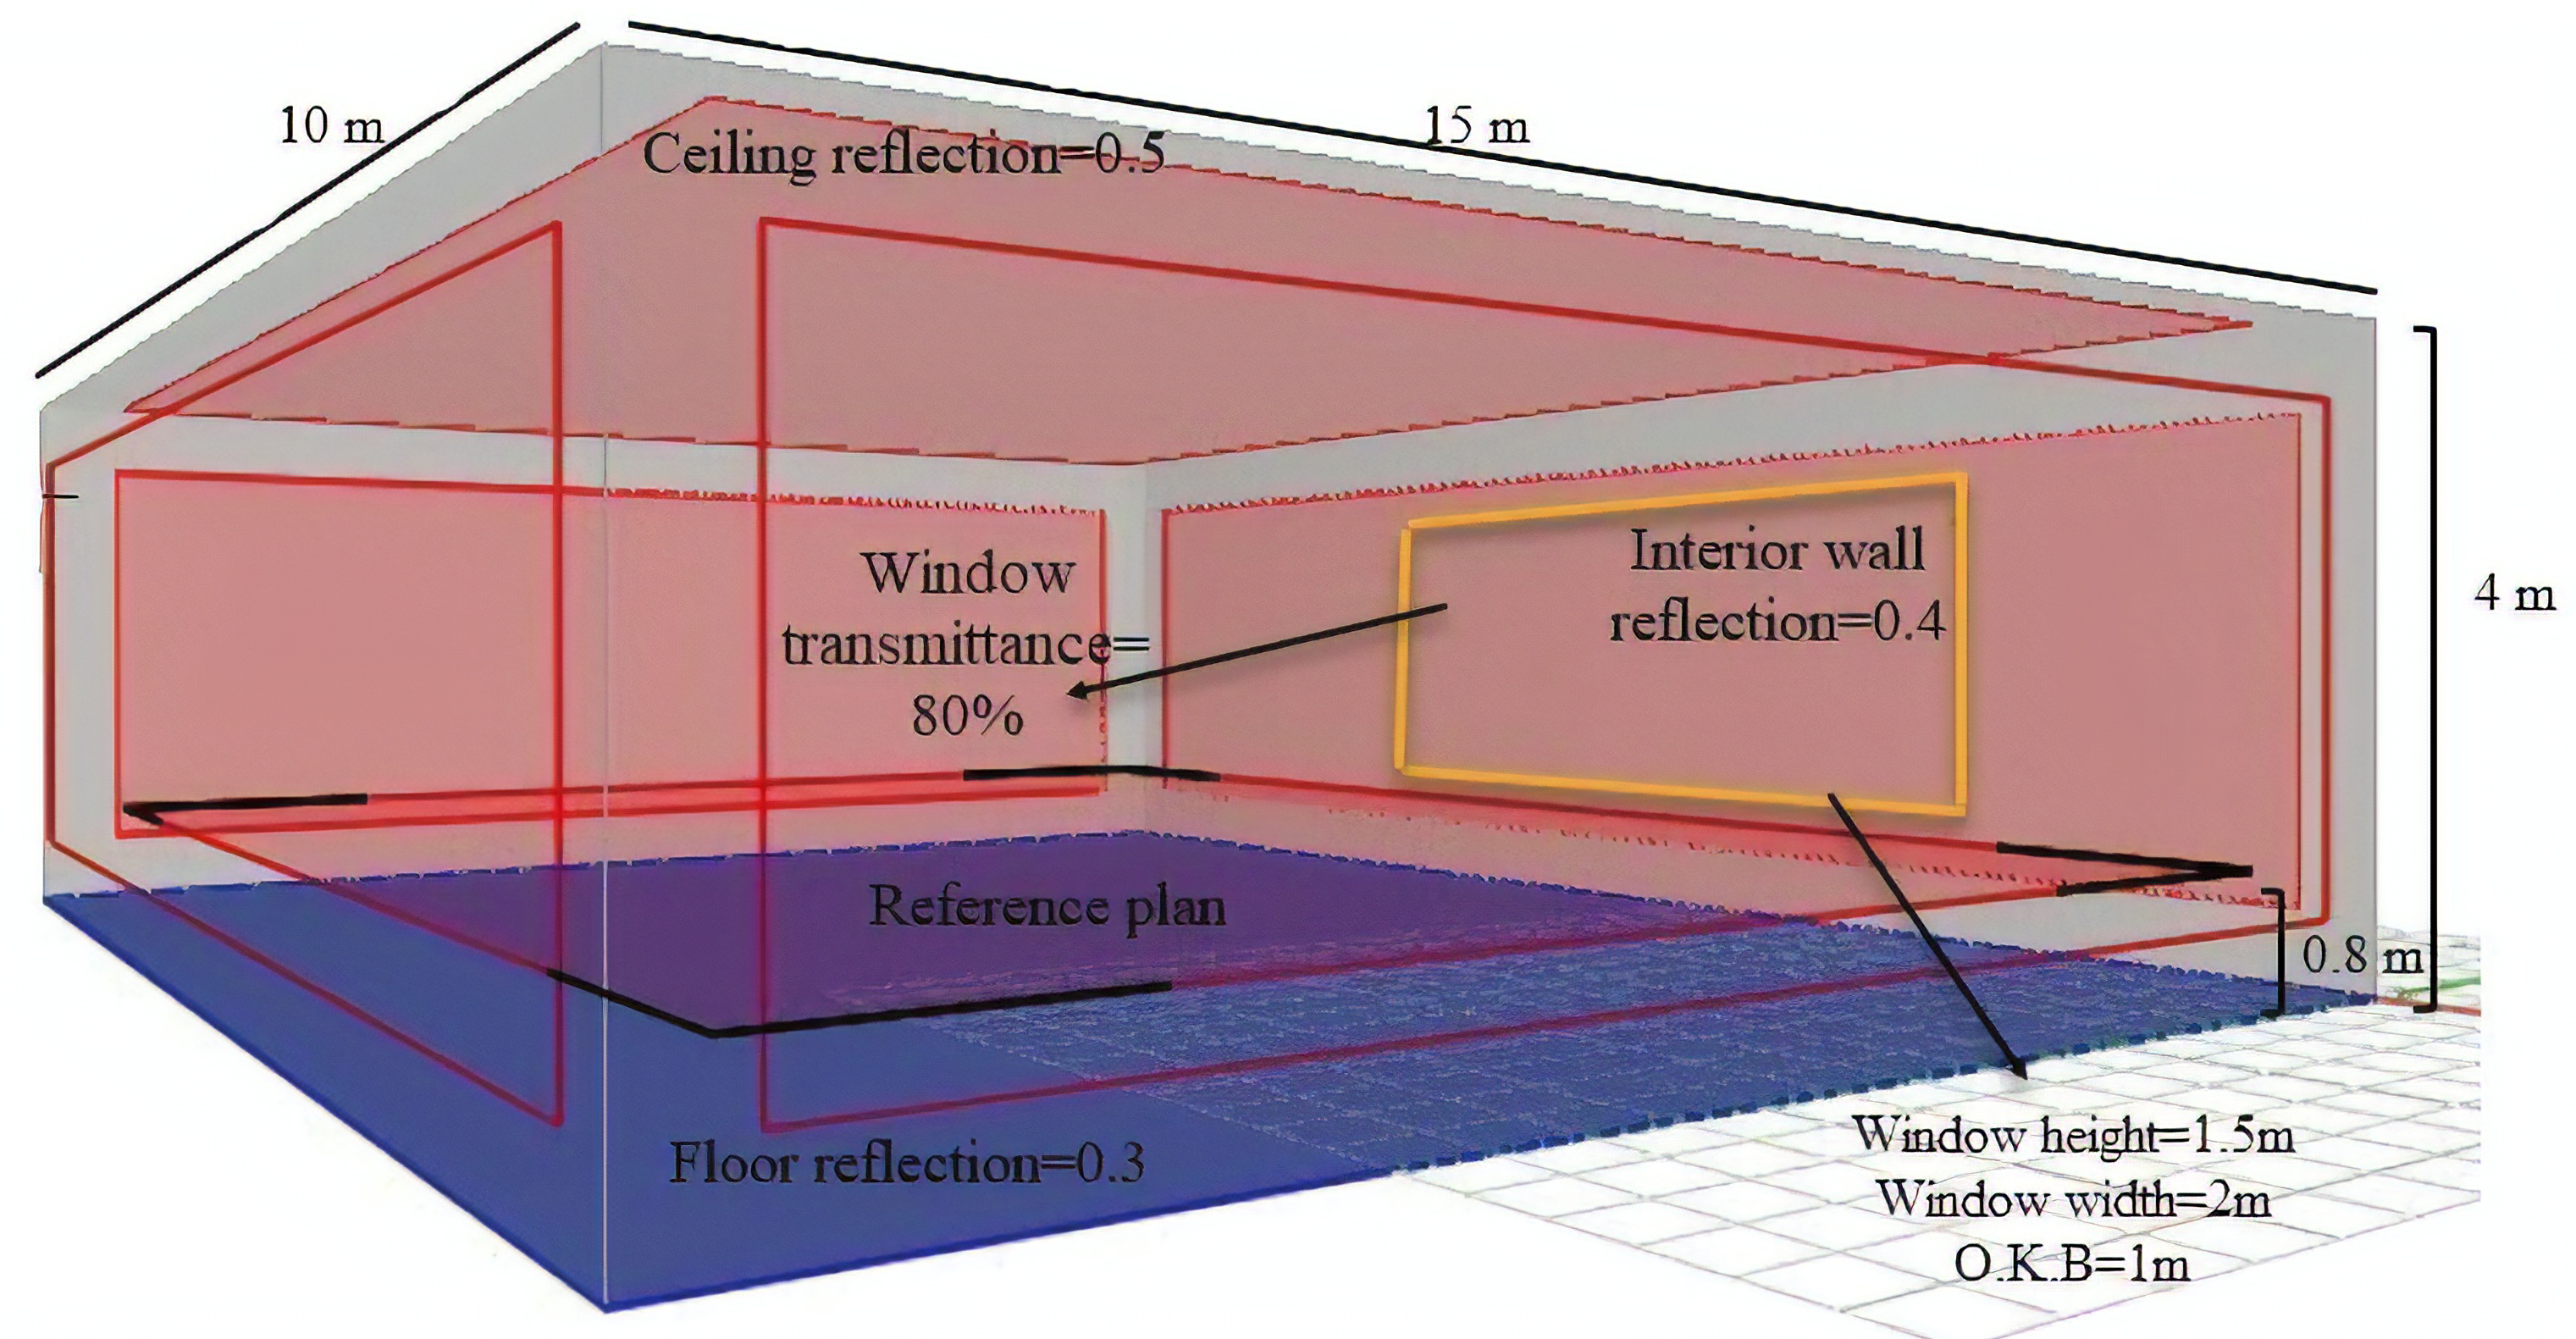
Fig. 3. Specifications of the base model in Relux Software.
To calculate the amount of energy conservation, a photosensor technique was used for artificial lighting in space. When daylight is within required level, the lights are turned off and otherwise turned on. The lights are first selected according to their size and efficiency, and through this technique, the reduction of electrical energy consumption in each scenario is obtained using Relux software that analyzes both natural and artificial light. Also, the optimization is done with the help of logical reasoning and simulation method. In fact, the order of the role of the architectural elements such as the dimensions and position of the openings, the reflectivity of the surfaces and the layout of the space have been investigated using simulations in Relux software. Visual comfort has been investigated by calculating the uniformity rate and in fact the degree of uniformity of light in space through Relux software. Also, with the help of photosensors the amount of light is controlled properly. The impact of external shadings has not been investigated and only the internal shadings (curtains) have been investigated in the final phase of the simulation. Due to the wide range of variables in this subject, this issue has not been addressed in this research, and this is suggested for the future research.
In addition, EN 15193-1 [49] as well as CEN / TC 169 / WG 11 [50] standards have been used for daylight monitoring. The variables considered in this study also include: Daylight factor, Uniformity, Electrical energy consumption, Window Position, Window Form, Space geometry, Layout of furniture and Reflectivity of surfaces.
4.1. Window position
In order to select the appropriate dimensions and position of the windows, several studies suggest the 30 and 50 cm as the most suitable distance of room to the top of the windows. The position of the windows should be in a way, so it provides a vision and interaction with outside as well as allowing better distribution of inbounding lights. The windows to wall ratio are chosen based on the school standards (the area of the window should be about 30 to 40 percent of the façade area) as there is not a certain standard for study spaces. For modelling and analyzing proposes this ratio is increased gradually from 35% to 40% and eventually to 45%. Based on the window to wall ratio of 35%, the obtained length for the window is 1.5 cm (Fig. 4, Mode 1). Also, considering OKB at 1m, 50 cm distance from walls of both sides, the maximum length of the window at 9 m and the window to wall ratio of 35% yields in the obtained height for the window is 1.5 m (Fig. 4, Mode 2). However, after determining the appropriate initial dimensions for the window, the optimum position of their placement in both north and south orientation is selected according to Table 3 while considering various models. The previous step is taken to achieve visual comfort and reduction of electrical energy consumption. Examining the electrical energy consumption in space, the energy consumption of space in the normal mode is collected. The electrical energy is calculated with the help of in-space photosensors via Relux software. Furthermore, the electrical energy consumption rate is obtained by considering daylight controllers with presence of optical linkers for artificial lighting system which turns on with enough daylight (in the standard range of 300 to 500 lux) and they turn off when the daylight is not sufficient as well as dependency of linkers to the presence and absence of the residents. The difference between the two obtained values indicates the percentage of reduction in electrical energy consumption for the modelled study hall.
Figure 4
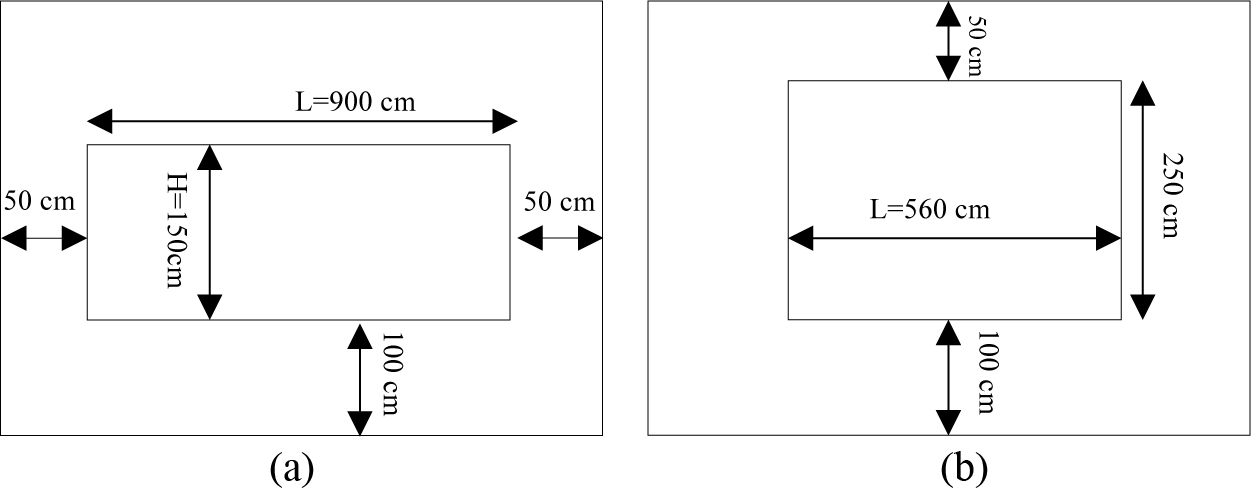
Fig. 4. Specifications of windows in the simulation (a) window with width maximum (mode 2) WWR=35% and (b) window with height maximum (mode 1) WWR=35%.
Table 3
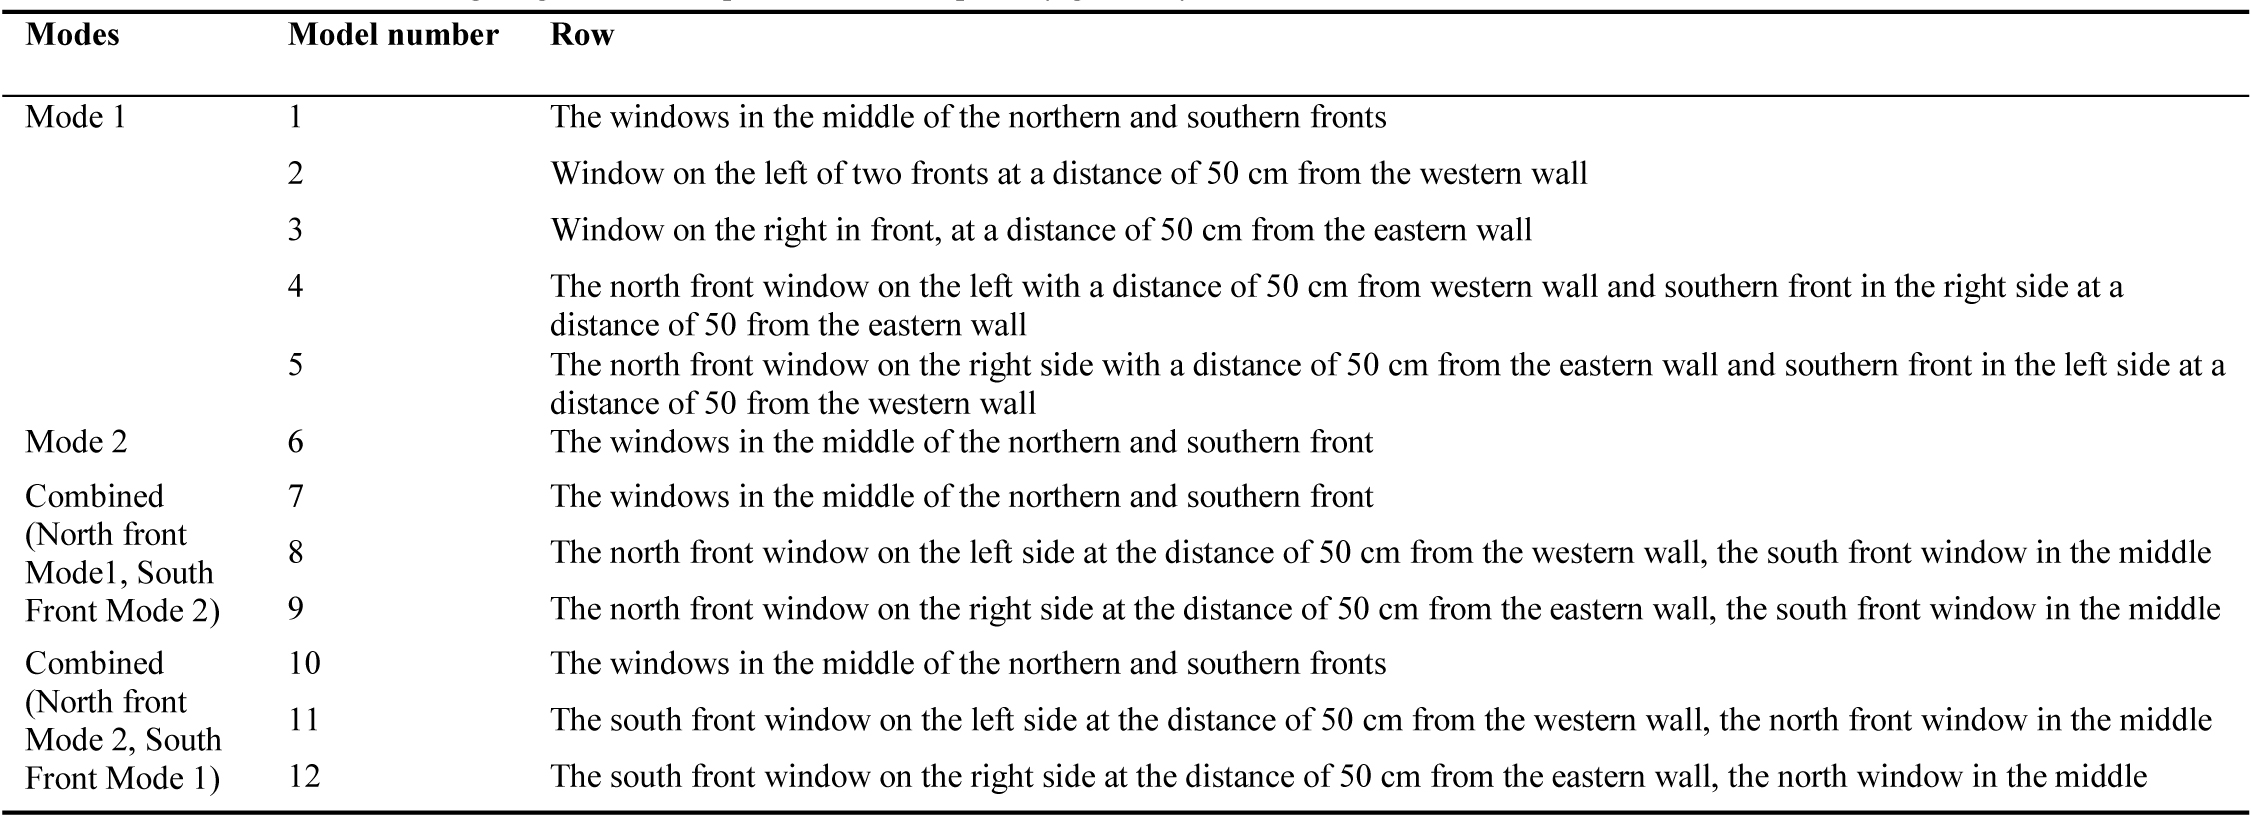
Table 3. Various models in investigating the window position with the primary geometry.
According to Fig. 5, it is evident with windows at maximum height on the two sides of space, the rate of daylight and uniformity rate fall is into an appropriate range in comparison with the standard model. However, by changing the position of the windows to the left and right of the space, it is seen that the uniformity of daylight distribution decreases. This value is not consistent in every point, which causes the undesired glare for the users. By placing the window at its maximum length, uniformity is again at its lowest level. In combined modes, it was evident that by using the horizontal window with the vertical window, the rate of uniformity in the space is slightly improved. However, when the windows are in the middle of walls, more uniformity is experienced. Finally, it could be concluded that in mode 1, walls, a steadier rate of daylight and uniformity is experienced in the space. Considering the inbounding daylights and its distribution in space, with the presence of high openings, the deep light penetration caused the lighting to be in the range of illuminance and reduced the distance between minimum and maximum illuminance. As a result, the daylight factor and uniformity rate will be at a better range in terms of visual comfort. This uniform light distribution enables the residents to utilize less artificial lighting in space, which helps to reduce electrical energy consumption by 30%. This value of reduction is compared with other situations in Fig. 6. The illuminance distribution in the optimal model is shown in Fig. 7. With better distribution and uniformity of daylight in space, the rate of uniformity is as close as 0.6, meaning better distribution and uniformity of light in space. Therefore, the need to use artificial light has also been reduced, leading to visual comfort for users and reduced energy consumption. Among the studied scenarios, all the numbers obtained for the uniformity rate were less than 0.24 and this option worked better than the others, as well as the daylight factor. According to the previous comments, the energy consumption is compared with the baseline scenario and the percentage reduction is achieved.
Figure 5
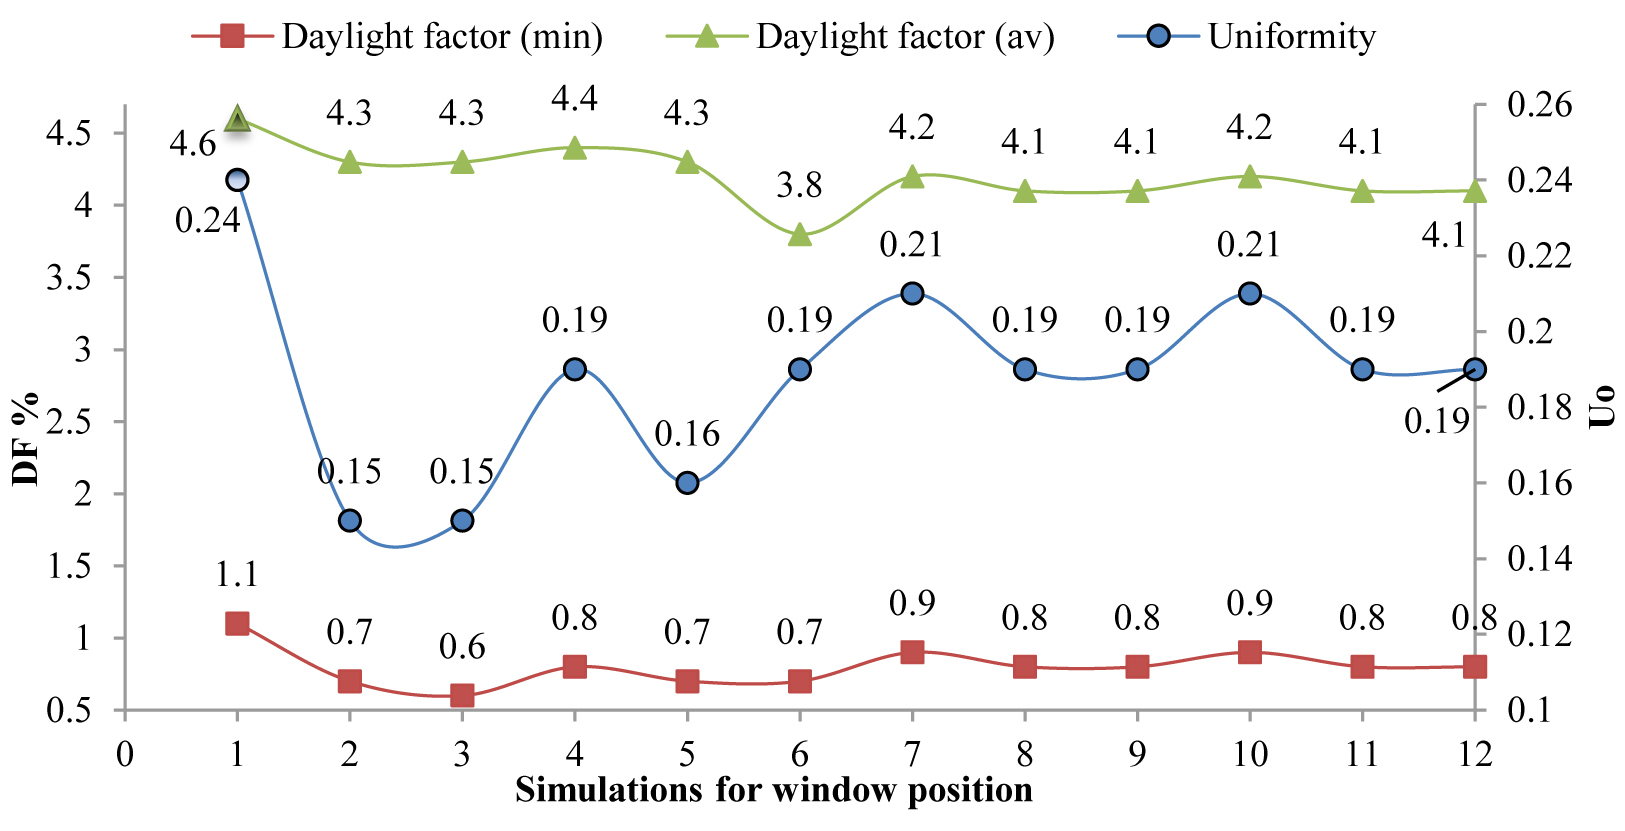
Fig. 5. Results of modeling for visual comfort.
Figure 6
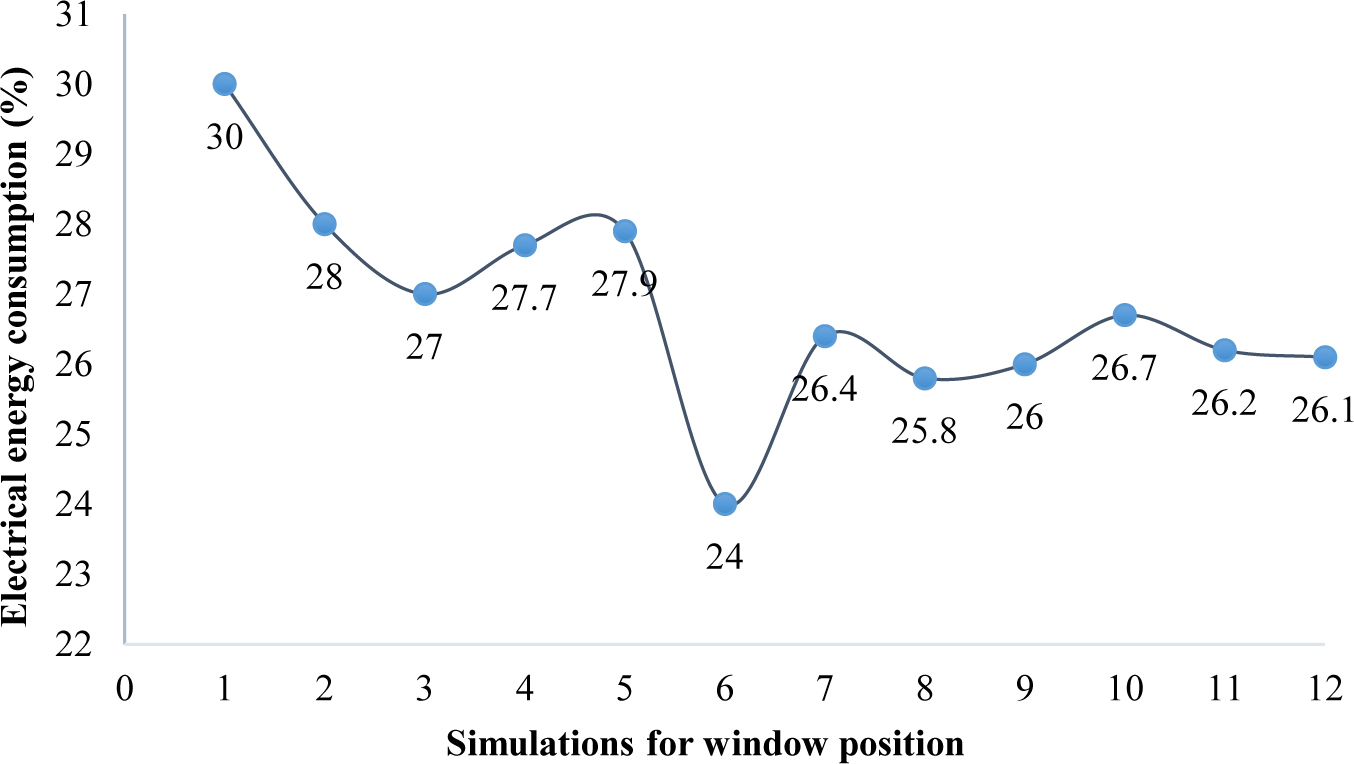
Fig. 6. Percentage of changes in electrical energy consumption of space.
Figure 7
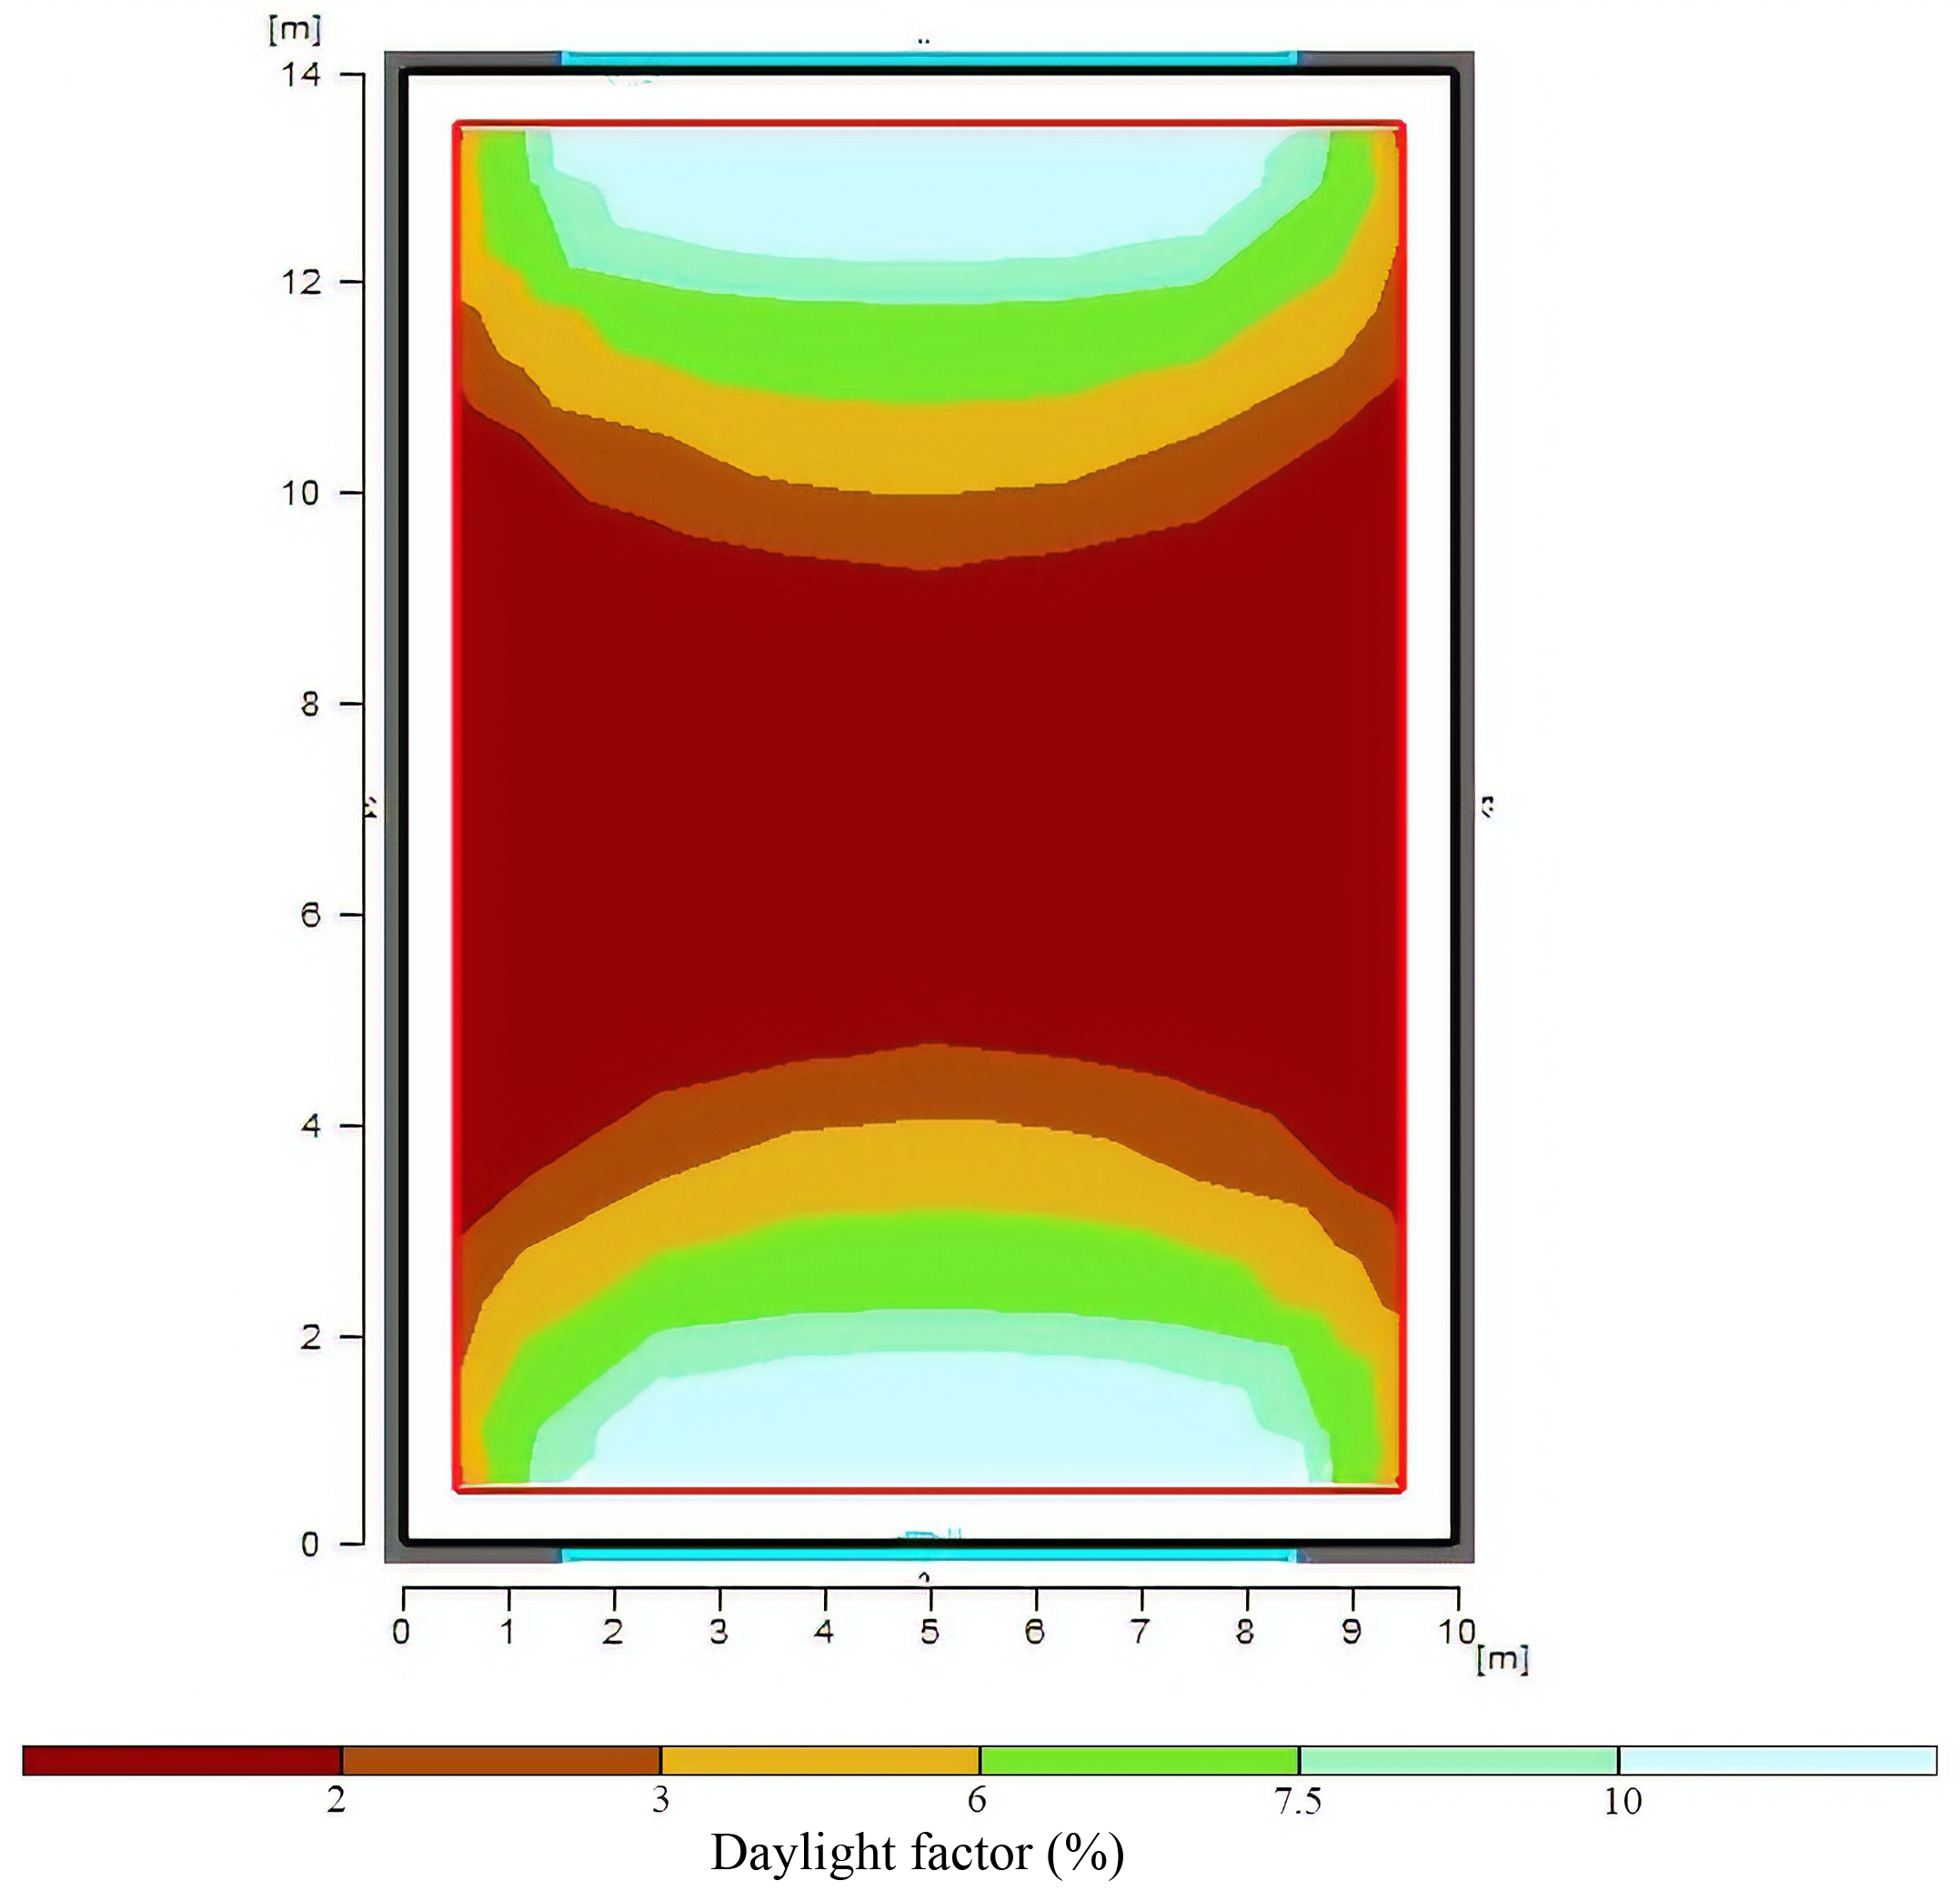
Fig. 7. Display of daylight factor distribution for the selected option (scenario 1) of the window position.
4.2. Window form
In this section, the dimensions of the windows are discussed using Table 4. Before analyzing this effect, the window to the wall ratio is changed from 35% to 45% and subsequently 40 %. Hence, the ratio of 40% provides suitable results. Hence, this value is considered as a default for modelling proposes of this study as well as calculating the area of the implemented windows. In this section, the first and the base scenario/model is obtained using the previous window to wall ratio of 40% and the window length of 6.40 cm. To obtain the appropriate window dimensions, the horizontal and vertical divisions are performed at the level of the windows while considering the distance from the floor, roof, and as well as the window to wall ratio. Considering Fig. 8, creating vertical divisions disturbs the daylight distribution. However, amongst all the scenarios with vertical division, scenario three which divides into four vertical windows, provides better results in comparison to other cases. This could be justified by creating more divisions, the window is changed from vertical mode and it almost covers all of the wall surfaces which increases the difference in the light distribution which ultimately does not provide suitable and positive results. However, having horizontal divisions, the negative impact of vertical divisions is diminished. The next step includes creating a grid division that involves a combination of scenario 3 with vertical division and scenario 6 with the horizontal division. Finally, scenario 8 offers a horizontal-vertical network relative to the base model which shows a more uniform distribution of the daylight. Therefore, it can be concluded that the use of the grid windows is the best option as the distance from the roof and the floor is investigated. Figure 9 portrays the changes in electrical energy consumption in these scenarios. It is evident in scenario 8, in addition to creating the appropriate conditions of lighting, a 32% reduction in the consumption of artificial light is recorded. Since this research aims to find the best option to provide a satisfactory level of visual comfort conditions while reducing electrical energy consumption, scenario eight is considered as the optimal and base model for the next stages of this study. The results, as mentioned earlier, are shown in Fig. 10.
Table 4
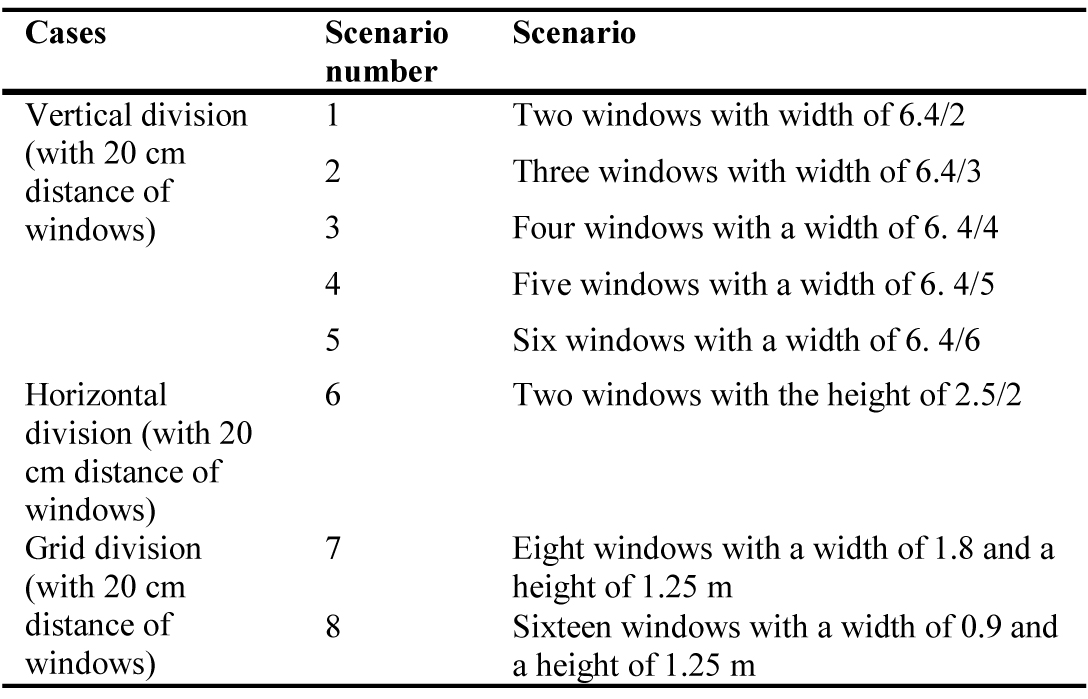
Table 4. The different models of dimensions of the window (division with a distance of 20 cm).
Figure 8
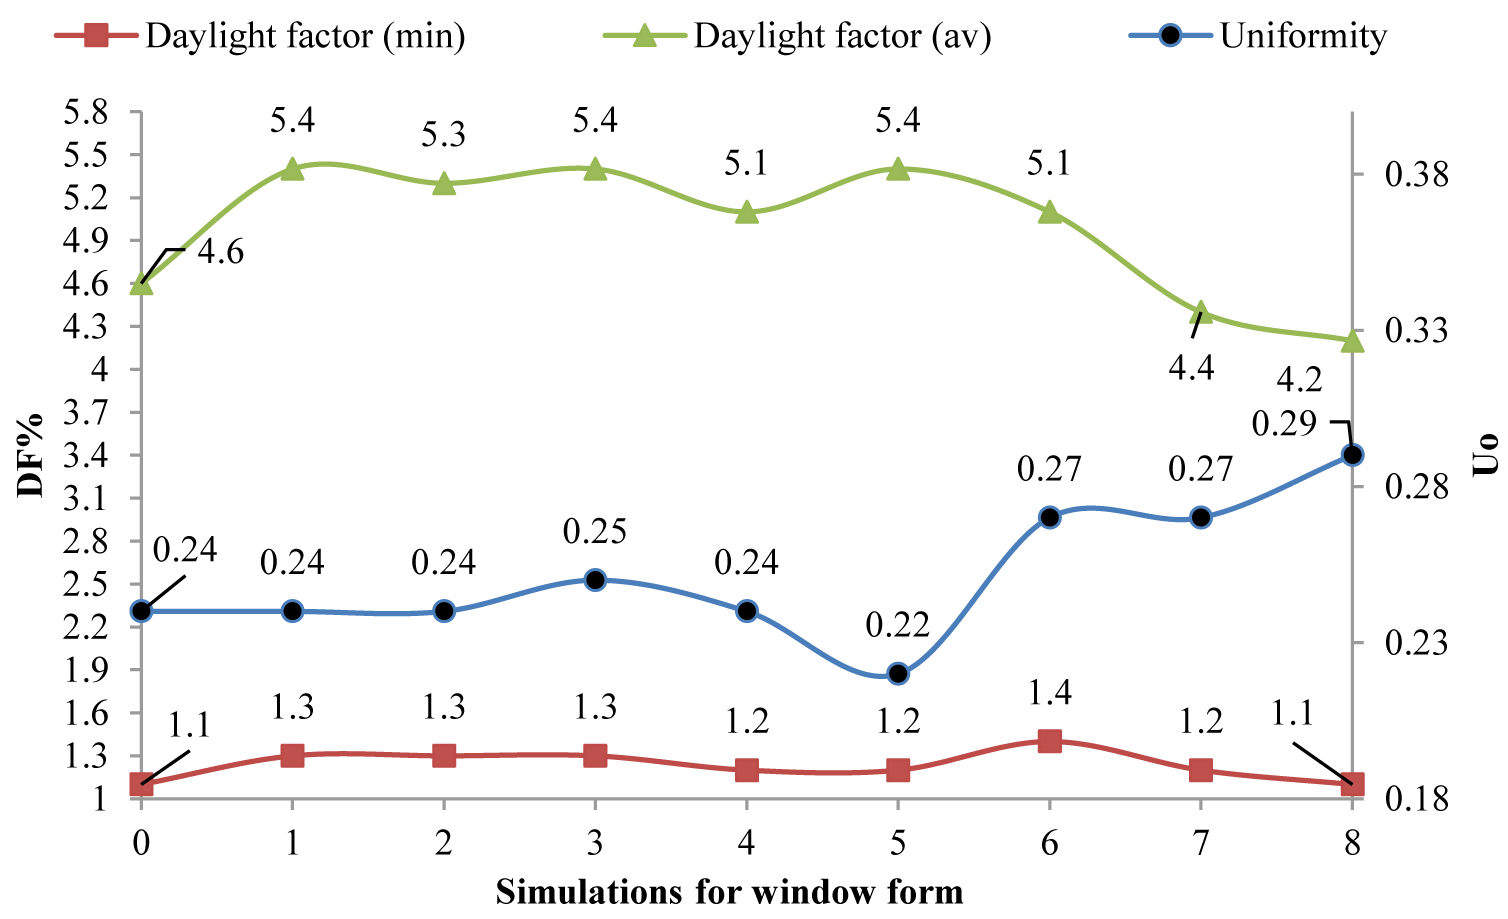
Fig. 8. The results of modelling in the study of visual comfort.
Figure 9
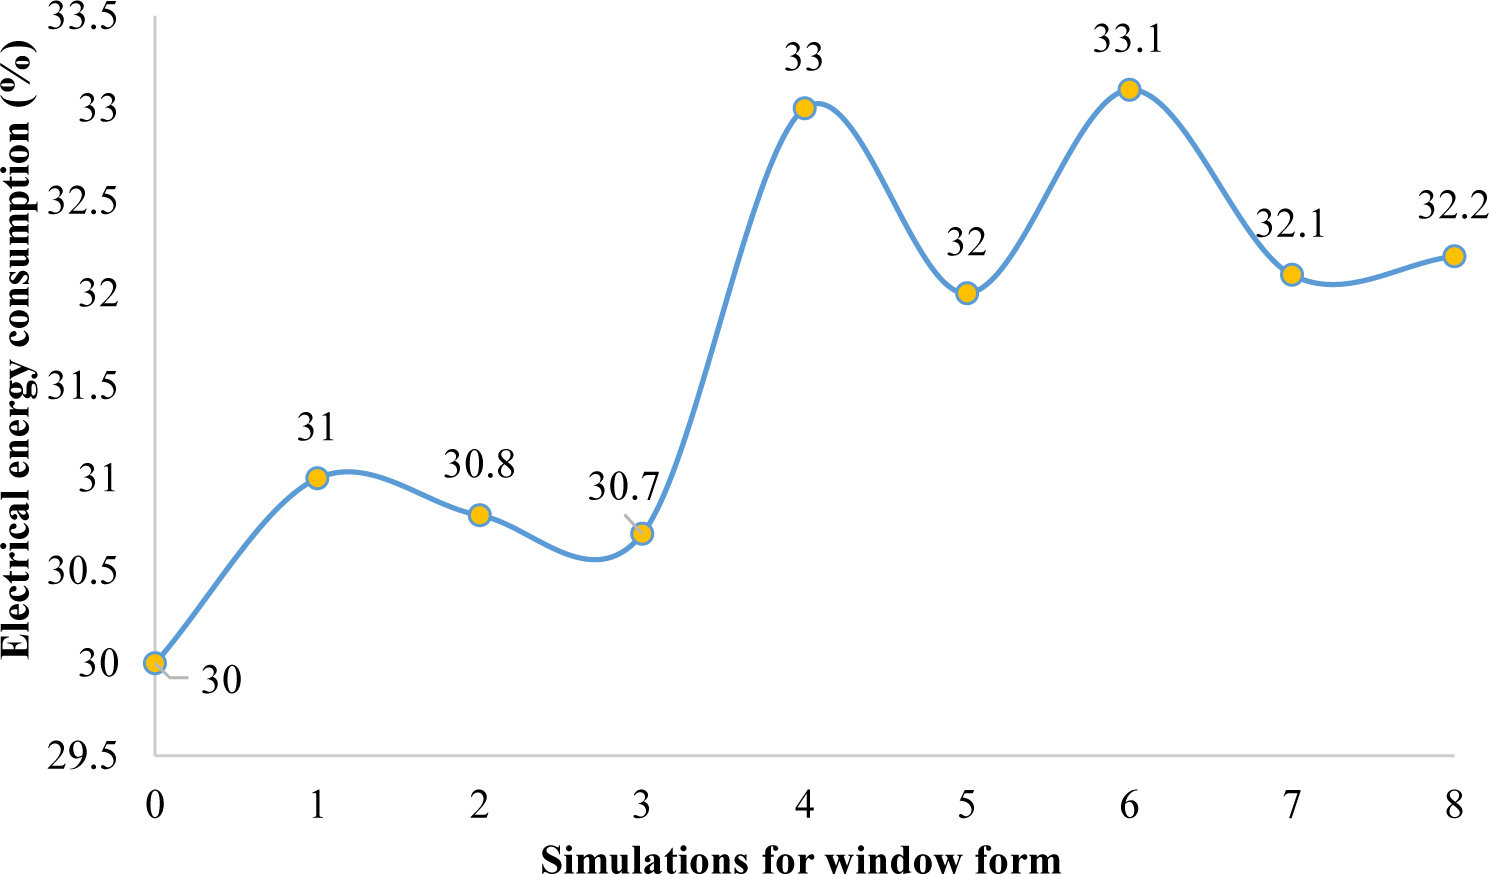
Fig. 9. Percentage of changes in electrical energy consumption of space in different models.
Figure 10
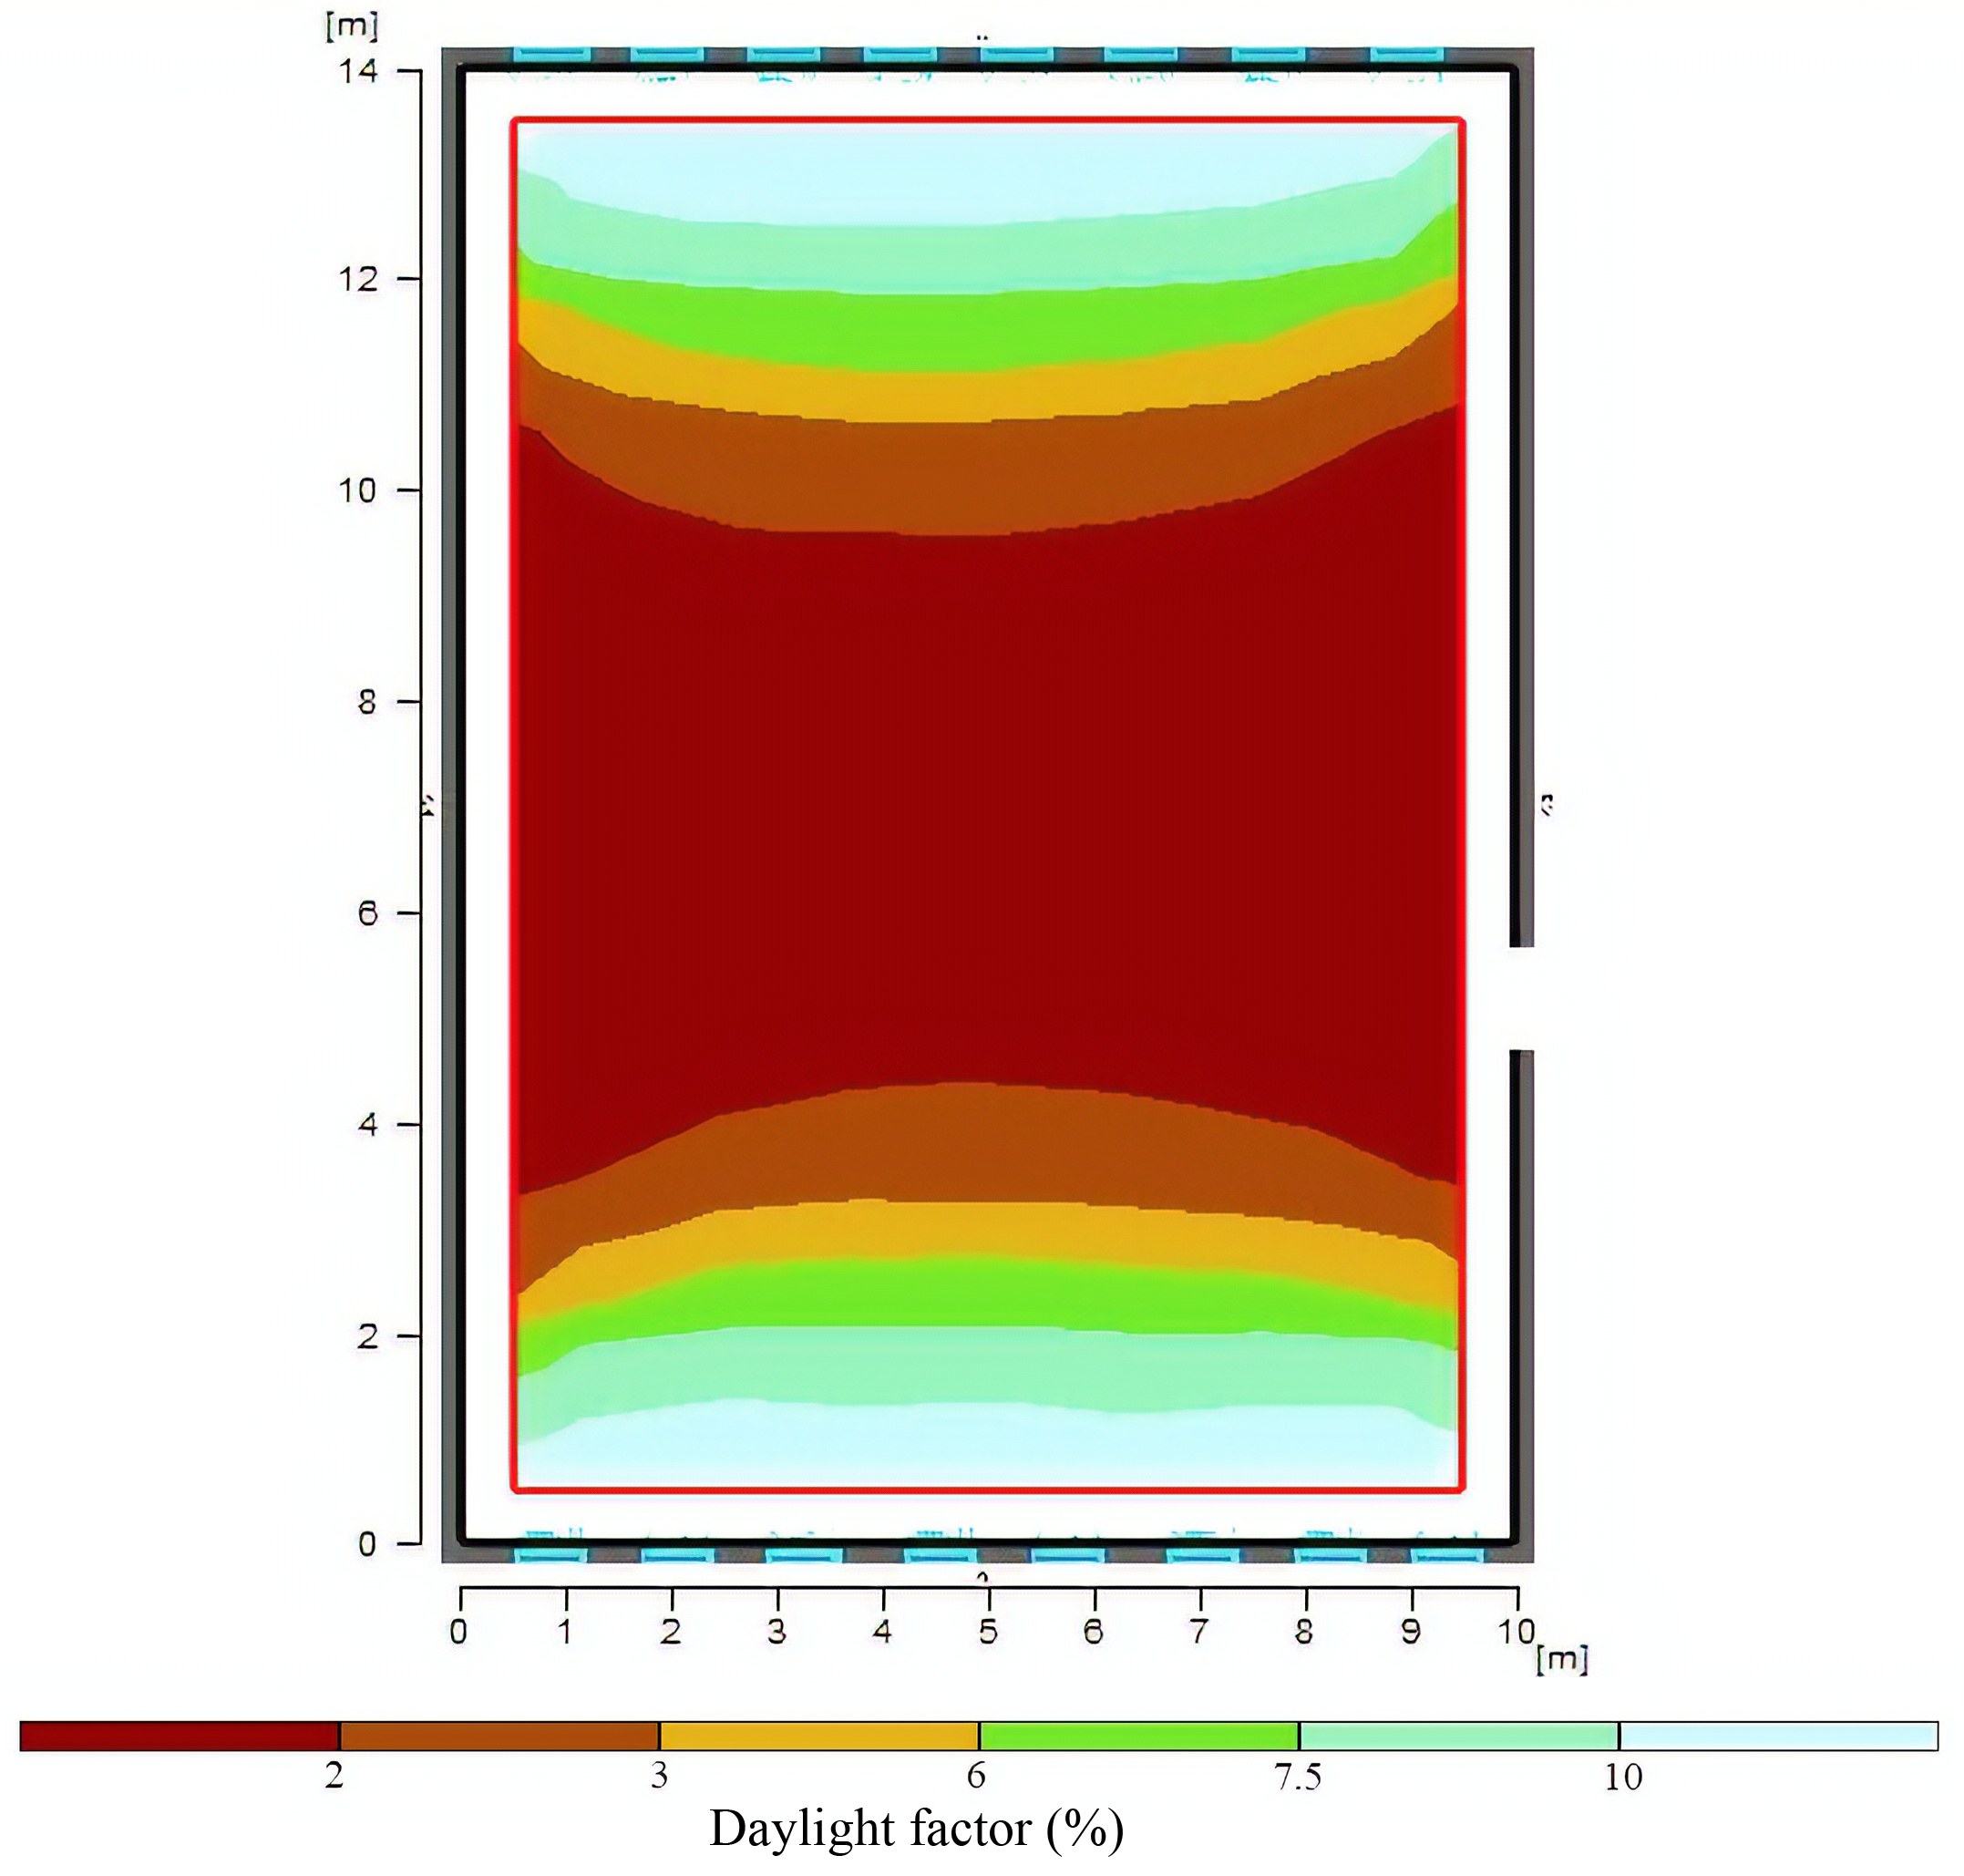
Fig. 10. Illustrating daylight factor distribution for the selected option (scenario 8) of dimensions of the window.
This section considers vertical and horizontal divisions that are close to Iranian architecture and sash windows [51]. Smaller area windows allow better distribution of light in the space and provide better visual space.
4.3. Space geometry
After determining the position and dimensions of the window, the geometry of space proportions is examined in this section. Table 5 shows the length to width ratio, and implementation of internal awnings to provide the optimal conditions of thermal comfort.
Table 5
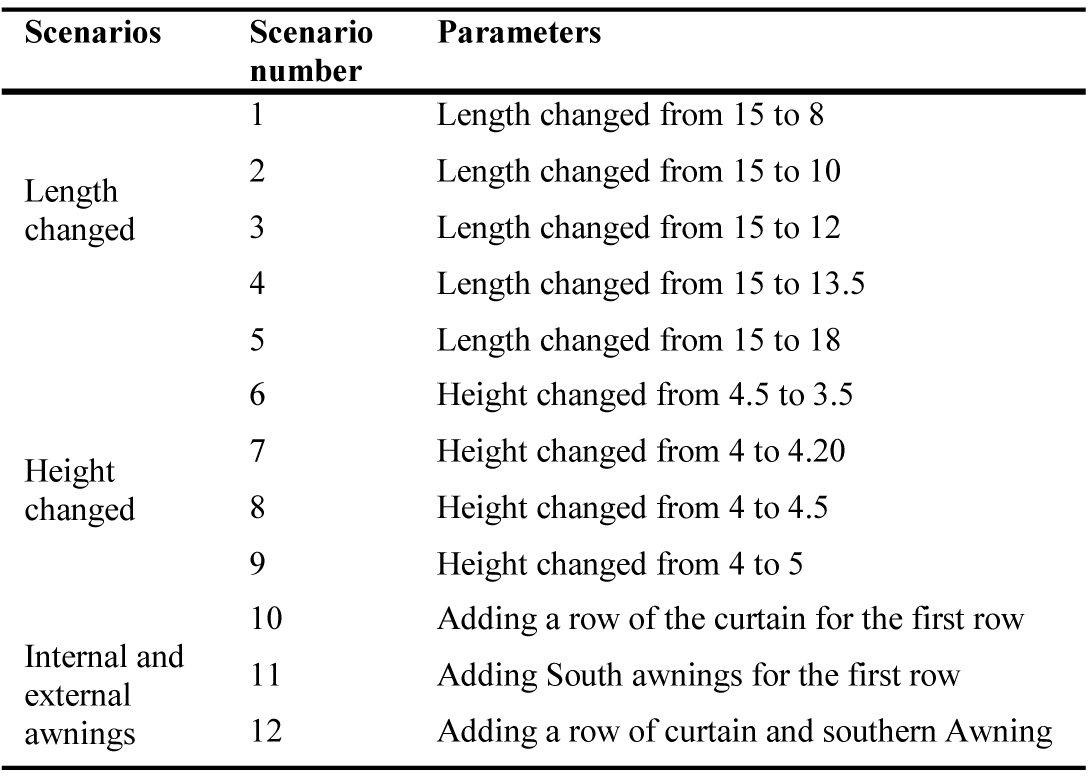
Table 5. Different models in studying space geometry.
According to Fig. 11, the reduction of the length to the width ratio due to the excessive amount of inbounding light in space, the difference between the minimum and maximum daylight factor in space is increased. In other words, the rate of uniformity is far from the standard value. With the increase in length in Scenario 5, the rate of uniformity, minimum and maximum daylight factor reduces drastically. This means the light distribution is not satisfactory due to the high length of the space. However, an increase in dependent variables values is seen by changing the height. The increased height by 5m in scenario 5, increases this rate and causes the illuminance distribution. Therefore, the obtained results suggest that space height up to 4.5m is better in providing a more uniform distribution of light and lighting the environment. With increasing the height, the amount of using artificial light or daylight will vary according to each other, and the comparison of these two values will show reduction percentage in energy consumption, this is taken into account in all studies. Also, only the number of lamps in each scenario for energy consumption varies according to software calculations and their type and amount of power are assumed to be the same. Therefore, according to the space requirement and photosensors, the energy consumption rate is calculated and compared to the baseline model, the reduction percentage in each scenario is obtained.
Figure 11
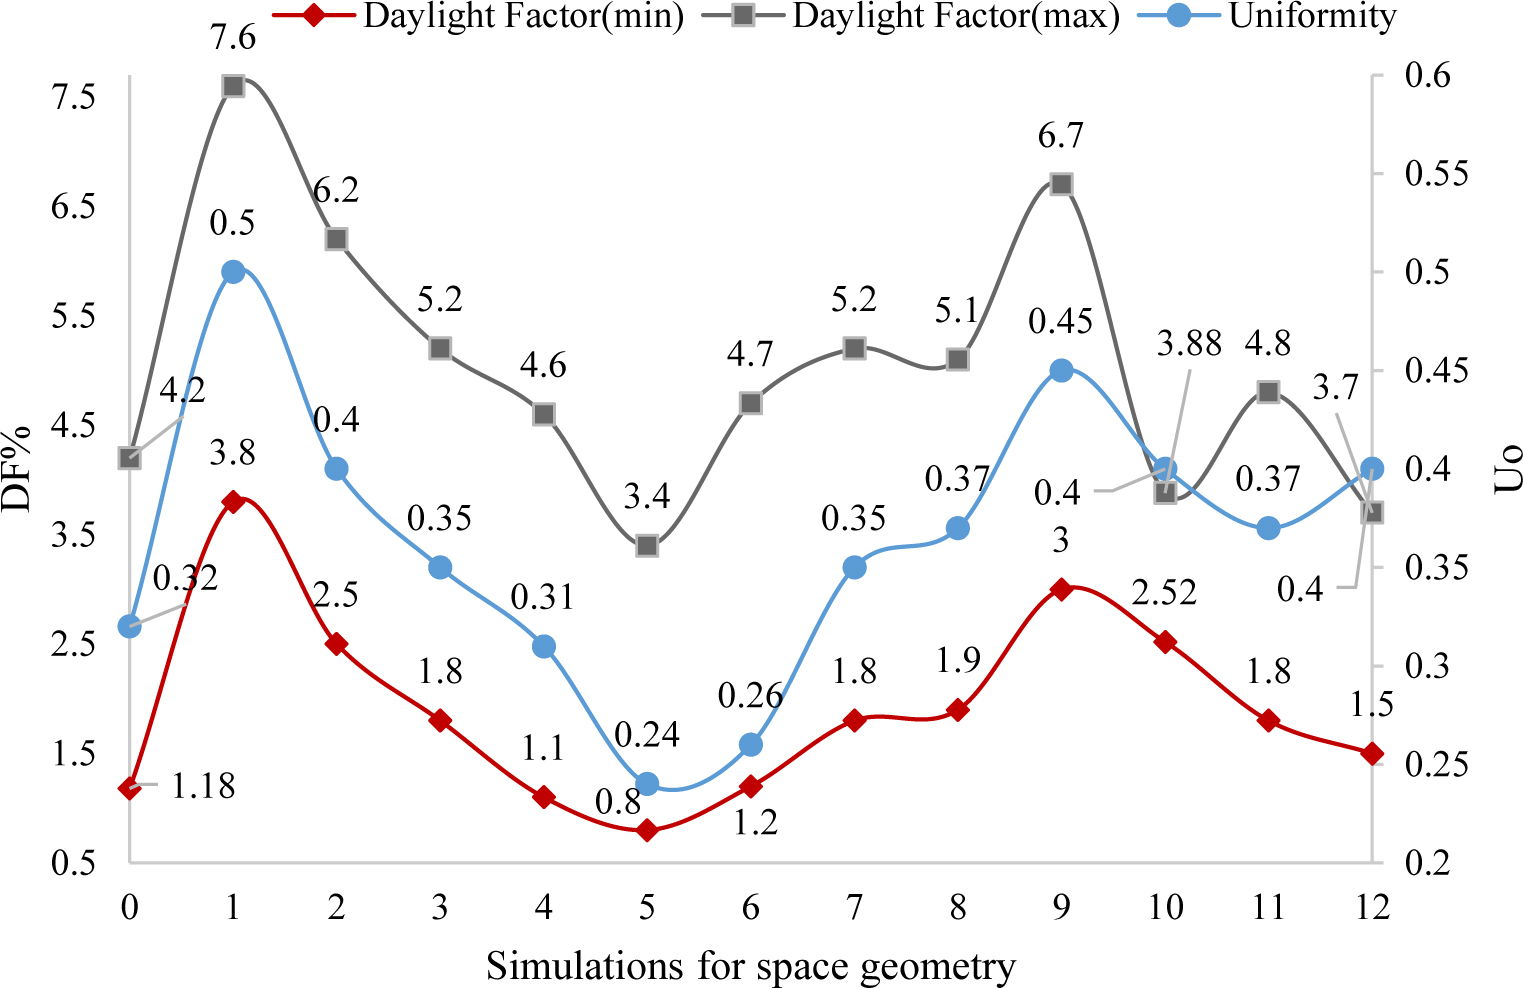
Fig. 11. The results of modeling in the study of visual comfort of space.
Furthermore, usage of internal curtains as awnings creates a lighting balance between the area around the window and center of the space. That rate of uniformity and daylight factor in space compared to the other scenarios in the case as mentioned earlier is closer to the standard. The external awnings on the south side reduce this rate in a way that the minimum daylight factor is reduced while its maximum increases. The results indicate that using southern awnings against internal curtains harms the balanced distribution of daylight in space. Finally, implementing both types of awnings simultaneously has no desired effect in space. Therefore, according to Fig. 12, in terms of electrical energy consumption, a 34% decrease is seen in the option 10. Additionally, based on the results of Fig. 13, this option is considered as the most desirable option in simultaneous visual comfort and energy consumption which is selected as the base mode.
Figure 12
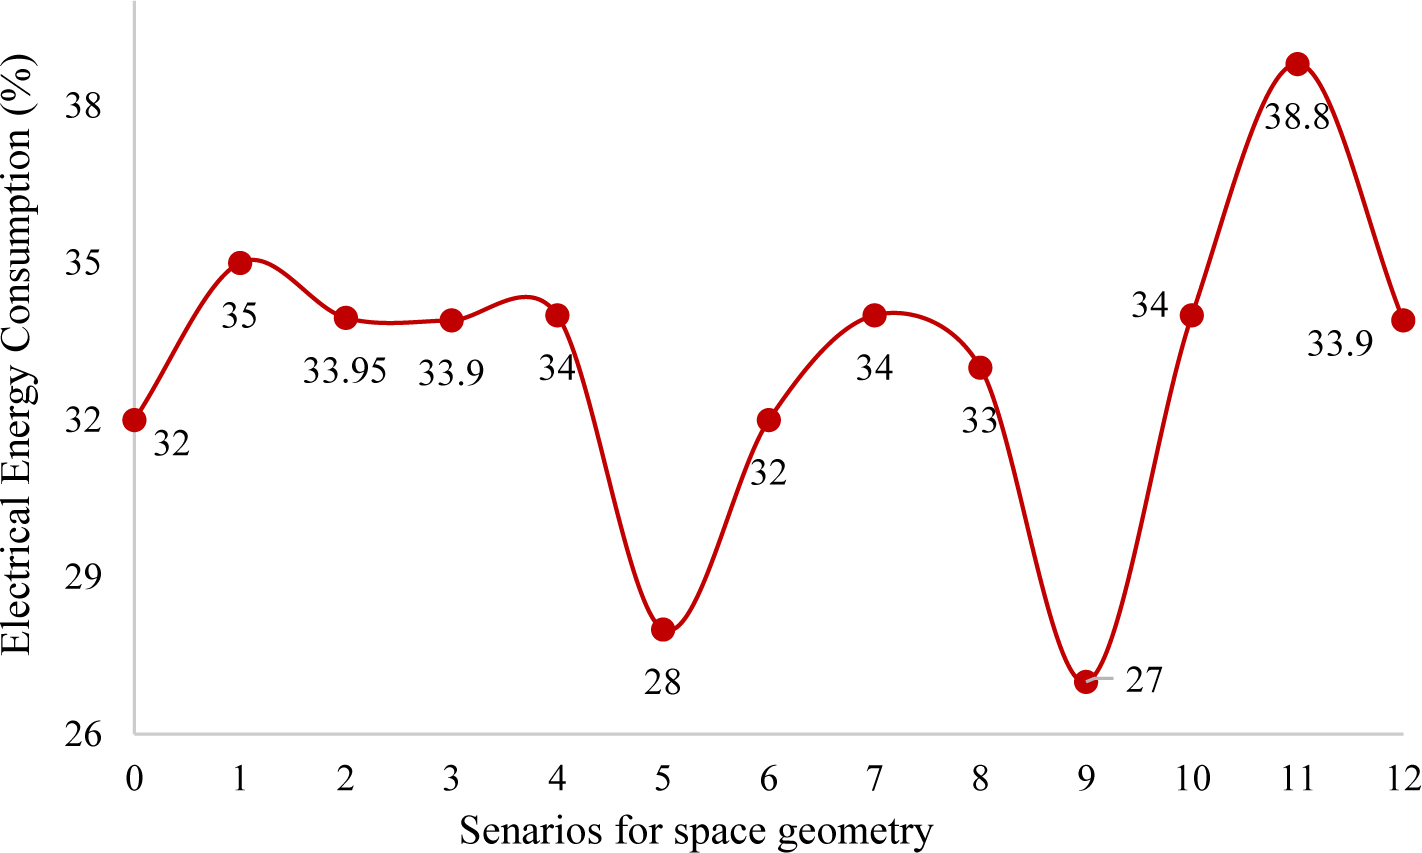
Fig. 12. Percentage of changes in electrical energy consumption of space in different models.
Figure 13
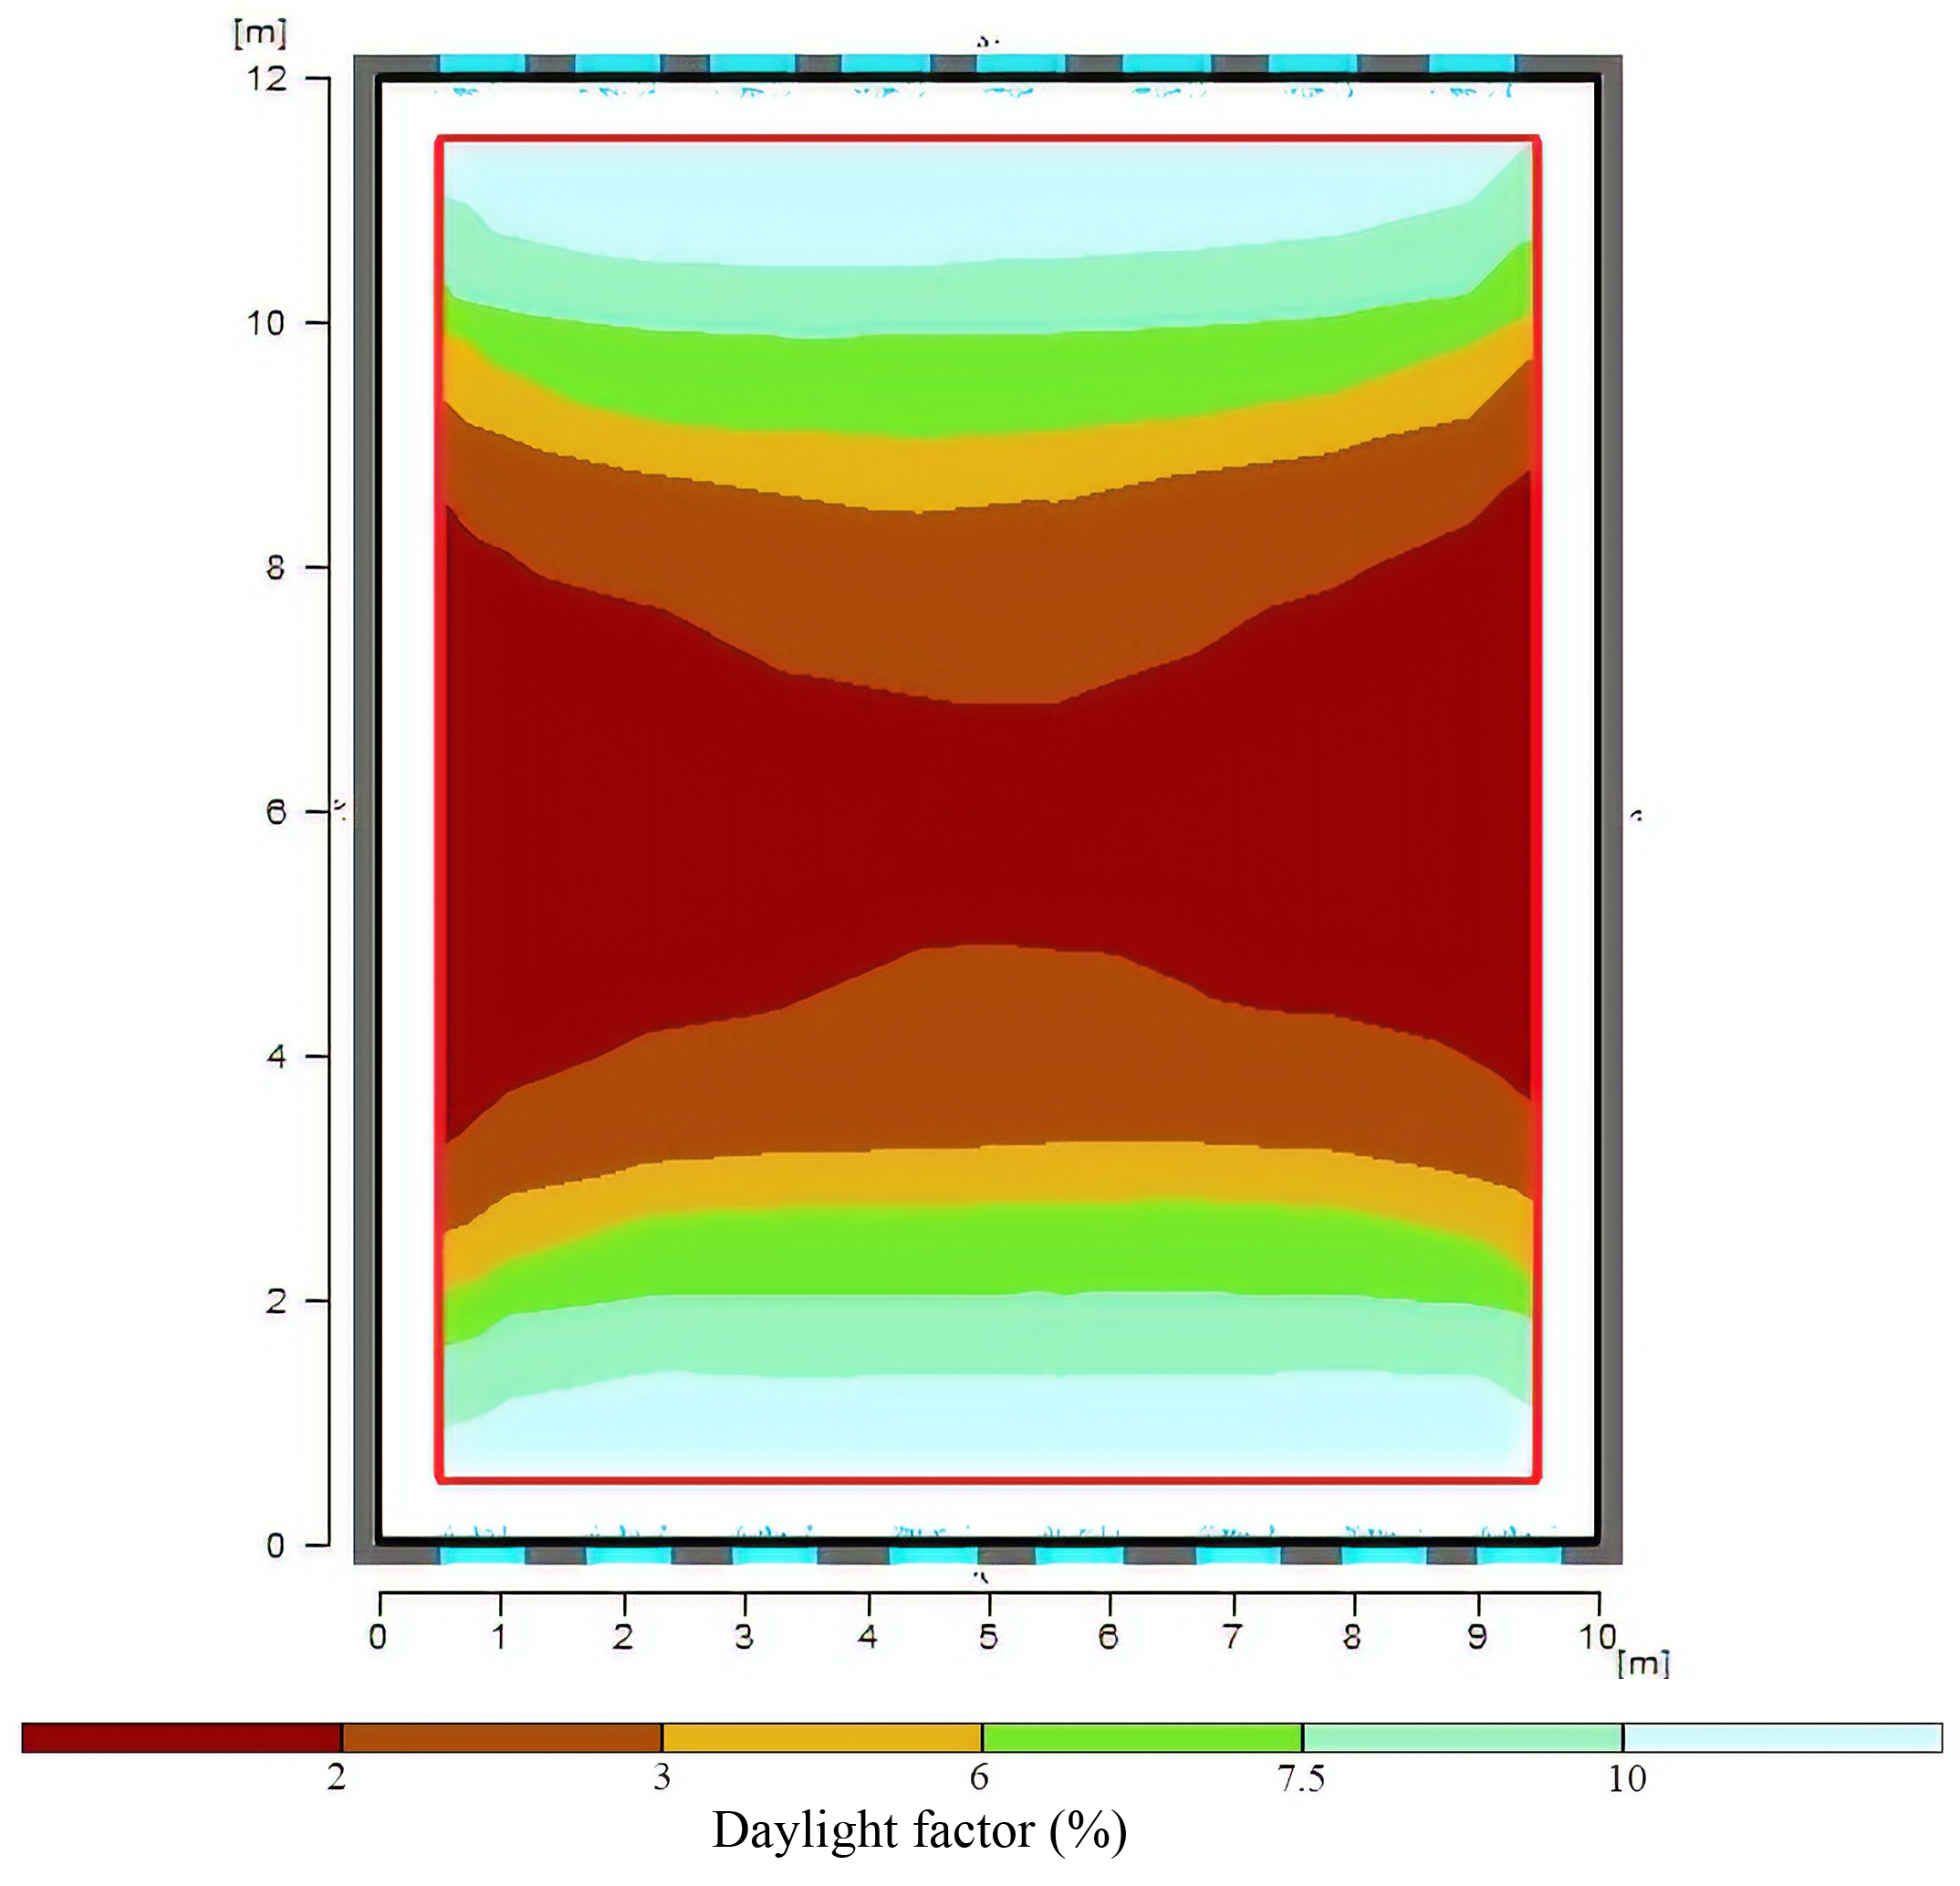
Fig. 13. The display of daylight factor for the selected option (Scenario 10) of dimensions of the window.
4.4. Layout of furniture
As is evident in Fig. 14, the layout types are changed in various forms. Different modes are tested to investigate the reflection effects of both horizontal and vertical surfaces. Figure 16 shows that eight layouts behave desirably. In more detail, the occupancy level of tables is considered 28% of the study space with a capacity of 50-60 (54 users). The main difference among various models is the placement of vertical and horizontal surfaces, separating study tables (vertical or parallel with beams of light).
Figure 14
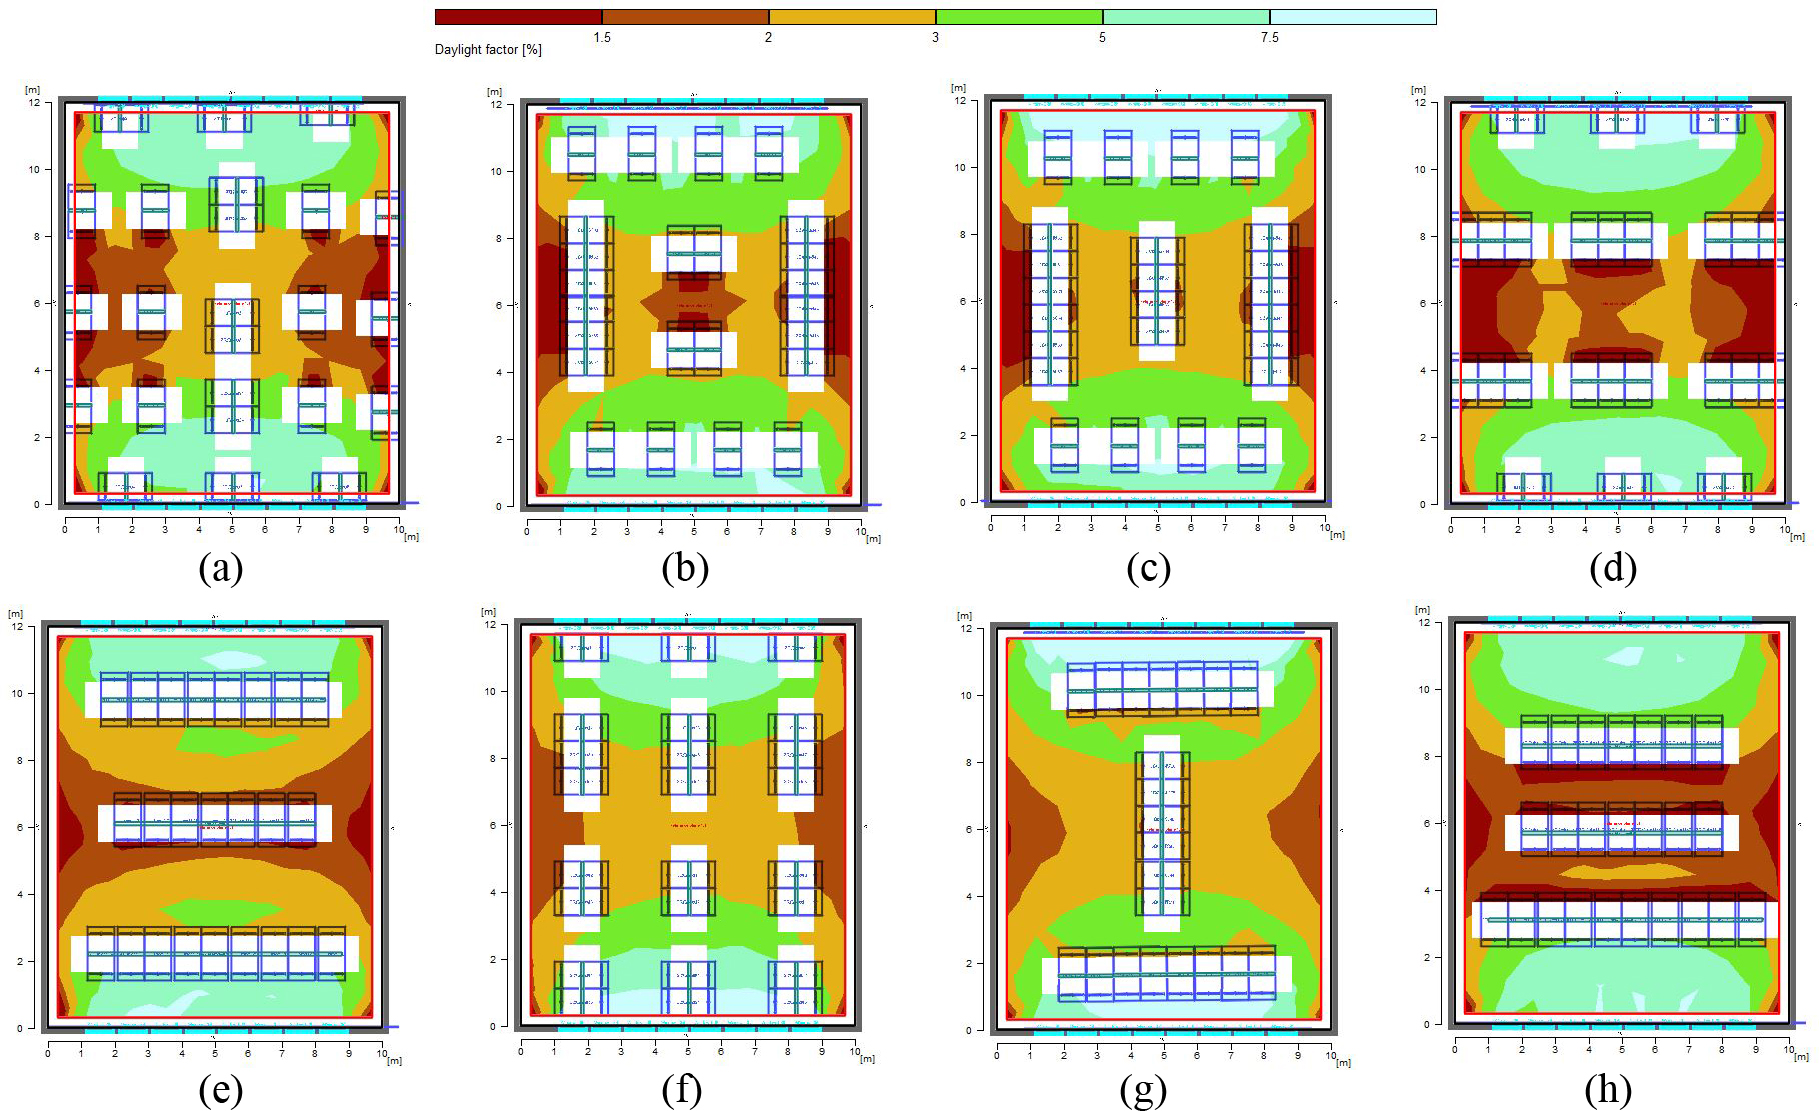
Fig. 14. Distribution of DF in different layouts.
As shown in Fig. 15, among different scenarios for the layout of surfaces in the space, it is observed that scenario 7 has a higher uniformity rate as well as a more balanced minimum, maximum and mean daylight factor in comparison to other scenarios. In this scenario, the integrated placement of tables near the windows reduced the excessive light as the light is distributed in space. The integrated placement perpendicular to the layout close to the windows distributes the light throughout the space, and more uniformity in space is experienced. Besides, it is seen in Fig. 16 that the amount of electrical energy consumption in this scenario decreases by 32%. Although this reduction of energy consumption is lower than the base model, nevertheless the layout in the space is inevitable and it is considered in this investigation. This reduction in the amount of artificial lighting could be justified by the penumbra caused by the presence of tables, vertical and horizontal surfaces in space. Hence, based on the results, it is observable that in a space with elongated rectangle geometry, it is suitable to integrate the table layouts and place them closer to the windows to aid daylight radiation in space and achieve higher uniformity level of light through windows. Besides, the use of an integrated layout along the length of the space is recommended to spread the daylight in the middle and areas far from the windows. The presence of vertical surfaces separating study tables perpendicular to the window in a row near the window causes radiation of light at different points in space and vertical separating surfaces in parallel with the window in the middle of the space will point the radiation along with space and the inbounding lights are closer to the sidewalls. Therefore, scenario seven is considered as the base model for the next stage.
Figure 15
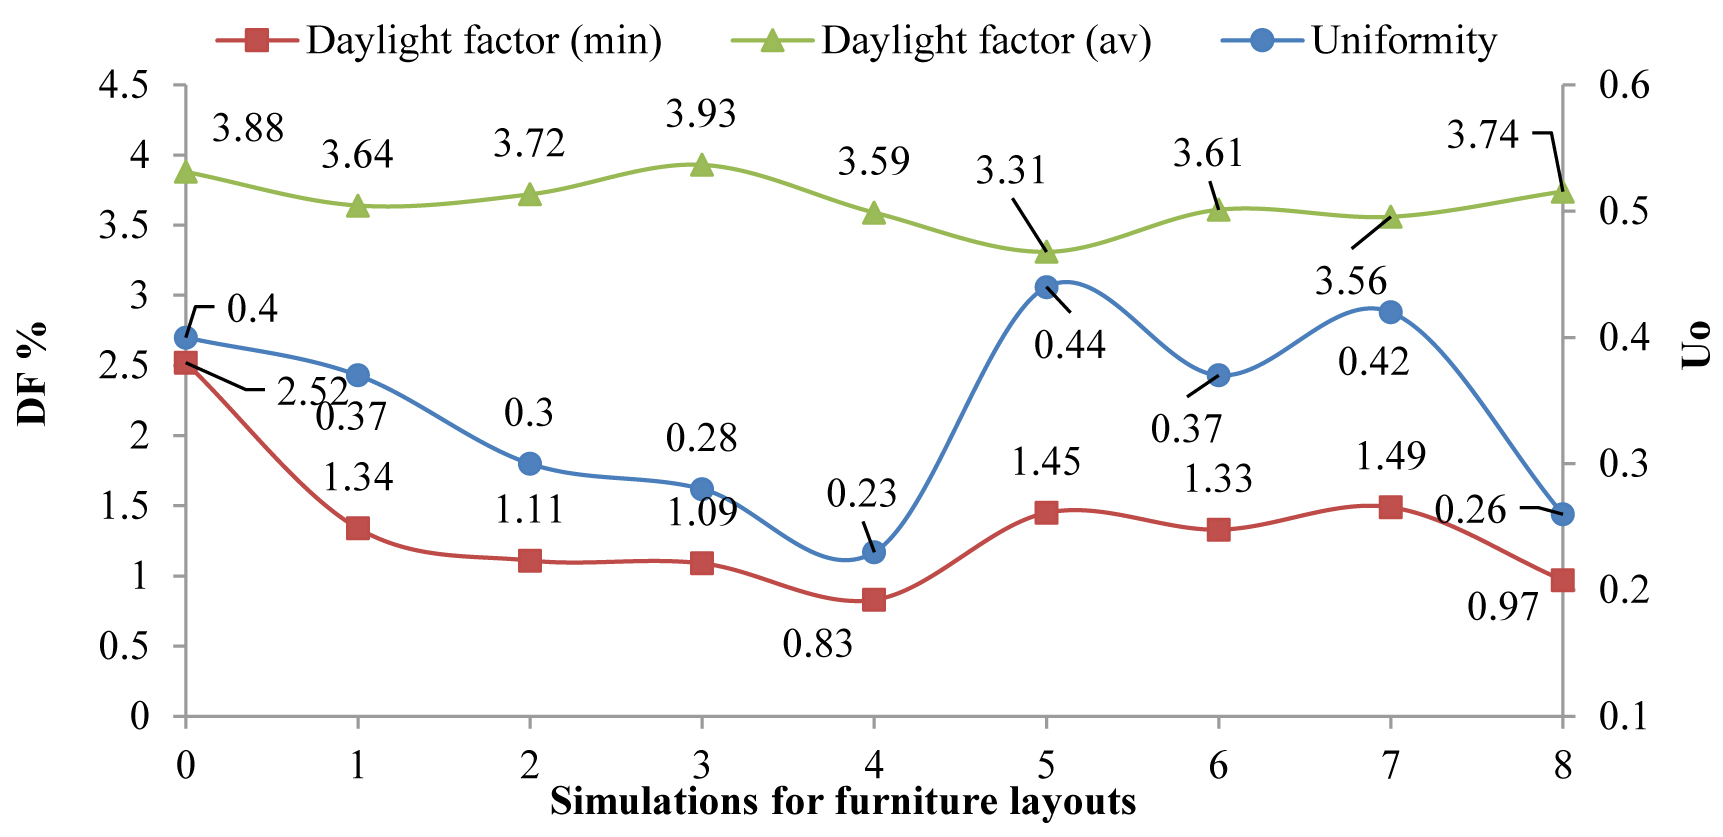
Fig. 15. The results of modelling in the study of visual comfort of space.
Figure 16
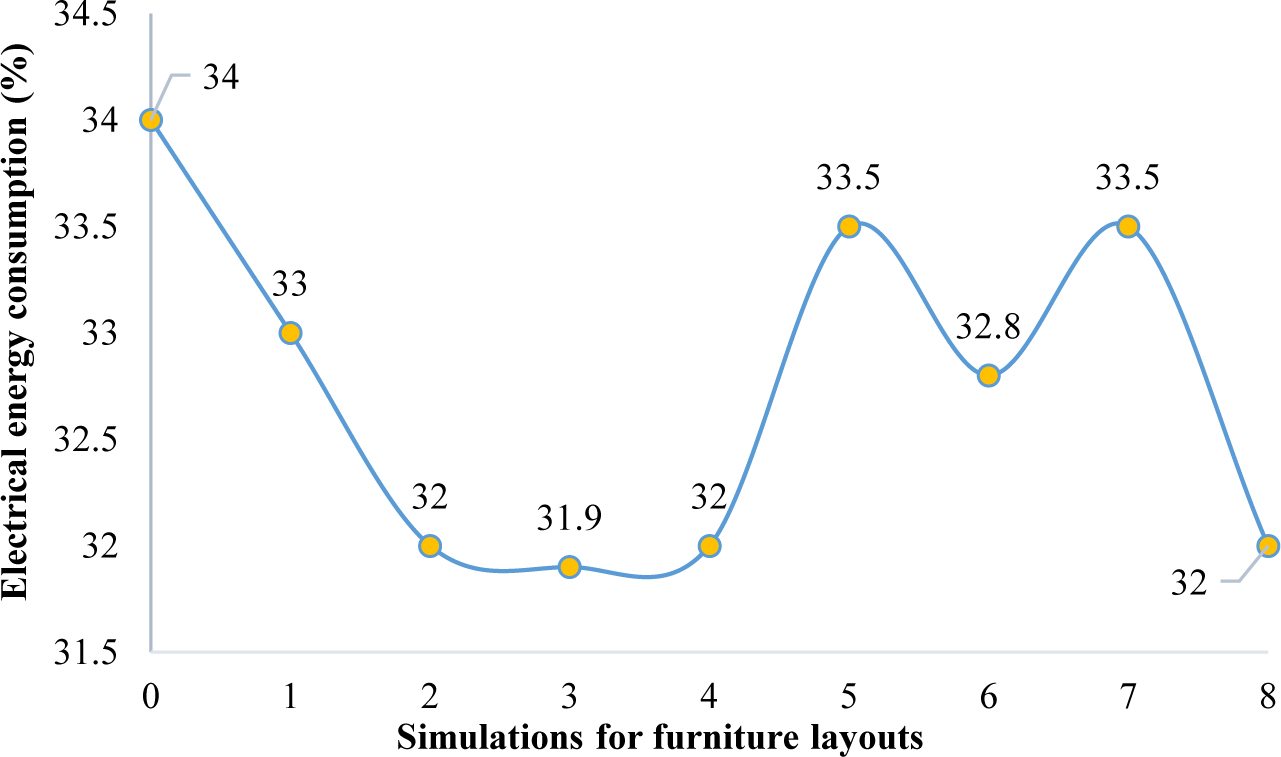
Fig. 16. Percentage of changes in electrical energy consumption of space in different models.
4.5. Reflectivity of surfaces
This section elaborates on the role of reflectivity (reflection coefficient) considering vertical and horizontal surface materials in the desired lighting distribution. Surfaces with moderate reflectivity obtained from field measurements, existing standards, and common materials used in a variety of studies are considered before this section. Therefore, the reflectivity coefficients for the roof, floor, and the walls were considered as 0.5, 0.3 and 0.4, respectively [48]. To explore the role of reflectivity of surfaces, a proposed range is considered according to the standard range for different surfaces so the values whether lower or higher than the proposed range are neglected. The maximum reflectivity coefficient for shiny surfaces is set at 0.6 while the minimum reflectivity coefficient is 0.1 for surfaces such as mosaics and stones on the floor. Thus, this parameter in various models is simulated and studied according to Table 6. Based on scenario 7 obtained from the previous stage, areas closer to western and eastern walls lack appropriate lighting while this phenomenon is high near the windows.
Table 6
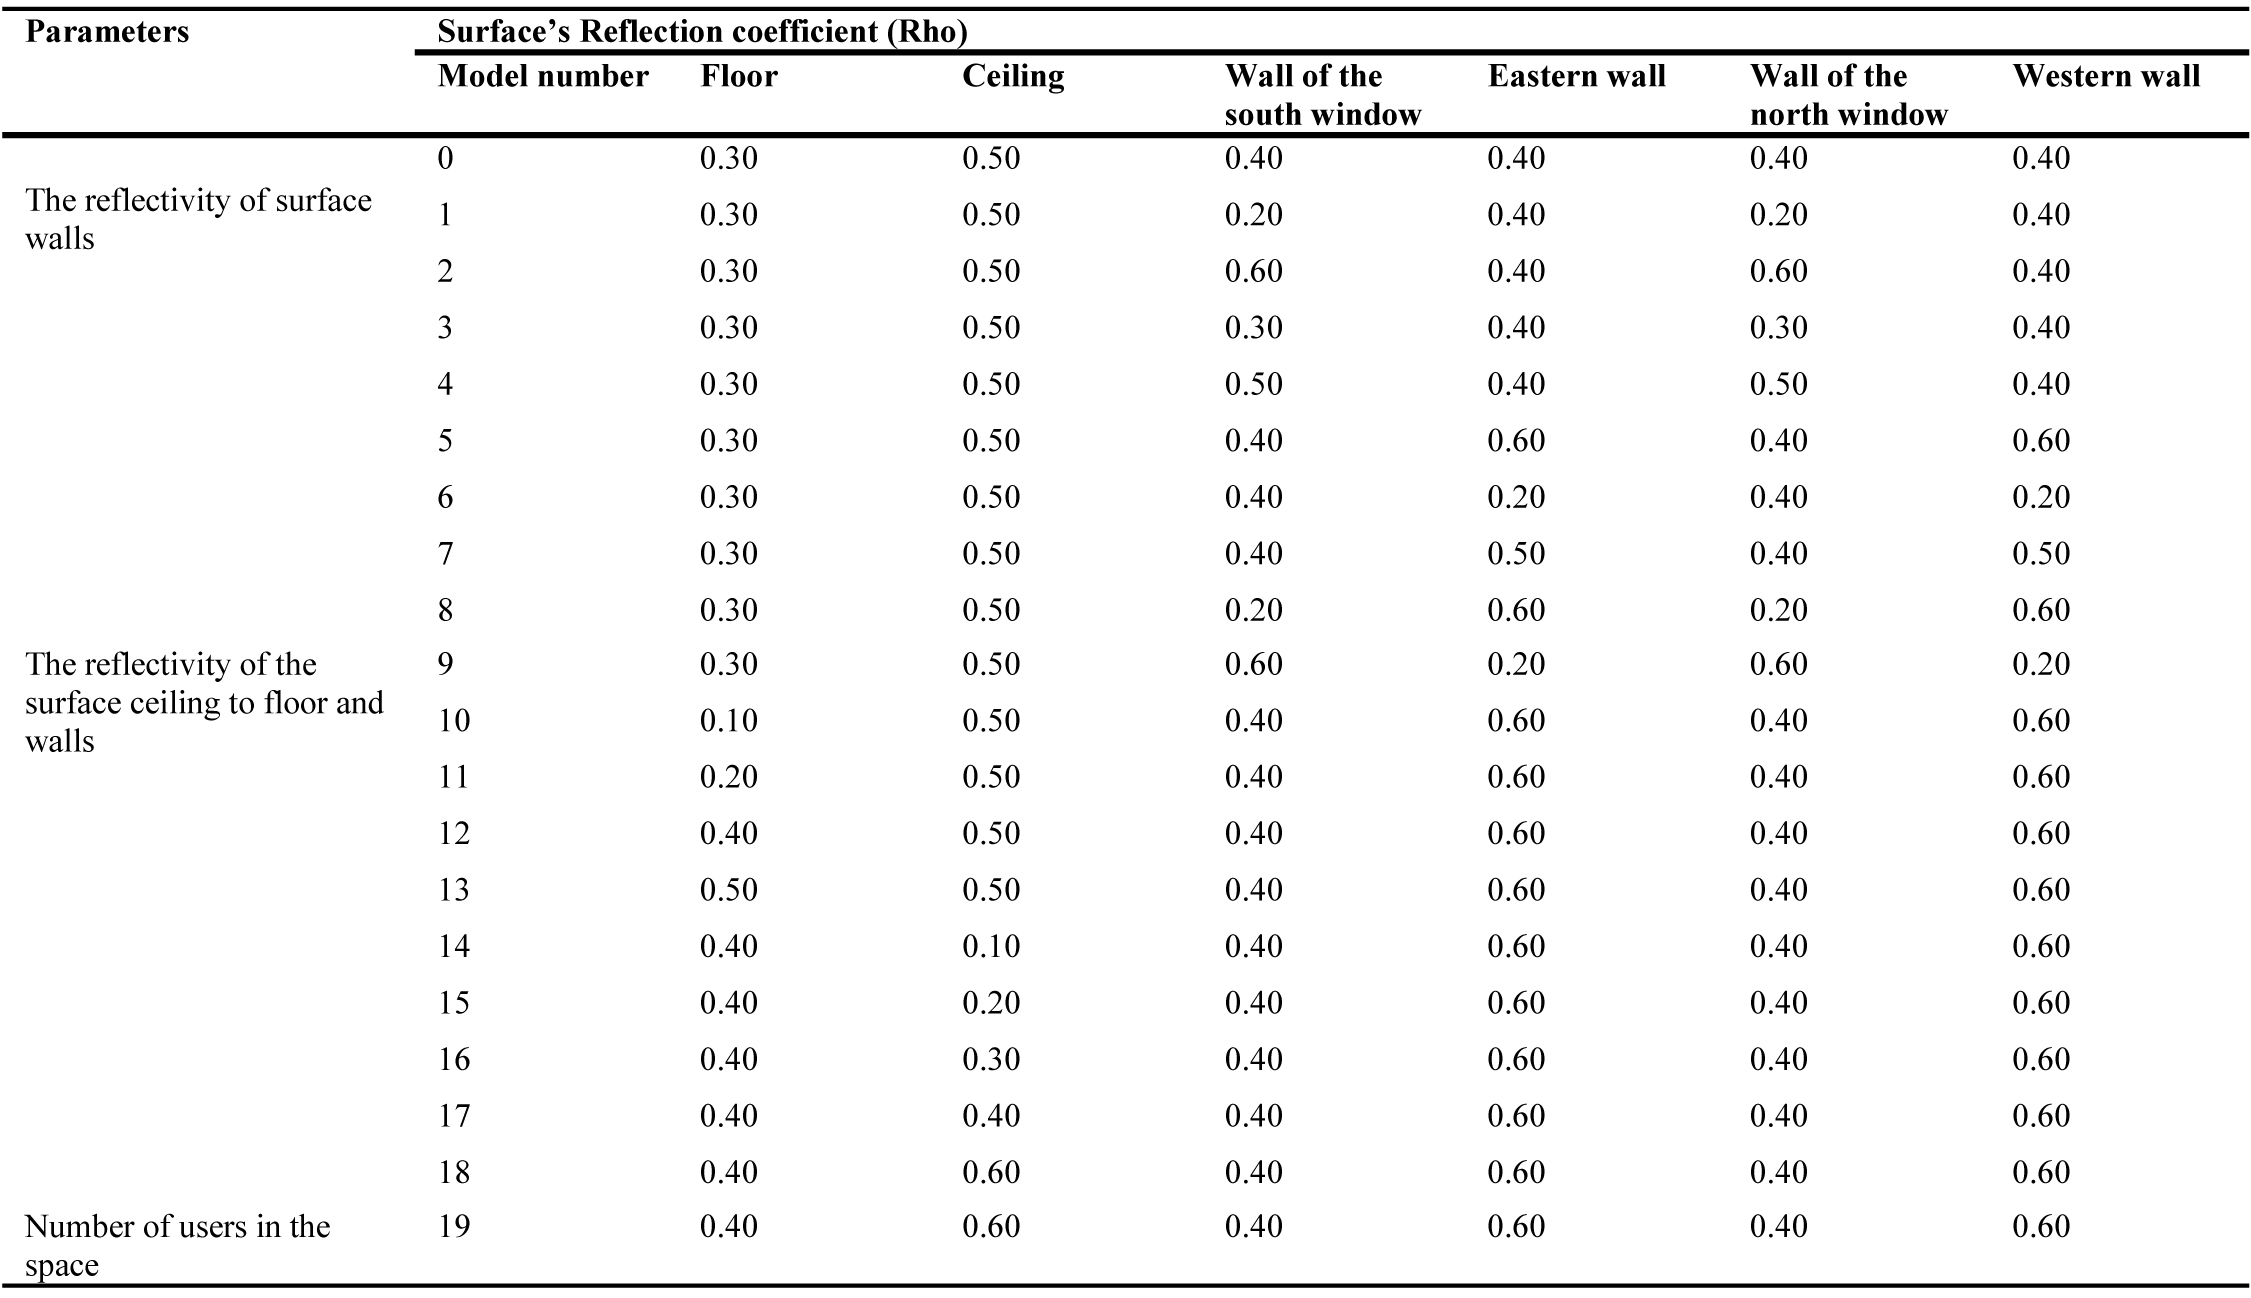
Table 6. Relationship between people activities, circadian action factor, and colour temperature.
Therefore, scenarios 1 to 9 is suggested to investigate the role of reflexivity of walls with or without windows. The results show that the reflectivity of northern and southern walls changed from 0.4 to 0.2 and 0.5 and 0.6, respectively. The obtained results in Figs. 17 and 18 suggest that it is suitable to have a reflection coefficient of 0.4 for walls with windows on facing the northern and southern fronts. Subsequently, to examine the appropriate level of reflectivity for the eastern and western walls, the reflectivity of eastern and western walls changed from 0.4 to 0.2, 0.3,0.5 and 0.6. The reflectivity factor of 0.6 is more desired for such surfaces. Therefore, the examination is conducted with a reflectivity factor of 0.4 and 0.6 for vertical surfaces (walls). The reflexivity of the floor at this stage is changed from 0.3 to 0.1, 0.2, 0.4 and then 0.5 as the maximum reflectivity for the floor as greater values cause visual discomfort. The reflectivity coefficient of 0.4 for the floor is highly effective for lighting in space. In the end, this value is tested for the roof. The reflectivity of roof is changed from 0.5 to 0.1, 0.2, 0.3, 0.4 and 0.6.
Figure 17
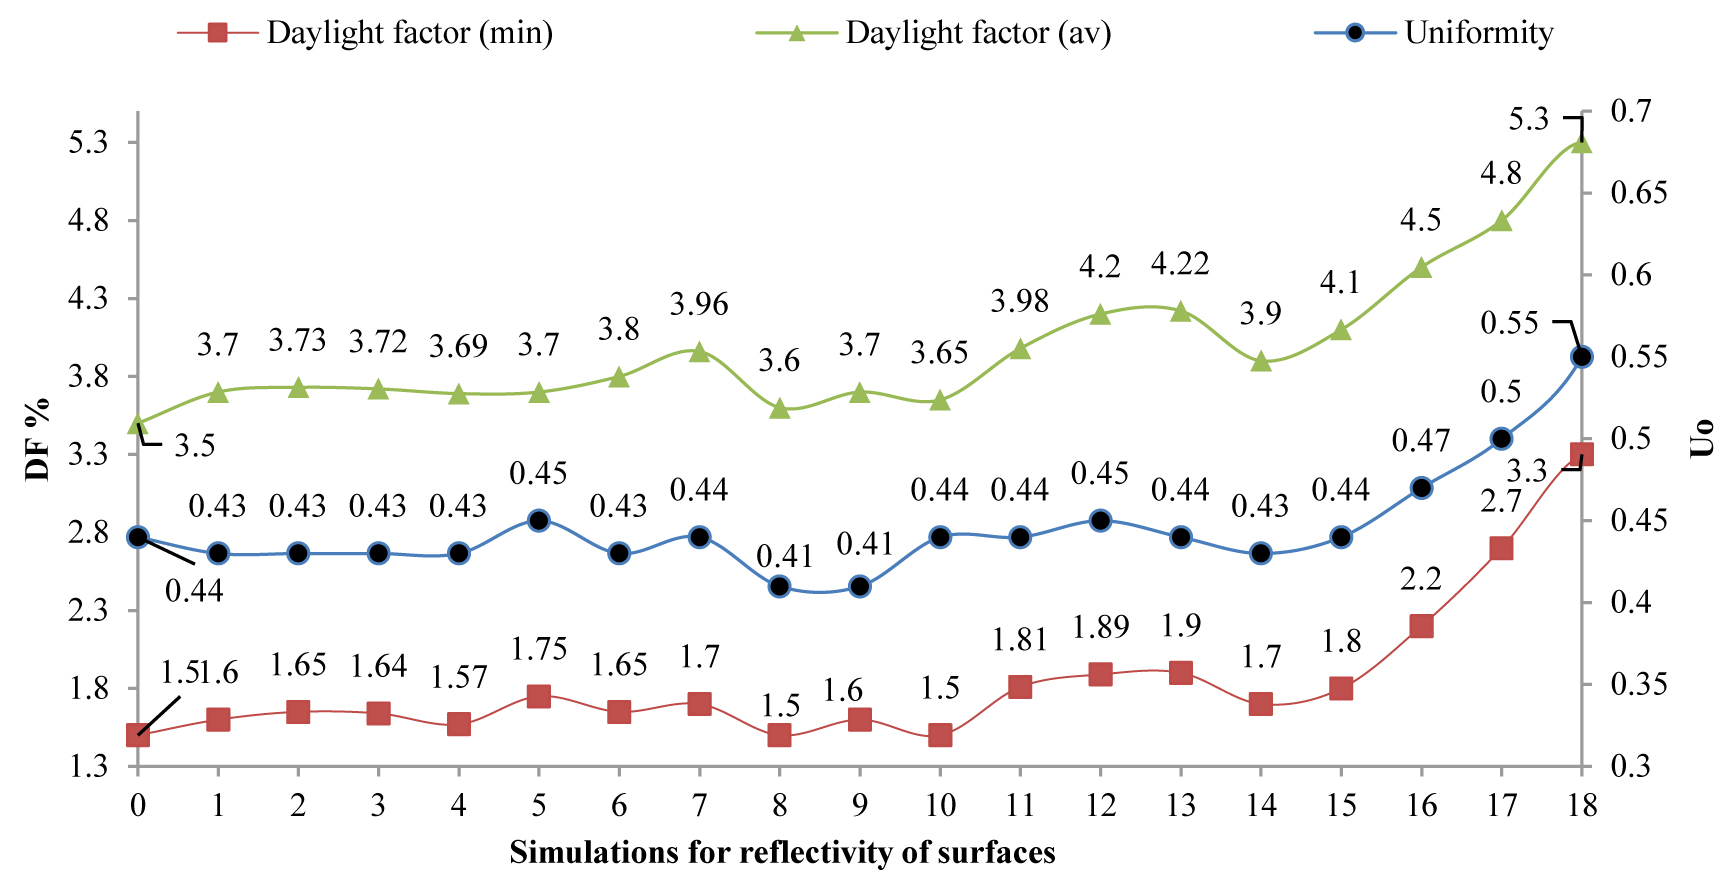
Fig. 17. The results of modeling in the study of visual comfort of space according to Table 6.
Figure 18
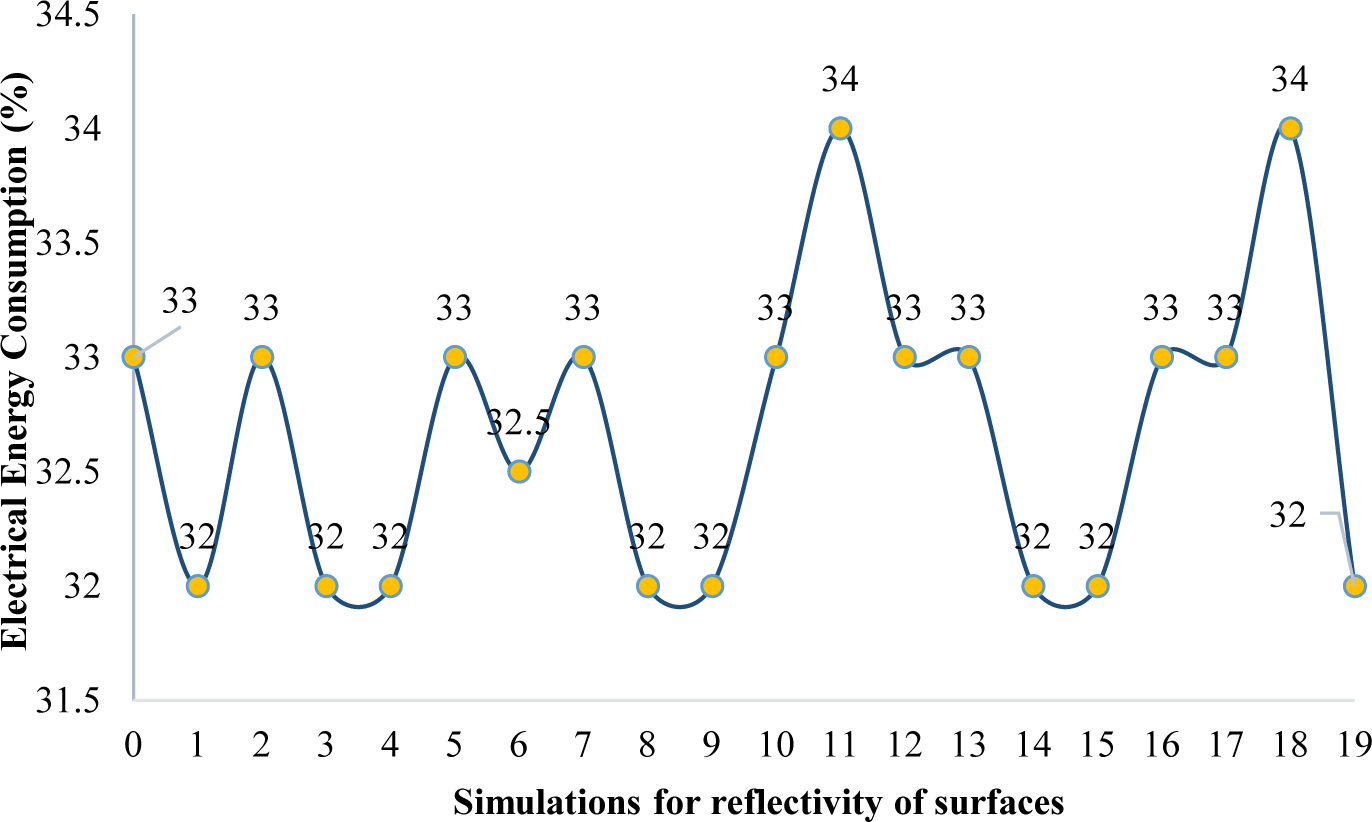
Fig. 18. Percentage of changes in electrical energy consumption of space in different models according to Table 6.
As a result, the investigations show the reflectivity of 0.6 as the optimal value. It should be noted that the inside layout of the space has its reflection coefficient, but due to limitation in computer simulation this option is impossible to alter in all investigations and therefore reflectivity of 0.5 is considered for tables with wooden materials. The reflectivity of side surfaces in space, scenario 18 causes a 34% reduction of artificial light is also selected as the most optimal option. As in every architectural space, the layouts, individuals, and users are not separable, in the final stage of the simulation; the desired option with the presence of people inside the space is examined and simulated. As shown in Fig. 19(a), the distribution of lighting in scenario 18 is within the balanced range in comparison with the standard level in terms of uniformity rate and daylight factor. As the residents enter the space, dependent variables values increase and place at the standard range, as shown in Fig. 19(b). The relevant standard suggests it, the minimum uniformity rate and daylight factor should be 0.6 and 2% respectively, which means for simulation purposes of this value should be between 4 and 5 while its maximum should not exceed 6. Analyzing the results suggest such cases are observed in scenario 19, and it is concluded that this scenario is the optimal model for appropriate lighting distribution. In addition to creating desirable visual comfort in space, scenario nine according to Fig. 18, helps to decrease the electrical energy consumption by 32%. Therefore, based on the lighting standards by implementing this scenario using daylight and creating visual comfort more than one-third of the electrical energy is saved in space.
Figure 19
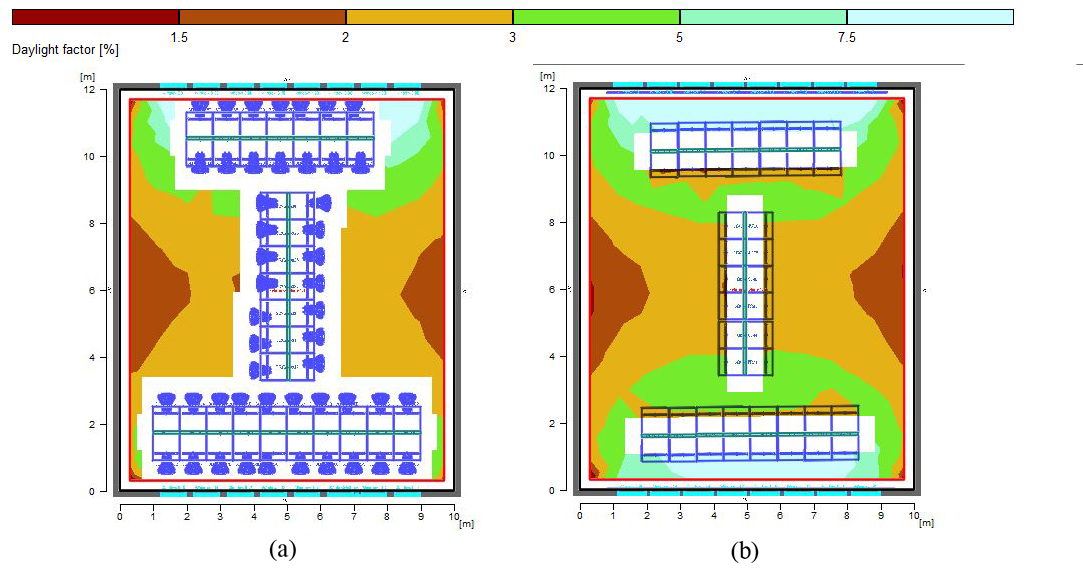
Fig. 19. Distribution of daylight factor in (a) scenario 18 and (b) scenario 19.
The presence of people in the scenario was due to the type of layout and was the only criterion for assessing the presence of people with anthropogenic conditions on the distribution of daylight. There is no dynamic presence or movement of individuals. In fact, the aim was to determine what changes in the rate of light entering the space, despite the human elements with human conditions.
The proposed architectural model is presented in Fig. 20. Figure 21 also shows the impact of various factors of this research on the daylight factor and uniformity rate.
Figure 20
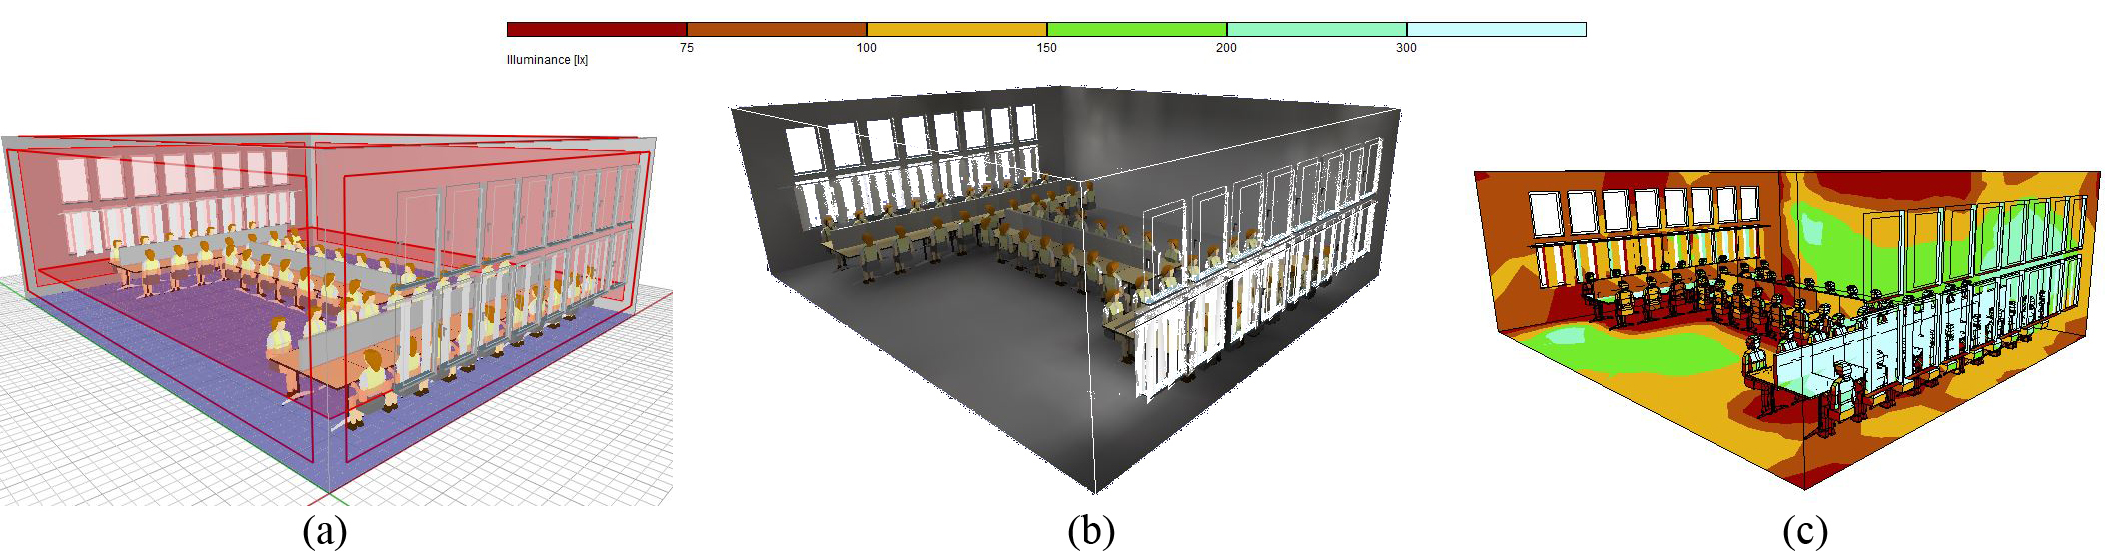
Fig. 20. (a) Three-dimensional display of optimal architecture model, (b) lighting distribution in space, and (c) distribution of daylight factor in the optimal model of study hall for scenario 18.
Figure 21
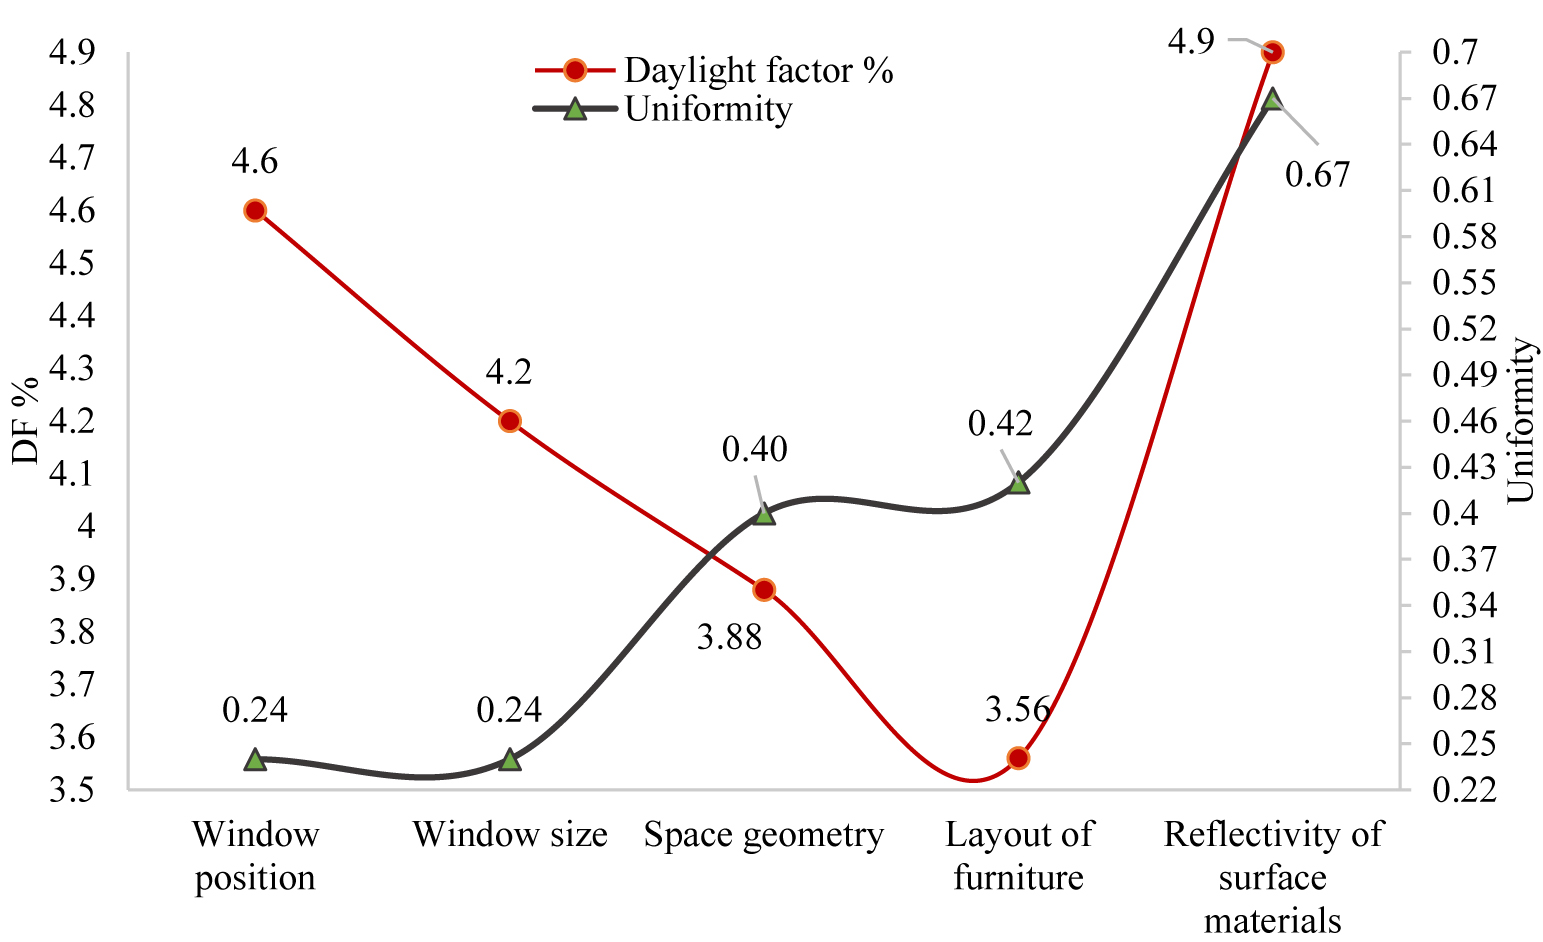
Fig. 21. The impact of different variables on daylight factor and uniformity rate.
5. Conclusions
This study examines the factors affecting in providing the optimal model for study space to reduce the electrical energy consumption while achieving the visual comfort of the space users using computer simulations in Relux. The analysis results suggest that position and dimensions of the windows, space proportions, vertical and horizontal placement of the surfaces (the type of furniture layout) in space and reflectivity of the inner surface materials had the most significant impact on the lighting distribution in space, respectively. The use of windows with a maximum height to width ratio of 35 to 45% with the preferable ratio of 40% can decrease the electrical energy consumption by 32% with horizontal and vertical divisions. It also improves the visual comfort situation by 7.5%. The optimal length to width and height ratios are 6.5 and 5.2 respectively, to create visual comfort in space as well as reducing the electrical energy consumption by 34% reduction
This influential factor plays an essential role in achieving optimal lighting conditions by 24%. In terms of inner surfaces layout, using horizontal and vertical surfaces with two front windows along the length of the building provides a better uniformity rate in lighting. Therefore, it distributes the light around and in the middle of the room. This factor causes a 33% reduction in electrical energy consumption as well as improving the visual comfort conditions by up 27%. Furthermore, the suitable range for reflection coefficient for the roof, floor, walls with windows, and walls of two other fronts are 0.6, 0.4, 0.4, and 0.6, respectively. By using these coefficients, the difference obtained from validation of this architectural model shown with uniformity rate, minimum and mean daylight of 0.61, 2.1, and 4.1% respectively which decrease the use of artificial lighting by 32%. The proper conditions to achieve visual comfort and uniform distribution of daylight in space are created. The obtained results based on 30° to 40° north latitude that requires more daylight in the internal spaces, there is the possibility of change in results due to the changes in radiation direction and angle of the sun.
Besides, various factors including orientation, geometry, space, glass type, the ratio of glass dimensions to the windows frame, the effect of shading devices and cracks in the roof, the effect of roof types such as gable and dome roofs, etc can affect the uniformity and distribution of lighting in visual comfort achievement. The factors as mentioned earlier, can be used as future research themes to be investigated to provide a better level of visual comfort and optimal energy consumption.
Contributions
The authors have contributed equally.
Declaration of competing interest
The authors declare that there is no conflict of interest.
References
- D. H. W. Li and E. K.W. Tsang, An analysis of daylighting performance for office buildings in Hong Kong, Building and environment 43 (2008) 1446-1458. https://doi.org/10.1016/j.buildenv.2007.07.002
- C. Reinhart, and S. Selkowitz, Daylighting-light, form and people, Energy and Buildings 38 (2006) 715-717. https://doi.org/10.1016/j.enbuild.2006.03.005
- L. Roche, E. Dewey, and P. Littlefair, Occupant reactions to daylight in offices, International Journal of Lighting Research and Technology32 (2000) 119-126. https://doi.org/10.1177/096032710003200303
- A. D. Galasiu and J.A. Veitch, Occupant preferences and satisfaction with the luminous environment and control systems in daylit offices: a literature review, Energy and Buildings 38 (2006) 728-742. https://doi.org/10.1016/j.enbuild.2006.03.001
- H.-D. Cheung and T.M. Chung, A study on subjective preference to daylit residential indoor environment using conjoint analysis, Building and Environment 43 (2008) 2101-2111. https://doi.org/10.1016/j.buildenv.2007.12.011
- D.H.W. Li, A review of daylight illuminance determinations and energy implications, Applied Energy 87 (2010) 2109-2118. https://doi.org/10.1016/j.apenergy.2010.03.004
- A. R. Othman and M. A. M. Mazli, Influences of Daylighting towards Readers’ Satisfaction at Raja Tun Uda Public Library, Shah Alam. Procedia-Social and Behavioral Sciences 68 (2012) 244-257. https://doi.org/10.1016/j.sbspro.2012.12.224
- J. Heerwagen and B. Hase, Building biophilia: Connecting people to nature in building design. Environmental Design and Construction 3 (2001) 30-36.
- M.T. Araji, Balancing human visual comfort and psychological wellbeing in private offices, 2008, University of Illinois at Urbana-Champaign.
- M.D. Egan and V.W. Olgyay, Architectural lighting, 2002, McGraw-Hill.
- C.L. Robbins, Daylighting, Design and analysis, 1985.
- A, Iversen, N. Roy, M. Hvass, M. Jørgensen, J. Christoffersen, W. Osterhaus, K. Johnsen, Daylight calculations in practice: An investigation of the ability of nine daylight simulation programs to calculate the daylight factor in five typical rooms, 2013, SBI forlag.
- K. Shailesh and T.S. Raikar, Application of RELUX software in simulation and analysis of energy efficient lighting scheme, International Journal of Computer Applications 9 (2010) 24-35. https://doi.org/10.5120/1397-1886
- M. S. Alrubaih, M. F. M. Zain, M. A. Alghoul, N. L. N. Ibrahim, M. A. Shameri, and O. Elayeb, Research and development on aspects of daylighting fundamentals, Renewable and Sustainable Energy Reviews 21 (2013) 494-505. https://doi.org/10.1016/j.rser.2012.12.057
- X. Yu, Y. Su, and X. Chen, Application of RELUX simulation to investigate energy saving potential from daylighting in a new educational building in UK, Energy and Buildings 74 (2014) 191-202. https://doi.org/10.1016/j.enbuild.2014.01.024
- S.Y. Koo, M.S. Yeo, and K.W. Kim, Automated blind control to maximize the benefits of daylight in buildings, Building and Environment 45 (2010) 1508-1520. https://doi.org/10.1016/j.buildenv.2009.12.014
- S. S. orsavi, Z.S. Zomorodian, and M. Tahsildoost, Visual comfort assessment of daylit and sunlit areas: A longitudinal field survey in classrooms in Kashan, Iran, Energy and Buildings 128 (2016) 305-318. https://doi.org/10.1016/j.enbuild.2016.06.091
- Z. S. Zomorodian, and M. Tahsildoost, Assessment of window performance in classrooms by long term spatial comfort metrics, Energy and Buildings 134 (2017) 80-93. https://doi.org/10.1016/j.enbuild.2016.10.018
- R. W. da Fonseca, E.L. Didoné, and F.O.R. Pereira, Using artificial neural networks to predict the impact of daylighting on building final electric energy requirements, Energy and Buildings 61(2013) 31-38. https://doi.org/10.1016/j.enbuild.2013.02.009
- L.C. Tagliabue, M. Buzzetti, and B. Arosio, Energy saving through the sun: Analysis of visual comfort and energy consumption in office space, Energy Procedia 30 (2012) 693-703. https://doi.org/10.1016/j.egypro.2012.11.079
- C. Reinhart, et al., Umi-an urban simulation environment for building energy use, daylighting and walkability, in: 13th Conference of International Building Performance Simulation Association, 2013, Chambery, France.
- T. Dogan, C. Reinhart, and P. Michalatos, Urban daylight simulation calculating the daylit area of urban designs, in: Proceedings of SimBuild, 2012, pp. 613-620.
- D. H. W. Li, G. H. W. Cheung, K. L. Cheung, and T. N. T. Lam, Determination of vertical daylight illuminance under non-overcast sky conditions. Building and environment 45 (2010) 498-508. https://doi.org/10.1016/j.buildenv.2009.07.008
- J. Yao, An investigation into the impact of movable solar shades on energy, indoor thermal and visual comfort improvements, Building and Environment 71 (2014) 24-32. https://doi.org/10.1016/j.buildenv.2013.09.011
- J. Yao, D. Chow, and Y.-W. Chi, Impact of manually controlled solar shades on indoor visual comfort, Sustainability 8 (2016) 727. https://doi.org/10.3390/su8080727
- S.-H. Kim, I.-T. Kim, A.-S. Choi, and M. Sung, Evaluation of optimized PV power generation and electrical lighting energy savings from the PV blind-integrated daylight responsive dimming system using LED lighting, Solar Energy, 107 (2014) 746-757. https://doi.org/10.1016/j.solener.2014.06.022
- R. Mistrick, C. Casey, L. Chen, and S. Subramaniam, Computer modeling of daylight-integrated photocontrol of electric lighting systems, Buildings 5 (2015) 449-466. https://doi.org/10.3390/buildings5020449
- L. T. Doulos, A. Tsangrassoulis, P. A. Kontaxis, A. Kontadakis, and F. V. Topalis, Harvesting daylight with LED or T5 fluorescent lamps? The role of dimming, Energy and Buildings 140 (2017) 336-347. https://doi.org/10.1016/j.enbuild.2017.02.013
- B. Obradovic, B. Szybinska Matusiak, Daylight Transport Systems for Buildings at High Latitudes, Journal of Daylighting 6 (2019) 60-79. http://dx.doi.org/10.15627/jd.2019.8
- D. Liu, Y. Sun, R. Wilson, and Y. Wu, Comprehensive evaluation of window-integrated semi-transparent PV for building daylight performance, Renewable Energy 145 (2020) 1399-1411. https://doi.org/10.1016/j.renene.2019.04.167
- A. Kirimtat, B. K. Koyunbaba, I. Chatzikonstantinou, and S. Sariyildiz, Review of simulation modeling for shading devices in buildings, Renewable and Sustainable Energy Reviews 53 (2016) 23-49. https://doi.org/10.1016/j.rser.2015.08.020
- L. Jin and N.R. Ziebarth, Sleep, health, and human capital: Evidence from daylight saving time, Journal of Economic Behavior & Organization 170 (2020) 174-192. https://doi.org/10.1016/j.jebo.2019.12.003
- D. Durmus, D. Abdalla, A. Duis, and W. Davis, Spectral optimization to minimize light absorbed by artwork, Leukos 16 (2020) 45-54. https://doi.org/10.1080/15502724.2018.1533852
- M. Wei, W. Bao, and H.-P. Huang, Consideration of light level in specifying light source color rendition, Leukos 16 (2020) 55-65. https://doi.org/10.1080/15502724.2018.1448992
- K. H. Cheong, Y. H. Teo, J. M. Koh, U. R. Acharya, and S. C. Man Yu, A simulation-aided approach in improving thermal-visual comfort and power efficiency in buildings, Journal of Building Engineering 27 (2020) 100936. https://doi.org/10.1016/j.jobe.2019.100936
- G. Rossi, P. Iacomussi, and M. Zinzi, Lighting Implications of Urban Mitigation Strategies through Cool Pavements: Energy Savings and Visual Comfort, Climate 6 (2018) 26. https://doi.org/10.3390/cli6020026
- A. Ikuzwe, X. Ye, and X. Xia, Energy-maintenance optimization for retrofitted lighting system incorporating luminous flux degradation to enhance visual comfort, Applied Energy 261 (2020) 114379. https://doi.org/10.1016/j.apenergy.2019.114379
- L. Doulos, A. Tsangrassoulis, and F. Topalis. Reviewing the role of photosensors in lighting control systems, in: Proceedings of the 6th WSEAS international conference on application of electric engineering, 2007, Istanbul, Turkey.
- E. Ghisi and J.A. Tinker, An ideal window area concept for energy efficient integration of daylight and artificial light in buildings, Building and environment 40 (2005) 51-61. https://doi.org/10.1016/j.buildenv.2004.04.004
- L. Doulos, A. Tsangrassoulis, and F. Topalis, Multi-criteria decision analysis to select the optimum position and proper field of view of a photosensor, Energy conversion and management 86 (2014) 1069-1077. https://doi.org/10.1016/j.enconman.2014.06.032
- M.-C. Dubois, Impact of Solar Shading Devices on Daylight Quality: Measurements in Experimental Office Rooms, 2001, available at: http://lup.lub.lu.se/record/526057.
- S. Simm and D. Coley, The relationship between wall reflectance and daylight factor in real rooms, Architectural Science Review 54 (2011) 329-334.https://doi.org/10.1080/00038628.2011.613642
- L. Fernandes, E. Lee, and G. Ward, Lighting energy savings potential of split-pane electrochromic windows controlled for daylighting with visual comfort, Energy and Buildings 61 (2013) 8-20. https://doi.org/10.1016/j.enbuild.2012.10.057
- D. H. W. Li, S. L. Wong, C. L. Tsang, and G. H. W. Cheung, A study of the daylighting performance and energy use in heavily obstructed residential buildings via computer simulation techniques, Energy and buildings 38 (2006) 1343-1348. https://doi.org/10.1016/j.enbuild.2006.04.001
- C. L. Cheng, C. L. Chen, C. P. Chou, and C. Y. Chan, A mini-scale modeling approach to natural daylight utilization in building design, Building and Environment 42 (2007) 372-384. https://doi.org/10.1016/j.buildenv.2005.08.004
- G. Steffy, Architectural lighting design, 2002, John Wiley & Sons.
- R. Leslie, Capturing the daylight dividend in buildings: why and how?, Building and environment 38 (2003) 381-385. https://doi.org/10.1016/s0360-1323(02)00118-x
- E. CSN, 12464-1, Light and Lighting—Lighting of Work Places—Part 1: Indoor Work Places. Central Bureau of the CIE: Vienna, Austria, 2011. https://doi.org/10.3403/02729981u
- Standard CEN/TR 15193-2, Energy performance of buildings - Energy requirements for lighting - Part 2: explanation and justification of EN 15193-1, Module M9, March, 2017. https://doi.org/10.3403/30292861u
- M. Fontoynont, CEN/TC 169–Daylight in Building, TC169 WI 00169068, Draft proposal of CEN Standard for public enquiry, WG11, 2016.
- F. Kateb, Window in Iran Islamic Architecture with Emphasis on Role of Light, Journal of History Culture and Art Research 7 (2018) 215-222. https://doi.org/10.7596/taksad.v7i1.1454
Copyright © 2020 The Author(s). Published by solarlits.com.

4011
Total views
Citations
SHARE ON


