Volume 8 Issue 2 pp. 222-238 • doi: 10.15627/jd.2021.18
Optimum Characteristics of Windows in an Office Building in Isfahan for Save Energy and Preserve Visual Comfort
Abbas Maleki,a,b Narges Dehghan*,a,b
Author affiliations
a Department of Architecture, Najafabad Branch, Islamic Azad University, Najafabad, Iran
b Advancement in Architecture and Urban Planning Research Center, Najafabad Branch, Islamic Azad University, Najafabad, Iran
*Corresponding author.
abbas.maleki74@gmail.com (A. Maleki)
dehghan@par.iaun.ac.ir (N. Dehghan)
History: Received 30 March 2021 | Revised 24 May 2021 | Accepted 6 June 2021 | Published online 29 July 2021
Copyright: © 2021 The Author(s). Published by solarlits.com. This is an open access article under the CC BY license (http://creativecommons.org/licenses/by/4.0/).
Citation: Abbas Maleki, Narges Dehghan, Optimum Characteristics of Windows in an Office Building in Isfahan for Save Energy and Preserve Visual Comfort, Journal of Daylighting 8 (2021) 222-238. https://dx.doi.org/10.15627/jd.2021.18
Figures and tables
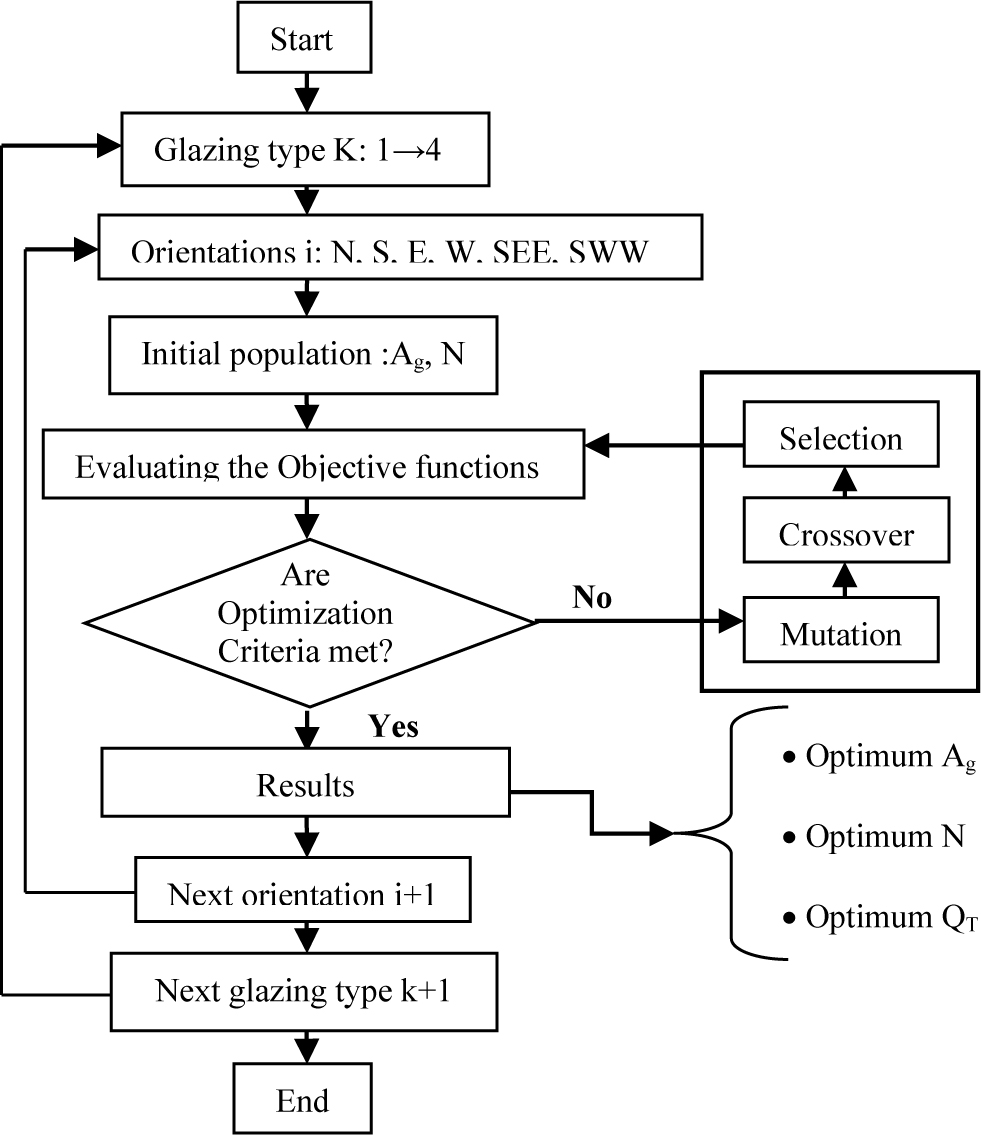 Figure 5
Abstract
Nowadays, the use of renewable energies has increased due to the energy crisis and subsequent environmental issues. The window design significantly affects energy consumption and natural light absorption regarding preventing visual discomfort and improving indoor quality with effective external features. Hence, it should be carefully selected from the early stages of design. Thus, the present study investigated the optimal design of windows considering four components of the window-to-wall ratio (WWR), window shape, and positioning on each façade by separately considering the sill height of the window for a general office. The objective was to provide visual comfort and save energy. Applying constraints to the data set can yield an optimization method concerning the variables and their relationship as well as optimal solutions based on the stated goals. Therefore, the desired groups can be accepted as optimal solutions for improving the efficiency of the building. According to the results, the WWR of 30% with the square and horizontal shapes in the upper and central positions were optimal solutions for each window orientation, which had better performance in the north-facing WWR of 40%. Furthermore, several best design solutions were presented in each orientation in terms of energy consumption, daylighting, and visual comfort in the indoor environment. This method also allows the designer to visualize all the data while finding the clients’ desired option by improving the energy efficiency between the variables and choosing the appropriate solution.
Keywords
Window-to-wall ratio, Window position and orientation, Visual comfort, Office building
Nomenclature
| ADF | Average daylight factor (%) |
| ASE | Annual sunlight exposure (%) |
| BIM | Building information modelling |
| CBDM | Climate-based daylighting metrics |
| CFD | Computational fluid dynamics |
| CIE | Commission internationale de l'Eclairage |
| DA | Daylight autonomy (%) |
| DF | Daylight factor (%) |
| DGI | Daylight glare index (%) |
| DGP | Daylight glare probability (%) |
| DS | Daylight safety (%) |
| EV | Eye illuminance |
| IEQ | Indoor environmental quality |
| LEED | Leadership in energy and environmental design |
| NSGA-II | Non-dominated-and-crowding sorting genetic algorithm II |
| PPD | Predicted percentage of dissatisfied |
| sDA | Spatial daylight autonomy (%) |
| sDS | Spatial daylight safety (%) |
| UDI | Useful daylight illuminance (%) |
| UO | Uniformity ratio |
| USGBC | U.S. green building council |
| WFR | Window-to-floor ratio |
| Wp | Working plane |
| WWR | Window-to-wall ratio |
1. Introduction
Windows have a direct impact on energy consumption for space heating and cooling particularly natural energies [1]. Moreover, they play an important role in visual comfort. Solar systems are considered the most efficient way for reducing energy and fossil fuel consumption. The remarkable impact on the amount of energy loss from buildings can be observed along with the reduction of environmental pollutions and the greenhouse effect by considering sustainable architectural principles such as designing windows [2]. Selecting the features is a part of the initial design decisions, which must be performed carefully to take into account all aspects at all seasons [3]. Office buildings have high energy consumption [4]. In Iran, most office buildings are governmental where energy consumption is not an important issue [5]. By properly designing the windows of such buildings, the required energy for indoor lighting will be reduced through getting the proper daylight. However, they account for nearly 20% of the total energy consumption [6]. Although the thermal load in the winter decreases by a proper window design, the window controls the thermal load caused by solar radiation, which results in energy storage [7]. The window as an exterior element of the building can also control the energy in electric lighting, cooling, and heating while maintaining visual comfort through the amount of the transmitted sunlight as a green and infinite source. However, solar radiation control systems are needed to determine the amount of heat and daylight in the interior [8].
Currently, energy saving is one of the most important variables in office building design. Thus, the proper use of daylight is essential to reduce the energy consumption from electric lighting while providing maximum visual comfort to occupants [9]. Even the use of colored glass reduces receiving daylight and the potential for electric lighting [10]. When the solar beam reaches the glass surface, it is reflected and absorbed depending on the type of glass and its visual characteristics. The visible and invisible solar beam radiation represents a wide range of wavelengths and varies for different wavelengths [11]. The invisible spectrum comprises more than 50% of solar energy [12] and is highly effective in controlling energy consumption.
The office buildings with different operations, arrangements, and spatial structures have a great effect on making a sense in place and connecting people to enhance work efficiency. In the meantime, with the development of new technologies, the air conditioning and lighting systems have been optimized in the workplace, while highlighting the window components in this area. Considering the importance of daylight in these buildings and its effect on the workplace environment quality, the window study was identified as an efficient component in the buildings to create visual comfort conditions by measuring criteria such as daylight factor (DF), the uniformity ratio, the range of working plane (Wp) illuminance, annual daylighting, spatial daylight autonomy (sDA), useful daylight illuminance (UDI), and annual sunlight exposure (ASE). On the other hand, increasing the demand for energy as cooling, heating, and lighting, along with environmental pollutions from fossil fuel consumption has increased the importance of the subject under discussion, which is further reviewed in response to the needs of buildings based on the stated objectives.
1.1. Energy saving in terms of visual comfort
A study was performed [13], to assess the effect of the window-to-floor ratio (WFR), the shape of the window and the room, and the type of lighting in an academic class at the University of L’Aquila, Italy on energy consumption and DF and daylight autonomy (DA) criteria using DIVA in Rhinoceros. Based on their results, no difference was observed between the two class geometries due to DA by keeping a constant orientation and WFR. The results further showed that the geometry of the classroom and the window saves energy consumption up to 48.5%. Furthermore, Daysim was used [14] to evaluate the influence of window-to-wall ratio (WWR), the shape and position of the window, and the reflection surface of the wall concerning DA and lighting energy consumption. Similar amounts of DA were obtained for all shapes of the window, and energy consumption was not based on the shape of the window. In another study, the WWR was designed [15] along with the reflectance amount from the ceiling, wall, and floor at three different room depths to store electrical energy. In the studied climates, regardless of the other components in the north orientation, the large windows performed better despite the different room depth in each climate and the effective intelligent control of different lighting. Furthermore, energy consumption and visual comfort were evaluated [16] regarding the type of glazing in the climate of Dhahran, Saudi Arabia using DesignBuilder software. Their results represented that using low-Emissivity double glazed windows with automated venetian blinds can reduce the total energy consumption and improve visual comfort. In several climates of the United States and Canada, design components were analyzed [17] concerning energy consumption, UDI metric, and the predicted percentage of dissatisfied (PPD) by increasing the WWR of electrochromic windows using TRNSYS software. Their results demonstrated that these windows are more economical and have a greater impact on UDI compared to thermal comfort conditions (PPD) in warmer climates. Furthermore, the WWR was optimized [18], along with the reflection and orientation of the window by using Radiance and Daysim software according to different criteria of daylight and solar energy. The optimum case was 30% WWR with a reflectance of 0.8 from the wall on the south face of the tropics (Af). Moreover, static daylight benchmarks and the building rating system were evaluated [19] considering WFR in addition to room and window geometry using DesignBuilder software. The upper and lower limits of the proposed WFR were 15 and 24%, respectively, and the horizontal shape of the window had a greater impact on the average DF. Similarly, a photovoltaic glazing surface was designed [20] and WWR was increased to investigate the energy and daylight performance of several cities in China using EnergyPlus and Radiance software. Based on their findings, increasing the WWR by more than 45% in the south orientation resulted in the minimum energy consumption. Moreover, daylight availability and glaring could be controlled using semi-transparent photovoltaic glazing. In a study, DIVA and field measurements were applied [21] to study the central courtyard houses in the UAE, which now have museum usage. It was found that by changing the WWR to assess the impact of daylight and the dangers of artifacts, increasing the depth of the room contributes to daylighting safety (DS), and reducing the WWR represents the best option for spatial daylight safety (sDS) and sDA.
1.2. Influence of the type and geometry of openings on energy consumption
In a study [22], the relationship between an increase in WWR and the orientation on energy consumption was examined using EnergyPlus software. It was found that increasing the WWR increases the cooling load while decreasing the heating load in the Tripoli climate. In another study, ideal values of the WWR were obtained [23] as 0.30<WWR<0.45 for different European climates. Additionally, the overall energy consumption of office buildings was analyzed [24] by changing the type of glazing and increasing the WWR in Biskra, Algeria. The direct relationship between the increase in the WWR and total energy consumption and the greater impact of double and triple glazing on energy consumption were the results of this study performed using OpenStudio and EnergyPlus software. Furthermore, the impact of WWR was studied [25], along with the position and orientation of the window for the building information modeling (BIM) using Revit and Green Building Studio. It was found that 20% WWR has the highest impact on cooling and heating loads, and the positioning of east windows has a significant effect on the total energy load in Vancouver, British Columbia. To design the early stages of the building envelope design, EnergyPlus and the NSGA-II algorithm were used [26]. They analyzed the energy performance by varying the number, position, shape, and type of windows and the thickness of masonry walls in office buildings. Pareto front solutions on the east, west, and north directions showed low WWR values, which increased on the southern one.
1.3. Evaluation of visual comfort according to daylight criteria
Visual comfort assessments are significant along with the extent of daylight availability by the occupants of the building, and the individuals’ responses to these criteria [27]. Remarkable studies examined the validity of the two criteria, namely, sDA and ASE, by employing subjective assessment methods in this particular regard. For example, the quality of the occupants’ contentment with daylight was evaluated [28] to validate the annual daylight performance criteria. Furthermore, this particular field study is affiliated with daylight simulation. A high correlation is conferred between the elements by investigating the correlation between the subjective responses of occupants within space and the simulation results the annual horizontal illumination. Additionally, ASE is deemed a reliability criterion with 10% direct exposure protection against radiation.
Accessible daylight assessment criteria were surveyed and compared [29] including DF, DA, and UDI within a classroom at the University of Cambridge based on the subjective assessments of occupants. The results of this study revealed that the DA criterion (with a difference of 7% less than the students’ assessment) is more credible than other accessible daylight criteria in daylight areas compared to the occupants’ subjective assessments. Furthermore, the occupants’ subjective assessment of space was examined [27] accommodating an adequate number of accessible daylight assessment criteria versus simulations. An assertive correlation was recognized between the simulation and subjective assessment of particular space occupants utilizing a questionnaire and simulation of daylight subject to a 50% DA criterion in 13 individual zones within schools including classrooms, laboratories, studios, and a complete floor in diverse climates, as well as areas with adequate daylight were marked accordingly.
Likewise, the impact of dynamic daylight criteria was evaluated [30] on the prediction of their capability using a questionnaire and DIVA for Rhinoceros. Their results showed a high correlation between student feeling and dynamic daylight for Texas classrooms. They further demonstrated that sDA and ASE were good criteria for the initial design and achieving a complete vision. Furthermore, it was found that the vertical eye illuminance (EV) index was more consistent than horizontal for evaluating discomfort glare. This study investigated sensible real-world conditions by surveying volunteers and analyzing the simulation data to serve a better design and, consequently, providing validation.
The envelope and building physics transfer the heat and cold to the outside environment. Windows as part of the envelope (the transparent layer) are effective in this process, improving the living environment and space quality in addition to energy issues. Considering the rapid growth of technology and environmental issues, adhering to energy management standards for this purpose reduces the maintenance costs of resource-efficient buildings. For example, the Leadership in Energy and Environmental Design (LEED) certification developed by the U.S. Green Building Council [31,32] has emphasized the correct and optimal use of light and landscape considering important criteria presenting the labels. The improvement of indoor environmental quality (IEQ) is one of these criteria. Therefore, using natural light and visual comfort is an important and effective principle for window design. On the other hand, windows with any type of glazing absorb some sunlight, and this light should be controlled for space heating in the winter and cooling in the summer so that indoor temperatures can bring outside comfort. Thus, using windows as a small part of a building would be beneficial to energy consumption and uniquely reduce the cost of primary energy.
Among the types of buildings, office buildings have high energy consumption. The average annual energy consumption for this type of buildings in Iran, despite working 8 to 10 hours a day, is equal to 350 kWh/m2 [4], which is a high coefficient in terms of energy consumption [5]. Because most office buildings in Iran are governmental, energy management has not properly been performed. Based on recent governmental policies on proper energy management, office buildings are considered in the present study. Furthermore, in the hot and dry climate of Isfahan, there is no specific facade design solution in terms of windows shape, position, and WWR on different orientations of the office buildings. In this regard, the current study aims to optimize the design of windows to separately evaluate the WWR, along with the shape and position of the window in each façade in order to maintain visual comfort with proper daylighting. Moreover, the reconsideration of design principles and their implementation at the design stage are important issues that should be addressed due to challenges for energy conservation and improving the quality of the interior [33]. This study examined and compared all predictable scenarios with the dynamic simulation through reviewing the literature and extracting independent and dependent variables. The optimal scenarios were decided based on design codes for the office building in Iran [34] as well as weighing the impact of each option on variables. The study further sought to reduce the costs and improve workplace environment quality by providing relevant solutions that are appropriate for Isfahan office buildings (The climate type is 3B and BSk classification, respectively according to ASHRAE and Köppen-Geiger.) throughout the research and the drafting process of this paper. More precisely, adopting adequate plans and encouraging the institutions in the charge toward establishing building efficiency will serve to increase the productivity of indoor environments and promote occupants’ health. This is a new step within this climate and the office buildings of Isfahan for reverting to optimal window designs.
2. Research method
To review the basics of window design for reducing energy consumption and receiving adequate daylight based on the optimal window variables, first, the concepts of primary energy and daylight analysis about visual comfort are explained according to the theoretical foundations of the study. Then, all cases for the most optimal window components in the office buildings are analyzed by selecting and defining the simulated model to control all the confounding factors in office spaces and generalize the results to the sample. Figure 1 displays a summary of the research process.
Figure 1
Fig. 1. A summary of the research process.
2.1. Properties of the reference room
Due to different roles, variations of height, and the location of each room (on floors and façades where the air exchange occurs) in office buildings, modulations with different scenarios should be done for sampling. For this purpose, a public office room is used to assign variables to the whole building. An office reference room is chosen to analyze daylight and energy consumption as the representative of office buildings. Since the Shoebox model is used in most studies, in the present study, an office room with a width and depth of 4 m is also considered. This is because changes in the depth of sunlight penetration are prevented to calculate daylight and energy consumption and the window area is the same as the other orientations. The useful height of the simulated space is estimated as 2.80 m based on the office building [35,36]. The selected WWR range can be within the range of 10-60% with a 10% tolerance. According to wall dimensions for windows, square (S), horizontal (H), and vertical (V) shapes are used for each WWR with the same area at central, upper, and lower positions by varying the window sill height in the main orientations (i.e., south, east, north, and west). As seen in Fig. 2, in the central case, the midpoint of the window is in the middle of the façade. For the upper case, the upper edge of the window is aligned with the top of the wall (up to the ceiling). Regarding the lower case, the lower edge of the window is aligned with the bottom of the wall (up to the floor). Figures 3 and 4 represent the details of the scenarios for the central position of the windows and the physical properties of the building, respectively. Main office spaces have heat exchangers from only one wall, and the other physical envelopes are connected to unconditioned and conditioned spaces. They are located on the middle floors of common office areas, and other floors are more service-oriented. Thus, the model is located on the middle floor, and the only façade with the window is connected to the outside. Other envelopes (including ceilings, floors, and other walls) are adiabatic. A total of 180 scenarios (15 (WWR, shape) × 3 (position) × 4 (orientation)) are analyzed based on lighting, heating, and cooling energy consumption and daylight criteria modeled by DesignBuilder 6.1.0 software. Table 1 presents the input data for all scenarios.
Figure 2
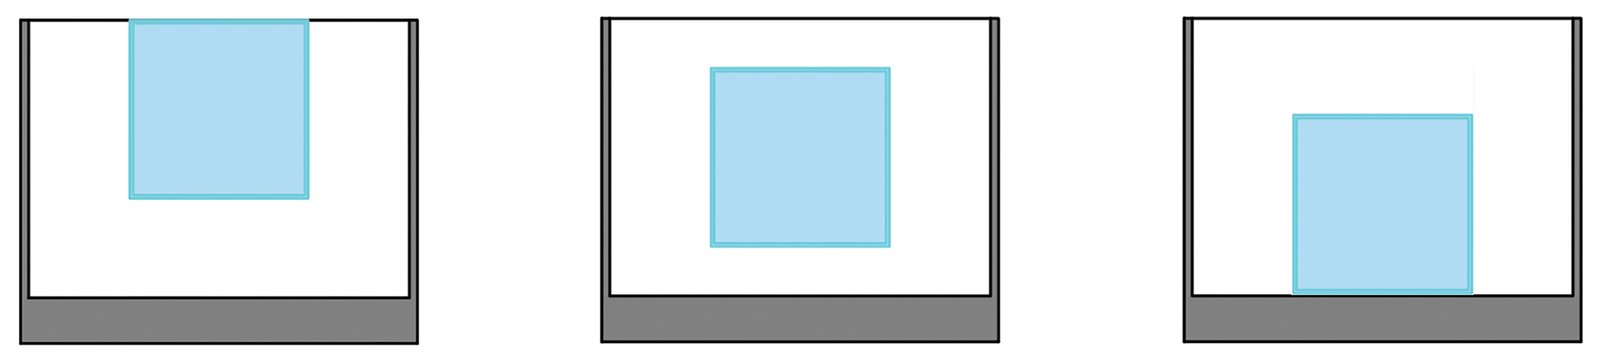
Fig. 2. Models by varying the window sill height at upper (left), central (center), and lower (right) positions.
Figure 3
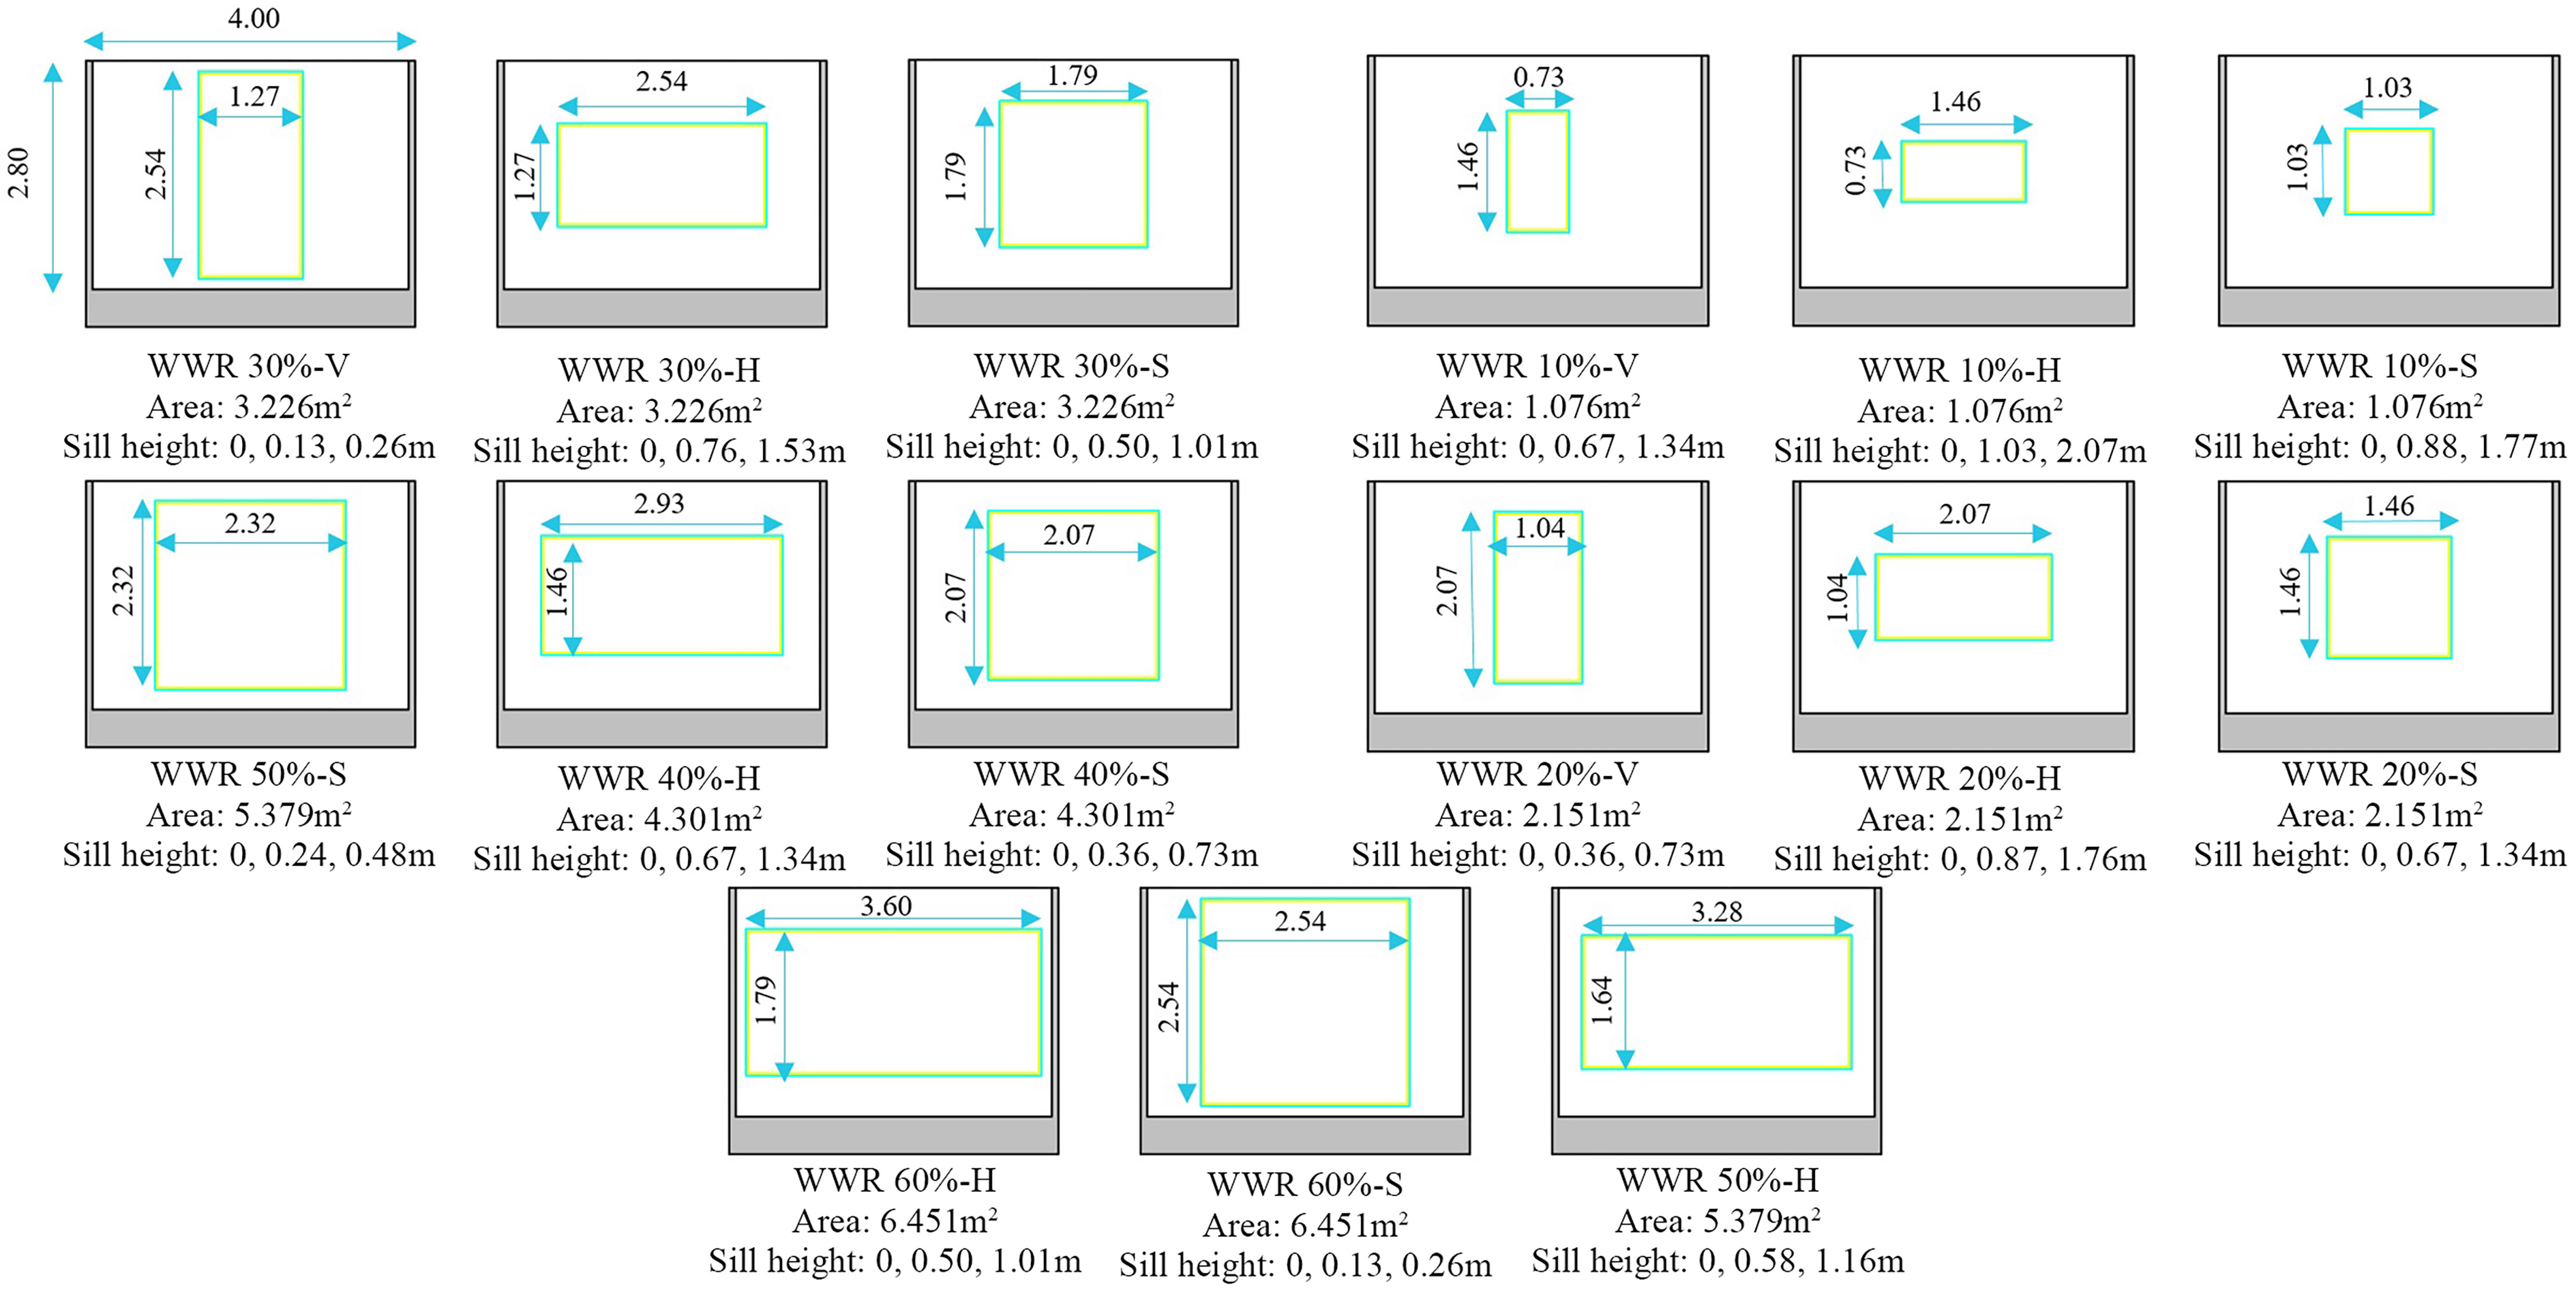
Fig. 3. Various configurations of simulated windows, including WWR, shape, Positions.
Figure 4
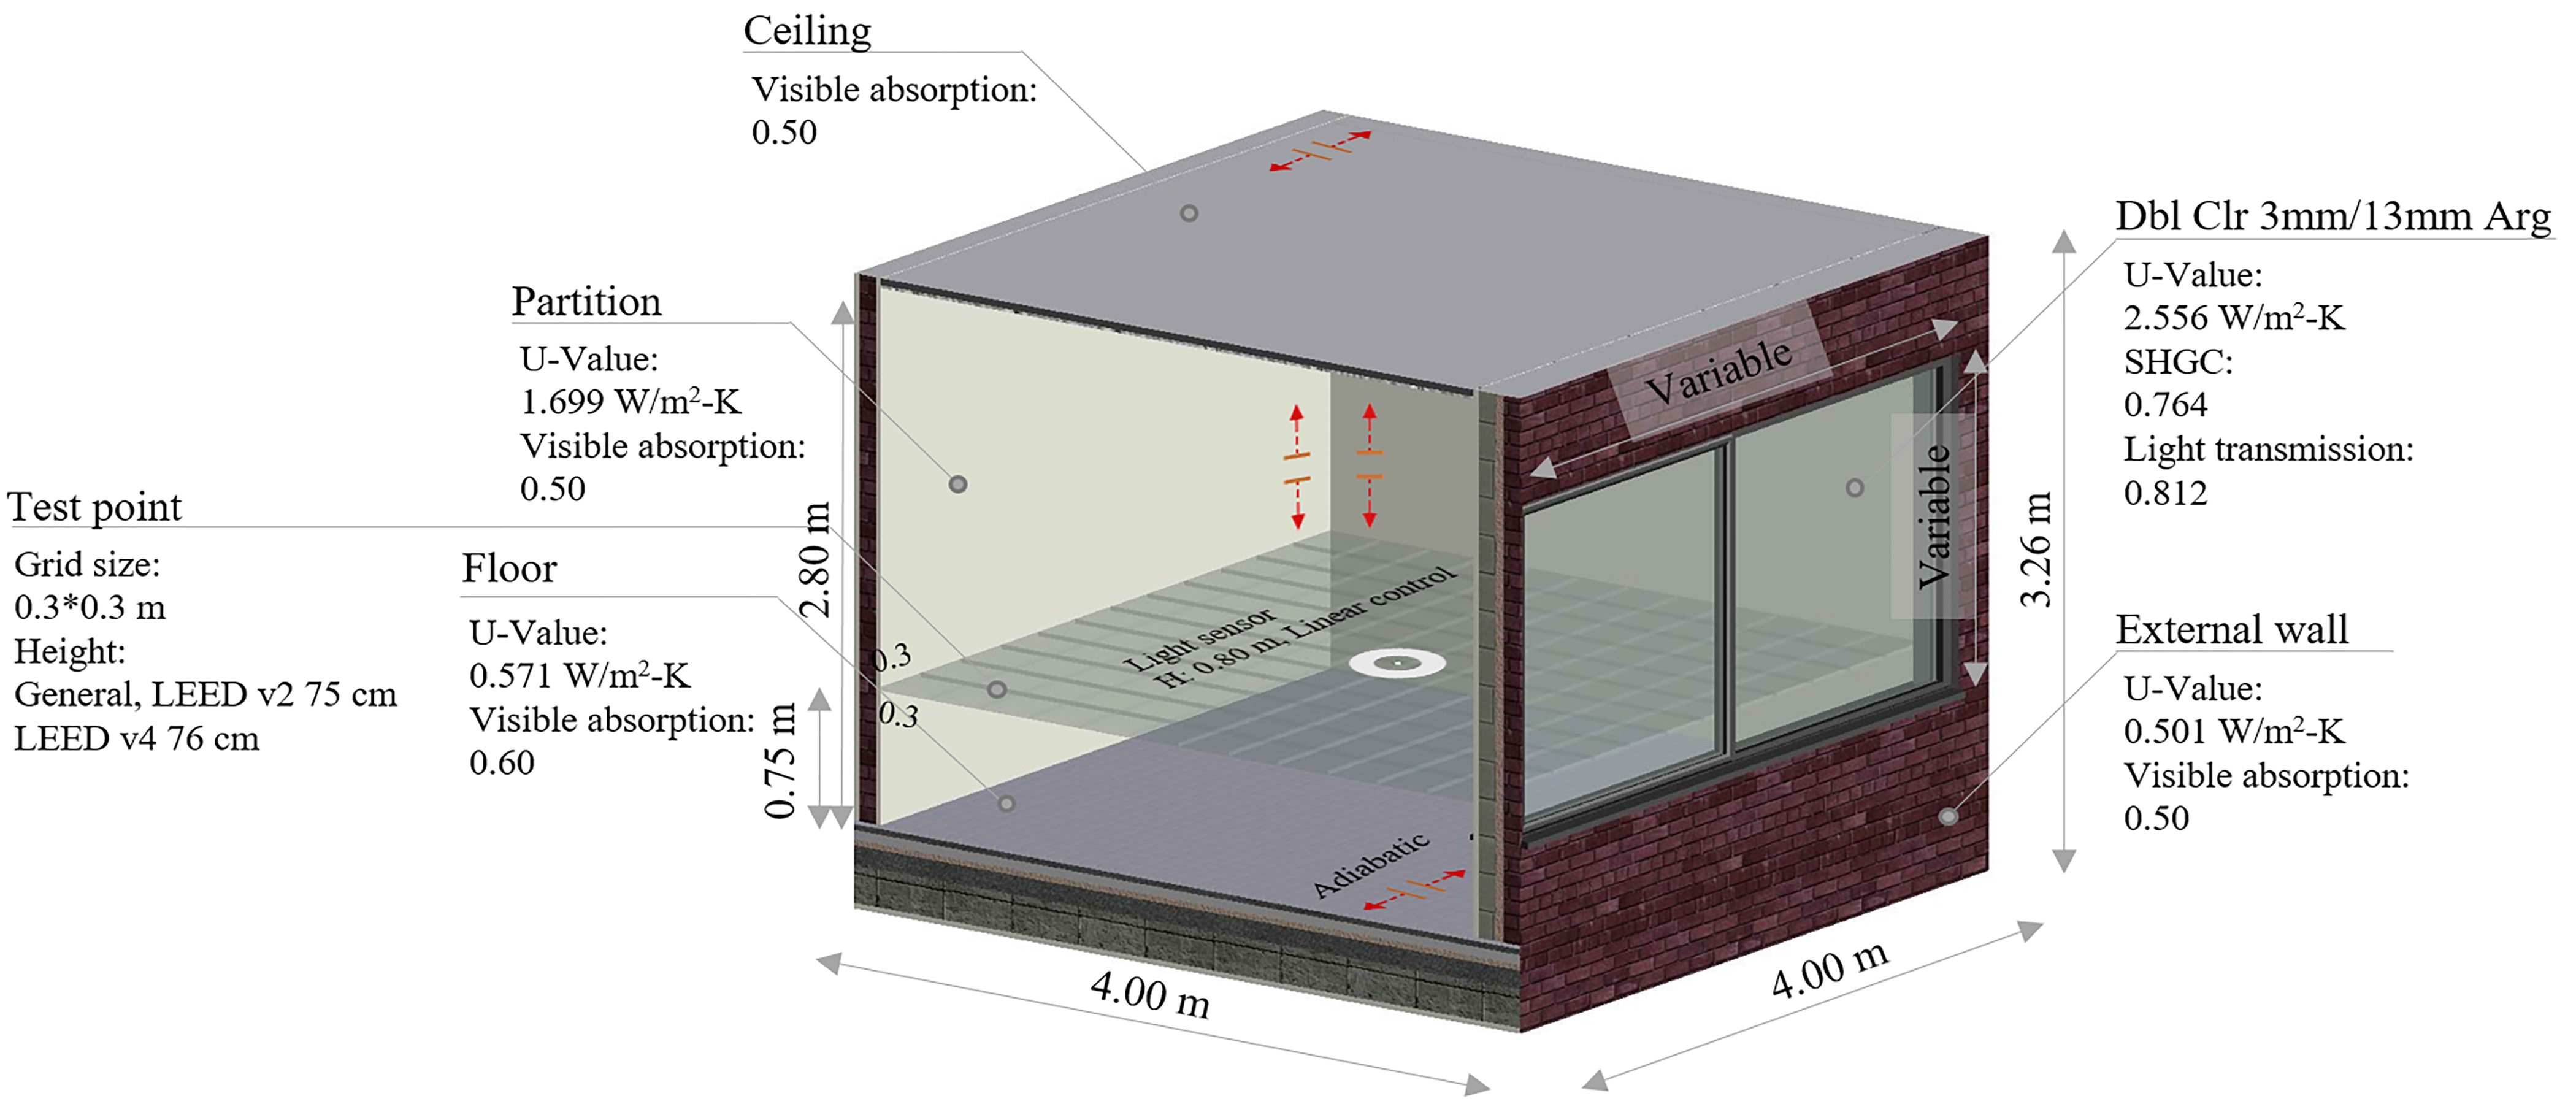
Fig. 4. The schematic of the simulated room for calculations in DesignBuilder software.
Table 1
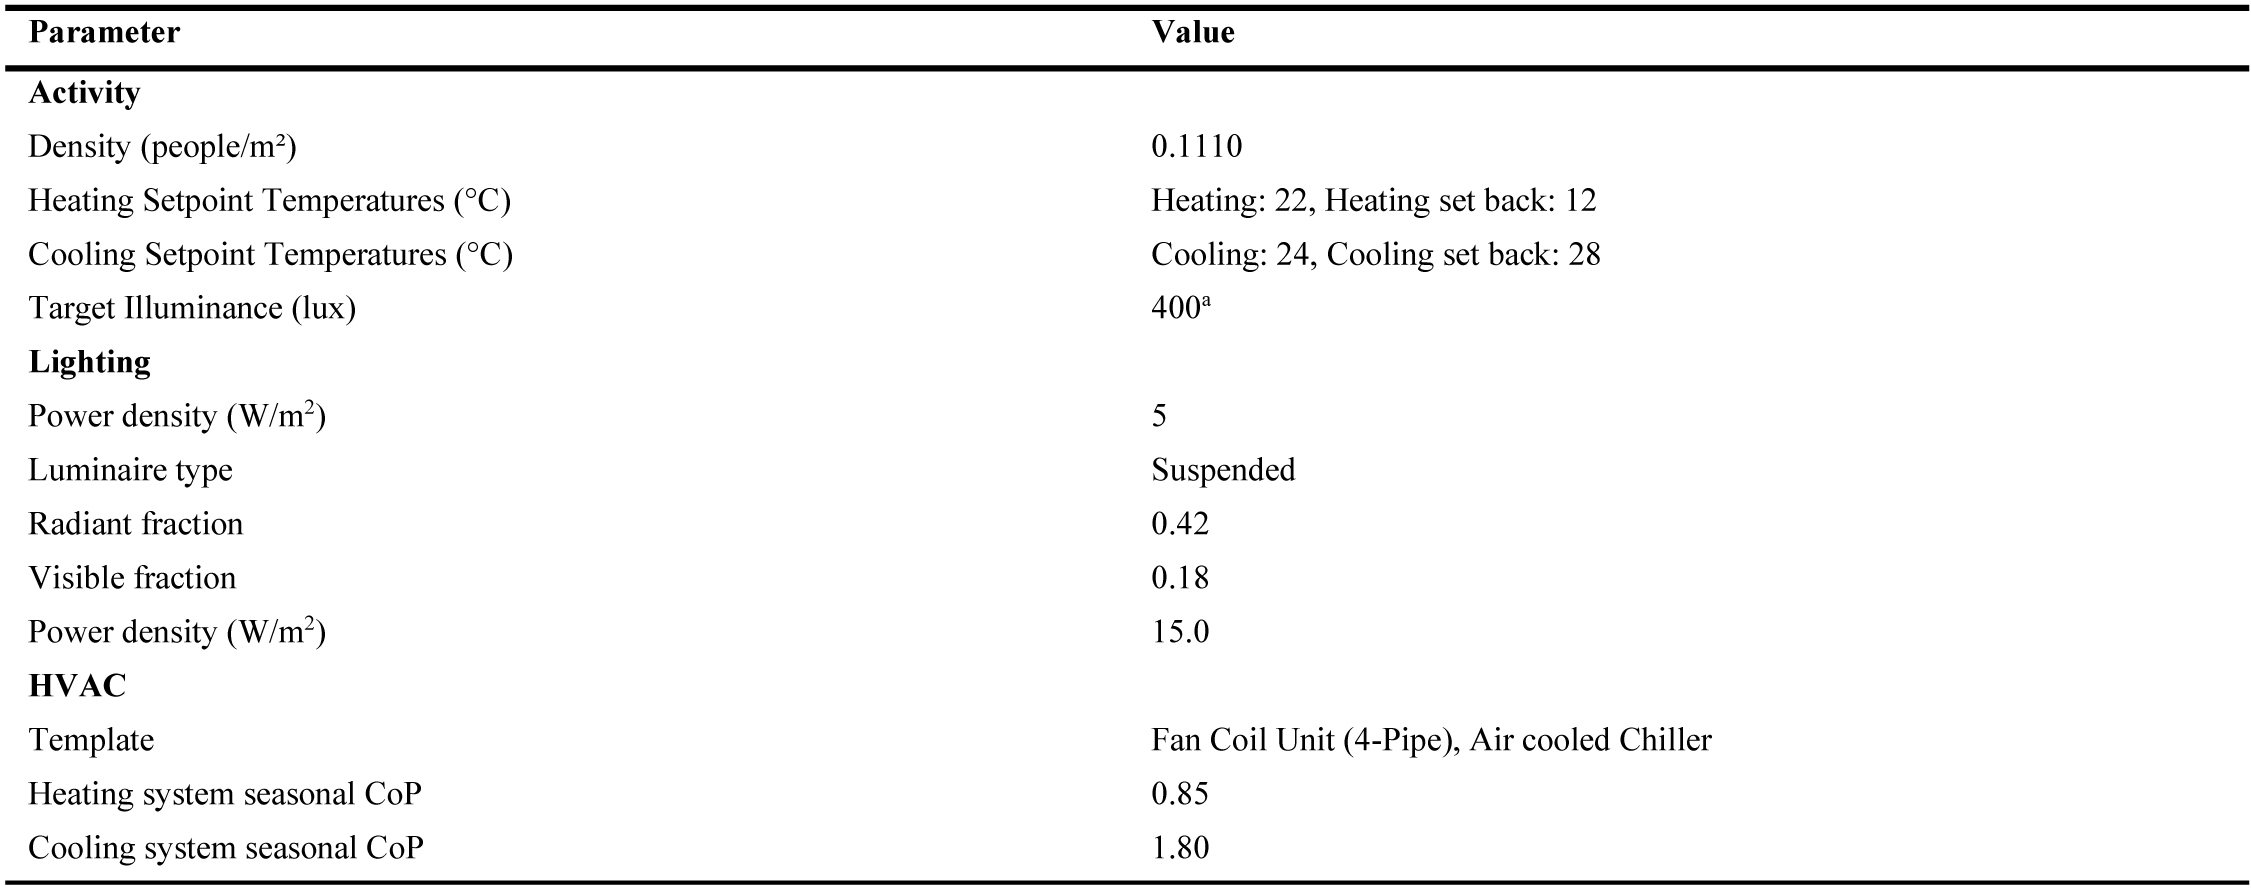
Table 1. Input data for activity and lighting templates for all scenarios.
2.2. Climate information for simulation
This study is conducted in Isfahan, Iran at 51.67° N and 32.47° E. Meteorological data are automatically obtained from the DesignBuilder software for calculations. There is no limitation to the simulation process time. Therefore, the results are obtained for the whole year or periodically. On average, the highest and lowest dry-bulb temperatures are monthly estimated as 29 °C and 2 °C in July and January, respectively. The global horizontal radiation is in the range of 2991-6185 Wh/m2 in different months, and the highest and the lowest radiations occur in June and December, respectively.
2.3. Simulation approach
Buildings have various construction costs, and it is essential to identify factors affecting the principles of efficient design according to new technologies. Therefore, the required decisions for finding solutions for reducing energy consumption are of great importance. On the other hand, a complex relationship exists between design components and climatic factors, as well as the type of the ventilation system and lighting, and only interfering factors can be measured by the simulation [37]. In addition, it is extremely difficult to calculate the amount of the consumed energy and the daylight via access to the information of all the interfering factors such as the sun, the sky, and the vicinity. Considering the respective values for each of these factors, using appropriate formulation makes a possibility of computational errors. Thus, it is common to use simulation software for data analysis and hundreds of software are now available in this field with various capabilities, including DesignBuilder with EnergyPlus, Radiance, and Daysim simulation engines.
The validity of DesignBuilder software has been measured by studies in various ways. For example, in a study [38] the annual energy consumption of a three-story office building was compared using simulations and bills from electricity and natural gas. The building had single-glazed windows with semi-open horizontal blinds in Semnan (with hot and dry summers and cold and dry winters). The results of actual energy consumption in 2015 and software outputs showed a difference of less than 1.6%. Furthermore, the DesignBuilder software was validated [39] using computational fluid dynamics (CFD) concerning the two main components of air velocity and temperature versus natural ventilation in a laboratory located at Chalkida Technological Educational Institute, Greece, with the dimensions of 6 m (width), 4 m (depth), and 5.5 m (height). Despite some errors, the obtained results from the CFD were closely in agreement with the measured data in the experimental test. In some studies, DesignBuilder software was focused on energy modeling and simulations. For example, a study [40] investigated the effect of shading performance (louver) on energy efficiency in the hot and humid climates of the Dhahran Hotel, Saudi Arabia. However, with the development of simulation software highlighting a building scale, DesignBuilder software is chosen as a simulator to examine and design building performance indices and characteristics.
3. The analyzed findings
To obtain optimal window characteristics in terms of ideal annual energy consumption and daylight criteria with the specified range, it is necessary to analyze the data and compare them with each other. For this purpose, charts and tables are prepared after collecting data from simulation scenarios, and then optimal window states in all four main orientations are obtained to create visual comfort and optimize energy consumption.
3.1. Annual energy consumption in different geometries and window positions
Figure 5 depicts the annual energy consumption for each position of the four window orientations. As WWR increases, the demand for heating and lighting energy decreases, dramatically increasing the cooling energy. As a result, the daylight passing through the window causes the interior to heat up due to the radiation heat transfer. Thus, the air conditioning system needs to be more active to bring the temperature to comfortable summer conditions, resulting in environmental pollutions. The highest and lowest energy consumption of heating and cooling is caused by the orientation of the window to the north of the building, respectively. In the north orientation of the window, the lack of receiving heat from sunlight increases the heating energy requirement. For the south side with 30% WWR and an average of 1.22 kWh/m2, this energy requirement reduces and acts as a passive solution. Different window shapes in each WWR have extensive energy consumption variations, indicating heat transfer from building envelopes through thermal bridges around the window frame in addition to the angle of solar radiation. In general, square and vertical shapes consume less amount of energy. In the lower position (b), the lighting energy consumption is higher compared to other positions, especially in early WWR values due to the poor performance of the window in daylight receiving. In the north face, the lighting demand is higher than in other window orientations. In contrast, the cooling and heating energy are lower in comparison to other façades, and the window sill height generally affects the WWR and the window shape on the energy consumption generated by burning natural gas and electricity. Overall, the energy demand increases by an increase in WWR. Window shapes at each position and WWR attribute their tangible performance. Furthermore, the window position at initial WWR values (up to 30%) has good performance impacts on building energy consumption, and its effect decreases by increasing WWR. Obviously, by increasing the WWR, the amplitude of the window sill height changes representing a reduction. Hence, window positions lead to slight changes in energy storage and provide approximately the same results for central and upper positions.
Figure 5
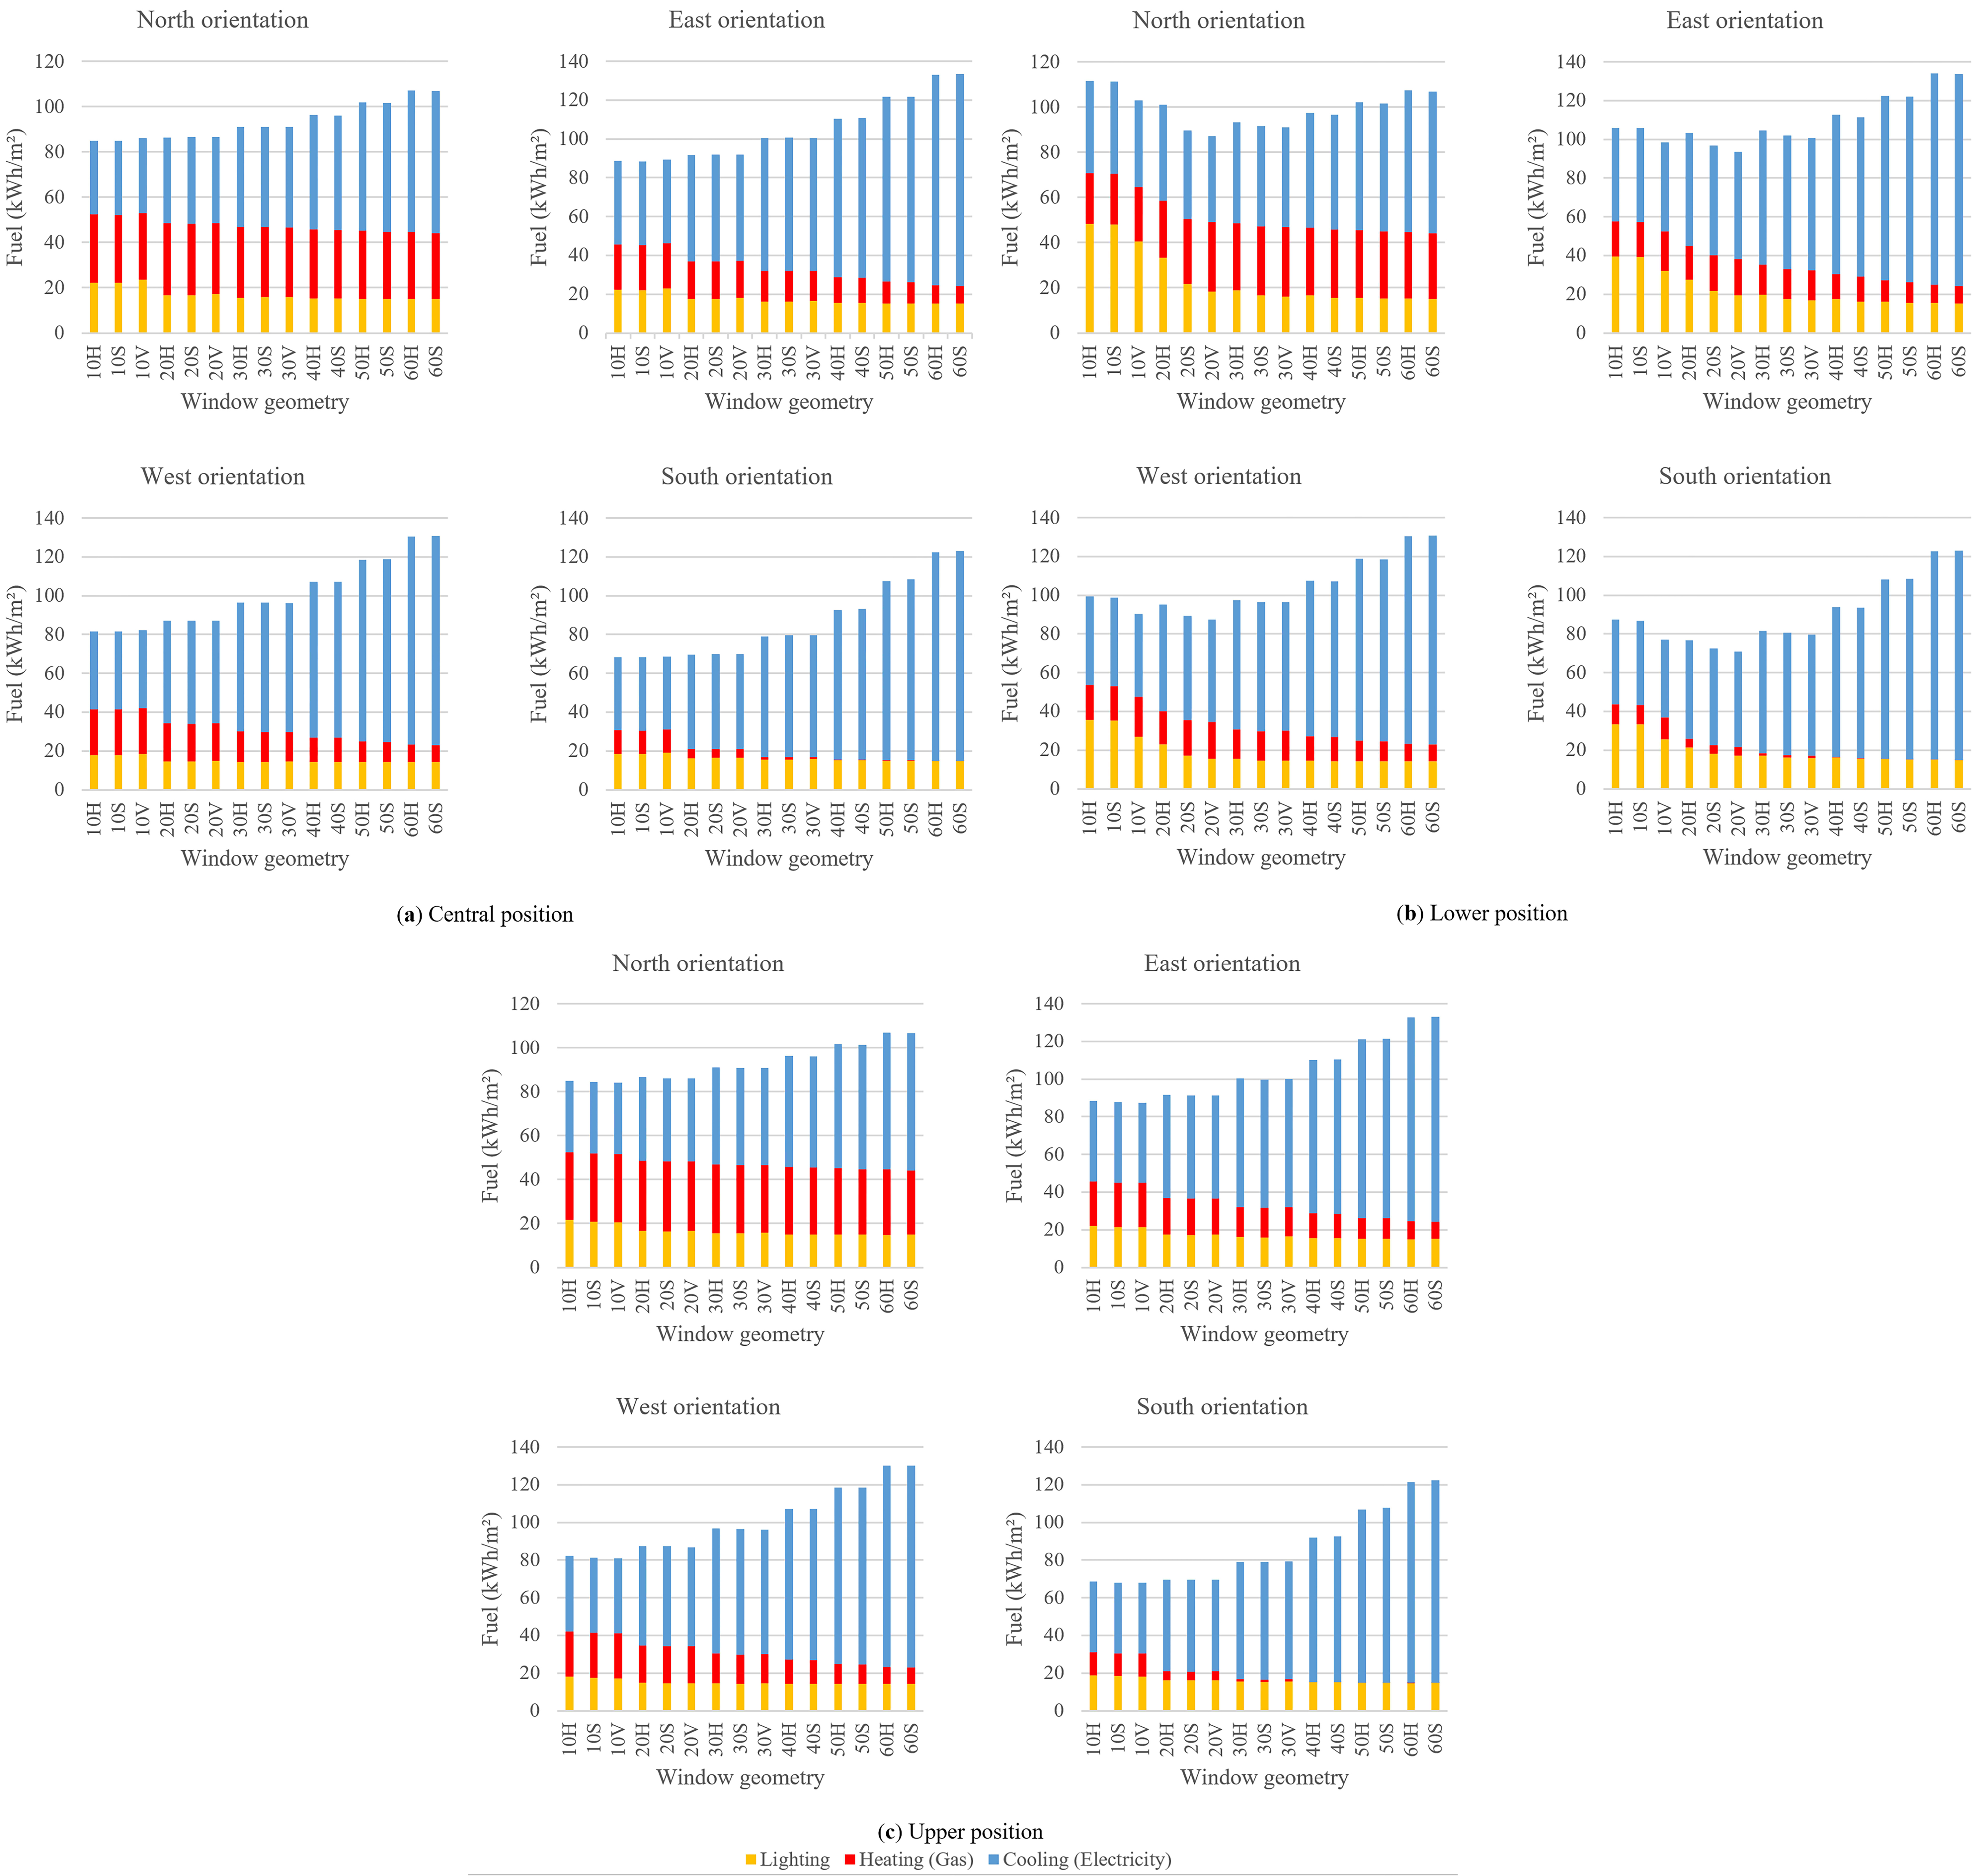
Fig. 5. The annual energy consumption chart in square meters for (a) Central, (b) Lower, and (c) Upper positions.
3.2. Evaluation of window components by daylight criteria
To generally calculate daylight with respect to simulations or LEED v2 and LEED v4 option 1, settings such as the sky type and Wp height were applied to the results of daylight simulations for this study. Moreover, regarding the Radiance engine, all daylight computing parameters were equally used for all models (Table 2) [41].
Table 2
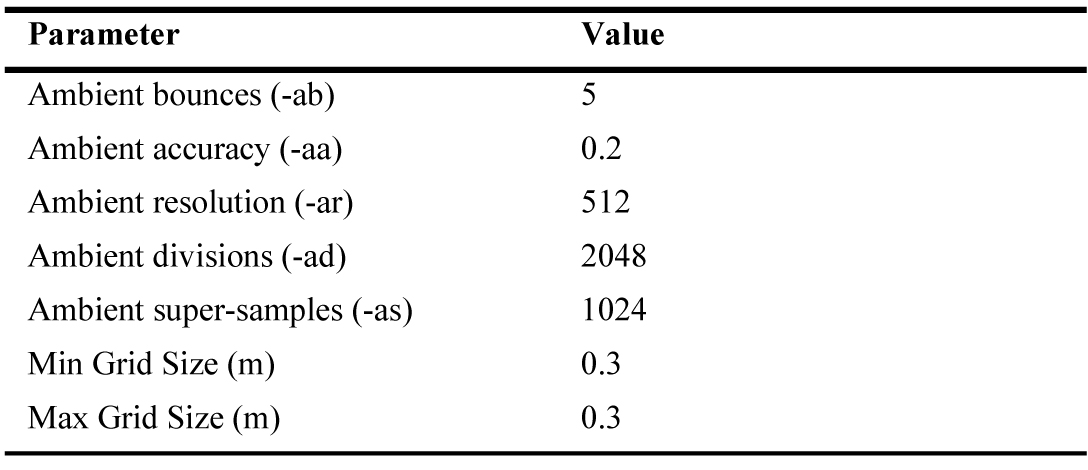
Table 2. Parameters of daylight calculations.
Based on the data in Table 3, the ADF reaches the floor area of the room and signifies this process for all orientations according to the daylight criteria and the range of WWR from 20 to 40% and even in the case of 50% with a horizontal shape in the range of 2-5% in accordance with the standard [42]. Besides, window shapes at each position and WWR have reasonable performance. At the lower position of the window, these values for the smaller WWR cases decrease significantly compared to other positions and receive an acceptable status from the WWR 0.3S. Accordingly, there is a difference of 0.96 and 21.88% for the central position for each window orientation as compared to upper to lower ones, respectively, and a difference of 20.92% for the upper position in comparison to the lower one.
Table 3
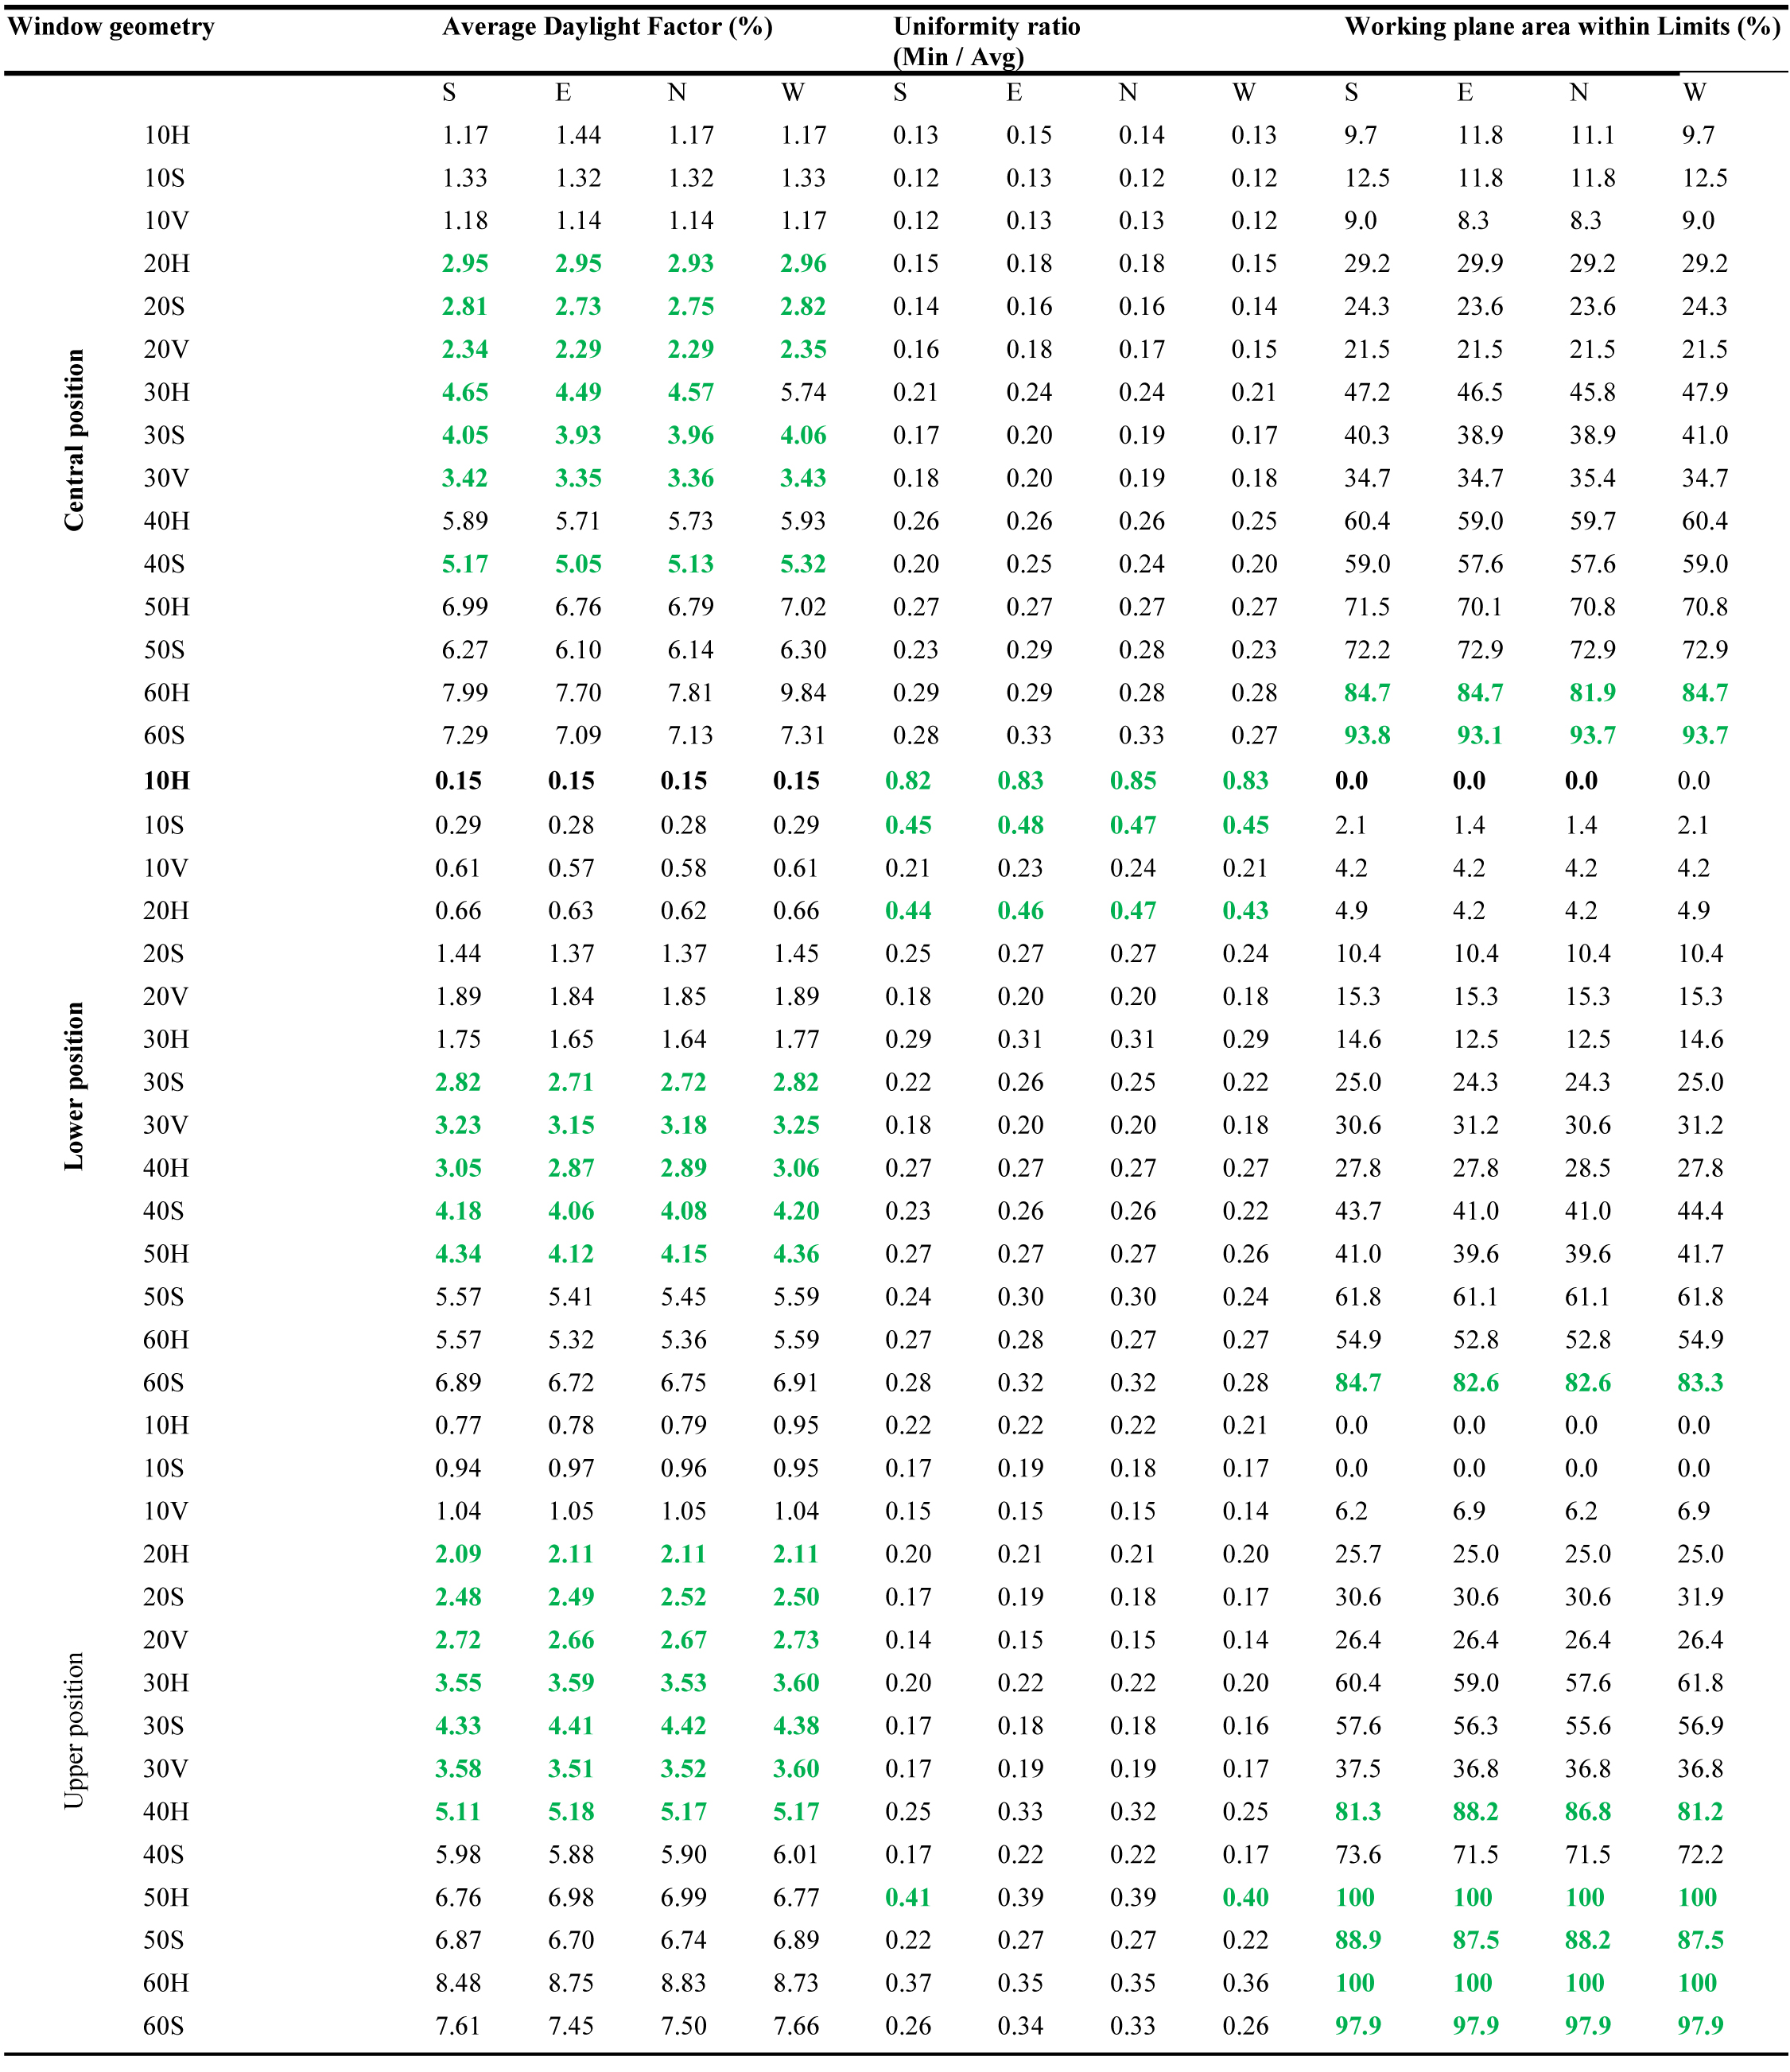
Table 3. Evaluation of static daylight criteria and LEED v2 certification for window geometry and its positions.
As previously mentioned, the uniformity ratio indicates daylight quality and uniformity in indoor spaces. According to the EN standard [43] indicating the minimum uniformity ratio of 0.4%, the lower position for all window orientations for the initial WWR values reaches the permissible value. This ratio increases/decreases by an increase in WWR. Therefore, it is essential to employ other solutions such as shading or light shelves [44]. The evaluated components in this study do not depend on the uniformity of daylight.
The Wp range receiving daylight is calculated based on the LEED NC 2.2 Credit EQ 8.1 standard [31], where a working plane height is 75 cm and a sky model is based on the Commission Internationale de l'Eclairage (CIE) of an overcast day (with specifying illumination). Acceptance conditions are to achieve at least 75% of the occupied floor area with sufficient daylight and illuminance exceeding the minimum threshold value (269.098 lux). By enhancing the WWR, more space will meet daylight in Wp. This demand is felt higher for the upper position of the window. Even a window with a WWR of 0.5-0.6 H achieves this requirement by 100% although the visual comfort issue should be considered and, a window cannot certainly reach this desired range and obtain this certification.
Table 4
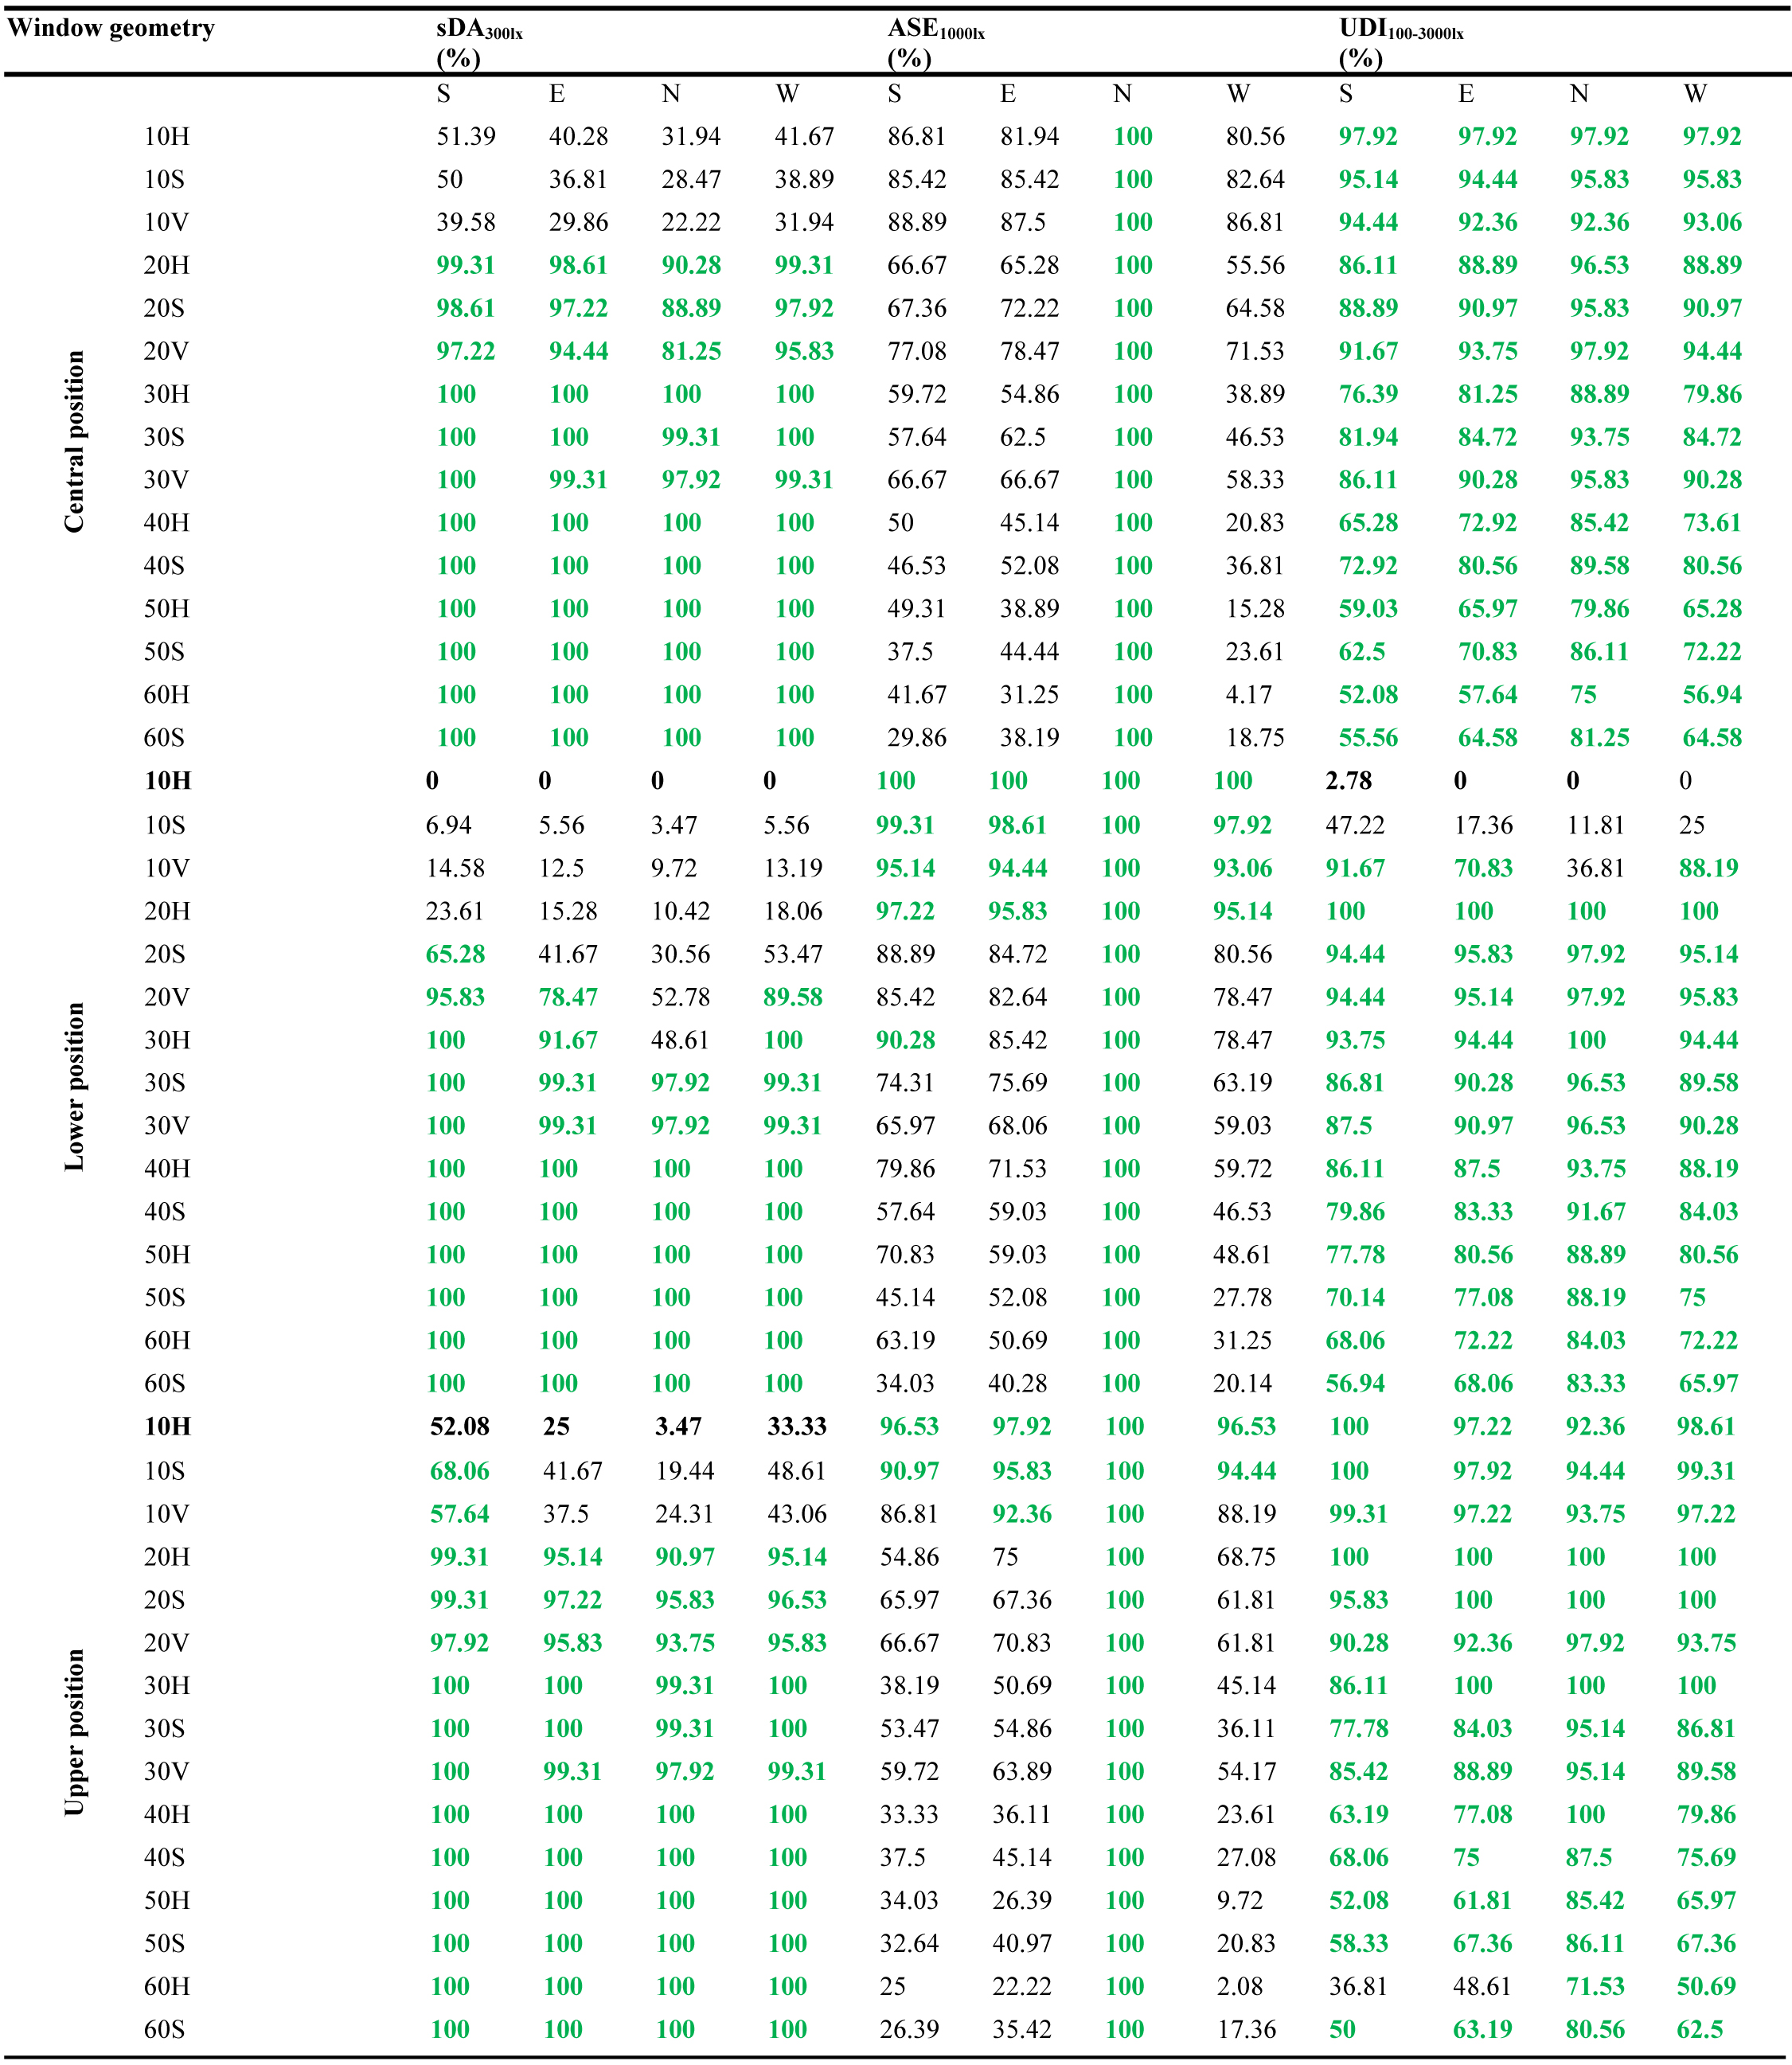
Table 4. Estimation of climate-based daylighting metrics (CBDM) for different window geometries and positions.
Table 4 presents the requirements for daylighting based on dynamic factors. Considering the sDA metric [45] indicating the natural received daylight, the area of the floor receiving this daylight increases by increasing the WWR. Given the constant depth of the room, it comprises the full amount (100%) of the floor area from 30% WWR. On the south façade, natural daylight is received by the same 10% WWR for the upper position, 20% from the other two positions, on the other directions, 20% WWR of the occupation hours during the year, and 55% or more floor areas. This condition is provided only for the lower position on the north face of WWR 0.3S. However, it should be noted that these values should be measured with ASE [45] for comfort conditions and 10% of the floor area can be exposed to direct sunlight at a given hour. Moreover, 90% of it must be free of sunlight at 1000 lux to be qualified [46]. Based on the obtained data from the software, ASE denotes that the percentage of the occupied floor area is not exposed to direct sunlight. In other words, 1000 lux illuminance does not reach the room within 250 h of the annual occupancy. Hence, the appropriate ASE range within the software's output is between 90-100%.
The floor area receiving no direct sunlight during the 250-hour occupation of the whole year naturally increases only on the north façade by a reduction in WWR. Moreover, there is a possibility of sunlight entering the summer afternoon. However, the shape and position of the window are influenced by these values. In terms of the LEED v4 standard, the window with a north orientation of WWR 0.3S and 0.2H for the lower position have reasonable conditions along with two other cases, the south façade of 10% WWR in the upper position and 0.3 H in the lower position.
According to some studies [47,48], the lowest and highest UDI are 100 and 3000 lux, in which, the room has no daylight during the occupancy time [49], respectively. Based on a comprehensive review of the latest data by field studies in daylight occupation, these values are considered in the present study. Additionally, these values are decreased by increasing WWR due to the annual occupation hours and the same trend is observable only in the north façade of the window. Therefore, unlike the 10% WWR with a horizontal window shape, vertical and square shapes have better performance in other cases with the average rate of upper, central, and lower positions.
3.2.1. Daylight performance on the south
According to Table 4, the sDA level on the south of the building, as elsewhere, increases by increasing WWR. This rate is 100% on the south from upwards of 30% WWR in all windows shapes and positions. The amount of sDA is more than 50% with 20% WWR horizontal, square and vertical shapes, central and upper positions, and 10% WWR square and vertical shapes in the upper position. The amount of ASE in the south orientation is more than 90% for different window modes with 10% WWR, horizontal, square, and vertical shapes, lower and upper positions, with 20% WWR, horizontal shape, lower position, and 30% WWR, horizontal shape, and lower position. The UDI rate on the south orientation is more than 50% in all windows modes, except when the window is 10% WWR for horizontal and square shapes and 60% WWR for horizontal shape in the upper position.
3.2.2. Daylight performance on east
According to Table 4, the sDA level on the east of the building and in the central position is similar to the south of the building. This rate is 100% in the lower position, from upwards of 40% WWRS, however, it is less than 50% for windows with 10% WWR, and 20% WWR, horizontal and square shapes. In the upper position, sDA is 100% for upwards of 30%WWR and less than 50% for all windows with 10%WWR. The ASE on the east is less than 90% for all windows in the central position. This rate is more than 90% with 10% WWR, lower and upper positions, and 20% WWR, horizontal lower position. East UDI rate is below 50% for 10%WWR and 60%WWR, horizontal and square shapes, lower position.
3.2.3. Daylight performance on north
According to Table 4, the sDA rate on the north orientation, in the central and upper positions, and from 20% WWR upwards is more than 90%. This rate in the lower position, from 30% WWR, square and vertical shapes to higher WWRs is approximately 100%. The ASE rate is 100% in the central, lower and upper positions for all windows modes. The UDI rate is more than 50% in all cases of Central and Upper positions, and more than 50% in the lower position in all cases except in the 10% WWR.
3.2.4. Daylight performance on west
According to Table 4, the sDA rate on the west orientation is similar to the north orientation in the central and upper positions, and from 20% WWR upwards is approximately 100%. This rate is approximately 100% in the lower position, vertical shape, from 20% WWR to higher WWRs. The ASE rate in the central position is less than 90% and more than 90% in the Lower position with 10% and 20%WWRs, horizontal shape, and 10%WWR, horizontal and square shapes, upper position. The UDI rate in the central and upper positions is more than 50% in all cases. This rate is less than 50% in the lower position with 10% WWR, horizontal and square shapes.
3.3. Data analysis
Multiple linear regression analysis was used in SPSS software to investigate the effect of window component (x_i) on daylight indices and energy consumption component (y_i). Independent variables affecting dependent factors were identified. The dependent variable's value can be estimated by placing the effective independent variables in each regression model related to a dependent variable. Table 5 presents the standard regression coefficient for each dependent variable. Moreover, the coefficient of each model component is entered for each regression model. In the window shape variable, two factors of width and height are considered in the regression model, and the efficiency or inefficiency of both factors of the window shape on the dependent variable cannot be accurately interpreted. Therefore, the shape of the window does not significantly affect the dependent variables. According to regression data, the effect of window height is significant on heating demand, UO, and ASE, and its width on ADF, sDA, and UDI.
Table 5
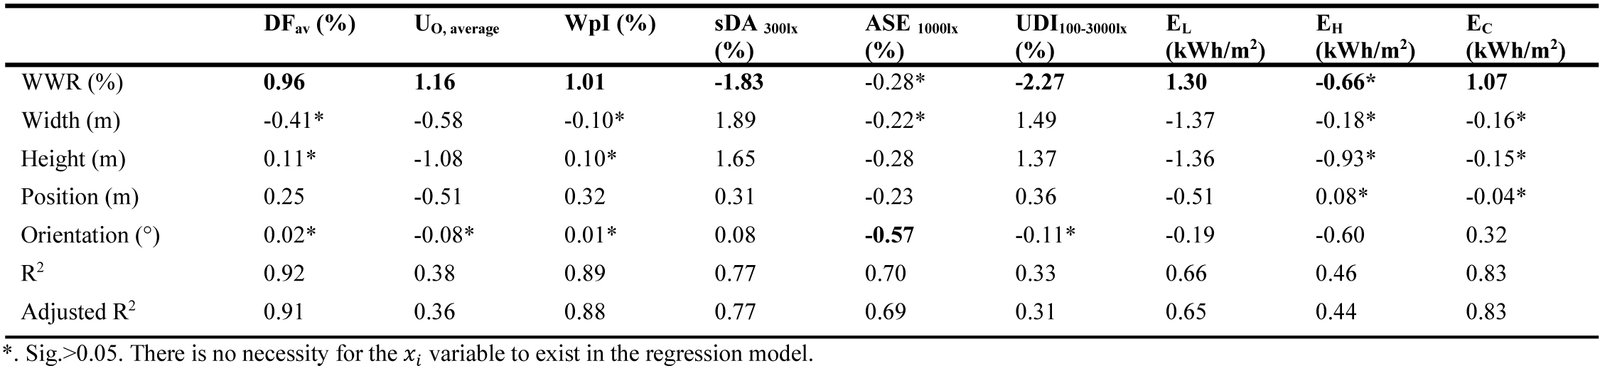
Table 5. Standardized regression coefficient β for model components related to the weighted average of output variables.
The results of the analysis show that in the model, there is less relationship between the two variables of UO and UDI and heating energy consumption than the independent component. In other words, the regression model was able to cover a smaller percentage of the dependent variable changes, and the closer the R Square and Adjusted R Square values to 1, the stronger the relationship. Hence, WWR has a significant effect on all the measured criteria, except for the ASE criterion. Orientation with a value of -0.57 is more effective, and these two factors have the best performance for predicting output variables. The least effective factor in daylighting and lighting energy consumption is the orientation of the window. Moreover, the window position in the heating, cooling (with values of 0.08 and -0.04), and ASE is significant with less impact.
3.4. Finding the optimal solutions and results
Linear optimization is used by DesignExplorer [50] to select optimal solutions based on the evaluation of input and output variables and the relationship between output variables as well as the definition of daylighting indices. In this method, appropriate options are determined based on energy consumption and visual comfort by limiting the solutions. There is a multi-objective optimization method that uses the genetic algorithm to define input variables and the objective function by minimizing and maximizing its threshold to find evolutionary and parametric optimal solutions. The Pareto front is applied to identify optimal solutions in this way. The designers can find an alternative based on their purpose by visualizing all solutions. Next, the most effective output variables in choosing the optimal solution are examined and evaluated for each window orientation for model performance. The red reference line in Fig. 6 illustrates the lowest and highest thresholds for the target metric.
Figure 6
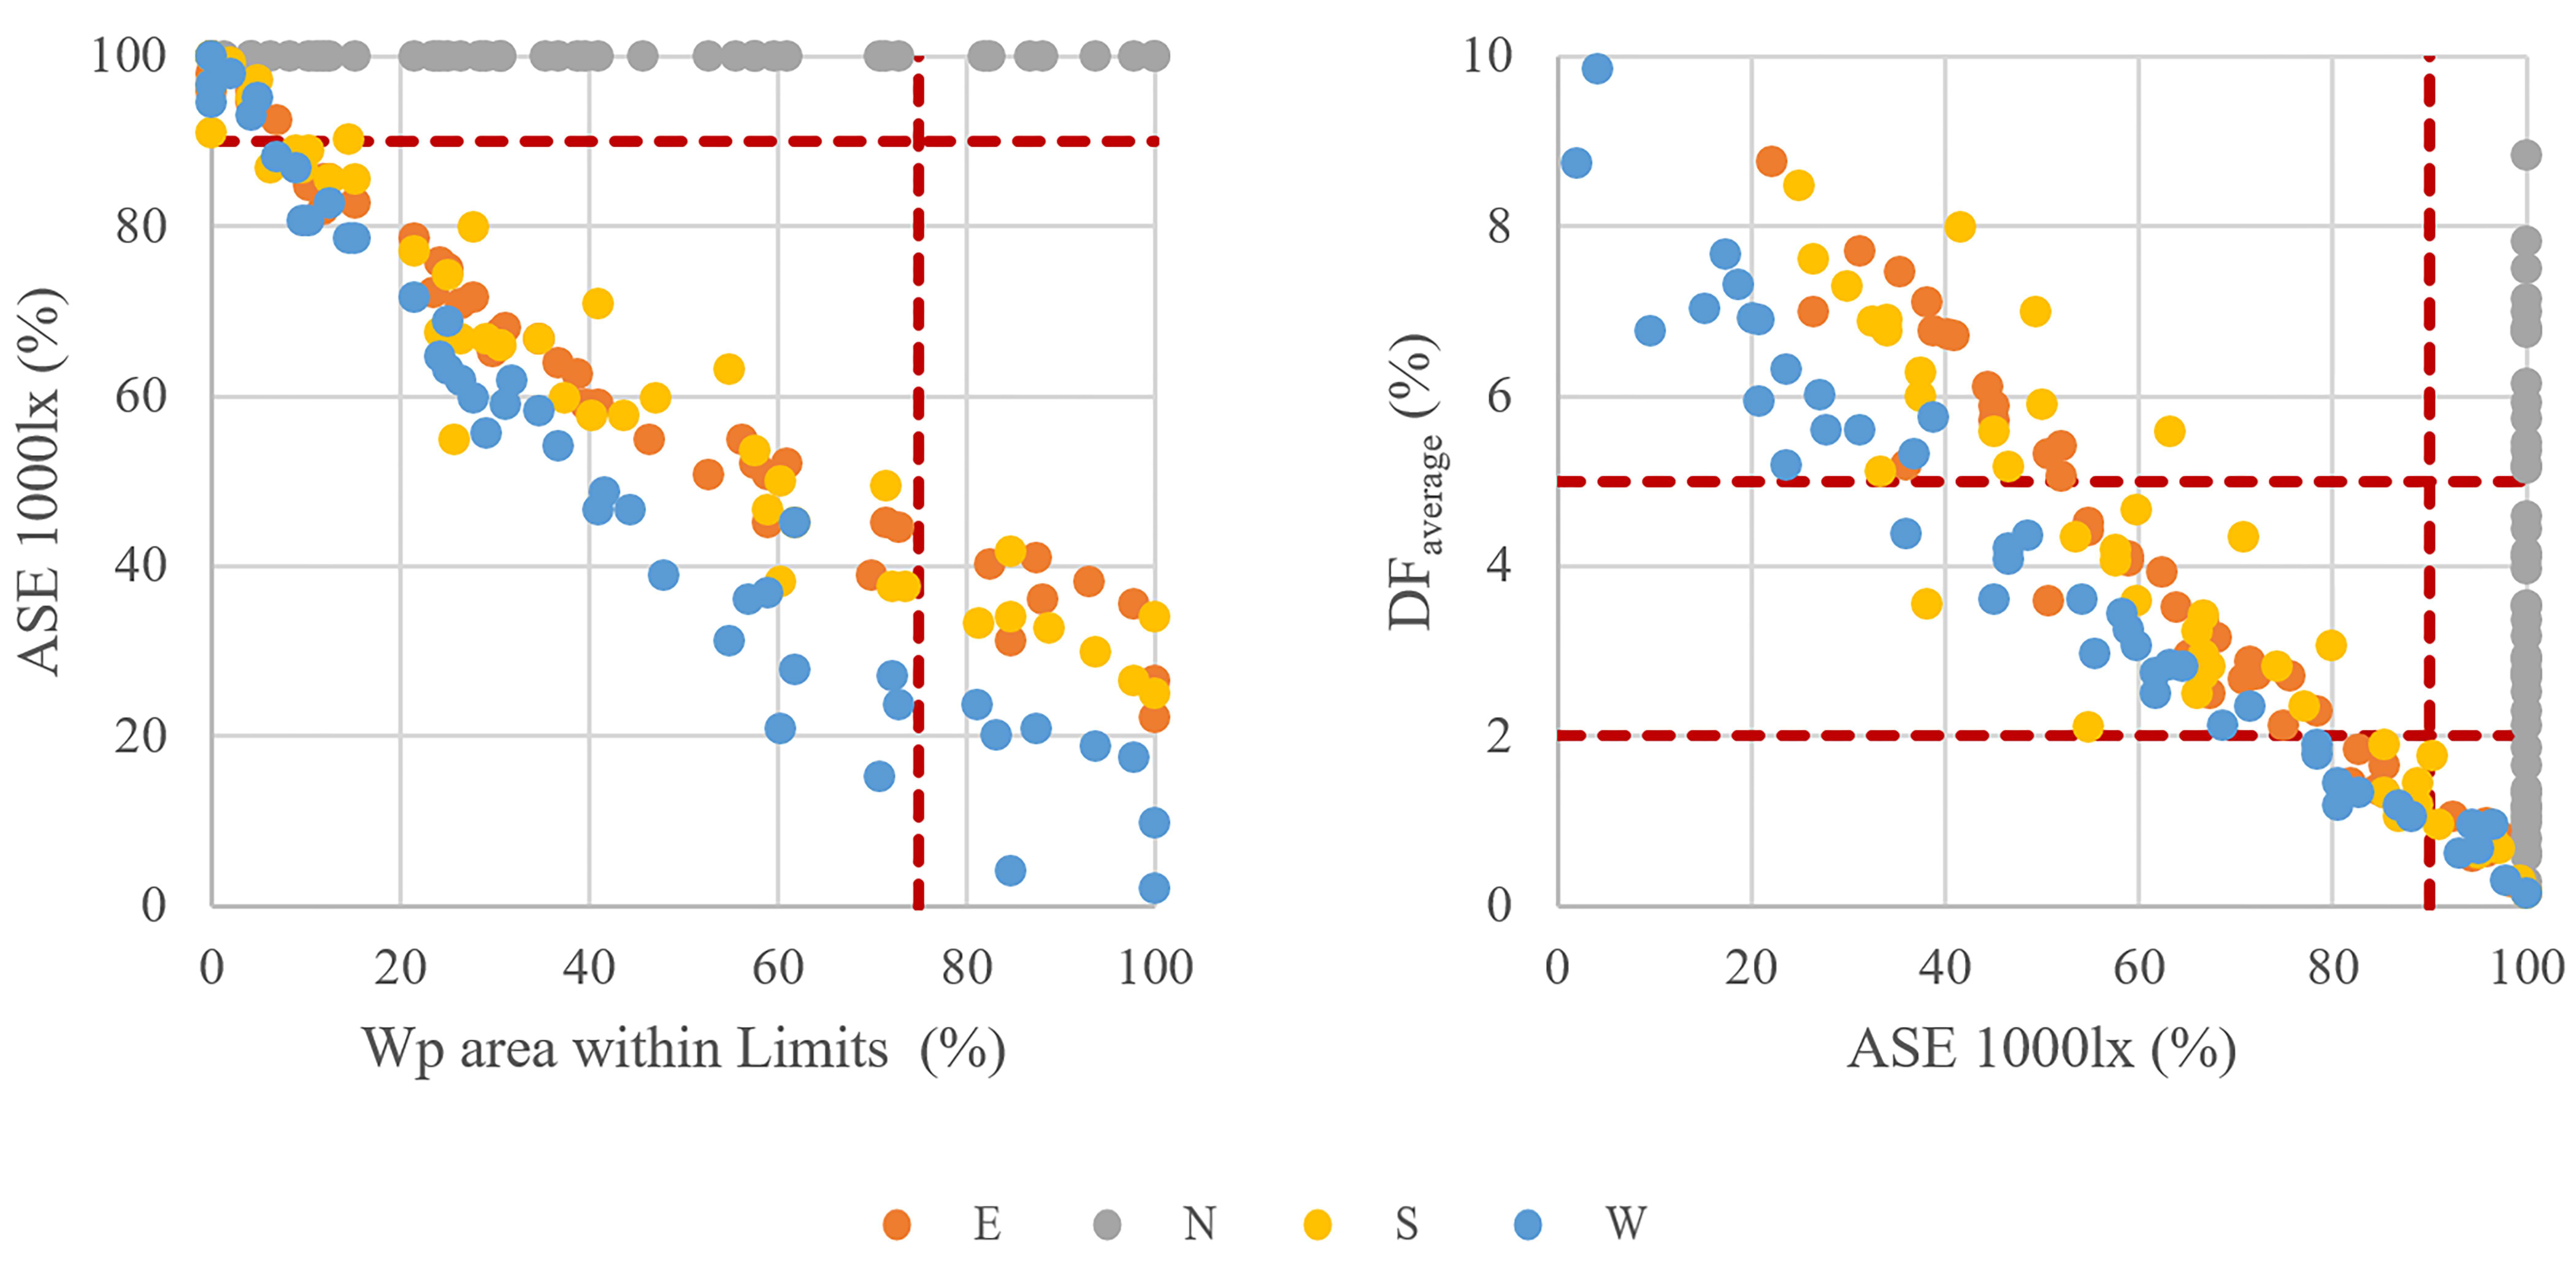
Fig. 6. The scatter plot of target variables at four cardinal directions.
Figure 6 shows the relationship between the most significant variables for selecting the appropriate window option. ASE values decrease dramatically by increasing Wp area illumination. A direct relationship is only observed in the north orientation of the window that could be chosen for the optimal case. In other words, by improving the efficiency of the discomfort index, the illumination decreases in the Wp area. The illumination around Wp is associated with an increase in WWR. Therefore, it must be chosen considering discomfort to select the appropriate solution.
As defined by the ASE, a floor area of space with more direct sunlight, is exposed to increase ADF in this case. Thus, the illumination at those points increases, causing a high potential for glare. The discomfort situation is changed by increasing WWR, leading to an increase in daylight in the indoor space, thus, the ADF range for the north window is acceptable. Hence, there is no discomfort in the space and direct sunlight occurs in other directions in this space, moreover, the requirements for LEED v4 with ADF cannot be met in this regard.
The analysis of windows in the façades of the buildings in response to appropriate daylight conditions and reductions in energy consumption provides numerous options for the designers, such as optimal efficiency. Figure 7 depicts a set of data for evaluations and replaces the current configuration with the appropriate selection of functional components for design improvements. By simulating an office room with specified characteristics, all data were read by DesignExplorer to find optimal solutions. Then, the effect of each window component on daylight quality and energy consumption with specified parameters was evaluated by determining input variables. The analysis was conducted to identify demands for daylight, maintain visual comfort, and reduce energy consumption for space occupants. However, there is no priority for maximizing sDA300 lx and minimizing ASE1000 lx, 10% to prevent direct sunlight in the room, and other daylight and energy storage variables. Therefore, taking into account all confounding factors, Table 6 presents the suggested solutions for optimal conditions. It is worth noting that it is impossible to simultaneously fulfill all criteria.
Figure 7
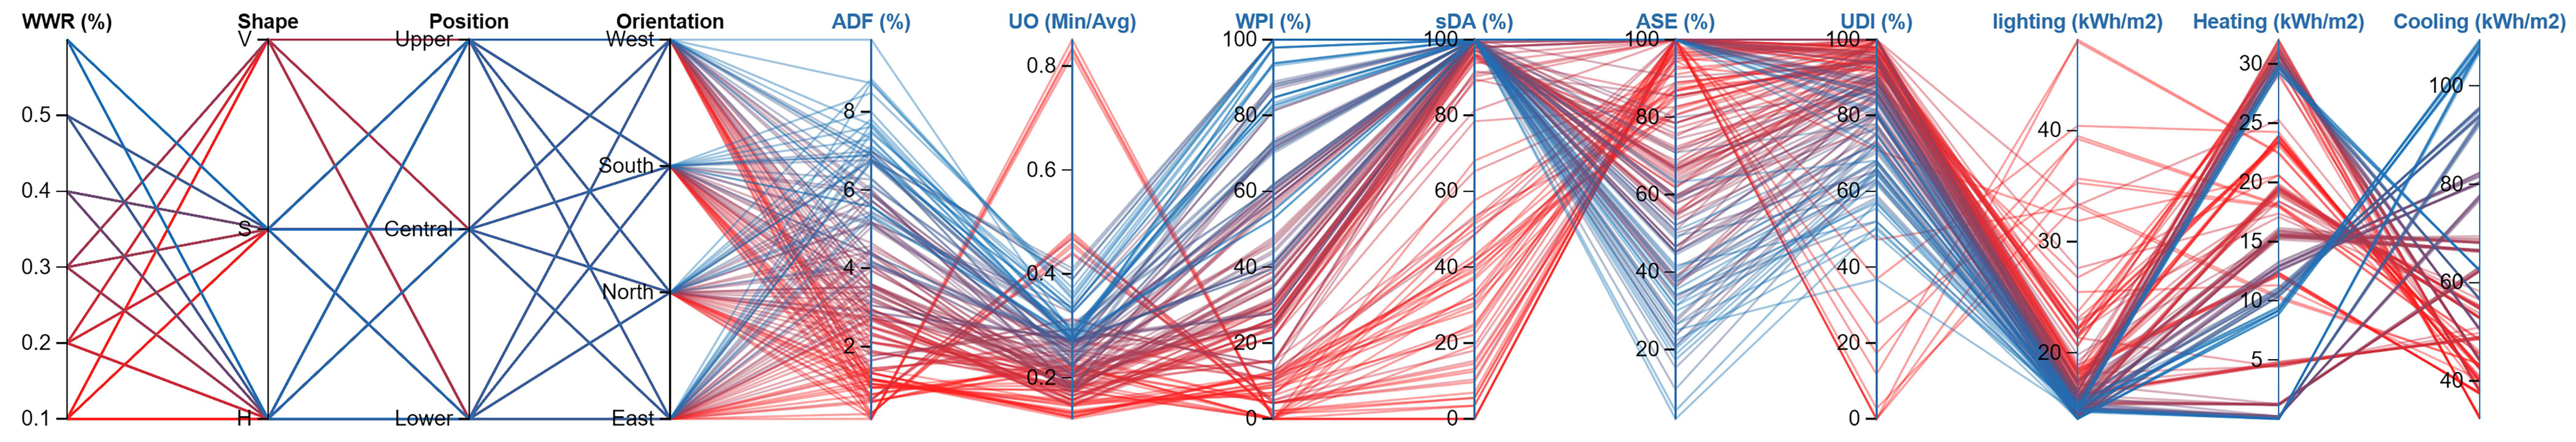
Fig. 7. The linear status of simulation scenarios based on window characteristic performance.
Table 6
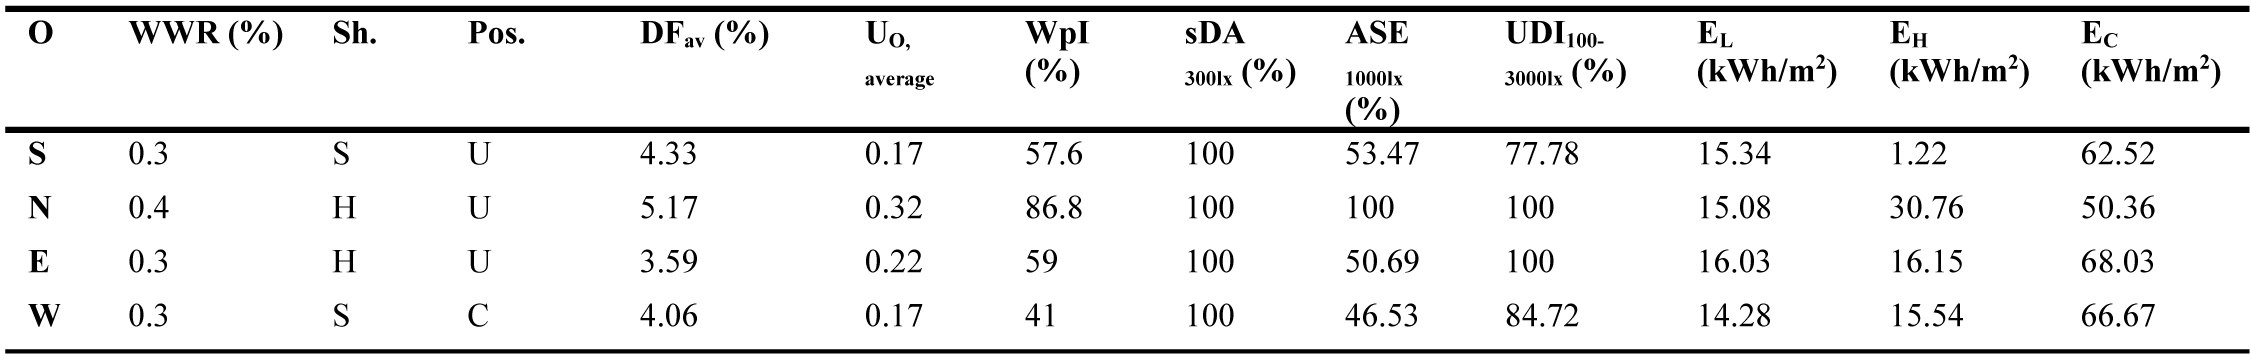
Table 6. Optimal characteristics of the window based on an ideal relationship between the main orientations.
The ideal conditions cannot clearly be achieved only by considering window characteristics. This research was conducted without the inclusion of window-based elements such as shading, glazing types, lighting systems, and the amount of reflection from surfaces. Therefore, the optimum components were evaluated based on their best relationship.
Table 7 presents design solutions based on linear optimization results for window orientations. These solutions are prioritized in order, and each façade has 2-4 solutions. It should be pointed out that all design options in Fig. 7 provide numerous solutions for the designers. These solutions depend on the designer’s needs and preferences. In Fig. 8, the solutions are categorized for energy and daylight performance. They will be undoubtedly changed by focusing on the minimum energy consumption or the limitations of daylight criteria.
Figure 8
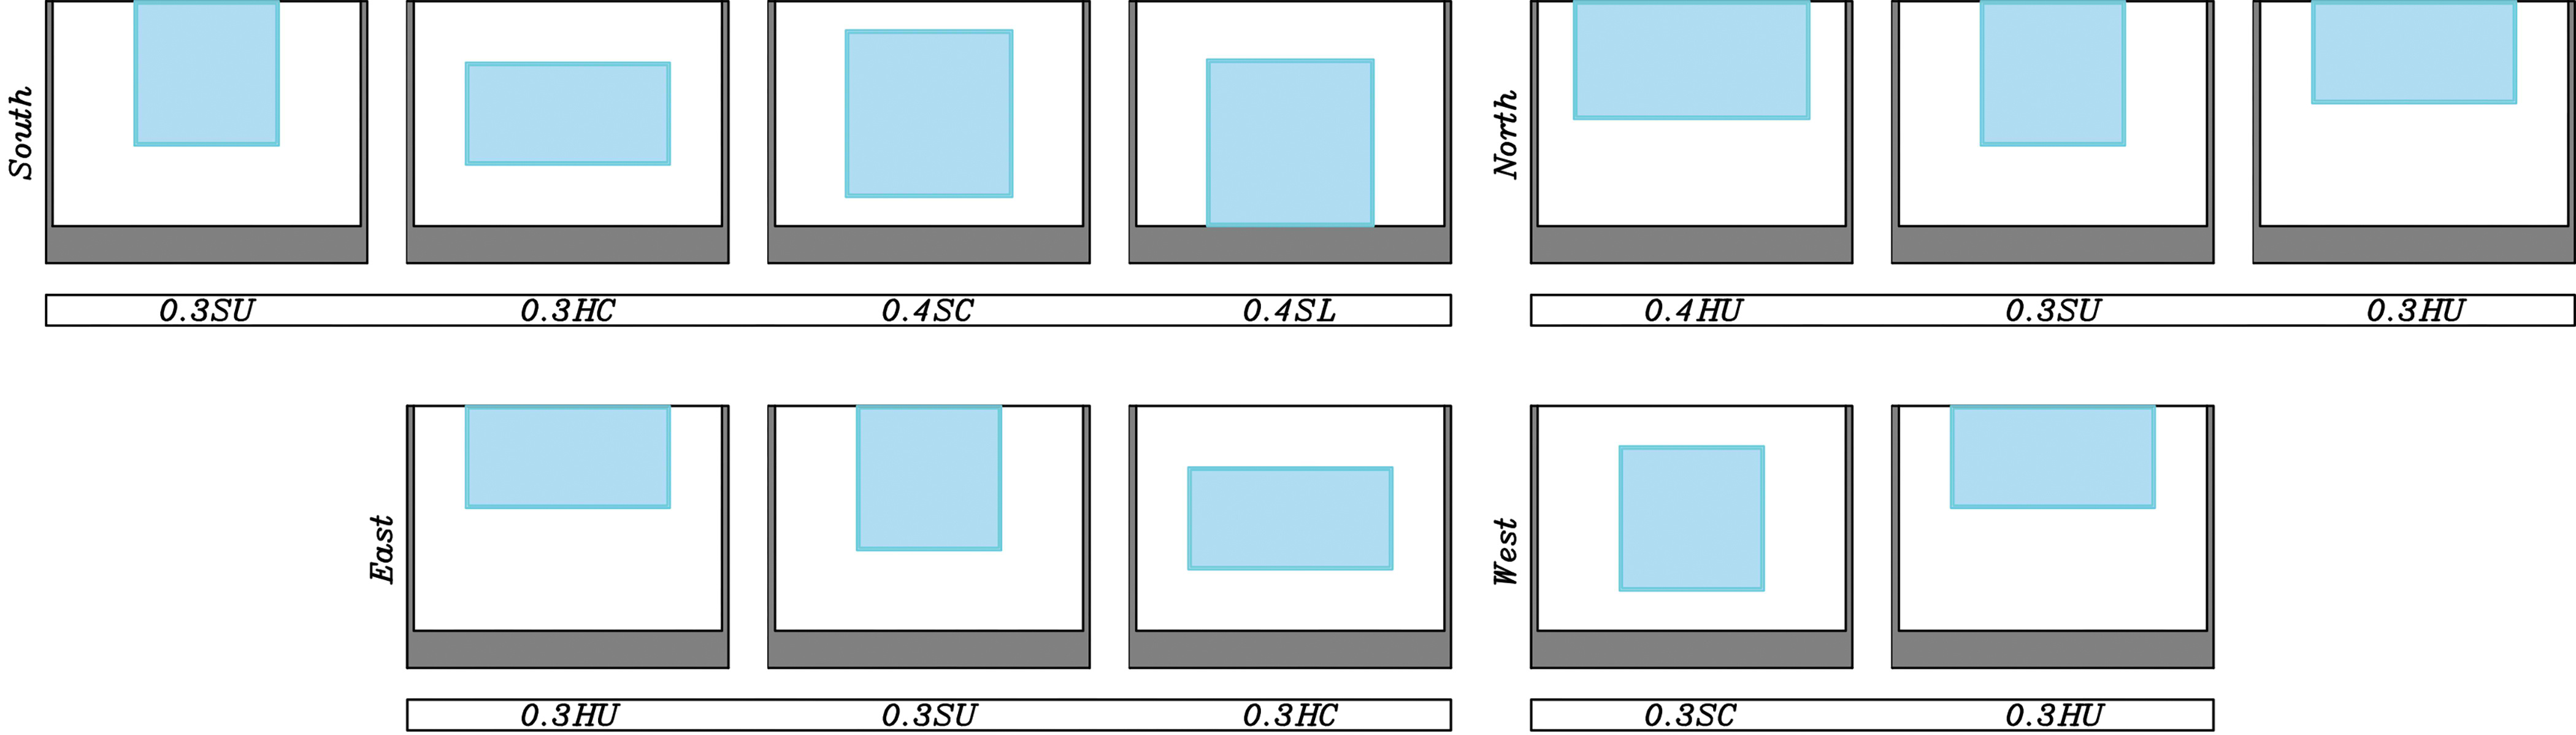
Fig. 8. The selected solutions for the main orientations.
Table 7
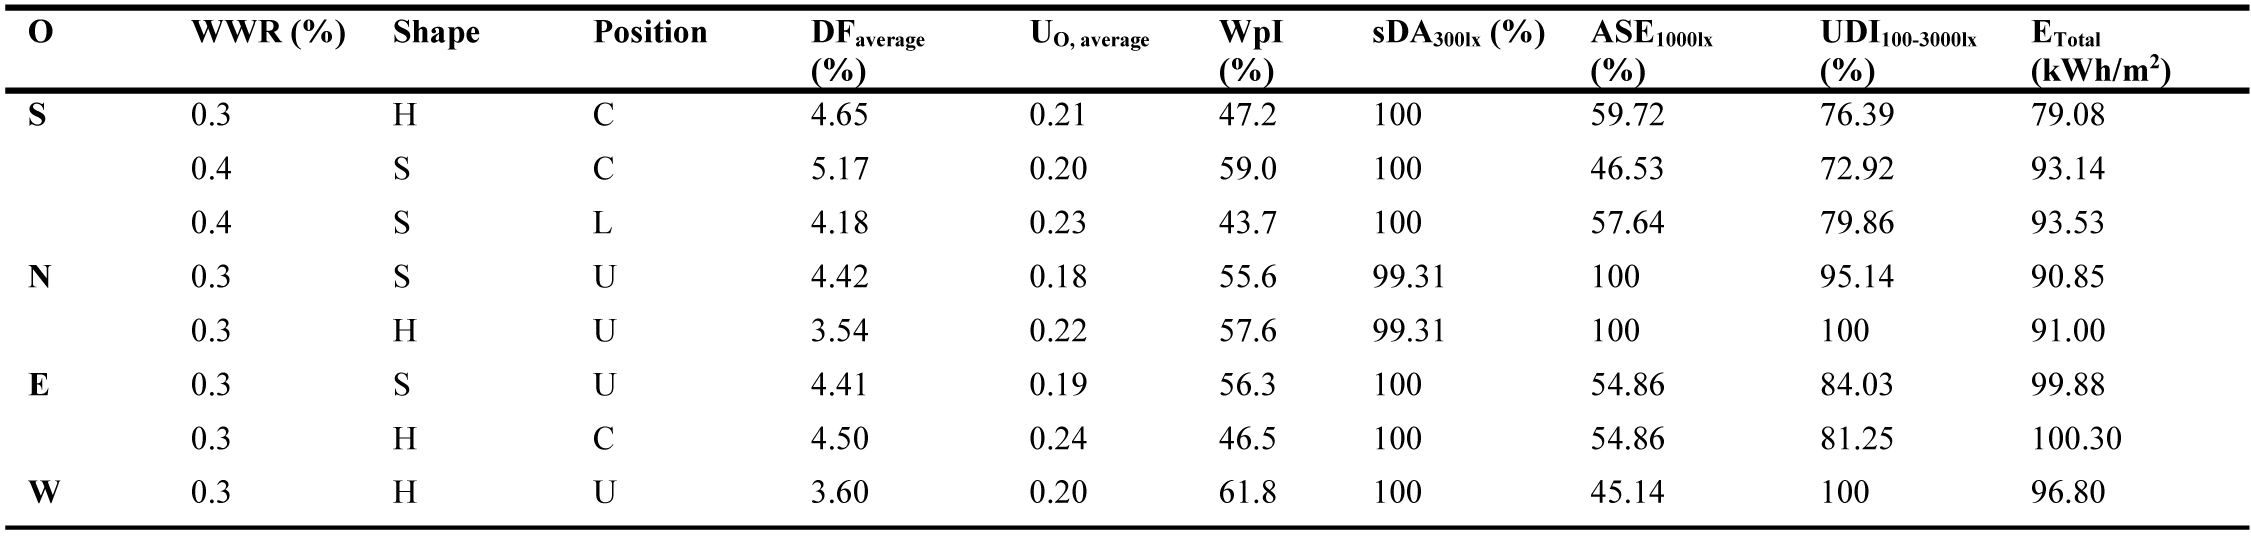
Table 7. Design solutions and their optimal values for different orientations.
3.4.1. Assessment of glare in optimal solutions
It was indicated [45] that exposure to direct sunlight exceeding 1000lux/250h leads to the potential of visual discomfort in space. Accordingly, the ASE was assessed [51] as an adequate criterion for glaring within the nearly zero-energy building commercial-office building equipped with LEED Platinum certification. The obtained results from comparatively analyzing simulation data and field measurements at a San Francisco-based office indicated various amounts of ASE concerning the annual DGP (daylight glare probability), and the ASE provided no valid glare approach in terms of the occupants’ experiences. Accordingly, the DGP index was adopted to assess discomfort glare observed in optimal solutions within this study, the details of which are addressed as follows.
Glare caused by indoor excessive natural or artificial illuminance leads to visual disturbance and the discomfort of the person present in the area [52], which is clearly detectable in space. However, the occupants’ sense of discomfort caused by glare is somewhat a subjective phenomenon closely related to the occupants’ comfort in the area [53]. DGI (daylight glare index) is used for large-source glare caused by windows, and its values are measured by several levels of disturbance resulting from glare, which is accepted with a 22% threshold [54]. Another indicator for the evaluation is DGP, which is defined as a local, short-term, one-tailed index. This criterion is perceived by the observer. The received EV for evaluating the level of illuminance represents a strong correlation in the occupants’ response to glare [55].
Glaring refers to the excessive luminance of natural and electric lighting, which disrupts the occupants’ observation of a luminous environment. It can lead to either discomfort or the loss of visual performance and visibility [52]. Different criteria exist for measuring room glaring. In this study, the DGP index was used to assess the occupants’ risk of glaring. For this purpose, DGP benchmarking was documented indoors using the Honeybee 0.0.64 in Grasshopper for optimal solutions [41]. In Fig. 9, the glare assessment is conducted indoors based on March 21st data (per maximum hours of diffusing radiation observed during the month) under the same conditions and the field of view directly facing outdoors at 9 a.m., 12 p.m., and 3 p.m. By definition [56], perceptible glare is discerned in the eastern façade at 9 a.m. while disturbing glare is observed within the area in the southern and western directions at 12 and 3 p.m., respectively. Accordingly, this discomfort can be managed with louvres or slatted blinds.
Figure 9
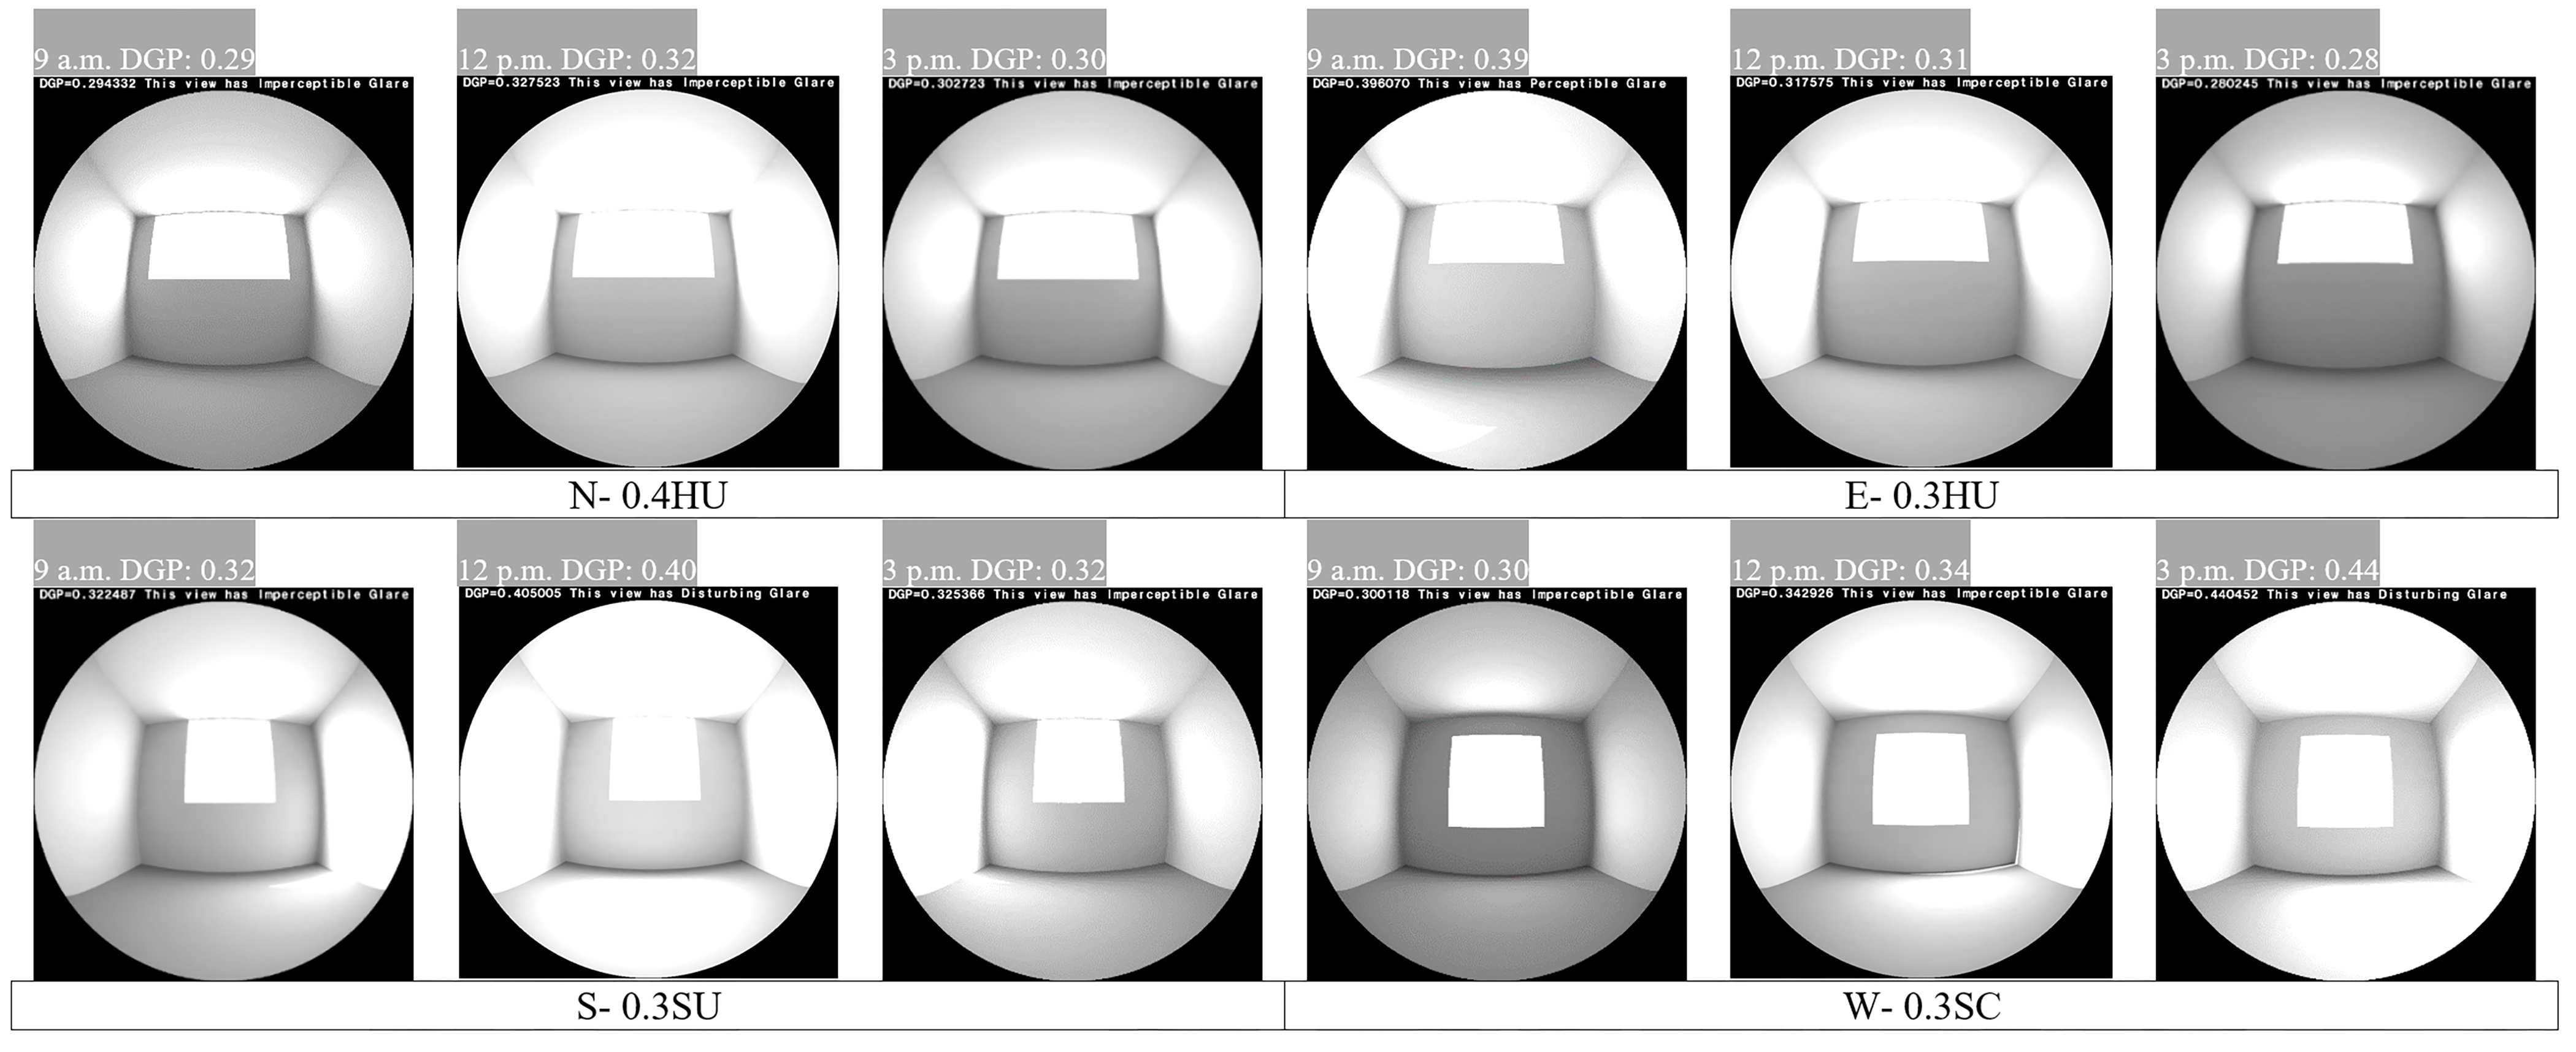
Fig. 9. The visualization of optimal patterns according to the DGP index.
4. Discussion
According to a previous study based on the WFR in the climate of Mediterranean summer (CSa) and the continental arid summer (DSa) (Köppen–Geiger classification system), the horizontal window was the best in these two climates [57]. According to research [58], square windows were not approved by users in office spaces. The preferences of users of these spaces were first based on the WWR and the horizontal windows and then on the square windows and other types of windows in the next step. In this study, horizontal windows in the central position have the lowest energy consumption compared with the square windows in the central position. This was proved in a similar study [59]. Another study showed that continuous horizontal windows on the west and east orientations are better than separate horizontal or other types of windows [60]. The results of the present study confirm that the office windows with 30% WWR have the lowest energy on the east and west orientations.
A study on the multi-objective optimization methodology for window design showed the best design solution is 40% WWR. Although the satisfaction of the visual performance is not enough, it has the lowest energy consumption [61]. In the present study, the optimal window on the south orientation of the office building is the square window with 40% WWR in the central position.
The work plane is an important factor in the daylight satisfaction of space users. The windows sill height of less than 76 cm (distance from the ground) does not have a direct impact on the results because the second factor is the light reflection from the surfaces, which can increase the illumination of the room. The sill height and window distance from the plane play an important role in daylight satisfaction. In this paper, sill heights are considered differently, however, all models are simulated with the same conditions in the distance from the window to the plane. In this study, the window sill height in the south orientation is mostly in the central position with a height of 0.76 and 0.36 m. Moreover, all the window sill heights in the north orientation are in the upper position with heights of 1.01, 1.34, 1.53 m and they are in the upper position with a height of 1.53 and 1.01 m in the east.
5. Conclusions and results
In this study, all modes are built by manipulating variables such as WWR, shape, position, and orientation (180 scenarios). They are incorporated into DesignBuilder software to achieve optimal characteristics while reducing annual energy consumption and proper daylight performance to maintain visual comfort. The optimal pattern is presented by filtering a set of design solutions to meet the requirements. There are no constraints in this method and the designer can evaluate many input and output variables to find the optimal values. Optimal solutions are then obtained for each orientation and the information is provided for the designers. Hence, they can select the appropriate solution while controlling their effective factors and maintaining high efficiency.
The optimal solutions are determined for each orientation. For the north face window, where 40% WWR is a good selection based on LEED v4 and LEED v2. According to the efficiency of variables, 30% WWR with square and horizontal shapes in the upper and central positions is the proposed method for other orientations based on the relationships between the variables. However, there is still a demand for daylight quality in the uniformity metric. In the presence of other indices such as DGP, different solutions will be found to control the glaring. In the south orientation, energy consumption increases by more than 15% annually when WWR increases while visual performance demonstrates no significant change in the presence of sDA, UDI, the uniformity ratio, and ADF. Based on dynamic and static daylight criteria for the south orientation, window with 30% WWR, horizontal shape in the central position, and 40% WWR, square shape in the central and lower positions is the best design choice. The optimal east-facing window is 30% WWR, square and horizontal shapes in the upper and central positions, respectively. The best design solution for the west orientation is the window with 30% WWR, horizontal shape in the upper position.
If all orientations are considered, the values of ADF, sDA, and UDI meet the acceptable range of daylight criteria. In contrast, ASE, illuminance uniformity, and Wp illuminance (LEED v2) indices should be improved. Moreover, the selection of solutions based on the ASE and illumination of Wp under intermediate conditions (neither better nor worse) are put in the first mode except for the north façade. In terms of energy consumption performance of 0.3 WWR, the south orientation is the lowest and gradually increased to the level previously studied in the eastern façade. Moreover, the horizontal slice section of the room cannot compare the daylight performance between orientations and it requires other illumination indices.
Considering window variables, annual energy consumption values, and daylighting indices, the findings of the present study (a case study of the office building) are useful tools for building efficiency and improving the quality of the indoor environment. The designers can provide an optimized window design to reduce the consumption of electricity and natural gas and consider the use of indoor daylight by taking into account the façade of the building. The convenience of jEplus + EA is one of the features provided by the DesignBuilder simulation method. This method is positively efficient in multi-objective optimization as a result of the presence of genetic algorithms and taking less time. This simulation method was abandoned in this study owing to some input variables (including window shape also affecting WWR) that are not parametrically supported.
With the development of the building according to the evaluated criteria in the field of daylight and energy consumption, several designs can be employed in this regard to increase the efficiency of the building. In this way, the present results can be directly applied to the building to achieve daylight efficiency and productivity by developing data in each location. Finally, the performance of louvers, shading, and similar elements can be evaluated using the optimal values of the window to achieve LEED v4.
Acknowledgment
This research received no specific grant from any funding agency in the public, commercial, or not-for-profit sectors.
Contributions
The authors contributed equally.
Declaration of competing interest
The authors declares that there is no conflict of interest.
References
- A.S. Muhaisen, H.R. Dabboor, Studying the Impact of Orientation, Size, and Glass Material of Windows on Heating and Cooling Energy Demand of the Gaza Strip Buildings, Architecture and Planning 27 (2013) 1-15.
- F. Goia, M. Haase, M. Perino, Optimizing the configuration of a façade module for office buildings by means of integrated thermal and lighting simulations in a total energy perspective, Applied Energy 108 (2013) 515-527. https://doi.org/10.1016/j.apenergy.2013.02.063
- C.E. Ochoa, M.B. Aries, E.J. van Loenen, J.L. Hensen, Considerations on design optimization criteria for windows providing low energy consumption and high visual comfort, Applied Energy 95 (2012) 238-245. https://doi.org/10.1016/j.apenergy.2012.02.042
- F. Bagheri, V. Mokarizadeh, M. Jabbar, Developing energy performance label for office buildings in Iran, Energy and Buildings 61 (2013) 116-124. https://doi.org/10.1016/j.enbuild.2013.02.022
- G. Karamnia, F. Amini, N. Kaveh, P. Soleimanpoor, L.S. fattahi, N. golghahramani, M. khodi, M. Tavanpoor, M. ghormad, Kh. Kazemi, M. Eghlimi, M. Sharifi, V. Arianpour, Energy Balance for Iran, Office of Comprehensive Energy Planning, ed. 1st, Ministry of Energy, Tehran, 2010.
- I.E. Agency, 25 Energy Efficiency Policy. 2011.
- S. Nikoofard, V.I. Ugursal, I. Beausoleil-Morrison, Effect of window modifications on household energy requirement for heating and cooling in Canada, in: The Canadian Conference on Building Simulation, 2012, PP. 324-337. https://doi.org/10.1016/j.enbuild.2011.03.003
- M.H. Oh, K.H. Lee, J.H. Yoon, Automated control strategies of inside slat-type blind considering visual comfort and building energy performance, Energy and Buildings 55 (2012) 728-737. https://doi.org/10.1016/j.enbuild.2012.09.019
- R.P. Leslie, L. Radetsky, A. Smith, Conceptual design metrics for daylighting, Lighting Research & Technology 44 (2012) 277-290. https://doi.org/10.1177/1477153511423076
- H. Arsenault, M. Hébert, M.-C. Dubois, Effects of glazing colour type on perception of daylight quality, arousal, and switch-on patterns of electric light in office rooms, Building and environment 56 (2012) 223-231. https://doi.org/10.1016/j.buildenv.2012.02.032
- A. Chen, Cool Colors Project: Improved Materials for Cooler Roofs, 2015, 2004; Available from: http://eetd.lbl.gov/newsletter/nl19/. zzzzzzzzzzz
- R. Alghamedi, M. Vasiliev, M. Nur-E-Alam, K. Alameh, Spectrally-selective all-inorganic scattering luminophores for solar energy-harvesting clear glass windows, Scientific reports 4 (2014) 32-66. https://doi.org/10.1038/srep06632
- T. de Rubeis, I. Nardi, M. Muttillo, S. Ranieri, D. Ambrosini, Room and window geometry influence for daylight harvesting maximization–Effects on energy savings in an academic classroom, Energy Procedia 148 (2018) 1090-1097. https://doi.org/10.1016/j.egypro.2018.08.050
- I. Acosta, M.Á. Campano, J.F. Molina, Window design in architecture: Analysis of energy savings for lighting and visual comfort in residential spaces, Applied Energy 168 (2016) 493-506. https://doi.org/10.1016/j.apenergy.2016.02.005
- I. Acosta, M.Á. Campano, S. Domínguez-Amarillo, C. Muñoz, Dynamic Daylight Metrics for Electricity Savings in Offices: Window Size and Climate Smart Lighting Management, Energies 11(11) (2018) 31-43. https://doi.org/10.3390/en11113143
- M.A. Fasi, I.M. Budaiwi, Energy performance of windows in office buildings considering daylight integration and visual comfort in hot climates, Energy and Buildings 108 (2015) 307-316. https://doi.org/10.1016/j.enbuild.2015.09.024
- J.-M. Dussault, L. Gosselin, Office buildings with electrochromic windows: A sensitivity analysis of design parameters on energy performance, and thermal and visual comfort, Energy and Buildings 153 (2017) 50-62. https://doi.org/10.1016/j.enbuild.2017.07.046
- R.A. Mangkuto, M. Rohmah, A.D. Asri, Design optimisation for window size, orientation, and wall reflectance with regard to various daylight metrics and lighting energy demand: A case study of buildings in the tropics, Applied Energy 164 (2016) 211-219. https://doi.org/10.1016/j.apenergy.2015.11.046
- S. Vaisi, F. Kharvari, Evaluation of Daylight regulations in buildings using daylight factor analysis method by radiance, Energy for Sustainable Development 49 (2019) 100-108. https://doi.org/10.1016/j.esd.2019.02.002
- Y. Sun, K. Shanks, H. Baig, W. Zhang, X. Hao, Y. Li, B. He, R. Wilson, H. Liu, S. Sundaram, Integrated semi-transparent cadmium telluride photovoltaic glazing into windows: Energy and daylight performance for different architecture designs, Applied Energy 231 (2018) 972-984. https://doi.org/10.1016/j.apenergy.2018.09.133
- K.A. Al-Sallal, A.R. AbouElhamd, M.B. Dalmouk, UAE heritage buildings converted into museums: Evaluation of daylighting effectiveness and potential risks on artifacts and visual comfort, Energy and Buildings 176 (2018) 333-359. https://doi.org/10.1016/j.enbuild.2018.06.067
- S.K. Alghoul, H.G. Rijabo, M.E. Mashena, Energy consumption in buildings: A correlation for the influence of window to wall ratio and window orientation in Tripoli, Libya, Journal of Building Engineering 11 (2017) 82-86. https://doi.org/10.1016/j.jobe.2017.04.003
- F. Goia, Search for the optimal window-to-wall ratio in office buildings in different European climates and the implications on total energy saving potential, Solar Energy 132 (2016) 467-492. https://doi.org/10.1016/j.solener.2016.03.031
- Z. Djamel, Z. Noureddine, The Impact of Window Configuration on the Overall Building Energy Consumption under Specific Climate Conditions, Energy Procedia 115 (2017) 162-172. https://doi.org/10.1016/j.egypro.2017.05.016
- S. Kim, P.A. Zadeh, S. Staub-French, T. Froese, B.T. Cavka, Assessment of the impact of window size, position and orientation on building energy load using BIM, Procedia Engineering 145 (2016) 1424-1431. https://doi.org/10.1016/j.proeng.2016.04.179
- T.M. Echenagucia, A. Capozzoli, Y. Cascone, M. Sassone, The early design stage of a building envelope: Multi-objective search through heating, cooling and lighting energy performance analysis, Applied Energy 154 (2015) 577-591. https://doi.org/10.1016/j.apenergy.2015.04.090
- C. Reinhart, T. Rakha, D. Weissman, Predicting the daylit area—a comparison of students assessments and simulations at eleven schools of architecture, Leukos 10(4) (2014) 193-206. https://doi.org/10.1080/15502724.2014.929007
- A. Nezamdoost, K. Van Den Wymelenberg, A daylighting field study using human feedback and simulations to test and improve recently adopted annual daylight performance metrics, Journal of Building Performance Simulation 10(5-6) (2017) 471-483. https://doi.org/10.1080/19401493.2017.1334090
- C.F. Reinhart, D.A. Weissman, The daylit area–Correlating architectural student assessments with current and emerging daylight availability metrics, Building and environment 50 (2012) 155-164. https://doi.org/10.1016/j.buildenv.2011.10.024
- Z.S. Zomorodian, M. Tahsildoost, Assessing the effectiveness of dynamic metrics in predicting daylight availability and visual comfort in classrooms, Renewable Energy 134 (2019) 669-680. https://doi.org/10.1016/j.renene.2018.11.072
- U.S. Green Building Council, LEED-NC Green Building Rating System for New Construction & Major Renovations, Version 2.2, USGBC, 2005.
- U.S. Green Building Council, NC-2009 IEQc8.1: Daylight and Views-Daylight, USGBC (2009).
- A. Maleki, N. Dehghan, Optimization of energy consumption and daylight performance in residential building regarding windows design in hot and dry climate of Isfahan, Science and Technology for the Built Environment (2020) 1-16. https://doi.org/10.1080/23744731.2020.1812294
- P.a.B. Organization, design code for office building 1998, Planning and Budget Organization: tehran. p. 17.
- K. Alhagla, A. Mansour, R. Elbassuoni, Optimizing windows for enhancing daylighting performance and energy saving, Alexandria Engineering Journal 58 (2019) 283-290. https://doi.org/10.1016/j.aej.2019.01.004
- C.F. Reinhart, J.A. Jakubiec, D. Ibarra, Definition of a reference office for standardized evaluations of dynamic façade and lighting technologies, in: 13th Conference of International Building Performance Simulation Association, 2013, PP. 3645-3652, Chambéry, France.
- J.N. Holst, Using whole building simulation models and optimizing procedures to optimize building envelope design with respect to energy consumption and indoor environment, in: Eigth International Conference, 2003.
- A. Fathalian, H. Kargarsharifabad, Actual validation of energy simulation and investigation of energy management strategies (Case Study: An office building in Semnan, Iran), Case studies in thermal engineering 12 (2018) 510-516. https://doi.org/10.1016/j.csite.2018.06.007
- M. Baharvand, A. Hamdan, M. Abdul, DesignBuilder verification and validation for indoor natural ventilation, Journal of Basic and Applied Scientific Research 3(4) (2013) 8.
- W.K. Alhuwayil, M.A. Mujeebu, A.M.M. Algarny, Impact of external shading strategy on energy performance of multi-story hotel building in hot-humid climate, Energy 169 (2019) 1166-1174. https://doi.org/10.1016/j.energy.2018.12.069
- F. Kharvari, An empirical validation of daylighting tools: Assessing radiance parameters and simulation settings in Ladybug and Honeybee against field measurements, Solar Energy 207 (2020) 1021-1036. https://doi.org/10.1016/j.solener.2020.07.054
- G. CIBSE, Weather, solar and illuminance data, Chartered Institution of Building Services Engineers (2002).
- C. EN, 12464-1-Light and lighting-Lighting of work places-Part 1: Indoor work places. 2011, Brussels. https://doi.org/10.3403/30206727
- H. Lee, G. Jeon, J. Seo, Y. Kim, Daylighting performance improvement of a light-shelf using diffused reflection, Indoor and Built Environment 26(5) (2017) 717-726. https://doi.org/10.1177/1420326x16631144
- I. IESNA, LM-83-12 IES Spatial Daylight Autonomy (sDA) and Annual Sunlight Exposure (ASE), New York, NY, USA: IESNA Lighting Measurement (2012).
- U.S. Green Building Council, LEED Reference guide for guilding design and construction. Version 4, USGBC Inc (2013).
- J. Mardaljevic, M. Andersen, N. Roy, J. Christoffersen, Daylighting metrics: is there a relation between useful daylight illuminance and daylight glare probabilty?, in: Proceedings of the building simulation and optimization conference BSO12, 2012.
- A. Nabil, J. Mardaljevic, Useful daylight illuminances: A replacement for daylight factors, Energy and buildings 38(7) (2006) 905-913. https://doi.org/10.1016/j.enbuild.2006.03.013
- D.A. Chi, D. Moreno, P.M. Esquivias, J. Navarro, Optimization method for perforated solar screen design to improve daylighting using orthogonal arrays and climate-based daylight modelling, Journal of Building Performance Simulation 10(2) (2017) 144-160. https://doi.org/10.1080/19401493.2016.1197969
- T. Tomasetti, Design Explorer, 2019; Available from: http://tt-acm.github.io/DesignExplorer.
- G. Dutra de Vasconcellos, Evaluation of Annual Sunlight Exposure (ASE) as a Proxy to Glare: A Field Study in a NZEB and LEED Certified Office in San Francisco, (2017).
- I. IESNA, The Lighting handbook, in Illuminating Engineering Society of North America. 2000, IESNA New York: New York (USA).
- C.F. Reinhart, J. Wienold, The daylighting dashboard–A simulation-based design analysis for daylit spaces, Building and environment 46(2) (2011) 386-396. https://doi.org/10.1016/j.buildenv.2010.08.001
- P. Chauvel, J. Collins, R. Dogniaux, J. Longmore, Glare from windows: current views of the problem, Lighting Research and Technology 14(1) (1982) 31-46. https://doi.org/10.1177/096032718201400103
- J. Wienold, J. Christoffersen, Towards a new daylight glare rating, Lux Europa, Berlin (2005) 157-161.
- J. Wienold, J. Christoffersen, Evaluation methods and development of a new glare prediction model for daylight environments with the use of CCD cameras, Energy and Buildings 38(7) (2006) 743-757. https://doi.org/10.1016/j.enbuild.2006.03.017
- F. Kharvari, A Field-validated Multi-objective Optimization of the Shape and Size of Windows Based on Daylighting Metrics in Hot-summer Mediterranean and Dry Summer Continental Climates, Journal of Daylighting 7 (2020) 222-237. https://doi.org/10.15627/jd.2020.19
- I.T. Dogrusoy, M. Tureyen, A field study on determination of preferences for windows in office environments, Building and Environment 42(10) (2007) 3660-3668. https://doi.org/10.1016/j.buildenv.2006.09.010
- E. Negev, A. Yezioro, M. Polikovsky, A. Kribus, J. Cory, L. Shashua-Bar, A. Golberg, Algae Window for reducing energy consumption of building structures in the Mediterranean city of Tel-Aviv, Israel, Energy and Buildings 204 (2019) 109-460. https://doi.org/10.1016/j.enbuild.2019.109460
- T. Ashrafian, N. Moazzen, The impact of glazing ratio and window configuration on occupants’ comfort and energy demand: The case study of a school building in Eskisehir, Turkey, Sustainable Cities and Society 47 (2019) 101-483. https://doi.org/10.1016/j.scs.2019.101483
- Y. Zhai, Y. Wang, Y. Huang, X. Meng, A multi-objective optimization methodology for window design considering energy consumption, thermal environment and visual performance, Renewable Energy 134 (2019) 1190-1199. https://doi.org/10.1016/j.renene.2018.09.024
Copyright © 2021 The Author(s). Published by solarlits.com.

SHARE ON


