Volume 8 Issue 1 pp. 50-64 • doi: 10.15627/jd.2021.4
Comparative Study on Computer Simulation of Solar Shading Performance with Heliodon and Artificial Sky
David B. Dalumo,a Yaik-Wah Lim*,a,b
Author affiliations
a Faculty of Built Enviroment and Surveying, Universiti Teknologi Malaysia (UTM), Malaysia
b Centre for the Study of Built Environment in the Malay World (KALAM), Institute for Smart Infrastructure and Innovative Construction (ISIIC), UTM, Malaysia
*Corresponding author.
b.dalumo@graduate.utm.my (D. B. Dalumo)
lywah@utm.my (Y.-W. Lim)
History: Received 08 November 2020 | Revised 6 January 2021 | Accepted 11 January 2021 | Published online 25 January 2021
Copyright: © 2021 The Author(s). Published by solarlits.com. This is an open access article under the CC BY license (http://creativecommons.org/licenses/by/4.0/).
Citation: David B. Dalumo, Yaik-Wah Lim, Comparative Study on Computer Simulation of Solar Shading Performance with Heliodon and Artificial Sky, Journal of Daylighting 8 (2021) 50-64. https://dx.doi.org/10.15627/jd.2021.4
Figures and tables
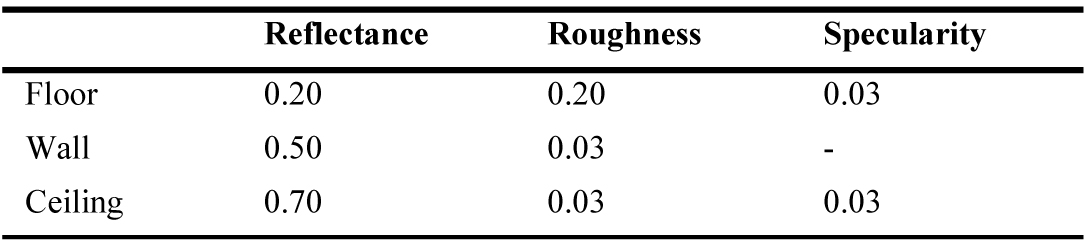 Table 1
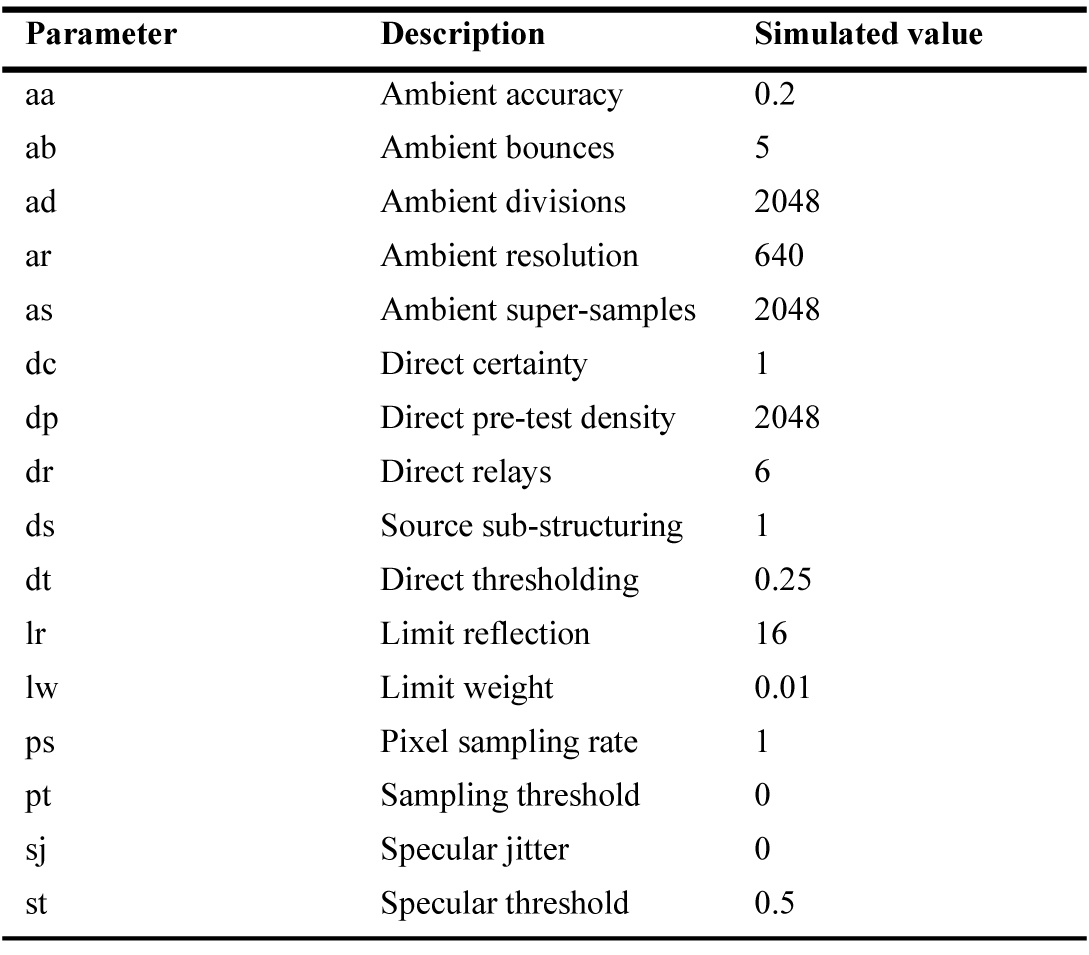 Table 2
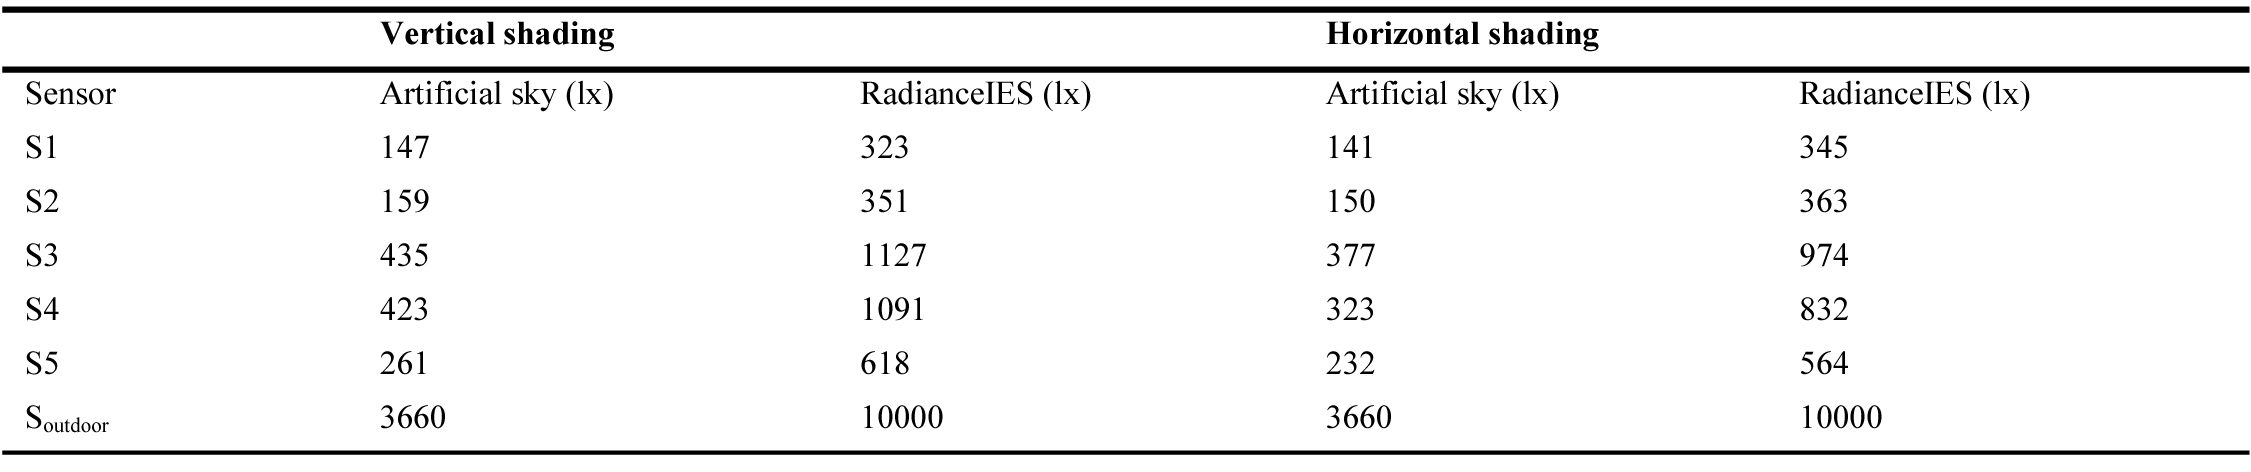 Table 3
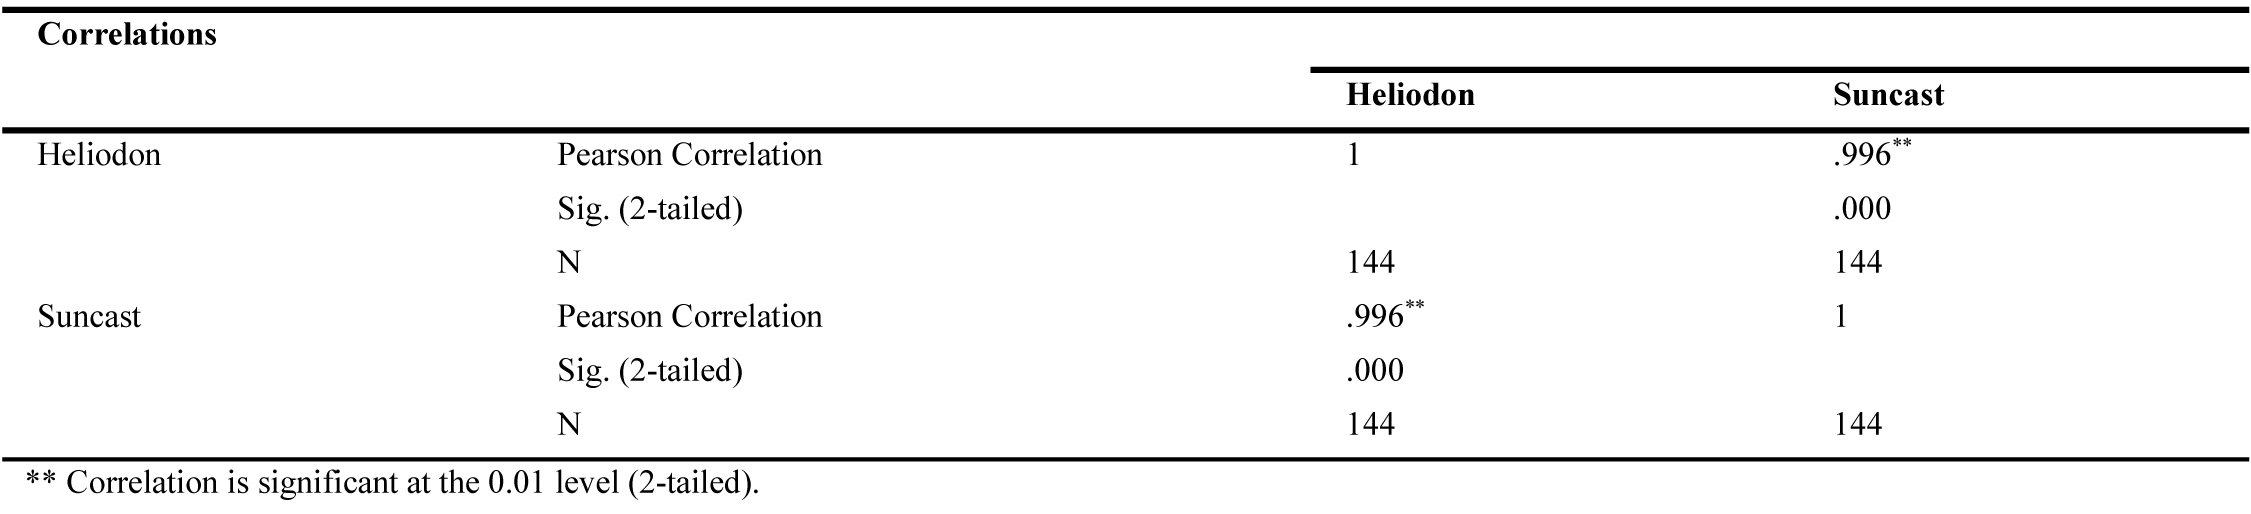 Table 4
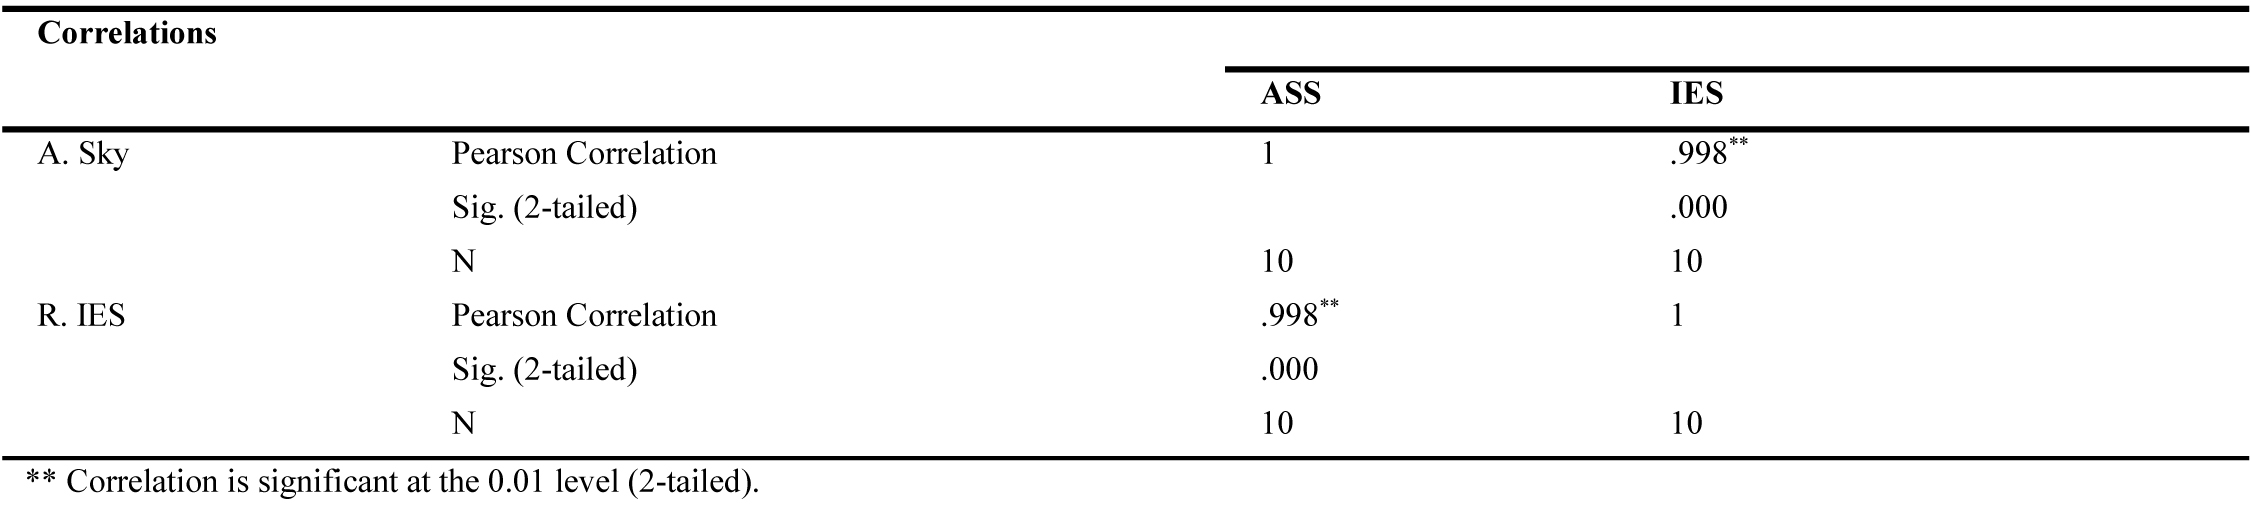 Table 5
Abstract
Current technological advancement and the requirement for sustainability-driven practices has birthed increased demands for accuracy in performance and assessment of energy consumption in the built environment. Energy-efficient and sustainable building projects are to large extents dependent on achieving functional solar shading and sufficient daylighting in building interiors. Hence, the understanding and adequate evaluation of the sun and its dynamic influence on buildings right at the early stage of planning and design is essential for the development of performance-driven building designs. In this study, the performance simulation results of Integrated Environmental Solutions <Virtual Environment> software program modules are examined for accuracy in executing performance analysis of solar shading. This study assesses the shading prediction of Suncast; a virtual solar shading calculation tool, and RadianceIES for measuring daylight availability in a tropical climate region. The evaluation of shading performance with Suncast was validated through physical experiment by comparing the results obtained therein with shading analysis outcomes generated on a scale model with the aid of a heliodon. Likewise, RadianceIES daylighting simulations were compared with measurements realised from an artificial sky simulator. The results were further subjected to correlation tests to determine the relationship between simulation and physical experiment results. The computational evaluation approach presented more efficient means of conducting the performance simulations over the physical experiment methods which were limited by mechanical design of the components. Suncast and RadianceIES simulation results presented comparable equivalence with measurement output acquired from the heliodon and artificial sky respectively, with minimal variations in accuracy. Thus, demonstrating the ability of the computational simulation program in accurately predicting solar shading and daylight performance in buildings, this could benefit architects in the proper and efficient design of shading devices for building facades at early design stages.
Keywords
Heliodon, Artificial sky, Suncast, RadianceIES
1. Introduction
The integration of large glazing surface areas on building facades increases the challenge of minimising solar radiation and its effects on the environment. Attaman [1], and Rahman et al. [2], posited that buildings globally expend almost 40% of the total energy generated in the ecosystem. In the hot and humid climate of Malaysia, office buildings were found to contribute up to 65% of overall energy consumption [3], which are channelled to the building mechanical cooling operations as a result of the extreme solar transmittance through openings. Integrating sun-shading devices on such critical facades can significantly minimise the severity of solar gains, however designers and architects having sufficient knowledge about the sun’s dynamism and the consequences on building designs is imperative for achieving comfortable indoor environment and optimum energy performance.
The advent of advanced computer software programs such as IES<VE>, DIVA, EnergyPlus [4], has encouraged the use of virtual means for studying the impact of environmental performance of solar shading on buildings especially in complex design instances. Nevertheless, physical measurement components provide a relatively basic approach to physically experiment and demonstrate the impact of environmental performance and passive strategies on building design in relation to the prevalent climatic conditions through all seasons of the year. This study incorporates the use of the heliodon and artificial sky simulator for early-stage assessment of solar shading and daylighting strategies for building design.
1.1. Heliodon
Heliodons by design replicates the position of the sun at a time or its movement path with reference to scale models placed on a horizontal surface representing a precise geographical location on earth with the aid of an attached light beam. There are diverse model designs of heliodon available beginning from the earliest version developed by Dufton and Beckett [5], followed by George Beal’s improved design [6]. Heliodons are usually characterised by the mobility of either the light source (sun) or reference plane (earth surface) as presented by Cheung et al., Doberneck & Knechtel, and Lechner [7-9]. The tilting horizontal plane design however is found to be lacking in the pragmatic simulation of the solar trajectory, thus inadequate for proper solar studies [9]. Figure 1 illustrates the design concept of the heliodon.
Figure 1
![Conceptual working diagram of the heliodon [10].](figures/8-50-1.jpg)
Fig. 1. Conceptual working diagram of the heliodon [10].
A typical modern heliodon (Fig. 2), also referred to as a ‘sun-emulator heliodon’, is made up of physical components which represent the variables for investigating the sun’s position relative to a location and time [11,12]. The components include:
- a fixed, horizontal reference platform representing the earth surface, where test models are placed and can be rotated in the different cardinal orientations
- light source with dedicated control switches that radiates onto the platform surface depicting the direction of sun beam to the building location
- 360° adjustable metal hoops fitted electric lamps (light source) emulating the solar geometry at different times and days of the year, and
- a double-ring bracket holding the metal hoops together that can be manually rotated (up to 90°) to various degrees of inclination representing the latitude of a geographical location. Attached to this is a latitude selector plate marked with latitudinal angles starting from the equator.
Figure 2
![Conceptual working diagram of the heliodon [10].](figures/8-50-2.jpg)
Fig. 2. Conceptual working diagram of the heliodon [10].
1.2. Artificial sky
For simulated sky environments, an artificial sky according to Hopkinson [13], proffers a controlled illumination method for the evaluation of scale models. The artificial sky is a sky simulator facility (Fig. 3) useful for quantitative and qualitative daylight analysis in addition to validating computer software programs. Rosato [14] and Mardaljevic [15], outlined the typical design description of an artificial sky simulator to be a box comprised of reflective interior walls (mirrors) to give initiate a sense of spatial infinity around the model. The interior is fitted with a lamp-lit horizontal ceiling to provide illumination calibrated to approximate luminance of the CIE overcast sky condition [16], which makes it suitable for determination of daylight factors. Furthermore, the sky simulator is rigged with illuminance sensors for data collection, which could be connected to a computer for digital sensors.
Figure 3
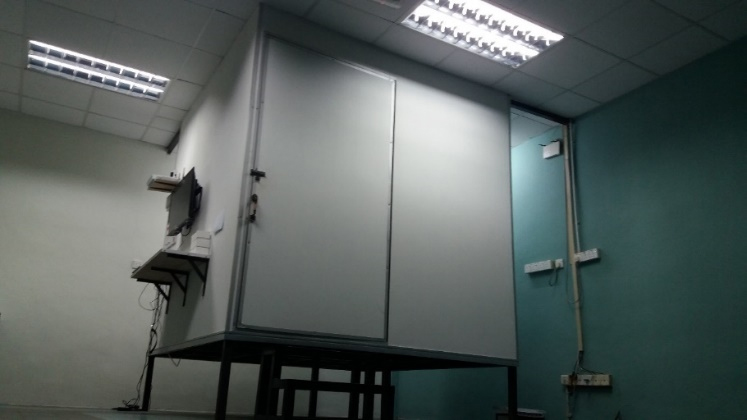
Fig. 3. Artificial sky simulator.
1.3. Integrated snvironmental solutions <virtual environment>
Building performance simulation tools has become the primary methods for achieving designs that enhances the environment and human comfort. In situations where complex models require performance analysis e.g. energy consumption, passive solar design appraisals, daylighting, renewable energy integration, indoor quality, sophisticated and complex simulation tools are most times necessary to save time and resources. Integrated Environmental Solutions <Virtual Environment> (IES<VE>) provides an encompassing list of building performance simulation tools for evaluating solar, lighting, energy performance and green rating evaluation of building designs thereby serving as a medium for processing different performance workflows in the built environment. Solar shading and daylight availability calculations can be implemented with the Suncast and RadianceIES simulation modules respectively.
1.3.1. Suncast
Suncast is the solar analysis module of IES-VE software program. It is useful for conducting rapid solar and shading studies ranging from simple to complex model forms at various design stages [17]. The operation is generally intuitive and interactive in visualisation and its analysis process is based on solar insolation and shadow generation from the sun at specific location, date and time acquired from an integrated weather database system. Suncast surface shading calculations output are produced in area (m2) or percent area options.
1.3.2. RadianceIES
Radiance is one of the prominent simulation tool employed by professionals in the architecture, engineering and construction (AEC) industry with a growing integration in other simulation tools [18-20]. It is a comprehensive daylighting performance prediction engine in interior spaces at preliminary design stages. Integrated into IES-VE as RadianceIES, it offers accurate virtual representation of environmental conditions using Apache engines and CIE standard skies for performance simulations. One of the benefits of RadianceIES is its fast and accurate simulation output for models ranging from simple to complex geometries and flexibility in selection of materials and scene geometries [21].
1.4. Study objective
The objective of this study is to evaluate and compare physical measurements and computational simulation of solar shading and daylighting results, by experimenting with a test office model with fixed vertical and horizontal shading devices.
2. Shading device performance parameters
In the design of shading systems, several environmental and computational variables are taken into consideration to deliver operational and performance-based solutions. Performance parameters are described as quantifiable characteristics that puts into context the functionality of shading systems. According to Johnsen and Watkins [22] in evaluating the performance of shading devices for occupants’ comfort, direct solar shading, illuminance, daylight factor, luminance, glare, privacy and security, outdoor visual are considered as requirements [9]. One or a combination of these requirements form the basis of effective shading device design in a bid to meet the demands of occupants.
The basic function of solar shading systems is to sufficiently regulate the internal penetration of solar radiation in buildings, by reducing its fractional range of transmittance. External shading provides excellent performance on glazed surfaces of the envelope towards effective shading control in hot and humid conditions. An appropriate shading strategy in such conditions should not only decrease but optimise solar gains in different seasons, and as well compensate for other solar energy-related parameters associated with its availability in the built environment, such as sufficient day-lit indoor environment.
2.1. Shading mask
The use of heliodon for solar shading predictions is proven to offer quite accurate results and effective solar shading design solutions in practice [10,23]. Solar shading calculations with the aid of a heliodon shows the periodic movement of the sun and the shadows cast on surfaces at different times of the day, which is similar to the actual sun-path over a given location. In the design of solar shading devices, shading masks are used to visualise and quantify areas shaded by solar shading elements. A shading mask is a horizontally projected replica of a sun path diagram [24] which in conjunction with a profile angle protractor, can be utilised for evaluating portions of a model which are visible or concealed as seen from the sky, through the generation of shadows cast by shading elements. The shadows cast are products of solar radiation on surfaces which portrays the sun position as angular components or shadow angles [25] namely: vertical and horizontal shadow angles. The Vertical Shadow Angle (VSA) is the trigonometric angle between the ground plane and the solar altitude, while the horizontal Shadow Angle (HSA) is described as the horizontal angle between a window pane normal and the sun azimuth.
Shading masks were used physically before the introduction of shading calculation tools in performance analysis tools and were not very effective in complex models. In modern simulation tools the concept of the shading mask is represented as segments of polygons which are computed for determining hourly fractions or percentages of shading on a surface efficiently. The VSA and HSA are relevant to the design of horizontal and vertical solar shading devices respectively and in shading device design, they can be used to define tilt angles of shading elements based on the position of the sun relative to time.
2.1.1. Methods of calculating shaded area
The resultant shaded area on a façade which is visually represented as shadows is essential in assessing the solar shading performance of shading devices. Calculations of shaded area cast by external shading devices are carried out using the cell method and the point method as described by Suji et al. [26]. The cell method involves the subdivision of the shaded surface into scaled units of cells for quantitative estimation of shadows over each of the cells. The total number of cells within the shaded surface covered by shadows is calculated to determine the shaded area. Furthermore, other derivations of the cell method exist which are the grid and bar methods [4]. These methods are basically similar to the cell method; the differences are only in the type of surface subdivision for shading calculations. The cell method is used for this validation experiment due to the practical approach and reasonable accuracy in evaluating the test model compared to the others.
2.2. Illuminance
Illuminance, measured in lux is defined as the amount of light intensity reaching a plane per unit area [27]. Illuminance is the simplest performance parameter that measures the quantity of the light on a surface such as a horizontal work plane in a building interior [28]. Illuminance of the interior space can be provided from daylighting and artificial (electric) lighting. However, the goal of shading design in office buildings is to admit natural light to provide the optimum illuminance level possible necessary for the executing tasks or activity in the specified space. Hence, work plane illuminance (WPI) provides an accurate evaluation of illumination for a working environment. It is the indoor illuminance at a horizontal reference point (work top/ plane), required to perform various tasks. Although the level of brightness in a space can be argued to be perceptible to different users, there are standards available for daylighting design in building spaces for various tasks. These standards ensure occupants obtain optimum illumination to run their operations over activity zones without compromising job productivity. In Malaysia, illuminance levels ranging from 300 to 400 lx are recommended as sufficient for paper-based tasks and computer use in office spaces [29].
2.3. Daylight factor
According to NBI [30], daylight factor (DF) is the ratio of indoor illuminance on a horizontal surface to the concurrent outdoor illuminance under overcast sky conditions. Shading systems constitute an integral part of the building envelope. They are designed to shield the indoor environment from adverse solar impact, but they also affect the availability of daylight indoors. Thus, the performance of shading devices subject to daylight availability could be evaluated using the DF metric. DF is one of the popularly used metrics for daylight potential as it shows the amount of outdoor illumination into the indoor space however, it does not take into consideration other sky conditions except for overcast sky thus, neglecting the effects of direct sunlight penetration [31]. In this study, DF is used as a performance metric to evaluate daylight availability in the test model’s interior. The DF standard in different regions present optimum ranges for indoor comfort based on extensive climate studies. According to MS 1525:2014, DF ranges of 1.0-3.5% are acceptable in office spaces.
Mathematically, the daylight factor is determined as a percentage, which is expressed with the equation:
where EI is the indoor illuminance; and E0 is the outdoor illuminance.
3. Methodology
The aim of the research is to validate computational simulation tools through physical measurement methods. This is achieved by evaluating the solar shading and daylighting performances of static vertical and horizontal shading elements on a multi-storey office building. IES<VE> simulation modules were used to carry out the digital performance assessment for the study objectives due to its efficient interoperability, in addition to its versatility in executing environmental performance studies within a standalone program [19].
The procedure is divided into two parts for evaluating solar shading and daylighting performance in the test model, as presented in the overall research design for the study (Fig. 4). The first section involves the experimental assessment and results comparison of solar shading prediction of computer simulations using Suncast program, and physical measurements with a sun-emulator heliodon across eight cardinal orientations. This assessment is conducted to calculate respective percentages of shaded areas on the exposed façade of the model.
Figure 4
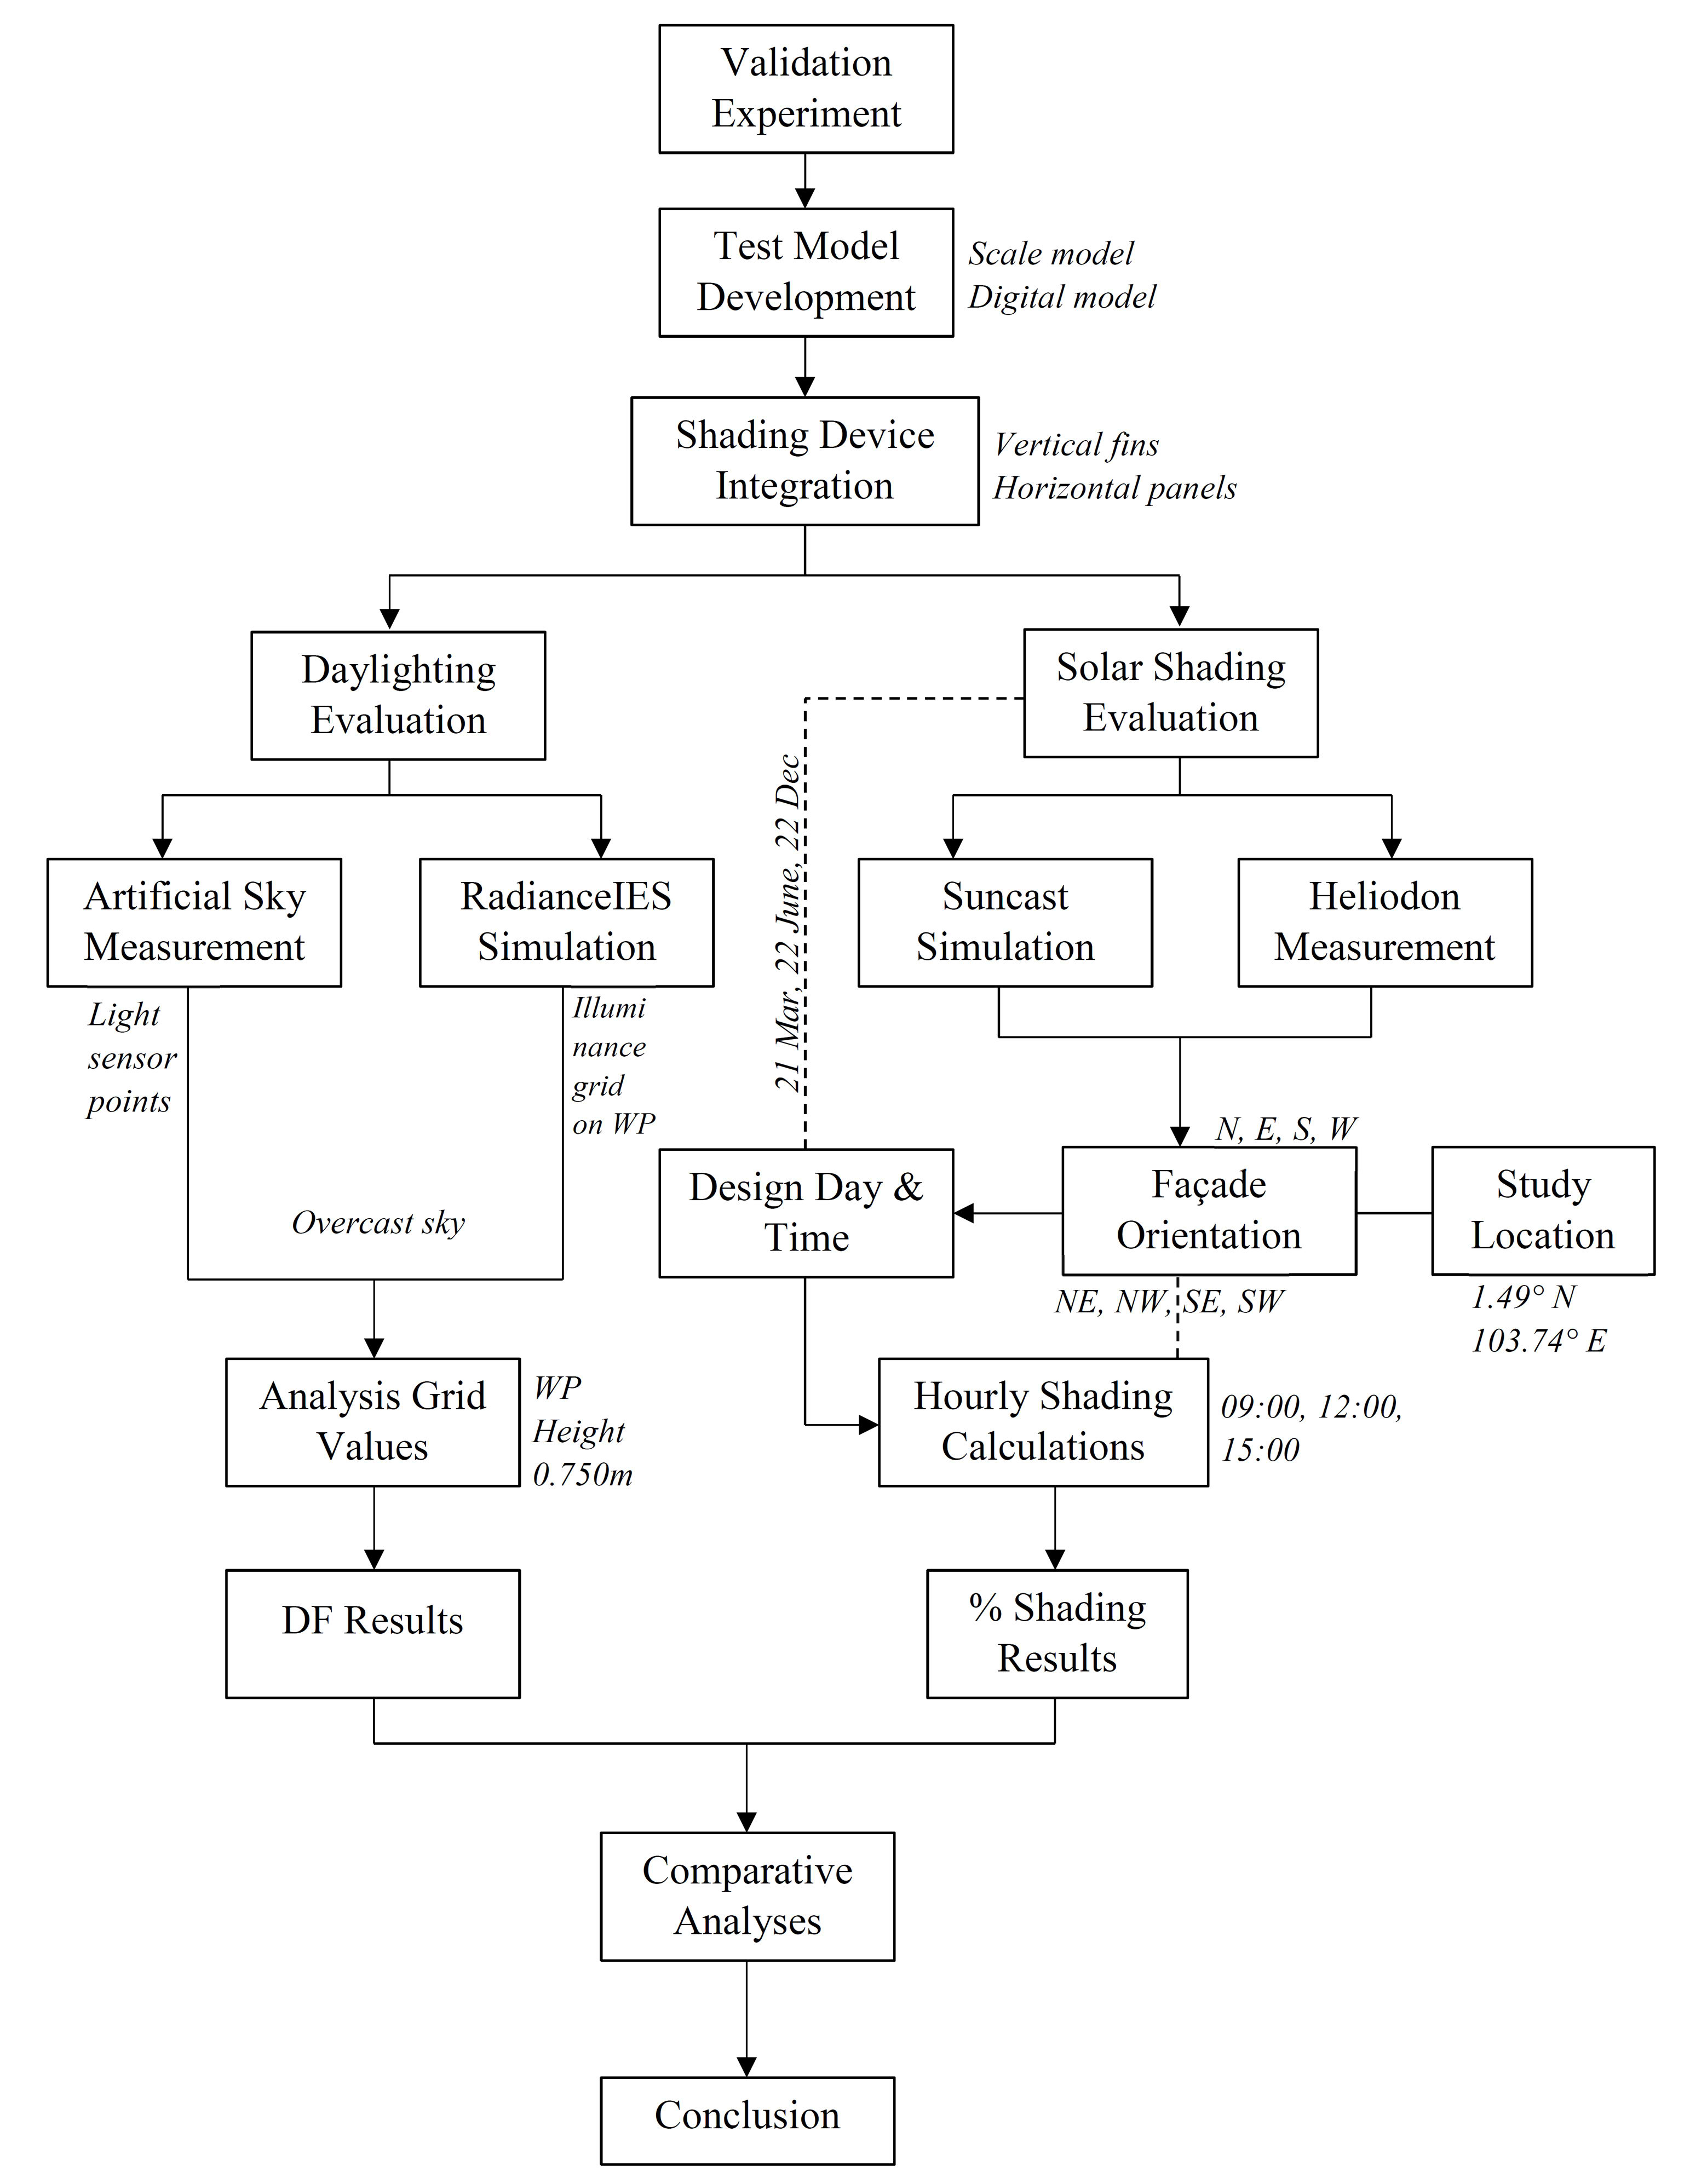
Fig. 4. Research design workflow.
The evaluations were carried out on three days respectively; 21st March, 22nd June and 22nd December of the year which are critical for solar design (March solar equinox, summer and winter solstices), and at three hours; 09:00, 12:00 and 15:00 accounting for different hours of the day (morning, noon, afternoon) and the average periods of building use. The second section compares the daylight factor evaluation results of the artificial sky and RadianceIES simulations. Furthermore, the results were subjected to regression analysis to determine the correlation between both evaluations using a linear regression model.
3.1. Test model
An office space with single glazed, window-wall façade bounded by walls on the sides is adopted for the procedure to depict the typical spatial configuration of multi-story open-plan office buildings in Malaysia [19,32,33]. The room measures 9 m by 6 m, with floor-to-ceiling height of 3m, with no consideration for furniture layout or occupancy density. The transparent envelope properties were adopted to depict the conventional façade design approach of existing multi-storey office buildings, and also to assume a worst-case scenario of exposure to radiation. Thus, the glazed façade has a 100% window-to- wall ratio (WWR) with visible light transmittance (VLT) of 0.9, spanning the entire width dimension of one of the perimeter walls. Fixed external shading elements with depths of 0.75 m and 0.60 m; positioned at a horizontal and vertical façade grid of 1.5 m and 1.2 m respectively, for horizontal and vertical shading (Fig. 5).
Figure 5
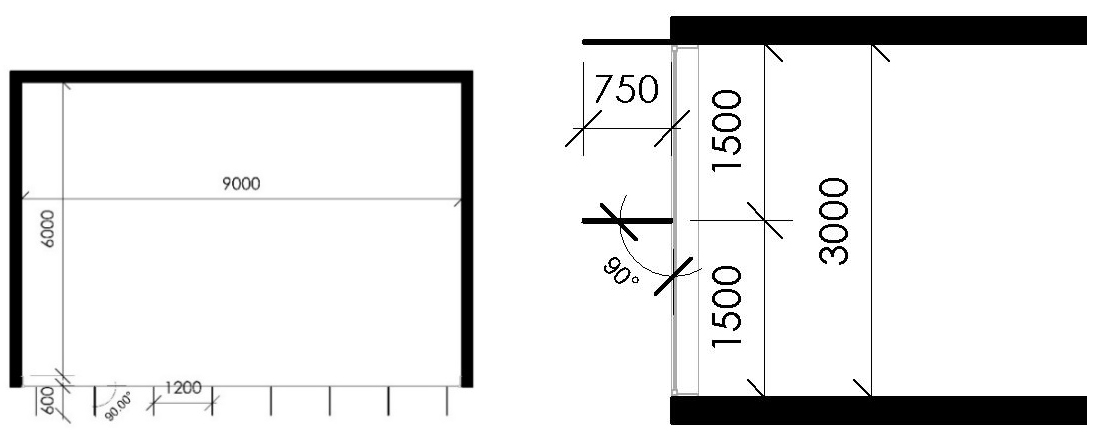
Fig. 5. Test model with (a) vertical fins (b) horizontal panels.
The building envelope surface properties adopted for the simulations were based on recommended values derived from IESNA [34], and previous studies related to the scope of the research [35,36]. The properties are presented in Table 1.
Table 1
Table 1. Surface properties of building envelope elements.
3.1.1. The scale model
The use of scale models affords designers opportunities to assess design decisions under real or simulated conditions [37-39]. Considering the dimensions of the adopted office model under evaluation, replicating the geometric and surface properties physically provides a detailed and realistic assessment of the validation tests. Hence, the adoption of a scale model is considered appropriate for the experiment. The scale model (Fig. 6) was developed out of boards on scale 1:25 mm, with similar surface properties as the test model through a deliberate assessment of the model materials for accurate replication of physical properties. Adequate precautions were also taken to ensure there were no light leaks into the model during the development and simulation processes.
Figure 6
Fig. 6. The scale model.
3.2. Study location
The building is situated in Johor Bahru, Malaysia, located close to the equator, lying on latitude 1.4927° N, and longitude 103.7414° E. The region is considered a tropical climate area characterised with hot and humid weather conditions with high intensity of solar radiation throughout the year as presented in Fig. 7. The building location is assumed to be clear of external obstructions such as vegetation and adjoining buildings.
Figure 7
![Average daily sunshine hours in Johor Bahru [39].](figures/8-50-7.jpg)
Fig. 7. Average daily sunshine hours in Johor Bahru [39].
3.3. Physical measurement procedure
3.3.1. Solar shading performance evaluation
The heliodon employed for this study (Fig. 2), is a manually operated sun-emulator heliodon which requires no dome for solar and shading analysis, likewise other heliodon models. It however, provides an hourly representation of the solar path on given days at different locations on the earth’s surface. The prepared scale model is placed horizontally at the centre of the reference platform of the heliodon and the latitude of the building is set using the calibrated selector plate positioned at the side of the reference platform. To position the sun for the simulation days and hours, the month selector is switched to the respective months to turn on the light sources on the time-hoops. These time hoops are then rotated to the simulation hours with aid of the graduated markings on the heliodon to visualise the shadow images generated. Contrary to the backward raytracing calculation techniques employed in suncast, solar shading analysis under the heliodon was calculated manually through the grid method. This involved the subdivision of the entire glazed surface of the scale model into grids of cells measuring 300 mm × 300 mm as shown in Fig. 8.
Figure 8

Fig. 8. Cell subdivision for calculating shaded area on glazed façade.
Using the simulation dates for the study location as stated earlier, these tests were carried out by integrating both vertical and horizontal external shading devices to test their shading performance on the glazed surface over the simulation periods. For the heliodon, the simulation days were selected by turning the marked selector switch to the respective months under consideration which turns on the light source for the selected month. The metal hoops can then be adjusted manually by rotation to the graduated hour marks on the coupling bracket (Fig. 2). The scale model was set to the eight simulation orientations on the horizontal surface according to the cardinal directions printed on the surface. This is done by aligning the midpoint of the model to the centre of each marked direction, and at an approximate angle of 45° between two right-angle cardinal directions (N, E, S, and W) for positioning the model to the inter-cardinal orientations (NE, NW, SE, SW) on the horizontal surface.
However, since the area of interest for the experiment is the opening, the shadow of the shading devices formed on the subdivided glazed surface only were recorded by taking photographs. Furthermore, the shaded area per time and day is calculated by counting the number of cells shaded from which the amount of total shaded area can be measured. The shaded region on the façade is expressed as a percentage of the total façade area to give the percentage of shaded area. However, there are certain instances when the sun has no effect on the orientation and façade area, due to the unavailability of direct sunlight at certain hours of the days thus, the façade is termed to be self-shaded in these cases. As illustrated in Fig. 9, this process was performed in repetition with the glazed façade overlooking each of the eight cardinal orientations by utilising the directional guides marked on the heliodon surface.
Figure 9
Fig. 9. Heliodon evaluation procedure.
3.3.2. Daylighting performance evaluation
The artificial sky simulator facility available at the Faculty of Built Environment, Universiti Teknologi Malaysia (UTM) was used to conduct the RadianceIES validation experiment. The artificial sky simulator is calibrated to represent overcast sky conditions under which daylight factor can be evaluated physically. The simulator measuring 2.4 m × 2.4 m × 2.4 m (L × W × H), is made of sturdy wooden boards on the exterior, properly sealed at the edges to eliminate light leaks through component. The interior walls and floor are bounded by reflective glass surfaces and wooden boards coated with a reflective paint material to emulate the sky condition and scatter light. For uniform illumination, the ceiling is a plastic membrane material in which lamps (illumination source) are embedded and controlled by light switches installed on the exterior of the component.
In order to carry out illuminance assessments, the sky simulator is fitted with multi-point illuminance measurement systems. The system consists of six detachable KONICA MINOLTA manufactured T-10MA illuminance meters with mini receptor heads measuring 16.5 mm (0.0165 m) in diameter, and one T-10A standard receptor unit powered by batteries (AA-sized) or AC supply. The receptors otherwise known as sensors are made of silicon photocell with illuminance measurement range of 0.01 to 299,900 lx. They are calibrated with cosine correction characteristics within 3% indicating a little margin of directional error and spectral response of 6% according to CIE standards [40].
The system is capable of executing multiple readings over an area, supporting a minimum of 2 and a maximum of 30 points simultaneously. This is possible with the connection of the T-10MA sensors in a loop to a T-10A unit from where the measurements are initiated and results are retrieved using its function buttons. The collection of data through this system was carried out with a data management software referred to as T-S10w which was processed in a spreadsheet software for real-time visualisation of results and convenient data analysis. Figure 10 shows the validation experiment using the artificial sky simulator.
Figure 10
Fig. 10. Validation experiment using the artificial sky.
The simulation of illuminance was validated by using an artificial sky simulator with one illuminance sensor placed outside of the model with the receptor window pointing to the ceiling of the simulator, and free from obstructions or shading effect to measure the external illuminance from the artificial sky. Due to limited number of sensors available for the experiment, only five points were measured inside the model- two at the front, close to the glazed façade, two at the rear and one at the middle of the room. In order to compensate for the height of the sensors on the WP, the dimensions were considered such that the receptors on respective sensors were on the same level of the WP height.
The sensors, facing upwards are placed in the interior of the scale model on a reference grid of 1.5 m x 1.5 m, on the workplane height of 0.750 m of the model (Fig. 11), testing both vertical and horizontal shading devices. The values from these sensors are recorded automatically into a Microsoft Excel document using the integrated T-S10w Data management software over a period of 180 seconds in 10 reading intervals, to check random error and acquire average illuminance levels. Considering that the data obtainable from the artificial sky simulator are in illuminance units (lx), the DF results are mathematically calculated using the formula stated in Eq. (1).
Figure 11
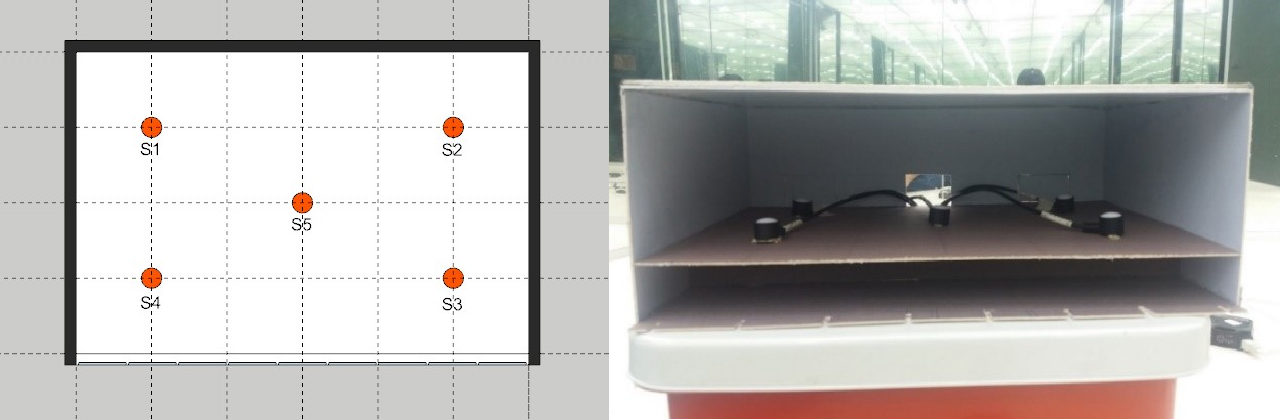
Fig. 11. Analysis grid and sensor placement positions at the workplane height.
3.4. Computational simulation procedure
3.4.1. Solar shading performance evaluation
The simulation process begins with the creation of the digital prototype of the test model in IESVE ModelIT workspace defining the room area, and shading elements as “local shades”. The building location and weather information was acquired with the ApLocate wizard, while the orientation was set by rotating the site in increments of 45° for the eight cardinal orientations. The actual shading calculations was performed in the Suncast module by inputting the simulation days, to calculate the effect of the shading elements on the exposed building envelope. The shading results obtained were recorded as a percentage of the total area of the façade under consideration, and for periods when the sun is not directly incident on the façade, the building was considered to be absolutely shaded.
3.4.2. Daylighting Performance Evaluation
The computational simulation procedure was carried out using the Radiance to evaluate daylight performance of the shading devices design in the interior of the building model as modelled in the ModelIT tab. Since the DF evaluation is not affected by changes in building orientation, the orientation parameter is not considered for this assessment. In the RadianceIES tab, the work plane (WP) height was inputted (0.750 m), and the WPI (WP View Image) simulation type was selected from illuminance simulation options under “Simulate” tab. Custom simulation quality parameters were chosen to ensure the best accuracy in results according to previous studies as presented in Table 2.
Table 2
Table 2. Surface properties of building envelope elements.
For even comparison in daylight simulations, the 10 Klx CIE overcast sky is adopted as it provides a uniform external illumination (10,000 lx) and does not consider design days and hours in simulation. The DF data output in Radiance were presented in form of scaled colour maps within the view extents of the office model dimensions. The overview of the computational simulation procedure is presented in Fig. 12.
Figure 12
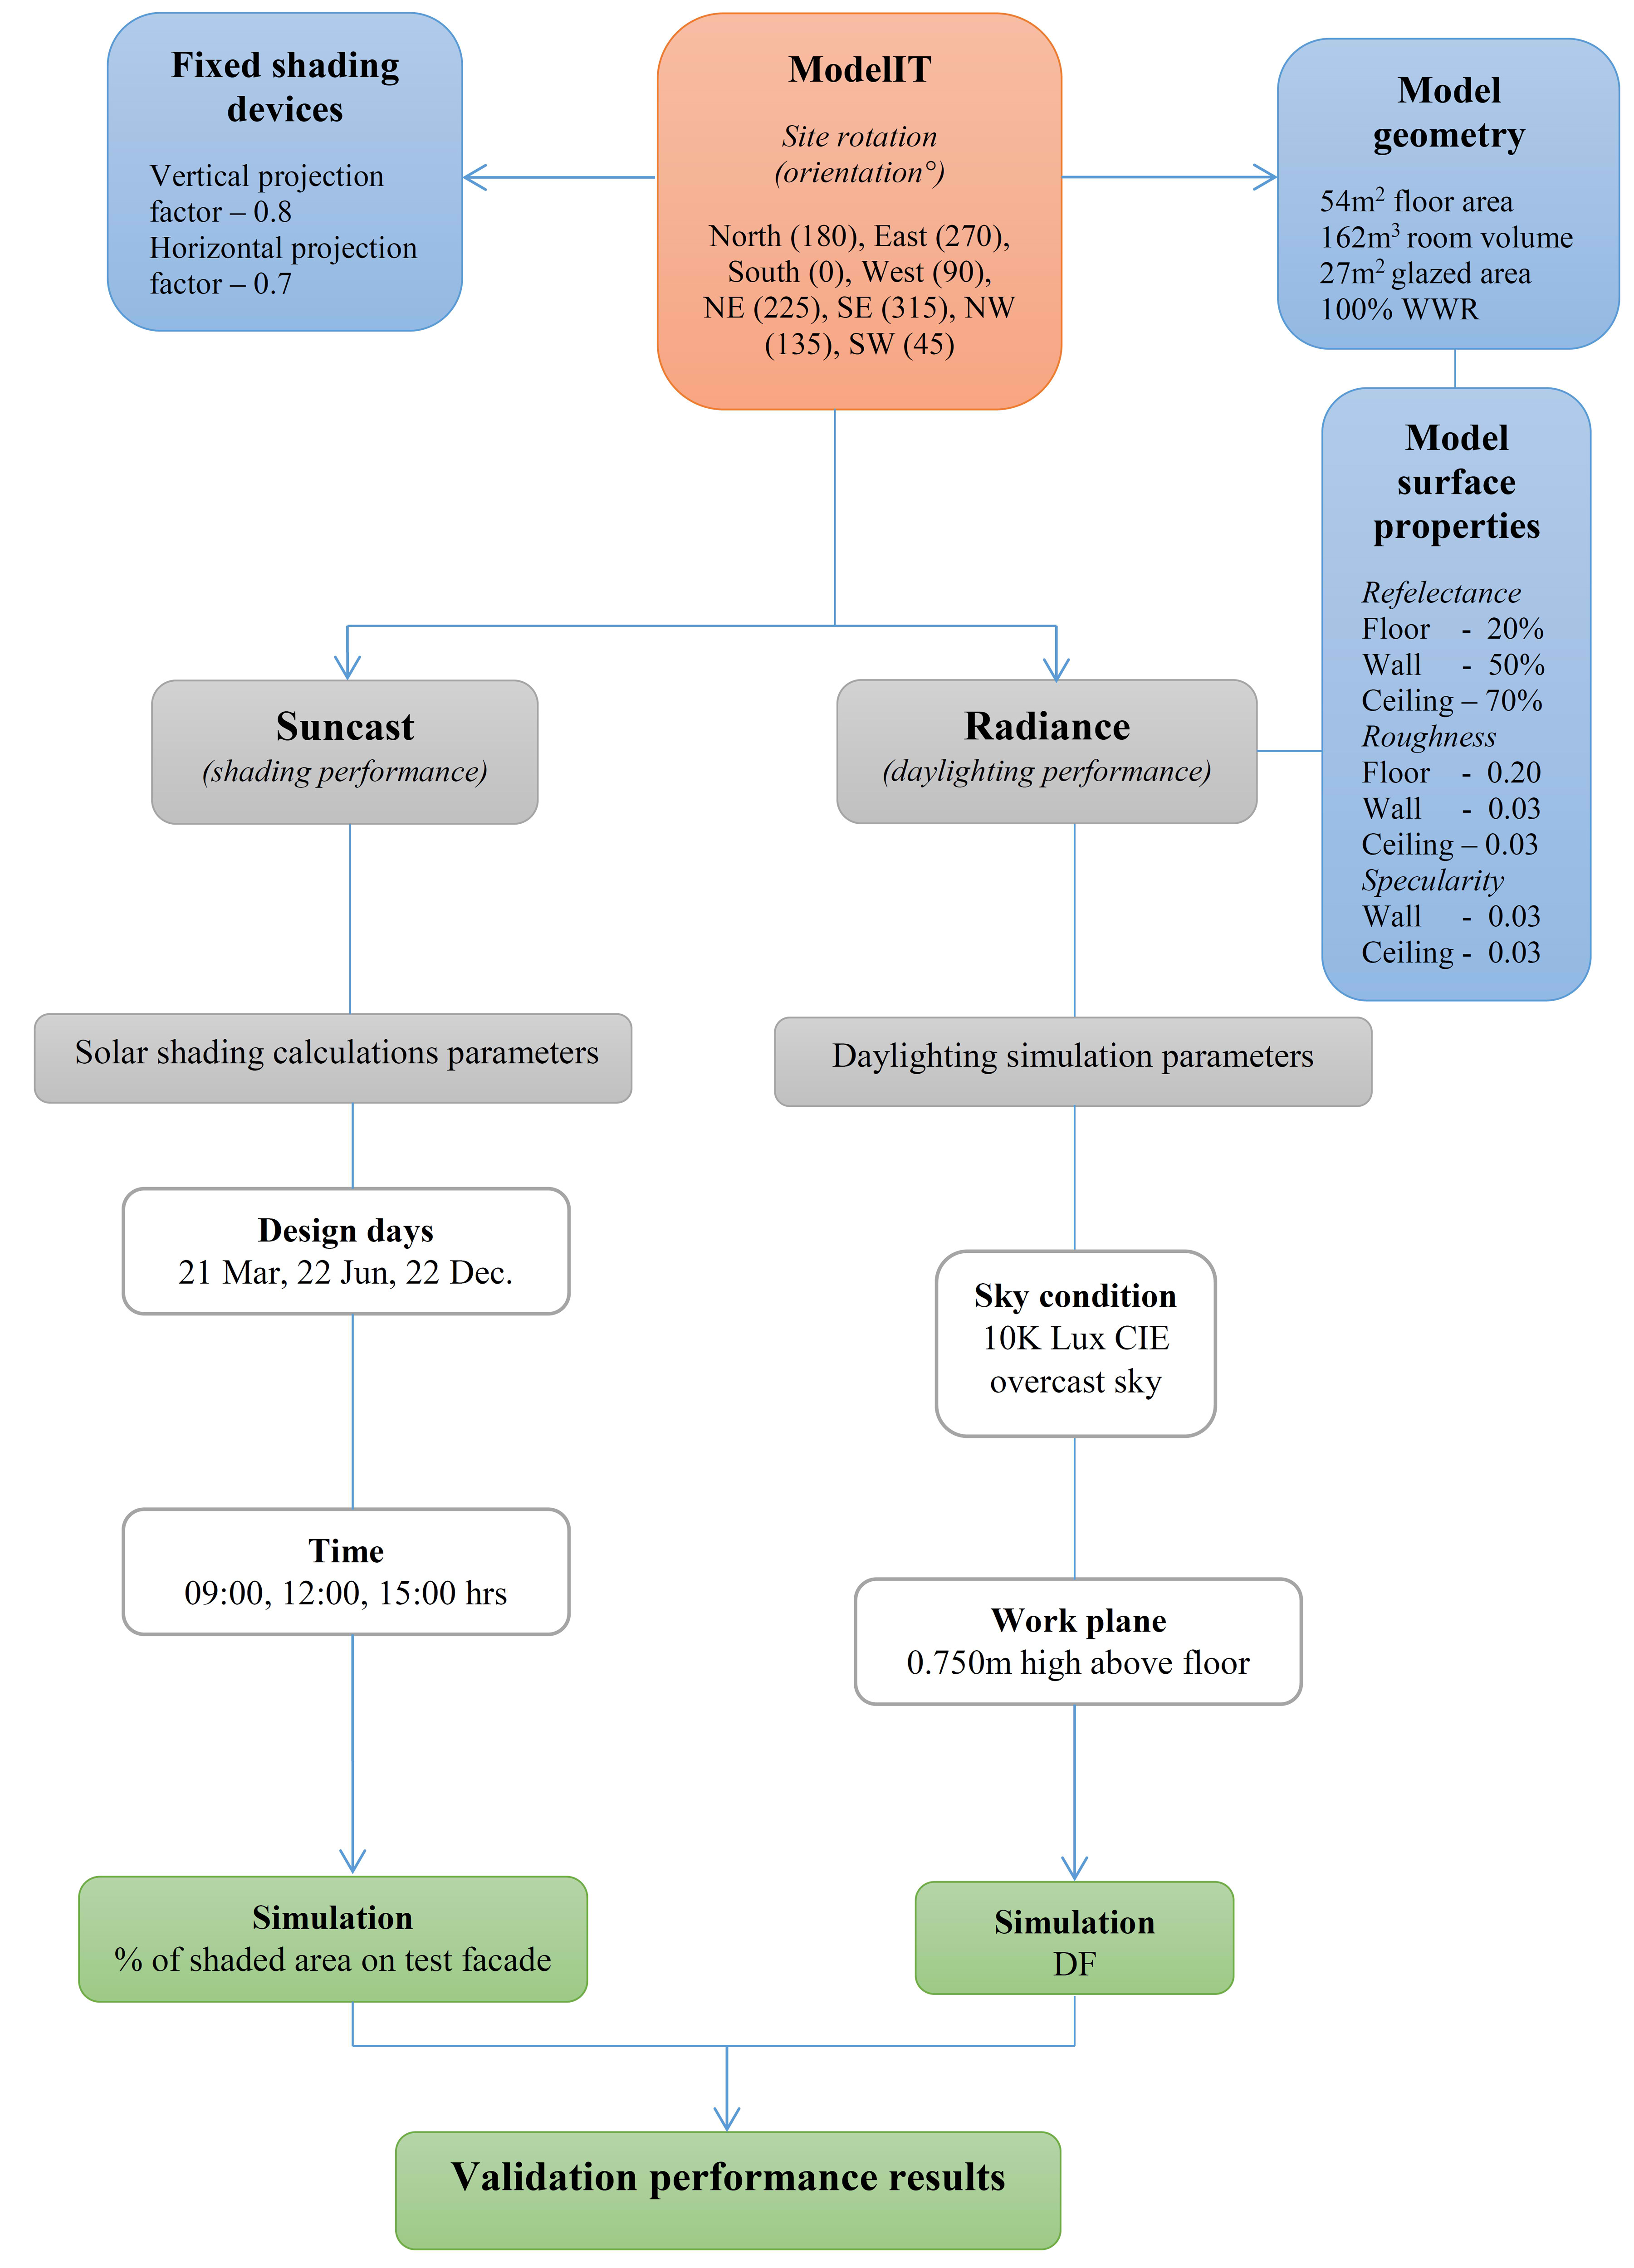
Fig. 12. Computational simulation framework.
4. Results and discussion
The comparative analysis of both computational and physical measurements is presented and discussed in this section. The results were also evaluated with statistical methods of linear regression analysis to measure the correlation between the tools and accuracy of the simulation results.
4.1. Shading performance analysis comparison
Suncast simulation results were validated by comparing results with physical measurements using a heliodon for solar shading studies. Following the outlined procedure in section 2.1.1, the model is shaded using scaled vertical fins and horizontal panels as external shades. These fixed shading elements were integrated on to the exposed façade at a perpendicular angle of 90° to the window wall for all cases and the respective effects on the exposed façade across eight orientations were documented for analysis. Comparing both simulation and modelling cases, the average shaded area recorded on the façade were approximately 78.7% and 78.9% respectively.
Figure 13
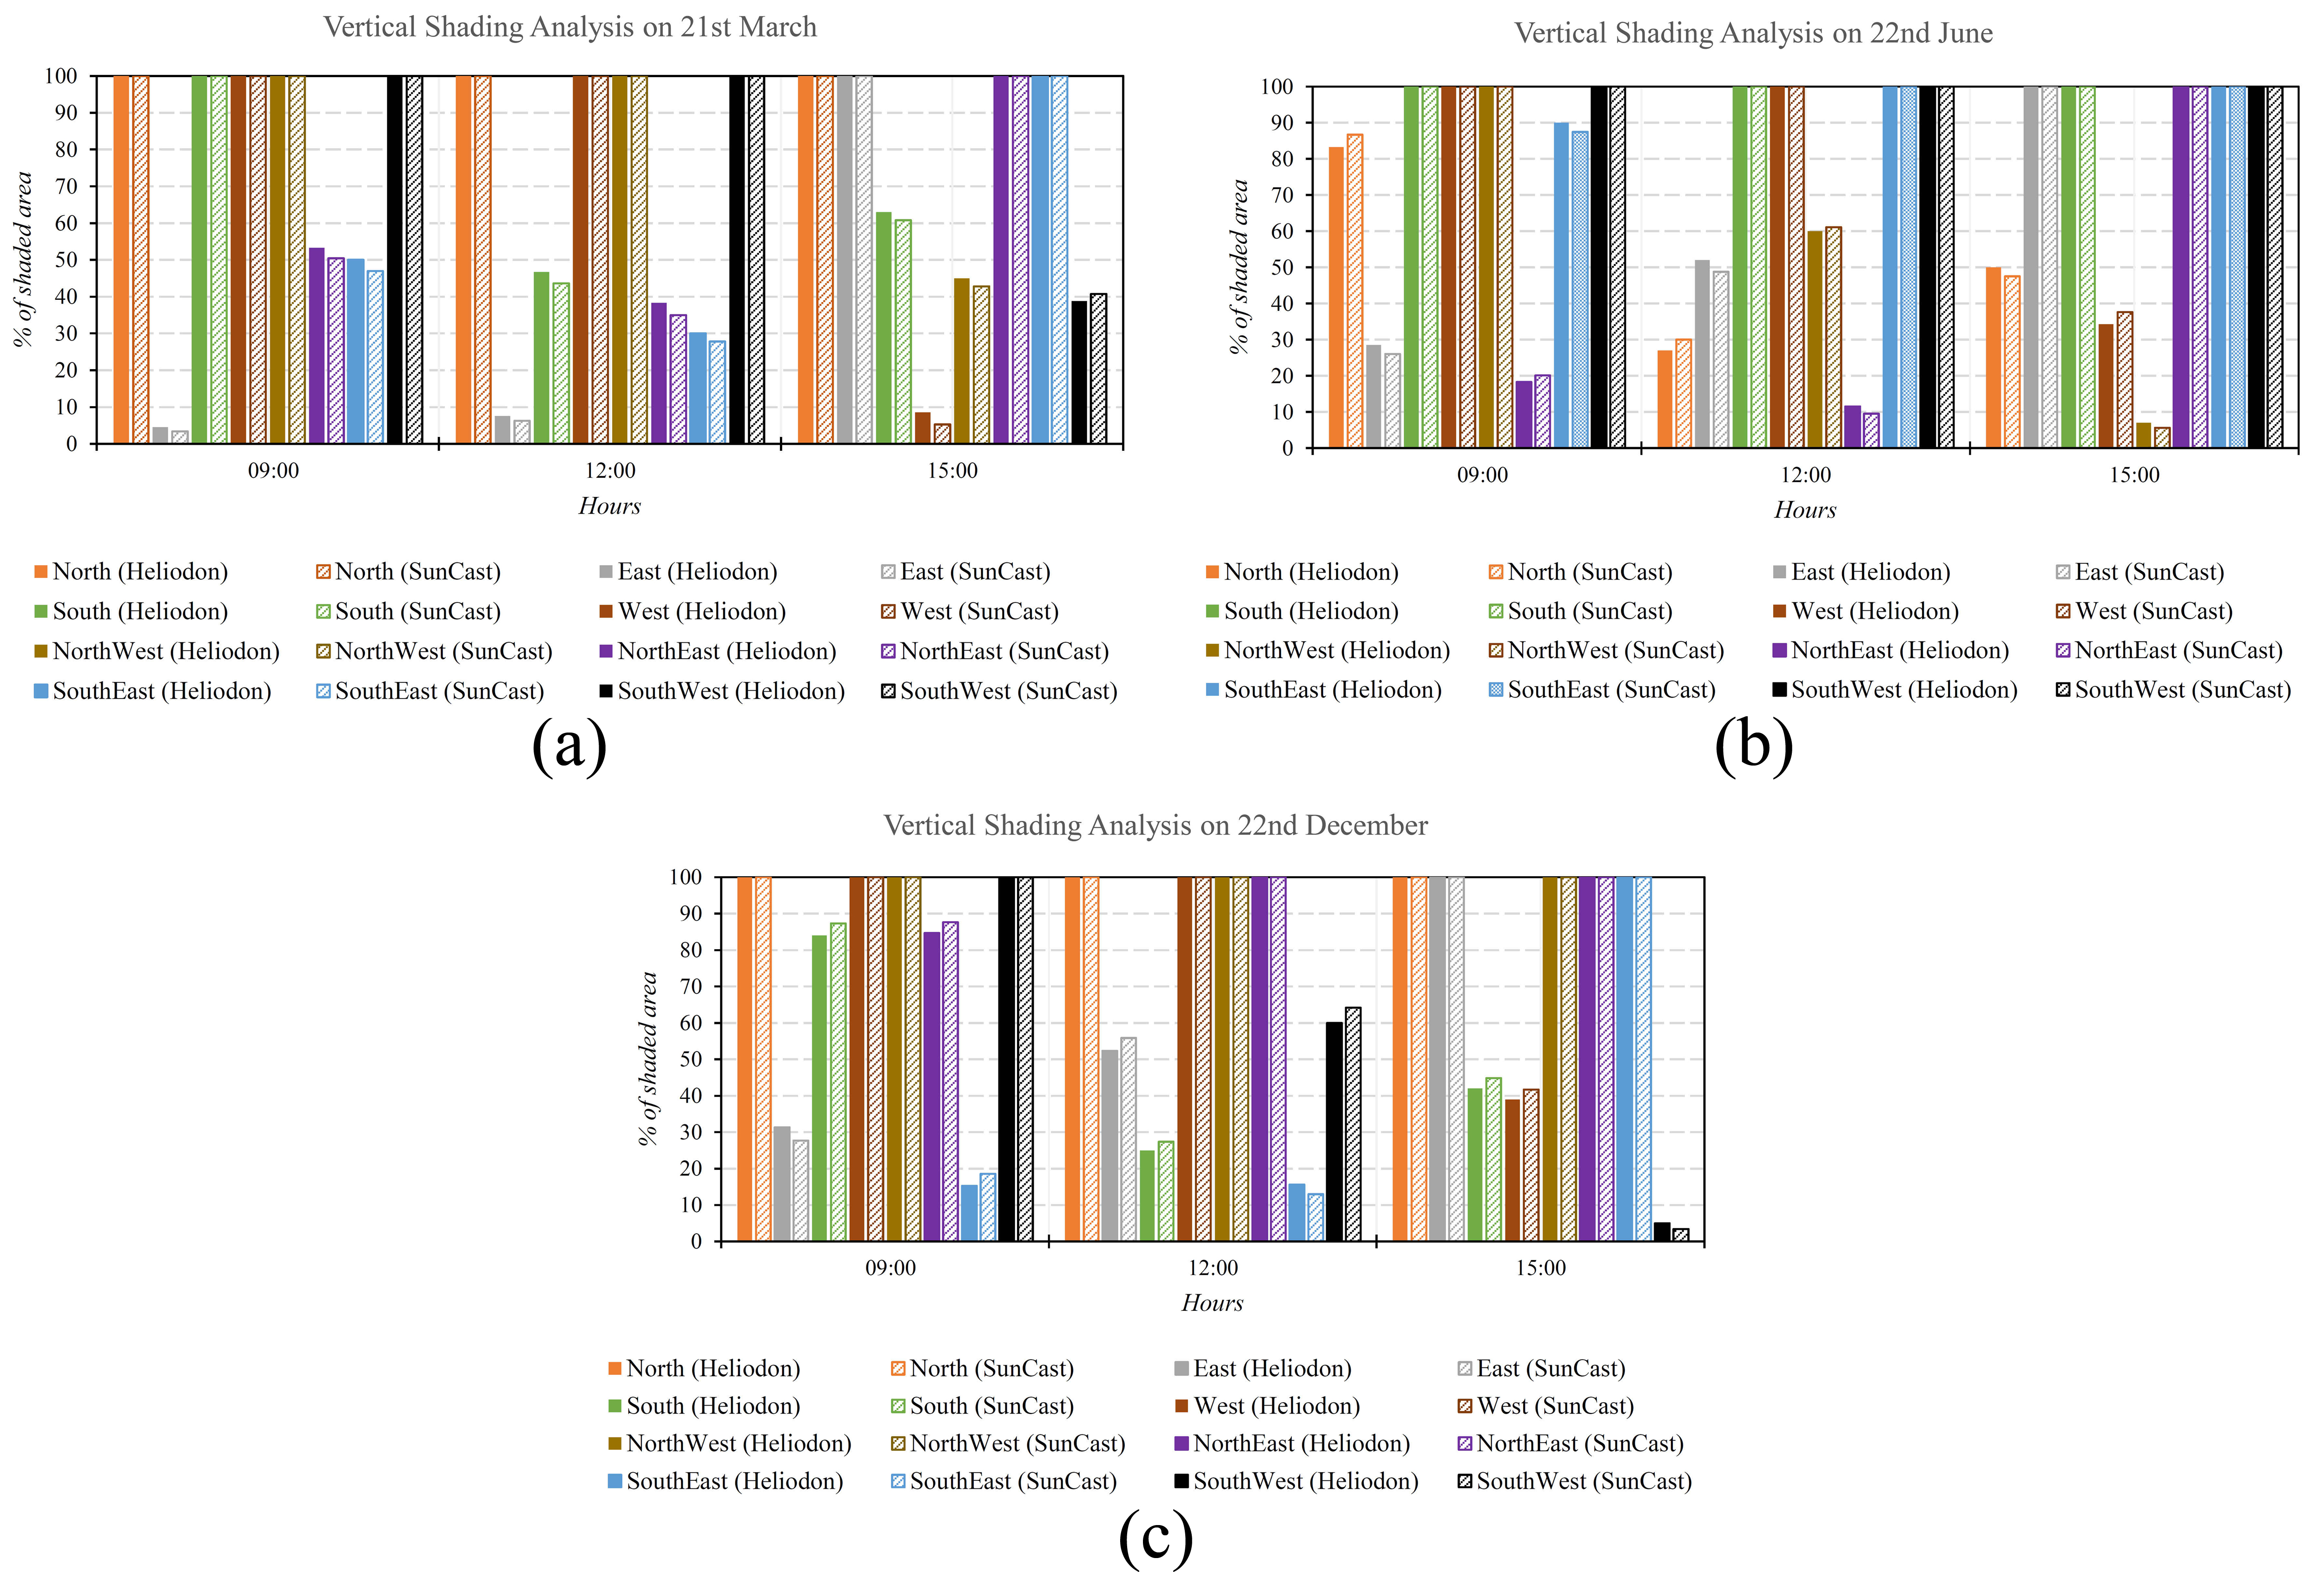
Fig. 13. Computational simulation framework.
The heliodon measurements were observed to have presented slightly higher values over the simulations in Suncast (Figs. 13 and 14). Results comparison from the initial data analysis showed no distinctive different pattern between both cases except for the better shading performance realised on the façade with the horizontal shading elements. Generally, the best performances of the vertical shading elements were recorded in the morning periods (09:00), and the worst conditions at noon monthly. In contrast, it was observed that the shading performance of horizontal panels at 09:00 for the three simulation days generated the lowest shading performance on the East, Northeast and Southeast compared to the other orientations. 100% shading were obtained on both Suncast and heliodon simulations for facades not exposed to direct radiation which is considered a self-shading effect. However, in comparison with the vertical fins, the horizontal shading elements were observed to provide better shading on the façade for over 70% of the simulated cases, excluding self-shaded instances in the validation experiment.
In total, 144 respective results were recorded from hourly simulations on three days, and across eight cardinal orientations concordant to Suncast software simulation. Considering the mean percentage difference (about 0.2%), it can be inferred from the results presented in Figs. 13 and 14 that Suncast program estimated quite comparative shading performance results across the eight orientations with the calculation of the shaded façade area made on the heliodon. Significant variation in result comparison can be traced to the exaggeration of shadows cast on the façade, an effect due to the distance proximity of heliodon’s directional light beam to the horizontal surface holding the scale model. This distance as represented on the heliodon, does not in fact accurately model the relative distance of the sun to the earth surface thus, generating more shading effect on the considered façade. Furthermore, the adopted physical method of calculating shaded areas using the heliodon is limited in accuracy compared to computational methods which eventually leads to underestimation or overestimation of results.
Figure 14
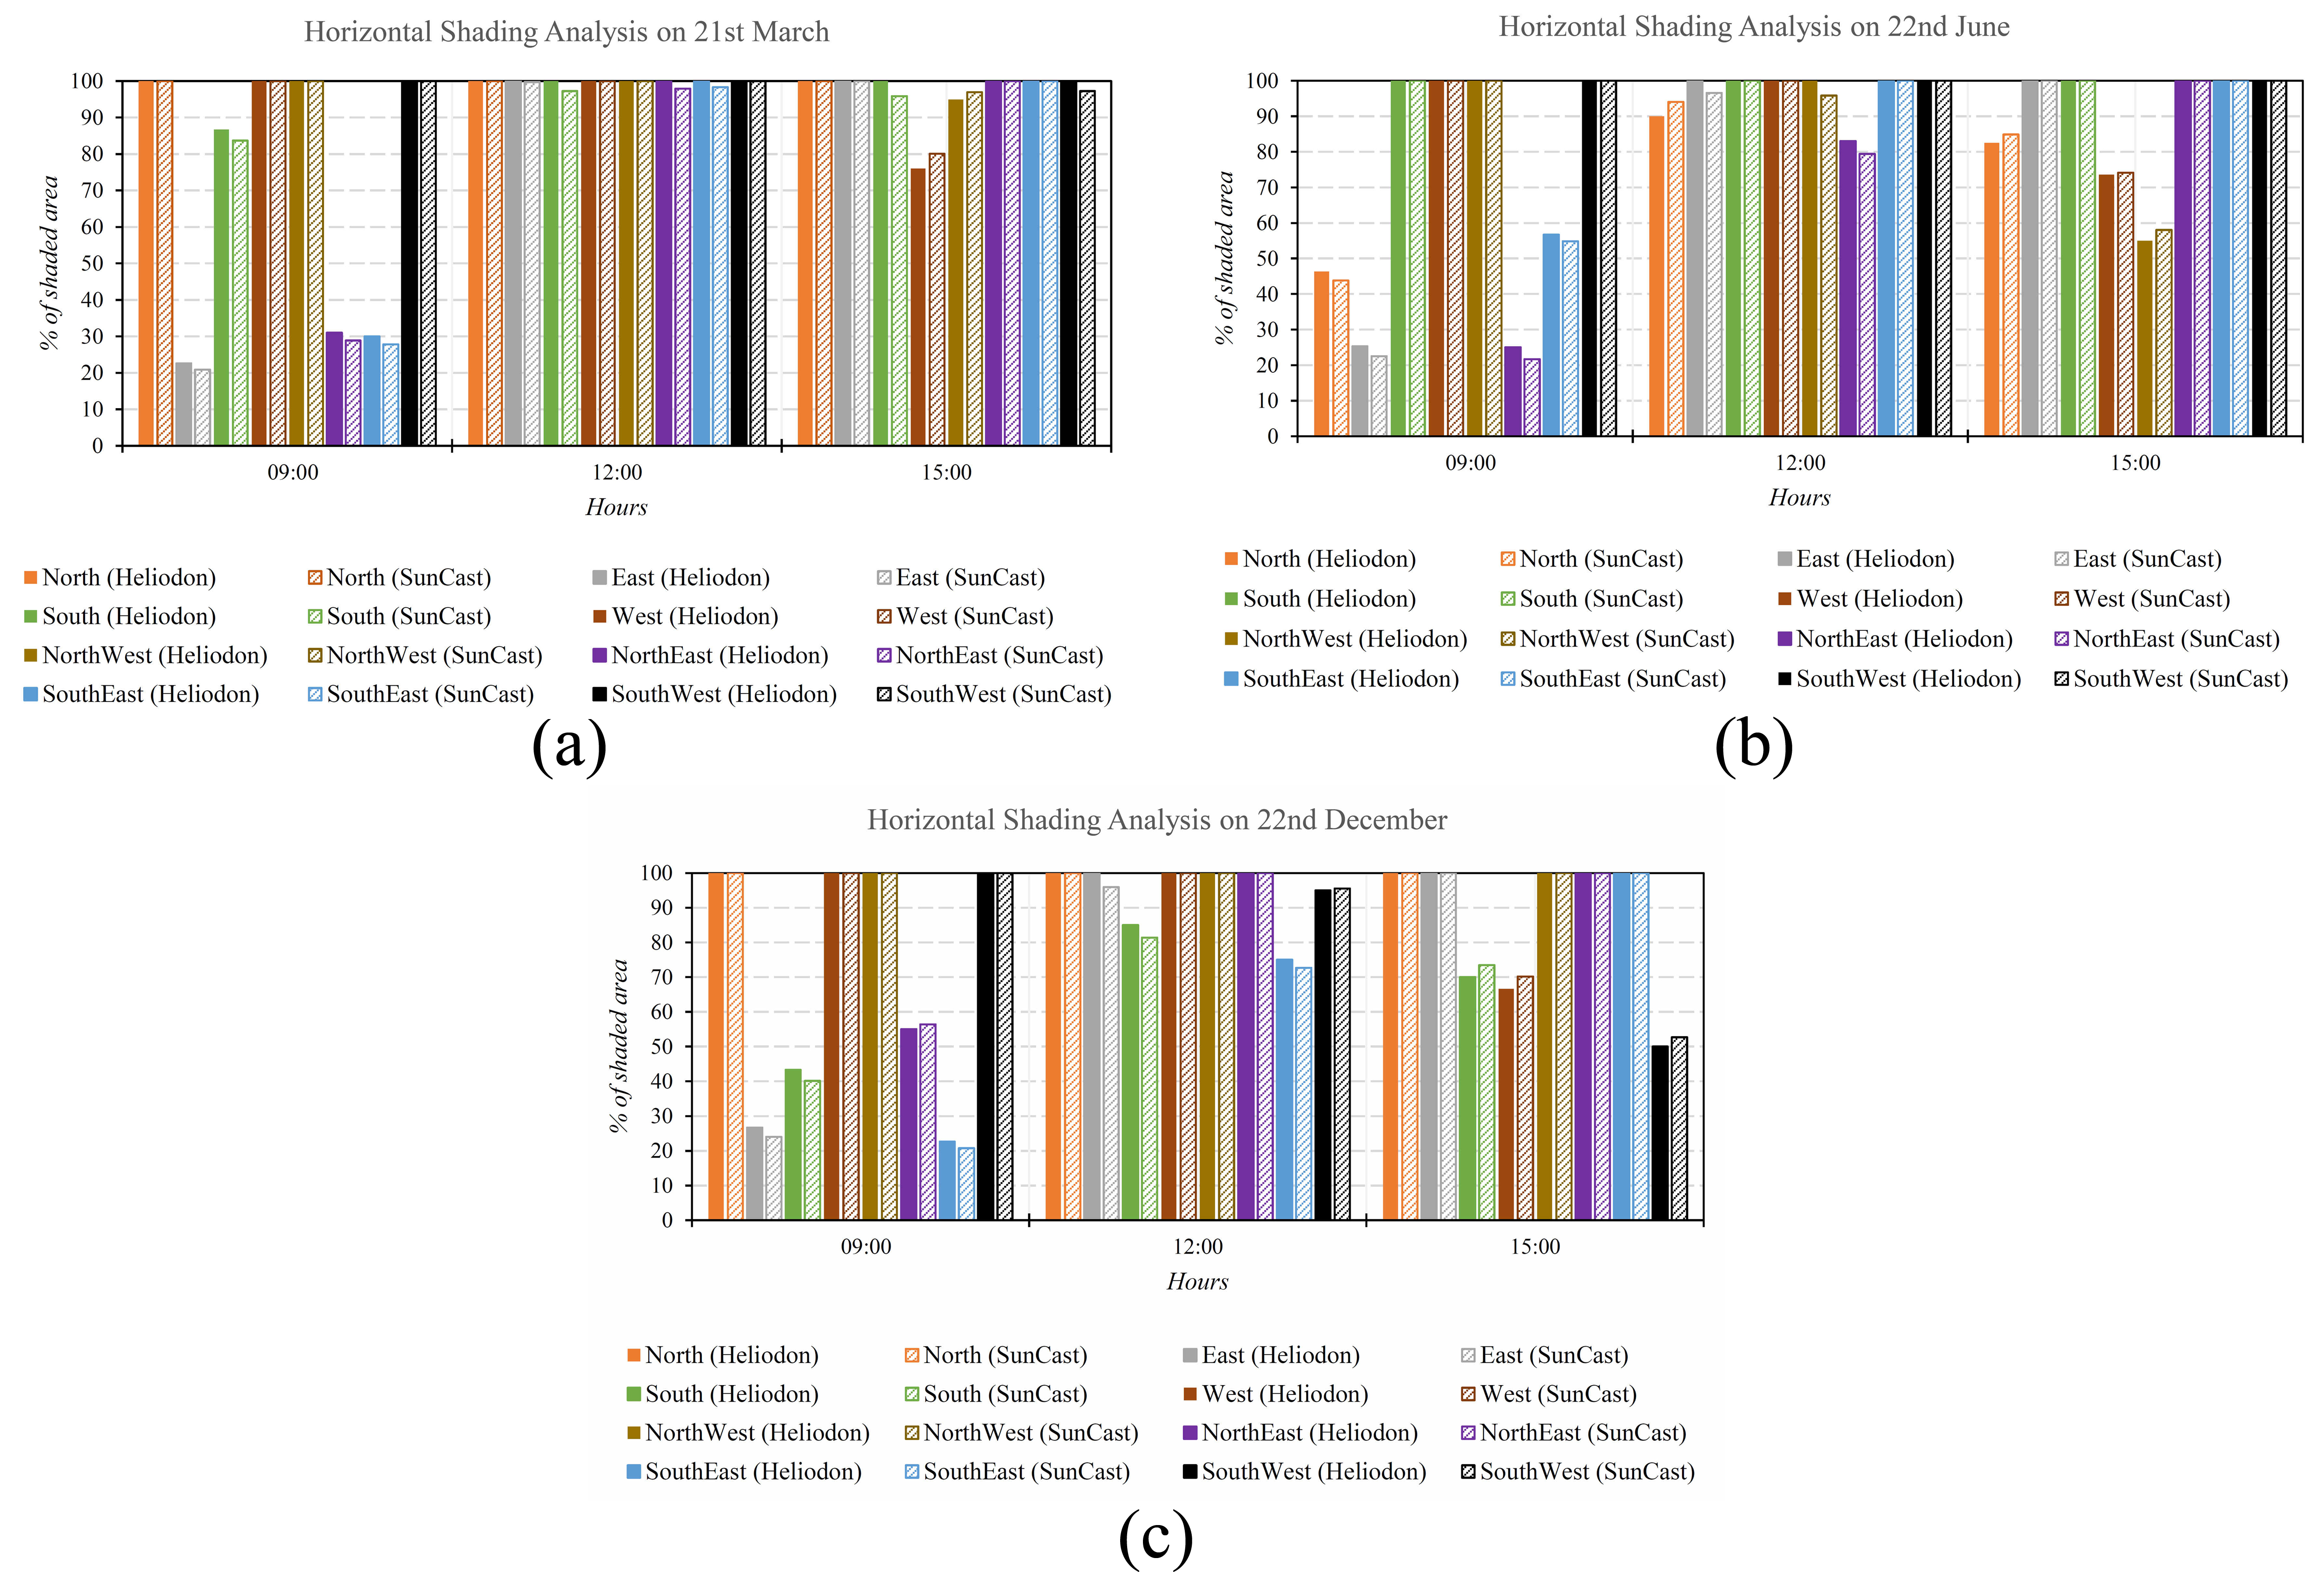
Fig. 14. (a)-(c) Horizontal shading performance comparisons between heliodon and Suncast.
4.2. Daylighting performance analysis comparison
The artificial sky simulator and digital light sensors (S) are capable of physically measuring the amount illuminance reaching a plane or surface; the WP height in this case. The measurements were carried out in ten iterations for elimination of random errors in measurements, and to obtain the average illuminance at respective sensor points under overcast sky in the artificial sky simulator. The external illuminance recorded for the artificial sky and RadianceIES are 3,660 lx and 10,000 lx respectively, indicating that the sky illumination in Radiance is significantly greater in comparison to the artificial simulator. For both simulations performed, it was observed that the illuminance level logged on S1 and S2 were much lower than S4 and S5 as expected, due to the farther position to the opening, while S3 registered an average illuminance of 469 and 446 lx for vertical and horizontal shading devices elements respectively at the centre of the room. The complete results from the validation experiment performed is presented in Table 3.
Table 3
![RadianceIES simulation parameter settings [41-43].](figures/8-20-20.jpg)
Table 3. RadianceIES simulation parameter settings [41-43].
From the external and indoor illumination measurements, the daylight factor (DF) attained over respective sensors were calculated excluding the sensor located outside the scale model. The results show a minimum DF of 5.9% and maximum DF of 17.0%. Overall, the illuminance results output from artificial sky were lower than those derived from Radiance software simulations while DF results were higher in artificial sky when compared to Radiance calculations as shown in Figs. 15 and 16. The higher DF values calculated from artificial sky simulations are as a result of the lower outdoor illuminance measured which invariably increases the ratio. Figure 15 illustrates the RadianceIES false colour images for DF simulations.
Figure 15
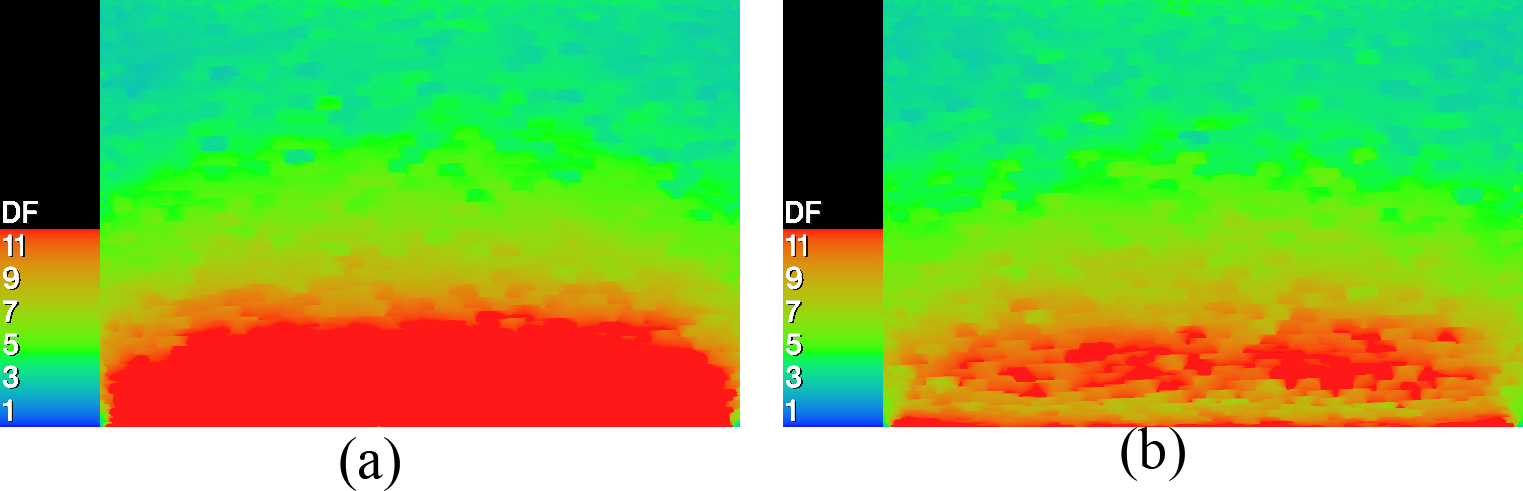
Fig. 15. RadianceIES false colour images for DF simulations: (a) vertical shading (b) horizontal shading.
Figure 16
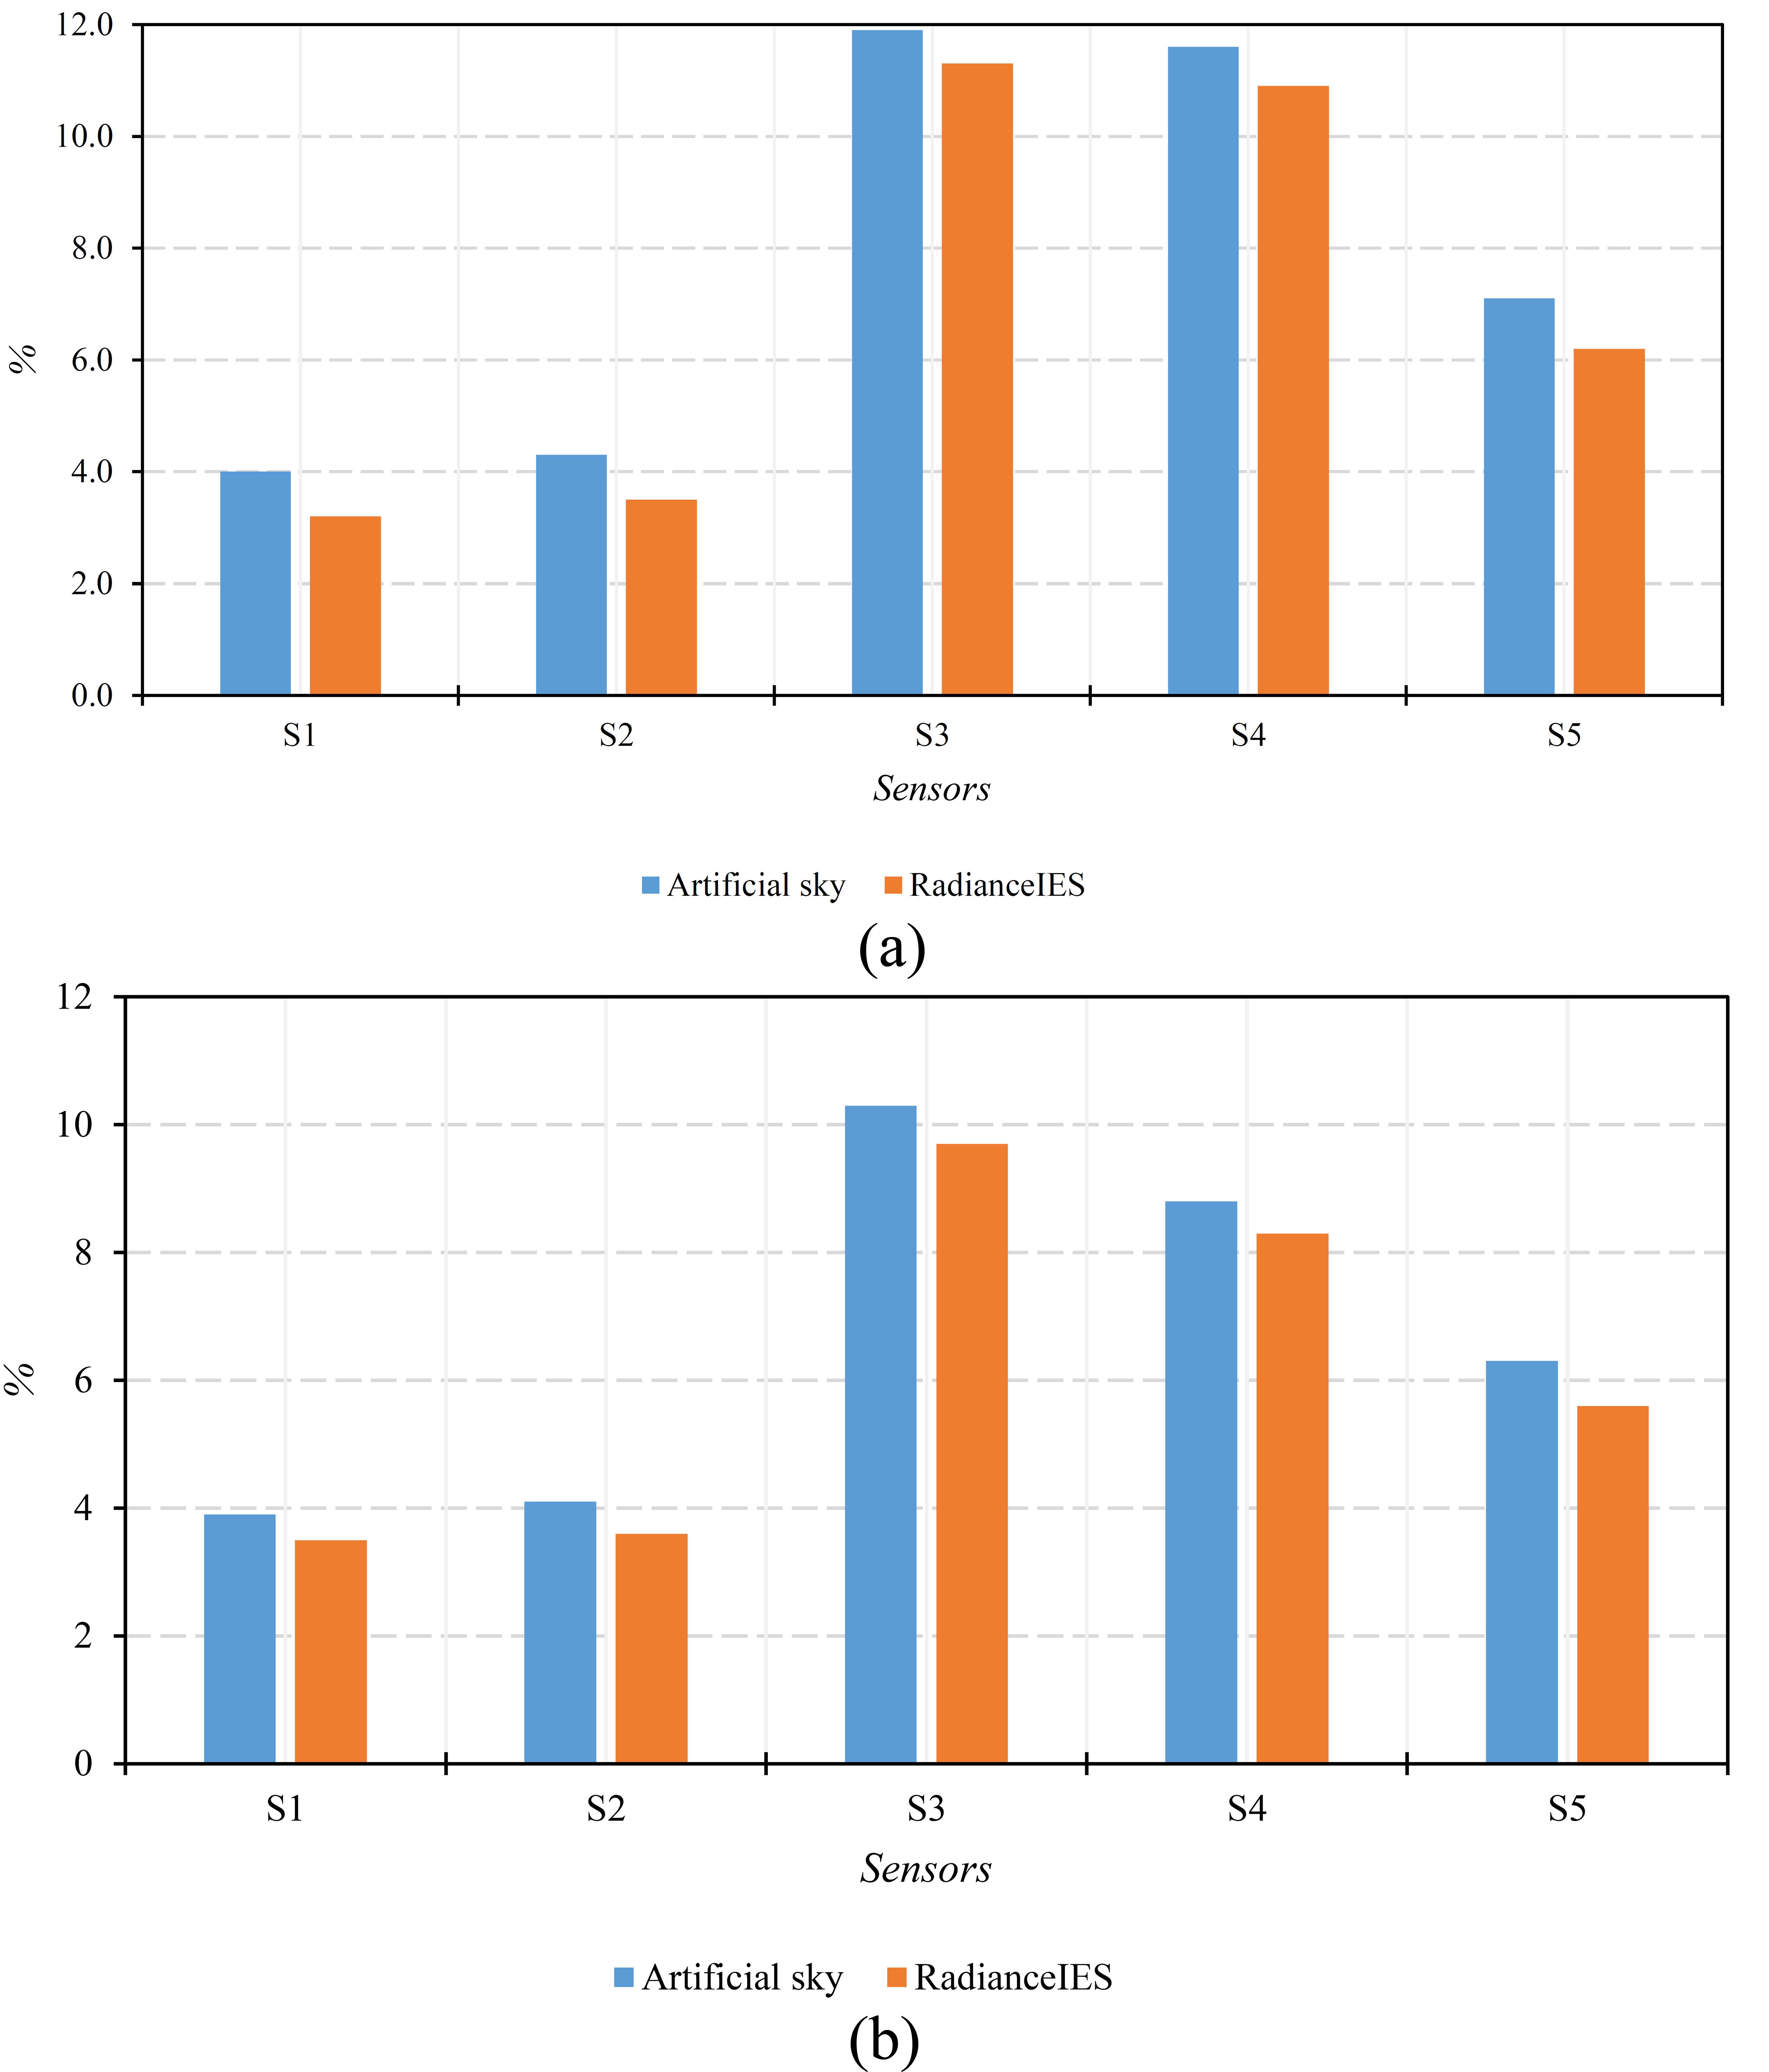
Fig. 16. Daylight performance results: (a) vertical shading (b) horizontal shading.
4.3. Correlation tests
All cases were evaluated using regression analysis, to establish the degree of association and data distribution between physical measurements and simulation procedures involved in the study which are presented in Fig. 17, showing the lines of simple fit on linear graphs plotted between software simulations and physical measurements. The resulting analysis showed that the coefficient of determination, R2 of both Suncast and Radiance simulation results were close to 1 (approximately 0.99 in respective cases) and Pearson’s correlation coefficient r, of 0.9 approximately, indicating that there was a normal distribution of data and associativity between the physical model measurements and software simulations (as presented in Tables 4 and 5).
Figure 17
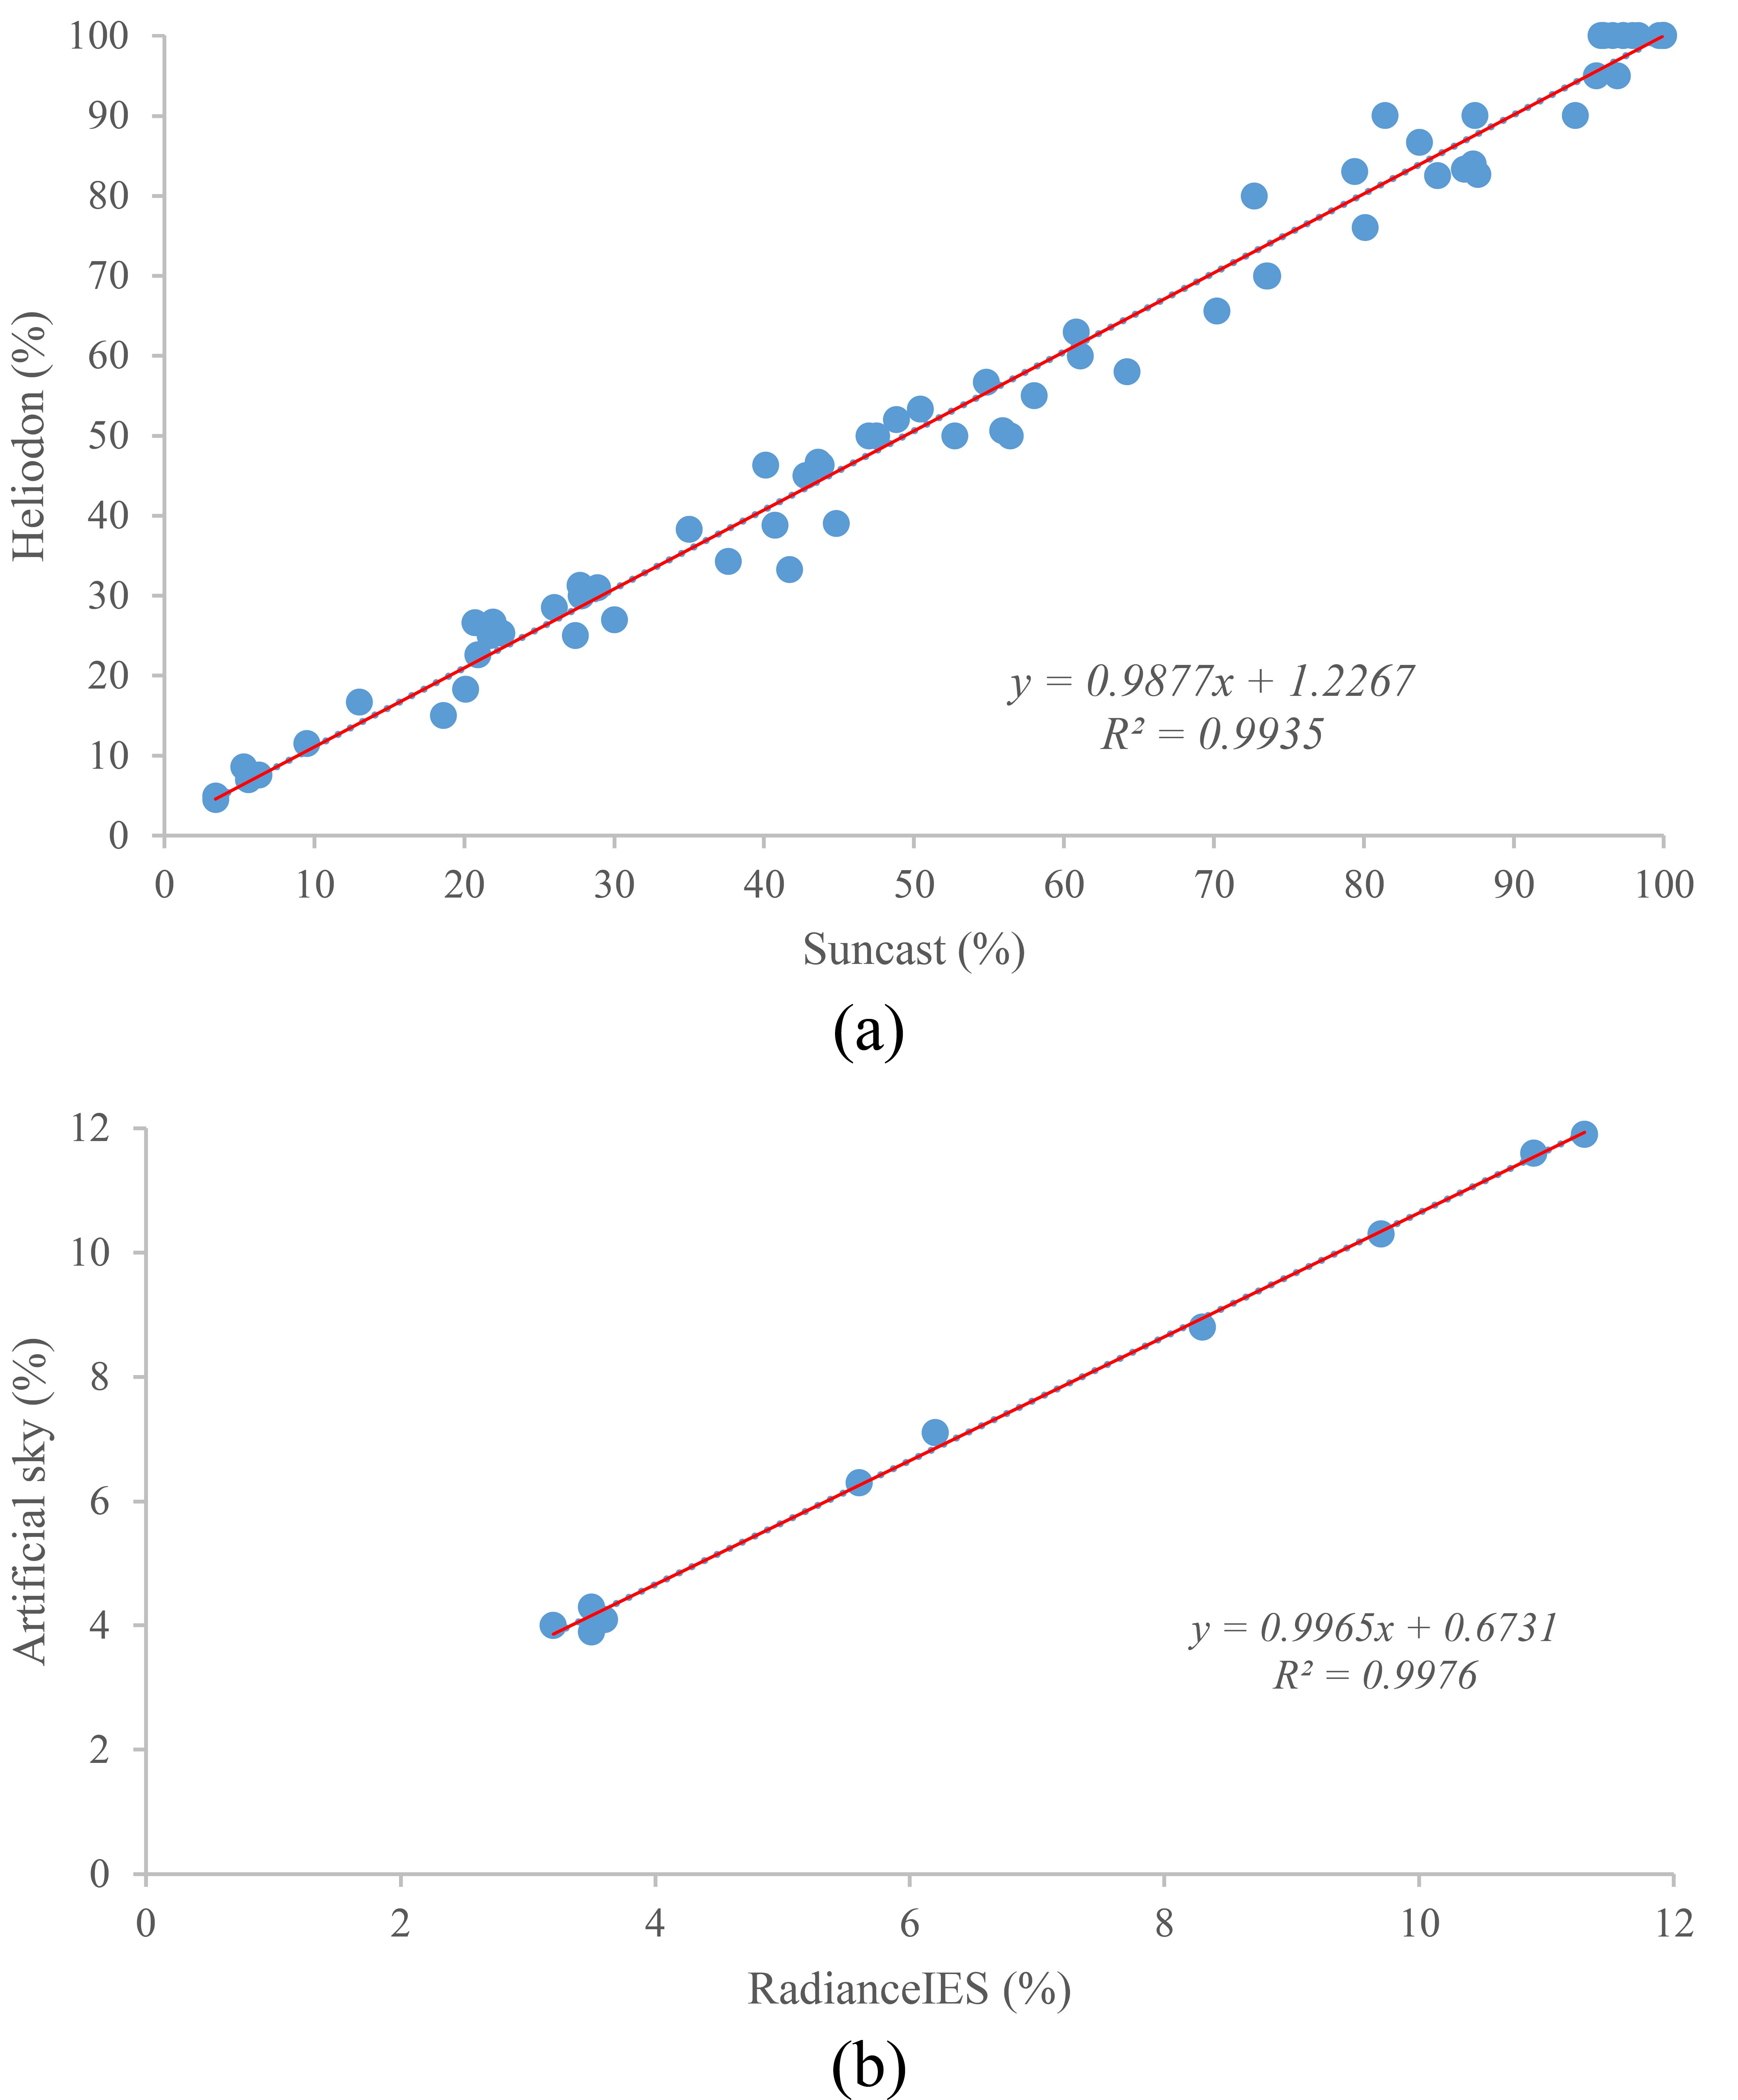
Fig. 17. Regression analysis for correlation: (a) Suncast and Heliodon measurements; (b) RadianceIES and Artificial sky measurements.
Table 4

Table 4. Pearson’s correlation results for solar shading evaluation.
Table 5

Table 5. Pearson’s correlation results for daylighting evaluation.
A regression line equation was derived as given in Eqs. (2) and (3) for Suncast and RadianceIES programs respectively, for the definition of the relationship, prediction and calibration of results to a reasonable level of accuracy between the variables being considered.
5. Conclusion
This study has presented an assessment of computational and physical experiment methods of evaluating solar shading and daylighting performance in buildings. Computational evaluation presented quite close results in shading performance with an acceptable level of accuracy in congruence with the physical experiment. Substantially, this study has demonstrated that Suncast and RadianceIES programs are capable of accurately simulating environmental performance for solar design and daylighting studies. The heliodon evaluation method provides a practical, hands-on approach of understanding the composition of the solar geometry and environmental variables requisite for solar shading design. However, the prediction accuracy of the heliodon is dependent on the distance of the light source to the reference plane. This could be improved by testing with small-sized scale models, although certain inherent details on the scale models might be lost with the reduction in size.
The results of the experiment indicate that the sky types available in RadianceIES for daylighting simulations and the sky condition emulated in the artificial sky simulator do not represent the actual conditions of tropical climates; as seen in the recorded measurement of the outdoor illuminance. Thus, the prediction of daylight performance in buildings located in the tropics could be underestimated with the use of the artificial sky. Nevertheless, the heliodon’s emulation of the sun path for a given location is proven to be potentially accurate for basic shading analysis and significant in understanding the solar geometry for solar studies. Its measurement and analysis accuracy may however be reduced and inconsistent when used for the evaluation on complex models with irregular shading geometries. In addition, the sun-emulator heliodons and artificial sky simulators are quite large in size thus tend to take up significant area of room space.
Overall, the computer simulations (from model preparation to results output) were carried out in considerably lesser time compared to the physical evaluation process with the heliodon and artificial sky. The average duration for each simulated case was observed to be less than 75 seconds. This however, does not represent the average simulation time for performance evaluations as the period of simulation is dependent on the processing power and specifications of the computer system. Likewise, IES<VE> simulation engines operate on backward ray tracing techniques; which takes into consideration material properties of surfaces and objects, as well as the effect of light reflections. Hence, the computational evaluation approach could generally, offer more reliable and effective methods of assessing solar shading performance for building design. This study was designed to assess the impact of direct solar radiation through window openings in buildings in tropical climates only. Therefore, to consolidate results accuracy of the tools utilised in this study, further research could be carried out by evaluating the performance of shading systems with complex geometries on building facades. In addition, future work to improve the study could include and address other systems of natural lighting for building design in other climate zones.
Acknowledgement
The authors would like to acknowledge research funding from Universiti Teknologi Malaysia (UTM) and Ministry of Higher Education, Malaysia (MOHE) through the International Industry Incentive Grant (IIIG), project no. 01M56, titled “BIM-based Collaborative Building Design Process and Coordination”.
Contributions
Both authors contributed equally to the development of this paper.
Declaration of competing interest
The author declares that there is no conflict of interest.
References
- O. Attaman, Green Architecture: Advanced Technologies and Materials, McGraw-Hill Professional, 2010.
- N. Rahman, K. S. Nizam & A. F. Wajdi, Scenario and Strategy towards Energy Efficiency in Malaysia: A Review, in: MATEC Web of Conferences, 2019, Malaysia.
- N. A. Ramli, A. H. M. Fairuz & R. Harison, Energy Efficiency Measures on Two Different Commercial Buildings in Malaysia, Journal of Building Performance 10 (2019).
- W. Huang, L. Li, Y. Li, Z. Han, Development and Evaluation of Several Models for Precise and Fast Calculations of Shading and Blocking in Heliostats Field, Sol. Energy 95 (2013) 255–264. https://doi.org/10.1016/j.solener.2013.06.016
- A. F. Dufton, and, H.E. Beckett, J. Sci. Instrum. 1932.
- G.M. Beal, Natural Light and the Inside-Outside Heliodon, University of Kansas publications, The Bulletin of Engineering and Architecture 38 (1957) 12-13.
- K. P. Cheung, S. L. Chung, M.F. Leung, P. Chu, A Discussion on Some Assemblies of Fresnel lens and Quartz Lamps in Simulating Quasi-Parallel Light for Testing Building Models in Heliodon Studies, International Journal on Architectural Science 9 (2012) 18–35.
- D. Doberneck, K. Knechtel, Heliodon: A hands-on daylighting educational tool, in: The 42nd ASES National Solar Conference 2013 (SOLAR 2013), pp. 342–348, Baltimore, Maryland.
- N. Lechner, Heating, Cooling, Lighting: Sustainable Design Methods for Architects, Fourth ed., John Wiley & Sons, Inc, Hoboken, New Jersey, 2015.
- M. Mostafa & M. Maged, A Simple Heliodon System for Horizontal Placed Models, Contemporary Urban Affairs, 2017, pp. 54-61.
- N. Lechner, The Sun Emulator: A Conceptually Clear Heliodon, in: Proceedings of the ASCA (Association Colligate Schools of Architecture) Technology Conference, 2001, 116-118.
- K. P. Cheung, A Multi-Lamp Heliodon for Architectural Schools, International Journal of Architectural Science 1 (2000) 46-58.
- Hopkinson R. G, Architectural physics – lighting, Her Majesty’s Stationery Office, London, 1963.
- A. Rosato, S, Michelangelo, S, Sergio, Use of a scale model under artificial sky for daylighting design, in: Conference Proceedings of the 11th International Forum of Studies - The Paths of the Merchants, Aversa/Capri, 2013, Italy.
- J. Mardaljevic, Daylight, Indoor Illumination, and Human Behaviour, 2012.
- C. Aghemo, P. Anna, L.V. Valerio, A protocol for artificial sun and sky validation, Turin (2004).
- Integrated Environmental Solutions Limited, Retrieved on 09 April, 2019 from https://www.iesve.com/downloads/help/Solar/SunCast.
- A. A.Y. Freewan, J. A. Al Dalala, Assessment of daylight performance of Advanced Daylighting Strategies in Large University Classrooms; Case Study Classrooms at JUST, Alexandria Engineering Journal 59 (2020) 791-802. https://doi.org/10.1016/j.aej.2019.12.049
- Y. W. Lim, Tropical Daylighting for Working Environment, Universiti Teknologi Malaysia, 2019.
- S. A. Solmaz, A critical review on building performance simulation tools, Alam Cipta 12 (2019) 7-21.
- United States Department of Energy, Radiance, Retrieved 21 August, 2019 from https://www.energy.gov/eere/buildings/downloads/radiance.
- K. Johnsen & R. Watkins, Daylight in Buildings, Hertfordshire, 2010.
- L. Pajek, P. Jaka, D. Mateja, B. David, Š. Nika, R. Kunič, & K, Mitja, Using Heliodon for Solar Building Design Education in the Age of Computer Simulations (2018) 1-10. https://doi.org/10.18086/eurosun2018.07.03
- A. Marsh, The Application of Shading Masks in Building Simulation, Ninth International IBPSA Conference, 2005, pp. 725-732, Montréal, Canada.
- S. V. Szokolay, Solar Geometry, Passive and Low Energy Architecture International: Design Tools and Techniques, Volume 1 of PLEA notes, Second Ed., University of Queensland, 2007.
- C. Suji, L. J. Dongseok, J. Hun, Method of Deriving Shaded Fraction According to Shading Movements of Kinetic Façade. Sustainability (2017) 1-19. https://doi.org/10.3390/su9081449
- Sweden Green Building Council, 5.0 Health and Wellbeing: Daylight. Technical report, BRE Global Ltd. (2013) 54–68.
- P. Tregenza, J. Mardaljevic, Daylight buildings: Standards and the needs of the designer. Lighting Res. Technol. 50 (2018) 63-79. https://doi.org/10.1177/1477153517740611
- Department of Standards Malaysia, "Malaysian Standard: Code of Practice on Energy efficiency and Use of Renewable Energy for Non-Residential Buildings." Malaysia, MS 1525:2014. 2014.
- New Buildings Institute, Daylight Pattern Guide: Analysis Methods, Retrieved on 4, July 2019 from http://patternguide.advancedbuildings.net/using-this-guide/analysis-methods.
- V. Costanzo, G. Evola, & M. Luigi, A Review of Daylighting Strategies in Schools: State of the Art and Expected Future Trends. Buildings 7 (2017) 41. https://doi.org/10.3390/buildings7020041
- A. A. S. Bahdad, S. F. S. Fadzil, N. Taib, Optimization of Daylight Performance Based on Controllable Light-shelf Parameters using Genetic Algorithms in the Tropical Climate of Malaysia, Journal of Daylighting 7 (2020) 122-136. https://doi.org/10.15627/jd.2020.10
- M. H., Elina & R. M. Yazit, R. N. Syaheeza, A. Fadli, I. Wan & J, Nor, Light, Daylighting and Fluctuation of Illuminance Level in Office Buildings, in: IOP Conference Series: Materials Science and Engineering, 2018. https://doi.org/10.1088/1757-899x/401/1/012021
- IES, Recommended Practice for Daylighting Buildings, New York, NY: Illuminating Engineering Society of North America, 2013, 5-13.
- M. F. Sadin, M. A., Ibrahim, & K. Sopian, The performance of external shading devices and daylighting rule of thumb for a tropical climate, Latest Trends in Renewable Energy and Environmental Informatics (2013) 130- 137.
- Y-W. Lim, M. Ahmad, & D. Ossen, Internal Shading for Efficient Tropical Daylighting in Malaysian Contemporary High-Rise Open Plan Office, Indoor and Built Environment 22 (2013) 932-951. https://doi.org/10.1177/1420326x12463024
- M. Bodart, R. De Penaranda, D. Arnaud, F. Gilles, A Web Tool for the Choice of Daylight Scale Model Materials in: PLEA2006 - The 23rd Conference on Passive and Low Energy Architecture, 2006, Geneva, Switzerland. https://doi.org/10.35199/epde2019.46
- J. Mardaljevic, Verification of program accuracy for illuminance modelling: assumptions, methodology and an examination of conflicting findings, Lighting Research & Technology 36 (2004) 217–239. https://doi.org/10.1191/1477153504li120oa
- Weatherspark, Average Weather in Johor Bahru, Malaysia. Retrieved June 22, 2020, from https://weatherspark.com/y/113804/Average-Weather-in- Johor -Malaysia-Year-Round.
- Konica Minolta, Illuminance Meter T-10A Series, Konica Minolta Inc. 2012.
- S. Luis, C. Luisa, Assessing the glare potential of side-lit indoor spaces: a simulation-based approach, Architectural Science Review (2020). https://doi.org/10.1080/00038628.2020.1758622
- C. Aini, & N. Rosyidah, R. Mangkuto & M. Koerniawan, Sensitivity analysis of various ambient parameters for simulating an anidolic daylighting system, in: ASA- the 53rd International Conference of the Architectural Science Association, 2019, Roorkee.
- D. Chi, E. Brembilla, & J. Mardaljevic, Evaluation of daylighting performance in a retrofitted building façade, in: Proceedings of 33rd PLEA International Conference, 2017, Edinburg.
Copyright © 2021 The Author(s). Published by solarlits.com.

2858
Total views
Citations
SHARE ON


