
Soroush Hassanzadeh, Abbas Tarkashvand*
Author affiliations
School of Architecture and Environmental Design, Iran University of Science and Technology (IUST), Tehran 16846-13114, Iran
*Corresponding author.
soroush.hassanzade@gmail.com (S. Hassanzadeh)
tarkashvand@iust.ac.ir (A. Tarkashvand)
History: Received 2 July 2026 | Revised 26 July 2026 | Accepted 5 August 2026 | Published online 25 October 2026
Copyright: © 2026 The Author(s). Licensee Solarlits Limited (Hong Kong). This is an open access article distributed under the terms and conditions of the Creative Commons Attribution 4.0 License.
Citation: Soroush Hassanzadeh, Abbas Tarkashvand, A Multilevel Penalty Function-Based NSGA-II Framework for Vertical Shading Devices: Optimizing Daylight Performance, Journal of Daylighting, 13:2 (2026) 660-681. doi: 10.15627/jd.2026.36
Abstract
Shading devices have a significant role in controlling the balance of daylight availability and solar control in office buildings. However, previous studies have focused primarily on horizontal shading systems, kinetic facades or conventional flat vertical fins. The potential of curved vertical fins in optimizing daylight has not been studied. Furthermore, the penalty schemes used in most optimization studies are uniform and do not guide the search process well towards solutions satisfying the performance requirements. The present study proposes a daylight-driven optimization framework for curved vertical shading devices applied on a south-facing office façade in Tehran, located in a hot semi-arid climate. The proposed framework combines parametric modelling, annual daylight simulation and NSGA-II optimization with a new LEED-inspired multilevel penalty function. The approach was two-stage: parametric exploration of simple shading configurations followed by form-finding optimization of curved vertical fins defined by 5 control points. The optimization was performed to maximize Useful Daylight Illuminance (UDI) and Spatial Daylight Autonomy (sDA) while minimizing Annual Sunlight Exposure (ASE). About 1,800 assessed design alternatives reached UDI values of 78.51–86.82%, sDA values of 75.89–94.64%, and ASE values of <10%, fulfilling all the preset daylight-performance criteria. The results show that the adoption of curved vertical fins significantly expands the feasible solution space compared to the conventional uniform-depth systems. Further sensitivity analysis revealed that the upper control points of the fin profile have the biggest influence on the daylight performance, while the lower control points have only small effects. The proposed framework offers an effective strategy for daylight-responsive facade design and demonstrates the potential of integrating geometric adaptability with graded constraint handling in performance-based architectural optimization.
Keywords
curved vertical fins, daylight performance optimization, NSGA-II, graded penalty function, LEED daylight credits
Nomenclature
| ASE | Annual Sunlight Exposure |
| sDA | spatial Daylight Autonomy |
| UDI | Useful Daylight Illuminance |
| NSGA-II | Non-dominated Sorting Genetic Algorithm |
| LEED | Leadership in Energy and Environmental Design |
| WWR | Window-to-Wall Ratio |
| NMBE | Normalized Mean Bias Error |
| BSh | Köppen hot semi-arid climate classification |
| CP1–CP5 | Control Point 1 through Control Point 5 |
| MCDM | Multi-Criteria Decision Making |
| BIPV | Building-Integrated Photovoltaics |
| DGP | Daylight Glare Probability |
| LSH | Energy Use Intensity |
1. Introduction
Buildings are among the main contributors to global energy consumption and environmental pollution. This sector accounts for approximately 40% of the world’s total energy consumption and 30% of the world’s greenhouse gas emissions [1]. Built environments are projected to double in size by 2050 due to rapid population growth and urbanization, especially in developing countries [2]. Office buildings have considerable potential for energy savings and carbon emission reduction because they are widely distributed and are occupied for extended operating hours [3,4].
Office buildings are the everyday workplaces of many; sufficient indoor environmental quality is not just an expectation, but a functional necessity. The interior environmental quality has a direct effect on the physical and emotional health of the occupants, their job satisfaction and productivity of the organization [5]. Daylight is an important element of the spatial quality. Daylighting has been shown to affect the human circadian cycle and improve physiological health and fatigue stemming from long hours spent working in enclosed spaces, as well as providing natural light and lessening reliance on artificial lighting. In addition, the visual connection to the outside through windows and the possibility of seeing natural or urban landscapes are important elements in improving the happiness and psychological well-being of the users [6,7]. Visual connection with the outdoor environment creates a more pleasant indoor atmosphere that helps to reduce stress and improve the cognitive and occupational effectiveness [8,9].
To solve these problems, shading devices have been widely recognized as one of the most effective passive design strategies to control direct solar radiation. Well-designed shading systems can provide a balance between adequate daylighting and glare control by limiting excessive sunlight penetration while maintaining sufficient levels of indoor illumination. Therefore, they can decrease energy consumption for cooling and lighting, as well as improve the thermal and visual comfort [10-14]. However, poorly designed shading systems can block beneficial daylight during cold seasons, increase artificial lighting demands and negatively influence outdoor visibility and occupant experience [15,16].
One of the many shading typologies that has received a lot of attention for its ability to offer selective solar protection without totally obscuring the external views is vertical fins. Their efficacy has been shown, especially, on east and west façades where the incidence angles of the sun are more effectively controlled by the use of vertical elements [17,18]. However, the performance of vertical shading devices is dependent on a number of interrelated design variables such as fin depth, spacing, orientation, geometry and distance from the façade, making the identification of optimal solutions difficult using conventional design approaches [9,19,20, 21].
Recent advances in parametric design, evolutionary computation, machine learning and biomimetic design have vastly increased the possibilities for façade optimization. Several studies have applied genetic algorithms and multi-objective optimization techniques to improve the daylighting performance and energy efficiency [22]. In the hot-dry climatic zone of Tehran, Hakimiazar et al. [23] simultaneously optimized sDA, DGP, EUI, Tc and UDI by NSGA-II. They reported large gains in daylight autonomy and reduction of glare. Ahmed et al. [24] used the Galapagos genetic algorithm to minimize annual energy consumption and cooling loads in Abu Dhabi. Chen et al. [25] applied ant colony optimization to optimize external louvers for visual comfort. To mitigate the increasing computational cost of complex geometries, Hazbei et al. [26] proposed a framework that combines NSGA-III, surrogate models and Tabu search. Lin and Tsai [27] showed that machine learning models can serve as an effective replacement of simulation-based evaluation, which can significantly reduce computational time with good prediction accuracy.
A structured review of twenty recent studies on daylighting and shading-device optimization is presented in Table 1. The reviewed research covers a wide range of climatic conditions, façade typologies, optimization methods, and performance objectives. As shown in Table 1, most studies employ parametric simulation environments based on Rhinoceros, Grasshopper, and Ladybug Tools, frequently combined with multi-objective optimization algorithms such as NSGA-II, Galapagos, Wallacei, and Octopus. The dominant performance indicators include UDI, sDA, ASE, DGP, EUI, and energy consumption metrics. The review further reveals a growing interest in machine learning-assisted optimization, kinetic façades, biomimetic systems, and photovoltaic-integrated shading solutions. However, relatively few studies have focused on the optimization of vertical shading devices for south-facing office façades, particularly using complex geometries and advanced constraint-handling strategies.
Table 1

Table 1. Review of characteristics-based approach, function of daylighting and shading devices.
The geometries of shading have also been investigated in the case of static and dynamic systems. Kim et al. [28] showed that the performance of ASE and sDA can be significantly improved with optimized horizontal and multidirectional shading systems. Brzezicki [29,30] studied dynamic vertical-fin and split-horizontal systems in different climatic conditions and reported substantial improvements in UDI performance. Rubel and Joarder [31] found the optimal trade-off between daylight availability and glare reduction for mesh-type shading systems. Jiang et al. [32] showed the energy-saving potential of curved mesh shading canopies for a number of Chinese climates. Rezakhani and Kim [33] optimized hexagonal, triangular and square façade configurations at the level of geometric patterns, and found better structural and visual performance of hexagonal patterns. Lee and Kang [34] also experimentally demonstrated considerable lighting energy savings by integrating daylight-concentrating louvers with dimmable LED systems.
Another active line of research deals with the integration of shading systems with photovoltaic technologies and adaptive façades. Alsukkar [35] developed photovoltaic-integrated louvers that are able to keep the indoor illuminance within an acceptable range. Liang et al. [36] showed that photovoltaic louvers could reduce thermal discomfort and provide a large share of the building’s annual energy requirements.
Jayakumari et al. [37] also found that kinetic façades integrated with building-integrated photovoltaics (BIPV) can significantly reduce the overall energy consumption and help with the on-site electricity generation.
Another promising strategy for the design of responsive façades is based on biomimetic approaches. Based on the natural adaptive mechanisms, Fattah et al. [38] developed a bio-kinetic façade which mimics the cactus stomata behavior, resulting in significant reductions of cooling energy in different climates. Similarly, Farmani et al. [39] proposed a decentralized kinetic façade based on the Venus flytrap and reported significant reductions in ASE and DGP while maintaining high UDI performance. Other studies have focused on user-oriented aspects of façade design. Abdolhamid et al. [40] showed that parametric patterned façades can enhance concentration and spatial performance, and Mehrvarz et al. [41] emphasized the advantages of integrating passive architectural strategies with adaptive shading systems. Ebrahim et al. [42] demonstrated that the integration of horizontal and vertical louvers could significantly reduce the annual energy consumption of container-based buildings.
Nevertheless, two important research gaps remain. Most of the previous studies were focused on horizontal shading devices, mesh systems, kinetic façades, photovoltaic-integrated solutions or east and west oriented vertical shading systems [28,31,32,36,37].
Horizontal shading is generally preferred and few studies have focused on optimizing vertical shading devices for south-facing façades [7,13]. Some researchers have even questioned the effectiveness of vertical fins on southern exposures. For example, Brzezicki [29] concluded that vertical fins rotating on a south façade improved daylight availability but were insufficient for glare control. Furthermore, past studies have primarily considered simple geometries of flat fins with fixed angles [11,12,29]. Therefore, the optimization potential of curved vertical fins is still largely unexplored particularly in the hot-dry climate of Tehran [13,20].
The second research gap is in optimization method. Most of the current NSGA-II-based studies mainly apply uniform penalty functions or post-optimization weighting methods to deal with performance constraints [22–26,39,43]. As a result, solutions that nearly meet daylight-performance targets are often penalized as harshly as solutions that significantly violate these targets. To the best of our knowledge, no study has combined a graded penalty function based on discrete thresholds for daylight performance according to LEED with the optimization of façade shading devices [22,23-26,39-45].
Climate—tropical rainforest: Af, humid continental: Dfb, humid continental climate: Dwa, humid subtropical climate: Cfa, warm desert: BWh, marine west coast: Cfb, mild and semi-humid: Csa, monsoonal humid subtropical climate: Cwa, tropical savanna: Aw, semi-arid: BSh, and tropical and subtropical steppe: BSK. Building occupancy—residential: Res and Office: Off. Software—Rhinoceros: RH, Autodesk Revit: RVT, Autodesk AutoCAD: ACAD, SketchUp: SkP, and IDA Indoor Climate and Energy: IDA ICE. Plug-ins—Ladybug Tools: LBT, Climate Studio: CS, Parametric Modeling: PM, Grasshopper: GH, Energy Plus: EP, Radiance: R, Wallacei X: WX, Galapagos: GP, Octopus: OP, DIVA: D, and Karamba: K. Method—parametric simulation: PS, biomimetic: B, Experimental: Exp, Multi objective optimization: MOO, Particle Swarm Optimization: PSO, Ant Colony Optimization: ACO, machine learning: ML, sensitivity analysis: SA, genetic algorithms: GAs, computer-aided design: CAD. Targets—Useful Daylight Illuminance: UDI, average Illuminance: aI, Annual Sunlight Exposure: ASE, spatial Daylight Autonomy: sDA, Energy Use Intensity: EUI, Energy Consumption: EC, Daylight Autonomy: DA, Photo Voltaic Power Generation: PVPG, Cooling: C, Heating: H, Lighting: L, Solar Incident Radiation: SIR, Glare Autonomy: GA, spatial Daylight Glare: sDG, Predicted Mean Vote: PMV, daylight glare probability: DGP, CO2 emission: CO2e, Operational costs: OC, Reaction Force: RF, Node Force: NF, and Energy Deformation: ED.
To address these gaps, this study aims to present a systematic two-stage optimization framework for vertical shading devices on the south façade of office buildings in Tehran. In the first stage, a parametric analysis of flat vertical fins and reference horizontal shading systems is performed to identify promising design ranges and reduce the search space. The second stage optimizes curved vertical fins to test if increased geometric complexity improves daylight performance over conventional flat configurations. The optimization is carried out using NSGA-II algorithm to maximize UDI and sDA and minimize ASE [17,19,20]. Furthermore, a new graded penalty function based on LEED is proposed in this study, assigning different penalty factors according to discrete performance thresholds for sDA, ASE and UDI. The proposed framework steers the optimization toward solutions that satisfy the daylight-performance credits, rather than simply improving the raw metric values, as is the case with the conventional uniform penalty schemes.
As shown in Table 1, most of the existing works are devoted to horizontal louvers, kinetic systems, mesh-based shading devices, photovoltaic-integrated façades or east and west oriented applications. Furthermore, although multi-objective optimization techniques are commonly used, the majority of surveyed works rely on traditional penalty schemes or post-processing weighting methods. The combination of vertical shading devices with curved shape, south façade application and LEED based graded constraint handling is still very much under explored.
Thus, the present study addresses the following research questions:
- What are the best combinations of the number of fins and the depth of individual vertical segments of the vertical shading devices with the best trade-off between the availability of daylights and the solar control in a south facing office façade of Tehran?
- What geometric design variables have the most influence on this performance trade-off, as described by five independent control points defining the curved fin profile?
The main contributions of this study are: (1) development of a parametric optimization framework for south-facing vertical shading devices in the hot-dry climate of Tehran; (2) systematic comparison of flat and curved vertical-fin geometries through a two-stage optimization procedure; (3) application of a LEED-based graded penalty function within the NSGA-II framework; and (4) identification of most influential geometric variables that affect daylight-performance trade-offs.
2. Method
This work proposes the inverse design (Figure 1) method to optimize the external shading devices for an office building in a BSh Köppen climate. An inverse design approach was adopted because it starts from the desired daylight-performance targets and searches backward through the geometric parameter space to identify satisfying configurations, rather than evaluating a fixed, designer-specified geometry as in a conventional forward workflow. This is well suited to the present problem, where the design space (five independent control points per fin, plus fin count) is too large for manual exploration, and the three coupled daylight objectives (UDI, sDA, ASE) often conflict, making a systematic optimization-driven search more reliable than forward trial-and-error. The workflow combines parametric modeling, annual daylight simulation and multi-objective optimization to explore the relationship between shading geometry and daylight performance. The Methodology is organized in sequential stages, beginning with the definition of an office reference model. In the first step, a set of simple shading devices were modeled and a brute force simulation approach was implemented to evaluate their daylight performance for a wide range of geometric configurations. Next, an appropriate range for the number of shading elements is set and parametric shading models are created for the form-finding process. Then, multi objective optimization was performed using NSGA II algorithm. Finally, a correlation matrix was applied to study the relationships between the design variables and the daylight performance metrics. From this matrix the most influential design variables were identified. The results obtained in the optimization stage demonstrated superior performance than the initial brute force simulations.
Figure 1

Fig. 1. An inverse design model for the form-finding of the vertical fins.
Parametric modelling and environmental analysis tools were used for daylight performance assessment, including Rhinoceros, Grasshopper, Ladybug Tools, and Design Explorer. These tools enable a comprehensive evaluation of daylight performance how daylight is performing at the office [46,47]. Colibri was used as the brute force plug-in, Wallacei as the optimization tool.
2.1. Simple shading devices
This phase represents a preliminary screening of simple shading configurations using the Colibri plugin. In this phase, all vertical fins have a common uniform depth variable (0.10 m to 0.80 m) and the number of fins is considered as a discrete variable (Figure 2(a) and Table 2). Two horizontal shading cases are defined as baseline references, one at the mid height of the window and another at the top edge of the window (Figure 2(b)). These horizontal shadings also have the same uniform depth variable as the vertical fins. These horizontal cases are not form optimized but are used as performance references (Figure 2(c).
Figure 2

Fig. 2. Illustrates the variables of shading devices in brute force phase.
Table 2

Table 2. Simple shading devices variables.
To determine the range of fin counts that provide at least a minimal useful impact on daylight performance, a parametric exploration was conducted using the Colibri plugin in Grasshopper and Ladybug Tools. The study employs daylight performance simulations to determine the best form using climate-based daylight modeling metrics, including spatial daylight autonomy (sDA), useful daylight illuminance (UDI), and annual sun exposure (ASE).
The space is considered to be “daylit” when its spatial daylight autonomy (sDA) is 50% or higher, which means a minimum illuminance of 300 lux [47]. Useful daylight illuminance (UDI) is an annual measure of daylight availability in which illuminance levels between 100 and 3000 lux are suitable for common activities, below 100 lux is insufficient and above 3000 lux may cause visual discomfort [48]. Annual sunlight exposure (ASE) is the fraction of a space that receives an over-illumination of direct sunlight. The ambient radiance parameters used in the simulations (Table 3) are based on the settings recommended for climate-based daylight modelling with Radiance by Brembilla & Mardaljevic [47], and represent a compromise between simulation accuracy and computational cost for annual daylight coefficient-based calculations.
The results of this screening phase narrowed the search space for the number of fins and informed the subsequent form-finding phase.
Table 3

Table 3. Ambient parameters.
2.2. Parametric form-finding and optimization
A more detailed parametric model was developed using the effective range of fin counts obtained from the previous phase. Five control points (CP1 to CP5) are evenly distributed along the height of the window, from the bottom edge (CP1) to the top edge (CP5). The depth of each control point (offset perpendicular to the façade) is an independent continuous variable and the search range is 0.10m to 0.80m. The connection of these 5 points generates a continuous curved profile for each vertical fin. The number of fins is also considered as an independent variable. Two baseline reference cases of horizontal shading are defined, one at the mid height of the window (at the height of CP3), with the depth being controlled by the depth of CP3, and the other at the top edge of the window (at the height of CP5), with the depth being controlled by the depth of CP5 (Figure 3(b)). Table 4 illustrates the optimization model parameters.
Figure 3
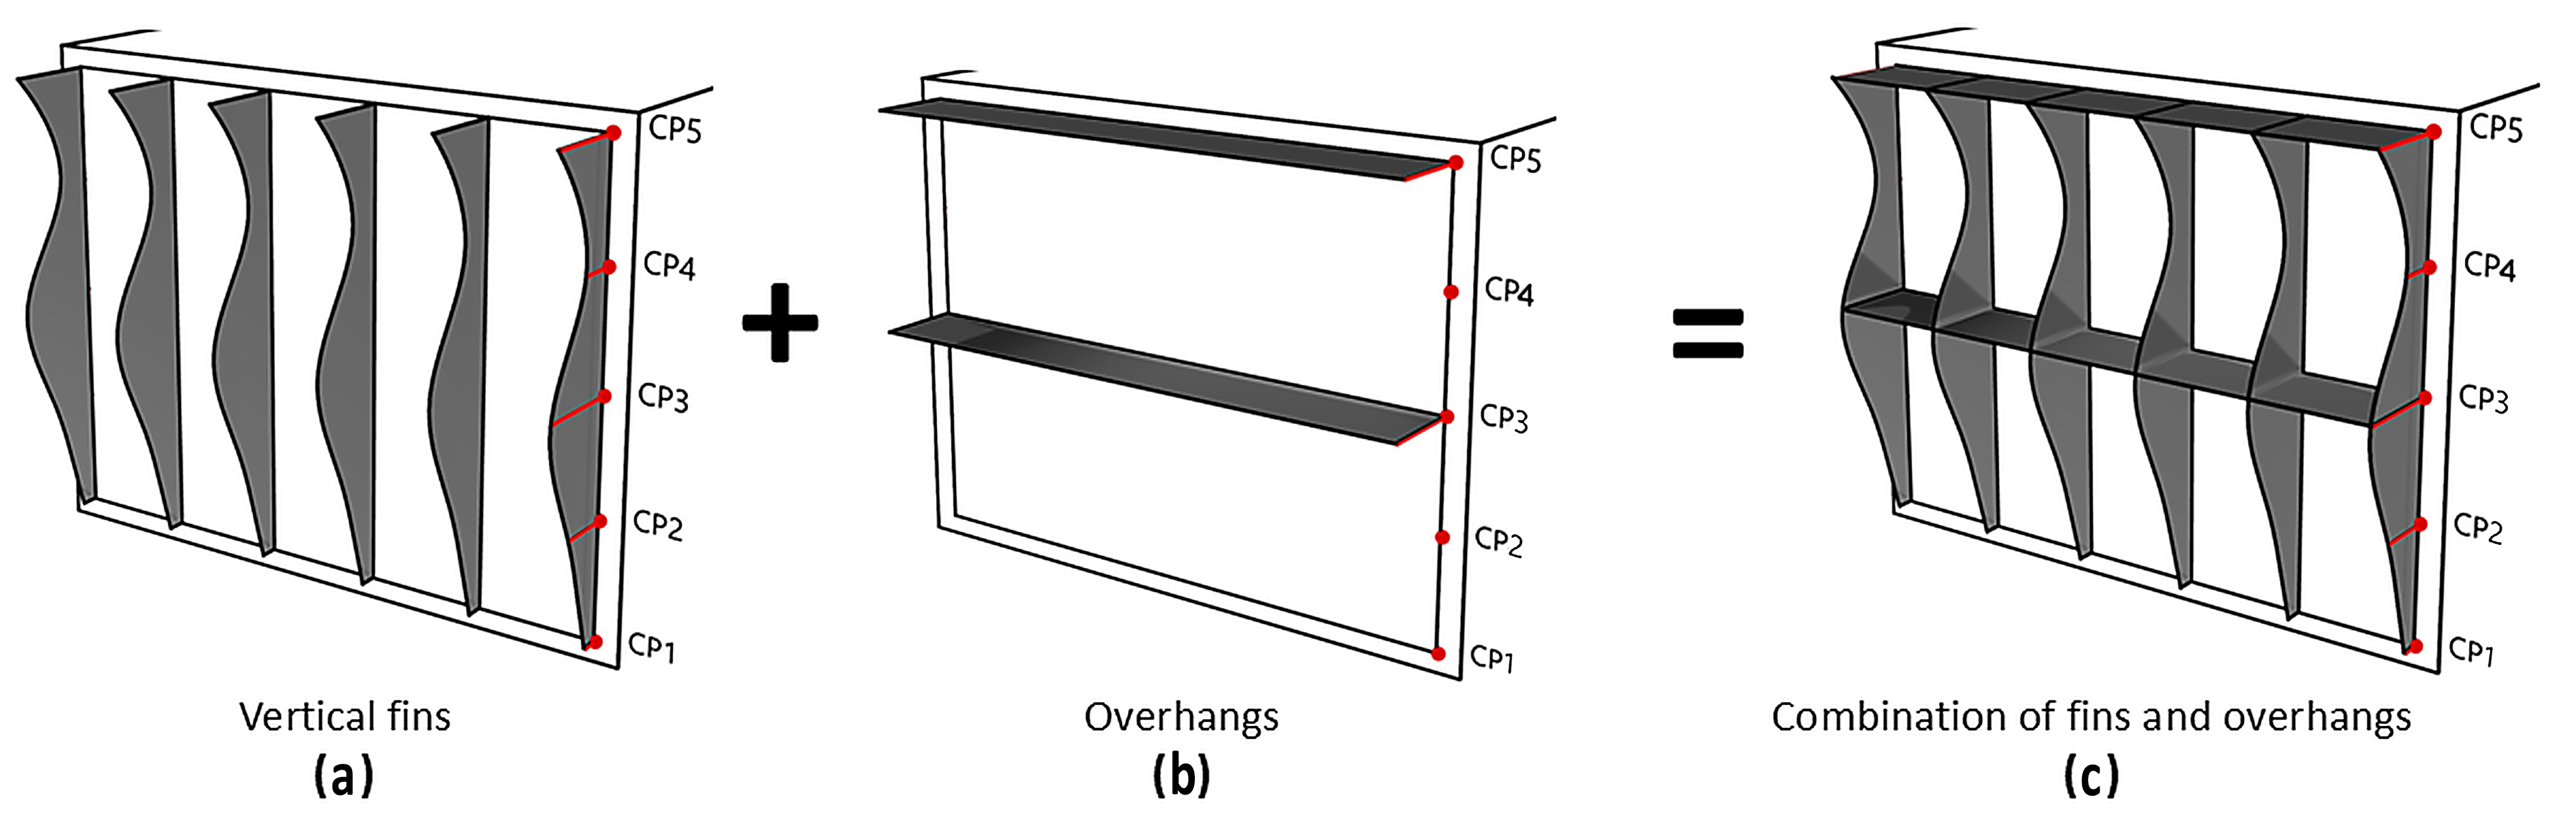
Fig. 3. (a) Vertical fins. (b) Horizontal overhangs. (c) Combination of curved fins and overhangs.
Table 4

Table 4. Optimization model parameters.
The optimization is performed using the NSGA II algorithm implemented via the Wallacei plugin within Grasshopper, with a generation size of 30 and a generation count of 60. The three objective functions are daylight performance metrics: spatial Daylight Autonomy (sDA) and Useful Daylight Illuminance (UDI), both to be maximized, and Annual Sunlight Exposure (ASE), to be minimized. All simulations are conducted using Radiance as the daylight engine through Honeybee Radiance, employing annual climate data for Tehran.
The genetic algorithm is guided by a graded penalty function for each objective to solutions satisfying Daylight Performance Standards established by the authors. One of the simplest and most popular ways of dealing with constraints in evolutionary algorithms are penalty functions [49,50]. The main idea is to convert a constrained optimization problem that is difficult to solve directly into a simpler unconstrained optimization problem [51]. This is achieved by modifying the objective (fitness) function of the algorithm; if a potential solution violates a given constraint, a penalty term is added to the raw value of its objective function [52].
In mathematics, it can be represented as:
In the equation is the penalized fitness value, is the original objective and is the penalty function which produces a non-negative penalty corresponding to the degree of constraint violation. The main goal is to penalize the infeasible solutions by assigning them a disadvantage in terms of fitness, so that the population is guided to the feasible regions of the search space in successive generations [53,54].
While the constrained evolutionary optimization literature has investigated graded or multilevel penalty schemes as an alternative to uniform, binary feasible/infeasible penalty formulations [55], the application of such schemes to daylight-driven façade optimization has not been reported. The current study offers two specific methodological contributions. First, the discrete penalty thresholds are not arbitrarily defined, but directly based on the performance credit tiers of the LEED v4.1 daylight rating system [45].
Therefore, the graded structure is anchored to an established, verifiable industry benchmark, rather than a study-specific heuristic. Second, this LEED-anchored graded structure is used simultaneously and independently for three coupled daylight objectives (UDI, sDA and ASE) in a single NSGA-II-run for a high-dimensional curved-geometry search space (five independent control points), rather than for one objective or simple geometric parametrization. This combination of LEED-based thresholds, applied in parallel to multiple daylight metrics, in a morphologically complex design space, sets the present framework apart from previous applications of NSGA-II with uniform penalty schemes [23-25].
The penalty coefficients are alpha, beta and gamma. (There is a penalty function for each performance indicator.) The penalty values are multiplied to the corresponding raw objective values directing the optimization search to LEED satisfying regions (see Appendix A, Figure A1).
The penalty coefficients (alpha = 80 for UDI, beta = 80 for ASE, and gamma = 100/90/80 for the three sDA sub-ranges) were selected such that the penalty term dominates the raw objective value (which is 0 to 100 for all three metrics), ensuring that infeasible solutions are always heavily penalized over feasible solutions, regardless of how close the raw performance value is to the threshold.
The tiered gamma values for sDA (100, 90, 80 for successively more proximate sDA ranges below the 75% threshold) are based on the three-tier LEED v4.1 daylight credit structure for spatial daylight autonomy, where successively lower sDA bands correspond to a loss of successively higher credit levels; the coefficients were made proportionally steeper for the lowest-performing band to more strongly discourage solutions far from compliance. These values were selected based on preliminary trial simulations to ensure a sufficiently strong and consistent directional gradient across generations, rather than via formal sensitivity optimization of the coefficients themselves; a systematic calibration of these coefficients is mentioned as a direction for future work in Section 4.3.
The discrete, threshold-based graded penalty structure derived from LEED distinguishes the present methodology from previous studies applying the NSGA II with uniform penalty schemes [23-25].
The NSGA II algorithm is run with the defined design variables (depths of 5 control points and number of fins), objective functions (sDA, ASE, UDI) and the graded penalty multipliers. The Wallacei plugin evaluates the population for each generation. Non dominated sorting and crossover and mutation operations are applied. The simulation outputs (raw sDA, ASE, UDI values) are recorded together with the penalized objective values.
2.2.1. Rationale for the graded penalty structure
Unlike the binary or uniform penalty schemes commonly adopted in prior NSGA-II-based façade optimization studies [23–26], where a solution is treated as either feasible or infeasible with no distinction in the degree of violation, the present penalty structure was designed a priori to scale with the distance of a solution from each LEED v4.1 daylight-credit threshold. The coefficients (alpha = 80 for UDI, beta = 80 for ASE, and gamma = 100/90/80 for the three sDA sub-ranges) were selected so that the penalty term dominates the raw objective value for any solution that does not satisfy the corresponding LEED threshold, while the tiered gamma values reflect the three-tier LEED v4.1 credit structure for spatial Daylight Autonomy. This design choice grounds the penalty structure in an established, verifiable industry benchmark rather than an arbitrary study-specific weighting. To empirically test this design choice, an additional control optimization run was performed using a uniform (non-graded) penalty scheme under otherwise identical NSGA-II settings, design variables and simulation parameters; the results of this comparison are reported in Section 3.4.
2.3. Statistical analysis and final solution selection
The Pareto front solutions are extracted after optimization and analyzed statistically. Correlation analysis is performed to understand which of the five control point depths has the largest impact on the trade-off between useful daylight provision and glare control (sensitivity analysis). Relations between variables and objectives are visualized with scatter plots, parallel coordinate plots and heatmaps.
The final ranking of design alternatives was based on the penalized objective values ( ) produced by the graded penalty function described in Section 2.2, rather than on the raw UDI, ASE and sDA values. For each design alternative, an aggregate score was computed as the unweighted sum of these three penalized outputs:
Because the penalty function already embeds the LEED-based alpha, beta and gamma coefficients, this aggregate score implicitly inherits the relative weighting established in Section 2.2 rather than applying an additional, independent set of weights across the three objectives. Design alternatives were then sorted in ascending order of this aggregate score, since lower penalized values correspond to solutions that more fully satisfy the LEED-based daylight-performance thresholds; the twenty alternatives with the lowest aggregate scores were retained as the final ranked set. This multi-criteria ranking procedure was used to select the single optimal configuration presented as the final outcome of the proposed framework — the one that best balances sDA, ASE and UDI while satisfying the LEED-inspired penalty criteria.
2.4. Case study
2.4.1. Base model definition
All simulations were performed on a baseline scenario of a common office room. The geometric features were maintained constant in the study, based on the well-established Reinhart office room model [47]. This space is used as the reference environment for the evaluation of energy and daylight performance. The dimensions of the room and the properties of the materials are given in Table 5. The climate of the selected location is classified as hot semi-arid (Köppen: BSh) The corresponding weather file was taken from the EnergyPlus database. Figure 4 shows the chart of global solar radiation, diffuse solar radiation, direct solar radiation and dry bulb temperature for Tehran, Iran, which shows the annual distribution of global horizontal irradiance.
Figure 4

Fig. 4. Annual climate data for Tehran (Mehrabad): global horizontal, diffuse horizontal and direct normal radiation, and dry bulb temperature.
Table 5

Table 5. Base model description.
The office model consists of a single enclosed zone situated on the first floor. Its internal dimensions are 3.60 m in width, 8.20 m in depth, and 2.80 m in height (Figure 5). All internal partitions, the floor, and the ceiling were modelled as adiabatic surfaces. The south facing exterior wall, which is part of the building façade, features a window to wall ratio (WWR) of 85%. The work plane height was set to 0.8 m above the floor for sensor placement (Figure 5). Table 5 provides detailed information on the optical properties of the material surfaces used in the model.
Figure 5

Fig. 5. The room definition.
2.4.2. Daylight simulation validation
To validate the accuracy of the simulation, the annual daylight simulations were performed for the same case study room as Reinhart [45]. The sDA, UDI and ASE simulation results were compared between the two studies for different window-to-wall ratios from 30% to 90% with a 5% interval under the same optical properties and office dimensions (Figure 6). The examination was performed using the normalized mean bias error (NMBE). According to ANSI/ASHRAE Standard 140, a model is considered calibrated when the NMBE is within ± 10% for hourly data or ± 5% for monthly data [52]. The comparative study showed that all NMBE values were within the permissible limit of less than 5%, namely −2.95%, -1.37% and −3.85% for sDA, ASE, and UDI, respectively. Thus, our daytime simulation has been verified.
Figure 6

Fig. 6. Comparison of average annual sDA, ASE and UDI metrics for the base model validation between ClimateStudio (CS) and Ladybug Tools (LBT) simulations.
3. Results
The simulation procedures were fully performed in the exact order of the steps as mentioned in the methodology section. We therefore show the results of these simulations as follows.
3.1. Results of simple shading device simulations
Figure 7 illustrates a parametric analysis of a simple shading device based on a climate-responsive daylight modeling standard. The image employs parallel coordinate charts to illustrate various design elements and performance outputs along vertical axes. The design variables are the number of fins and the extent of shadowing (fins and overhangs). The outputs include measurements of daylight performance, notably sDA (spatial daylight autonomy), UDI (useful daylight illuminance), and ASE (annual solar exposure). These are measures of the quality of daylight. The lower diagram illustrates a chosen collection of design concepts that satisfy the criteria: sDA > 75%, ASE < 10%, and UDI > 75%.
Figure 7

Fig. 7. Parametric exploration of a simple shading device based on a climate-responsive daylight.
3.1.1. The analysis of the results was carried out in phase 1 based on daylight metrics
The daylight performance of the generated façade configurations was evaluated using three complementary daylight metrics, i.e. Useful Daylight Illuminance (UDI), Spatial Daylight Autonomy (sDA) and Annual Sunlight Exposure (ASE). These metrics provide different perspectives on daylight quality, from daylight availability and its spatial distribution to the risk of excessive solar exposure. The results are discussed separately for each daylight metric to offer a comprehensive evaluation of the effectiveness of the proposed design alternatives. The overall daylight performance is highlighted with respect to the depth of façade and the number of panels. In Figure 8 and Figure 9, the dashed horizontal lines labeled "Credit" indicate the performance thresholds defined by the LEED v4.1 daylight rating system, whereby a design alternative earns a specific daylight credit once its UDI or sDA value exceeds the corresponding threshold; sDA in particular is evaluated against three successive LEED credit tiers (Credit 1, 2 and 3), each corresponding to progressively stricter daylight-autonomy requirements, as reflected in the tiered gamma coefficients of the penalty function described in Section 2.2.
Figure 8

Fig. 8. Effects of the number of the fins and depth of shading elements on UDI.
Figure 9

Fig. 9. Impact of fin quantity and shading element depth on sDA.
The UDI results (Figure 8) show a clear positive correlation between the depth of the façade and daylight quality. The percentage of occupied hours within the useful illuminance range generally improved with increasing depth for all design alternatives. This trend suggests that the deeper façade configurations are more efficient in filtering the excess of daylight while providing an acceptable level of illumination in the occupied zone. In addition, the higher the number of the panels, the better the UDI results were, which suggested a more balanced distribution of daylight and a reduction of both underlit and overlit conditions.
The sDA analysis showed that all configurations gave high levels of daylight autonomy, but with an increase of façade depth, daylight penetration was gradually decreased. This reduction is expected, as deeper façade elements create more shade, but most design alternatives still achieved acceptable levels of daylight autonomy. The results therefore show a trade-off between maximizing daylight availability and controlling direct solar radiation, where deeper configurations slightly reduce daylight penetration but contribute to improved daylight quality (Figure 9).
The ASE results were in the opposite trend to UDI.
Increasing the façade depth drastically reduced the amount of annual sunlight exposure, thus indicating a lower probability of visual discomfort, glare and overheating due to excess of direct sunlight. Shallow façade configurations were generally associated with higher exposure levels, while deeper alternatives significantly improved solar control performance. This ASE reduction demonstrates the efficacy of the proposed façade geometries to reduce the excessive solar gains while maintaining acceptable daylight conditions (Figure 10).
Figure 10

Fig. 10. Effects of the number of the fins and depth of shading elements on ASE.
Overall, the joint assessment of UDI, sDA and ASE shows that façade depth is a critical aspect to reach a balance between daylight availability and solar control. Greater configurations, while slightly reducing daylight autonomy, also increase the proportion of useful daylight and greatly reduce overexposure to sunlight. Therefore, the best solutions are found within the medium and deep façade configurations where a more balanced daylight performance is obtained across all the evaluated metrics.
3.2. The analysis of the results optimization
Figure 11 presents the results of the daylight-driven parametric optimization process using a parallel coordinate plot. The upper diagram includes the complete design space consisting of approximately 1,800 simulated alternatives, while the lower diagram shows only the solutions that satisfy the predefined performance criteria (UDI > 75%, sDA > 75%, and ASE < 10%). Each polyline represents one design alternative, linking the values of the five design variables (CP1–CP5) to the corresponding daylight performance indicators.
Figure 11

Fig. 11. The results of the daylight-driven parametric optimization process using a parallel coordinate plot.
The top plot shows the complete design space with more than 1,800 simulated options. The bottom plot shows only the solutions that meet the required performance criteria (UDI > 75%, sDA > 75% and ASE < 10%). Each line in the figure represents a design alternative, showing the values of the five design variables (CP1–CP5) against the respective daytime performance metrics.
The upper graph shows the distribution of the daylight performance over the whole design space, which consists of about 1800 simulated alternatives. The distribution of design variables (CP1-CP5) is fairly uniform within the feasible region, indicating that the optimization approach explored a large number of geometric configurations rather than a small region of the search space. This broader scattering indicates successful exploration during the evolutionary process. The population UDI levels vary from 65.88% to 86.82%, reflecting the large variation in the potential of different layouts to provide adequate daylight conditions. Some alternatives are characterized by high UDI values. This distribution shows that the interaction of design elements has a significant impact on daylight availability.
From the color gradient from blue to red it can be seen that the more advantageous solutions correspond to certain combinations of the parameters along the axes of the CP3, CP4 and CP5. The highest variation of the performance of the evaluated parameters is the ASE, with a variation from 0% to 31.25%. Such a broad variation indicates that certain configurations are successful in limiting excessive solar exposure, while others allow considerable solar penetration over the entire year. The polylines are diverging a lot around the ASE axis. This means that the sun exposure is sensitive to the changes of the design variables. The sDA metric remains high over the explored design space, with values ranging from 65.18% to 100%. The concentration towards the upper end of the scale suggests that a substantial part of the generated alternatives can meet the requirements for sufficient daylight autonomy, while visible differences persist between the combinations of the investigated parameters.
The lower diagram shows only the solutions that satisfy the optimization goals (UDI > 75%, sDA > 75% and ASE < 10%). The density of lines drops significantly compared to the full population, indicating that a small subset of the explored design space meets all of the daylight performance requirements at the same time.
After the filtering process, the performance ranges become much tighter. The retained solutions have UDI, ASE and sDA values in the ranges 78.51-86.82%, 0-9.82% and 75.89-94.64% respectively. This is especially the case on the ASE axis, where all solutions above 10% have been eliminated.
The distribution of the design parameters within the selected subset also suggests a contraction of the feasible design space. CP1 and CP2 still have a moderate variability, while CP3, CP4 and CP5 are focused on more restricted interval and it means that these parameters have a larger influence on the daylight performance and have a more decisive role to reach the optimization objectives.
A further observation relates to the Count parameter, which stands for the number of shading elements. In the case of a shading count of four, no optimal solution was identified, even though the entire design space includes configurations with shading counts ranging from 4 to 10. This means that all configurations with only four shading elements did not meet the imposed daylight performance criteria simultaneously and were therefore excluded from the final solution set.
The selected solutions show more parallelism and clustering along the axes of the parameters compared to the highly intersecting patterns in the full population. This behavior is due to the development of more consistent relationships between parameters among the high performing alternatives and points to convergence towards a limited area of the design space where balanced daylight performance can be achieved.
The 20 highest ranked design alternatives are shown in Figure 12 to analyze the optimization results in more detail and to visualize the geometric configurations of the best daylight performance in the identified solution space.
Figure 12

Fig. 12. The 20 highest ranked design alternatives.
3.3. Correlation analysis of design variables and daylight performance metrics
Figure 13 shows the Pearson correlation matrix between the design variables and the daylight performance metrics.
All coefficients were tested for statistical significance (two-tailed, n = 1,800); unless otherwise noted below, correlations are significant at p < 0.001. Different correlation patterns are found for the control-point depths, number of fins and the three daylight indicators.
Figure 13

Fig. 13. Correlation matrix for considering the effects of count of the shading devices and control points on the daylight performance metrics.
For UDI the highest positive correlation is with CP3 (r = 0.73), followed by number of fins (r = 0.67), CP5 (r = 0.60) and CP4 (r = 0.47). CP1 and CP2, on the other hand, show weak positive correlations with coefficients of 0.03 and 0.10, respectively; the correlation between UDI and CP1 is not statistically significant (p = 0.259), while the weak UDI–CP2 correlation is significant (p < 0.001) despite its small magnitude. The absolute values of the correlations increase gradually from the lower control points (CP1–CP2) to the middle and upper control points (CP3–CP5).
A similar trend is seen for ASE. CP3 shows the strongest negative correlation (r = −0.73) followed by number of fins (r = −0.60), CP5 (r = −0.59) and CP4 (r = −0.53). The correlations for CP1 and CP2 remain near zero, with coefficients of −0.01 and −0.05, respectively; as with UDI, the ASE–CP1 correlation is not statistically significant (p = 0.737), whereas the weak ASE–CP2 correlation reaches significance (p = 0.022).
The most significant correlation for sDA is with the number of fins (r = −0.72) then CP4 (r = −0.53), CP5 (r = −0.51) and CP3 (r = −0.50). CP1 and CP2 show weak correlations with sDA, with coefficients lower than 0.10 in absolute value; unlike their relationships with UDI and ASE, both CP1 (p = 0.008) and CP2 (p = 0.002) are weakly but statistically significantly correlated with sDA.
The correlations of the daylight performance metrics are far stronger than the correlations of the design variables. UDI and ASE are highly negatively correlated (r = −0.98, p < 0.001) and UDI and sDA are also negatively correlated (r = −0.87, p < 0.001). On the contrary, ASE and sDA are strongly positively correlated (r = 0.87, p < 0.001).
The correlations between design variables are generally low. Most of the coefficients range from −0.09 to 0.14, supporting a lack of linear relationships among independent variables. The highest correlation is found between CP3 and CP5 (r = 0.40, p < 0.001), and the remaining pairs of control points have relatively lower correlation values, all statistically significant (p < 0.05) except CP1–CP5 (r = 0.02, p = 0.332). The number of fins shows weak-to-moderate, statistically significant correlations with all control points (range r = 0.07–0.22, p < 0.05 in all cases).
Given the large sample size (n = 1,800), even very small correlation coefficients reach statistical significance; the exceptions noted above (UDI–CP1, ASE–CP1, and CP1–CP5, all p > 0.05) are therefore particularly notable, as they indicate a genuine absence of linear association rather than an underpowered test. For the remaining variables, statistical significance should not be equated with practical importance: the correlation magnitudes reported above, rather than significance alone, remain the primary basis for interpreting the relative influence of each design variable, as discussed further in Section 4.2.
3.4. Comparison with a uniform (non-graded) penalty scheme
To empirically test whether the proposed LEED-anchored graded penalty structure improves the optimization search relative to a conventional uniform penalty scheme, an additional control run of 1,800 design alternatives was performed with identical design variables, objective functions and NSGA-II settings (generation size 30, generation count 60), but with the graded alpha/beta/gamma coefficients replaced by a uniform, non-graded penalty term.
Under the graded penalty scheme (Table 6), 759 of the 1,800 evaluated alternatives (42.2%) simultaneously satisfied the three LEED-based daylight criteria (UDI > 75%, sDA > 75%, ASE < 10%), compared with only 132 of 1,800 (7.3%) under the uniform penalty scheme — a 5.7-fold increase in the number of feasible solutions retrieved from an equally sized population.
Table 6

Table 6. Comparison of daylight performance metrics between graded and uniform penalty schemes.
The feasible solutions identified under the graded scheme also spanned a wider and more favorable performance range: UDI 78.51–86.82% versus 78.23–83.47% for the uniform scheme; ASE 0–9.82% versus 7.14–9.82%; and sDA 75.89–94.64% versus 79.46–94.64%. Notably, the graded-penalty population reached considerably better extremes in both directions — a maximum UDI of 86.83% (vs. 83.47% for uniform) and a minimum ASE of 0% (vs. 7.14% for uniform) — indicating that the graded penalty structure guided the search into higher-performing regions of the design space that the uniform scheme did not reach within the same population size. In both schemes, no feasible solution was found for a shading count of four, consistent with the minimum-density requirement discussed in Section 4.
These results support the LEED-anchored graded structure as a more effective constraint-handling mechanism than a uniform penalty scheme for this multi-objective daylight optimization problem, in terms of the number and quality of feasible solutions retrieved from a population of equal size. Because generation-by-generation fitness data were not recorded for either run, this comparison reflects the final-population outcome rather than a formal convergence-speed analysis; tracking feasibility across generations is recommended as a direction for future work (Section 4.3).
4. Discussion
Results reveal that the daylight performance of south-facing office façades is mainly governed by the coupled interaction of shading geometry and shading density. In the parametric space, an increase of the fin depth always improves the UDI and reduces the ASE. While at the same time a drop in the sDA is induced. This confirms the persistent trade-off between daylight sufficiency and solar admission control, where deeper fins decrease direct irradiance but also limit spatial daylight penetration. The results reaffirm the fact that single-metric optimization is insufficient to capture façade performance and that inherently multi-objective formulations are necessary.
Against the common assumption in the literature that the vertical shading systems are less effective than the horizontal devices for south-oriented façades, the present results show that their effectiveness is highly dependent on the geometric configurational freedom. By distributing control points, fin morphology can be decoupled and fin density co-modulated, enabling vertical systems to achieve performance comparable or even superior to traditional typologies in some configurations. The finding challenges the commonly reported typology-dominant view in previous studies, and emphasizes the importance of geometry-driven performance over shading classification.
Results of the optimization also show a very constrained feasibility landscape. Although we evaluated > 1,800 configurations, only a limited subset met the simultaneous thresholds of UDI > 75%, sDA > 75%, and ASE < 10%. This highlights the inherent non-linearity of daylight performance objectives and identifies the limitations of deterministic or heuristic design approaches typically adopted in previous façade studies, which are rarely able to systematically explore such high dimensional design spaces.
A remarkable result is the requirement of minimum shading density. Configurations with too few fins (e.g., four fins) always fall short of multi-criteria performance thresholds, indicating the need for a baseline spatial distribution of shading elements that can effectively regulate solar inputs. Yet, the over-densified condition gives diminishing returns as the diffuse daylight penetration is suppressed. This confirms that optimality results from a non-monotonic relationship between density and performance, and not from linear reinforcement of the quantity of shading.
The correlation analysis indicates that CP3 is the most influential parameter for both UDI and ASE, followed by CP4 and CP5 from a morphological sensitivity perspective. These parameters are related to the upper and mid height ranges of the façade, which is consistent with the sun altitude dynamics in south-oriented exposures in semi-arid climatic conditions. Note that in the present parametrization, the depths of CP3 and CP5 also control the depth of the two horizontal overhang references (at mid-window and top-edge height, respectively; Figure 3(b)), so the high sensitivity observed for these two control points is due to the combined effect of the curved vertical fin shape and the associated horizontal overhang at that height, not the vertical fin shape alone. This coupling corresponds to the established effectiveness of horizontal shading in controlling high-altitude solar incidence on south-facing façades, and suggests that part of the performance contribution attributed to CP3 and CP5 comes from this combined vertical–horizontal shading effect. The CP4, with a similar high influence but no associated overhang, indicates that the upper part of the curved vertical fin shape contributes independently to the daylight performance beyond the influence of the horizontal overhangs. The CP1 and CP2 results, which are not associated with any overhang and are found to be less sensitive, indicate that minor changes to the lower fin shape alone have a minimal effect on the annual daylight performance. This spatial variation in sensitivity stands contrary to the implicit assumption of uniform importance commonly made in parametric shading studies.
The strong inverse correlation between UDI and ASE (r = -0.98) confirms their functional coupling in the daylight performance space, where reductions in over-illumination naturally shift distributions towards useful illuminance ranges. Similarly, the inverse correlation between UDI and sDA shows a structural limitation when using daylight autonomy alone as a performance metric, since increased exposure does not inherently guarantee better visual comfort or a more usable distribution of daylight. These results corroborate recent literature critiques advocating for composite daylight metrics instead of single performance indicators.
A major methodological contribution is the inclusion of a LEED-inspired graded penalty mechanism inside the NSGA-II framework. Unlike the uniform penalty schemes commonly used in prior studies [24–26], the proposed formulation applies a discrete, threshold-anchored penalty gradient that scales with the degree of deviation from each LEED-based performance tier, rather than treating all infeasible solutions equally. This design is intended to supply the algorithm with graded, proximity-to-threshold information rather than a binary feasibility signal. This is empirically supported by a control comparison against a uniform (non-graded) penalty scheme (Section 3.4), which retrieved 5.7 times fewer feasible solutions (132 vs. 759 out of 1,800 alternatives) and reached comparatively worse performance extremes, confirming that the graded, proximity-to-threshold information provided by the LEED-anchored penalty structure translates into a measurably more effective search.
Moreover, the results demonstrate the benefits of the curvature-driven vertical fins relative to the traditional uniform-depth systems. Five independent control points are introduced, allowing for a localized morphological adaptation, resulting in a non-uniform response to solar exposure with respect to façade height. This flexibility expands the set of feasible solutions and increases the density of Pareto-optimal configurations. Importantly, not only is this expansion quantitative, but it is also structural in that it introduces alternative high-performance zones not available to linear or extruded shading typologies. This finding fills a gap in existing façade optimization studies where geometric adaptability is often limited to parametric scaling rather than true morphological transformation.
However, these developments are subject to several limitations. The external validity is limited since the analysis is restricted to a single building typology, a fixed window-to-wall ratio and one specific climatic context. Moreover, the exclusive focus on daylight-based goals ignores important interdependencies with thermal performance and energy demand and visual discomfort phenomena such as glare. Finally, the penalty structure was anchored to the LEED v4.1 daylight-credit tiers to guide the search toward performance-compliant regions, but the use of preset certification thresholds introduces a contextual bias that may not generalize to other performance rating systems, and the effect of this structure on convergence behavior was not empirically benchmarked in this study (Section 4.3).
In general, the results indicate that the use of morphologically flexible shading systems and graded constraint-handling strategies can greatly enhance the performance-driven façade design. The proposed framework not only increases the optimization efficiency, but also extends the conceptual understanding of geometric adaptability in controlling daylight performance of complex façade systems.
4.1. A simple decision-making framework
The optimization results facilitate the development of a reduced-order decision framework that converts high-dimensional design complexity into a hierarchy of dominant control parameters. The results show that the façade performance is mainly controlled by the fin density, fin depth and morphological control of the upper region (CP3–CP5), while the lower-region parameters have little effect at the system level.
The design process can therefore be re-framed as a step-wise decision sequence: (i) establishing a minimum structural density to ensure baseline solar interception; (ii) adjusting fin depth to manage the UDI-ASE trade-off; and (iii) adjusting upper morphological curvature to optimize spatial daylight distribution while not sacrificing autonomy metrics. This hierarchy simplification results in a lower parametric redundancy and yet is close to Pareto-optimal regions.
The framework tackles a common gap in the façade design literature, which is that the optimization outputs are often computationally rich but not well-translated into practical design heuristics. This approach fills this gap between computational exploration and architectural decision making by extracting dominant variables.
4.2. Correlation matrix
The correlation structure shows a strong anisotropy of the influence of the parameters and CP3 as the main driver of the UDI enhancement and ASE reduction. CP4 and CP5 also show secondary but still significant effects, further confirming the importance of upper façade geometry in controlling solar access for high altitude sun conditions typical of south-oriented exposures.
In contrast, CP1 and CP2 have weak or statistically insignificant relations with all performance indicators, which means that lower modifications of the façade have a marginal effect on the annual daylight behavior. This spatial gradient of sensitivity contradicts the simplifying assumption of uniform parametric influence that is often assumed in previous shading optimization studies.
The strong inverse relation between UDI and ASE further confirms their intrinsic linkage in the performance space, and the UDI–sDA relation reveals a structural trade-off between daylight sufficiency and distribution quality. These interactions indicate that daylight performance cannot be decomposed into independent metrics without introducing interpretational bias, reinforcing recent methodological calls for integrated multi-metric evaluation frameworks.
4.3. Limitations
Several factors limit the generalizability of the study findings. First, the analysis was performed for only one spatial configuration and orientation of the façade, which limits extrapolation to different architectural typologies and design conditions; the observed performance trends should therefore be considered specific to the studied case rather than as generally transferable design rules.
Second, the penalty coefficients (alpha, beta, gamma) of the graded penalty function were selected based on preliminary trial simulations rather than a systematic sensitivity or optimization procedure. Their relative magnitudes were motivated by the tiered structure of LEED v4.1 daylight credits, but a formal calibration study — for example, testing how different coefficient magnitudes affect convergence speed and solution quality — was beyond the scope of this work and is recommended for future research.
Third, while the present study did empirically benchmark the proposed graded-penalty model against a uniform (non-graded) penalty scheme in terms of final feasible-solution yield and performance range (Section 3.4), generation-by-generation fitness data were not recorded for either run. As a result, the comparison could not evaluate convergence speed (e.g., the generation at which feasibility is first reached), and a more detailed convergence analysis, ideally averaged over multiple random seeds, is recommended for future work.
Fourth, the depths of CP3 and CP5 were linked to the horizontal overhang references in the current parametrization, so the separate contribution of the curved vertical-fin shape at these two control points could not be fully isolated from that of the corresponding horizontal overhangs. Future work could decouple these elements to more precisely attribute performance sensitivity to the vertical fin shape alone.
Finally, the shading geometry was limited to five common control points across all configurations. Assigning a separate control-point set to each individual fin would have substantially increased the design-space dimensionality and, given the high computational cost of annual daylight simulations, made the optimization computationally intractable. The selected parametrization therefore reflects a trade-off between geometric flexibility and computational feasibility, while still providing sufficient design diversity for a meaningful investigation.
5. Conclusions
A performance-based framework was proposed to optimize daylight for south-facing office facades with curved vertical shading devices, employing parametric form generation, NSGA-II and a LEED-inspired graded penalty function. The results showed that the daylight performance is affected by the complex interaction between the shading density and the geometric morphology, and that the optimal solutions cannot be achieved by simply increasing the fin depth or the fin number. The findings also showed that curved vertical fins have the potential to meet daylight performance criteria on south facing façades, when the fin geometry is optimized. This challenges common assumptions about the limited applicability of vertical shading systems on such façades.
The sensitivity analysis showed that the upper control points of the shading geometry were the most influential on the daylight performance, confirming the importance of localized morphological adaptation for hot semi-arid climates. Further, the proposed graded penalty function was designed to guide the evolutionary search toward LEED-compliant feasible regions by scaling the penalty according to the degree of threshold violation, rather than applying a uniform penalty to all infeasible solutions, as is common in many previous NSGA-II-based daylight optimization studies. In addition to the better environmental performance, the curvature-based design strategy also significantly enlarged the solution space compared with the traditional uniform depth shading systems, allowing for more architectural flexibility.
In general, the proposed framework enhances the research of façade optimization by integrating the morphology-based design exploration and the effective handling of constraints, and offers a feasible approach for daylight-responsive façade design. Future studies could extend the framework to include thermal-energy performance, different climate scenarios, and adaptive optimization strategies to improve the applicability and robustness of the framework.
Funding
This research received no external funding.
Author Contributions
S. Hassanzadeh: Conceptualization, Methodology, Software, Validation, Formal analysis, Investigation, Data curation, Visualization, Writing – original draft, Writing – review & editing. A. Tarkashvand: Conceptualization, Methodology, Formal analysis, Data curation, Project administration, Supervision, Writing – review & editing.
Acknowledgement
The authors gratefully acknowledge the support and resources provided by their affiliated institution in the development of this research.
Declaration of competing interest
During the preparation of this work, the authors used ChatGPT (OpenAI) in order to edit the text and enhance readability. After using this tool, the authors reviewed and edited the content as needed and take full responsibility for the content of the published article. The authors declare no conflicts of interest.
Funding
This research received no external funding.
Appendix A. Penalty-scoring algorithm for daylighting metrics
Figure A1

Fig. A1. Pseudocode of the penalty-scoring function applied to the UDI, ASE, and sDA daylighting metrics, showing the piecewise penalty conditions and weighting coefficients (alpha, beta, gamma) used for each metric.
- A. Costa, M. M. Keane, J. I. Torrens, E. Corry, Building operation and energy performance: Monitoring, analysis and optimization toolkit, Applied Energy 101 (2013) 310-316. https://doi.org/10.1016/j.apenergy.2011.10.037
- X. Qi, Y. Wang, L. Xu, A study of subjective evaluation factors regarding visual effects of daylight in offices using machine learning, Journal of Building Engineering 92 (2024) 108679. https://doi.org/10.1016/j.jobe.2024.108906
- Y. Zhu, Q. Huang, J. Wu, A three-stage decision-making process for cost-effective passive solutions in office buildings in the hot summer and cold winter zone in China, Energy and Buildings 272 (2024) 113202.
- S. M. Hosseini, S. Heidari, S. Attia, J. Wang, G. Triantafyllidis, Biomimetic kinetic façade as a real-time daylight control: complex form versus simple form with proper kinetic behavior, Smart and Sustainable Built Environment (2024). https://doi.org/10.1108/SASBE-03-2024-0090
- R. Taherkhani, M. Aziminezhad, Human-Building Interaction: A Bibliometric Review, Building and Environment 242 (2023) 110493. https://doi.org/10.1016/j.buildenv.2023.110493
- S. Altomonte et al., Ten questions concerning well-being in the built environment, Building and Environment 180 (2020) 106949. https://doi.org/10.1016/j.buildenv.2020.106949
- D. Teli, T. Psomas, P. Wargocki, Inclusive indoor comfort of neurodivergent individuals diagnosed before adulthood: A comprehensive study on thermal, acoustic, visual and air quality domains, Building and Environment 252 (2024) 112921.
- P. Shukla, S. Garg, R. Singh, A field study of investigation of indoor environmental quality status in Indian offices: Concerns and influencing building factors, Journal of Building Engineering 88 (2024) 108276. https://doi.org/10.1016/j.jobe.2024.108648
- H. Zhang, L. Liu, Y. Chen, Optimization and prediction of office building shading devices for energy, daylight, and view consideration using genetic and BO-LGBM algorithms, Energy and Buildings 281 (2024) 113563. https://doi.org/10.2139/ssrn.4895096
- I. P. Douglas, J. Lee, A. Williams, Physical workplaces and human well-being: A mixed-methods study to quantify the effects of materials, windows, and representation on biobehavioral outcomes, Building and Environment 224 (2022) 109516. https://doi.org/10.1016/j.buildenv.2022.109516
- R. Ito, S. Lee, Performance enhancement of photovoltaic integrated shading devices with flexible solar panel using multi-objective optimization, Applied Energy 373 (2024) 123866. https://doi.org/10.1016/j.apenergy.2024.123866
- M. Mahdy, A. Fahmy, R. El-Dabaa, A multi-objective optimization for passive adaptive envelope integrating smart materials, Civil Engineering and Architecture 13:2 (2025) 794-812. https://doi.org/10.13189/cea.2025.130204
- Y. Zheng et al., A novel sun-shading design for indoor visual comfort and energy saving in typical office space in Shenzhen, Energy and Buildings 322 (2024) 114699. https://doi.org/10.1016/j.enbuild.2024.115083
- M. Brzezicki, Daylight comfort performance of a vertical fin shading system: Annual simulation and experimental testing of a prototype, Buildings 14:3 (2024) 571. https://doi.org/10.3390/buildings14030571
- A. Gamas, Passive performance and building form: An optimization framework for early-stage design support, Solar Energy 122 (2015) 102-116.
- Z. Wu, Y. Xu, Z. Wang, Multi-objective optimization of energy, view, daylight and thermal comfort for building’s fenestration and shading system in hot-humid climates, PLOS ONE, 20:6 (2025) e0325290. https://doi.org/10.1371/journal.pone.0325290
- A. Tasar, M. Koyaz, A novel method for simulating dynamic facades to analysing, and optimizing daylight and visual comfort in office buildings, Results in Engineering 27 (2025) 105608. https://doi.org/10.1016/j.rineng.2025.105608
- S. Yazdi Bahri, M. Alier Forment, A. Sanchez Riera, M. Heiranipour, S. N. Hosseini, Kinetic facades as a solution for educational buildings: A multi-objective optimization simulation-based study, Energy Reports 13 (2025) 3915-3928. https://doi.org/10.1016/j.egyr.2025.03.021
- B. Yao, A. Salehi, M. Baghoolizadeh, Y. Khairy, S. Baghaei, Multi-objective optimization of office egg shadings using NSGA-II to save energy consumption and enhance thermal and visual comfort, International Communications in Heat and Mass Transfer (2024) 107697. https://doi.org/10.1016/j.icheatmasstransfer.2024.107697
- A. Ibrahim, M. Alsukkar, Y. Dong, P. Hu, Investigations for the daylighting performance of trapezoid profile shadings using multi-objective optimization, Journal of Building Engineering 99 (2025) 111645. https://doi.org/10.1016/j.jobe.2024.111645
- B. Mansouri et al., The impact of facade geometry on visual comfort and energy consumption in an office building in different climates, Energy Reports 11 (2024) 1-15. https://doi.org/10.1016/j.egyr.2023.11.021
- A. Kirimtat, O. Krejcar, B. Ekici, M. F. Tasgetiren, Multi-objective energy and daylight optimization of amorphous shading devices in buildings, Solar Energy 185 (2019) 100-111. https://doi.org/10.1016/j.solener.2019.04.048
- M. Hakimazari et al., Multi-objective optimization of daylight illuminance indicators and energy usage intensity for office space in Tehran by genetic algorithm, Energy Reports 11 (2024) 3283-3306. https://doi.org/10.1016/j.egyr.2024.03.011
- A. Ahmad et al., AI application in architecture in UAE: Application of an advanced optimized shading structure as a retrofit strategy of a midrise residential building façade in downtown Abu Dhabi, Energy and Buildings 325 (2024) 114995. https://doi.org/10.1016/j.enbuild.2024.114995
- T. C. Chen et al., Multi-Objective Optimization of External Louvers in Buildings, Computers, Materials and Continua 75:1 (2023) 1305-1316. https://doi.org/10.32604/cmc.2023.033274
- M. Hazbei et al., Optimizing architectural multi-dimensional forms; a hybrid approach integrating approximate evolutionary search, clustering and local optimization, Energy and Buildings 318 (2024) 114460. https://doi.org/10.1016/j.enbuild.2024.114460
- C. H. Lin, Y. S. Tsay, A practical decision process for building façade performance optimization by integrating machine learning and evolutionary algorithms, Journal of Asian Architecture and Building Engineering 23:2 (2024) 740-753. https://doi.org/10.1080/13467581.2023.2244564
- D. H. Kim et al., Optimizing the Shading Device Configuration of Kinetic Façades through Daylighting Performance Assessment, Buildings 14:4 (2024) 1038. https://doi.org/10.3390/buildings14041038
- S. M. Hosseini, M. Mohammadi, O. Guerra-Santin, Interactive kinetic façade: Improving visual comfort based on dynamic daylight and occupant's positions by 2D and 3D shape changes, Building and Environment, 165 (2019) 106396. https://doi.org/10.1016/j.buildenv.2019.106396
- M. Brzezicki, Enhancing Daylight Comfort with Climate-Responsive Kinetic Shading: A Simulation and Experimental Study of a Horizontal Fin System, Sustainability 16:18 (2024) 8156. https://doi.org/10.3390/su16188156
- A. Rubel, M. A. R. Joarder, Performance of Shading Against West Glass Facades to Optimize Daylight, Thermal Comfort and Energy Efficiency of Office Buildings, Journal of Daylighting 11 (2024) 131-148. https://doi.org/10.15627/jd.2024.8
- Y. Jiang et al., A Study on the Daylighting, Energy Consumption, and Climate Adaptability of Curved Mesh Shading Based on the Parametric Performance Design Method, Sustainability 16:13 (2024) 5549. https://doi.org/10.3390/su16135549
- M. Rezakhani, S. A. Kim, Genetic Algorithm-Driven Optimization of Pattern for Parametric Facade Design Based on Support Position Data to Increase Visual Quality, Buildings 14:4 (2024) 1086. https://doi.org/10.3390/buildings14041086
- J. H. Lee, J. S. Kang, Study on Lighting Energy Savings by Applying a Daylight-Concentrating Indoor Louver System with LED Dimming Control, Energies 17:14 (2024) 3425. https://doi.org/10.3390/en17143425
- M. Alsukkar et al., Daylighting performance assessment of a split louver with parametrically incremental slat angles: Effect of slat shapes and PV glass transmittance, Solar Energy 264 (2023) 112069. https://doi.org/10.1016/j.solener.2023.112069
- X. Liang et al., Parametric design of photovoltaic louver integrated shading devices for west facade windows of office buildings in central China, Journal of Asian Architecture and Building Engineering 00:00 (2024) 1-15.
- S. D. Sureshkumar Jayakumari et al., Energy and Daylighting Performance of Kinetic Building-Integrated Photovoltaics (BIPV) Façade, Sustainability 16:22 (2024) 97239. https://doi.org/10.3390/su16229739
- T.R. Fattah, D. Mohammed, T.J. Katona, B. Baranyai, Cactus-inspired multifunctional Bio-kinetic façade for energy performance improvement assessed by a novel energy simulation framework. Energy and Buildings, 346 (2025) 116188. https://doi.org/10.1016/j.enbuild.2025.116188
- F. Farmani, S. M. Hosseini, M. K. Assadi, S. Hassanzadeh, Computational Evaluation of a Biomimetic Kinetic Façade Inspired by the Venus Flytrap for Daylight and Glare Performance,Buildings (2025) 1-28. https://doi.org/10.3390/buildings15111853
- Y. M. S. Abdelhamid et al., The Effect of Parametric Patterned Façade Variations on Daylight Quality, Visual Comfort, and Daylight Performance in Architecture Studio-Based Tutoring, Journal of Daylighting 10:2 (2023) 173-191. https://doi.org/10.15627/jd.2023.15
- F. Mehrvarz et al., Designerly Approach to Design Responsive Façade for Occupant Visual Comfort in Different Latitudes, Journal of Daylighting 11:1 (2024) 149-164. https://doi.org/10.15627/jd.2024.9
- A. Ibrahim et al., Enhancing energy efficiency in shipping container house: A novel approach using hybrid louver systems, Energy and Built Environment (2024).
- C. Duclos-Prévet, F. Guéna, M. Efron, Constraint handling methods for a generative envelope design using genetic algorithms: The case of a highly constrained problem, International Journal of Architectural Computing 20:1 (2022) 135-154. https://doi.org/10.1177/14780771221120577
- S. Nazari et al., Comparison of shading design between the northern and southern hemispheres: using the NSGA-II algorithm to reduce building energy consumption and improve occupants' comfort, Smart and Sustainable Built Environment 14:4 (2025) 889-920. https://doi.org/10.1108/SASBE-11-2022-0248
- U.S. Green Building Council, LEED v4.1 Reference Guide, USGBC: Washington, DC, USA, 2021.
- C. F. Reinhart, O. Walkenhorst, Validation of Dynamic RADIANCE-Based Daylight Simulations for a Test Office with External Blinds, Energy and Buildings 33 (2001) 683-697. https://doi.org/10.1016/S0378-7788(01)00058-5
- E. Brembilla, J. Mardaljevic, Climate-Based Daylight Modelling for Compliance Verification: Benchmarking Multiple State-of-the Art Methods, Building and Environment 158 (2019) 151-164. https://doi.org/10.1016/j.buildenv.2019.04.051
- A. Nabil, J. Mardaljevic, Useful daylight illuminance: A new paradigm for assessing daylight in buildings, Lighting Research & Technology 37:1 (2005) 41-59. https://doi.org/10.1191/1365782805li128oa
- C. A. Coello Coello, Theoretical and numerical constraint-handling techniques used with evolutionary algorithms: a survey of the state of the art, Computer Methods in Applied Mechanics and Engineering 191:11-12 (2002) 1245-1287. https://doi.org/10.1016/S0045-7825(01)00323-1
- W. Paszkowicz, Properties of a genetic algorithm equipped with a dynamic penalty function, Computational Materials Science 45:1 (2009) 77-83. https://doi.org/10.1016/j.commatsci.2008.04.033
- M. Q. Pan, C. Si, L. Wang, A stage-based adaptive penalty method for constrained evolutionary optimization, Expert Systems with Applications 269 (2025) 126351. https://doi.org/10.1016/j.eswa.2024.126351
- J. Guo, M. Shao, S. Jiang, S. Yang, An Improved Multiobjective Optimization Evolutionary Algorithm Based on Decomposition with Hybrid Penalty Scheme, in: Proceedings of the Genetic and Evolutionary Computation Conference 2020 (GECCO '20 Companion), Cancún, Mexico, 8-12 July 2020, pp. 165-167. https://doi.org/10.1145/3377929.3389958
- M. Hu et al., From penalty function to learning-driven: evolution and perspectives of constrained multi-objective evolutionary algorithm, Swarm and Evolutionary Computation 96 (2025) 102006. https://doi.org/10.1016/j.swevo.2025.102006
- M. W. Kang, P. Schonfeld, N. Yang, Prescreening and Repairing in a Genetic Algorithm for Highway Alignment Optimization, Computer-Aided Civil and Infrastructure Engineering 24:2 (2009) 109-119. https://doi.org/10.1111/j.1467-8667.2008.00574.x
- X. Cheng et al., A constraint violation-based adaptive switching surrogate-assisted evolutionary algorithm for expensive constrained multiobjective optimization, Swarm and Evolutionary Computation 104 (2026) 102372. https://doi.org/10.1016/j.swevo.2026.102372
- C. F. Reinhart, J. A. Jakubiec, D. Ibarra, Definition of a reference office for standardized evaluations of dynamic façade and lighting technologies, in: Proceedings of Building Simulation 2013, Chambéry, France, 26-28 August 2013, pp. 3644-3652. https://doi.org/10.26868/25222708.2013.1029
Disclaimer/Publisher’s Note: The statements, opinions and data contained in all publications are solely those of the individual author(s) and contributor(s) and not of Solarlits and/or the editor(s). Solarlits and/or the editor(s) disclaim responsibility for any injury to people or property resulting from any ideas, methods, instructions or products referred to in the content.