
Sayedeh Mahsa Zamanian,1 Mohammad Latifi,1,* Mohammad Baharvand,1 Mohammadjavad Mahdavinejad 2,*
Author affiliations
1 Department of Architecture and Tourism, Architecture and Urban Research Center, Isf.C., Islamic Azad University, Isfahan, Iran
2 College of Engineering and Architecture, University of Nizwa, Oman
*Corresponding author.
ma.zamanian@iau.ac.ir (S. M. Zamanian)
md.latifi@iau.ac.ir (M. Latifi)
mahdavinejad@unizwa.edu.om (M. Baharvand)
baharvand@iau.ac.ir (M. Mahdavinejad)
History: Received 29 May 2026 | Revised 23 June 2026 | Accepted 2 July 2026 | Published online 10 September 2026
Copyright: © 2026 The Author(s). Licensee Solarlits Limited (Hong Kong). This is an open access article distributed under the terms and conditions of the Creative Commons Attribution 4.0 License.
Citation: Sayedeh Mahsa Zamanian, Mohammad Latifi, Mohammad Baharvand, Mohammadjavad Mahdavinejad, Multi-Criteria Evaluation of South Classroom Windows Forms in BWh Climate: Daylight Performance, View Quality and Energy Efficiency, Journal of Daylighting, 13:2 (2026) 521-536. doi: 10.15627/jd.2026.29
Abstract
The concurrent assessment of the daylight performance, lighting energy and quality of view within the classroom has been a crucial issue in the sustainable design in hot and dry climates (BWh). Extensive works have analyzed the WWR but the influence of window geometry and subdivision layout under a fixed WWR has been less systematically and comparatively investigated. This study aimed to isolate the effect of window geometry by evaluating the performance of ten different window configurations in south-facing classrooms in Isfahan, Iran. Performance evaluation was conducted using three climate-based daylight metrics, including Spatial Daylight Autonomy (sDA), Annual Sunlight Exposure (ASE), and Useful Daylight Illuminance (UDI), along with annual lighting energy (LE) consumption and quality of view to the outside (QV). A series of simulation run with Grasshopper-Ladybug/Honeybee environment while analyze on simultaneously in the Multi Criteria Decision Making (MCDM/TOPSIS) context. It shows that all models achieved the daylight adequacy criterion, while the daylight distribution pattern and potential glare risk was highly dependent on effective window height and window layout both horizontally and vertically. Multi-criteria ranking shows that M7 with three strips of horizontal window layout achieved an ASE value of 23.96% and a UDI value of 84.16%, with highest multi criteria ranking value indicating optimum balance between the uniformity of daylight direct solar exposure control. In contrast, the deeper the vertical windows (M1-M3), the higher the risk of excessive sunlight exposure, although it brings better daylight penetration. Multi-criteria analysis shows that in the hot and dry climate scenario (BWh), the M7, M5, and M4 configurations, respectively, provide more balanced performance across daylight, lighting energy consumption, and Quality of view. In general, this study provided a controlled comparative framework due to constant WWR and the simultaneous integration of daylight, energy, and view metrics, enabling a controlled comparison of different window configurations and supporting decision-making in the early stages of classroom design in hot and dry climates.
Keywords
daylight, lighting energy, quality of view, window form, classroom
Nomenclature
| ASE | Annual Sunlight Exposure |
| CBDM | Climate-Based Daylight Modeling |
| EN | European Standard |
| EQ | Indoor Environmental Quality |
| Global ABC | Global Alliance for Buildings and Construction |
| HB | Honeybee |
| IGDB | International Glazing Database |
| IEA | International Energy Agency |
| IES | Illuminating Engineering Society |
| LB | Ladybug |
| LBNL | Lawrence Berkeley National Laboratory |
| LE | Lighting Energy (Annual Consumption) |
| LEED | Leadership in Energy and Environmental Design |
| LPD | Lighting Power Density |
| MCDM | Multi-Criteria Decision Making |
| QV | Quality of View |
| REN21 | Renewable Energy Policy Network for the 21st Century |
| sDA | Spatial Daylight Autonomy |
| TOPSIS | Technique for Order Preference by Similarity to Ideal Solution |
| UDI | Useful Daylight Illuminance |
| USGBC | U.S. Green Building Council |
| WWR | Window-to-Wall Ratio |
1. Introduction
The building sector is recognized as a major contributor to global energy consumption and environmental impacts which is therefore a key domain for energy reduction strategies [1,2]. Specifically, a significant portion of building energy consumption is dedicated to lighting. Based on international estimates, a significant share of building energy is used for lighting [2,3].
Thus, focusing on reducing lighting energy consumption and enhancing daylight quality in buildings is essential.
In building performance daylight together with layout and physical construction is a key component, which significantly impacts the building [4,5]. When considering the components that comprise a building, windows are critical. Windows provide daylight, which influences both the building's views and the energy that must be used for lighting. Therefore, window proportions and geometry are recognized as effective passive strategies to improve daylight, energy efficiency, and quality of view [6–8]. Recent findings indicate that modifying the form and organization of windows, even with a fixed window-to-wall ratio (WWR), can alter daylight adequacy, the risk of excessive sunlight exposure, and view patterns [9,10].
The significance of window form is amplified when considering that daylight assessment has progressed from static analyses to dynamic, climate-based analyses. The results from dynamic measures, like sDA, ASE, and so forth, indicate realistic daylight fluctuations throughout the year by taking annual time series (8760h) [1]. Also, interior visual performance is influenced by factors including solar access, glare control and view quality to exterior environments. Failure to consider views and visual comfort, even when within illuminance targets, results in an incomplete daylight performance analysis. [11]. Therefore, the simultaneous evaluation of dynamic daylight metrics alongside quality of view, especially at the window scale, has emerged as a comprehensive approach for analyzing visual performance in interior and educational spaces.
Previous building openings literature covers factors such as WWR, types of glass, shading devices, but not many of them investigate the factors concerning the geometry of window such as horizontal, vertical and grid shapes at the same WWR. Recently, a couple studies on daylighting performance and shading have been done by parametric geometry. For instance, Al-Rqaibat et al. (2025) demonstrated that changes in the geometric pattern of mashrabiya can significantly affect daylight performance metrics, including illuminance adequacy, annual direct sunlight exposure, and useful daylight distribution [1]. In another study, Teimourtash et al. (2023) showed that the variations in window height affect ASE performance, with window geometry directly influencing daylight penetration and illuminance uniformity [9]. In the same way, in their research of south-facing classroom in Semnan, Maroofi & Mahdavinejad (2023) noticed that window shape and disposition in southern facade strongly influence both energy and useful daylight [12]. Accordingly, analyzing window geometry while keeping other factors like WWR and glazing type constant, would provide a critical knowledge on climate-based daylighting in classrooms. Table 1 provides a summary of some relevant studies. It can be noticed that many studies only examine a specific variable like variations in WWR and/or glazing type without considering the quality of view and the amount of lighting energy, therefore reducing their usefulness in developing a proper design strategy for classrooms in hot and dry climates.
Table 1
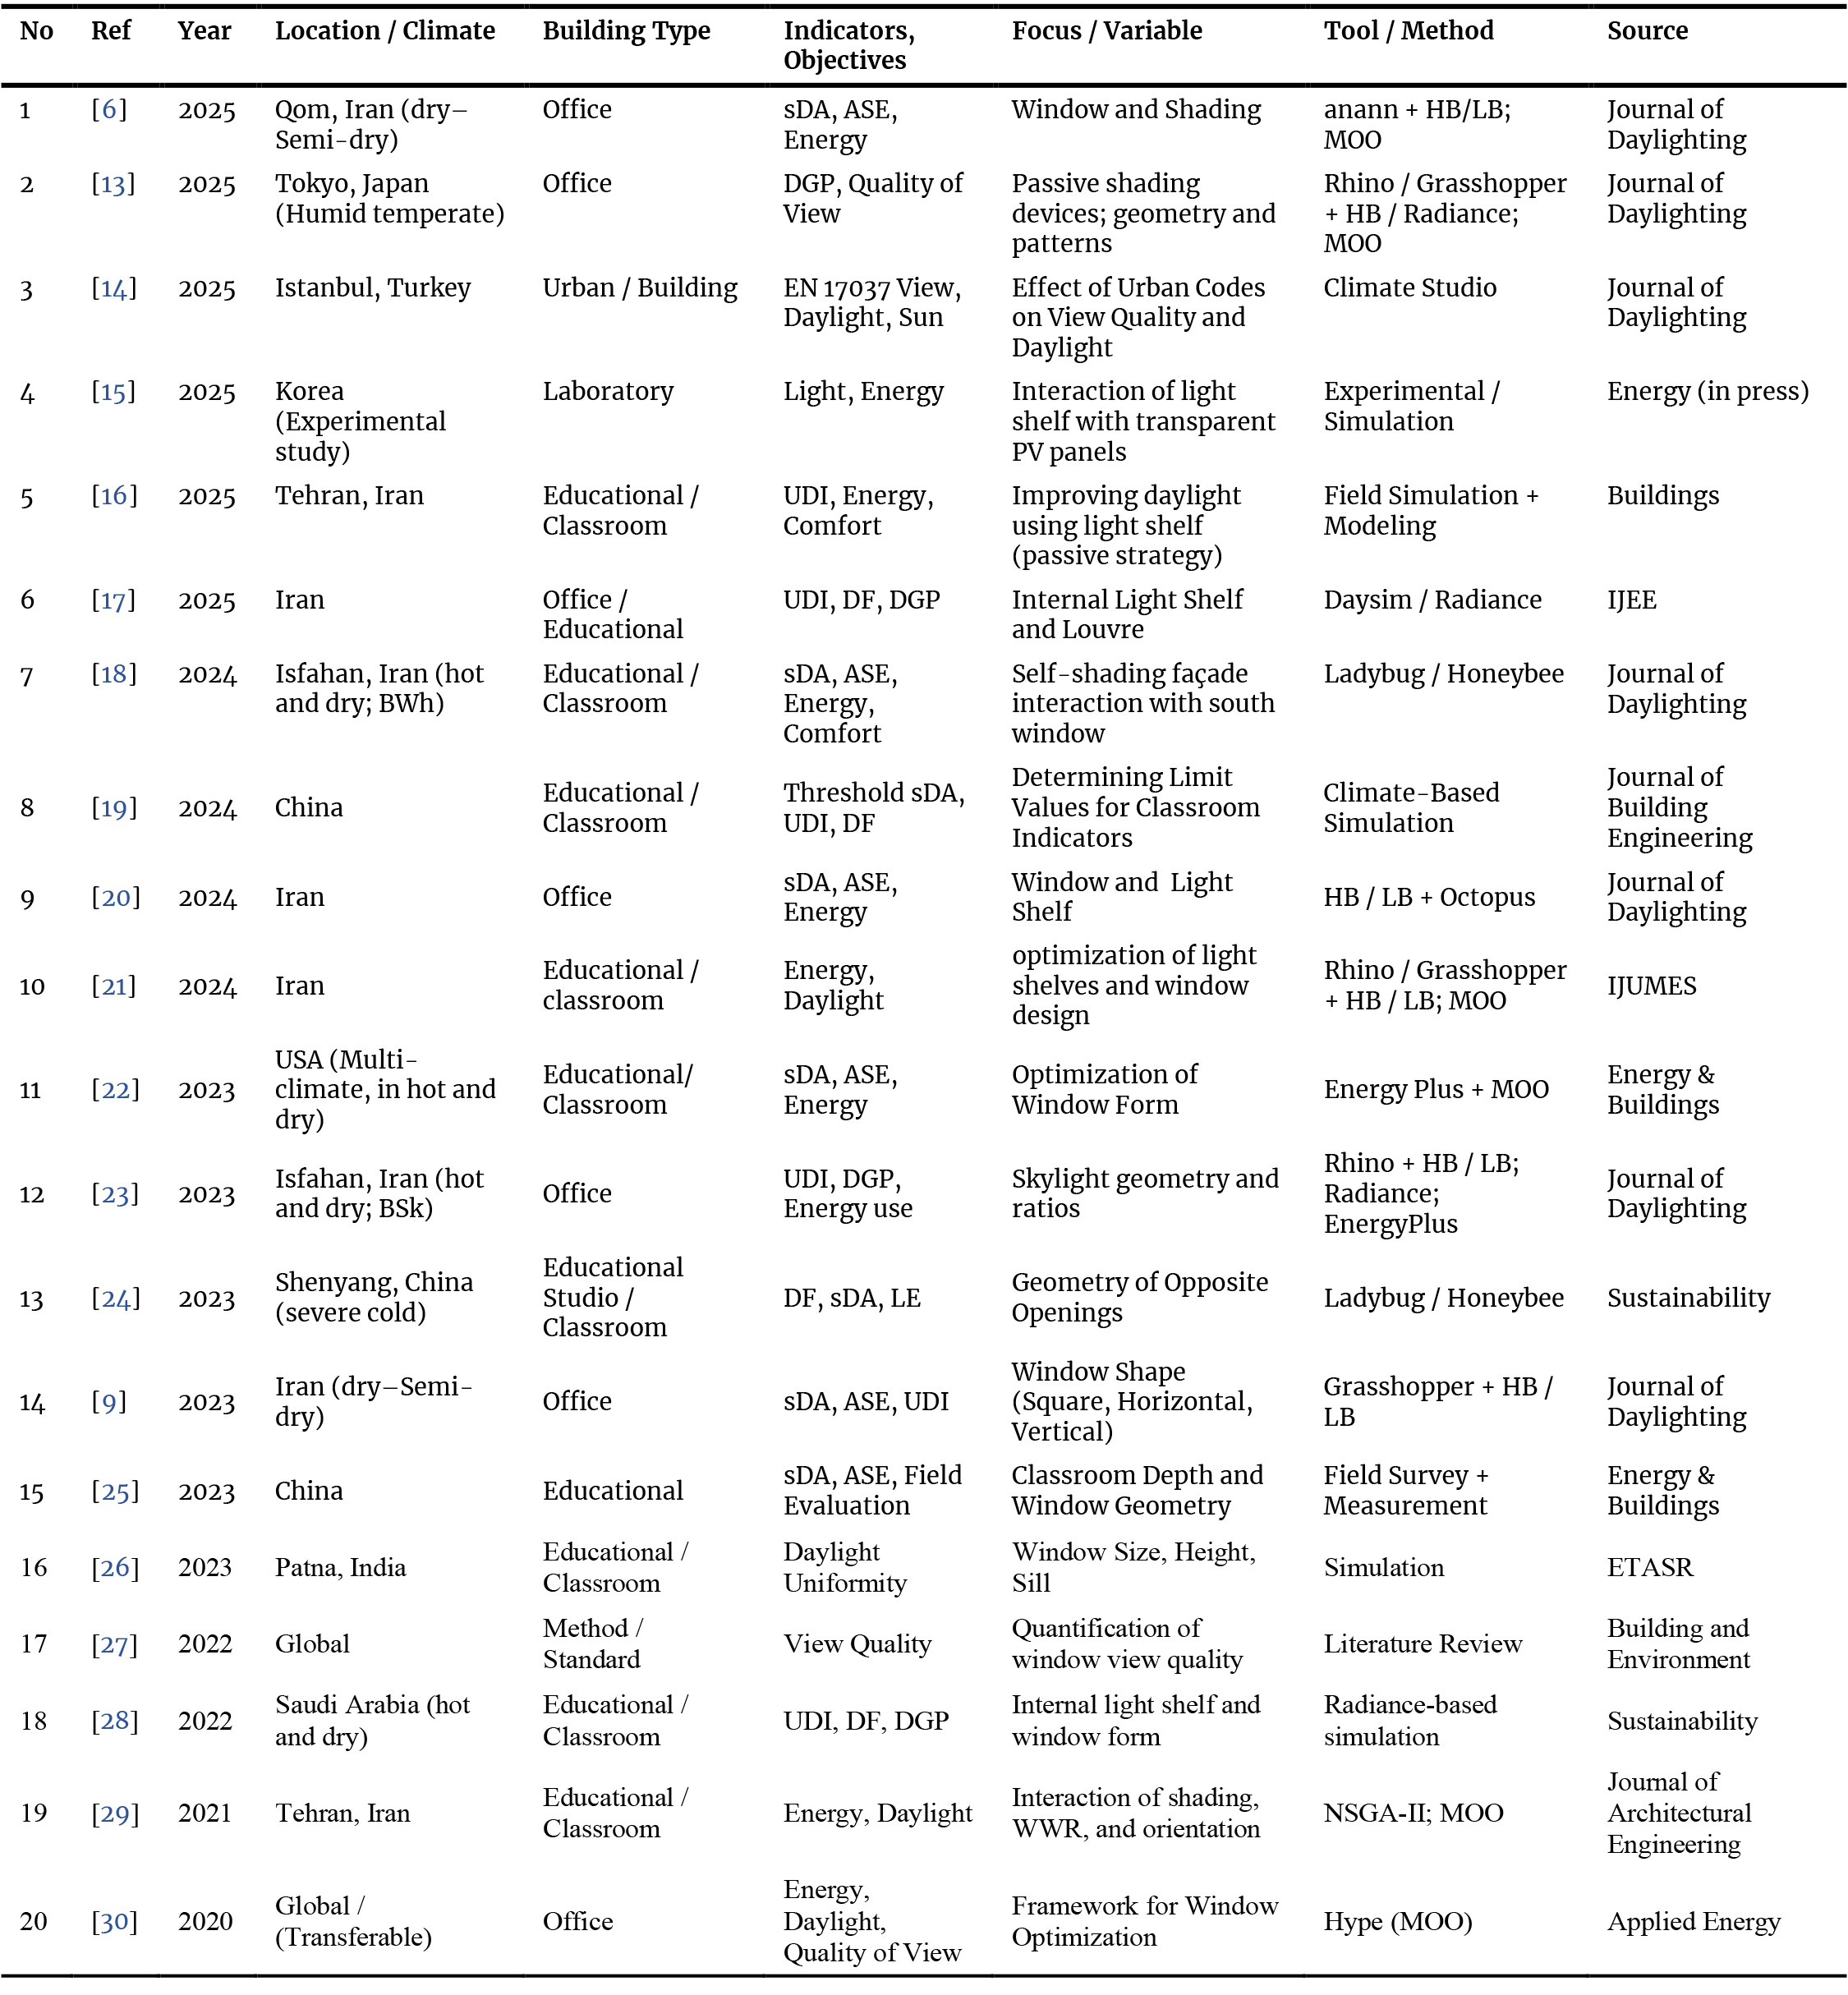
Table 1. Summary of recent studies (2020–2025) on window form and assessment of daylighting, lighting energy, and quality of view performance.
An overview of related research is given in Table 1. A review shows that even though the influence of window geometry and form on daylighting performance has been highlighted as very important, there are a few research issues that have not been addressed. In most research, studies have investigated the influence of variations in the window-to-wall ratio (WWR), glazing properties or shading devices. However, the independent effect of window shape under a fixed WWR has received less attention. Few studies address classrooms in hot and dry climates, which are highly vulnerable to excessive solar exposure and direct sunlight penetration. In addition, only a limited number of studies simultaneously examine key daylight metrics, quality of view, and lighting energy, even though such an approach is essential for evidence-based design guidelines.
Thus, this research, which studies the role of ten window shapes, vertical, horizontal, grid pattern in a south oriented classroom facade in the hot and dry region of Isfahan, will try to cover the gap through climate based simulation. Window geometry effects are compared analytically, without taking in account any other common facade parameter, and by fixing the window-to-wall ratio (WWR) and the glazing characteristics, the contribution of the window shape on daylight characteristics, both calculated in dynamic way, sDA, UDI, and ASE, and lighting energy and view to outside is analyzed.
This integrated approach enables a meaningful comparison of different window forms under identical conditions. It renders the simulation results a reliable tool to support decision-making in the early stages of classroom design in hot and dry climates (BWh) and in climates with similar characteristics.
2. Materials and method
Step 1: Mase model and simulation
In this work, simulations were performed to evaluate daylight performance, quality of view and lighting energy quantitatively in the classroom.
Three-dimensional base model of the classroom was built with Rhinoceros 8 and Grasshopper environment. Annual daylight performance evaluation was performed by CBDM (Climate-Based Daylighting Modeling) approach. In CBDM, the daylight performance indicators chosen were dynamic daylight metrics including sDA (Spatial Daylight Autonomy), ASE (Annual Sunlight Exposure), UDI (Useful Daylight Illuminance) respectively. These daylight performance indicators have been initially proposed and formally documented by the IES, widely used in daylight simulation over the last several years. [1,32].
To analyze annual lighting energy, data from the daylight simulations were transferred to OpenStudio/EnergyPlus, where lighting energy consumption (kWh/m²) was calculated using Daylighting Controls algorithms [33]. Furthermore, quality of view (QV) metrics were evaluated in accordance with LEED v4.1 – EQ: Quality Views criteria [34]. All model settings and structures were defined to ensure reproducibility, control for variables, and comparability of results across models.
Step 2: Design models
To evaluate the effects of window geometry/glass surface distribution on daylighting metrics, lighting energy, and quality of view, 10 window form design models with vertical, horizontal, and grid divisions were defined. In all models, the window-to-wall ratio (WWR) and other assumptions (materials, reflectance coefficients, occupancy schedule) were kept constant to isolate the effects of window geometry/glass surface distribution.
Step 3: Multi-criteria decision-making (MCDM)
To comprehensively analyze daylight, energy, and quality of view results, a Multi-Criteria Decision-Making (MCDM) framework was applied. Initially, for comparability, data normalization was performed using the min–max method, separating beneficial indicators (sDA, UDI, and QV) from cost indicators (ASE and LE). A composite score for each of the models was then developed using three weighting methods, including; 1) Equal Indicator weighting, 2) Daylight priority and 3) balanced Tri-objective Weighting. Rankings of each model were made using the TOPSIS algorithm where "alternatives are examined for simultaneously relative closeness to the ideal solution and relative separation from the negative-ideal solution"[35]. MCDM approaches and the TOPSIS algorithm to rank facade and window performance in both office and educational buildings has been previously reported [36–38].
The simulation settings and baseline classroom model assumptions used throughout the methodology are summarized in Table 2.
Table 2
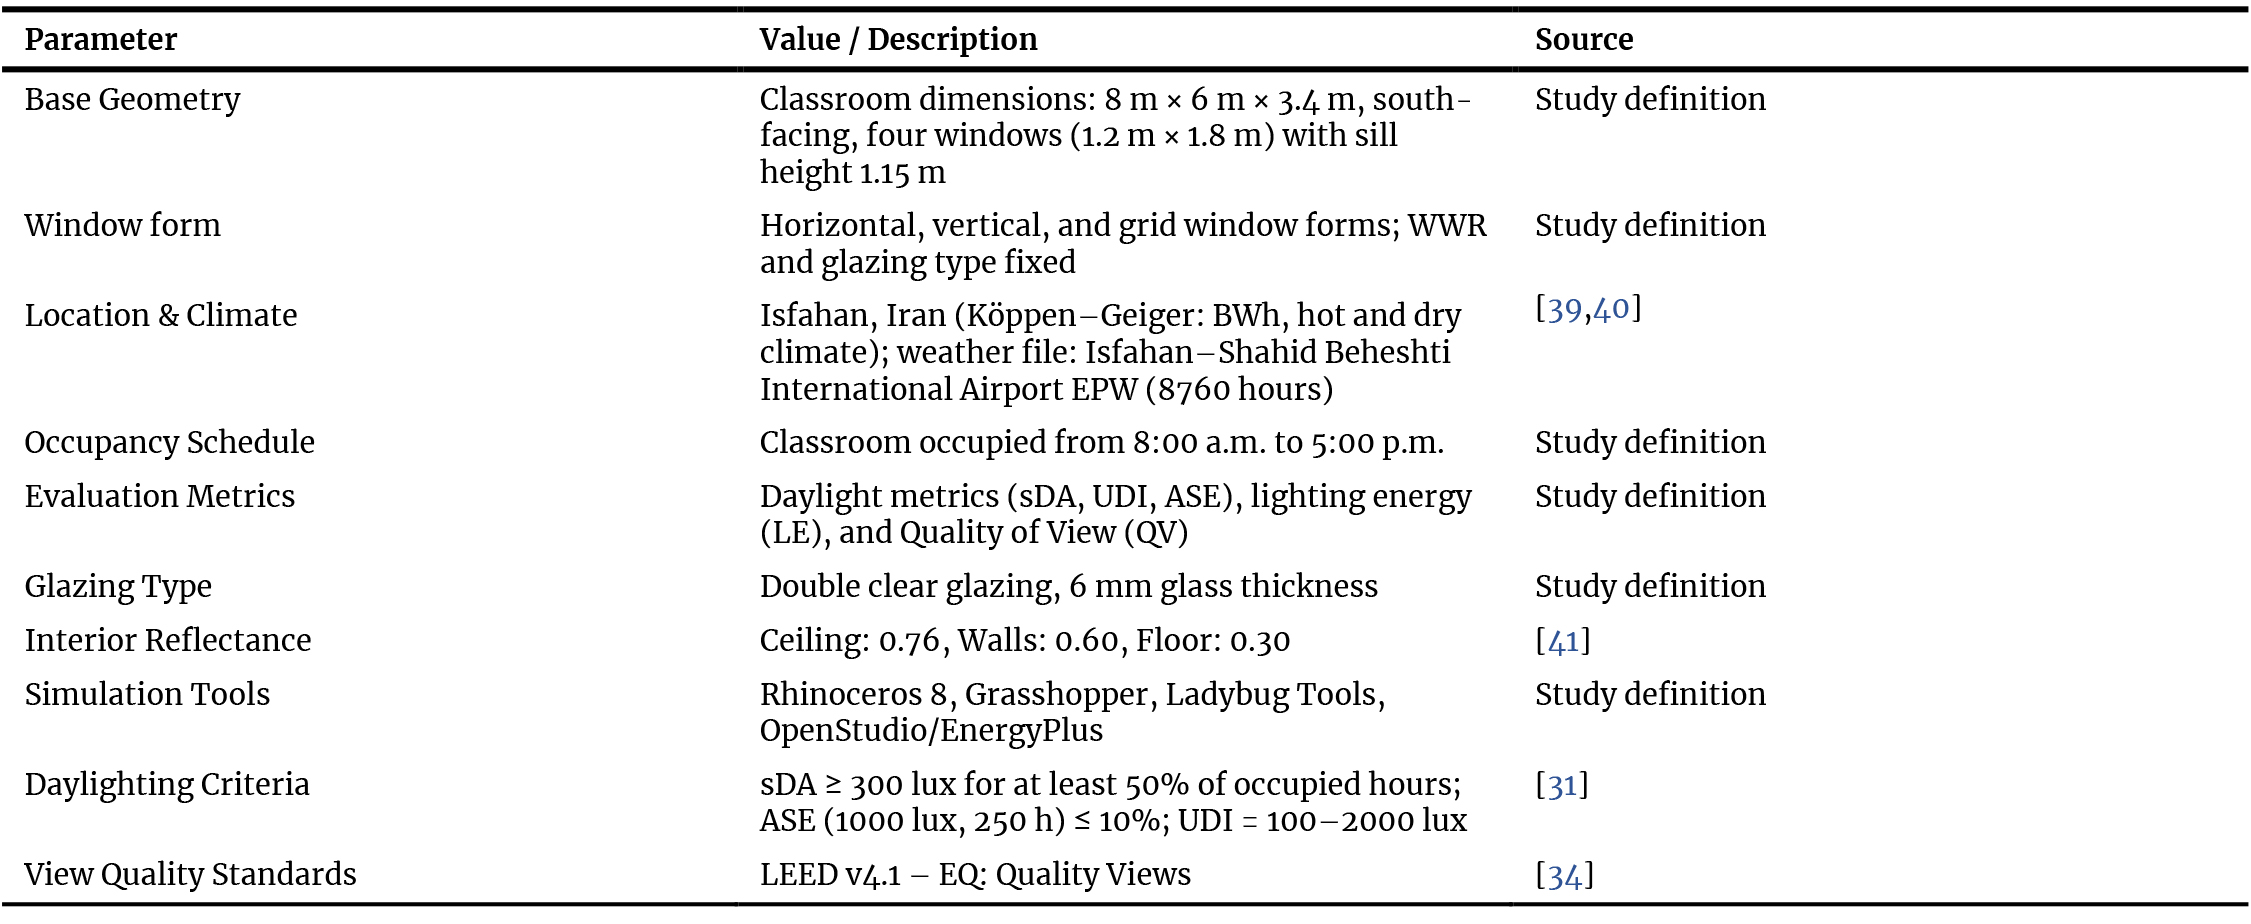
Table 2. Simulation parameters and baseline classroom model assumptions.
2.1. Location and climate
The study area is the city of Isfahan, located in central Iran and, based on Köppen–Geiger classification, belongs to the hot and dry climate (BWh) category. To simulate local climatic conditions, a standard EPW weather file for Isfahan was used. This file contains hourly data for the entire year (8,760 hours), including Direct Normal Irradiance (DNI), Diffuse Horizontal Irradiance (DHI), and Global Horizontal Irradiance (GHI), prepared according to the official EnergyPlus Weather Data Framework. Climate data were obtained from the Climate.OneBuilding database [39,40]. Reported annual average values in Table 3 were calculated as the arithmetic mean of all hourly data, including both day and night hours.
Table 3
![Summary of annual climatic parameters for Isfahan based on EPW data [40].](https://cdn.solarlits.com/solarlits/journals/jd/legacy-manuscripts/figures/13-521-16.jpg)
Table 3. Summary of annual climatic parameters for Isfahan based on EPW data [40].
2.2. Simulation environment and tools
The simulation was conducted to have high numerical accuracy and replicable results within Rhinoceros 8 and the Grasshopper parametric modeling space using Ladybug tools. The Daylight simulation was conducted through Climate-Based Daylight Modeling (CBDM), to assess yearly daylight performance. The grid for the Daylight sensor was developed at the classroom work plane 0.76 m above the floor (student desk height) at 0.5×0.5 m spacing (Figure 1). Daylight calculations were done using the Radiance engine within HB-Radiance as generally performed by Ladybug tools guidelines [42].
Figure 1
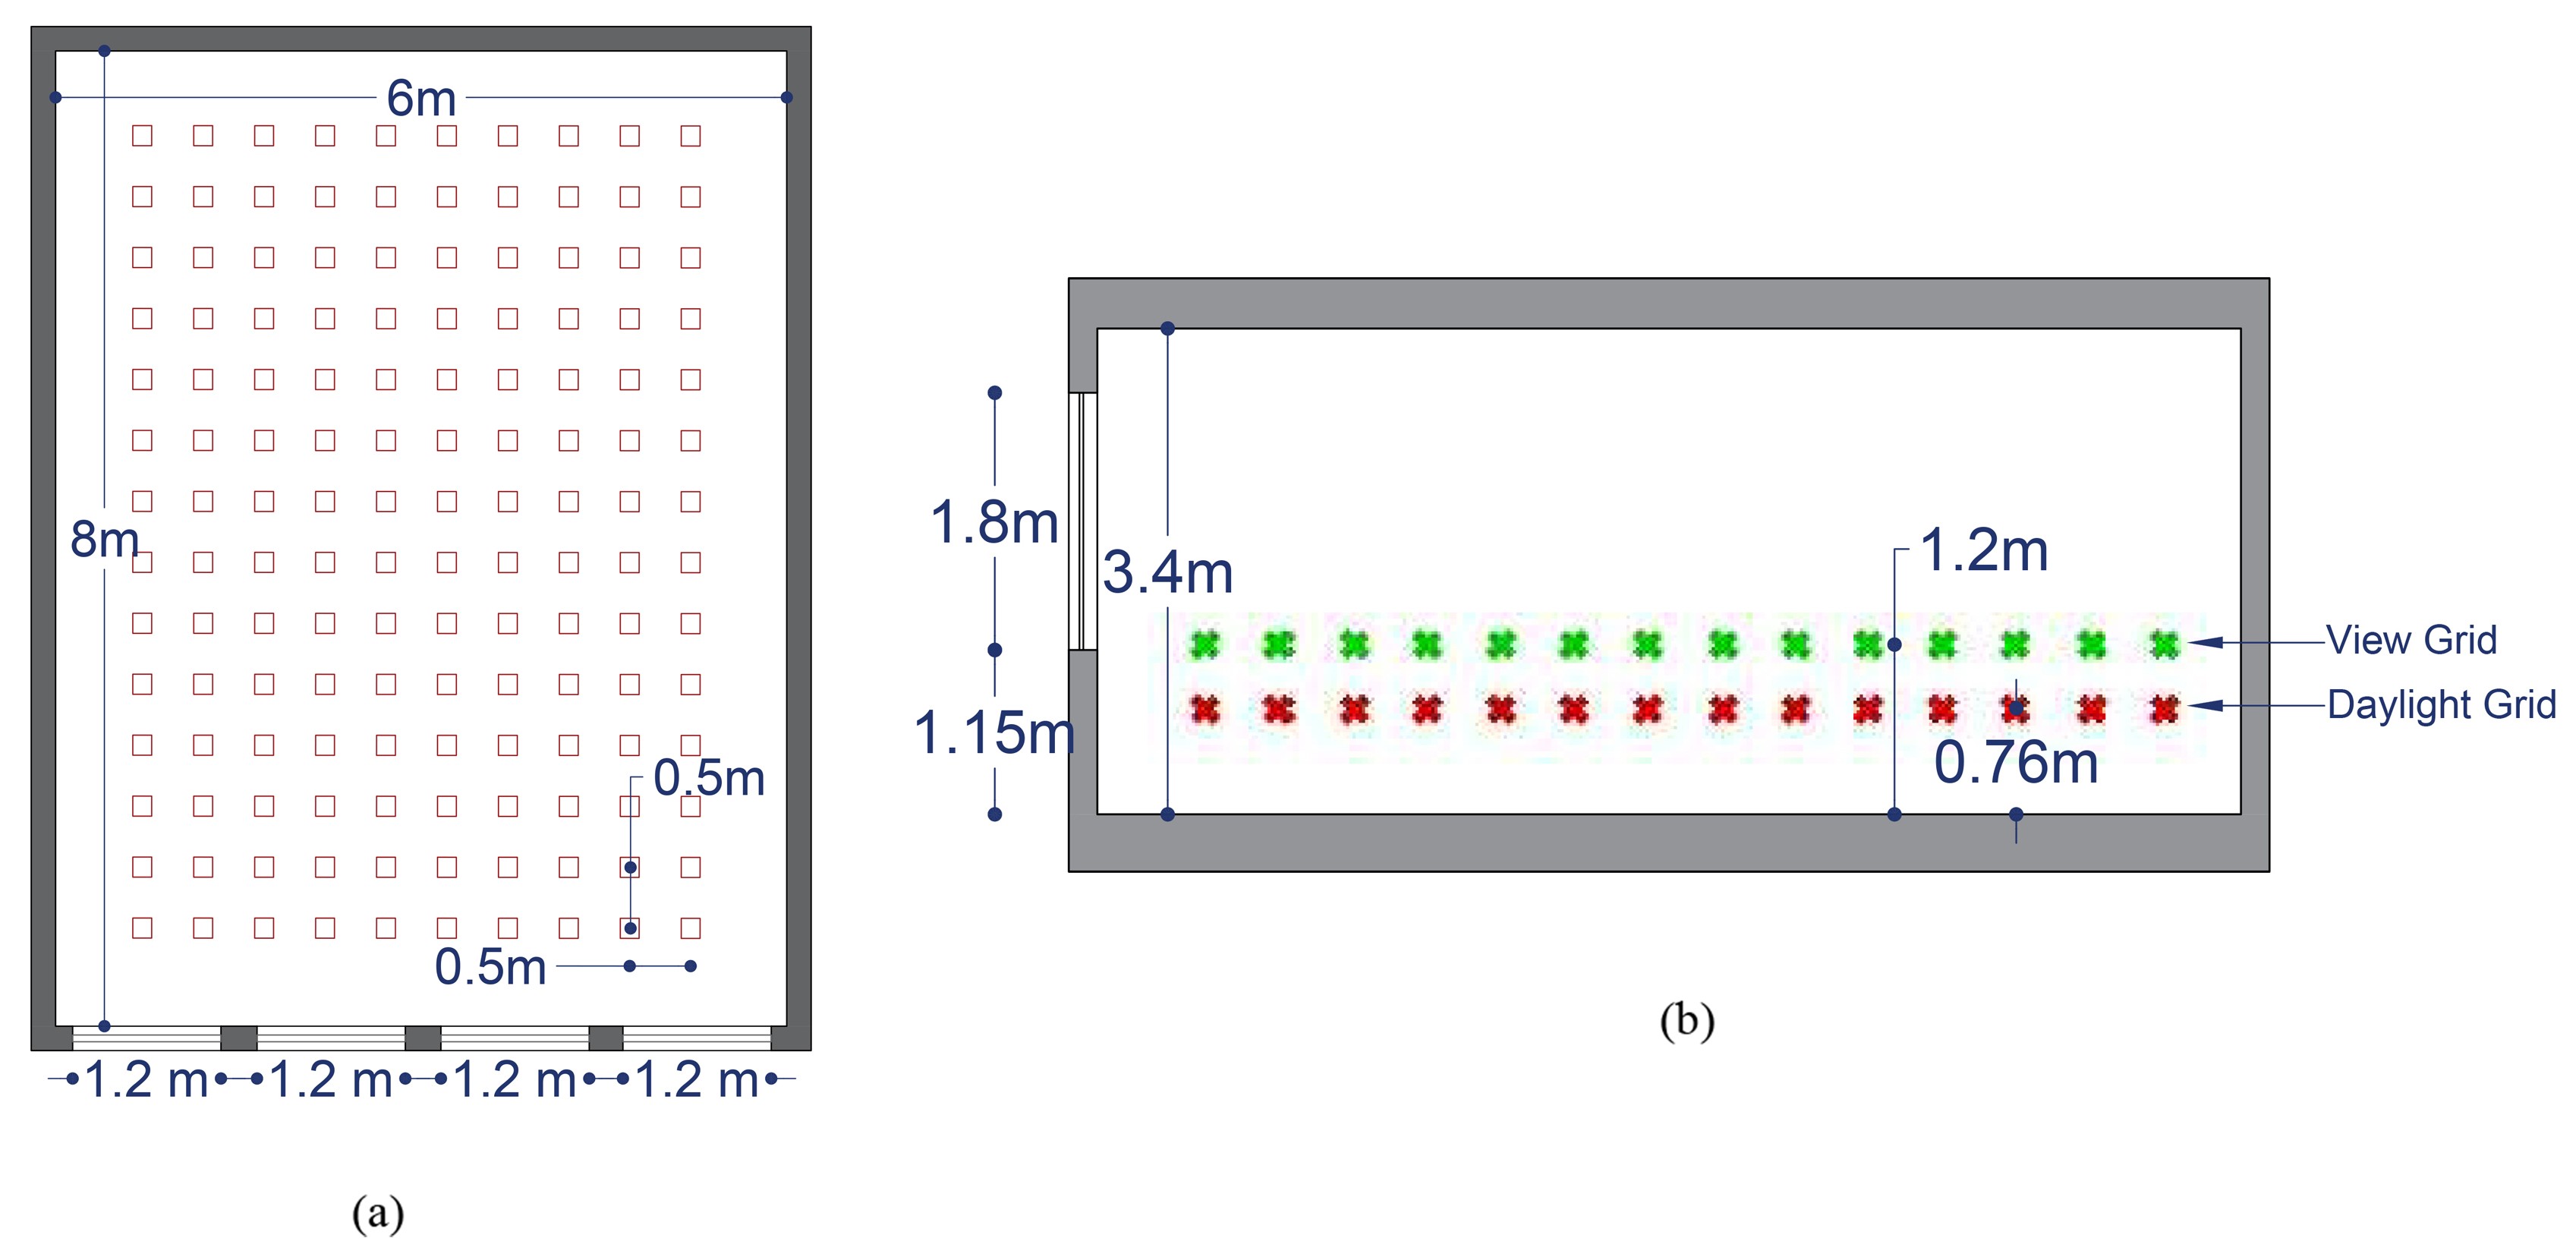
Fig. 1. Layout of daylight and view sensor grid on (a) plan and (b) section.
Daylight performance metrics were calculated due to IES LM-83-12 standard. These metrics include Spatial Daylight Autonomy (sDA300/50%), Annual Sunlight Exposure (ASE1000, 250hh), and Useful Daylight Illuminance (UDI100-2000 lux). The sDA metric was used to assess the adequacy of natural lighting, the ASE metric to evaluate the risk of excessive sunlight exposure, and the UDI metric as a complementary measure for comparing the quality of daylight distribution across different design scenarios [31].
All models use a double glazed window with a VLT of 0.60. The optical properties for the glass are taken from the recognized LBNL IGDB/WINDOW database that stands for the official reference for the optical and thermal properties of transparent building materials [43]. The coefficients of reflectance for interior surfaces are designated to regulate the reflected behavior according to education environments recommended in the IES Lighting Handbook: ceiling 0.80, walls 0.50, and floor 0.20 [41].
The LEED v4.1 – EQ: Quality Views framework was used as a comparative assessment for view quality. The Quality of View to the outdoors was quantified using an indicator (View percent) based on effective visual access to the outdoor environment, defined for this study [34]. The View Percent metric was evaluated considering a 360° horizontal field of view bounded by ±30° from the observer’s eye level. An observer eye height of 1.20 m above the floor was considered, and requirements for effective view depth were applied as a design constraint across all scenarios (Figure 1).
For annual lighting energy analysis, the developed models were imported into OpenStudio/EnergyPlus. In this process, the Daylighting Controls system was activated to simulate lighting energy consumption dynamically in response to available daylight. Annual lighting energy consumption (kWh/m²) was calculated based on dimming of electric lights in the presence of daylight, and results were extracted from EnergyPlus simulations [33].
In order to achieve comparable results from one simulation to the next and obtain high simulation accuracy, the Radiance parameters were set to High Accuracy and the same Radiance parameters for all models were employed. In this study, therefore, only changes in window geometry cause any variability, all non-geometric parameters were constant (Table 4). In addition, the simulation tools employed in this work have been widely validated in earlier work and used internationally [32, 44, 45]. Previous studies have demonstrated good agreement between simulation results and field measurements, supporting the methodological reliability of the adopted simulation approach.
Table 4

Table 4. Key radiance parameters (high accuracy)-recommended by Ladybug Tools guidelines.
Figure 2 summarizes the overall methodology adopted in this study, including parametric modeling, performance simulations, and MCDM-TOPSIS analysis.
Figure 2
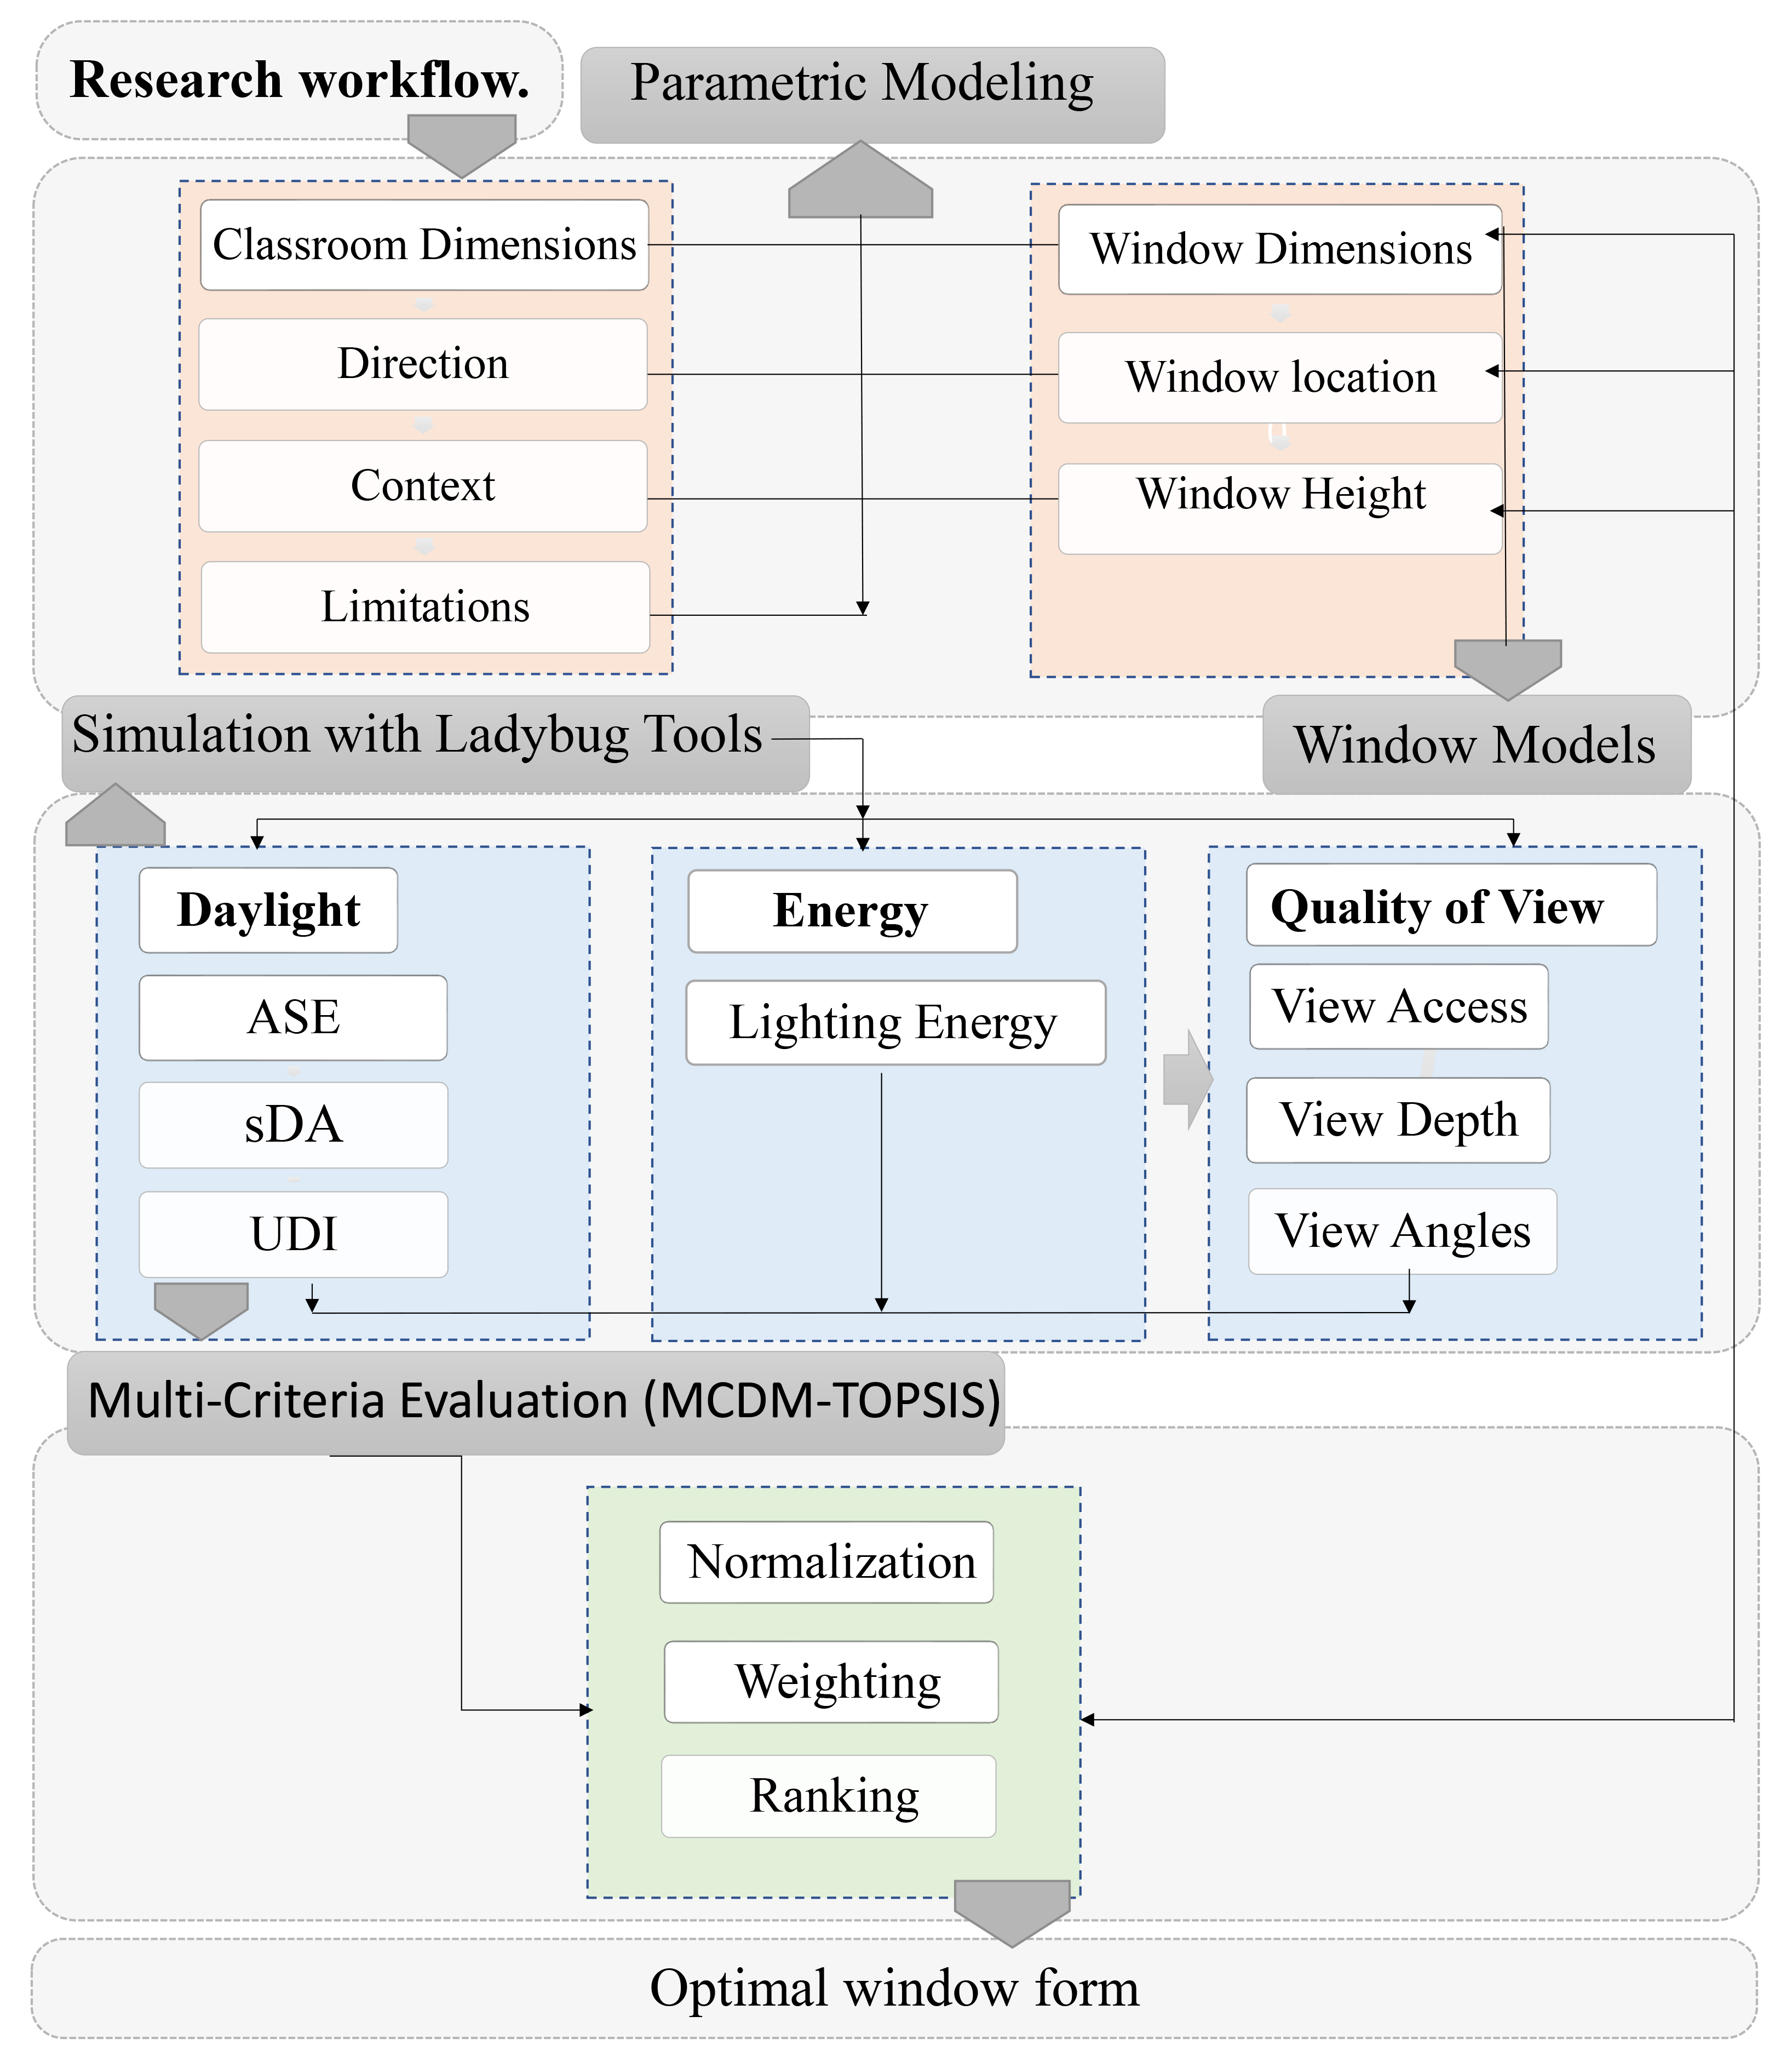
Fig. 2. Research framework.
2.3. Case study
The case study pertained to a south-facing classroom at the Faculty of Architecture, Islamic Azad University, Khorasgan Branch, Isfahan, Iran. The south-facing façade was selected as a challenging orientation in a hot and dry climate because it is exposed to substantial direct solar radiation and allows the influence of window geometry on daylight performance and direct solar exposure to be evaluated. The classroom was located on the ground floor, with internal dimensions of 6 m wide × 8 m deep × 3.40 m high, a floor area of 48 m², and a south-facing wall area of approximately 20.4 m². The windows are south-facing, consisting of four vertically divided units, each 1.20 m wide × 1.80 m high, with a sill height of 1.15 m. Window recess depth was 0.1 m, and the window-to-wall ratio was approximately 42% (Figure 3).
Figure 3
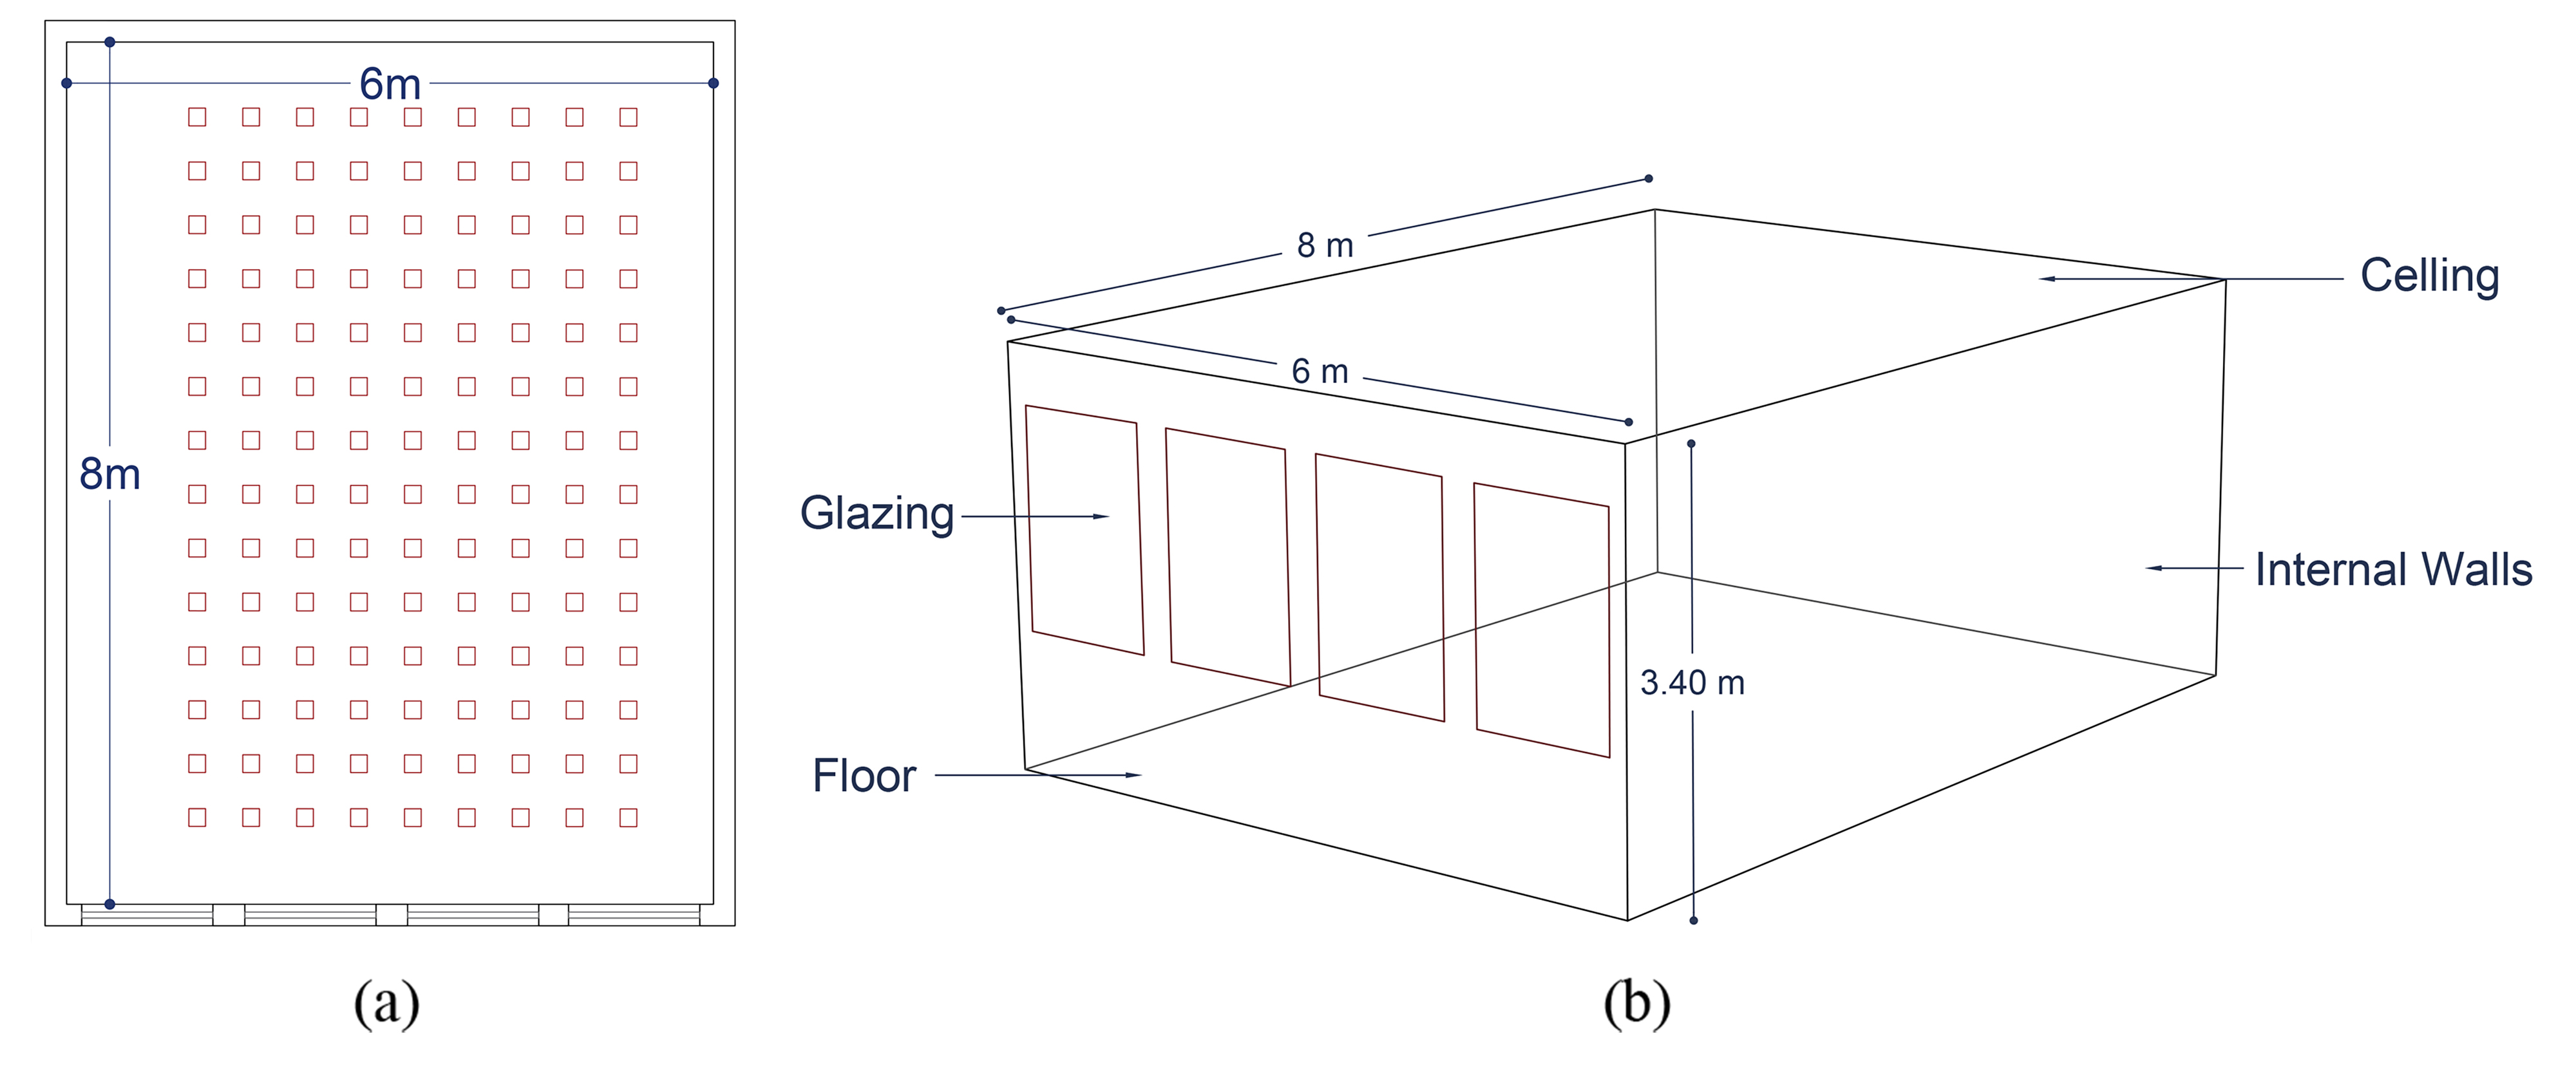
Fig. 3. (a) Plan and (b) 3D view of the case study model.
Using the properties of the base model, the 10 window models were categorized in three types of division: 1- vertical (variable number of vertical divisions, width, and height), 2- horizontal strip (one to three consecutive strips of varying height), 3- grid (with identical module sizes). For all models, the glass-to-wall surface ratio remains the same (about 42%), only the pattern/proportions of the transparent surface is changed. Figure 4 indicates 10 window forms.
Figure 4
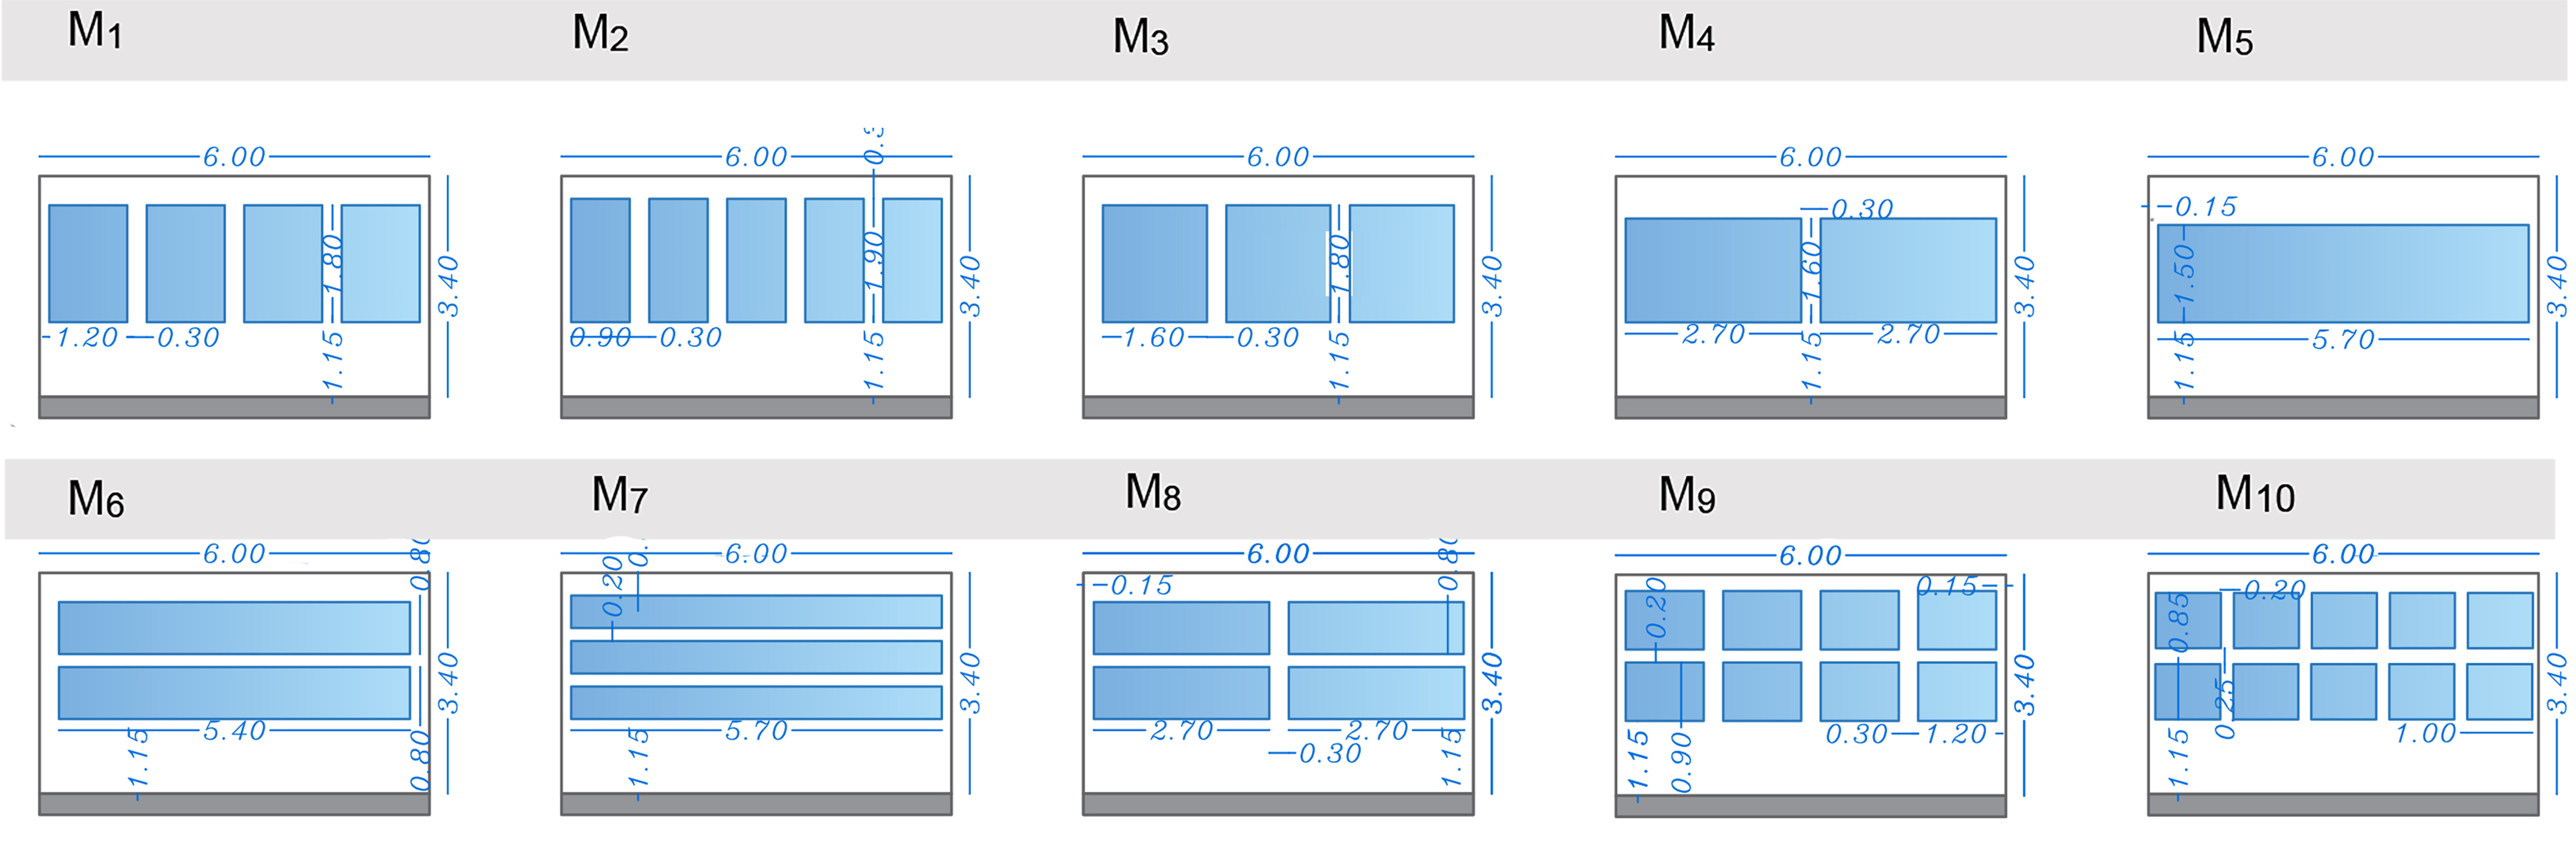
Fig. 4. Window form models with a fixed WWR on the south façade.
2.4. Occupancy Schedule and Simulation Settings
A classroom is occupied from Saturday to Thursday from 8:00 a.m. until 5:00 p.m. An average Lighting Power Density (LPD) for educational facilities of approximately 7.8 W/m² is established using ASHRAE 90.1-2019. The Daylight Controls system in EnergyPlus/OpenStudio automatically adjusts the amount of electric lighting based on how much daylight is available and calculates the total annual energy consumption for lighting (kWh/m2). [46].
A 300 lux threshold was used as the reference daylight illuminance level required for turning off or dimming artificial lighting gradually, and daylighting metrics were interpreted according to the IES LM-83-12 standard [31].
2.5. Multi-Criteria Decision-Making (MCDM)
To enable a coherent comparison across different window-form models, a Multi-Criteria Decision-Making (MCDM) framework was applied. In the first step, to eliminate scale effects and allow comparability among heterogeneous indicators, all metric values were normalized to a dimensionless range [0,1] using the min–max method. Beneficial indicators, including Spatial Daylight Autonomy (sDA), Useful Daylight Illuminance (UDI), and quality of view (QV), were normalized according to Equation (1). In contrast, cost-type indicators, including Annual Sunlight Exposure (ASE) and Annual Lighting Energy (EL), were normalized based on Equation (2).
Normalization of benefit-type indicators:
Normalization of cost-type indicators:
where xi is the original value of indicator i for each design option, and min(xi) and max(xi) are the minimum and maximum values of the same indicator among all options, respectively. represents the normalized value of indicator in the range [0,1]. If the minimum and maximum values of a specific indicator were equal, the normalized value was assigned equally to all options to prevent numerical instability.
To account for the relative importance of the indicators and address specific design priorities in hot and dry climates, three weighting scenarios ( ) were defined ( ).
- Equal Weighting: A uniform weight of 0.20 was assigned to all five indicators to serve as a baseline for comparison.
- Daylight Priority: To reflect the significance of natural lighting performance, 75% of total weight was allocated to daylighting metrics (0.25 for each of the sDA, UDI, and ASE indicators), and the remaining 25% was distributed equally between lighting energy and quality of view indicators.
- Balanced Tri-Objective Weighting: Given the necessity of a comprehensive approach in hot and dry climates, an equal weight of 33.33% was assigned to each of the three main functional objectives (daylight, energy, and view).
Afterward, the TOPSIS algorithm is utilized to finalize the ranking of the design alternatives. The basic premise underlying this method is that an optimal alternative should have the smallest distance to the positive ideal solution (the best possible value for all criteria) and the largest distance from the negative ideal solution (the worst possible results). Once the weighted Euclidean distances of the options were calculated based on their proximity to the positive and negative ideal points in the normalized decision space, a (Relative Closeness Score) was calculated for each design alternative. Ultimately, we ranked the design alternatives based on their maximum closeness scores to identify the design that scored the highest as our preferred option. The results of the ranking will also serve as a basis for the comparative analysis contained in the Results section and allow us to evaluate daylighting performance in total, lighting energy consumption in total and quality of view in total.
3. Results and discussion
3.1. Overview of model performance
Table 5 summarizes the performance of 10 window models (M1–M10) in terms of daylight, lighting energy, and quality of view indicators. In all models, the transparent surface-to-wall ratio was kept constant to reflect the actual classroom in the hot and dry climate of Isfahan, and to evaluate the effects of window geometry and division pattern on the metrics.
Table 5
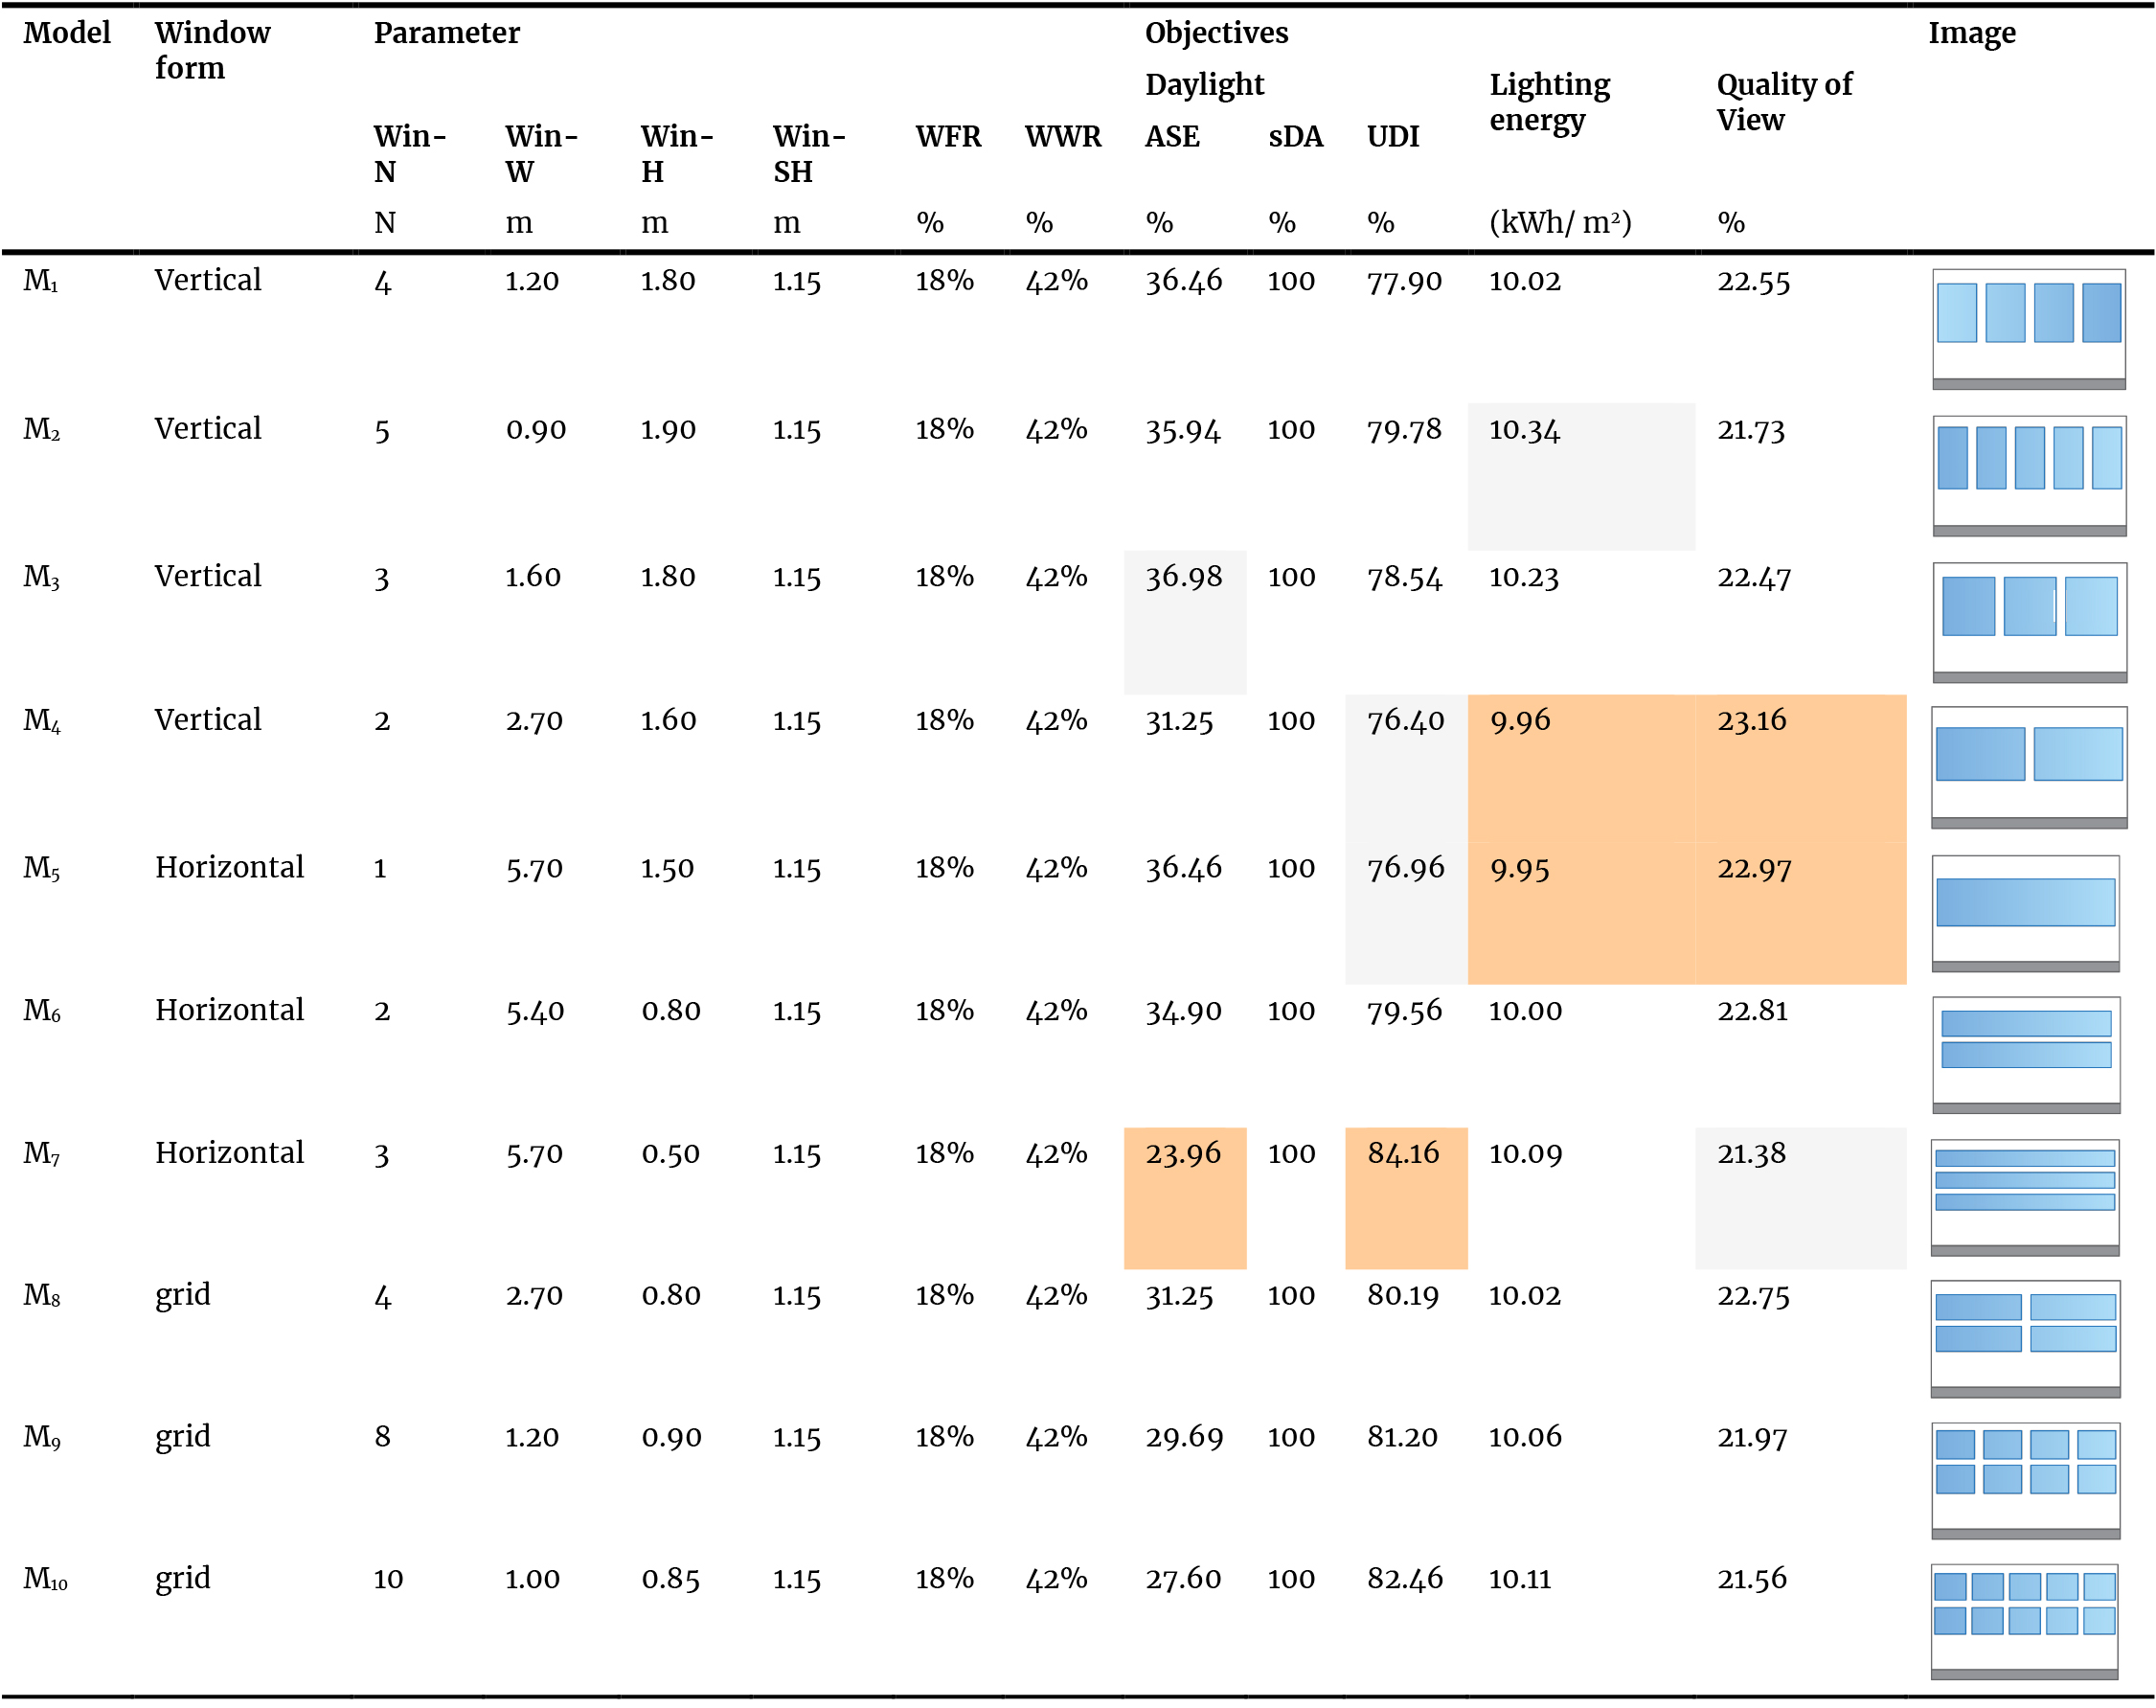
Table 5. Daylight, lighting energy, and quality of view indicators in ten window models.
From the output results it can be noted that sDA values are 100% in all the models. This result, especially, if we compare with the higher percentage of window-to-wall ratio, explains that the required amount of yearly daylight is available for the educational space. Thus, it complies with the IES LM-83-12 standard [31].
However, it was observed that there are greater differences among the models for Annual Sunlight Exposure indices (ASE1000/252h), Useful Daylight Illuminance (UDI100-200 lux) and Quality of view (QV). These indices simultaneously play a key role in establishing a balance among the adequacy of natural lighting, control of direct solar exposure, and the quality of visual perception; an issue that was emphasized in daylight and visual comfort assessment frameworks, especially for educational spaces [47].
3.2. Daylighting Performance (sDA, UDI, ASE)
Despite keeping the window-to-wall ratio (WWR) constant across all models, variations in window height, proportions, and division patterns resulted in significant differences in climate-based daylight metrics. This indicated that, beyond total glazing area, the geometric organization of openings plays a significant role in shaping daylight conditions within the classroom.
Useful Daylight Illuminance (UDI100–2000 lux): UDI values among the models ranged from 76.40% to 84.16%. The highest value was obtained for Model M7 (three horizontal bands) at 84.16%, indicating a more uniform distribution of useful daylight and more effective penetration into interior areas. Conversely, Models M4 and M5 showed the lowest UDI values, reflecting reduced uniformity of useful daylight in deeper areas. In general, the trend shows that for a constant WWR, division pattern and window sizes, the quality of useful daylight distribution is dramatically affected. This conclusion is consistent with the recently published work focusing on window geometry and horizontal or vertical division pattern of window and its impact on daylight uniformity irrespective of configuration [9,10,26].
Annual Sunlight Exposure (ASE1000/250h): Model ASE values from 23.96% to 36.98%, with the smallest value for M7 (three horizontal bands) and largest value for M3 (three vertical sections).
These findings suggest that a number of geometry patterns, for example a set of consecutive horizontal subdivision and more fragmented forms, are helpful for minimizing direct sunlight gain and the risk of glare. Control of ASE is particularly critical in hot and dry climates where direct sunlight gain decreases visual comfort and is associated with increased solar heat gains. This finding is consistent with recent works showing the potential of window geometry for achieving a trade-off between daylight, glare and energy consumption. [48].
Spatial Daylight Autonomy (sDA300/50₀%): In all models, sDA indicator reached 100%. Given the constant WWR, and the relatively large window dimensions in all scenarios, this result was expected and indicates full annual daylight sufficiency in the classroom. Therefore, ASE and UDI indicators were considered the primary metrics for differentiating daylight performance among window forms, as sDA alone cannot distinguish model performance (Figure 5).
Figure 5
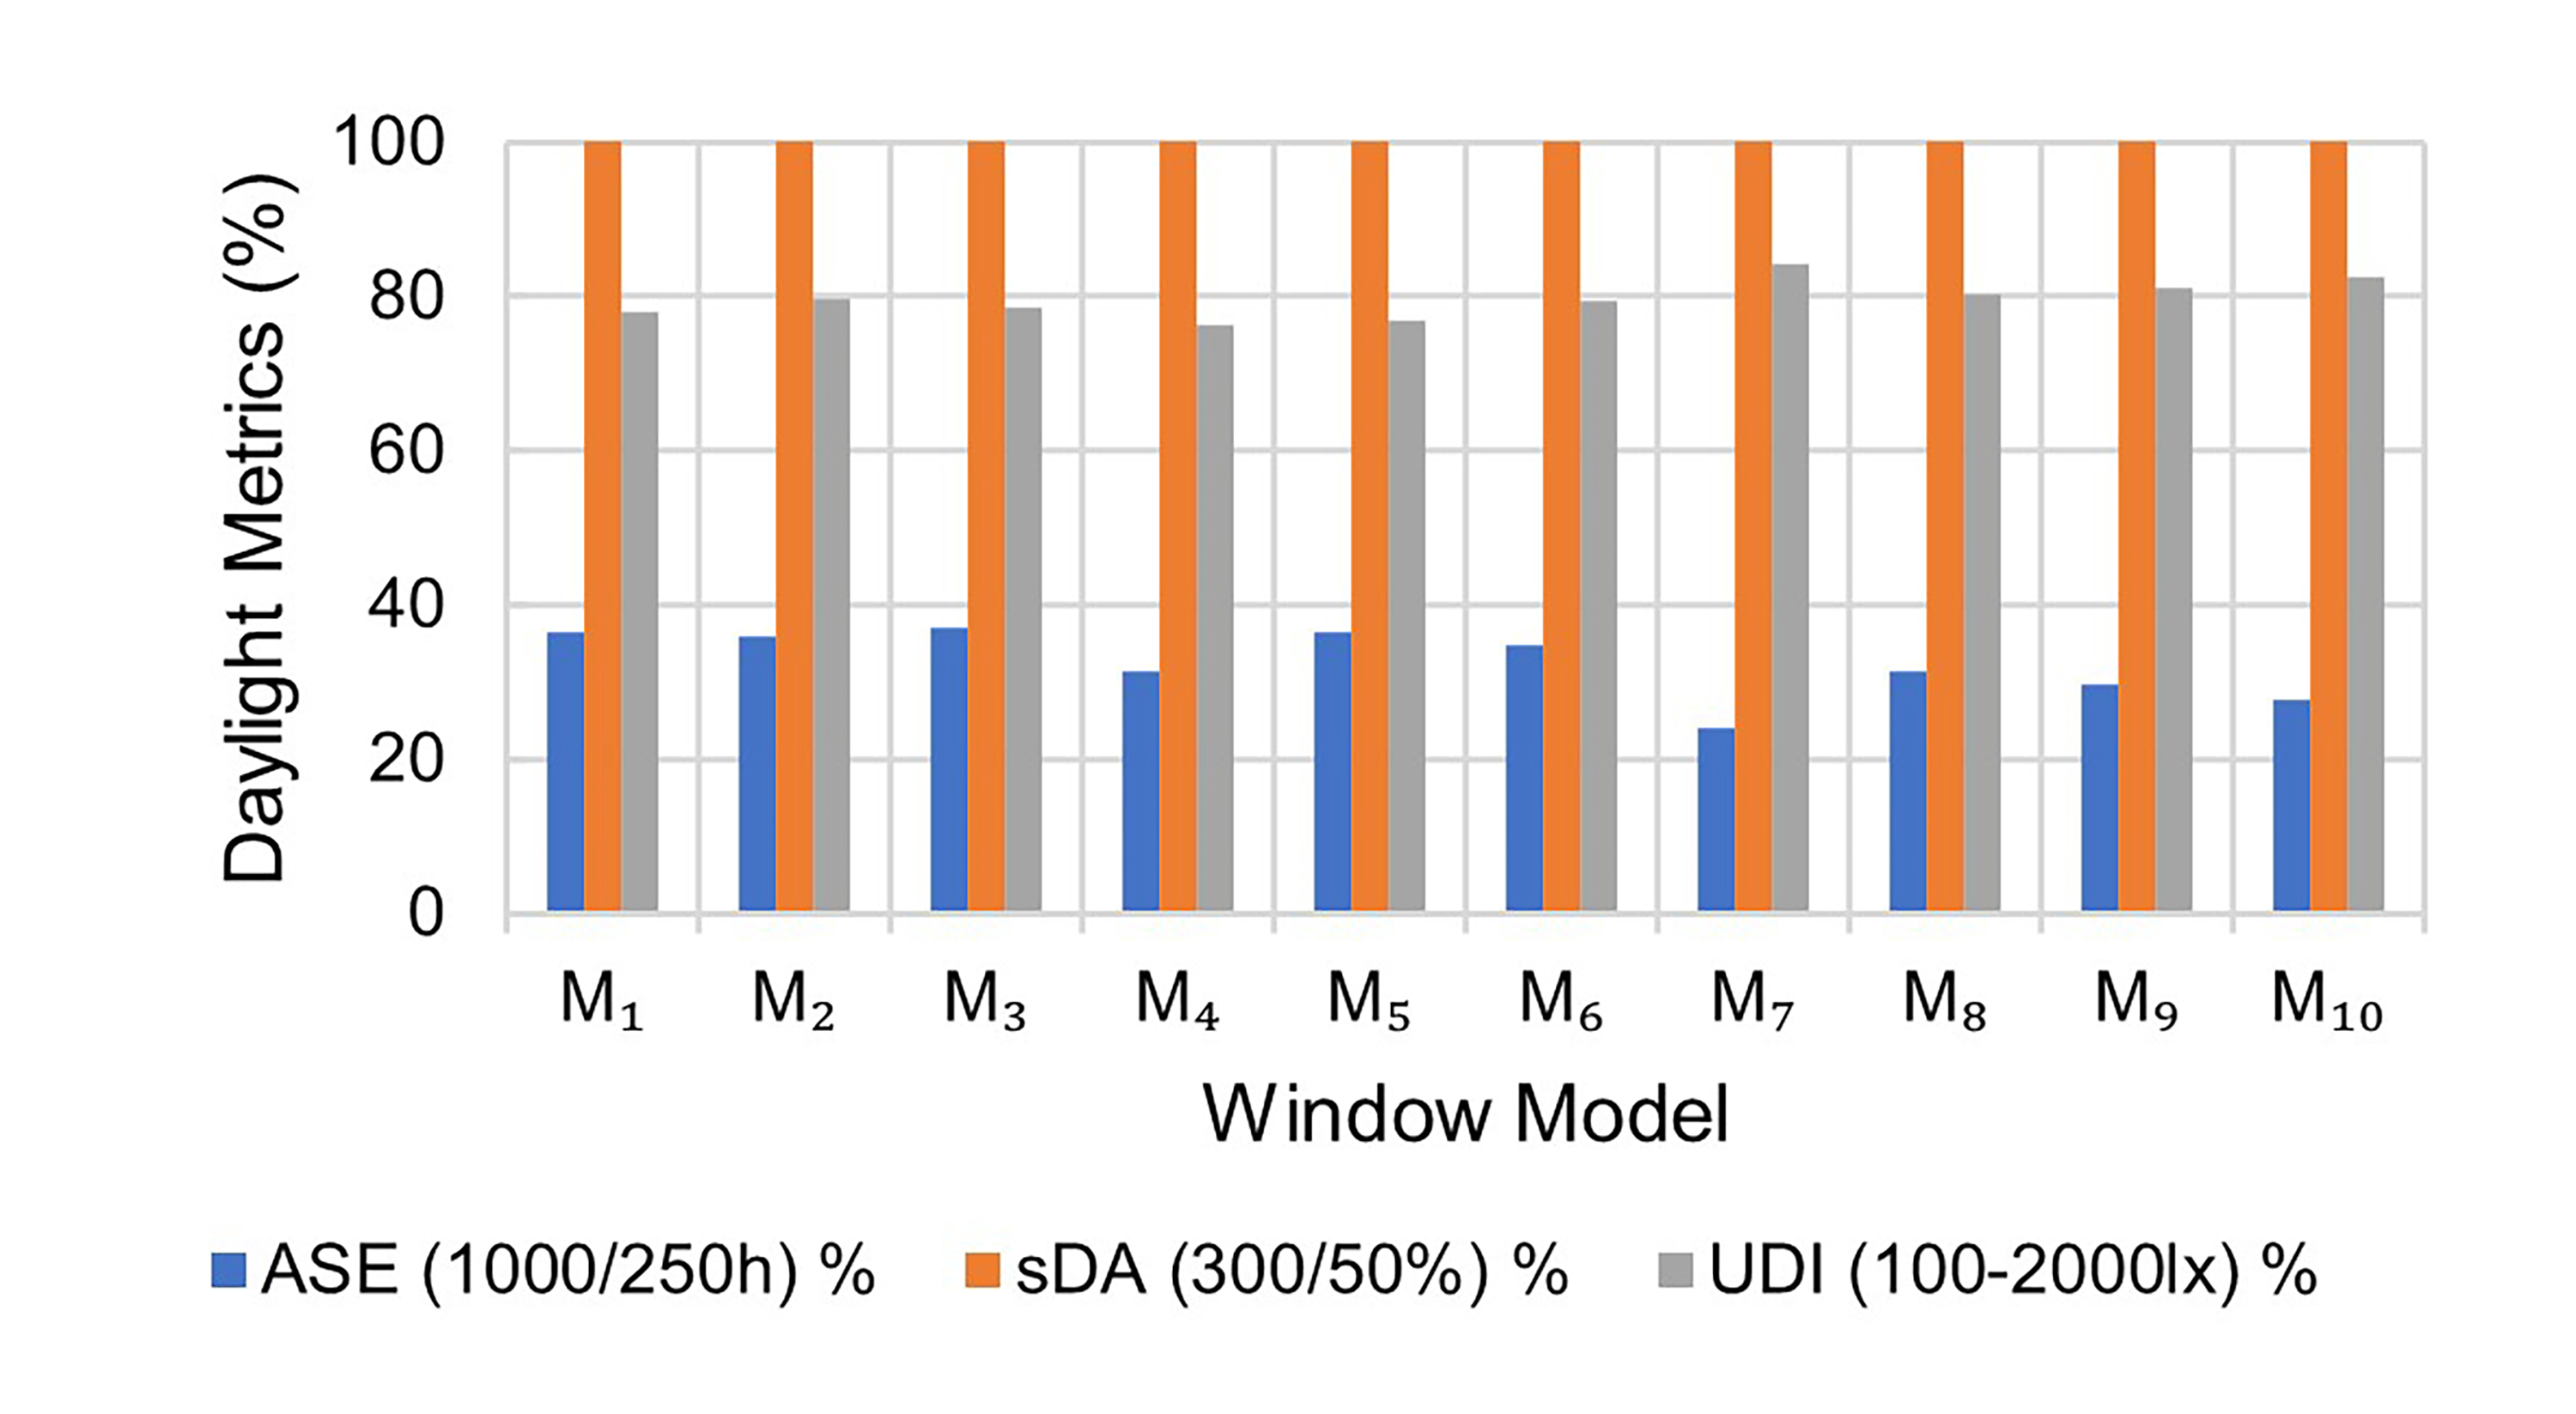
Fig. 5. Comparison of sDA, UDI, and ASE indicators across ten window models.
3.3. Lighting energy
Annual lighting energy consumption of each window model (M1-M10) had narrow scope which were from 9.95 to 10.34 kWh/m2. The lighting energy consumption was minimum for model M5 (single section horizontal strip window) which was 9.95 kWh/m2. Model M4 followed it with 9.96 kWh/m2, model M6 with 10.00 kWh/m2 and models M1 and M8 with 10.02 kWh/m2. In contrast, the highest lighting energy consumption was observed for model M2 at 10.34 kWh/m², followed by model M3 at 10.23 kWh/m².
Although many previous studies associate higher UDI values with lower ASE and reduced lighting energy consumption, this study's results indicated that the relationship is not necessarily linear or direct. For instance, Model M5, despite having a relatively low UDI (76.96%) and high ASE (36.46%), exhibited the lowest annual lighting energy consumption. Similarly, Model M4, with a low UDI (76.40%) and moderate ASE (31.25%), also showed lower lighting energy consumption (9.96 kWh/m²). In contrast, Model M7, despite a high UDI (84.16%) and low ASE (23.96%), consumed more lighting energy (10.09 kWh/m²) than Models M4 and M5.
These findings suggest that window geometry relative to sensor positions, in interaction with the logic of daylight-responsive lighting control systems, plays a decisive role in final lighting energy consumption. In Model M5, it also makes illuminance levels at sensor points reach the reference illuminance for a greater portion of occupied hours due to the way daylight penetrates. In the end, it can dim the lighting for a greater duration and result in lower annual lighting energy consumption, although the spatial distribution of UDI is not optimum.
Conversely, in Model M7, although daylight distribution is more uniform across the space, illuminance at sensor points less frequently reaches the control thresholds for significant dimming or switch-off, leading to higher annual lighting energy use (Figure 6).
Figure 6
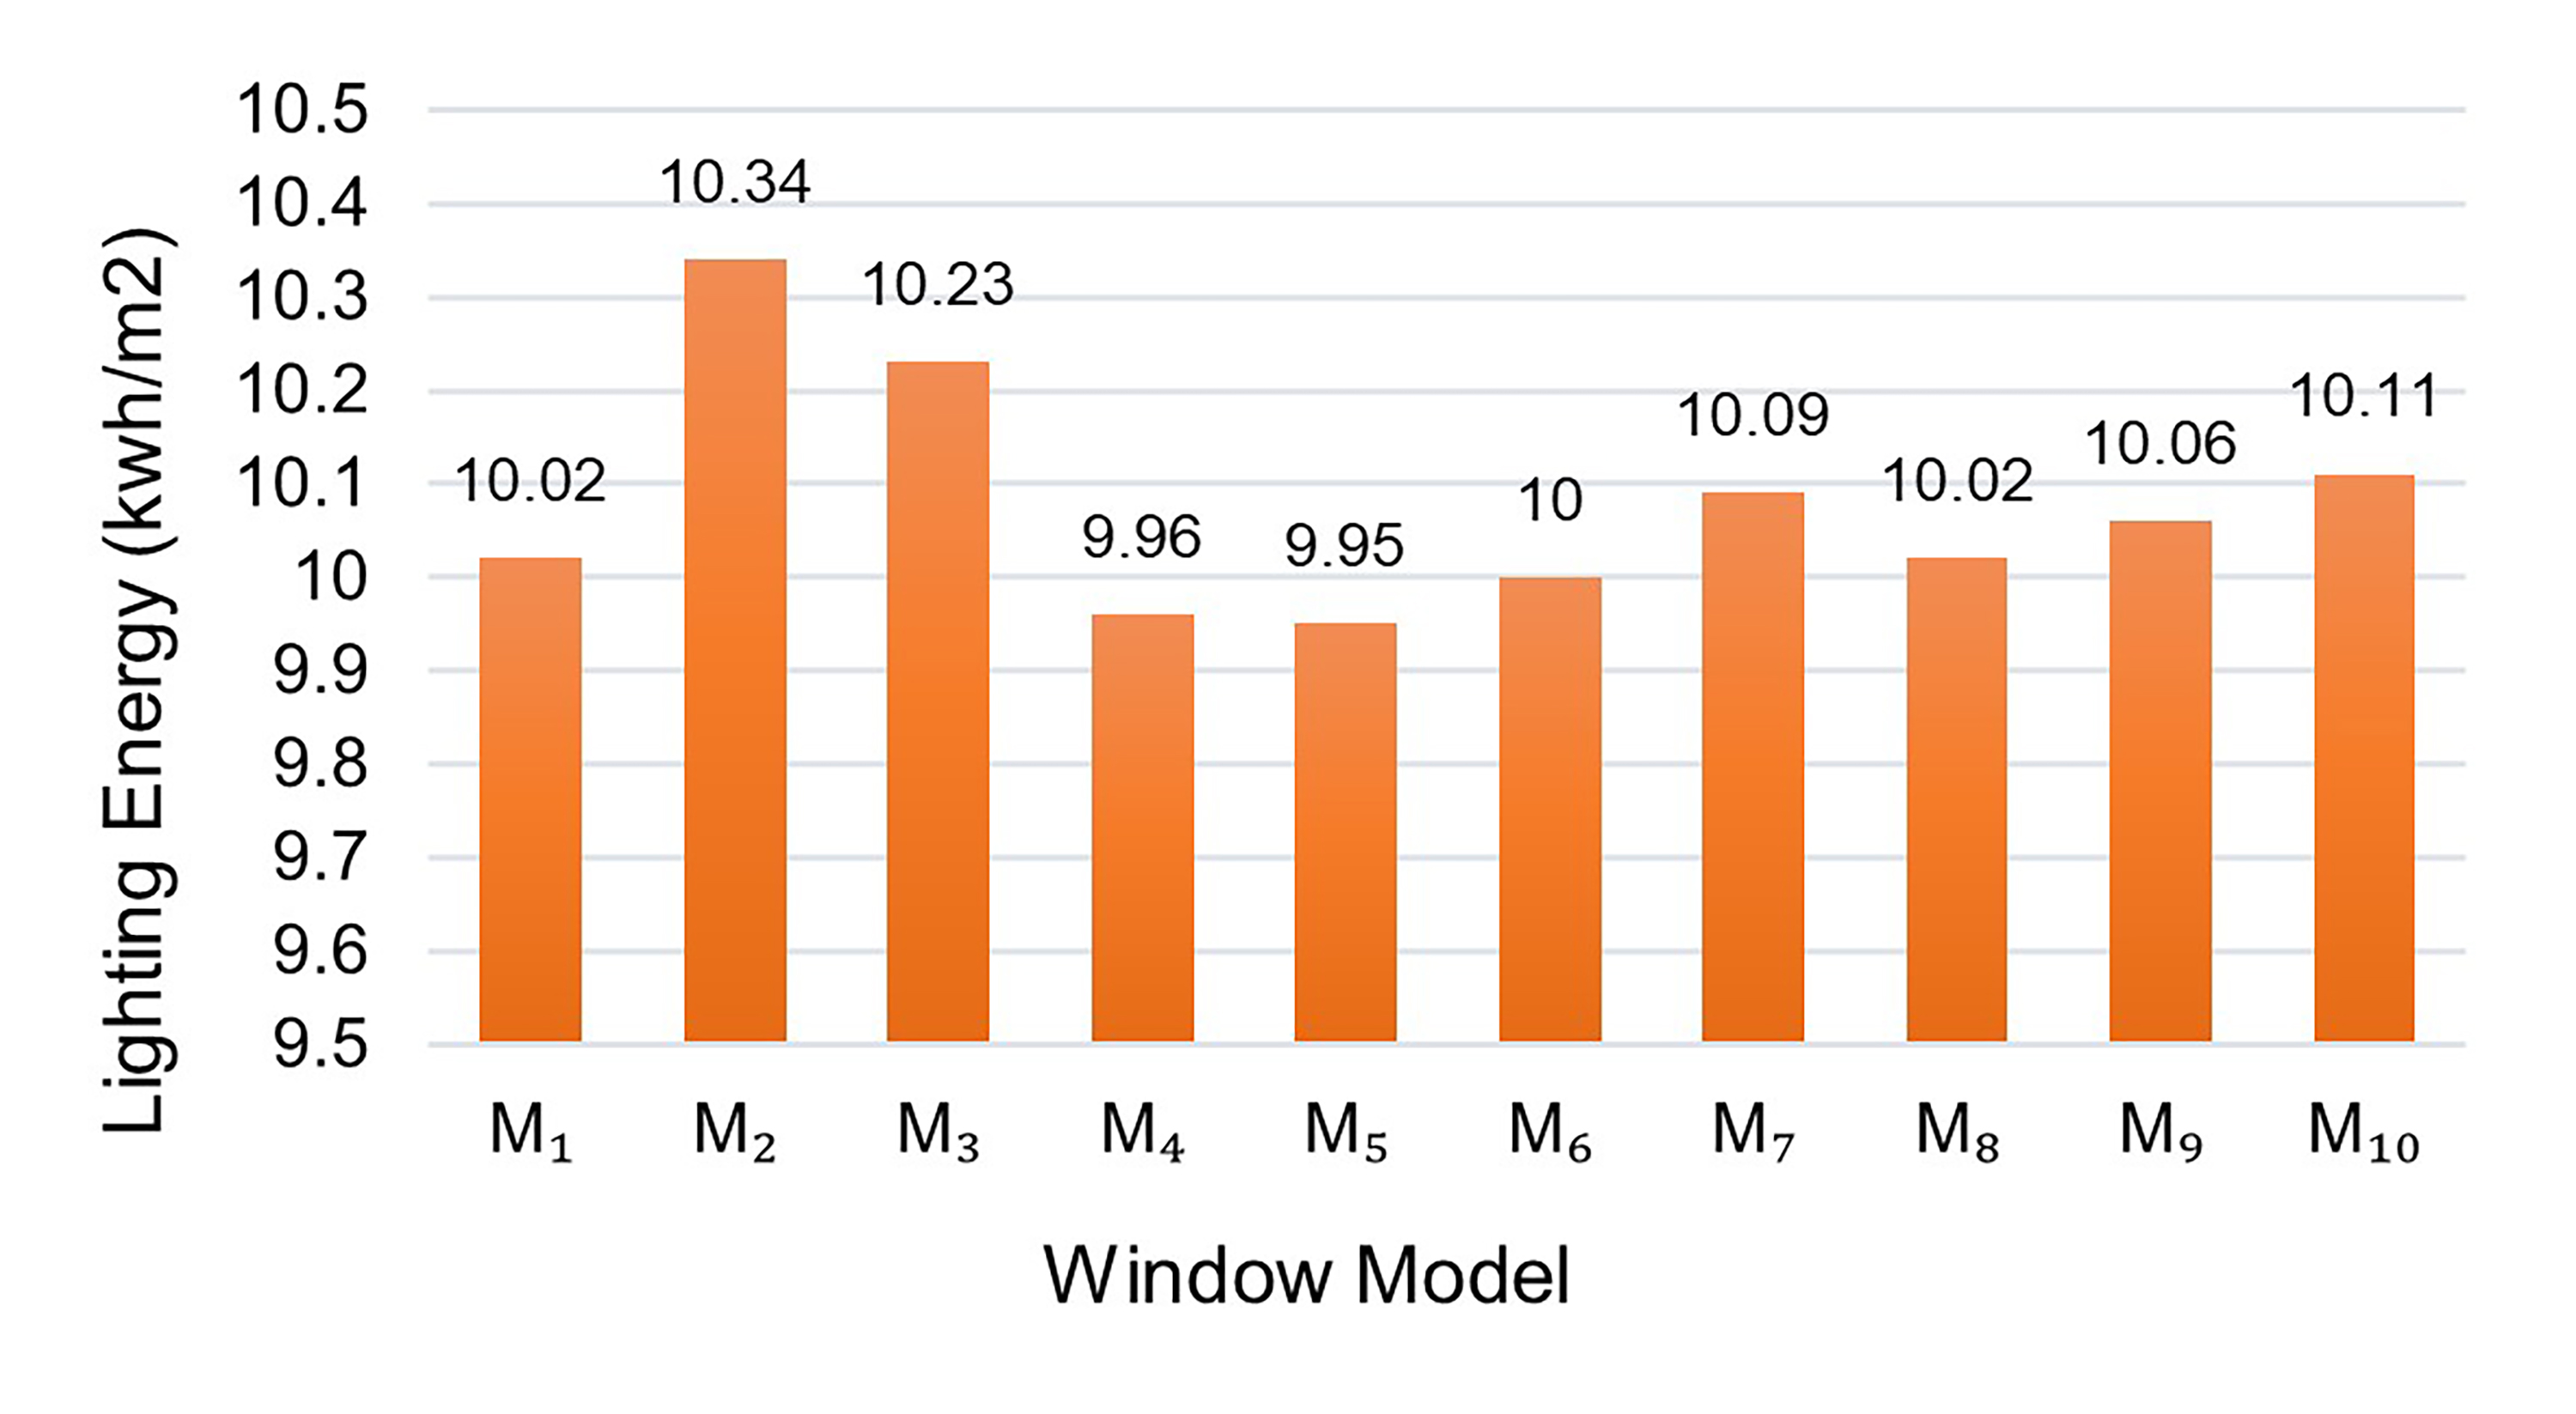
Fig. 6. Annual lighting energy Consumption for ten window models.
These observations are consistent with prior studies on daylight-responsive lighting systems in educational spaces, emphasizing that the temporal–spatial pattern of daylight availability at control sensor locations, rather than average daylight metrics such as UDI, is a key factor in predicting lighting energy consumption [22,31].
3.4. Quality of View (QV)
All models satisfied the baseline requirements for effective view access to the outdoors, with more than 21% of the regularly occupied area having direct sightlines to the exterior. These values meet the minimum criteria defined in LEED v4.1 – EQ: Quality Views. Although all models met this requirement, the variation in QV among them was relatively limited (21.38%–23.16%), which is expected given the fixed WWR and façade orientation (Figure 7).
Figure 7
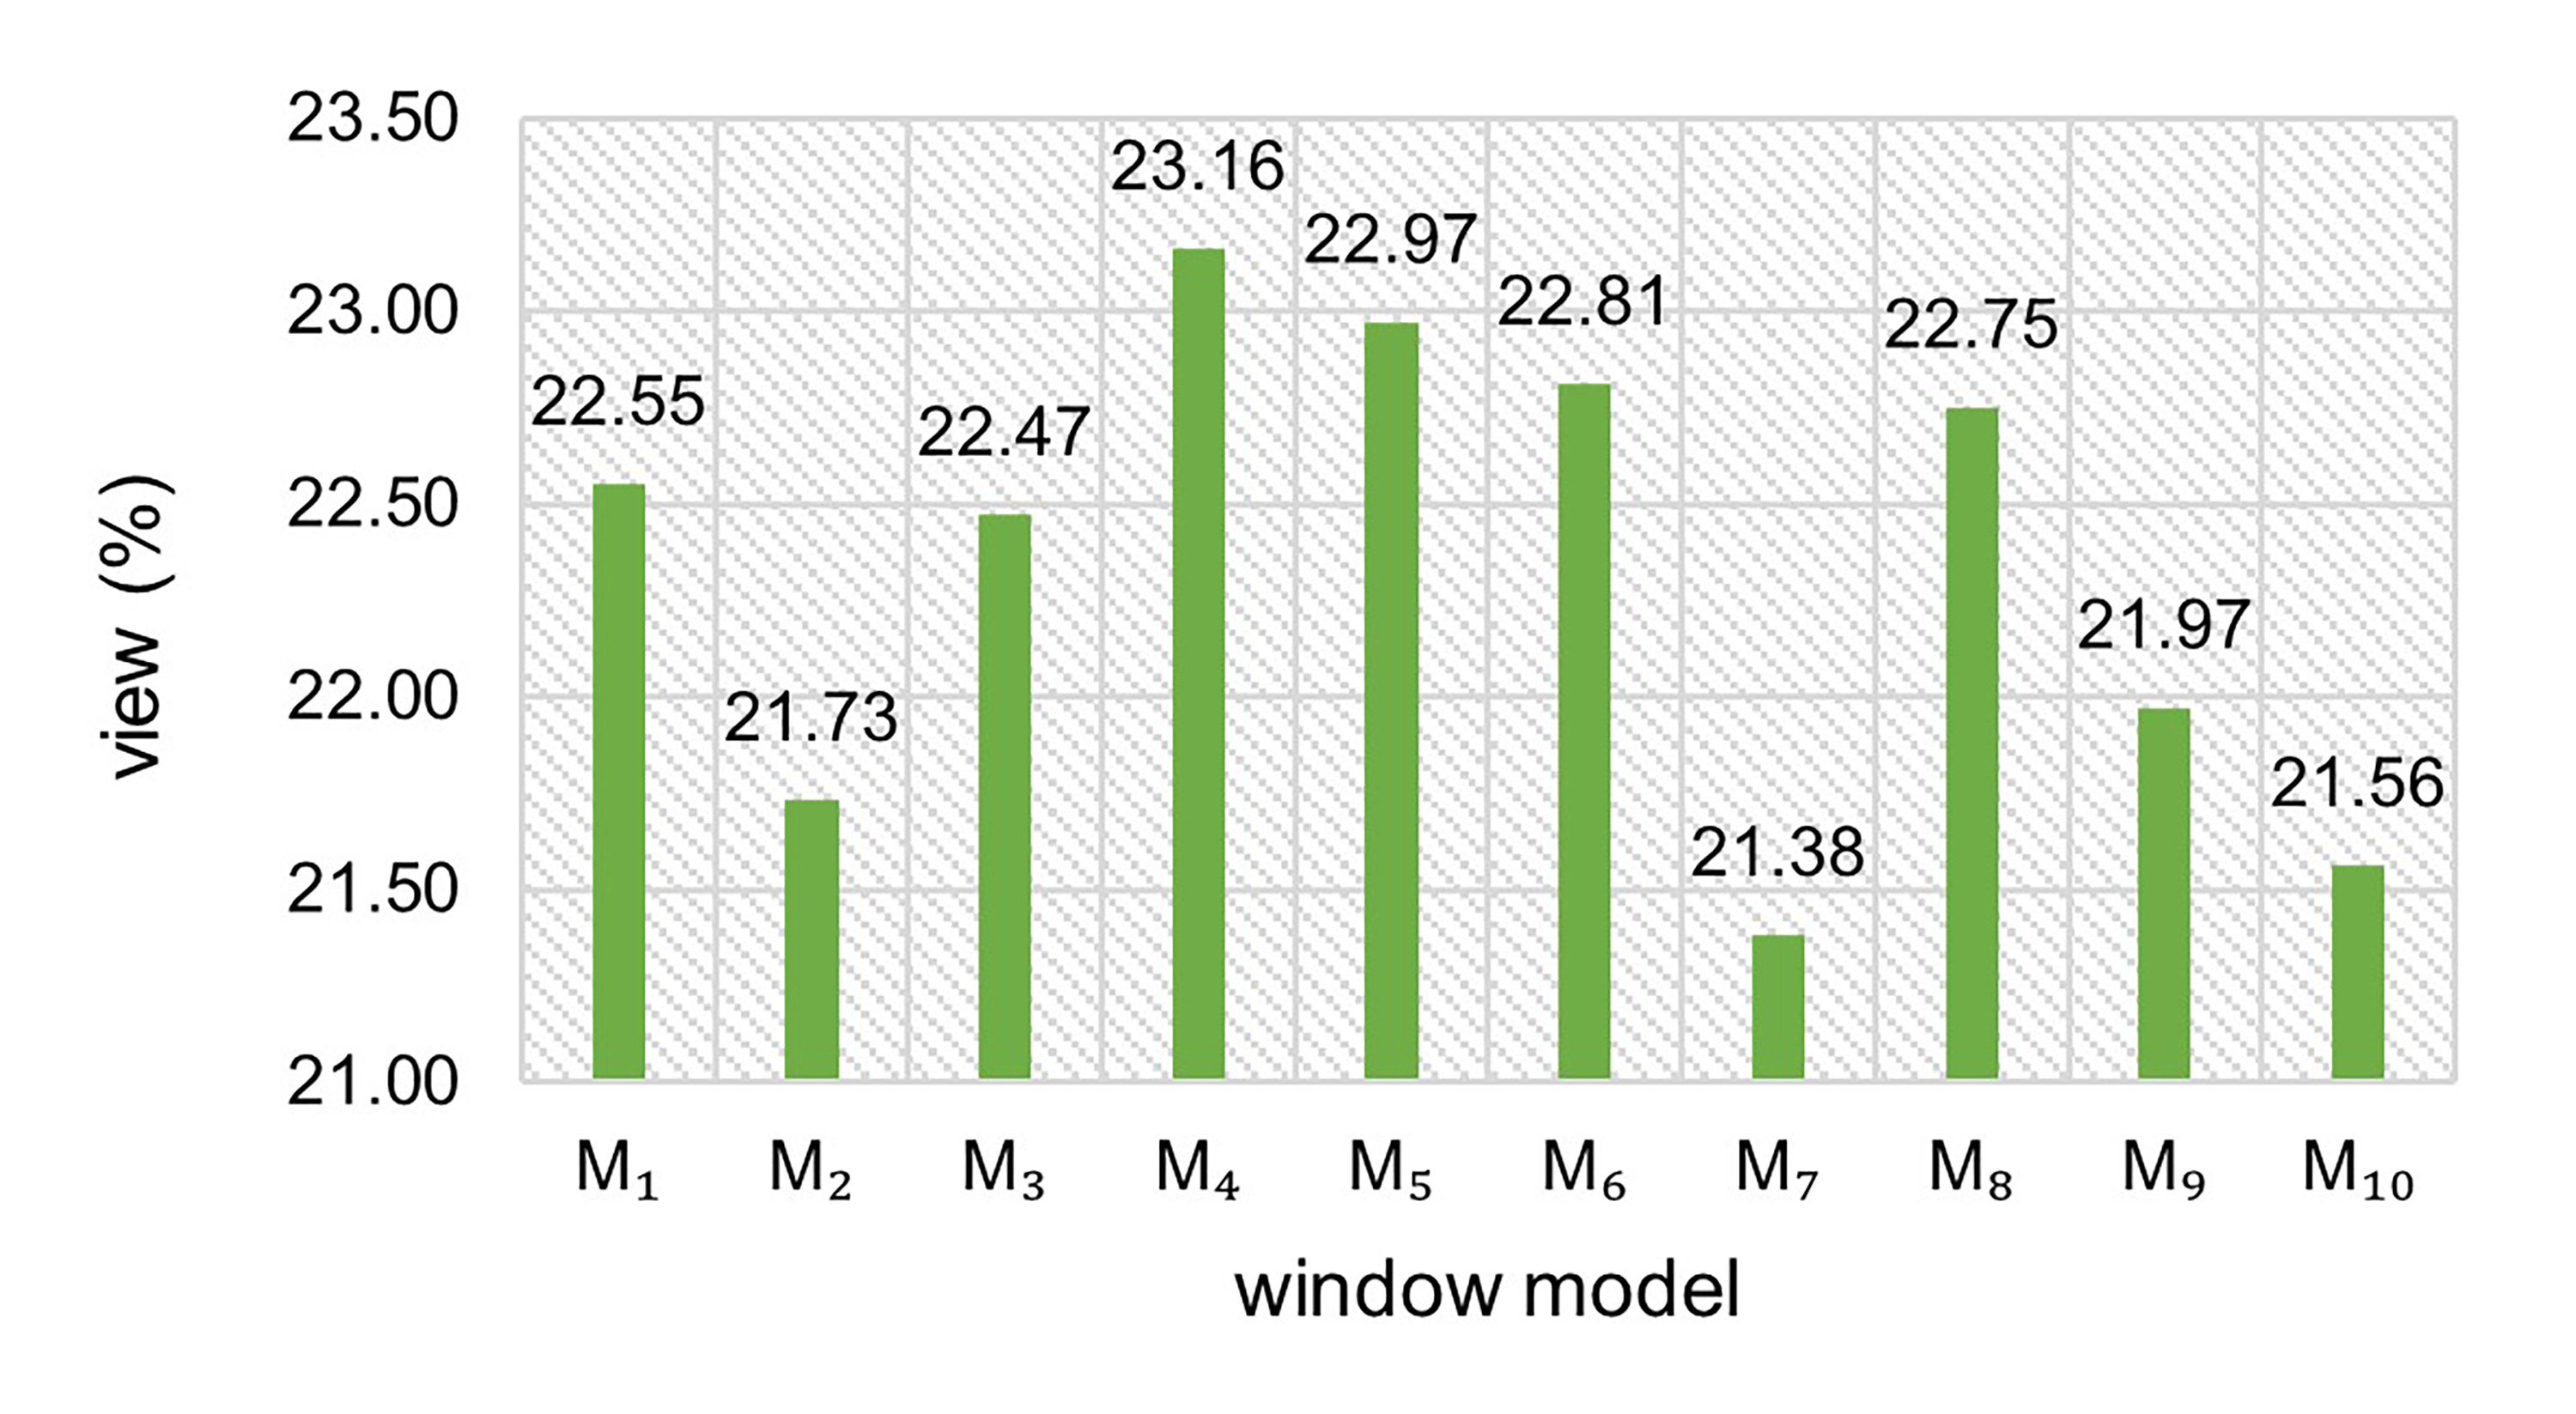
Fig. 7. Comparison of View percent for ten window models.
Model M4 (double vertical window) resulted in the highest quality of view (23.16%). It performed so well due to the larger vertical view depth and uninterrupted vertical view field, where the environment outside is more visible from many angles within the class. In contrast, Model M7 (three horizontal bands) showed the lowest quality of view at 21.38%. In this model, although the horizontal arrangement improves daylight uniformity, the reduced vertical view depth and the limitation of effective vertical field of view result in a lower QV index.
These results were consistent with recent studies indicating that window geometric division, even under a fixed WWR, can significantly affect quality of view and the extent of visual field for users [11,34].
3.5. Visual analysis
In addition to providing quantitative data and complementing the analysis of previous sections, it is necessary to analyze visually how the distribution of natural light and the quality of outward view vary depending on the window configuration. Thus, natural light distribution maps (Figure 8) and outward quality of view diagrams (Figure 9) of four selected models, three with combined good performances (M7, M5, and M4) and one with higher chance to receive direct sunlight exposure (M2) were obtained.
Figure 8
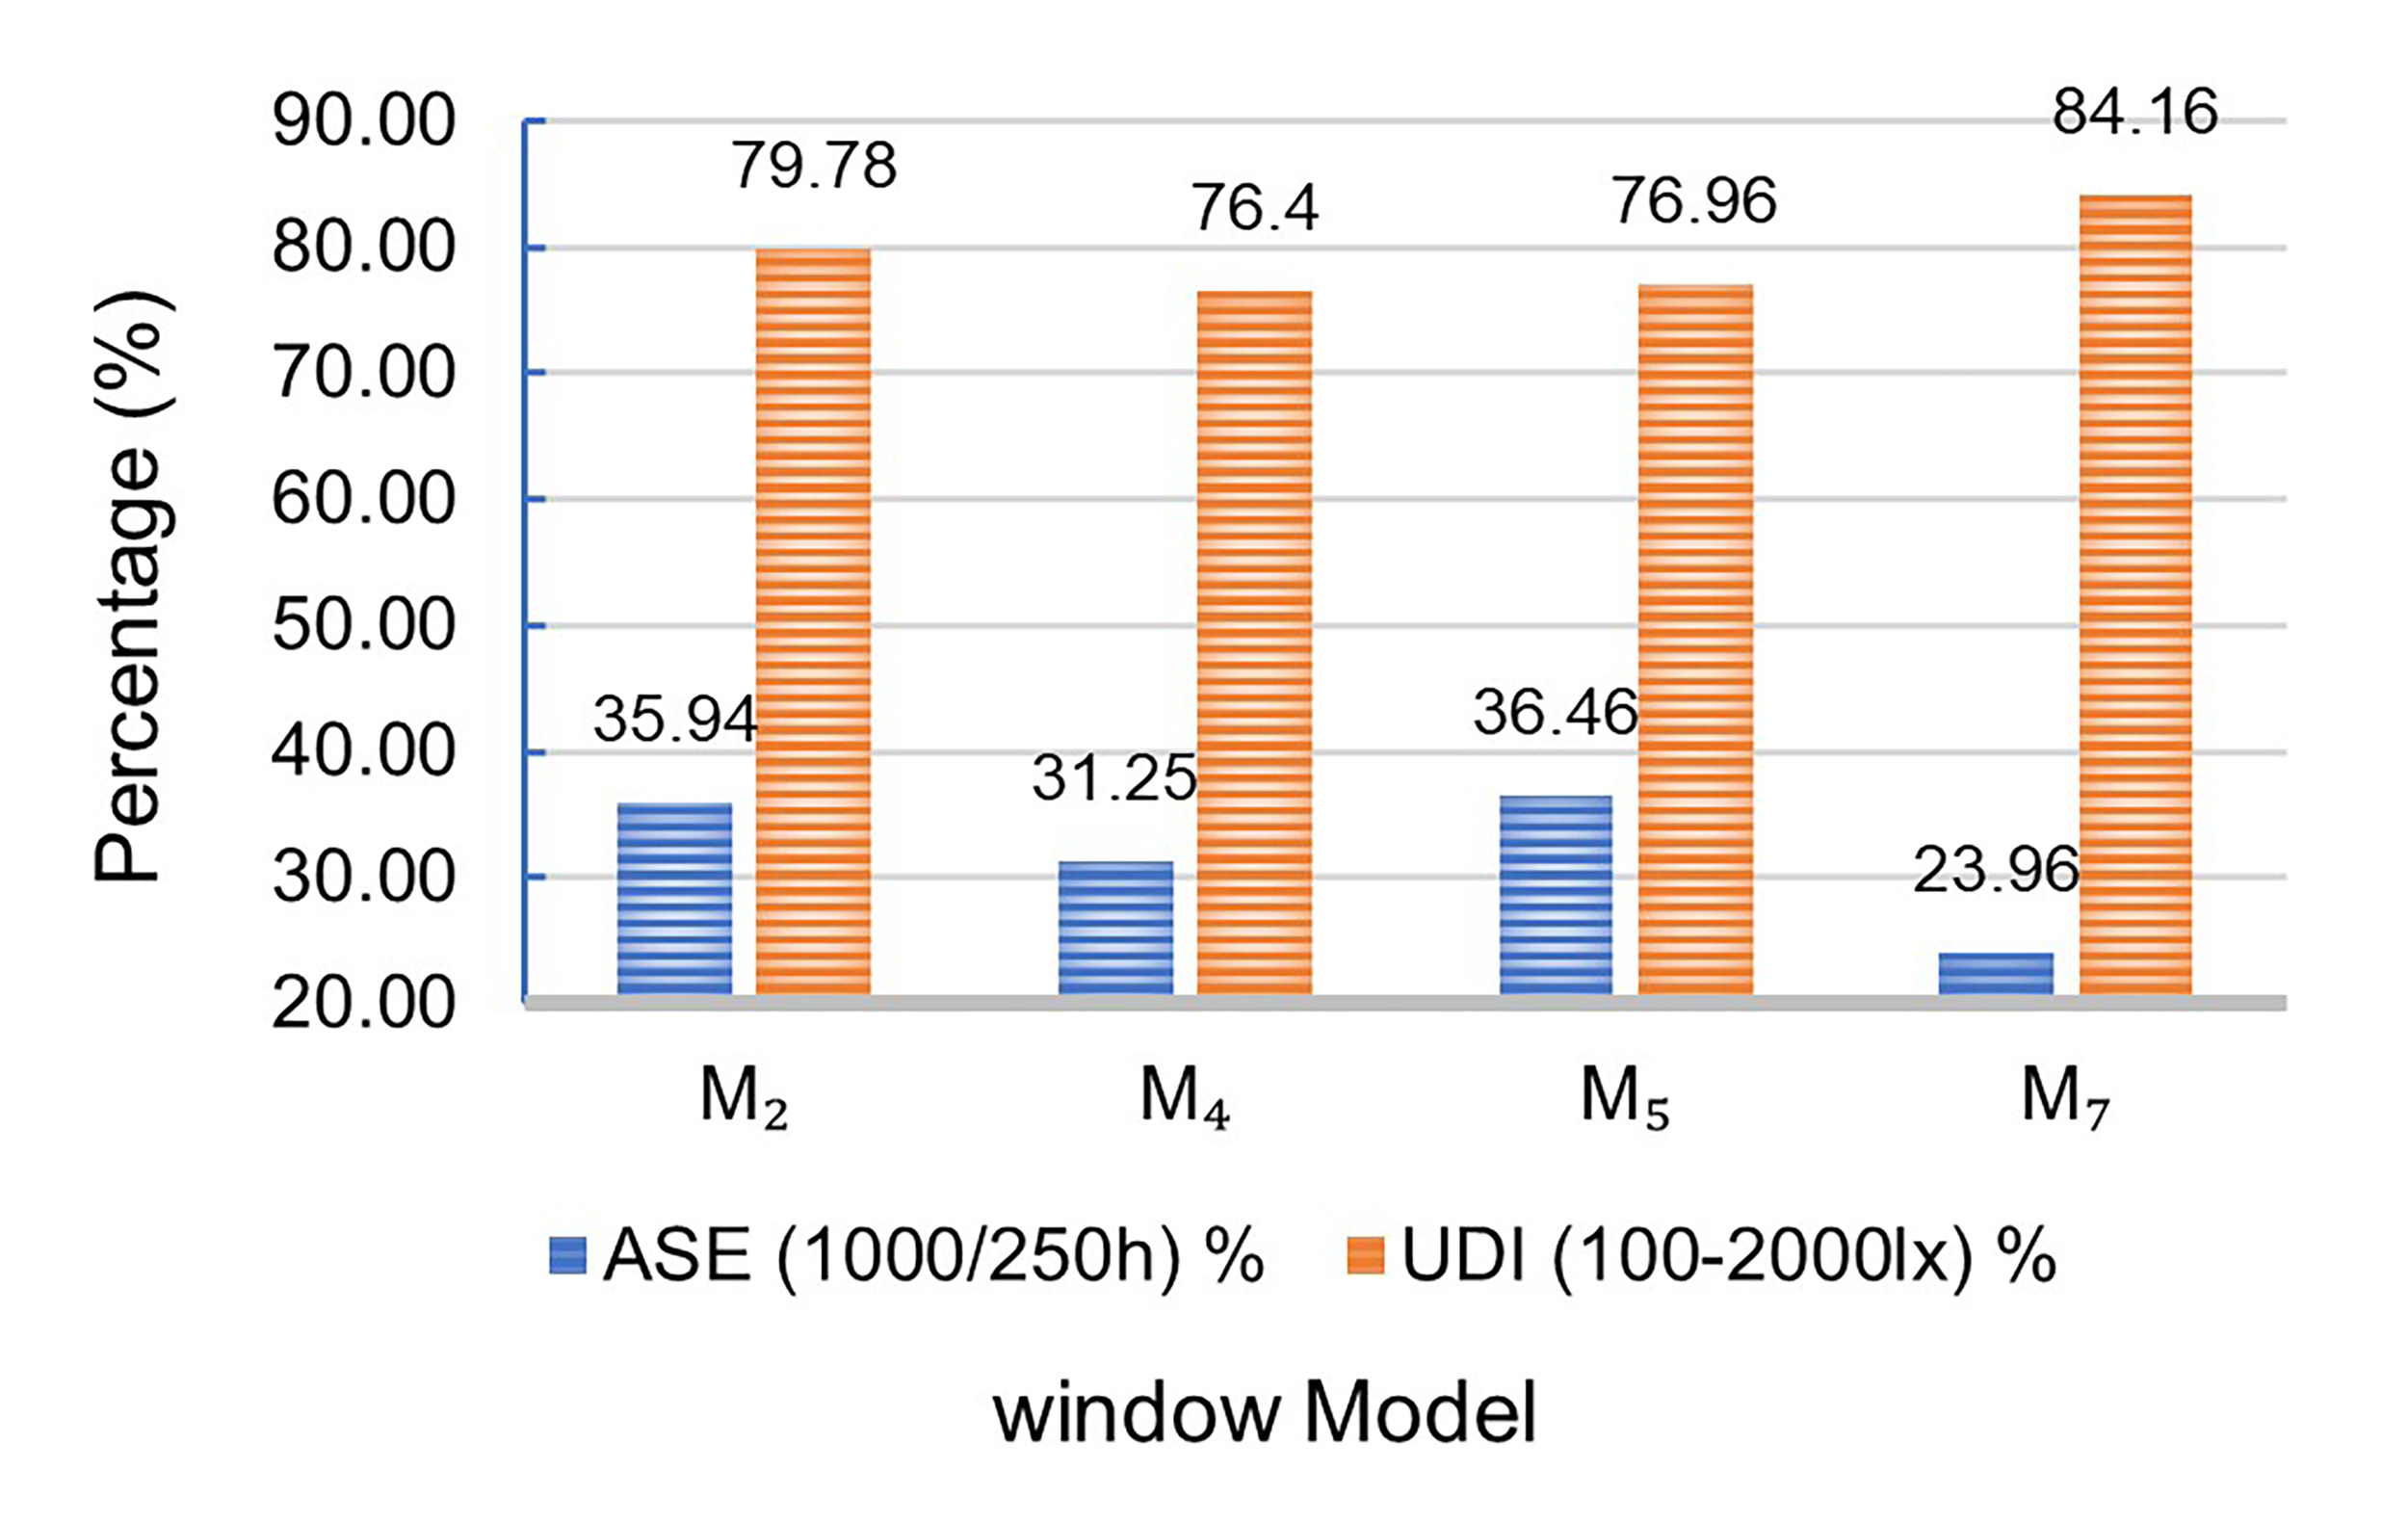
Fig. 8. Comparison of Daylight Performance for Selected Models.
- Model M7 (three horizontal bands): Daylight distribution maps show greater uniformity of illuminance across the classroom depth, with a larger portion of the space within Useful Daylight Illuminance range (UDI). Compared to others, the concentration of illuminance is not too high at south facing wall, and avoided areas of extreme high illuminance which matches the smaller ASE value in quantitative results. Qualitative analysis, horizontal division has a better uninterrupted horizontal view at eye level although not deeper than vertical division.
- Model M5 (Single Horizontal Band): In this model, the daylight penetration pattern ensures that illuminance at work surfaces and sensor points reaches the control reference level for a significant portion of occupied hours. Due to this reason the system responds to the daylight by dimming the lights over extended periods, resulting in lower annual lighting energy consumption. However, the lighting maps show areas of higher illuminance near the façade, which is consistent with the relatively higher ASE values observed for this model. From the quality of view perspective, continuous view through the horizontal orientation is obtained due to horizontal placement of the window; due to restricted vertical width the view is balanced.
- Model M4 (Vertical Two-Section): The lighting distribution maps for this configuration show a good balance between daylight penetration into the space and control of direct solar radiation near the facade. The UDI value of this model is a bit less than the horizontal configurations, the distribution of lighting is more uniformly; the values of ASE are in the mid range so no spots appear. In terms of quality of view, the vertical structure of the openings enhance the range of vision and view diversity for the vertical direction and give the best quality of view index (QV) for the models studied in this configuration.
- Model M2 (vertical five-segment): In this model, the illumination maps show a higher concentration of illumination near the facade and a decrease in uniformity at greater depths within the classroom. More vertical divisions resulted in local illuminated spots and the areas of higher contrast near wall. This is in consistent with the higher ASE values, and lower quality of view index in the quantitative results. Thus, multiple fractures in the facade wall have disrupted the field of view and weakened the overall quality of view.
As shown in the daylight distribution (Figure 8) and quality of view diagrams (Figure 9), it is apparent that disparity in performance among the models is due to combined effects of window division (horizontal vs. Vertical), number of divisions, and arrangement geometry of openings. Day lighting, lighting energy or quality of view can't be assessed from only one aspect of a model. These diagrams lay a ground for integrated comparison of performance. Figure 10 and Figure 11 presents a combined quantitative comparison of selected models (M2, M4, M5, M7) to simultaneously evaluate daylight performance, lighting energy consumption, and quality of view. Based on this integrated assessment, Models M7, M4, and M5 were identified as better-performing alternatives among the investigated models. At the same time, M2 showed the weakest performance among the models studied in the south-facing classroom in Isfahan, a hot and dry climate (BWh).
Figure 9
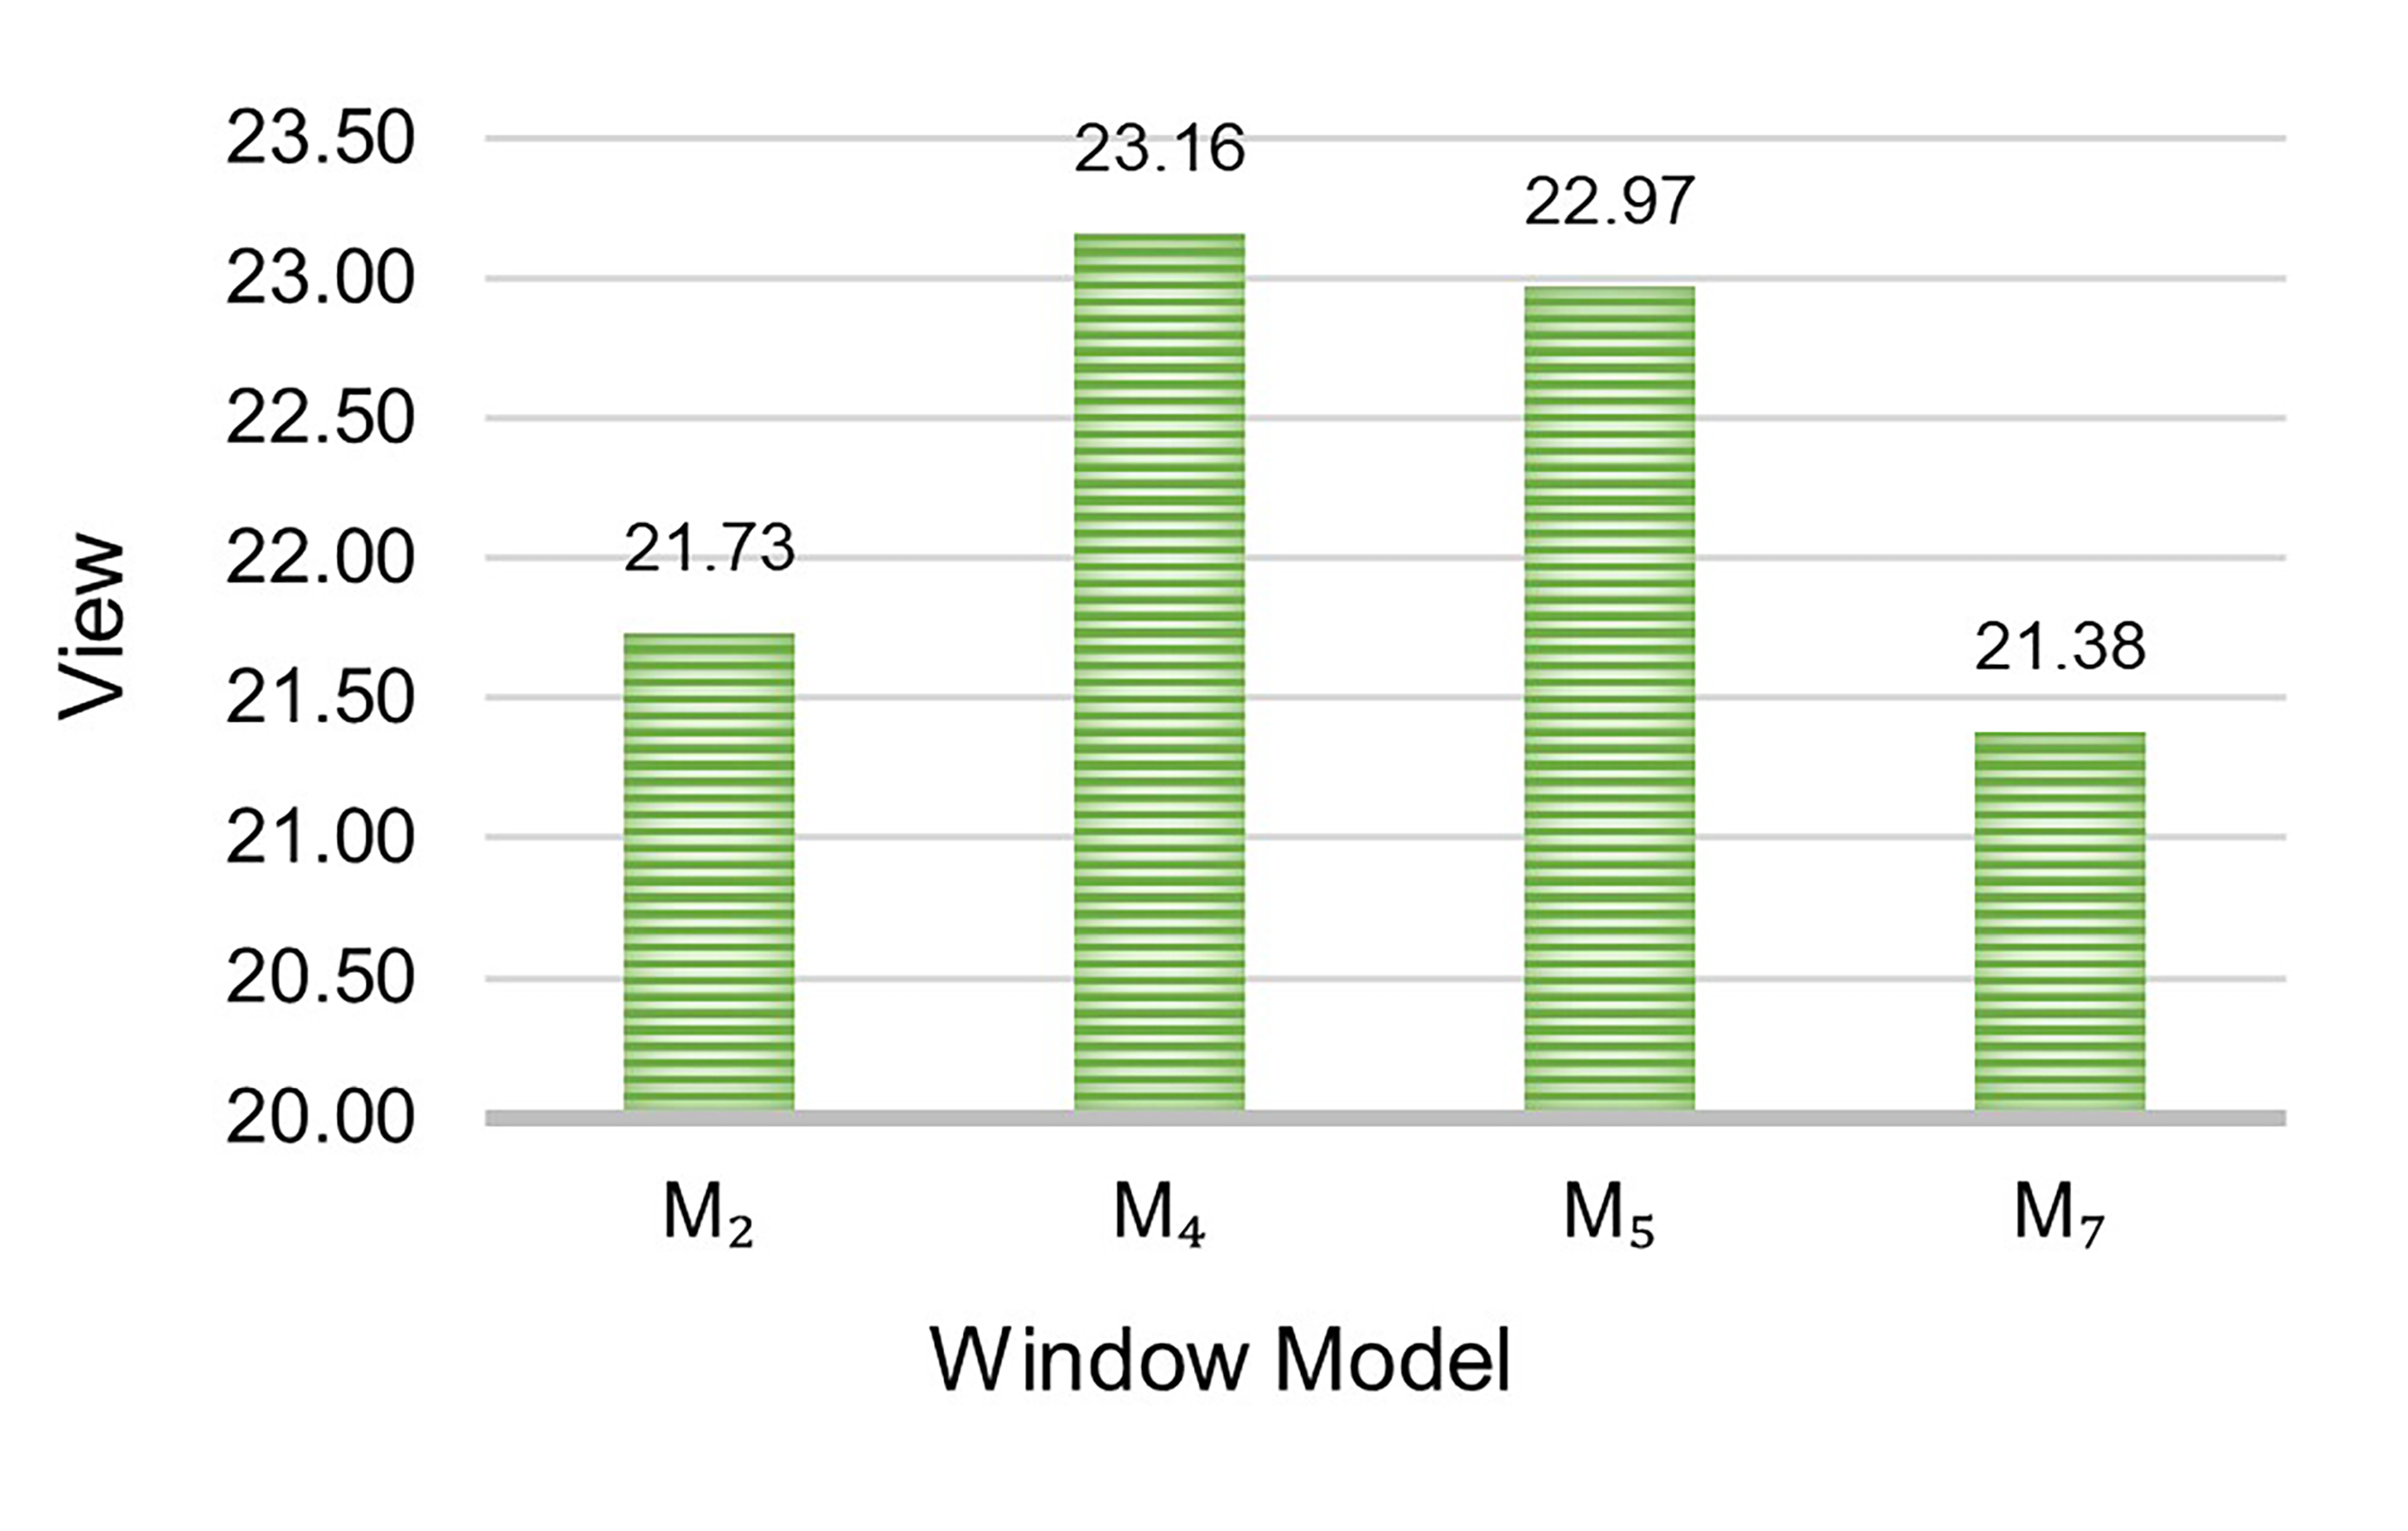
Fig. 9. Comparison of Quality of View for Selected Models.
Figure 10
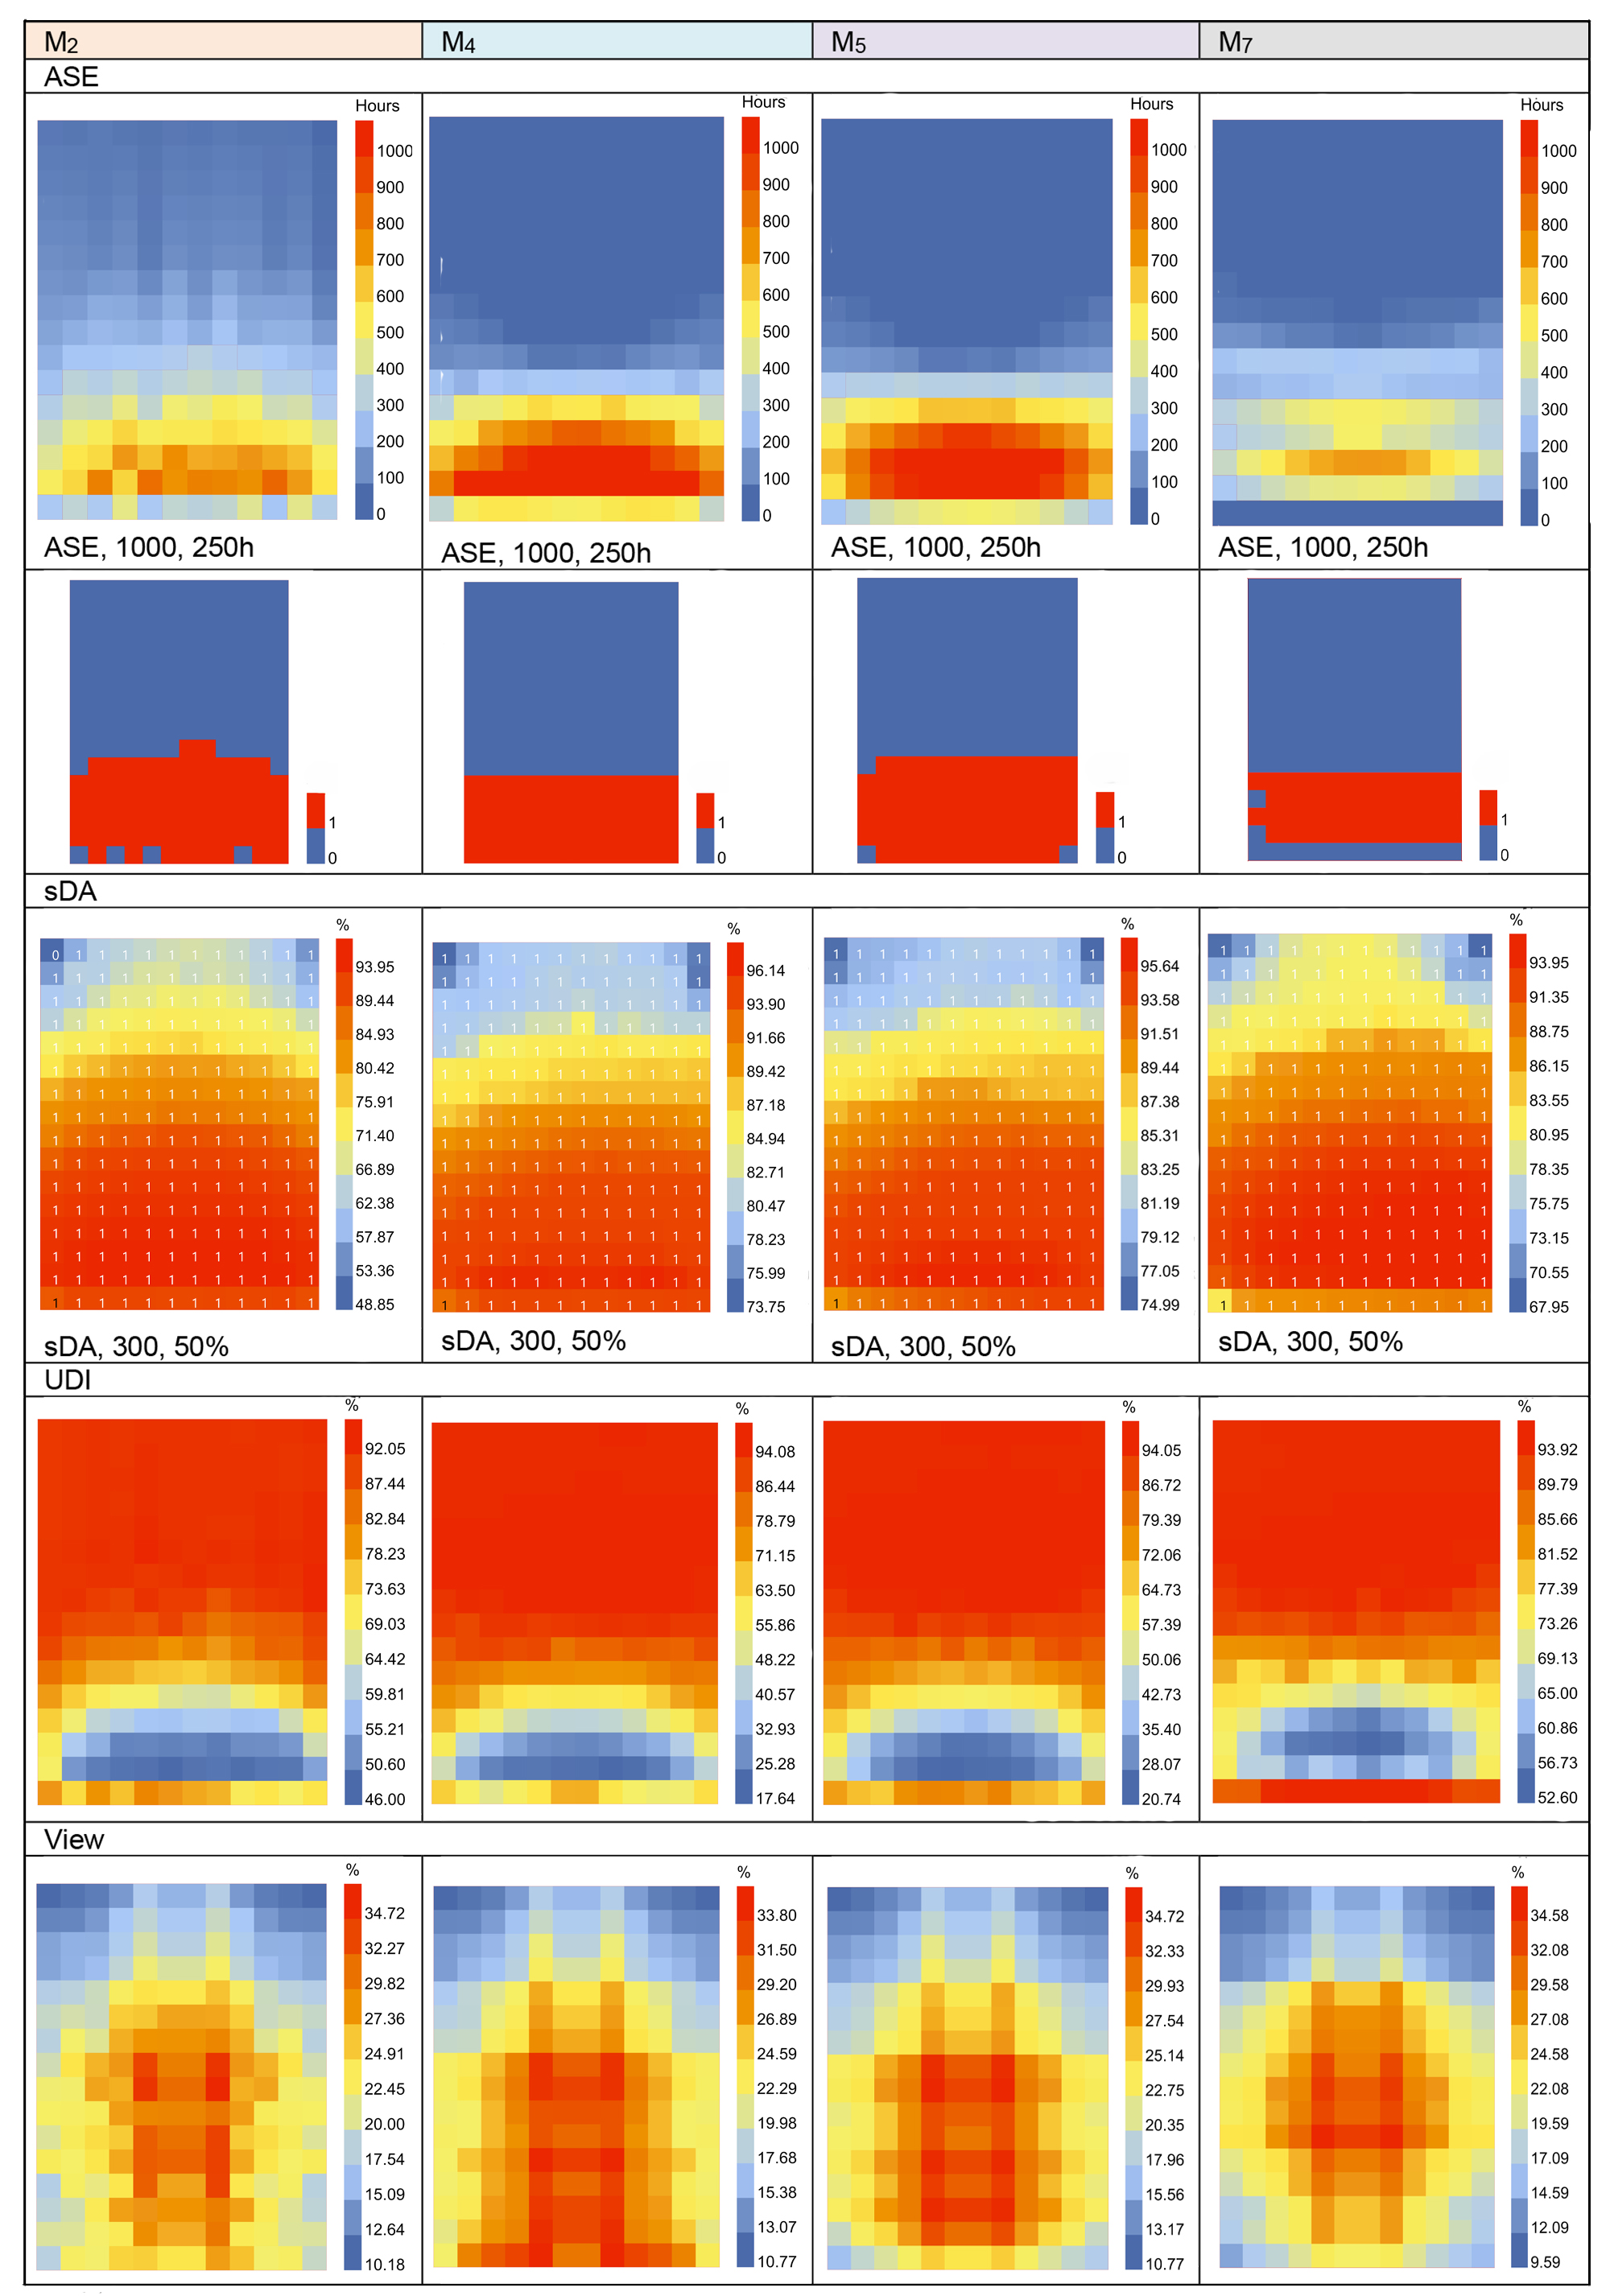
Fig. 10. Comparison of ASE, sDA, UDI, and QV for selected window models (M2, M4, M5, M7) with constant WWR.
Figure 11
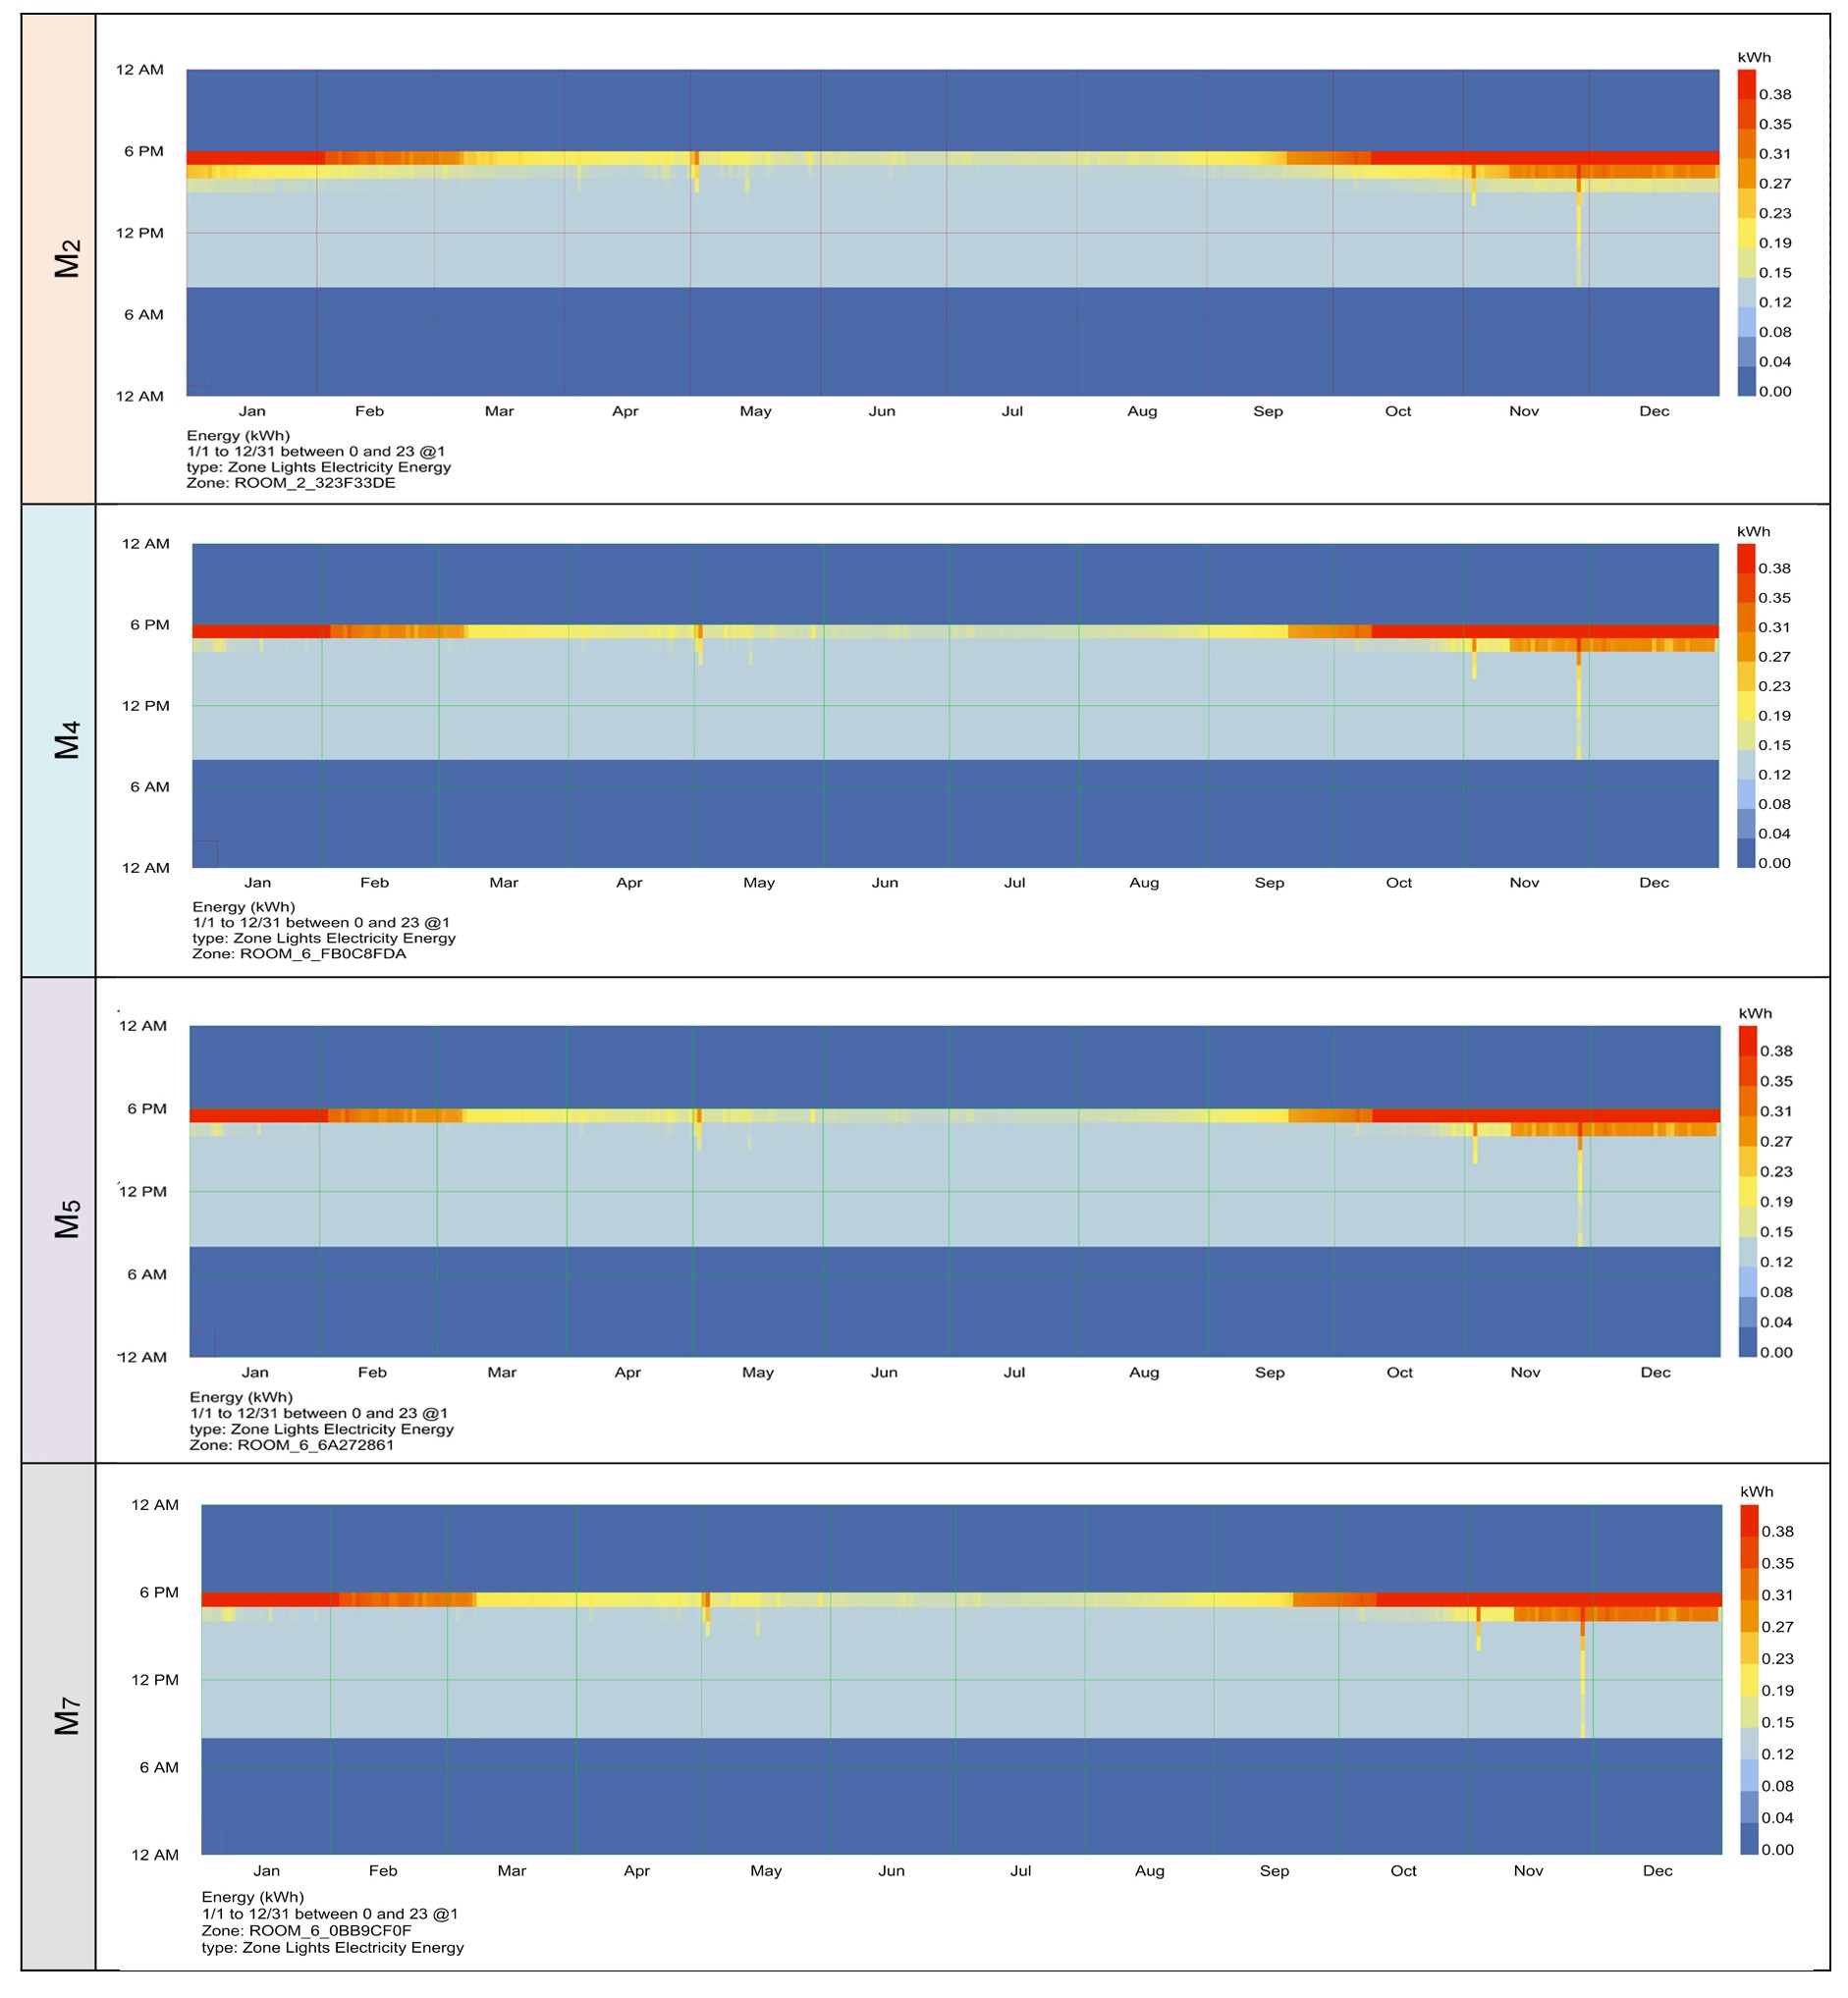
Fig. 11. Comparison of LE for selected window models (M2, M4, M5, M7) with constant WWR.
3.6. Multi-Criteria Ranking and Sensitivity Analysis
A Multi-Criteria Decision-Making (MCDM) method was employed to integrate simultaneously five performance indicators (sDA, UDI, ASE, LE and QV). These five indicators were normalized on a dimensionless scale of [0-1] by using min-max normalization method. Utility indicators (sDA, UDI and QV) and cost indicators (ASE and LE) were normalized separately on that dimensionless scale [0-1]. Additionally, sDA, as one of the standard daylight evaluation metrics, was considered in the multi-criteria analysis alongside the other performance indicators, despite having identical values across all window forms. Next, three different weighting scenarios were defined to examine the sensitivity of the ranking to design priorities:
(1) an Equal Weighting scenario, where all indicators hold the same level of importance; (2) a Daylight Priority scenario, allocating the majority of weight to daylight metrics (sDA, UDI, and ASE) to prioritize natural lighting performance; and (3) a Balanced Tri-Objective scenario, assigning equal weight (one-third) to each primary objective (daylight, energy, and quality of view) to reflect a comprehensive approach to the design requirements of south-facing classrooms in hot and dry climates.
The models have been rank using the TOPSIS algorithm and calculate relative closeness to the ideal solution score (Figure 12). This method was recently included in review articles that overview multi-criteria decision-making process applied in shell design and building performance assessment as one of the useful methods that incorporate both quantitative and qualitative criteria simultaneously [49,50] as well as used for a recent building daylight evaluation of an educational room. [51].
Figure 12
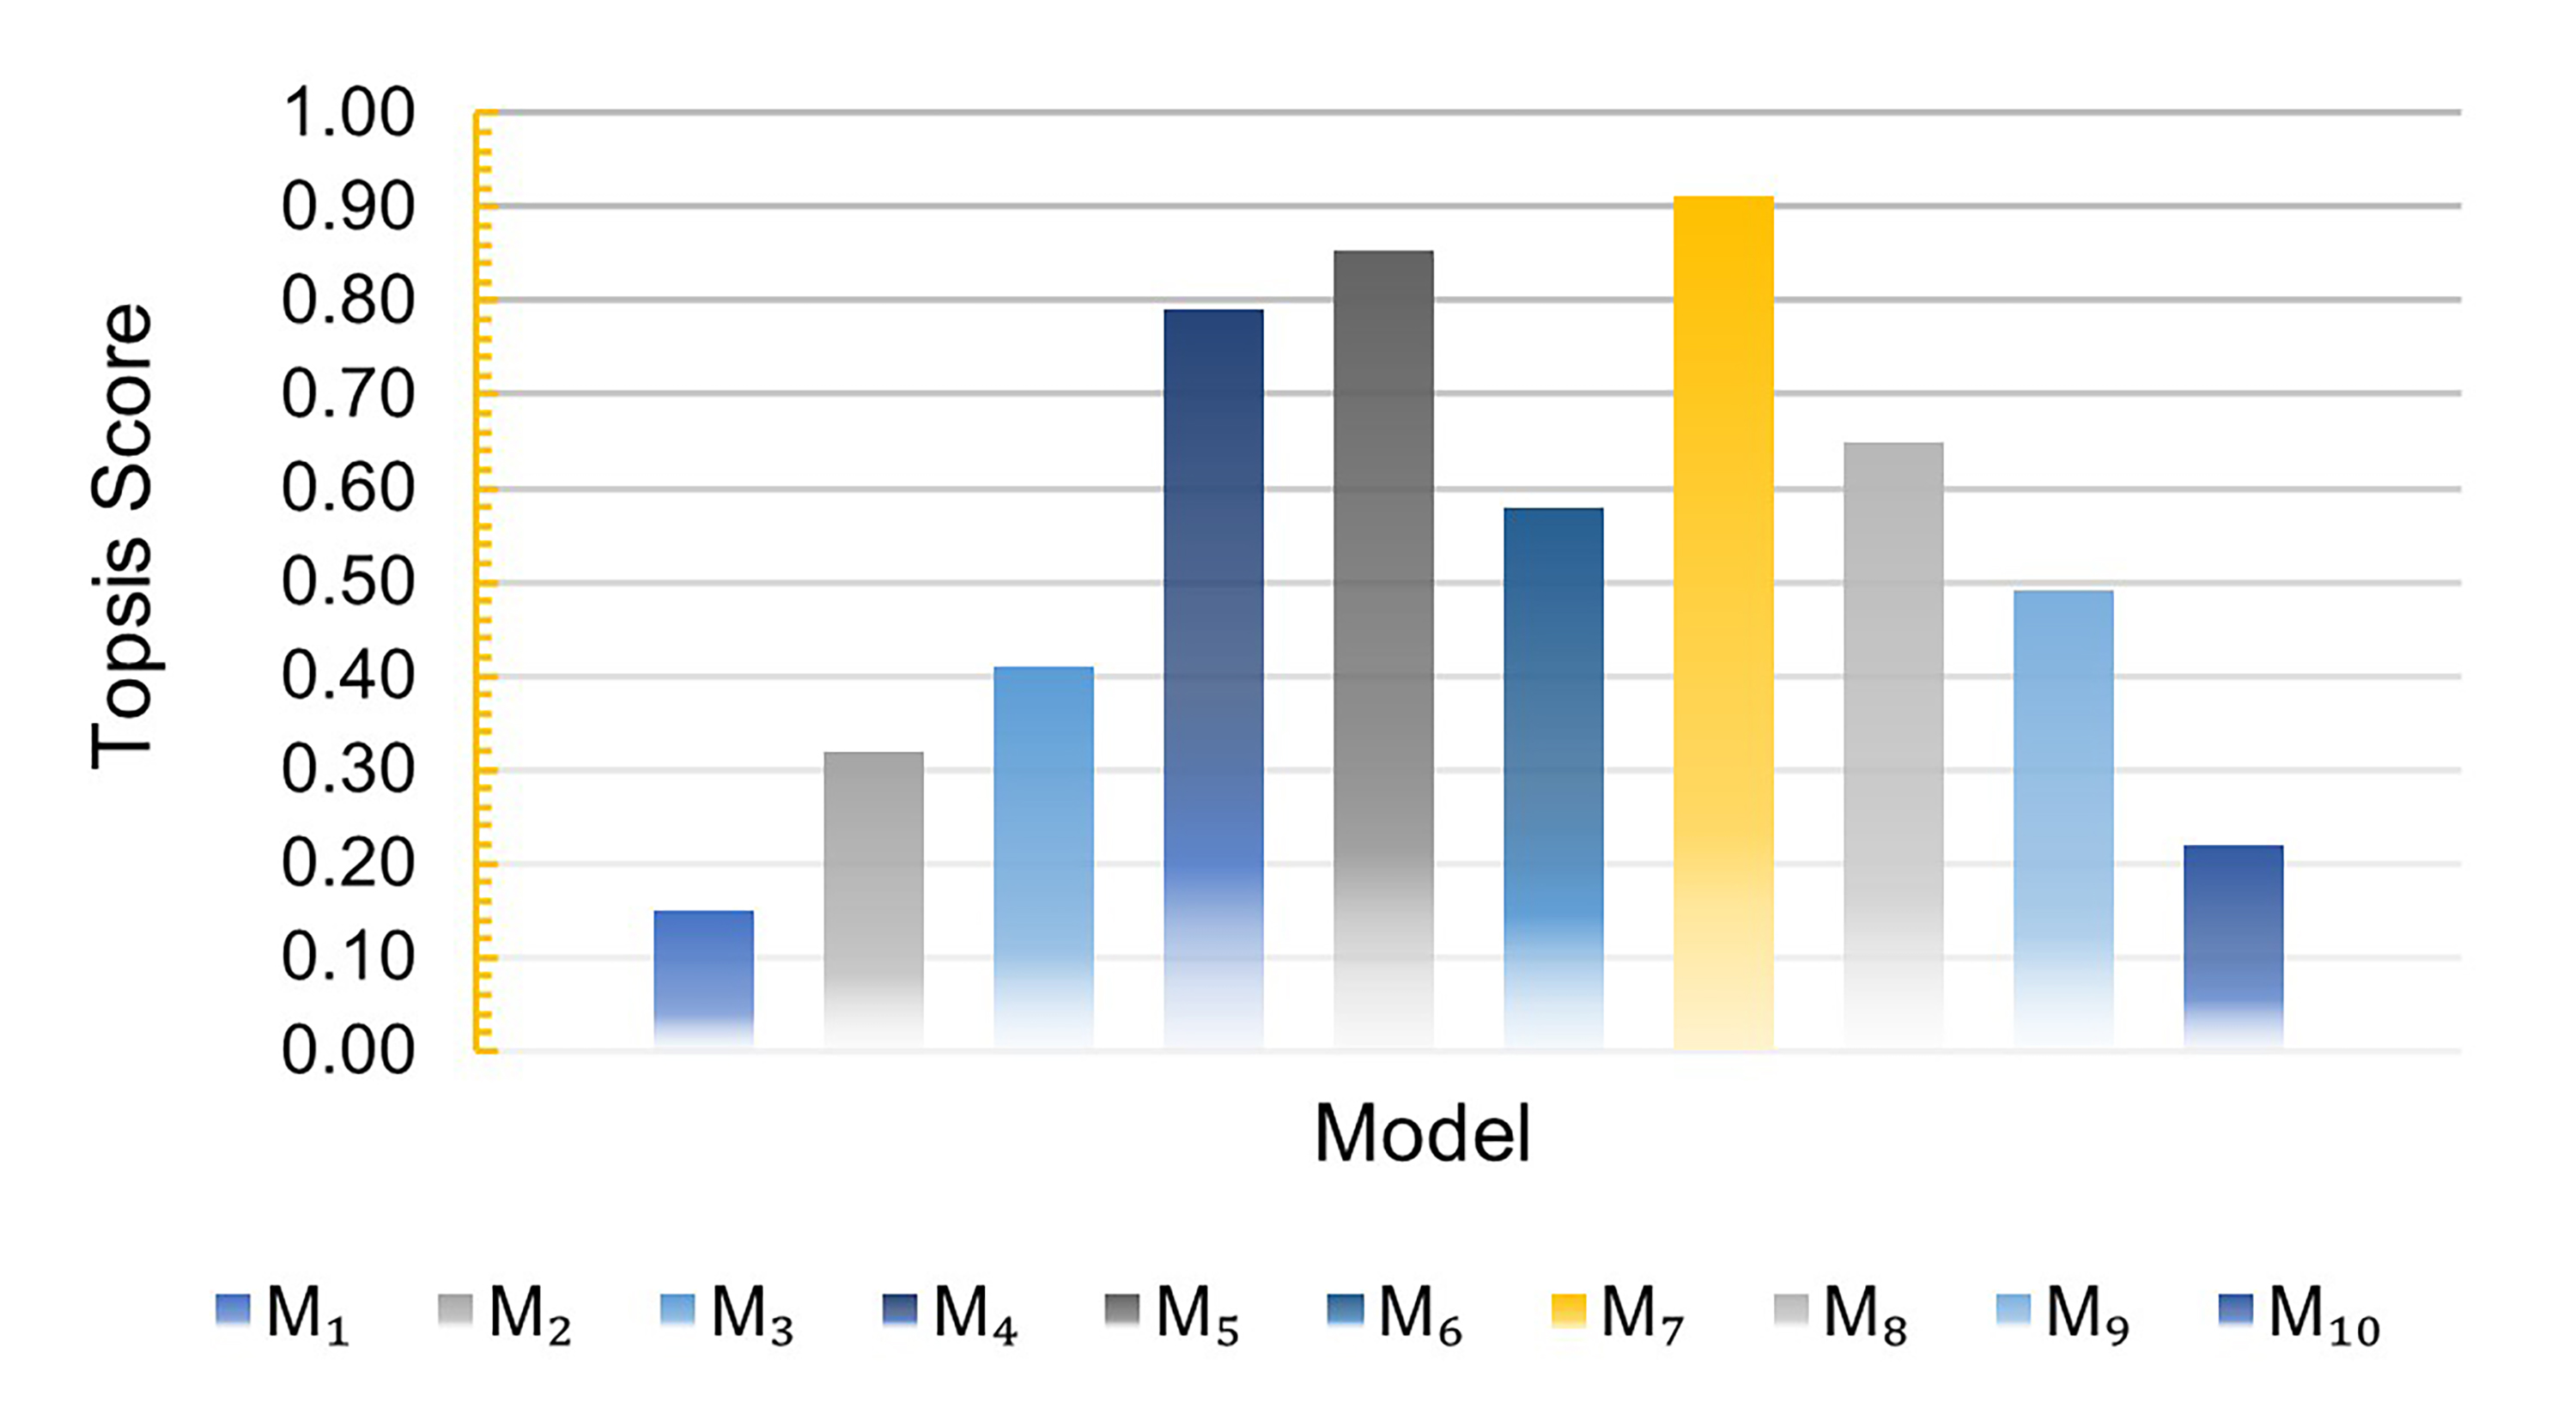
Fig. 12. TOPSIS scores and final ranking of the evaluated models under the balanced tri-objective weighting scenario.
Based on the multi-criteria ranking results:
- First rank was assigned to Model M7 (three horizontal bands), which, with low ASE (23.96%), high UDI (84.16%), and balanced performance in both LE and QV, was identified as a comparatively better-performing option among the investigated configurations for south-facing classrooms in hot and dry climates.
- Second rank went to Model M5 (single horizontal band), which recorded the lowest LE (9.95 kWh/m²). Despite its higher ASE, when complementary direct-solar-control strategies, such as light shelves, external shading devices, or dynamic control systems are implemented, it may be considered a competitive option alongside other performance criteria.
- Third rank was given to Model M4 (double vertical), which, with higher QV (23.16%) and moderate ASE, is suitable for spaces prioritizing vertical view access and visual clarity.
- Lower ranks were assigned to Model M2 and some fine-grid configurations, which demonstrated weaker performance in terms of higher ASE and LE (in M2) or reduced QV without significant daylight benefits (in grid models).
The sensitivity analysis results showed that, under equal weighting, models M5 and M7 perform closely and competitively. Moving towards the daylight priority scenario, model M7 consolidates its superiority through UDI, sDA value. The order M7, M5, M4 remains the same under the scenario of the Balanced Tri-Objective Weighting. The rankings remained largely unchanged across the weighting scenarios, which demonstrates the relative robustness of the ranking results and their consistency with recent studies that emphasize avoiding single-criterion optimization and adopting MCDM/TOPSIS frameworks to simultaneously integrate the indicators of daylight, lighting energy and quality of view in combination Figure 13 [49,50,52].
Figure 13
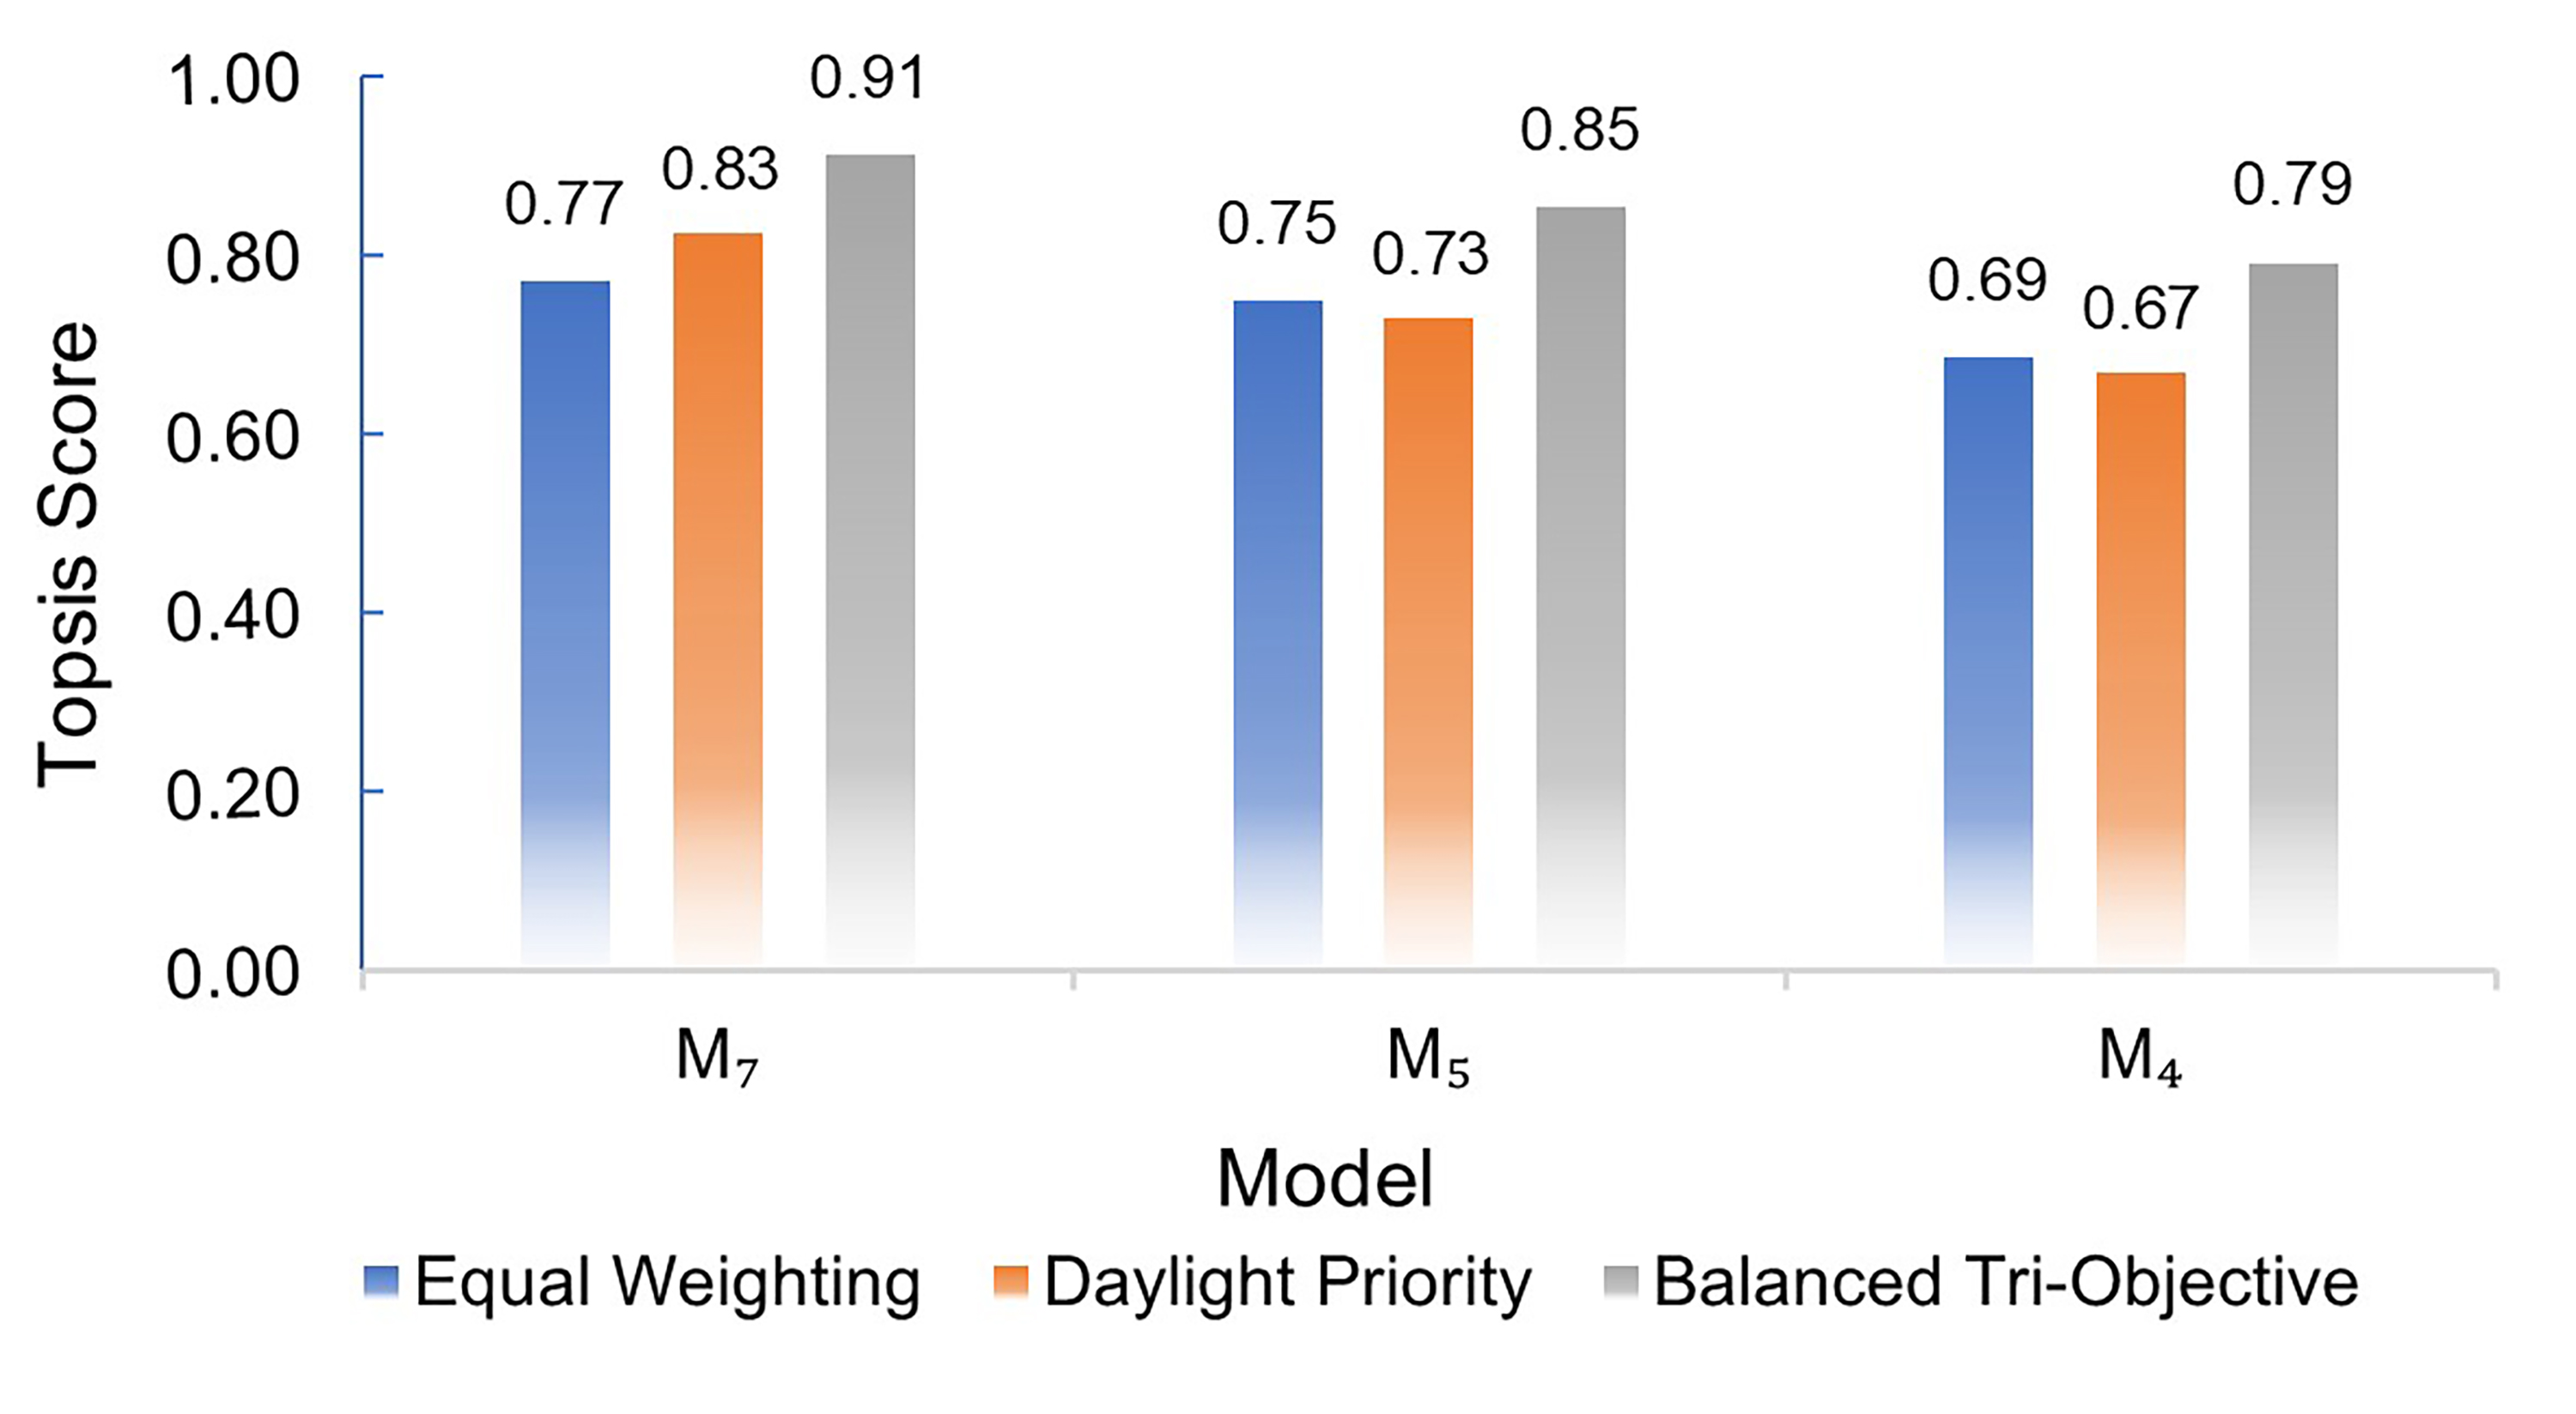
Fig. 13. Sensitivity analysis of rankings across three weighting scenarios.
3.7. Design implications
The findings indicated that modifying the geometric form of windows, even with a constant window-to-wall ratio (WWR), can significantly affect daylight distribution, direct solar exposure, lighting energy consumption, and quality of view. The following design implications can be drawn:
- The multi-part horizontal configuration (M7), with lower ASE and higher UDI, offers the most balanced performance among the investigated configurations across daylight adequacy, control of direct solar radiation, and quality of view for south-facing classrooms in hot and dry climates.
- Vertically divided forms (M1–M3), while enhancing daylight penetration into the depth of the space, tend to increase ASE and direct solar concentration. Therefore, complementary solar control strategies, such as light shelves or external fins, are recommended for these configurations.
- Fine-grid models (M9–M10) provide smoother, more uniform daylight distribution, but in spaces where visual continuity and an expansive outward view are critical, such as classrooms, they are less prioritized.
Finally, it can be concluded that an appropriate window design needs a multi-criteria assessment rather than a single measure: it has to find a trade-off between daylight performance and view quality as well as lighting energy efficiency. The outcome of this study could provide practical guidance for comparing and selecting window forms in the design of educational classrooms in hot and dry climate zone (BWh) and future climate-responsive window design guide could be developed based on these results.
4. Conclusion
This research, in a south-facing classroom in hot-dry climate (BWh), by keeping the window-to-wall ratio (WWR) constant and only varying the window geometry and division pattern, demonstrated that the quality of daylight distribution, the level of direct solar exposure, and lighting energy consumption were more dependent on the vertical and horizontal ratios of the openings, effective window height, and window division rhythm than on the increase in transparent area. The sDA reached 100% in all cases and exhibited no discriminative capacity due to functional saturation. UDI, ASE, LE and QV were considered as main discriminatory criteria of window performance. The results showed that the multi-segment horizontal pattern, represented by the M7 model, created a more favorable balance between higher UDI and lower ASE compared with the other investigated configurations by smoothing the luminance gradient throughout the depth of the space and reducing the concentration of direct radiation at eye level. Conversely, forms with high vertical subdivisions, although positively associated with a larger vertical field of view, were also associated with greater daylight excess and more intense direct radiation concentration, making them less unsuitable for visual comfort on south-facing facade unless combined with direct radiation control systems. The multi-criteria analysis based on MCDM/TOPSIS, with a strong emphasis on direct solar exposure control, demonstrated the stability of the ranking between M7, M5, and M4 and underlined the importance of moving beyond single-criterion considerations when selecting the highest-ranked window form. Consequently, the main practical implication of this study for south-facing educational classroom design under similar hot and dry (BWh) climatic conditions is that within the constraint of a fixed glazing surface it is feasible to improve daylight availability, reduce direct solar penetration, reduce lighting energy consumption, and improve Quality of View simultaneously by combining climate-dependent indices with multi-objective appraisal and by manipulating the size ratio, height and vertical-horizontal rhythm of window openings. This may be used to establish a reasonable framework for climate responsive window design in early stage of educational space design. However, the influence of other façade orientations remains to be investigated, and future research could extend this framework by integrating dynamic shading devices, electrochromic glazing, or occupant behavior patterns. In such an approach, combining daylight performance with thermal comfort and energy simulation would provide a more holistic assessment of window design strategies in educational spaces.
Funding
This research received no external funding.
Author Contributions
S. M. Zamanian: Conceptualization, Methodology, Simulation, Data collection and Analysis, Writing the Original draft; M. Latifi: Conceptualization, Methodology, Supervision, Review; M. Baharvand: Review and Editing; M. Mahdavinejad: Conceptualization, Methodology, Supervision, Writing the Original draft and Review.
Acknowledgement
The authors appreciate the support from the University of Sharjah with the research grant Ref. V.C.R.G. / R. 438/2023, Date: 22/ 05 /2023.
Declaration of competing interest
The authors declare no conflict of interest.
References
- S. Al-Rqaibat, M. Al-Khdairat, L. Hamad, S. Al-Husban, Evaluating Daylighting Performance of Parametric Mashrabiya in Mediterranean Climate: A Simulation-based Approach, Journal of Daylighting, 12(2) (2025) 397–419. https://doi.org/10.15627/jd.2025.25
- IEA, International Energy Agency, Buildings sector energy consumption, 2024.
- REN21, Renewables 2023 global status report, REN21 Secretariat, 2023.
- M. Latifi, M. Mahdavinejad, D. Diba, The Home Architecture Data Mining from a Spatial Structure Perspective (Case Study: Jangjouyan House), International Journal of Applied Arts Studies, 5(1) (2020) 57-76.
- M. Latifi, D. Diba, Data mining of the spatial structure of Qajar native housing, Case study: Jangjouyan House of Isfahan, Naqshejahan-Basic Studies and New Technologies of Architecture and Planning, 10(3) (2020) 163-171.
- M. H. Abedini, H. Gholami, H. Sangin, Multi-objective optimization of window and shading systems for enhanced office building performance: A case study in Qom, Iran, Journal of Daylighting, 12(1) (2025) 91-110. https://doi.org/10.15627/jd.2025.6
- K. Lakhdari, L. Sriti, B. Painter, Parametric optimization of daylight, thermal and energy performance of middle school classrooms, case of hot and dry regions, Building and Environment, 204 (2021) 108173. https://doi.org/10.1016/j.buildenv.2021.108173
- F. De Luca, A. Sepúlveda, T. Varjas, Multi-performance optimization of static shading devices for glare, daylight, view and energy consideration, Building and Environment, 217 (2022) 109110. https://doi.org/10.1016/j.buildenv.2022.109110
- S. Farivar, S. Teimourtash, Impact of window design on dynamic daylight performance in an office building in Iran, Journal of Daylighting, 10(1) (2023) 31-44. https://doi.org/10.15627/jd.2023.3
- Y. Jia, Z. Liu, Y. Fang, H. Zhang, C. Zhao, X. Cai, Effect of interior space and window geometry on daylighting performance for terrace classrooms of universities in severe cold regions: A case study of Shenyang, China, Buildings, 13(3) (2023) 603. https://doi.org/10.3390/buildings13030603
- J. Hraška, J. Čurpek, The practical implications of the EN 17037 minimum target daylight factor for building design and urban daylight in several European countries, Heliyon, 10(1) (2024) e23297. https://doi.org/10.1016/j.heliyon.2023.e23297
- N. Maroofi, M. Mahdavinejad, H. Moradi Nasab, Daylightophil educational buildings; Case Study: Optimizing of the southern walls' openings of the classrooms in Semnan, Journal of Architecture in Hot and Dry Climate, 10(16) (2023) 164-181.
- M. Ivanov, J. Sato, Occupant-Centric Visual Comfort Assessment and Optimization of Passive Solar Façade Shading Systems through View-Based Analysis of Daylight Glare Probability, View Content, and Spatial Frequency Distribution, Journal of Daylighting, 12(2) (2025) 293-305. https://doi.org/10.15627/jd.2025.20
- Z. A. Kılıç, A. k. Yener, A Framework for Integrating Zoning Regulations and Site Layout Design to Enhance Visual Comfort-A Study based on Zoning Regulation and EN 17037, Journal of Daylighting, 12(1) (2025) 148-166. https://doi.org/10.15627/jd.2025.9
- S. Han, H. Lee, Evaluation of energy performance and daylight utilization in light shelves integrated with transparent solar panels, Energy, 326 (2025) 136336. https://doi.org/10.1016/j.energy.2025.136336
- S. Masoud, Z. Zamani, S. M. Hosseini, M. Mahdavinejad, J. Wang, Enhancing Classroom Lighting Quality in Tehran Through the Integration of a Dynamic Light Shelf and Solar Panels, Buildings, 15(13) (2025) 2215. https://doi.org/10.3390/buildings15132215
- R. Purghorbani, H. Bagheri Sabzevar, Evaluation of Daylighting Performance, Glare Control, and Thermal Comfort Using Light Shelves and Internal Louvers in Office Buildings, Iranica Journal of Energy & Environment, 17(1) (2026) 37-51. https://doi.org/10.5829/ijee.2026.17.01.04
- S. Aghamohammadiha, N. Dehghan, Optimum geometry of double-skin self-shading facade of classrooms with the aim of creating energy saving and visual comfort in Isfahan Province, Iran, Journal of Daylighting, 11(2) (2024) 372-390. https://doi.org/10.15627/jd.2024.25
- H. Li, J. Jia, H. Yu, X. Wang, Research on the daylighting metrics of college classrooms based on visual comfort in China, Journal of Building Engineering, 98 (2024) 111178. https://doi.org/10.1016/j.jobe.2024.111178
- H. Li, J. Jia, H. Yu, X. Wang, Research on the daylighting metrics of college classrooms based on visual comfort in China, Journal of Building Engineering, 98 (2024) 111178. https://doi.org/10.15627/jd.2024.4
- Z. Sharifian, N. Dehghan, M. Hamzenejad, Z. S. Zomorodian, Enhancing Daylight and Energy Efficiency in the Architecture Studio by Designing Light Shelves and Windows with Sensitivity Analysis and Optimization, International Journal of Urban Management and Energy Sustainability, 5(3) (2024) 146-166.
- B. J. Alkhatatbeh, Y. Kurdi, S. Asadi, Multi-objective optimization of classrooms' daylight performance and energy use in US Climate Zones, Energy and Buildings, 297 (2023) 113468. https://doi.org/10.1016/j.enbuild.2023.113468
- B. Vojdani Fakhr, M. Mahdavinejad, M. Rahbar, B. Dabaj, Design optimization of the skylight for daylighting and energy performance using NSGA-II, Journal of Daylighting, 10(1) (2023) 72-86. https://doi.org/10.15627/jd.2023.6
- J. Ding, X. Zou, M. Lv, Influence of Opposing Exterior Window Geometry on the Carbon Emissions of Indoor Lighting under the Combined Effect of Natural Lighting and Artificial Lighting in the City of Shenyang, China, Sustainability, 15(17) (2023) 12972. https://doi.org/10.3390/su151712972
- B. Liu, Y. Liu, Q. Deng, K. Hu, A study on daylighting metrics related to the subjective evaluation of daylight and visual comfort of students in China, Energy and Buildings, 287 (2023) 113001. https://doi.org/10.1016/j.enbuild.2023.113001
- A. K. Maurya, R. Kumar, A. Kumar, Assessing Window Design's Impact on Daylight Uniformity in Classrooms in Patna, India, Engineering, Technology & Applied Science Research, 13(5) (2023) 11898-11903. https://doi.org/10.48084/etasr.6212
- F. Abd-Alhamid, M. Kent, Y. Wu, Quantifying window view quality: A review on view perception assessment and representation methods, Building and Environment, 227 (2023) 109742. https://doi.org/10.1016/j.buildenv.2022.109742
- M. Sabbagh, S. Mandourah, R. Hareri, Light shelves optimization for daylight improvement in typical public classrooms in Saudi Arabia, Sustainability, 14(20) (2022) 13297. https://doi.org/10.3390/su142013297
- M. Sedaghatnia, M. Faizi, M. Khakzand, H. Sanaieian, Energy and daylight optimization of shading devices, window size, and orientation for educational spaces in Tehran, Iran, Journal of Architectural Engineering, 27(2) (2021) 04021011. https://doi.org/10.1061/(ASCE)AE.1943-5568.0000466
- P. Pilechiha, M. Mahdavinejad, F. P. Rahimian, P. Carnemolla, S. Seyedzadeh, Multi-objective optimisation framework for designing office windows: quality of view, daylight and energy efficiency, Applied Energy, 261 (2020) 114356. https://doi.org/10.1016/j.apenergy.2019.114356
- Illuminating Engineering Society (IES), IES LM-83-12: Approved method for IES spatial daylight autonomy (sDA) and annual sunlight exposure (ASE), Illuminating Engineering Society: New York, NY, 2012.
- C. T. Do, N. T. T. Dung, Y. C. Chan, Daylighting assessment of window layouts and architectural elements in early design stages, Scientific Reports, 15(1) (2025) 39507. https://doi.org/10.1038/s41598-025-23389-x
- National Renewable Energy Laboratory, OpenStudio: Energy modeling framework for building performance simulation, NREL, Golden, CO, 2024.
- U.S. Green Building Council, LEED v4.1 for building design and construction, USGBC, 2024.
- C. L. Hwang, K. Yoon, Multiple attribute decision making: Methods and Applications, Springer-Verlag, New York, 1981. https://doi.org/10.1007/978-3-642-48318-9
- S. R. Aritonang, R. A. Mangkuto, A. Atthaillah, I. Prasetiyo, Daylighting Design Optimization of Complex Fenestration Systems with External Shading and Horizontal Slats in Tropical Elementary School Classrooms, Journal of Architectural Engineering, 31(1) (2025) 04025001. https://doi.org/10.1061/JAEIED.AEENG-1894
- J. Mohelníková, M. Pelech, Daylight illuminance data measurement and processing for a physical scale model, Journal of Architectural Engineering, 30(1) (2024) 04024003. https://doi.org/10.1061/JAEIED.AEENG-1518
- N. A. Khan, B. Bhattacharjee, Methodology for simultaneous optimization of the thermal, visual, and acoustic performance of building envelope, Journal of Architectural Engineering, 27(3) (2021) 04021015. https://doi.org/10.1061/(ASCE)AE.1943-5568.0000474
- U. S. Department of Energy, EnergyPlus weather data framework and EPW weather files, EnergyPlus, 2023.
- Climate.OneBuilding, EPW weather data repository: Isfahan-Shahid Beheshti International Airport, 2024.
- Illuminating Engineering Society, The Lighting Handbook, 11th ed., Illuminating Engineering Society, New York, NY, 2023.
- Ladybug Tools LLC, Ladybug Tools: Environmental analysis tools for Grasshopper, 2025.
- Lawrence Berkeley National Laboratory, WINDOW & International Glazing Database (IGDB) and Optical/Thermal Properties of Architectural Glazing Systems, U.S. Department of Energy, 2024.
- M. Şenalp, E. Köymen, E. Yaşa, M. E. Başar, Parametric Exploration of Natural Lighting and Visual Comfort in Contemporary Additions to Historic Buildings, Journal of Daylighting, 12(2) (2025) 506-519. https://doi.org/10.15627/jd.2025.30
- M. Mahdavinejad, H. Bazazzadeh, F. Mehrvarz, U. Berardi, T. Nasr, S. Pourbagher, S. Hoseinzadeh, The impact of facade geometry on visual comfort and energy consumption in an office building in different climates, Energy Reports, 11 (2024) 1-17. https://doi.org/10.1016/j.egyr.2023.11.021
- ANSI/ASHRAE/IES Standard 90.1-2019: Energy Standard for Buildings Except Low-Rise Residential Buildings, ASHRAE, 2019.
- EN 17037:2019 + A1:2023, Daylight in Buildings: Quality of View, European Committee for Standardization (CEN), 2023.
- Z. Wu, Y. Xu, Z. Wang, Multi-objective optimization of energy, view, daylight and thermal comfort for building's fenestration and shading system in hot-humid climates, PLoS One, 20(6) (2025) e0325290. https://doi.org/10.1371/journal.pone.0325290
- S. Bianchi, C. Andriotis, T. Klein, M. Overend, Multi-criteria design methods in façade engineering: State-of-the-art and future trends, Building and Environment, 250 (2024) 111184. https://doi.org/10.1016/j.buildenv.2024.111184
- H. Taherdoost, M. Madanchian, A comprehensive survey and literature review on TOPSIS, International Journal of Service Science Management Engineering and Technology, (IJSSMET) 15(1) (2024) 1-65. https://doi.org/10.4018/IJSSMET.347947
- M. Kim, J.H. Lee, K.S. Kim, A study on external shading devices for reducing cooling loads and improving daylighting in office buildings, Journal of Asian Architecture and Building Engineering, 14:3 (2015) 687-694. https://doi.org/10.1038/s41598-024-79721-4
- A. P. Rachman, C. Ichwania, R. A. Mangkuto, J. Pradipta, M.D. Koerniawan, J. Sarwono, Comparison of multi-criteria decision-making methods for selection of optimum passive design strategy, Energy and Buildings, 314 (2024) 114285. https://doi.org/10.1016/j.enbuild.2024.114285
Disclaimer/Publisher’s Note: The statements, opinions and data contained in all publications are solely those of the individual author(s) and contributor(s) and not of Solarlits and/or the editor(s). Solarlits and/or the editor(s) disclaim responsibility for any injury to people or property resulting from any ideas, methods, instructions or products referred to in the content.