

Parinaz Sabet,1,* Mosleh Ahmadi2
Author affiliations
1 Department of Architecture and Industrial Design, University of Campania "Luigi Vanvitelli", Aversa, Italy
2 Faculty of Architecture, Gdansk University of Technology, Gdansk, Poland
*Corresponding author.
parinazsabet62@gmail.com (P. Sabet)
mosleh.ahmadi@pg.edu.pl (M. Ahmadi
History: Received 26 June 2026 | Revised 22 July 2026 | Accepted 3 August 2026 | Published online 26 September 2026
Copyright: © 2026 The Author(s). Licensee Solarlits Limited (Hong Kong). This is an open access article distributed under the terms and conditions of the Creative Commons Attribution 4.0 License.
Citation: Parinaz Sabet, Mosleh Ahmadi, Quantifying Window View Quality in Urban Skylines: A Multi-Index Framework for Perception, Openness, and Density, Journal of Daylighting, 13:2 (2026) 555-574. doi: 10.15627/jd.2026.31
Abstract
Window views play an important role in indoor environmental quality by influencing visual comfort, psychological well-being, and the perceived quality of indoor spaces. However, current methods for evaluating window views tend to focus on individual aspects, such as geometric accessibility, glazing properties, or visible greenery, without considering how urban morphology, visual perception, and economic value interact. This study proposes an integrated framework for assessing window views in urban environments by combining architectural measurements, pixel-based image analysis using the Segment Anything Model (SAM), and exploratory hedonic interpretation. Three synthetic indices are introduced: the Skyline Perception Index (SPI), a literature-weighted perceptual score based on visible sky, greenery, and built mass; the Skyline Openness Index (SOI), which measures visual openness based on the visible proportions of sky and greenery, and to which SPI is mathematically related under the present weighting; and the Skyline Density Index (SDI), which quantifies the visual influence of surrounding building density. The framework was demonstrated through a proof-of-concept application in Aversa, Italy, using three representative window orientations. The results show that views with greater sky visibility and greenery consistently achieve higher SPI and SOI values and are associated with indicative residential value premiums of approximately 4–7%. In contrast, visually enclosed and high-density skylines are associated with lower perceptual scores and reduced economic value. By bringing urban morphology, visual perception, and economic interpretation into a single analytical framework, this study provides a reproducible and transferable approach that can support urban design, daylighting research, and residential environmental assessment.
Keywords
skylines, window views, visual comfort, perception, property value
Nomenclature
| SPI | Skyline Perception Index |
| SOI | Skyline Openness Index |
| SDI | Skyline Density Index |
| S, G, B | Proportion of visible sky, greenery, and built mass, respectively (0-1) |
| ws, wg, wb | SPI perceptual weighting factors for sky, greenery, and built mass. |
| GFAi | Gross floor area of building i (m²) |
| Basei | Ground-floor footprint area of building i (m²) |
| wi | Visible façade width of building i (m) |
| δi | SDI depth-attenuation weight for building i (front row: 1.0; back row: 0.5) |
| VAI | View Access Index |
| VCI | View Clarity Index |
| GWVI | Green Window View Index |
| SAM | Segment Anything Model |
| WWR | window-to-wall ratio |
| GFA/Base | Volumetric density ratio (gross floor area to ground-floor footprint) |
| TABULA | European Building Typology database |
| OMI | Osservatorio del Mercato Immobiliare (Italian real-estate market observatory) |
| IoU | Intersection-over-union (segmentation accuracy metric) |
| EN 17037 | European Standard for daylight in buildings |
| LEED | Leadership in Energy and Environmental Design |
1. Introduction
Window views are a fundamental yet frequently overlooked dimension of indoor environmental quality. A substantial body of evidence links the visual content seen through building windows to psychological restoration, stress recovery, and occupant well-being [1-3]. Similar restorative effects of workplace greenery on perceived stress [4] and of daylight access on cognitive performance in sunlit rooms [5] have emerged in related occupational settings, suggesting that these benefits extend beyond residential settings. Views incorporating natural elements sky, vegetation, and open terrain are consistently associated with beneficial physiological and psychological outcomes, a finding first documented in a clinical context by Ulrich [1] and later elaborated within the attention restoration framework [2]. More recent work has confirmed that window view quality also shapes occupants' overall assessment of their indoor environment and, in turn, the perceived quality of the building itself [3,6].
Controlled experimental evidence further supports these effects for elevated urban viewpoints specifically, showing that even brief exposure to greenery visible through high-rise windows produces measurable physiological relaxation responses, including increased alpha brainwave activity and reduced anxiety [7]. In dense urban environments, window views are dominated not by natural landscapes but by clusters of buildings and their collective skyline profile [8-9]. The view from an indoor space depends simultaneously on interior architectural parameters window size, position, and glazing properties and on the three-dimensional morphology of the surrounding urban fabric, including building height, spacing, and overall density [10-11]. The urban skyline thus acts as a perceptual interface between interior occupancy and the external environment: it defines the boundary between built mass and sky, conveys the scale and hierarchical organization of the city [12-13], and modulates daylight penetration, visual complexity, and the perceived degree of enclosure [10, 14-15]. This overlap between daylight performance and view composition is no coincidence: both are governed by the same unobstructed angular access to the sky and the surrounding urban volumes, so that any morphological condition reducing sky visibility also reduces daylight penetration. Daylight access and view quality thus share a common geometric cause rather than being independently determined [16-17]. This link between daylight and view quality is worth emphasizing here because the architectural variables that regulate daylight access window-to-wall ratio, orientation, obstruction angle simultaneously shape the visual composition of the view experienced from within the room [16]. As a result, the pixel-based sky, greenery, and built-mass proportions used throughout this study to describe view composition (Section 2.5) also reflect, by the same geometric logic, relative daylight access; skyline-driven view assessment can therefore be treated as connected to daylighting performance rather than as an isolated perceptual exercise. This geometric coupling between daylight admission and visual composition echoes findings from traditional daylighting scholarship, where the same unobstructed-aperture logic has been used to classify vernacular daylighting elements [18].
From an economic perspective, views function as measurable hedonic attributes of residential property. Studies across multiple urban and coastal contexts show that access to water, green space, or open urban scenery commands statistically significant market premiums, while obstructed or fully enclosed views carry price penalties [19-23] a pattern also documented for apartment markets specifically, where view obstruction depressed residential sale prices in a manner directly comparable to the penalties reported here for Aversa's enclosed skyline clusters [24]. These effects vary with view type, degree of obstruction, and the vertical distance of the viewpoint, but the directional relationship between view quality and property value holds across cultural and geographic contexts [20-21,23]. Yet most hedonic studies sort views into a small number of qualitative classes, without systematically relating the morphological characteristics of the skyline to the perceptual experience of the occupant [22-23]. More recent hedonic evidence confirms this sensitivity of property values to view composition, finding that even partial obstruction of an otherwise open view measurably depresses residential sale prices [25].
Existing quantitative tools for window view assessment have made important progress, but notable gaps remain. The View Access Index (VAI), developed by Ko et al. [26], captures geometric window attributes such as glazing ratio, horizontal viewing angle, and minimum obstruction-free distance, and establishes threshold values for occupant satisfaction. The View Clarity Index (VCI), introduced by Konstantzos et al. [27], relates optical and material properties of glazing to perceptual sharpness. More recently, the Green Window View Index (GWVI), proposed by Bolte et al. [6], quantifies visible greenery through automated semantic segmentation. A related but methodologically distinct contribution comes from Koga et al. [28], who used an immersive virtual-reality protocol to quantify the perceptual effect of visible greenery proportion on occupant view satisfaction, showing that the amount and spatial arrangement of greenery, rather than its mere presence, drives perceptual response. A complementary, standards-based line of work is offered by Scorpio et al. [29], who applied the EN 17037 and LEED view-quality criteria within a parametric 3D workflow for an office building in Gdansk, Poland, systematically varying floor level, room orientation, building rotation, and window-to-wall ratio; their findings show that window sizing and building orientation can be adjusted to reshape the specific urban elements and panorama visible through the window even where the underlying standards-based view-quality score itself remains unchanged, underscoring that compliance-based metrics and perceived view content are not interchangeable. Each of these tools VAI, VCI, GWVI, the Koga et al. perceptual protocol, and the Scorpio et al. standards-based parametric approach captures an important dimension of view quality, yet none integrates the three-dimensional morphology of the skyline (building height distribution, roofline continuity, volumetric density) with pixel-level visual content analysis and hedonic economic interpretation within a single coherent framework. These gaps in the literature take four specific forms. First, methodologies for window-view assessment remain fragmented across disciplines, with geometric access, optical clarity, and vegetative content evaluated by separate, non-communicating instruments. Second, no existing framework offers a set of integrated indices capable of jointly expressing skyline morphology, perceptual composition, and openness within a single reproducible metric structure. Third, automated, pixel-level, and reproducible assessment of view content as opposed to manual classification or expert judgement has not been systematically incorporated into skyline-based view-quality assessment. Fourth, the perceptual dimension of window views has rarely been connected to its economic implications through a transparent, morphologically grounded interpretive step, leaving perception and property valuation as parallel but largely disconnected literatures.
These three research traditions environmental psychology, urban morphology, and real-estate economics are conventionally treated as separate disciplinary fields, yet they describe successive stages of the same causal chain. Perceptual and psychological research establishes which visual attributes of a view are experienced as restorative or stressful; urban morphological research explains how the three-dimensional configuration of surrounding buildings physically produces those visual attributes; and hedonic economic research shows that the resulting perceptual differences are then capitalized into measurable market outcomes. Because a change in urban form such as increased building density propagates through visual composition to occupant perception and, ultimately, to economic value, an integrated analytical framework is needed to trace this chain consistently. Treating morphology, perception, and economic value as isolated proxies, as the existing literature does, prevents this chain from being observed or tested as a whole. The present study addresses this gap with a three-index methodological framework for evaluating window views dominated by urban skylines. Rather than adding a further isolated metric, the framework is intended to give planners, designers, and researchers a single, transferable instrument that translates three-dimensional urban form directly into indicators of occupant visual experience and residential market relevance, supporting evidence-based decisions in urban design, environmental assessment, and property valuation. It integrates morphological analysis of building height and volumetric density, pixel-based segmentation of visible sky, greenery, and built mass, and exploratory hedonic interpretation drawing on established pricing coefficients from the literature. Three synthetic indices are developed: the Skyline Perception Index (SPI), the Skyline Openness Index (SOI), and the Skyline Density Index (SDI). This study aims to: (i) develop these three skyline indices; (ii) integrate volumetric urban morphology with pixel-level semantic segmentation of window views; (iii) demonstrate the applicability of the proposed framework through a representative urban case study; and (iv) explore the framework's relationship with perceived and economic dimensions of view quality. This case study is described in Section 2.2. The central contribution of this research lies in the creation of a unified, transferable, and reproducible analytical instrument that links urban morphology, occupant visual experience, and residential economic value three dimensions that, to date, have been studied in isolation.
2. Methodology
2.1. Framework design
The proposed framework evaluates window view quality through five analytical dimensions of the urban skyline: building height, density, skyline silhouette, roof shape, and inter-cluster transition. These dimensions draw on prior research on skyline perception and urban morphology [10, 14-15,30-34], which also includes landscape-planning characterizations of urban form at the city scale [33], quantitative treatments of how two and three-dimensional morphology jointly shape environmental performance [34], and skyline-specific planning-strategy analysis conducted for London [32] a city revisited methodologically in Section 4's discussion of multi-city extension and together demonstrate that height distribution and spatial density constitute the structural parameters of the skyline, while silhouette geometry and roofline variation convey its aesthetic, symbolic, and identity-related qualities.
Transition the change in skyline profile between adjacent building clusters as a function of viewing angle and inter-building spacing governs visual rhythm, continuity, and perceived complexity [30,35]. Together, these five dimensions provide a systematic basis for morphological analysis that is both quantitatively measurable and perceptually meaningful. Building on this foundation, three synthetic indices were derived, each condensing multiple individual characteristics into a single reproducible measure suitable for comparative skyline assessment. The overall structure of the proposed analytical framework and the relationships among its main components are illustrated in Figure 1.
Figure 1
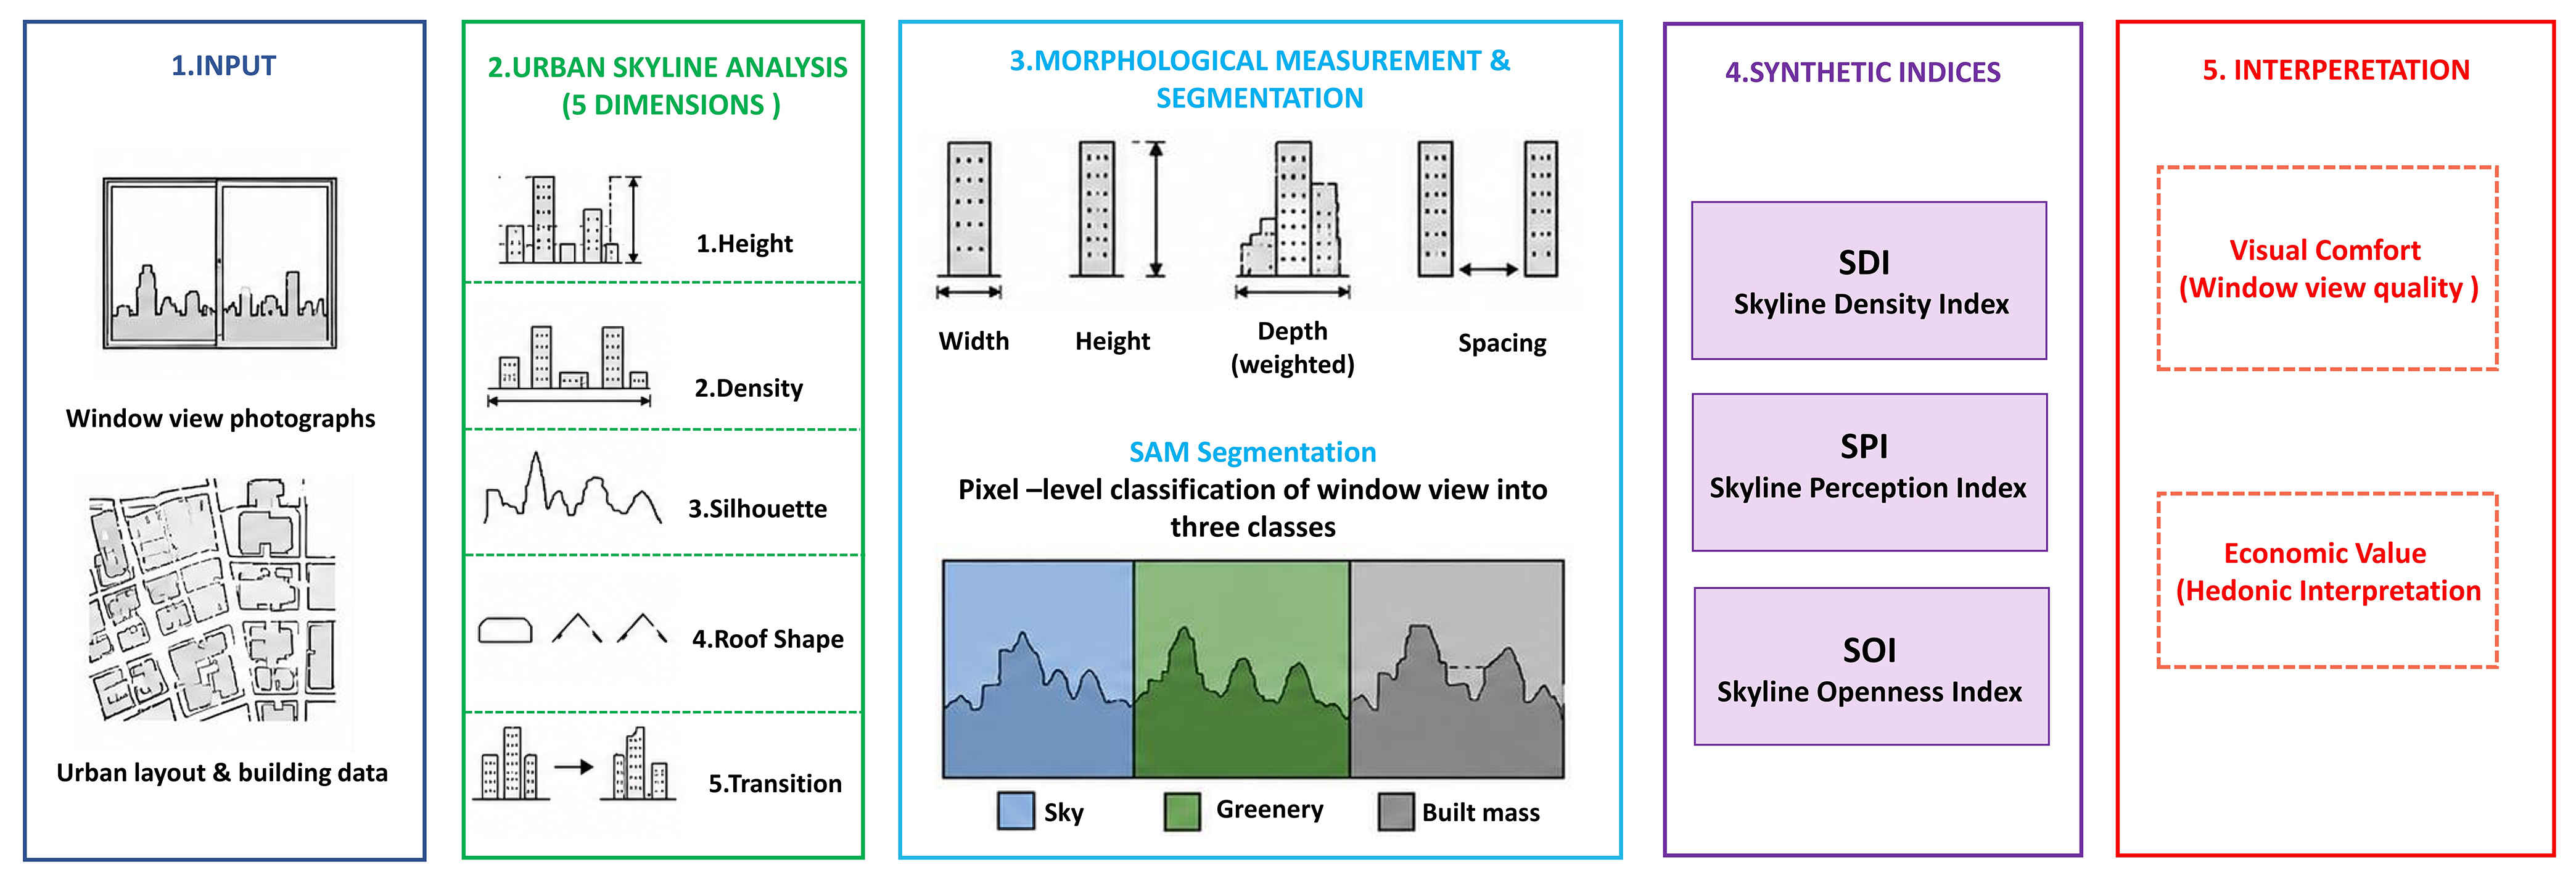
Fig. 1. Proposed urban skyline metrics framework.
The five analytical dimensions are not independent inputs: building height and density jointly determine the volumetric input to the SDI (Section 2.6.3); skyline silhouette and roof shape the aesthetic and physical attribute classifications described in Section 2.4; and, together with inter-cluster transition, they feed into the pixel-based segmentation of sky, greenery, and built mass (Section 2.5), which then supplies the compositional input to the SPI and SOI (Sections 2.6.1–2.6.2). Figure 1 illustrates these relationships, showing how the five morphological dimensions converge, through the measurement and segmentation steps described in Sections 2.2–2.5, into the three synthetic indices formulated in Section 2.6.
2.2. Urban layout and skyline review
The city of Aversa, located in the Campania region of southern Italy, was selected as the proof-of-concept case study. Aversa is a medium-sized historic city marked by a compact urban fabric in which historical and contemporary building stocks coexist, producing heterogeneous skyline conditions that make it a suitable test environment for the proposed framework. A reference office within the Department of Architecture and Industrial Design (University of Campania "Luigi Vanvitelli") served as the primary observation point, offering stable and reproducible viewing conditions for skyline assessment across multiple orientations.
A 1 km radius around the observation point served as the study boundary, consistent with the average distance at which urban features remain visually perceivable in medium-scale cities [36]. Land-use classification relied on pixel-based mapping of Google Earth satellite imagery, following the methodology of Bui and Mucsi [37], to distinguish built-up surfaces from open and green spaces. Built-up areas make up approximately 44% of the total land within the study radius, and green spaces account for approximately 26%. Road infrastructure was classified into three functional categories main roads (20 m width), secondary roads (12 m), and local roads (5 m) based on field measurements and Italian urban planning regulations [17]. The spatial distribution of these landscape metrics within the Aversa study area is illustrated in Figure 2. Building heights were extracted from Google Earth imagery and field observations. The dataset shows that buildings within the study area range from 3 m to 18 m, with the modal height at 9 m (27% of structures).
Figure 2
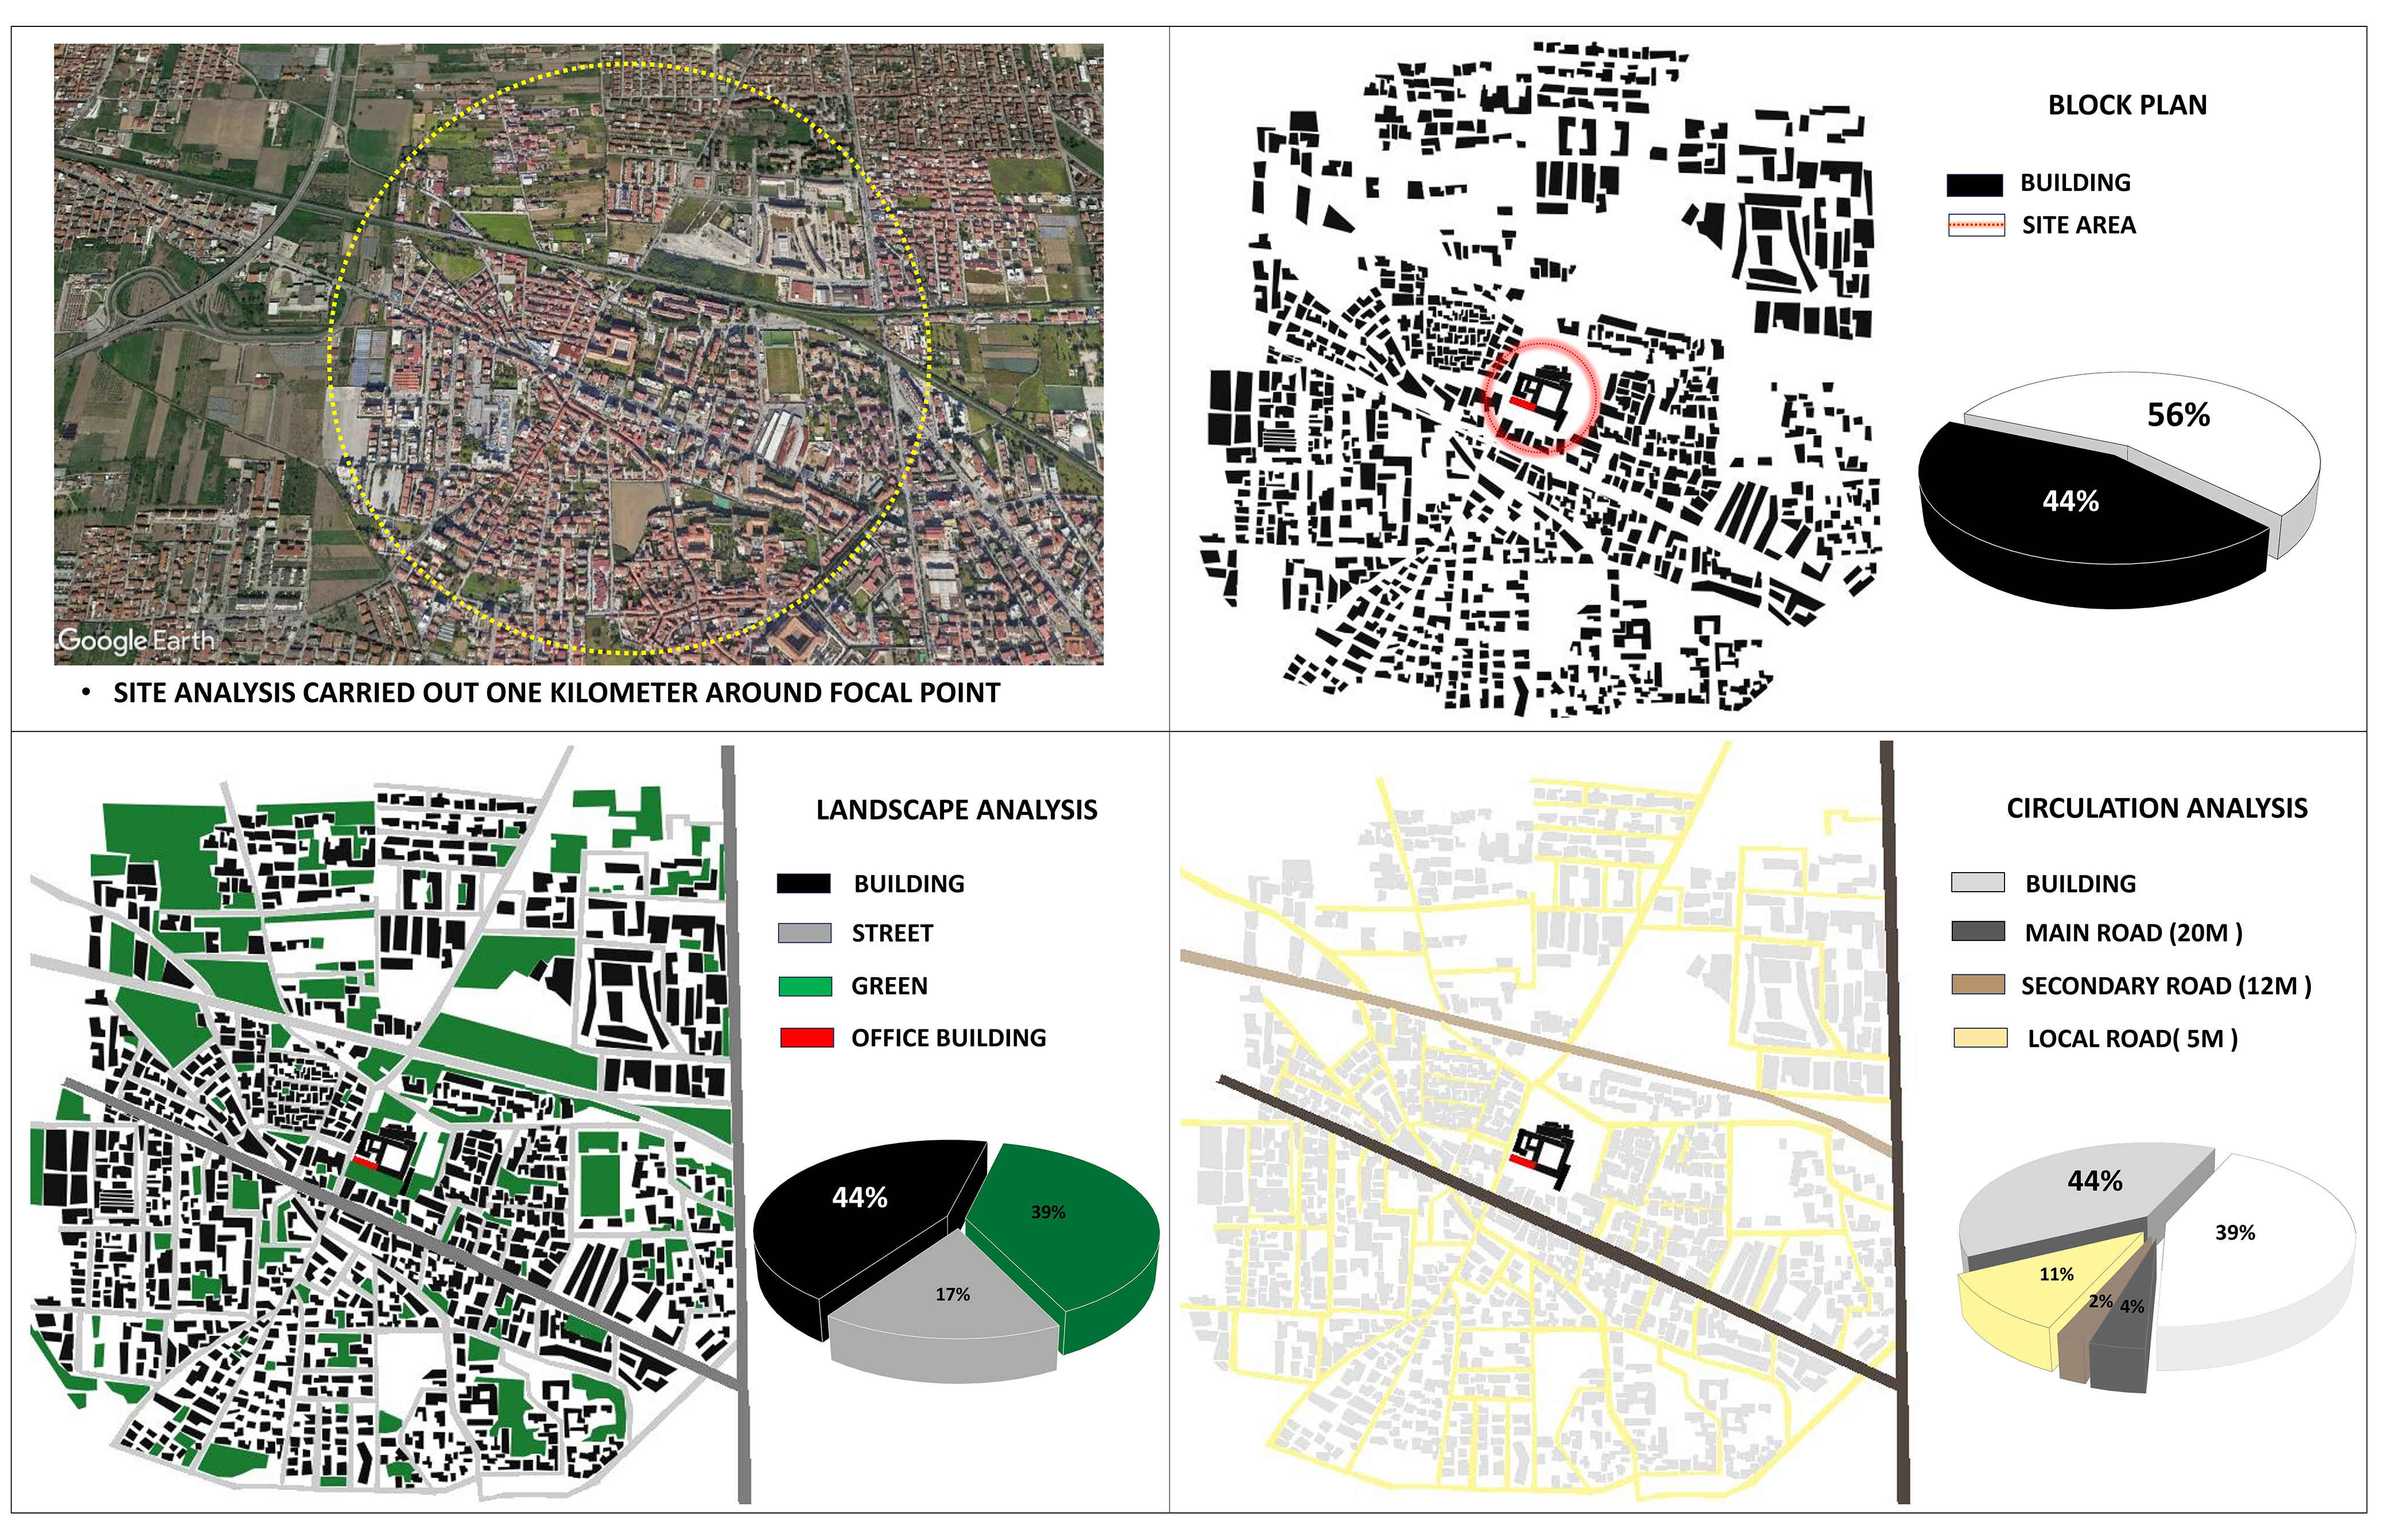
Fig. 2. Landscape metric review of Aversa.
Classification into three height categories drew on cross-referencing with the TABULA European building typology database [38], incorporating Belgian, Danish, and Italian national reports to establish consistent storey-height relationships for European residential building stock. The resulting classification system defines low-rise (0–10 m), medium-rise (10–20 m), and high-rise (20–50 m) buildings; those exceeding 50 m follow the tall building definition proposed by Al-Kodmany [13]. The resulting building-height distribution is shown in Figure 3, while the adopted height-classification ranges are summarized in Table 1.
Figure 3
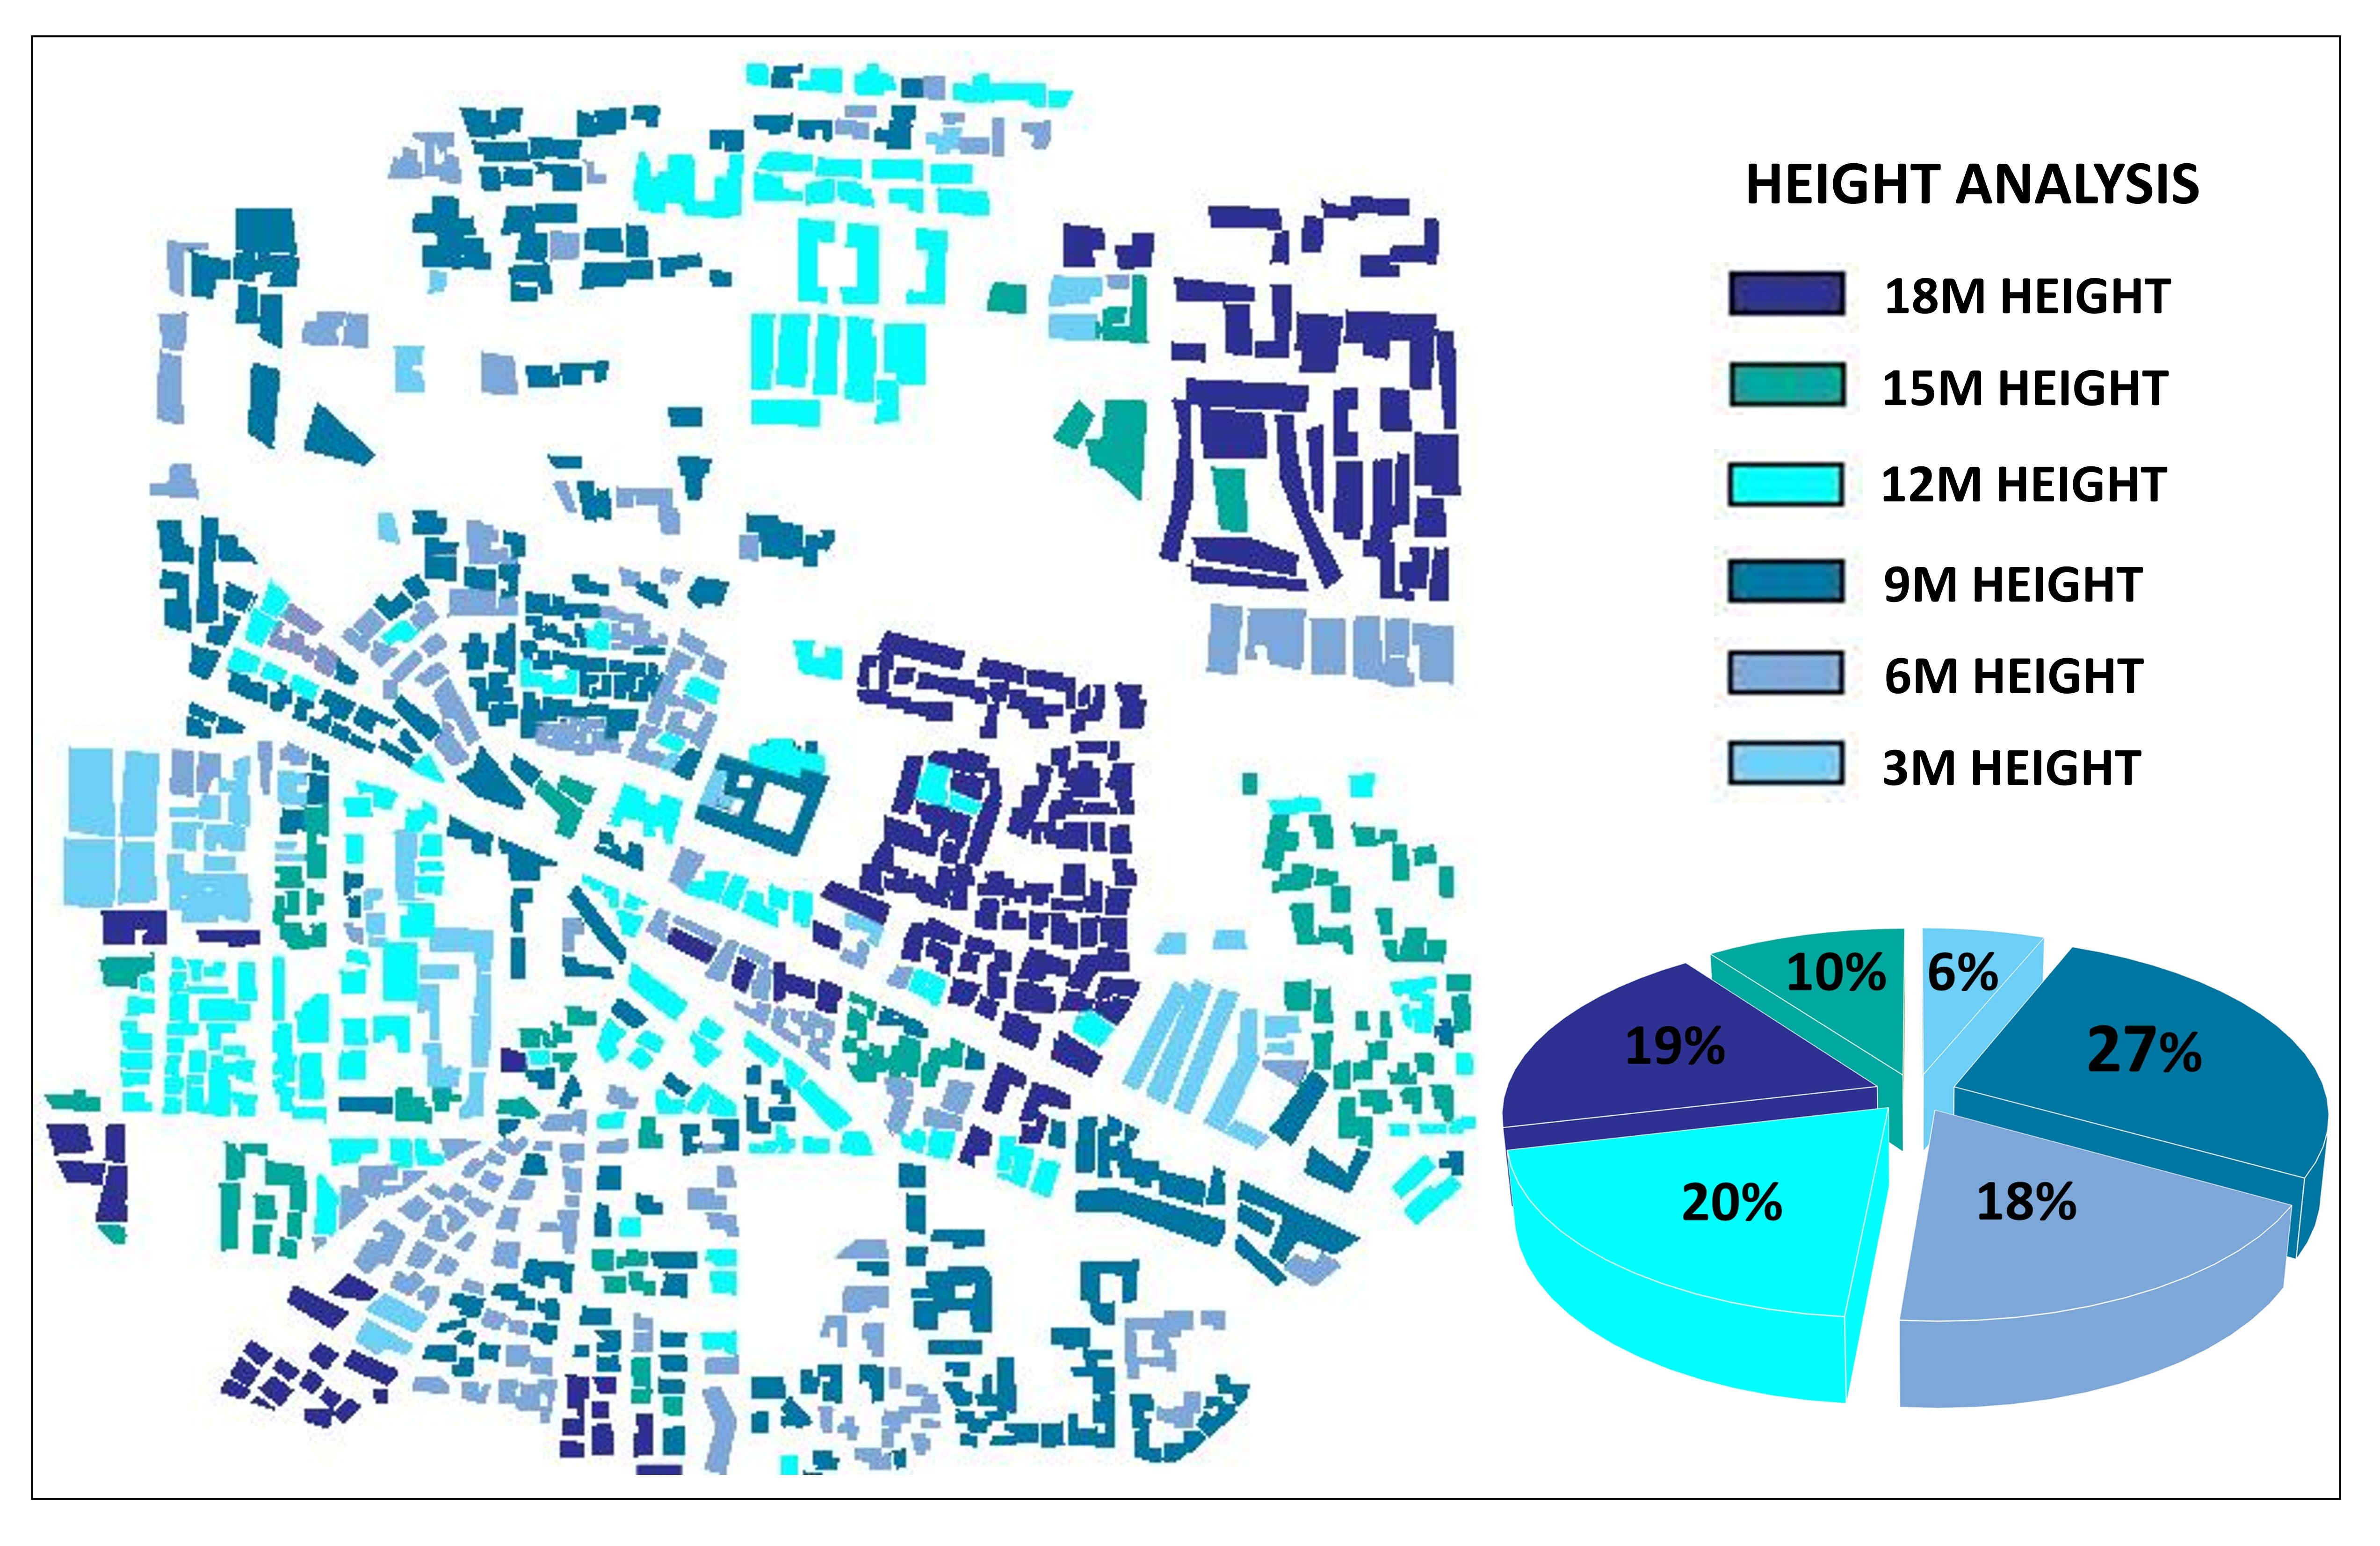
Fig. 3. Building height distribution around the observation point.
Table 1

Table 1. Proposed building-height classification.
2.3. Density analysis
Building density was evaluated as a fundamental parameter governing skyline perception, drawing on qualitative category definitions proposed in established skyline studies [8]:
- Low density: wide inter-building spacing that produces visual discontinuity and a fragmented skyline profile.
- Medium density: an open yet clustered arrangement in which built form appears continuous while retaining spatial gaps, yielding a semi-continuous and visually balanced skyline.
- High density: narrow inter-building spacing that produces strong visual connectivity and a cohesive skyline. These qualitative density categories are illustrated in Figure 4.
Figure 4
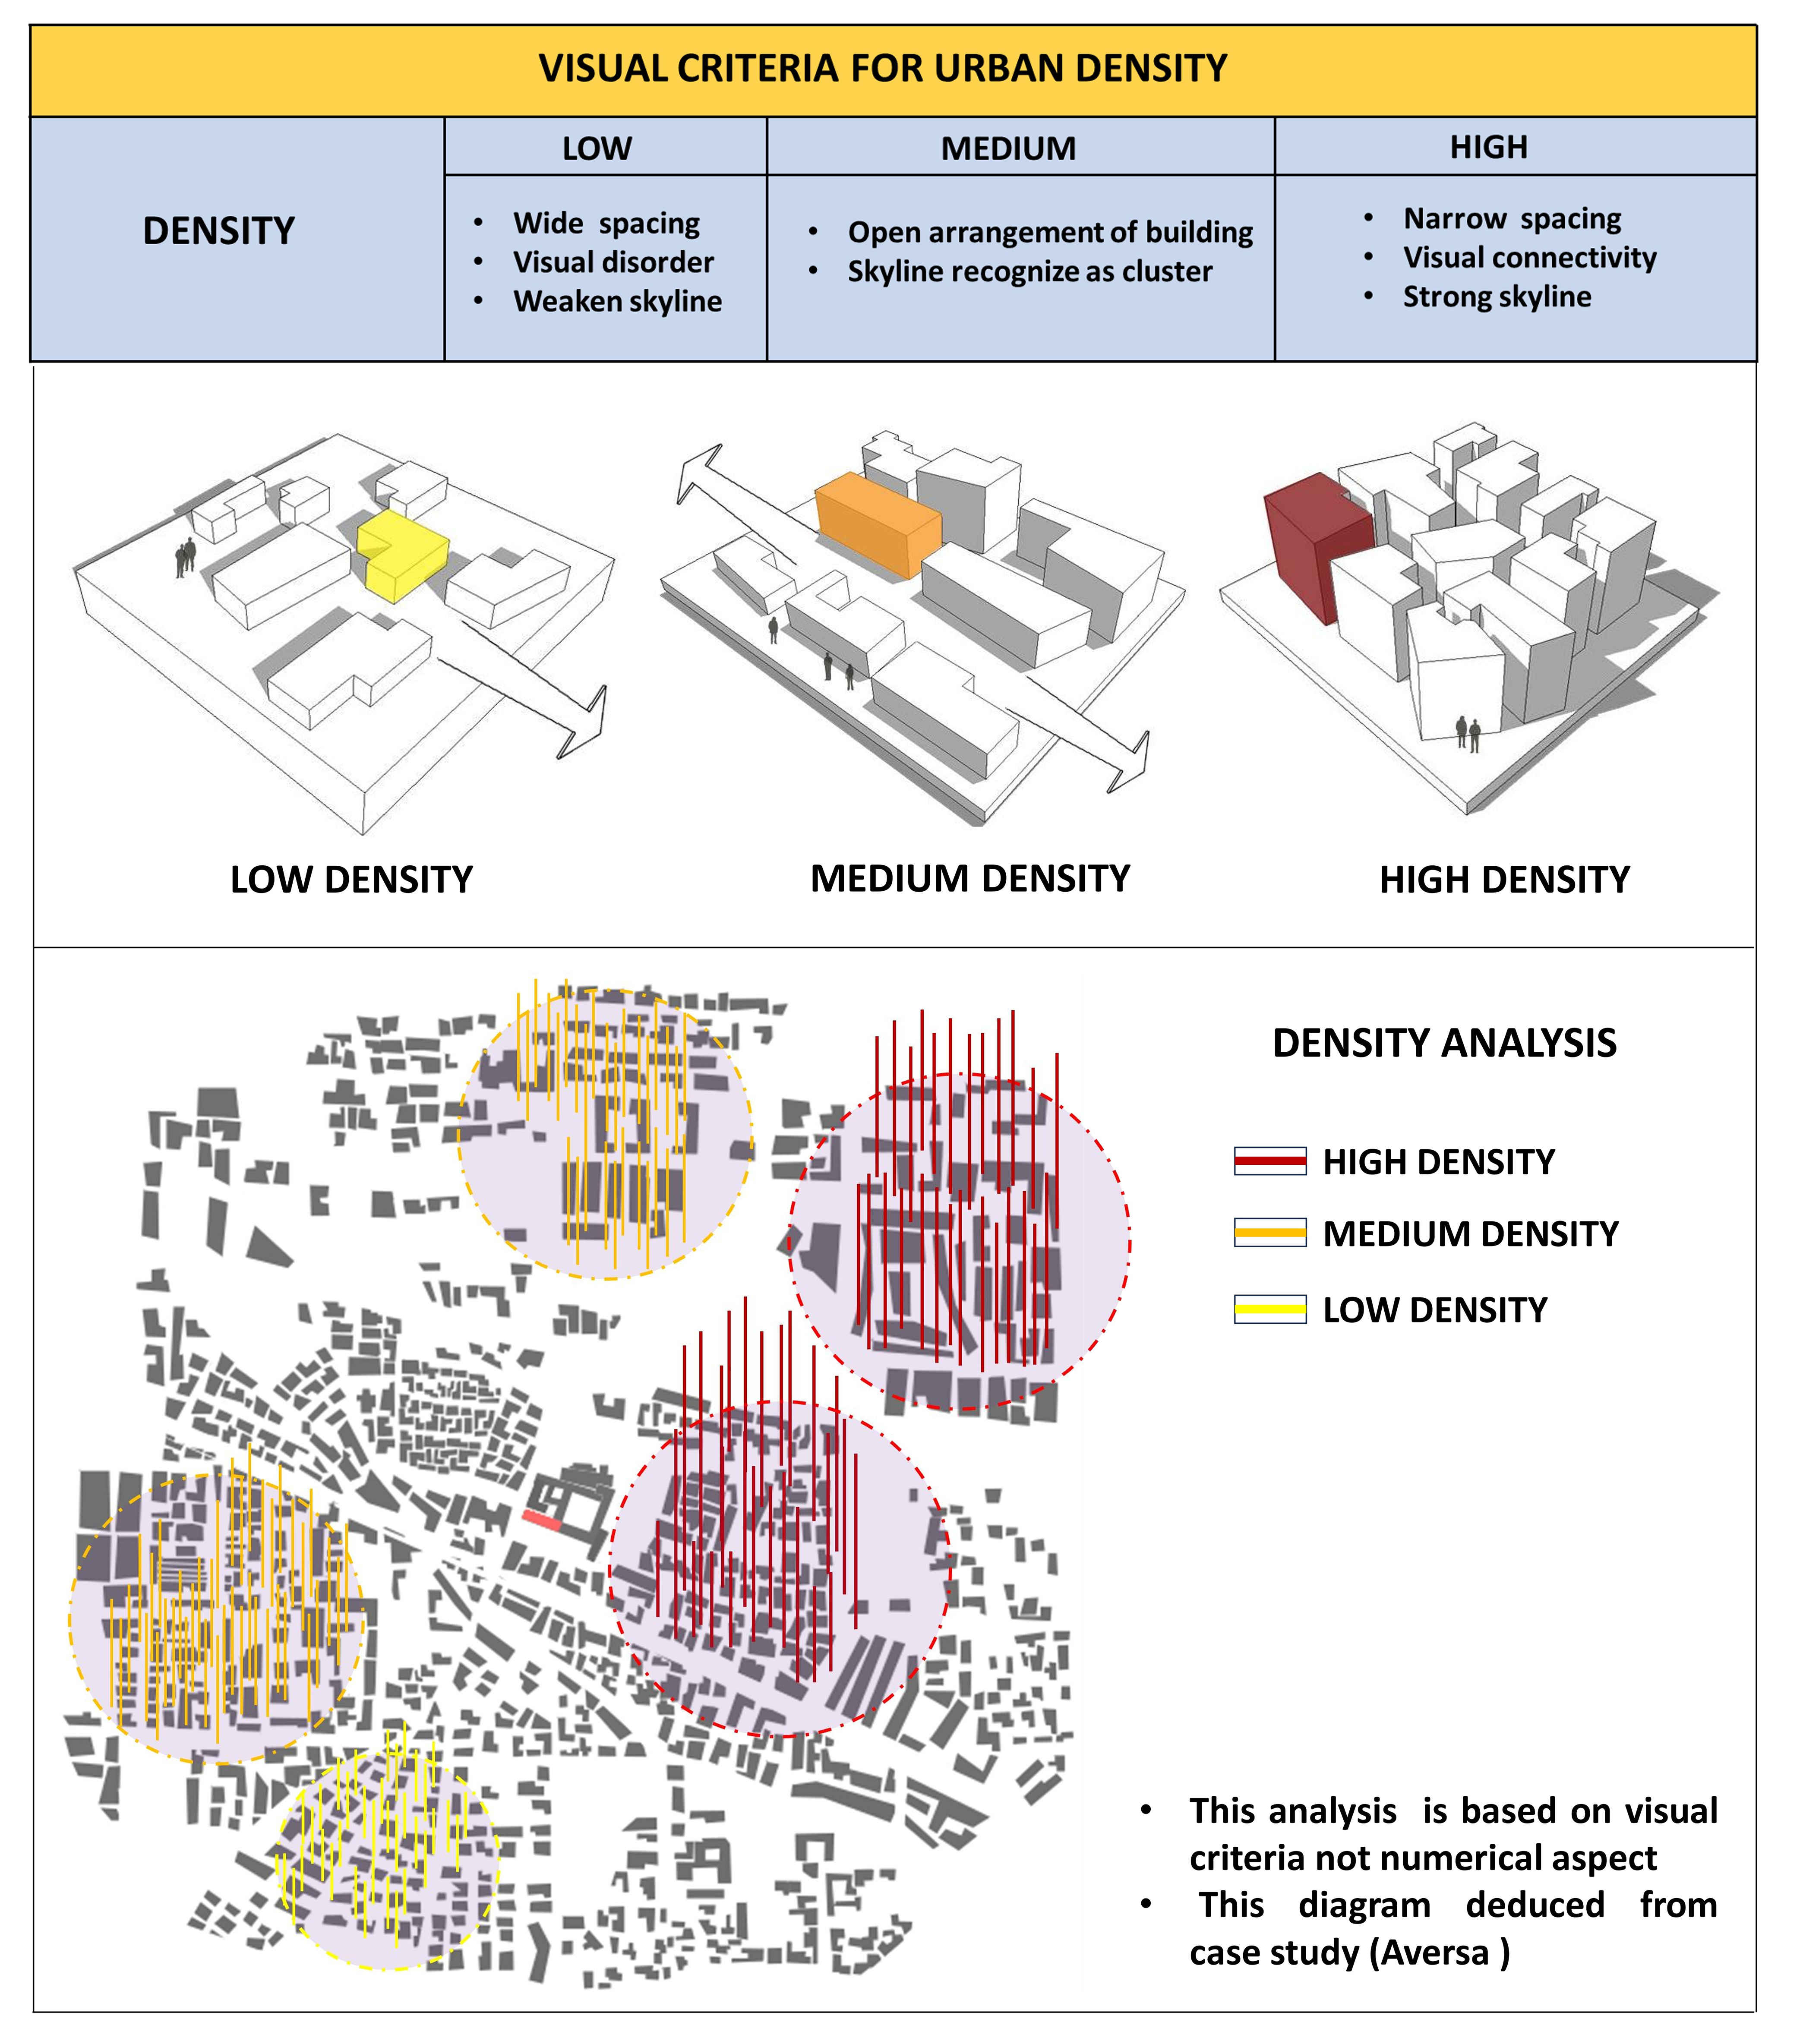
Fig. 4. Qualitative density classification from literature.
The qualitative low/medium/high spacing categories above reflect the relative, pattern-based density criteria established in prior skyline studies [8], in which inter-building spacing is characterised relative to building width, height, and viewing distance rather than as a single fixed metric distance: a gap that reads as "wide" between low-rise buildings of narrow footprint may read as "narrow" between taller, wider volumes. For this reason, the qualitative categories carry no universal meter threshold; instead, the pixel-based percentage thresholds defined below provide the quantitative, distance-independent complement used for reproducible classification in this study, as illustrated in Figure 5. Fixed-distance spacing thresholds calibrated to building-height class would be a valuable refinement for future work.
Figure 5
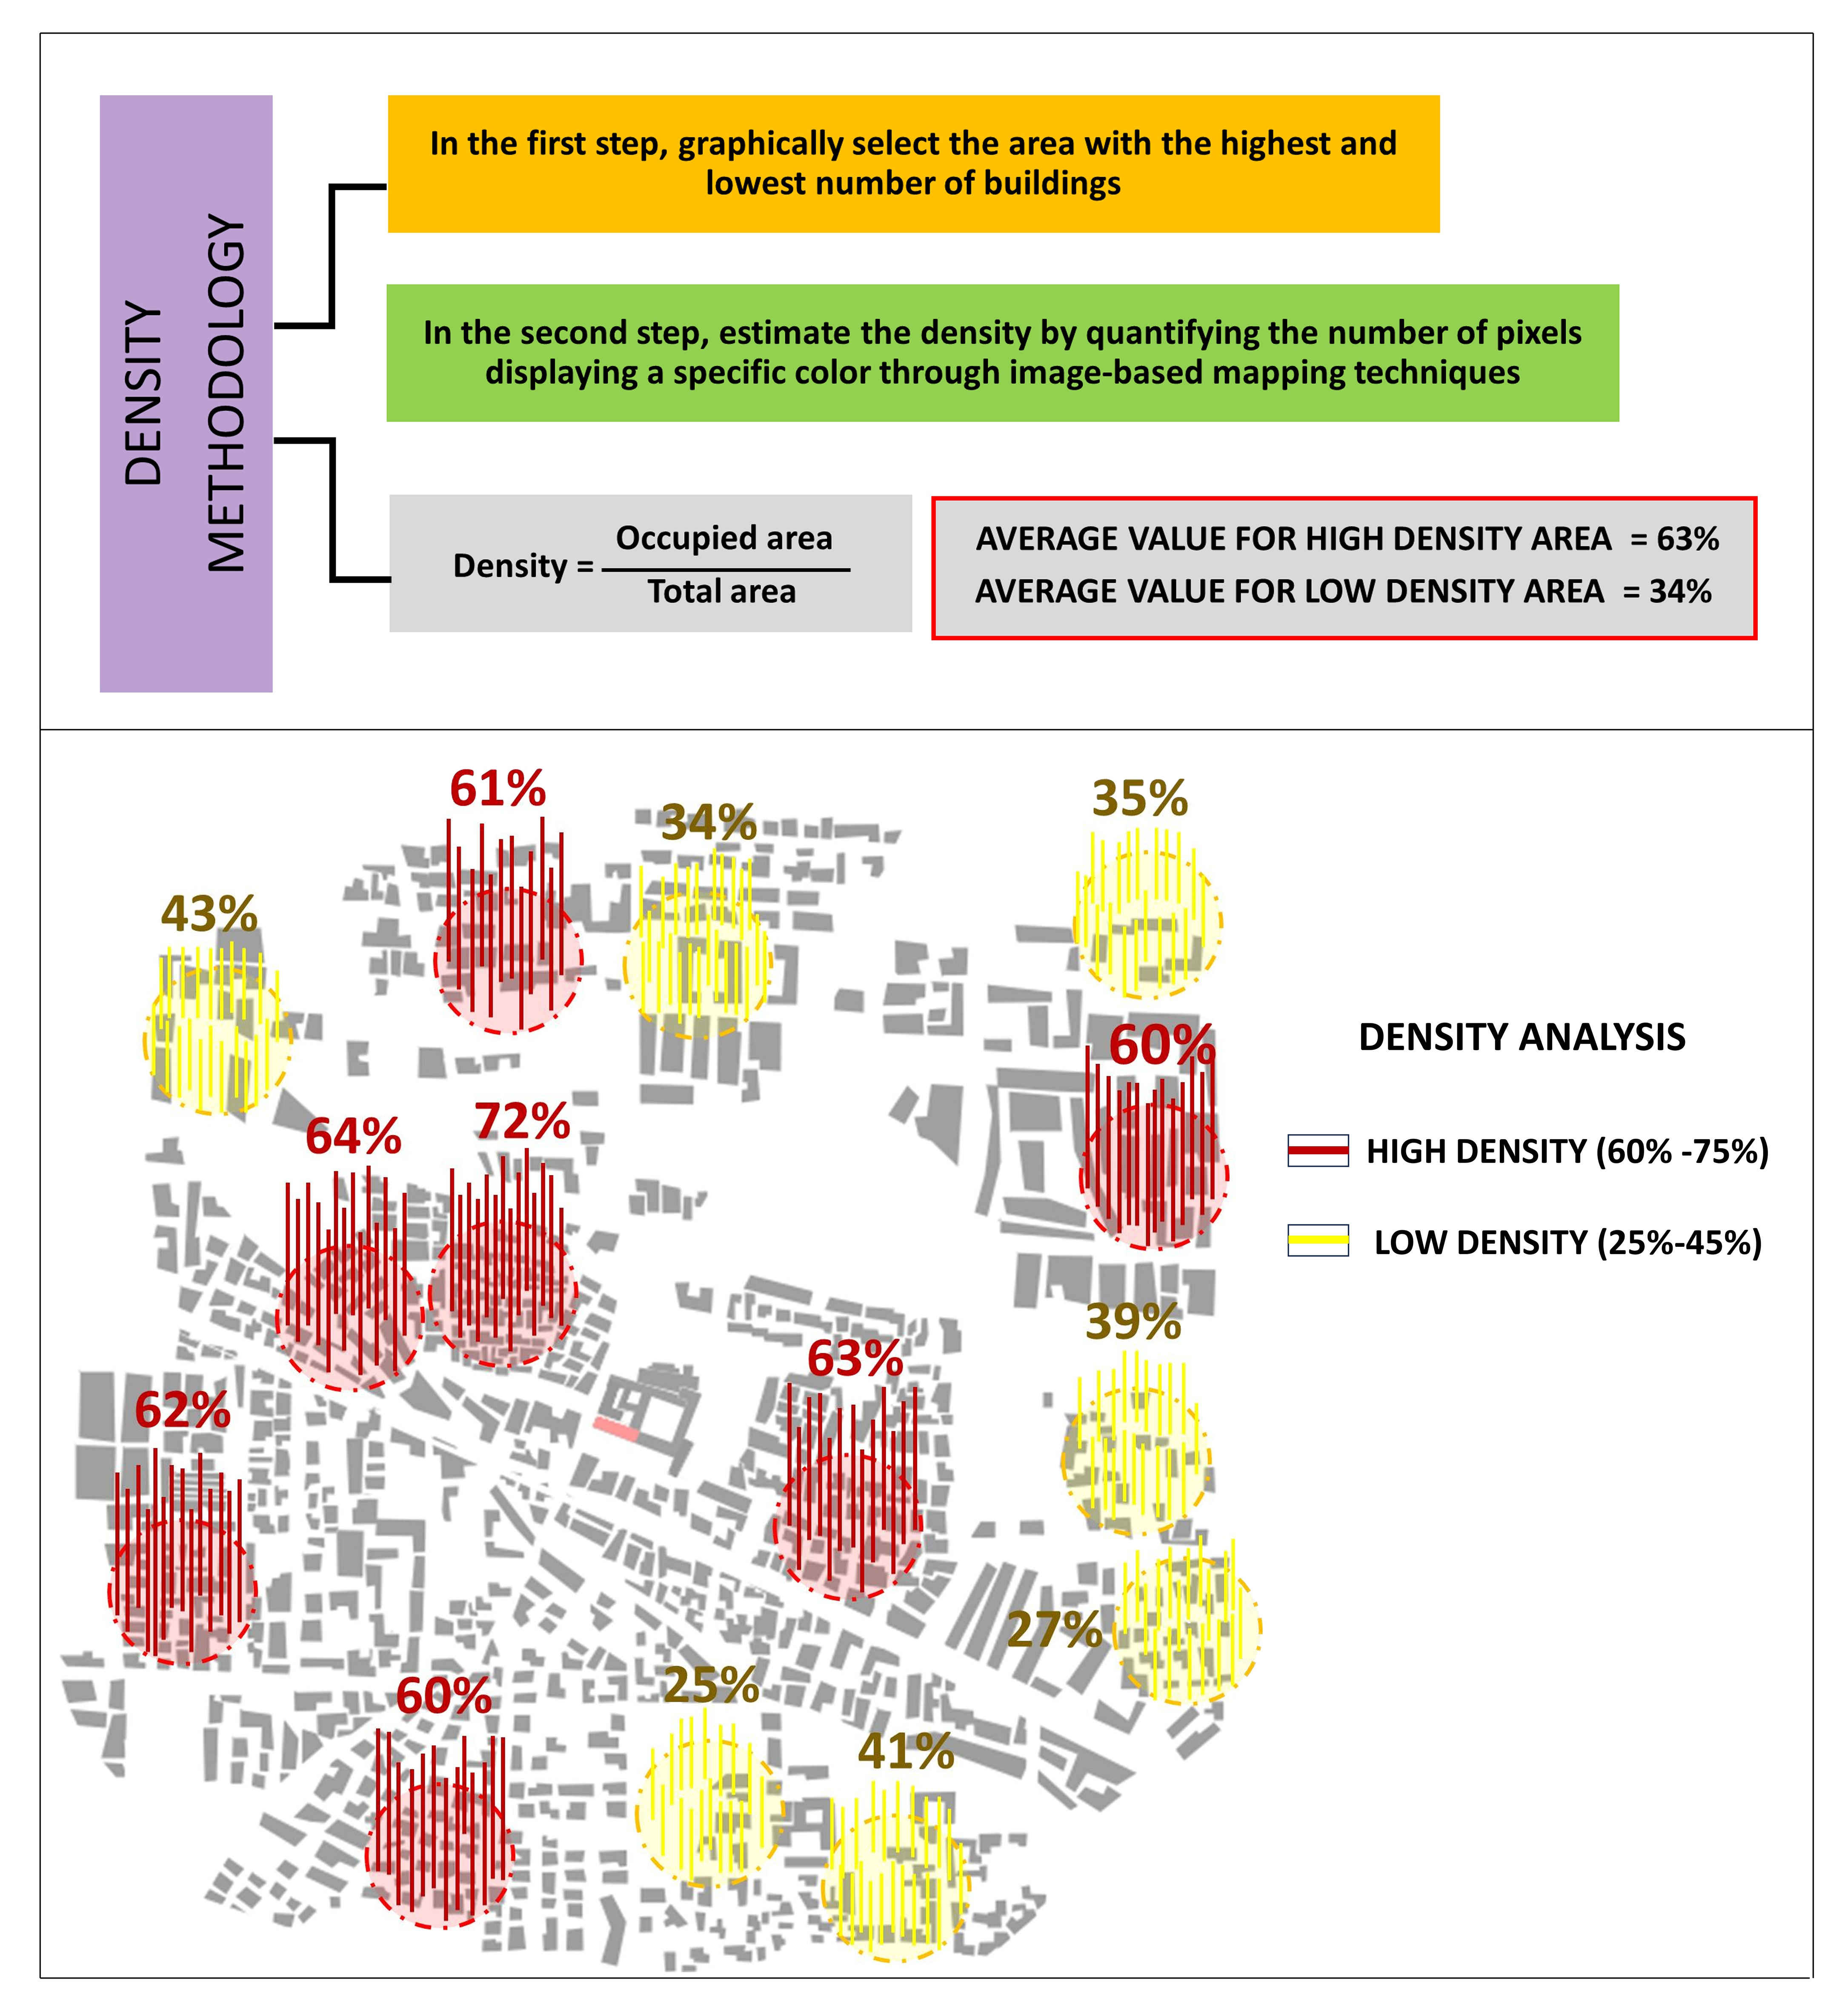
Fig. 5. Proposed pixel-based density analysis method.
Alongside this qualitative classification, a pixel-based density analysis method was developed as a semi-quantitative complement. Built-up area proportion within the study boundary was calculated from pixel counts of satellite imagery segmented into built-up and non-built-up classes, with three thresholds defined: high density (>60% built pixels), medium density (45–60%), and low density (<45%). This approach offers a transparent, reproducible, and image-derived measure of areal density that is independent of cadastral data, making it particularly suitable for cross-city comparisons.
As an additional validation step, the Indexz plugin for SketchUp was applied to automatically extract height and density data from the 3D model of the study area, verifying manually derived measurements and confirming the compatibility of the proposed framework with automated analytical workflows.
2.4. Skyline shape and attribute classification
The analysis of skyline shape addresses both aesthetic and morphological characteristics within the defined view field. Following Stamps [30], three aesthetic skyline categories can be identified: flat skylines, arising from buildings of similar height and producing a relatively uniform horizon; concave skylines, characterised by a profile that descends toward the centre and generating a greater sense of openness and spatial depth; and convex skylines, featuring an upward-curving profile that rises toward the centre and strengthening the perceptual dominance of the skyline core. The three aesthetic skyline categories are illustrated in Figure 6.
Figure 6
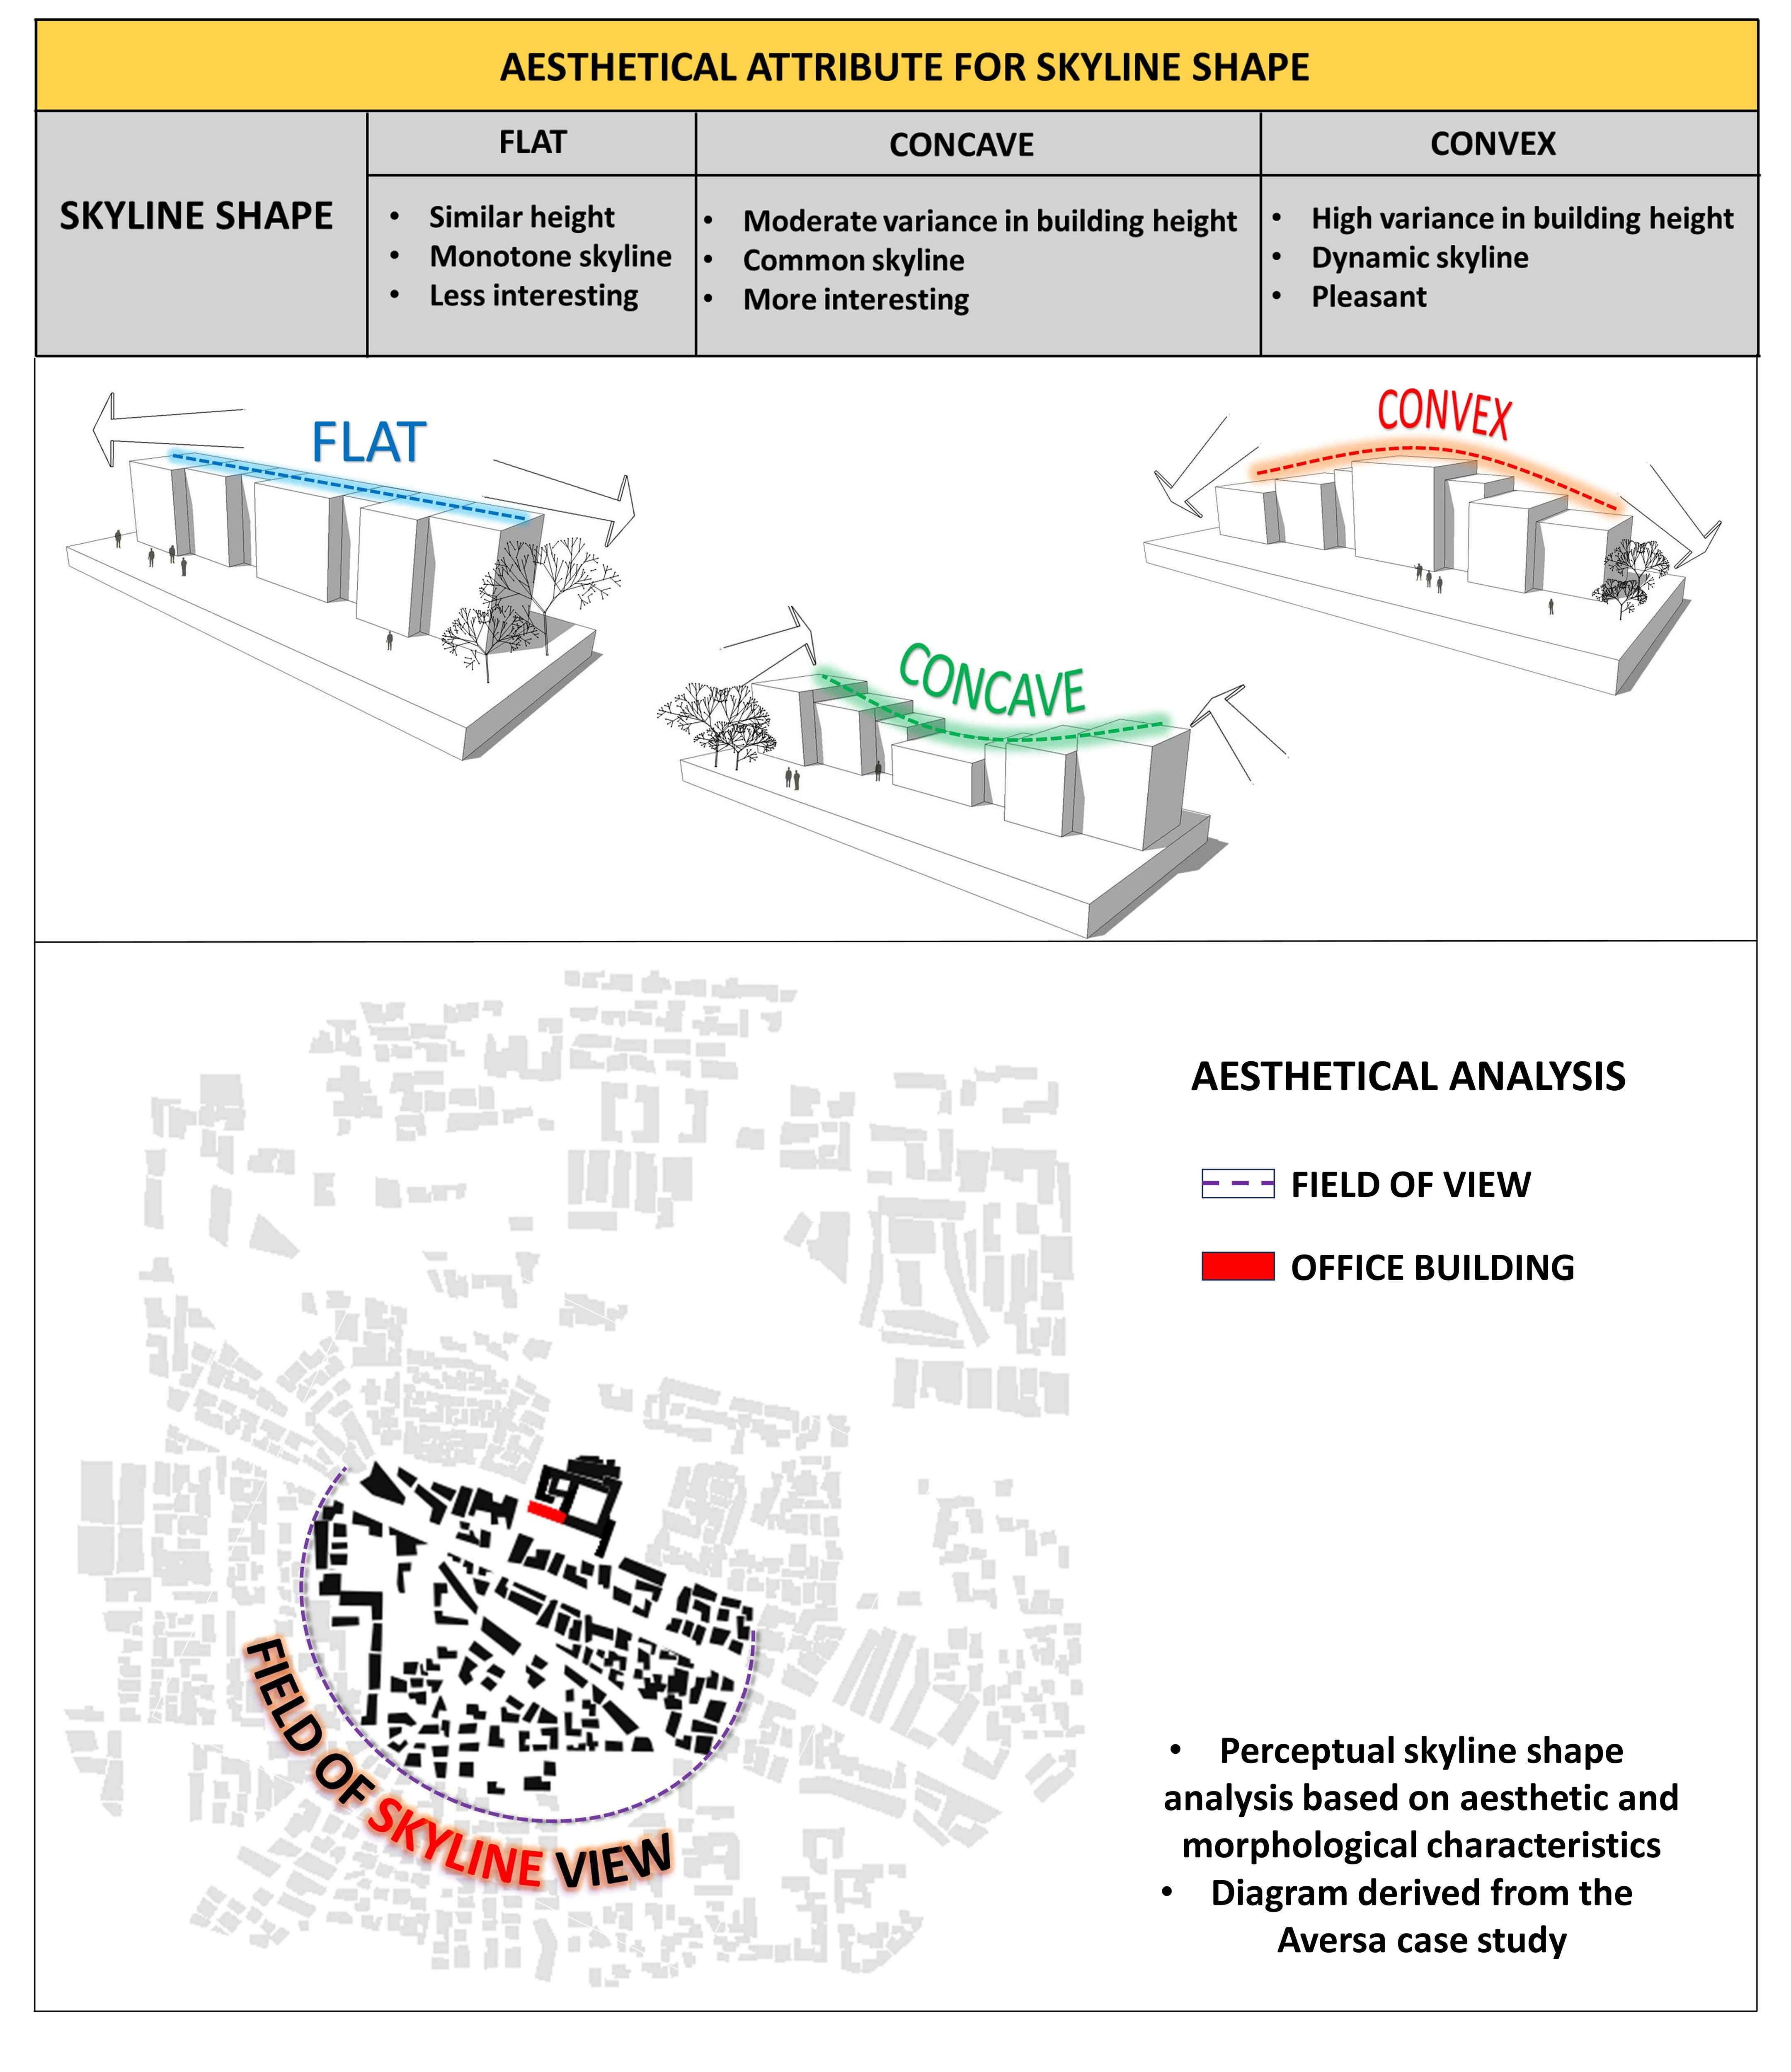
Fig. 6. Aesthetic skyline shape categories.
Physical skyline attributes comprise two compositional components roof shape and transition and three geometric parameters width, spacing, and observer-skyline distance following the classification proposed by Wang and Heath [39]. Roof shape (continuous, fragmented, or staggered) shapes the skyline's visual rhythm and degree of uniformity [14,39]. Transition characterises the change in silhouette as viewing position shifts from close-range to distant perspectives, producing either continuous or interrupted skyline effects [30,35]. These physical attributes were held constant across skyline shape comparisons so that observed perceptual differences could be attributed to silhouette variation rather than to baseline geometry [30,40]. The physical skyline attributes used in the classification are summarized in Figure 7.
Figure 7
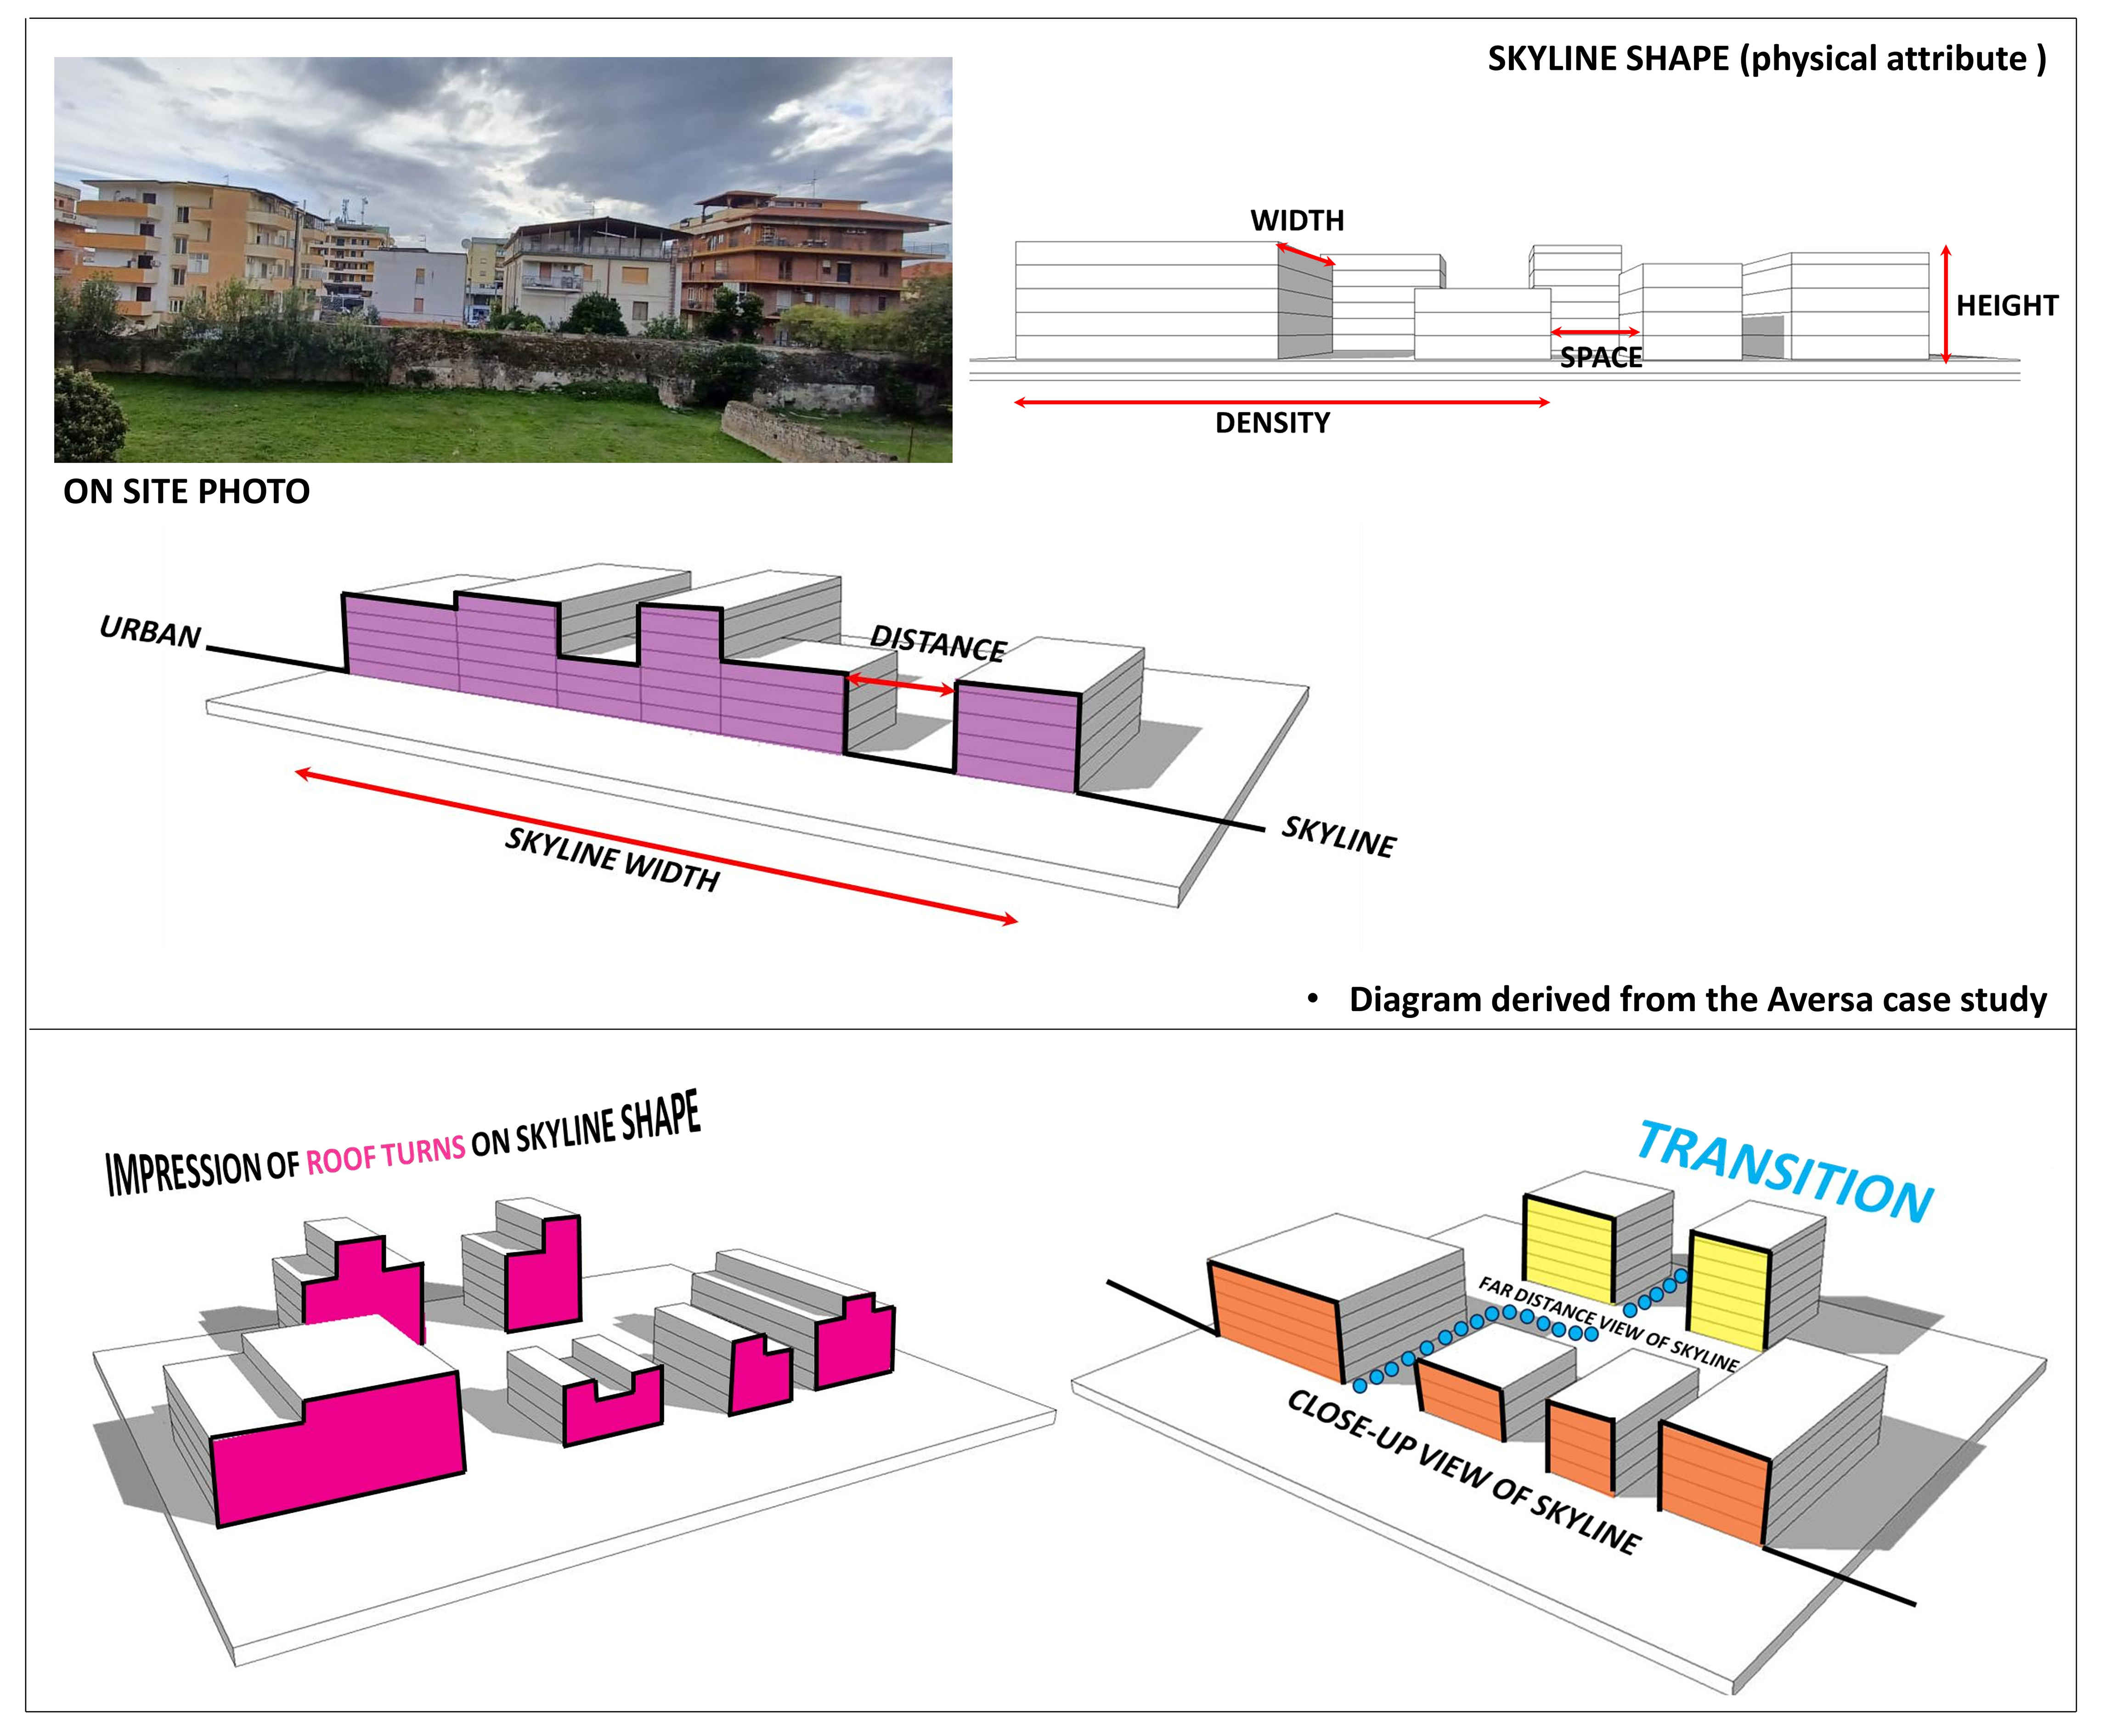
Fig. 7. Physical skyline attribute classification.
2.5. Visual content analysis
Visual content analysis examines how window views are composed in terms of the three principal pixel classes visible from an indoor viewpoint: sky (contributing to openness, daylight access, and spatial relief), greenery (enhancing restorative potential and biophilic connection), and built mass (representing the enclosing effect of the constructed environment). Classification boundaries were defined explicitly to ensure consistency: greenery encompasses visible tree canopies, shrubs, and lawns; shadows, bare soil, and window reflections fall under the built-mass class; and sky refers solely to the visible portion of the sky dome.
Segmentation relied on the Segment Anything Model (SAM), developed by Meta AI [41], a foundation model for promptable image segmentation that produces accurate class boundaries with minimal user interaction typically a single click per region. SAM was selected for its robustness to photographic variability, its public availability (https://segment-anything.com), and its suitability for processing simulated 3D renders. No peer-reviewed publication accompanies the original SAM release; the model card and documentation hosted at the cited URL therefore serve as the authoritative reference for this tool at the time of writing, consistent with standard practice for citing open-source computational software. In the interest of full methodological transparency, we note that the specific SAM model checkpoint/version, exact input image resolution, and a formally documented mask-selection protocol beyond the single-click-per-region prompting procedure already described were not systematically logged during the original analysis, and the degree of manual intervention beyond initial prompting was not quantified. This documentation gap is acknowledged as a reproducibility limitation in Section 4, and future applications of the framework should log these parameters explicitly. The proportion of each class was computed as: class share (%) = (class pixel count ÷ total pixel count) × 100. These proportions serve as the primary inputs to the SPI and SOI indices described in Section 2.6. Prior studies have used comparable pixel decomposition approaches for dynamic view analysis [42] and for Green Window View Index validation [43]. An example of the resulting SAM-based segmentation is shown in Figure 8.
Figure 8
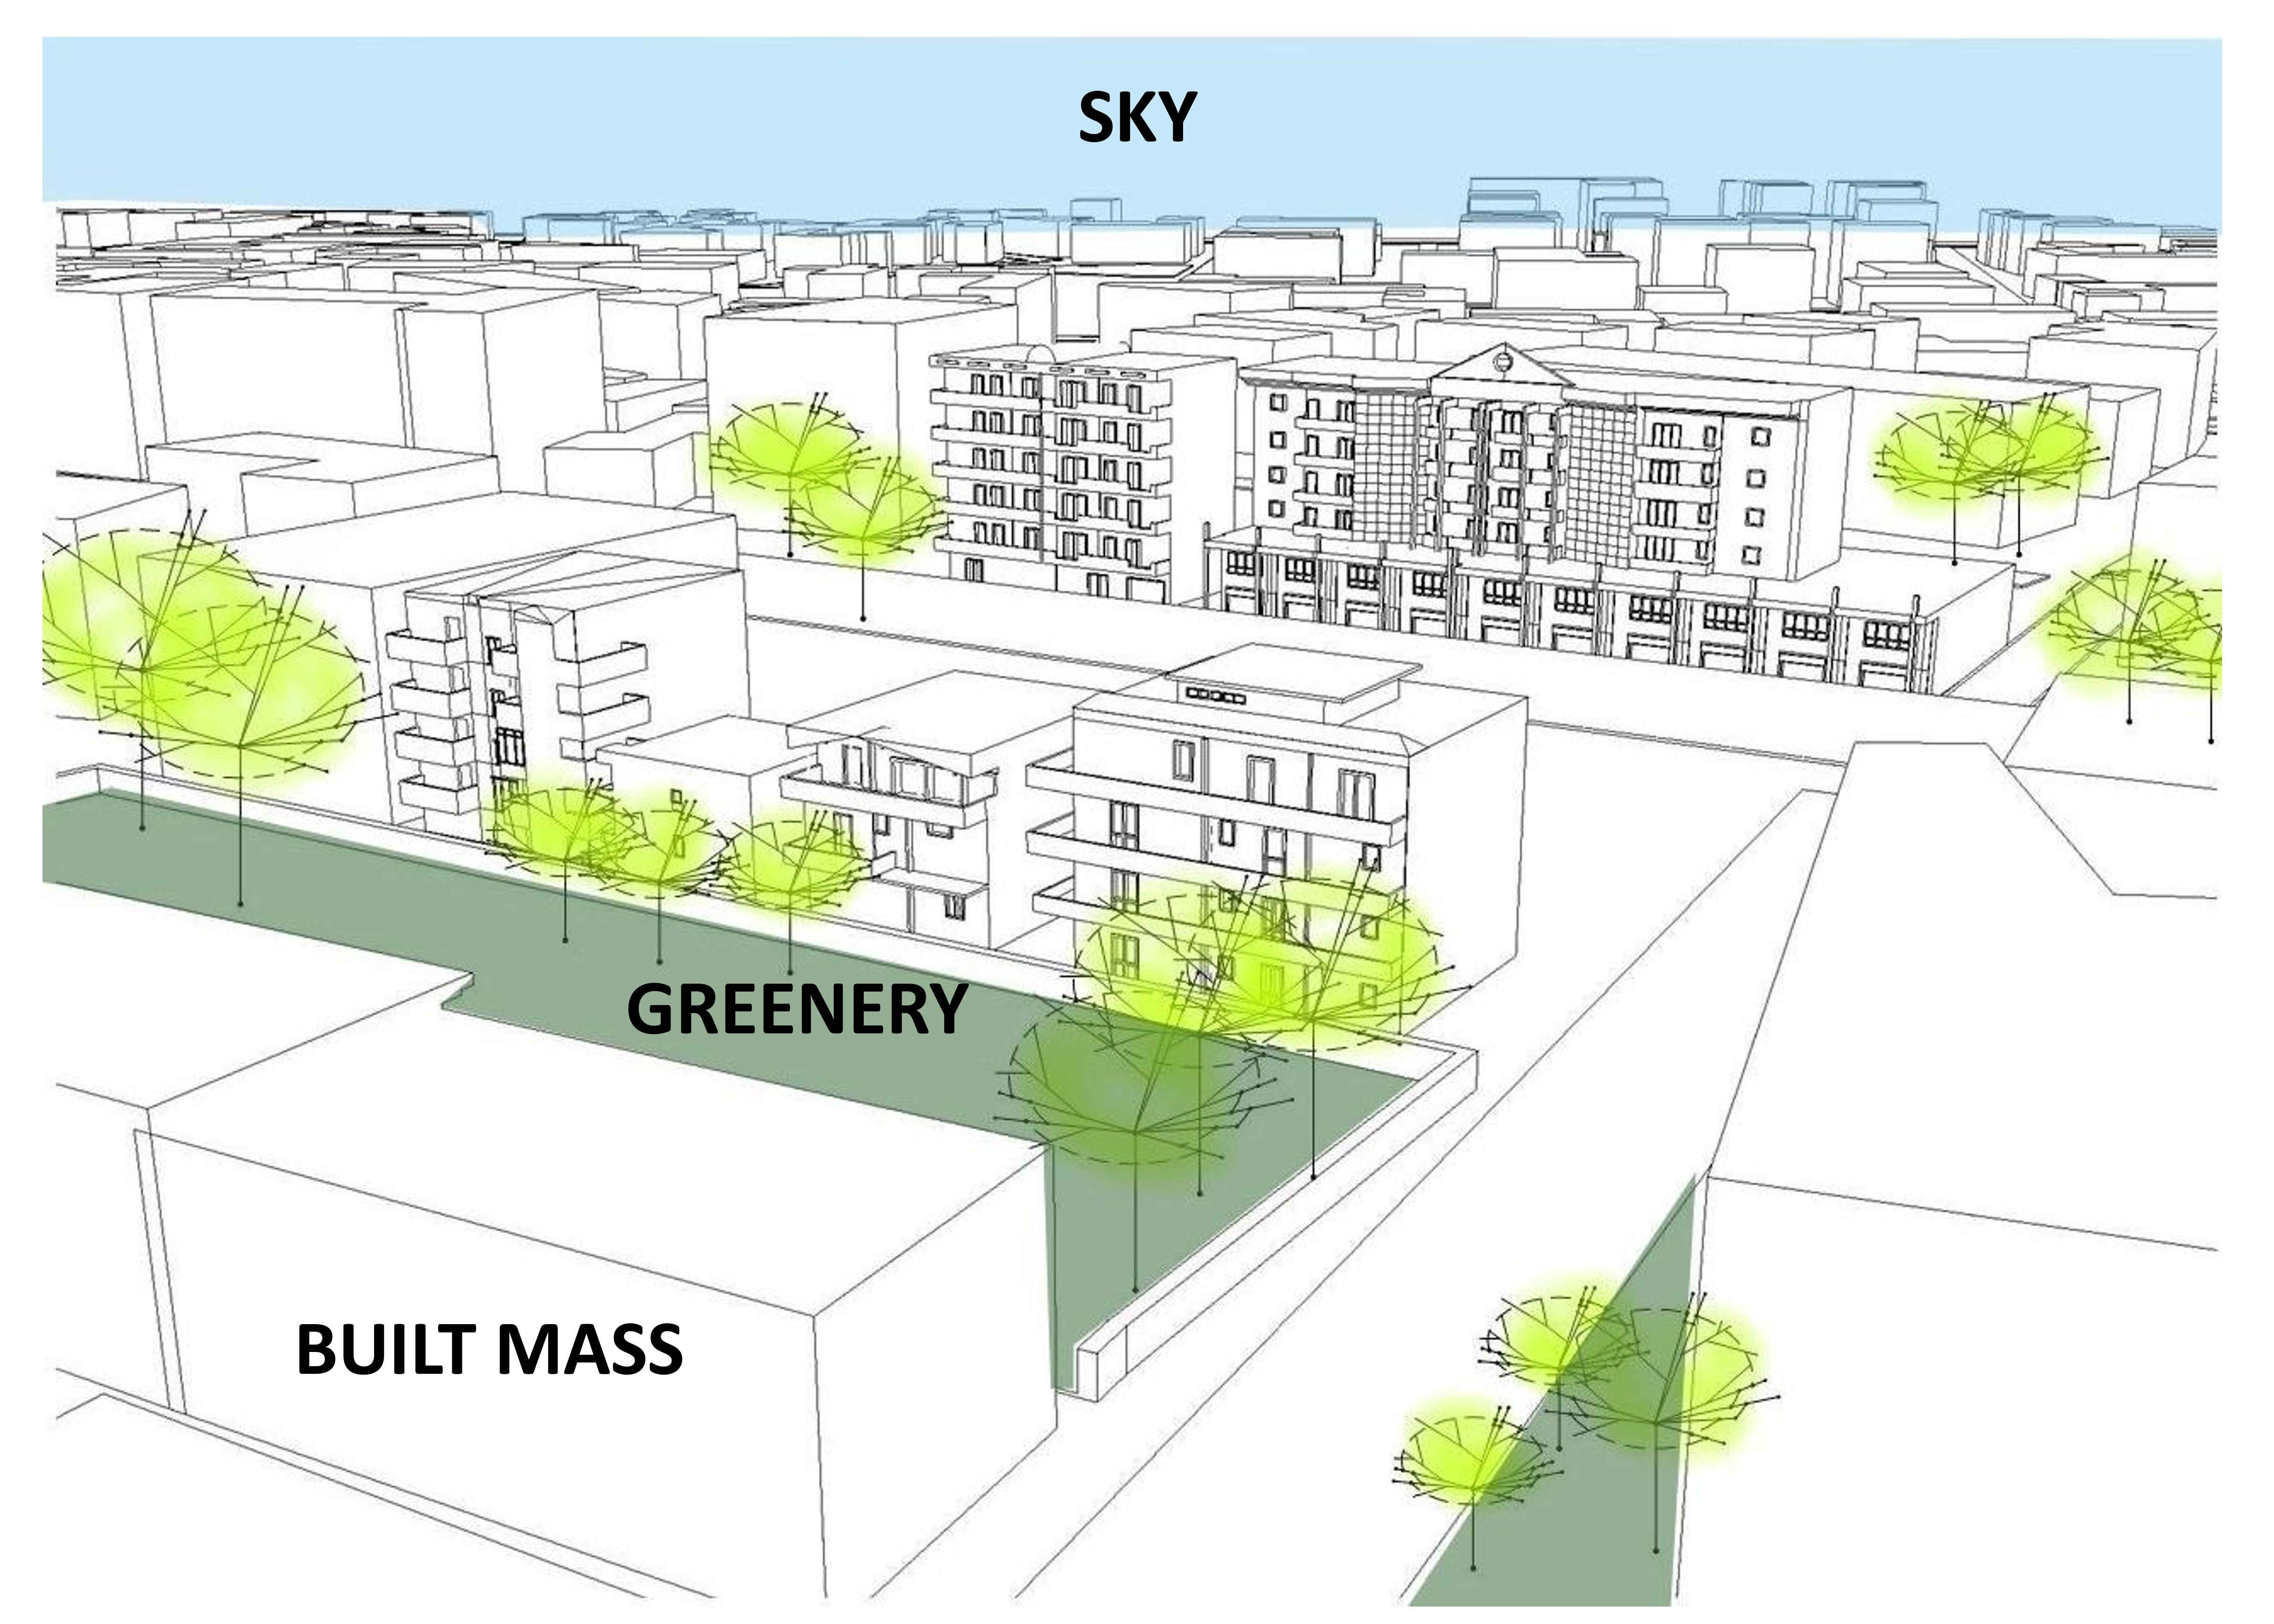
Fig. 8. SAM-based segmentation of the reference window view.
2.6. Synthetic index formulation
2.6.1. Skyline perception index (SPI)
The SPI quantifies the perceptual quality of a window view as a weighted combination of its three pixel-class proportions, reflecting the differential restorative value that each class confers on the observer:
where S, G, and B denote the proportions (0–1) of visible sky, greenery, and built mass, respectively, and ws = 0.4, wg = 0.4, and wb = 0.2 are the perceptual weighting factors. The weights reflect the restorative and visual comfort benefits of sky and greenery documented by Ulrich [1], Stamps [30], and Jim and Chen [44], while the negative contribution of built mass captures its occlusive and enclosing effect, consistent with virtual-reality evidence linking façade characteristics and visual massing directly to perceived oppressiveness in high-rise window views [45].
Given these weights, SPI is bounded by the extremes of the pixel proportions: the maximum attainable value is SPI = 0.4 (when S + G = 1 and B = 0, i.e., a fully open view with no built mass), and the minimum is SPI = −0.2 (when B = 1 and S = G = 0, i.e., a fully enclosed view). Higher SPI values within this [−0.2, 0.4] range indicate greater perceptual quality, while values approaching the lower bound indicate dominance of built mass with minimal restorative potential; SPI does not range toward 1.0 under the present weighting scheme and should be interpreted relative to this bounded range rather than as a normalised 0–1 score. These weight values represent a preliminary calibration grounded in the literature and should be validated through future user survey data. For repeatability, the specific weight values were assigned through the following literature-informed heuristic rather than a fitted statistical model: sky and greenery were assigned equal weight (ws = wg = 0.4) because both are reported in the cited literature as comparably strong drivers of restorative, positive perceptual response [1,30,44], whereas built mass was assigned a smaller-magnitude negative weight (wb = 0.2) to reflect its consistently reported, but comparatively less pronounced, negative association with perceived view quality in the same body of work. This procedure is fully reproducible in the sense that any set of segmented S, G, and B proportions can be substituted directly into Eq. (1) to obtain SPI; however, the relative magnitudes of the three weights themselves have not been fitted to empirical preference data specific to this study, which is why their formal sensitivity testing and empirical calibration are identified as priorities for future work in Section 4.
2.6.2. Skyline openness index (SOI)
The SOI measures visual openness as the combined proportion of sky and greenery within the view field:
Because S + G + B = 1, Eq. (2) is equivalent to 1 − B, confirming that SOI is directly driven by the visible proportion of built mass. Higher SOI values correspond to greater visual openness and permeability; lower values indicate increasing enclosure. The index provides a computationally direct, orientation-sensitive measure of view openness that complements the weighted perceptual assessment captured by SPI.
The SOI, as formulated in Eq. (2), treats sky and greenery as equivalent, interchangeable contributors to visual openness. This is a simplifying assumption: dense vegetation can itself reduce sky visibility and perceived visual depth, so a view that is high in greenery but low in sky visibility receives the same SOI as one with the reverse composition, even though the two are not necessarily equivalent in perceptual or restorative effect. Geometric openness (sky visibility) and natural content (greenery) are therefore conceptually distinct dimensions that the present single-valued SOI does not separate. A refined formulation could report a sky-visibility sub-index and a greenery sub-index alongside the combined measure, or weight the two components independently once empirical data justify a specific weighting; this is identified as a priority for future development of the index, alongside the related SPI weighting issue discussed next.
It should also be noted that, under the specific weighting scheme adopted for SPI (ws = wg = 0.4), SPI is not mathematically independent of SOI: substituting B = 1 − SOI into Eq. (1) gives SPI = 0.4(S+G) − 0.2(1−SOI) = 0.6·SOI − 0.2, so SPI is an exact linear transformation of SOI, and the two indices necessarily produce the same ranking of window views under the present calibration. This collapse is a direct algebraic consequence of assigning sky and greenery an equal weight; it is not a general property of the SPI formulation, and assigning sky and greenery independent, empirically differentiated weights, as already motivated above on separate conceptual grounds, would decouple the two indices, since SPI would then depend on the relative composition of S and G rather than solely on their sum. Until such differentiated, empirically calibrated weights are available, both indices are reported for interpretive clarity (SPI as the interpretable, literature-weighted perceptual score; SOI as its transparent, assumption-free geometric complement), while Section 4 explicitly flags that this mathematical redundancy must be resolved through empirical weight calibration before SPI can be considered to add independent information beyond SOI.
2.6.3. Skyline density index (SDI)
The SDI integrates volumetric building density with visual prominence by combining each building's effective storey count approximated as GFA/Base assuming a uniform floor-to-floor height of 3.0 m with its visible façade width and a depth-attenuation weight that reduces the visual contribution of distant volumes. The 3.0 m floor-to-floor height was adopted from the TABULA European building typology database [38] as a representative value for Italian and broader European residential stock and was applied uniformly to preserve consistency with the height-based classification developed in Section 2.2. GFA/Base was used in preference to a directly enumerated floor count because it is derived automatically from the same 3D-model and Indexz-plugin workflow (Section 2.3) used for every other morphological indicator in this study, ensuring internal methodological consistency; for the six buildings assessed here, the resulting GFA/Base values coincide exactly with the field-verified floor counts reported in Table 2, confirming that the approximation introduces no discrepancy for the present case study.
The skyline density index (SDI) is calculated using Eq. (3):
where (m) is the visible façade width of building i measured along the skyline. GFAi (m²) is the gross floor area of the building, and Basei (m²) is its ground-footprint area. The ratio
Table 2
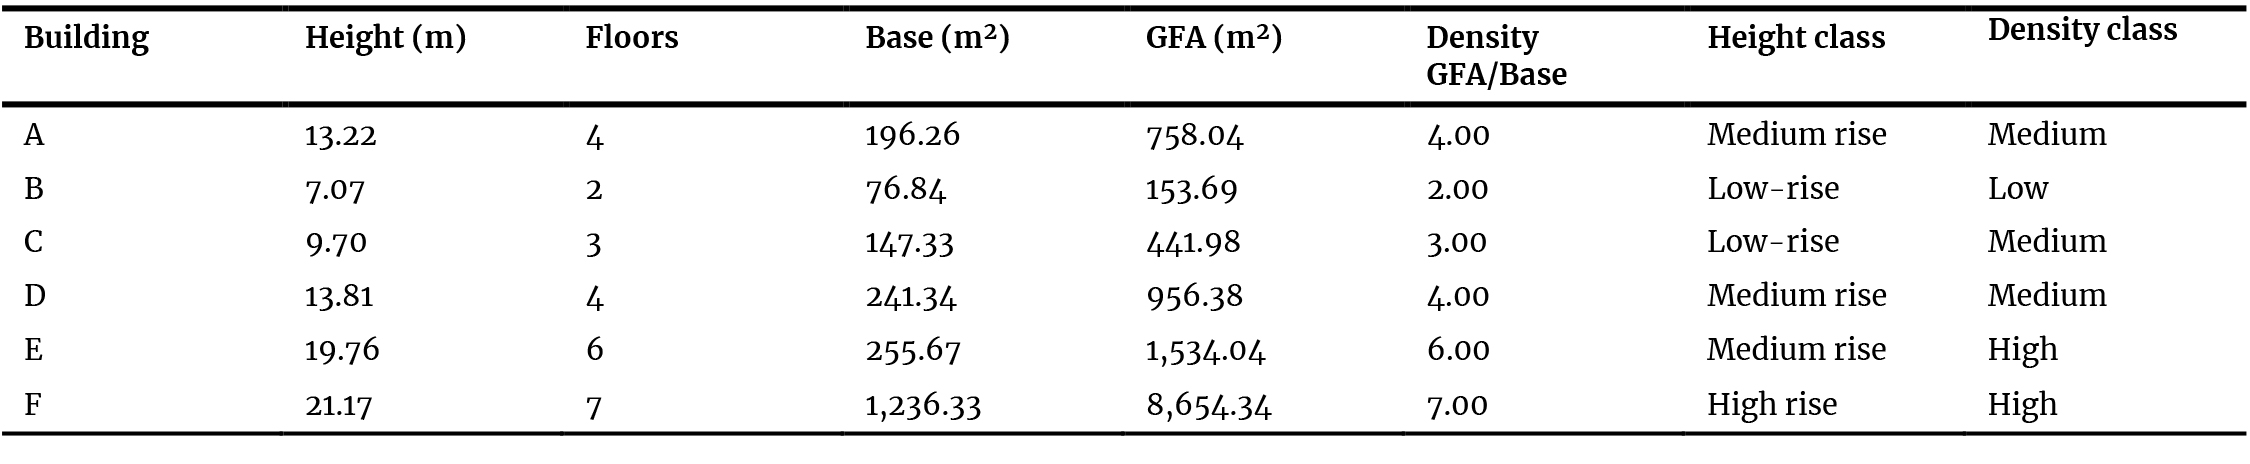
Table 2. Morphological characteristics of Buildings A–F.
When
The numerator sums the contribution of each building by combining its visible façade width, effective number of storeys, and depth weight, while the denominator represents the total depth-weighted visible façade width and is used to normalize the result. Consequently, the SDI represents the weighted average vertical density of the visible skyline rather than a simple count of buildings. Buildings that are taller and occupy a larger visible portion of the skyline contribute more strongly, whereas buildings located farther from the viewpoint or partially obscured contribute proportionally less. Therefore, a single SDI value provides a compact quantitative measure of skyline density for a given view. Façade width is expressed in linear metres rather than as an angular or solid-angle measure because all six buildings were evaluated from a single fixed observation point. Although this representation is appropriate for the present case study, it does not fully normalize view-geometry effects when comparing buildings at different distances or across multiple observation points. Future applications of the framework should therefore consider angular or solid-angle formulations together with a continuous distance-based attenuation function to replace the current two-tier depth-weight coefficient. For comparison with the pixel-based façade-fill method, SDI values were classified into three density categories: Low (SDI 3, corresponding to approximately 45% built pixels), Medium (3 SDI 5, corresponding to approximately 45–60% built pixels), and High (SDI 5, corresponding to approximately 60% built pixels).
These class boundaries were set heuristically to align with the pixel-based density thresholds defined in Section 2.3, rather than through formal calibration or quantitative error analysis, and their generalisability beyond the present case study has not yet been established; this is identified as a priority for future validation (Section 4). The two-tier δ values were assigned categorically according to each building's row position (front or back), as established through field verification and the 3D model (Section 2.7), rather than computed from a continuous function of distance. This provides a simple, transparent, and reproducible approximation appropriate to the two-row spatial arrangement of the present case study, at the cost of the finer distance sensitivity that a continuous formulation would offer, as already noted above. In addition to the angular or solid-angle reformulation already recommended above, projected façade area and directly measured visual obstruction (the fraction of each façade unobstructed by intervening structures, as opposed to its nominal width) are identified as further calibration variables that a future, empirically fitted version of the SDI should incorporate alongside viewing distance.
2.7. Simulation and 3D modelling
A 3D model of the study area was constructed in SketchUp using cartographic base data and field observations. The virtual camera was aligned with the actual window position, height, and orientation to reproduce real viewing conditions as closely as possible. In accordance with Stamps, Nasar, and Hanyu [40], this modelling step served as a preliminary validation measure for the skyline geometry and established the analytical basis for pixel-based content analysis. Recent research specifically examines how variations in simulation realism affect distance judgements in computer-generated urban scenes [46], underscoring the relevance of the modelling-fidelity considerations addressed in the present workflow and reinforcing the case for future validation of the simulated views against on-site photographic references (Section 4). Buildings A–D constitute the front row of the observed skyline composition; Buildings E–F form a second, more distant row. Their respective positions and heights were verified against field measurements and are reflected in the depth-weighting parameter δ used in Eq. (3). The 3D model represents a single, static set of environmental conditions clear-sky daylight and a summer-season vegetative canopy and does not capture the variability introduced by cloud cover, overcast conditions, or seasonal foliage change. Consequently, the sky, greenery, and built-mass proportions reported in this study should be read as representative of these baseline modelling conditions rather than as an all-season or all-weather average; Section 4 identifies robustness testing across weather, lighting, and seasonal conditions as a specific priority for future work. This priority is reinforced by evidence that the desirability of skyline views is itself sensitive to lighting conditions, varying systematically between daytime and after-dark viewing [47], a dimension the present clear-sky, daytime-only model does not capture. The resulting 3D model of the Aversa study area is shown in Figure 9.
Figure 9
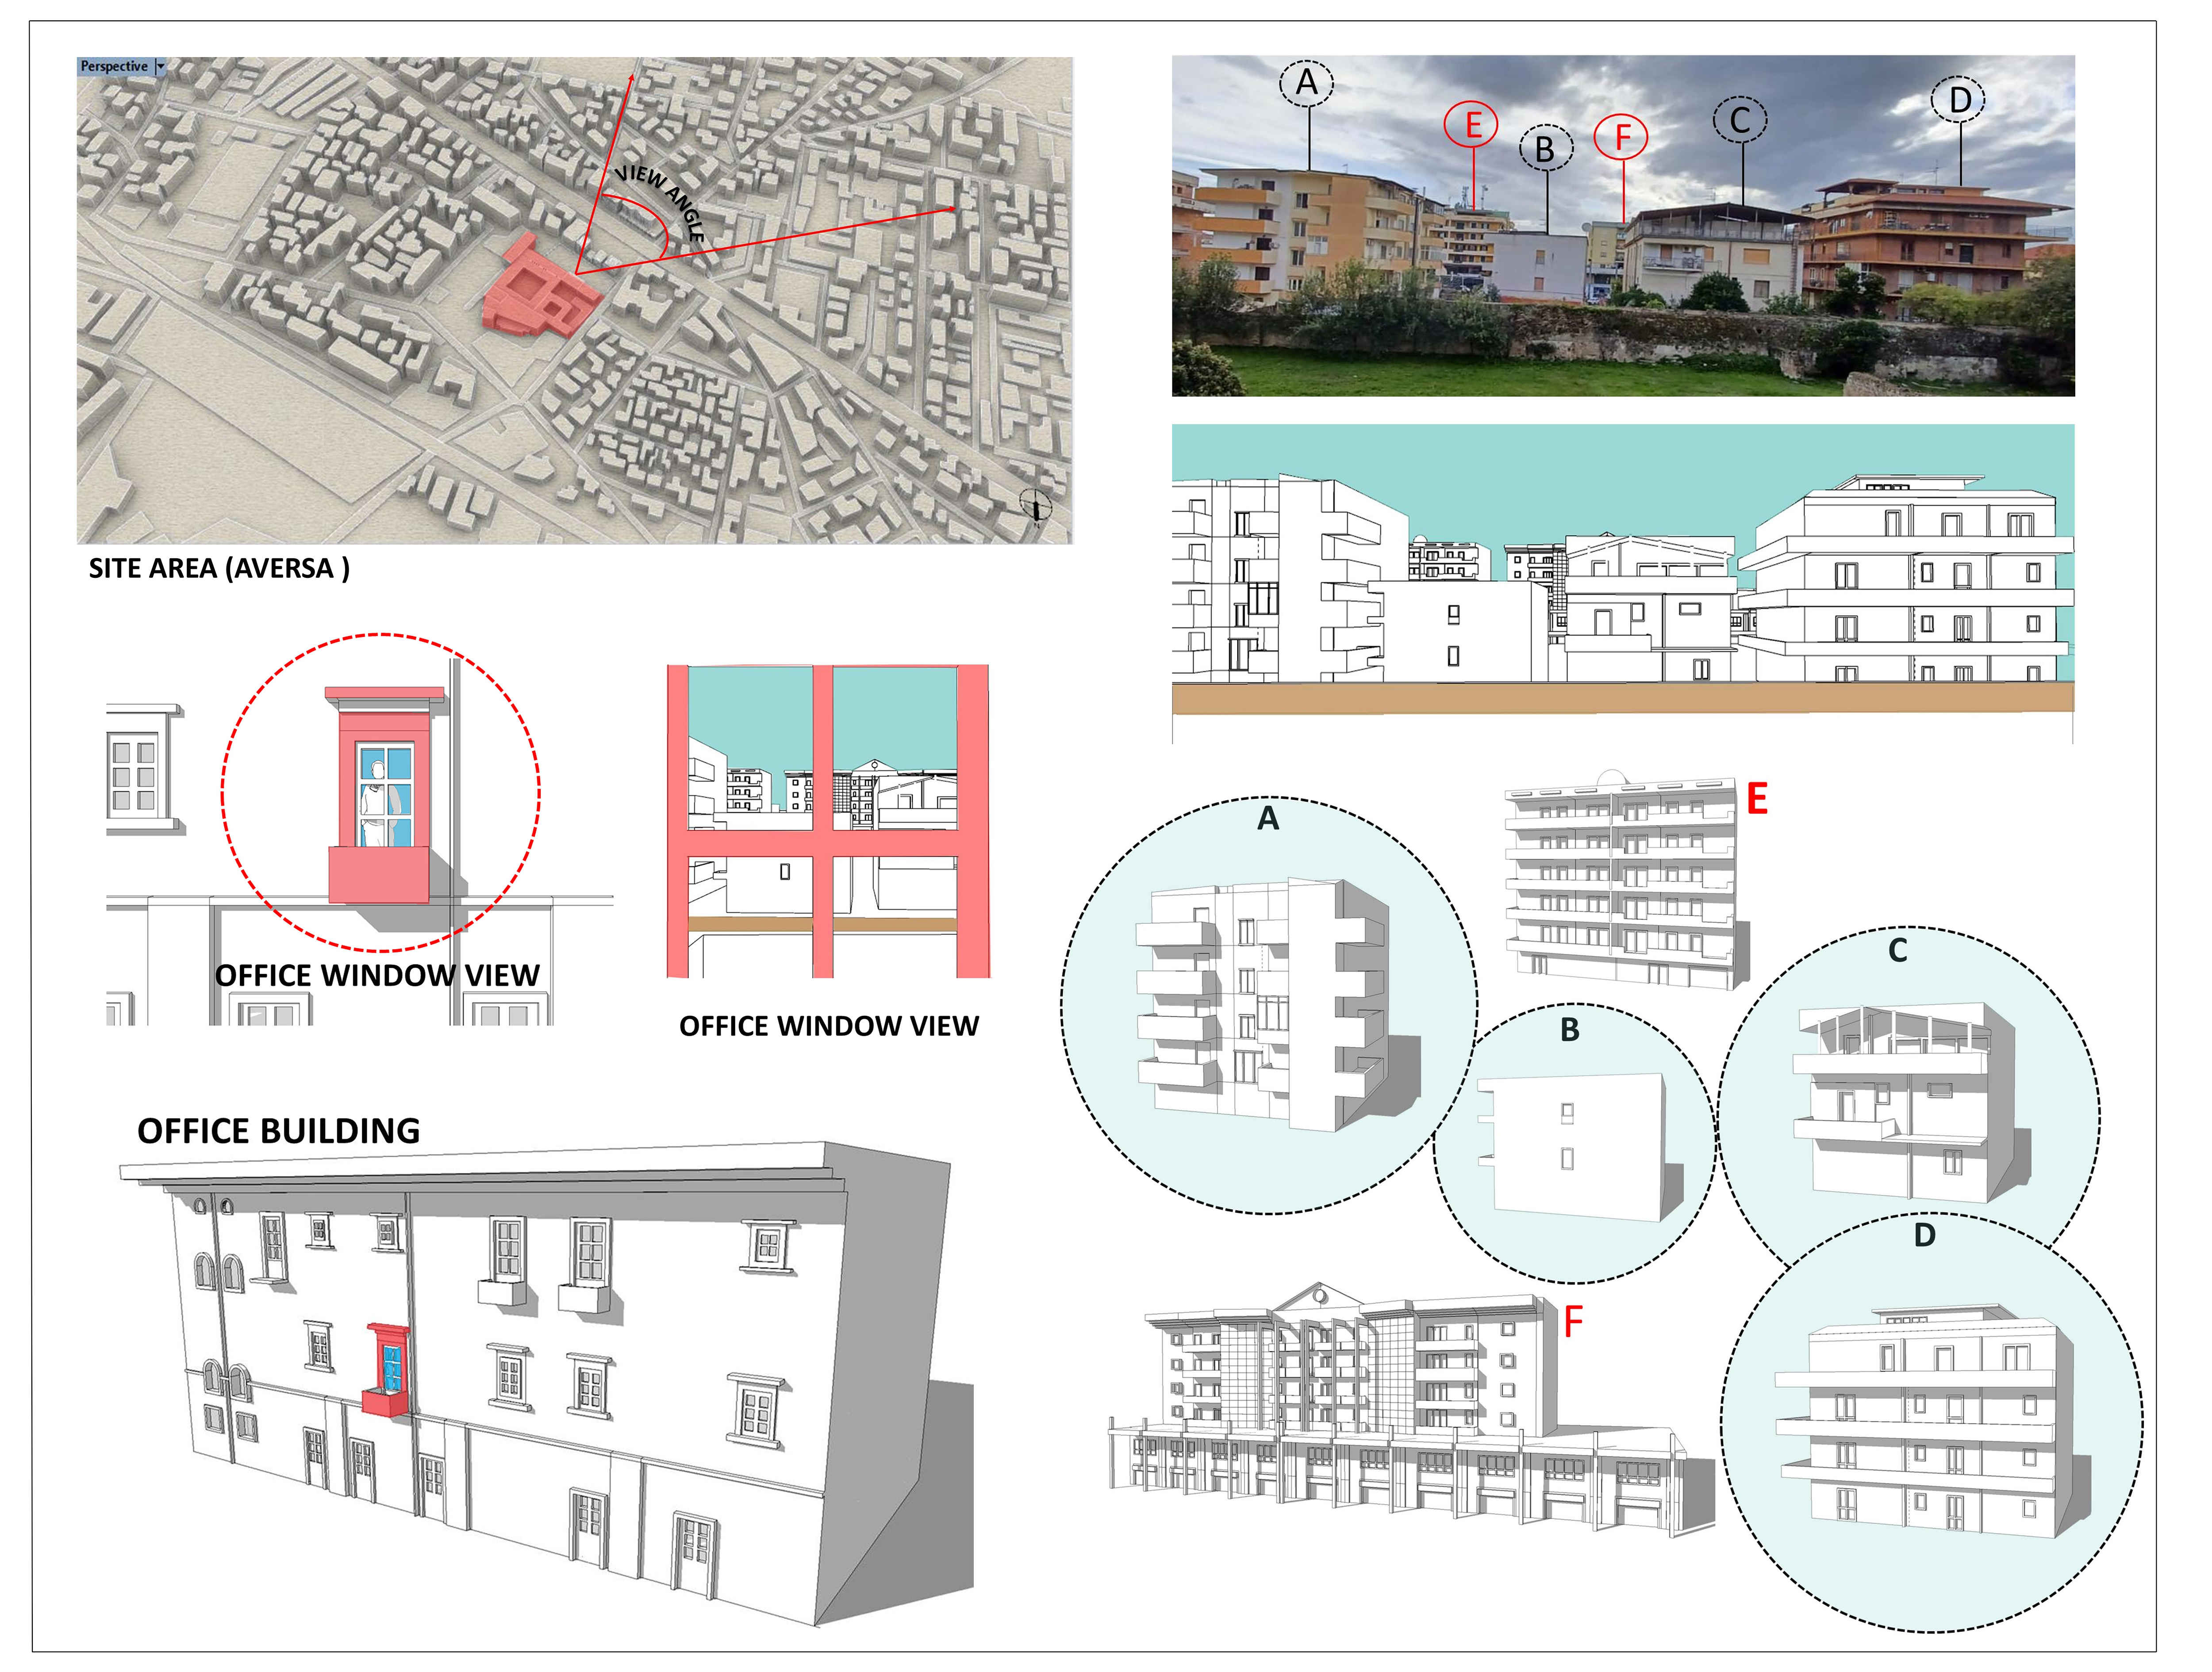
Fig. 9. 3D model of the study area in SketchUp.
2.8. Reference room and observation frame
A south-facing office within the Department of Architecture (University of Campania) was selected as the reference room. The room is equipped with a centrally positioned window providing an unobstructed view of the skyline. Its spatial characteristics window dimensions, sill height, and room depth were incorporated into the 3D model to ensure accurate correspondence between the simulated and real visual fields. The room serves as a fixed observation frame: the window defines the viewing angle and the near-field boundary of the visual field, while the skyline beyond constitutes the primary content of the view. This approach follows established practice in skyline evaluation research [12,40,48] and connects interior observational conditions to the broader urban landscape through line-of-sight and transition analysis [40]. To clarify the experimental design: the south, west, and east views reported in Section 3 are not three separate physical windows or additional observation points, but virtual camera rotations executed within the same 3D model about the single, fixed reference observation point described above; the observation point, room geometry, and window position remain constant, while the viewing direction is rotated to face the corresponding cardinal orientation.
This design holds the observation point constant while allowing the composition of visible urban content to vary with viewing direction, but it also means that the orientation effect and the effect of differing urban content or skyline morphology are confounded in the present single-point design: rotating the camera necessarily changes which buildings and skyline segments are visible, so the reported differences between orientations cannot be attributed to orientation alone, independent of the specific urban morphology that happens to lie in each viewing direction. Disentangling these two effects would require multiple, morphologically matched observation points, which is identified as a specific direction for future work in Section 4. The reference-room simulation and fixed observation frame are illustrated in Figure 10.
Figure 10
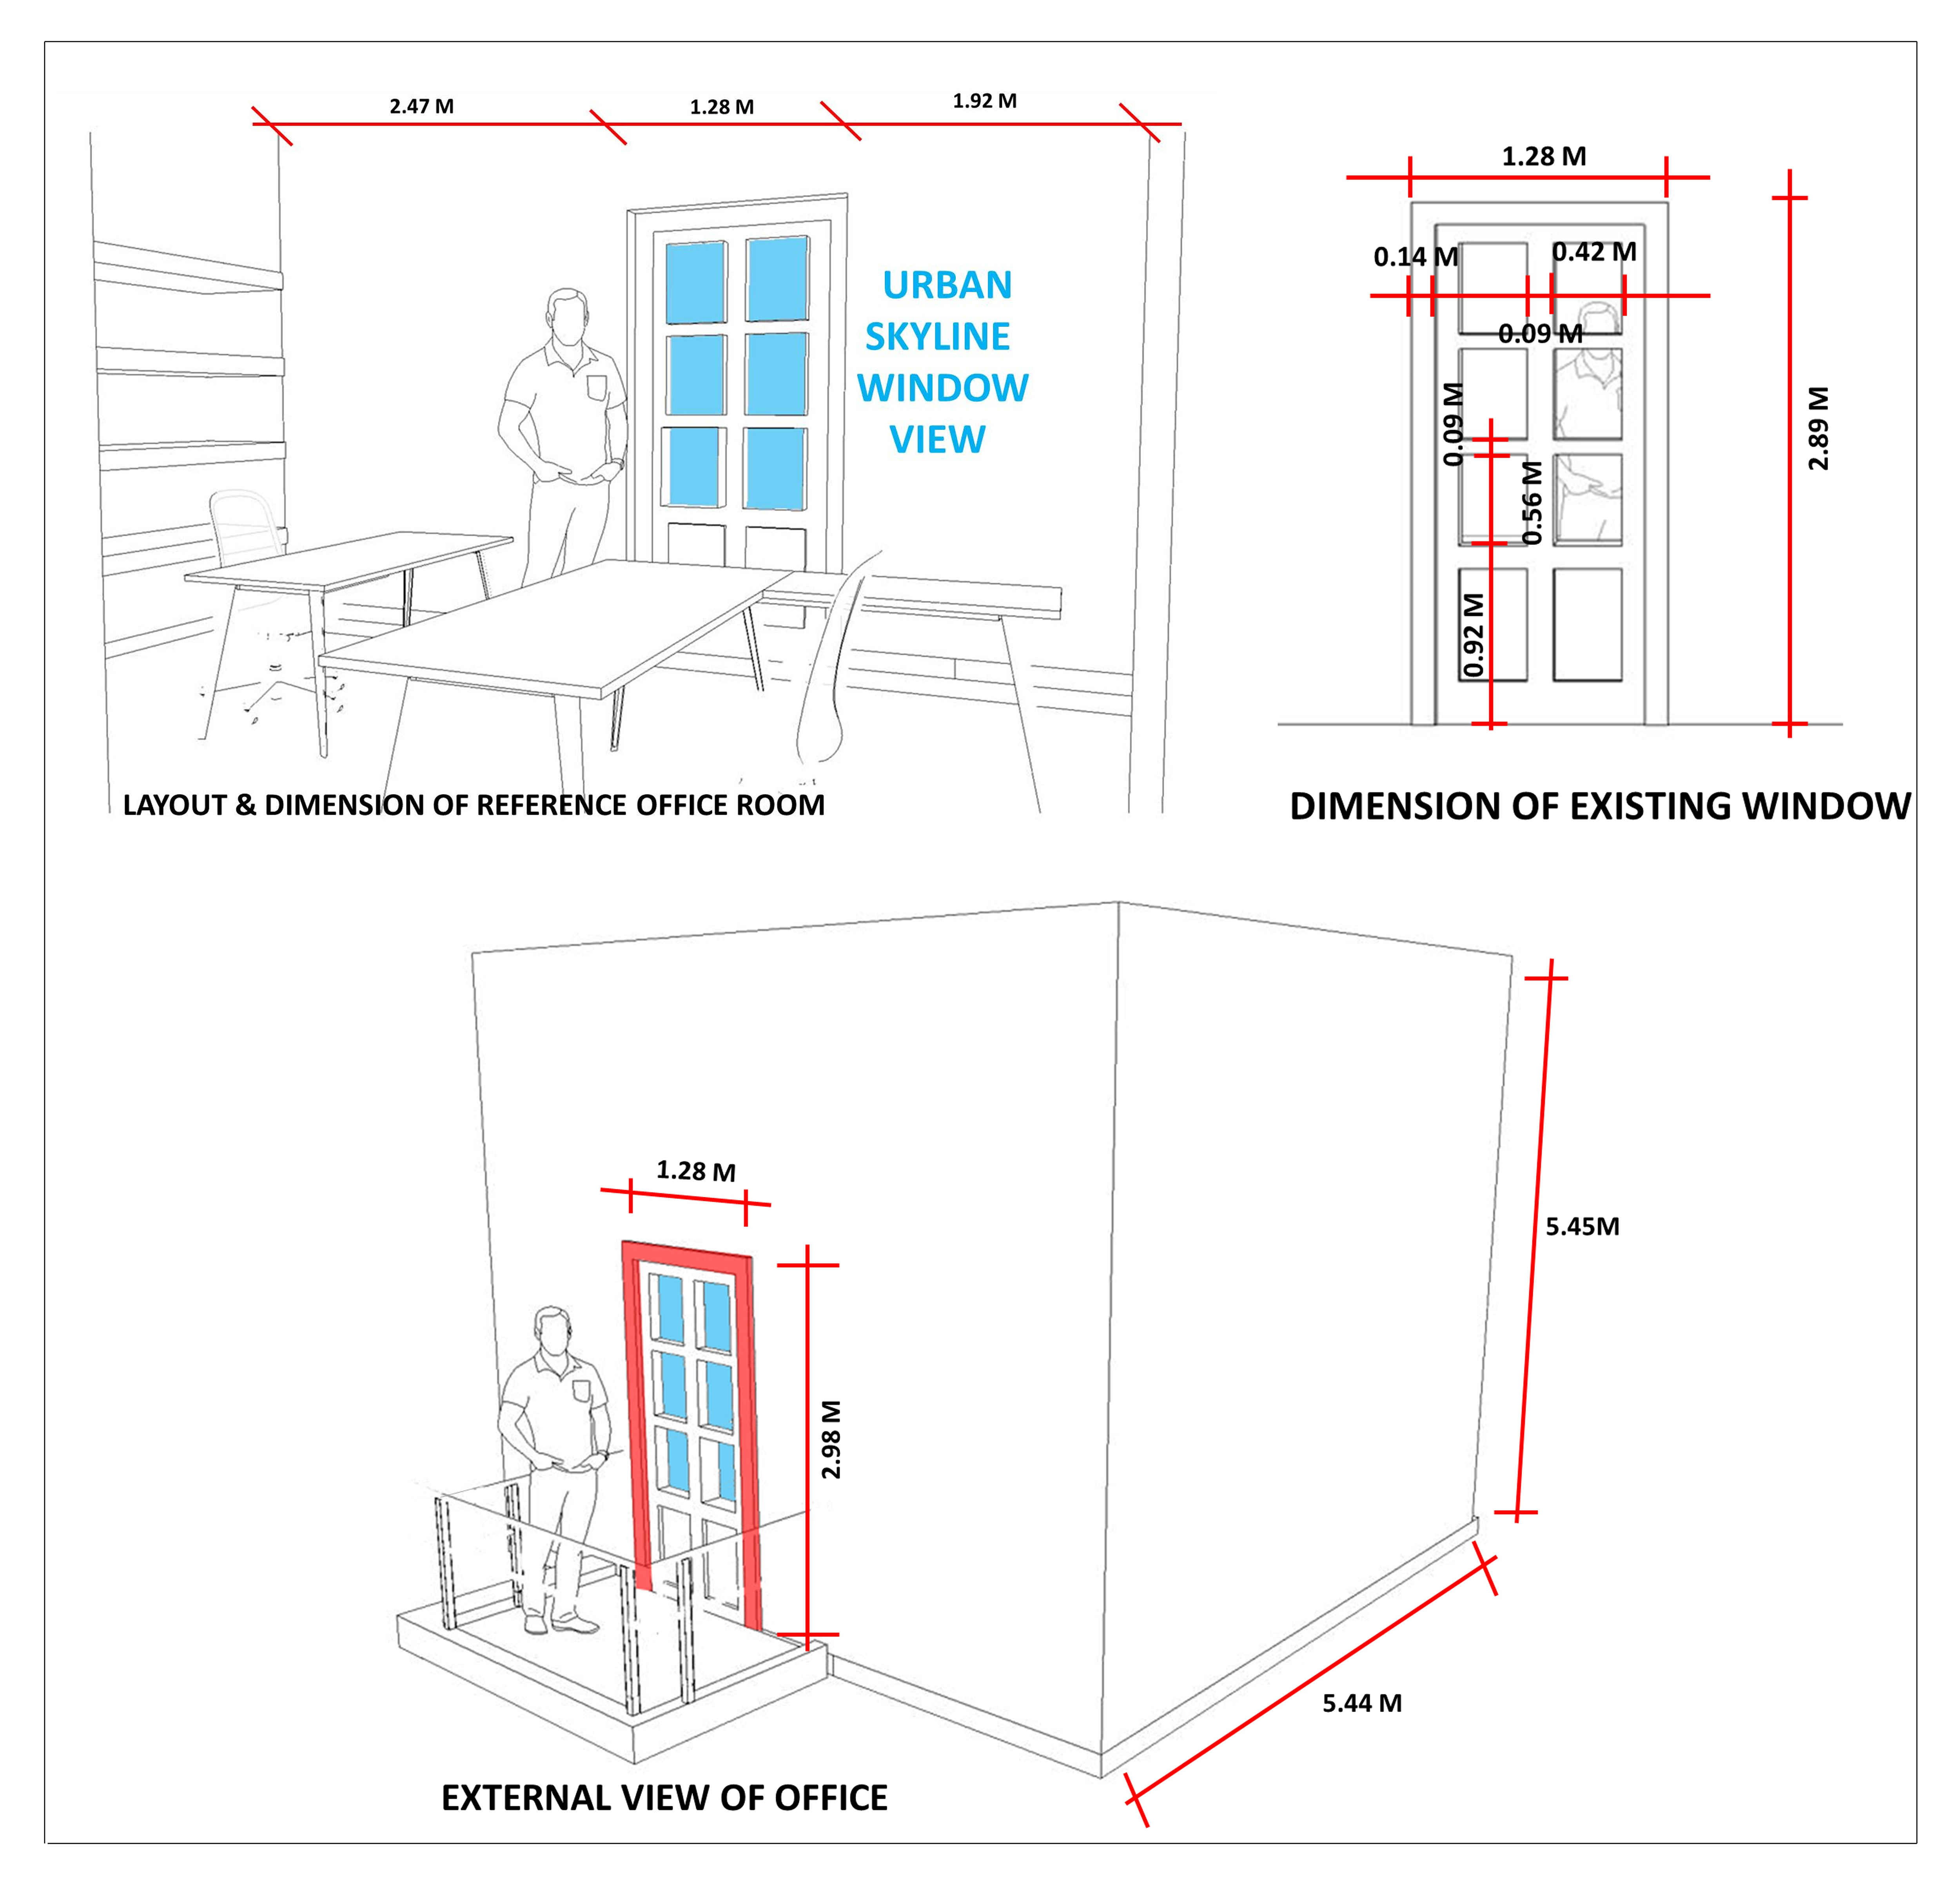
Fig. 10. Reference room simulation.
3. Results
3.1. Urban morphology: buildings A-F
Morphological analysis of Buildings A–F, combining field observations with SketchUp/Indexz outputs, established the quantitative basis for subsequent perceptual assessment. Results are summarised in Table 2. The two tallest structures Building F (21.17 m, 7 floors, GFA/Base = 7.00) and Building E (19.76 m, 6 floors, GFA/Base = 6.00) exhibit the highest volumetric density ratios and accordingly constitute the dominant visual elements within the skyline composition, contributing disproportionately to the reduction of perceived openness.
Buildings A (13.22 m) and D (13.81 m) form a mid-rise group that moderately influences skyline openness while maintaining lower visual dominance than Buildings E and F. Building C (9.70 m) functions as a transitional mass between the low-rise and mid-rise frontages, while Building B (7.07 m) with the lowest volumetric density ratio (GFA/Base = 2.00) preserves visual gaps and contributes to skyline continuity. The labelled configuration of Buildings A–F within the office window view is shown in Figure 11.
Figure 11
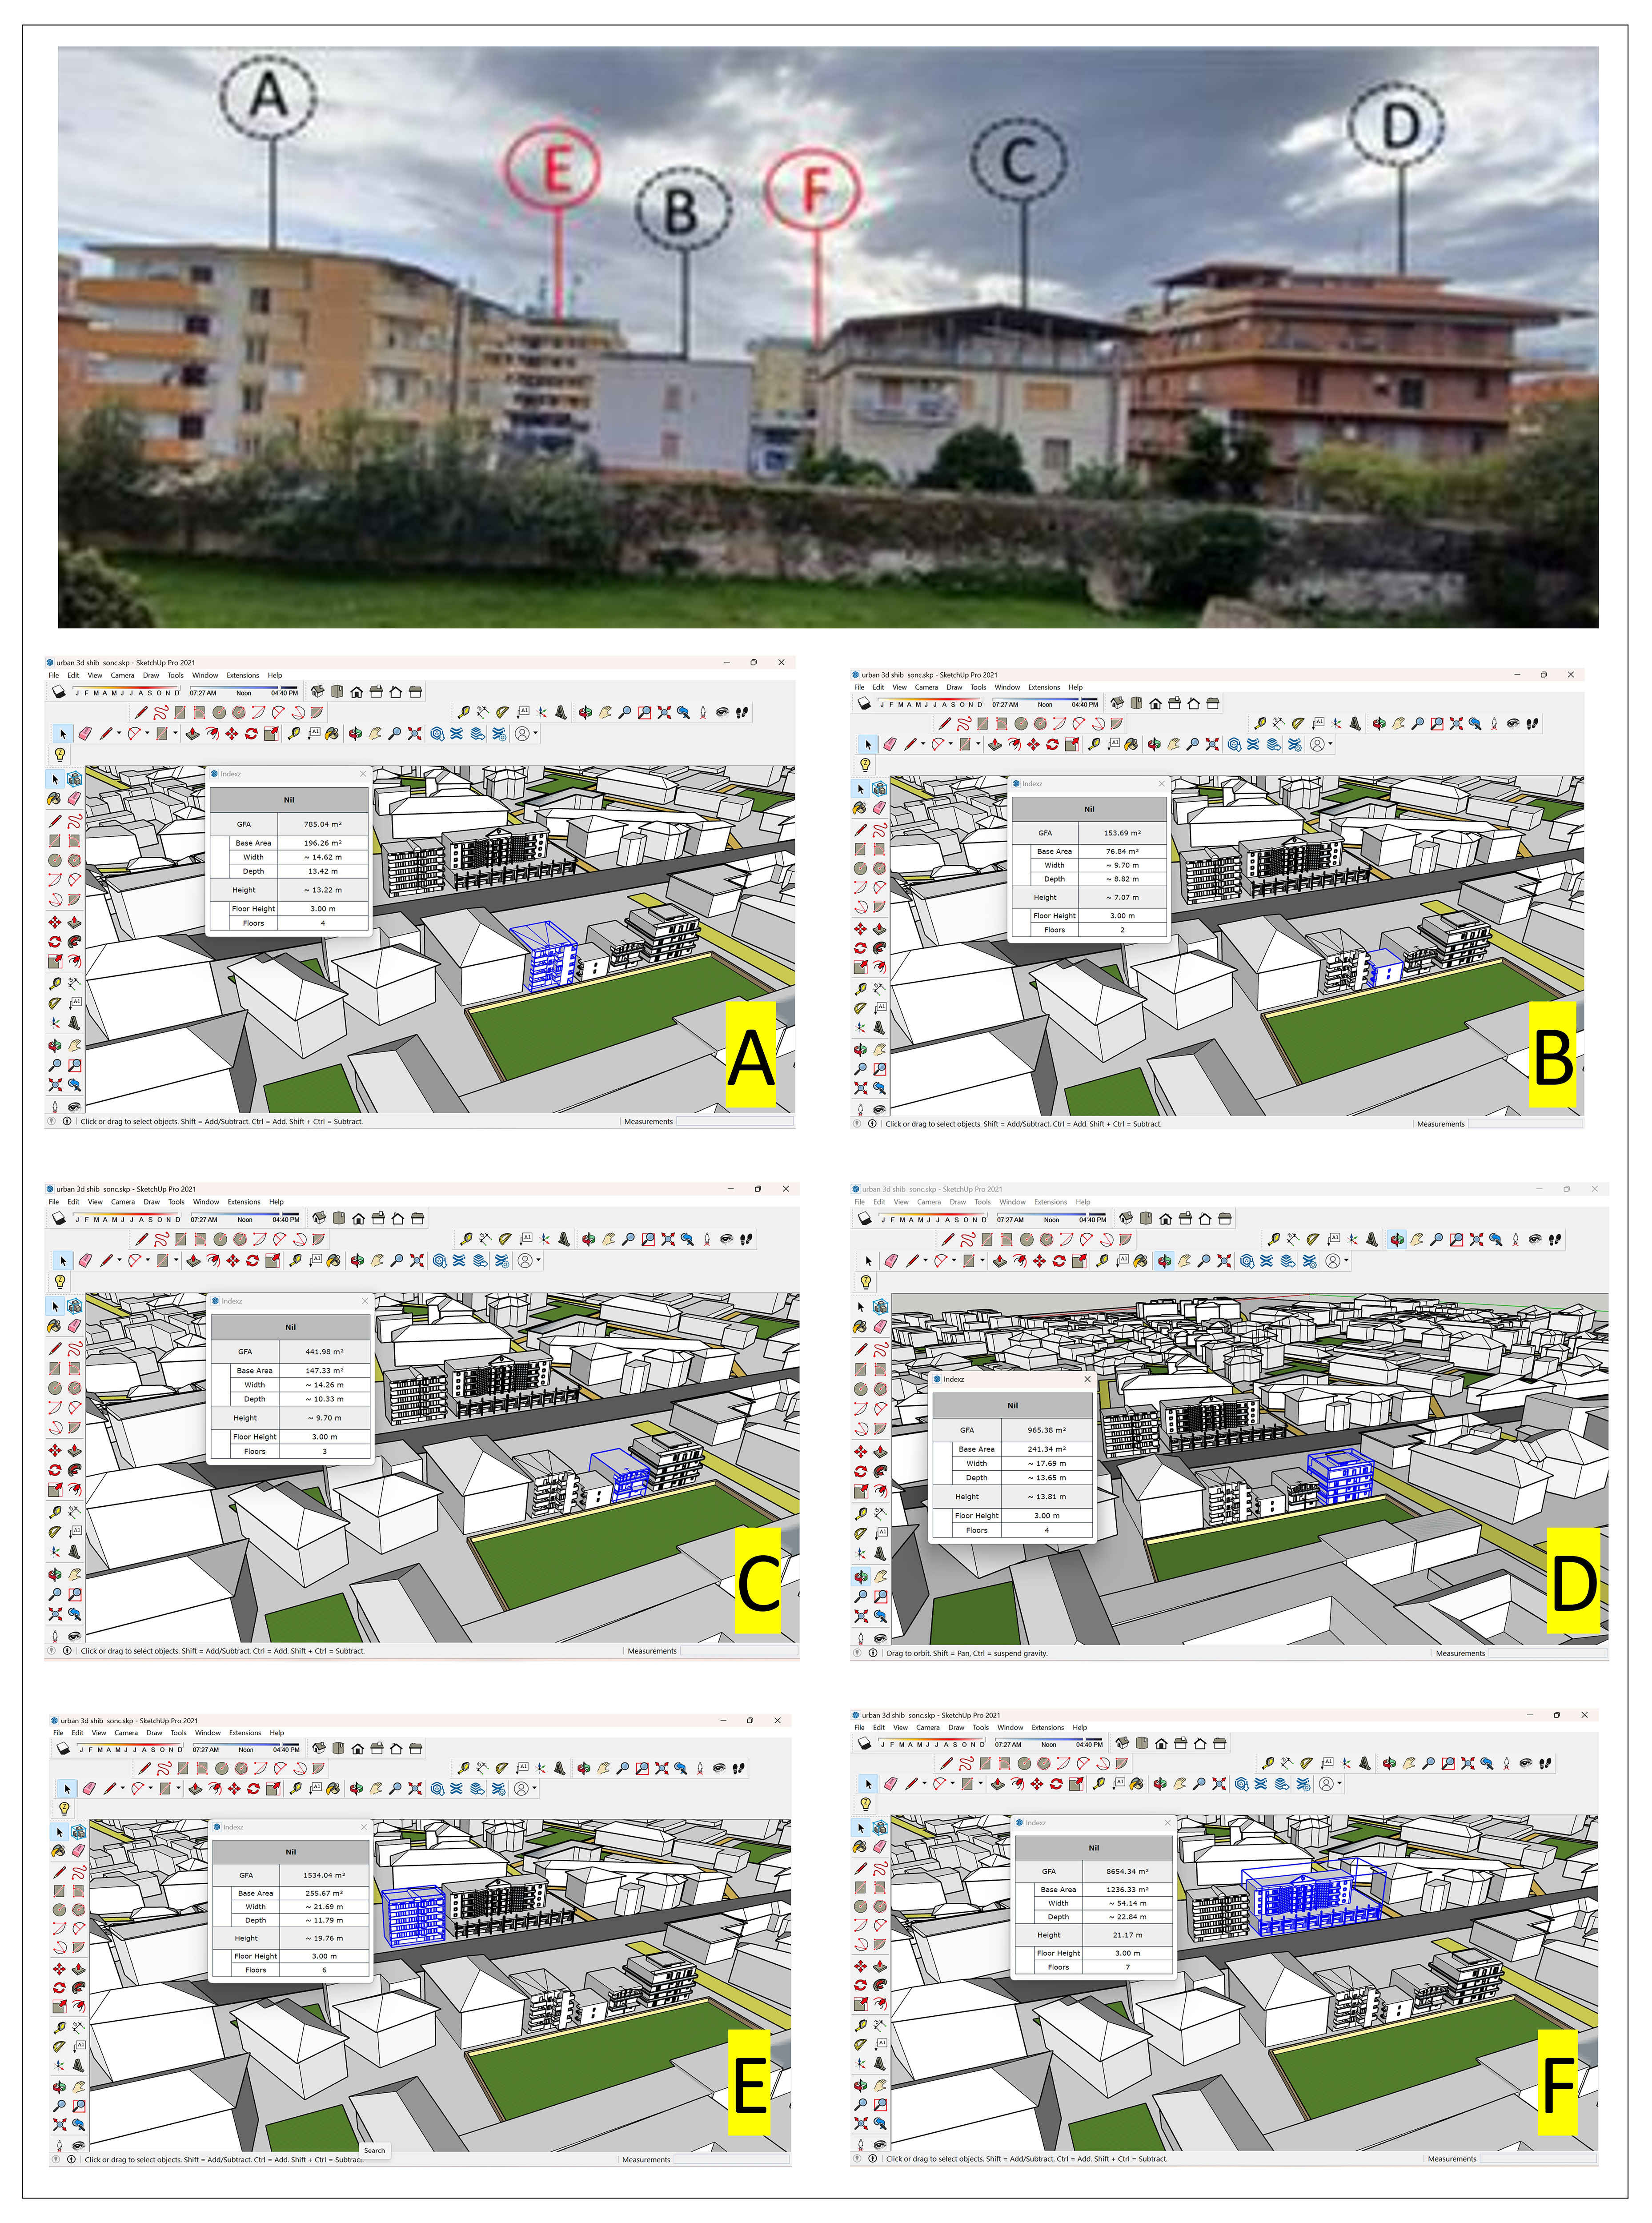
Fig. 11. Office window view of the study area with labelled buildings A–F.
3.1.1. Skyline density index: buildings A-F
To complement the areal pixel-based density measure with a volumetric indicator, the SDI was computed for the six buildings visible in Figure 11 using the Indexz-derived data presented in Table 2. Three scenarios were evaluated:
- Front row only (Buildings A–D): SDI 40 Medium density, confirming that the low-rise and mid-rise frontage produces a visually permeable composition.
- All buildings without depth weighting (A–F): SDI = 5.30 High density, reflecting the strong visual influence of the taller background volumes.
- All buildings with depth weighting (E, F: = 0.5): SDI = 4.74 Upper-medium density, representing the attenuated visual contribution of the back-row volumes at their actual viewing distance.
These SDI values align closely with pixel-based results for the same view: south-and west-facing façades show low density (approximately 25-26 built pixels), whereas the east-facing façade reaches medium density (approximately 50 ). After applying depth attenuation, the SDI converges with image-derived measures and accurately captures the visual dominance of Buildings F and E while reflecting the moderating contribution of the lower front-row buildings (A-D).
3.2. Synthetic indices: SPI and SOI by orientation
SPI and SOI values were computed for the south-, west-, and east-facing simulated window views using the pixel proportions obtained from SAM segmentation. Results are presented in Table 3.
Table 3

Table 3. View composition and synthetic indices for south, west, and east orientations.
South-facing views (SPI = 0.245; SOI = 0.742) exhibit a balanced composition in which greenery constitutes the largest single class (39.2%), complemented by a wide sky fraction (35.0%) and relatively restricted built mass (25.8%), characteristic of a semi-open, concave skyline. West-facing views achieve the highest index values (SPI = 0.251; SOI = 0.752), with a similar compositional balance slightly larger sky fraction and correspondingly smaller built-mass contribution – confirming superior visual openness. East-facing views record markedly lower scores (SPI = 0.101; SOI = 0.502), driven by a near-50% built-mass fraction and the lowest sky proportion (21.2%) of the three orientations, consistent with the flat, obstructed skyline profile identified in the morphological analysis.
The contrast between the south/west and east orientations demonstrates that the indices are sensitive to compositional differences arising from skyline geometry and window orientation. Because SPI is a linear function of SOI under the present weighting (Section 2.6.2), this contrast is reported once by two related metrics rather than as two independent confirmations. The gap between east-facing SPI (0.101) and south/west SPI values (~0.25) is substantial, indicating that the obstructed flat skyline in the east view produces substantially weaker perceptual performance across all weighting assumptions.
3.3. Building-level perceptual analysis
Table 4 summarizes the building-level influence of each structure on SPI and SOI values, derived from a combination of morphological analysis (height, GFA/Base ratio, SDI contribution) and segmentation results.
Table 4
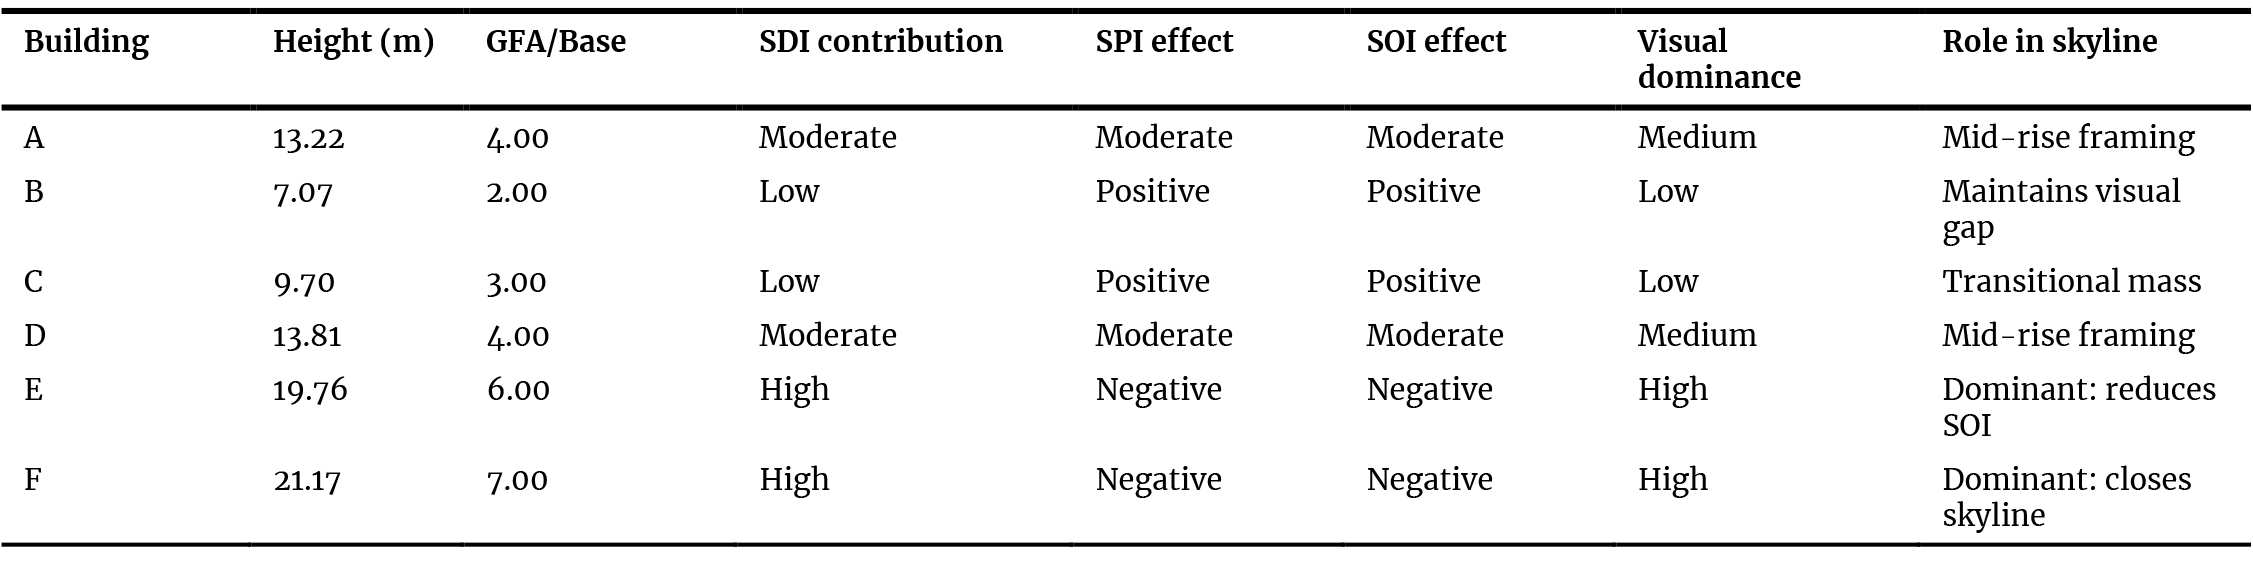
Table 4. Building-level perceptual impact on SPI and SOI.
Buildings E and F exert the strongest negative influence on both indices, given their greater height, higher volumetric density, and consequently greater occlusion of sky and greenery within the view field. In contrast, Buildings B and C make a positive contribution to perceptual quality by maintaining visual gaps and preserving skyline continuity. These findings confirm that height and volumetric density (GFA/Base) are the primary morphological drivers of skyline variation at the building level, consistent with the synthetic SDI analysis presented in Section 3.1.1. We clarify that the SPI/SOI effect classifications reported in Table 4 (Positive/Moderate/Negative) are qualitative assessments obtained by ranking each building's height, GFA/Base ratio, and SDI contribution and cross-checking this ranking against the segmentation results, rather than the output of a formal quantitative method. A more rigorous approach, such as recalculating SPI and SOI after computationally removing each building in turn from the segmented view and observing the resulting change in each index, was not performed in the present proof-of-concept and is identified as a specific priority for future refinement of the building-level analysis.
3.4. View segmentation results: south, west, and east orientations
Visual content analysis of the three simulated window views yielded the compositional profiles summarized in Table 3 and illustrated in Figure 12 and Figure 13. The south-facing view (35.0% sky, 39.2% greenery, 25.8% built mass) and the west-facing view (37.1% sky, 38.1% greenery, 24.8% built mass) display closely similar compositions, reflecting comparable skyline geometry in these two orientations. Both exhibit semi-open, concave skyline profiles consistent with the qualitative assessment conducted in Section 2.4.
Figure 12
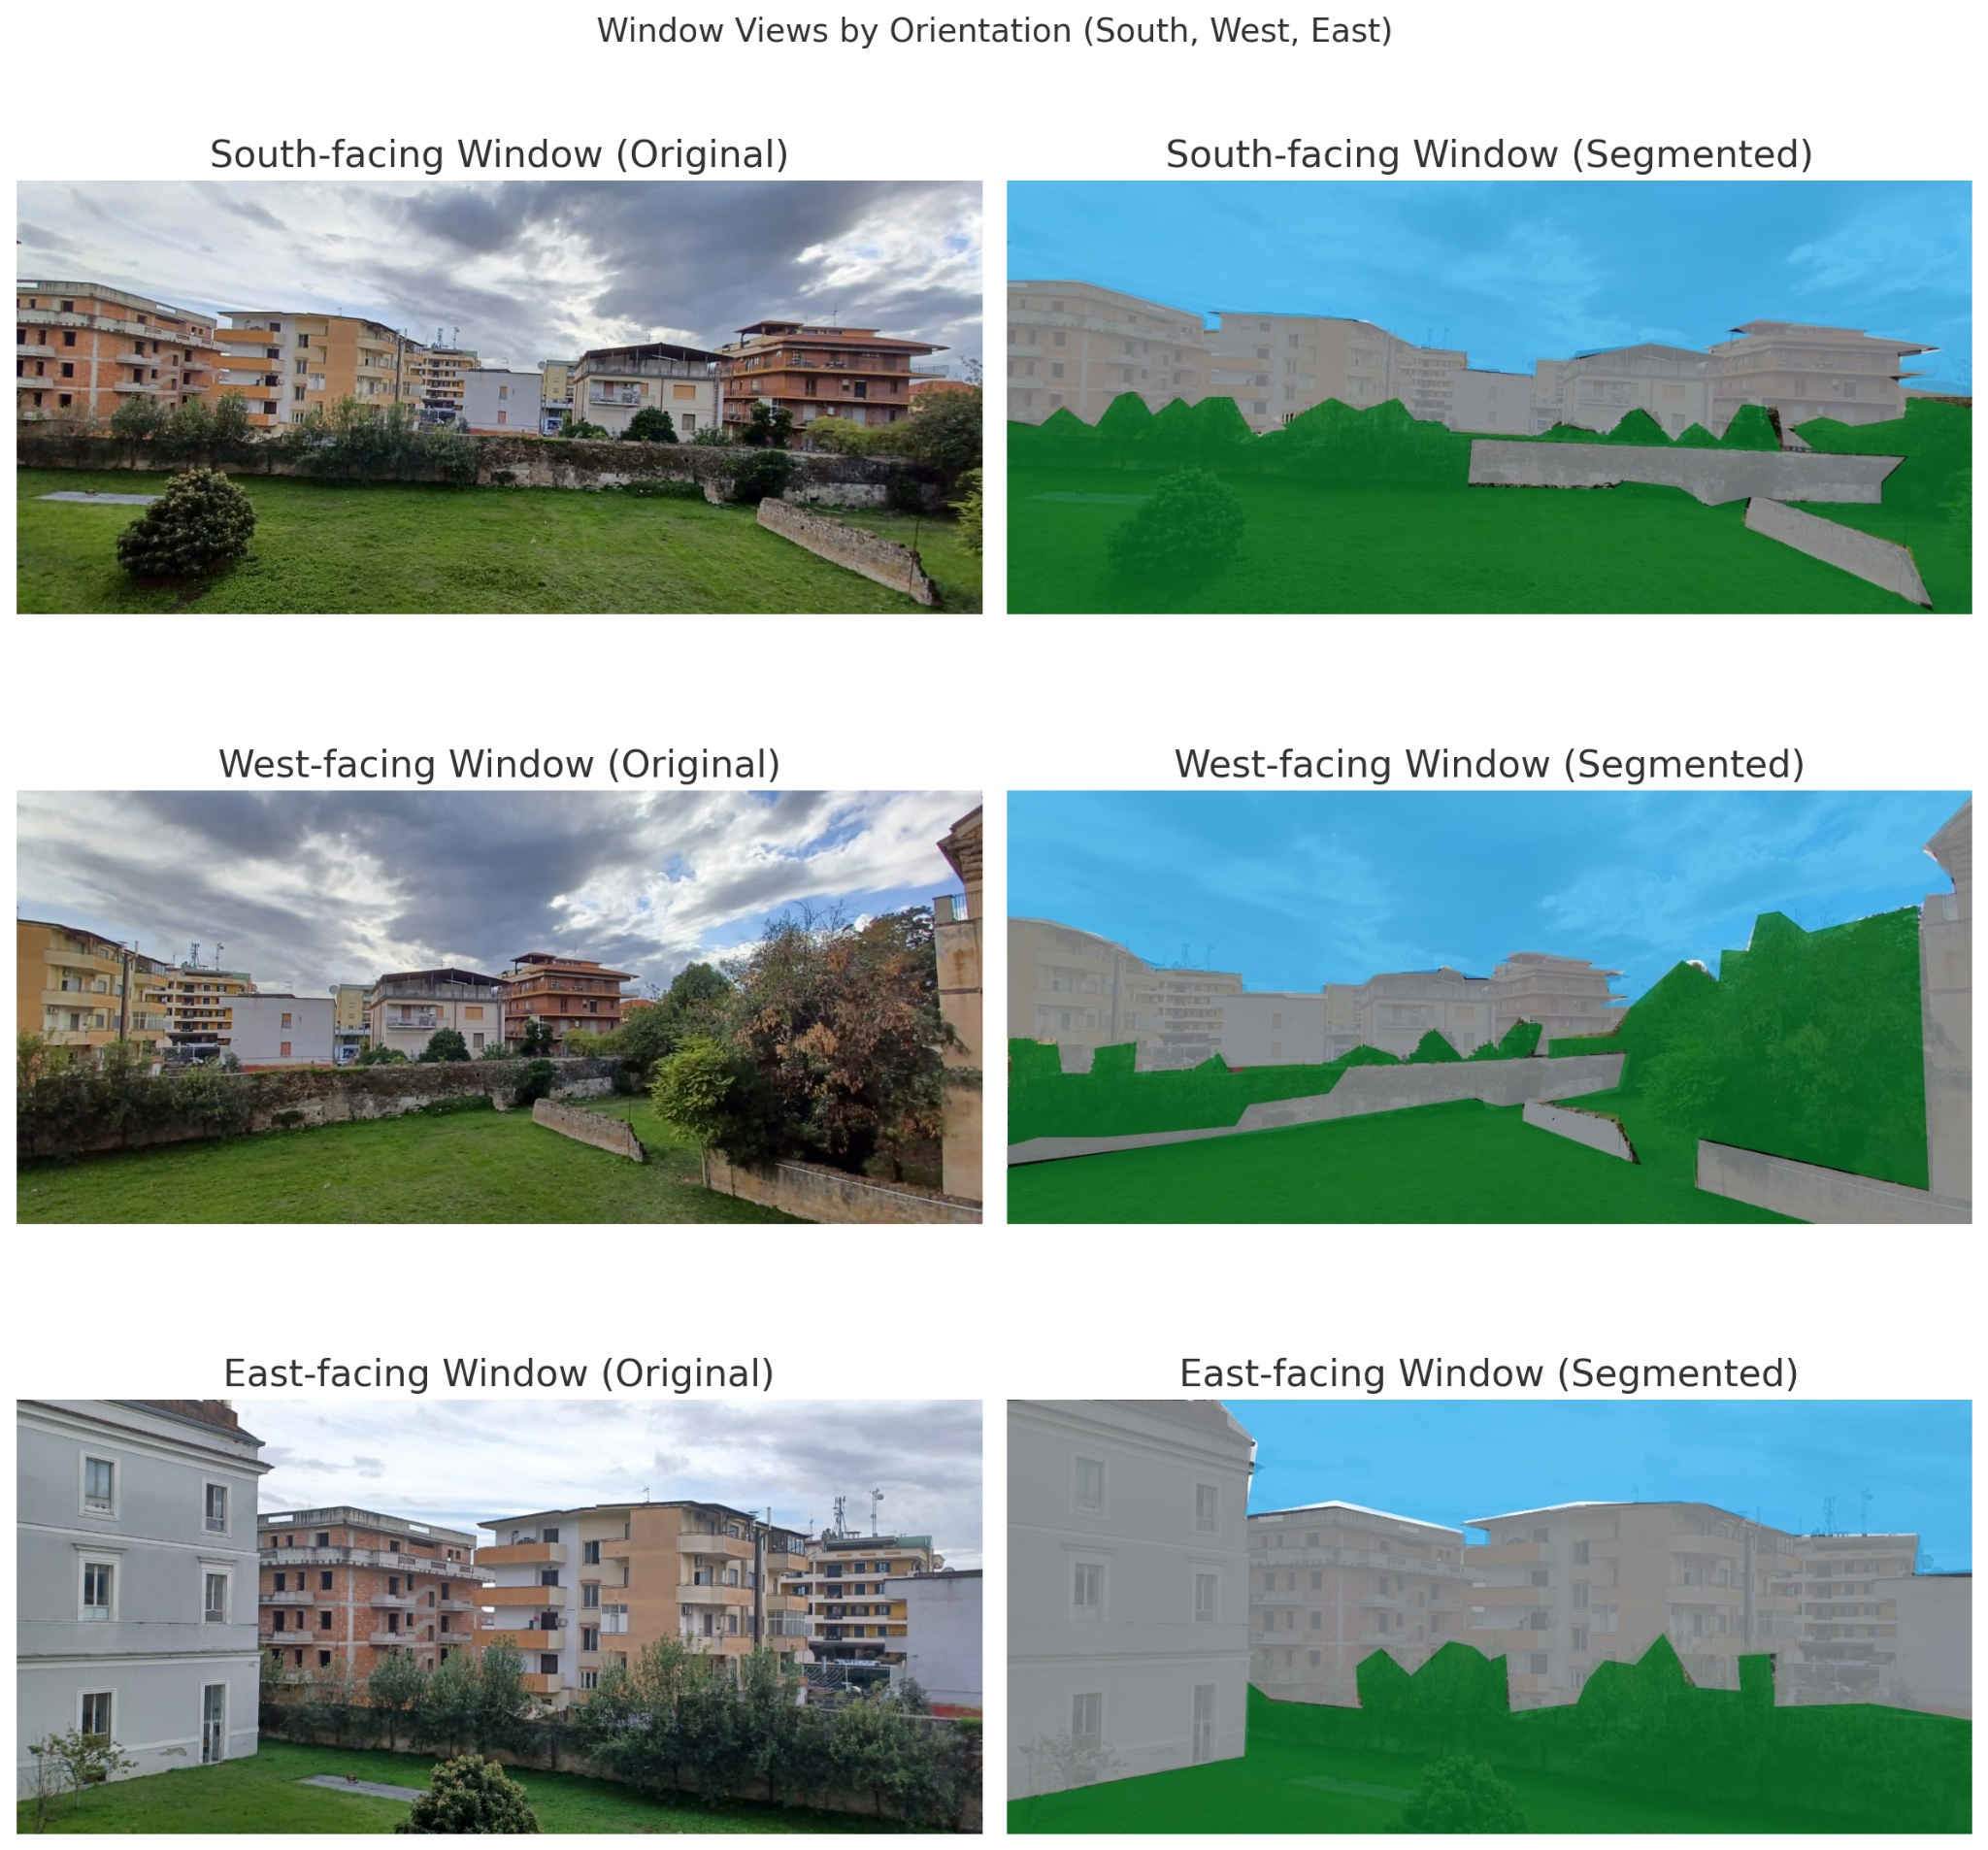
Fig. 12. Original simulated window views for south, west, and east orientations.
Figure 13
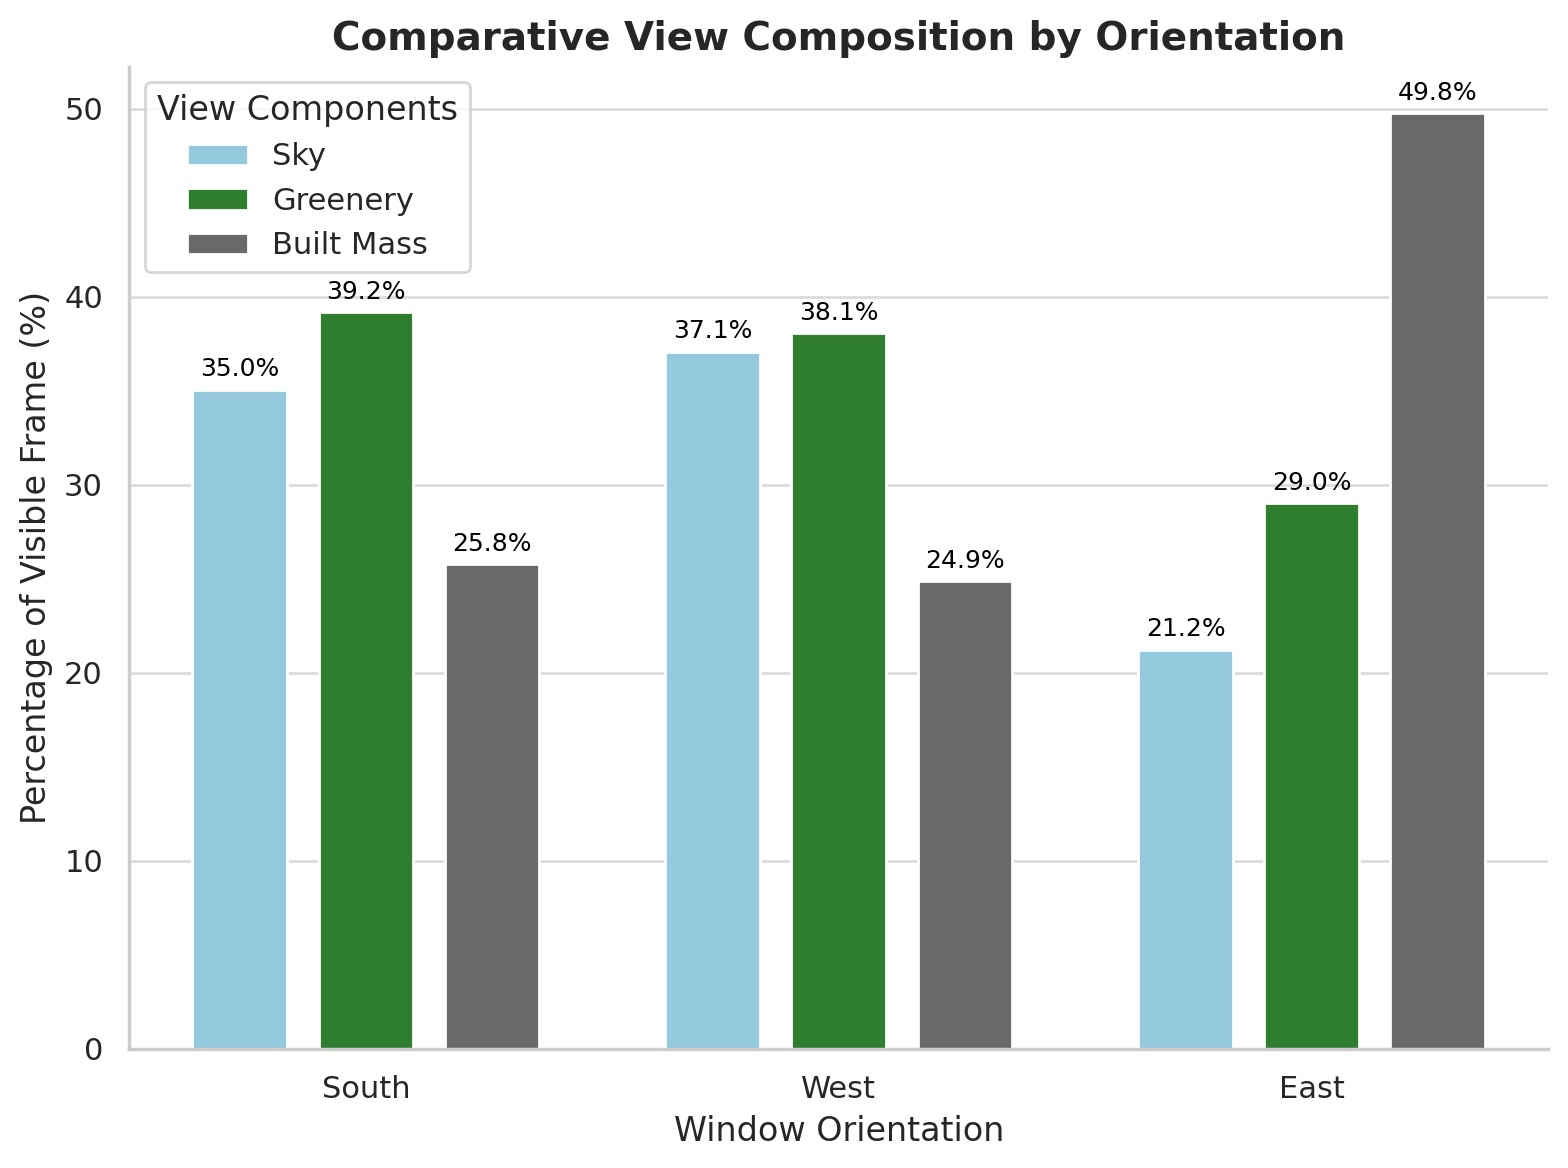
Fig. 13. SAM segmentation results: sky, greenery, and built mass for all three orientations.
The east-facing view, by contrast, shows a markedly different composition: sky (21.2%) and greenery (29.0%) are substantially reduced while built mass (49.8%) approaches a majority of the total view field, producing the flat, obstructed skyline profile identified in the morphological analysis.
The segmentation was performed using SAM with single-click prompts per class region. The model produced accurate and visually consistent class boundaries across all three views, confirming its suitability for this application. Pixel proportions were extracted directly from the segmented masks without post-processing filters. The results indicate that even modest differences in window orientation in this case a 90° rotation from south to east can generate substantial variations in view composition, with the built-mass fraction increasing by approximately 24 percentage points and the SOI declining from 0.742 to 0.502.
3.5. Economic outcomes: hedonic perspective
The perceptual and morphological findings were translated into indicative economic outcomes through a hedonic pricing lens. The applied coefficients were adapted from established empirical studies [19,21,44,49], which report positive hedonic effects of greenery and sky access and negative effects of urban enclosure. To ensure contextual validity, coefficients were recalibrated for local market conditions and incorporated into a semi-logarithmic hedonic price model controlling for dwelling size, construction period, and location. The following indicative associations are reported:
- A 20 percentage-point increase in visible greenery may be associated with an estimated 5% rise in property value.
- Semi-open views may command approximately 4–5% higher prices than fully obstructed or enclosed views.
- Concave skyline profiles appear to yield approximately 3% higher values relative to flat or fragmented profiles.
- When urban enclosure exceeds 50% built mass, a price penalty of approximately 6% may be observed.
It is important to emphasise that these values are indicative rather than prescriptive. The analysis draws on adapted literature coefficients and a single case study; the figures are presented to illustrate the hedonic framework's potential rather than to establish locally calibrated market premiums. Direct transaction-level validation remains a priority for future research.
3.5.1. Application to Aversa
Market data for Aversa were sourced from Immobiliare.it [50] and cross-validated against Idealista.it [51] and OMI (Osservatorio del Mercato Immobiliare) reports to ensure internal consistency. In September 2025, the average selling price for residential property in Aversa was approximately €1,885/m², representing an increase of 3.5–7% relative to September 2024 and a cumulative recovery of approximately 45% from the 2018–2020 market trough (≈€1,300/m²). The average monthly rental price was €7.31/m², marginally above the Caserta provincial average of €7.19/m².
Analysis focused on a 400–500 m radius around the observation point (Via San Lorenzo, Viale Europa, Via Filippo Turati). Listings in this area indicate a local mean price range of €2,000–2,300/m², which modestly exceeds the citywide average (€1,885/m²), implying a local premium of approximately 5–7% associated with properties offering open skyline views and southern or western orientations.
Conversely, enclosed, and visually restricted zones particularly along Via Bisceglia and Via 4 Novembre exhibit price discounts of approximately 5–8% relative to the citywide mean. Properties overlooking semi-concave urban voids and green corridors reach prices up to €2,400/m², while units in dense, enclosed clusters with limited daylight access show prices of approximately €1,800/m². This price distribution aligns directionally with the morphological and perceptual patterns captured by SOI and SPI across the three orientations studied.
When compared with surrounding municipalities, Aversa's residential market performs above both the Caserta provincial average (€1,734/m²) and the regional mean (€1,268/m²), consistent with its role as a primary economic centre within the metropolitan area of Naples and with the positive externalities generated by the university's presence. Figure 14 maps the real-estate prices around the Department of Architecture in Aversa. Table 5 summarizes the corresponding spatial distribution of property values and morphological characteristics, while Figure 15 illustrates the associated morphological typologies and property-value trends.
Figure 14
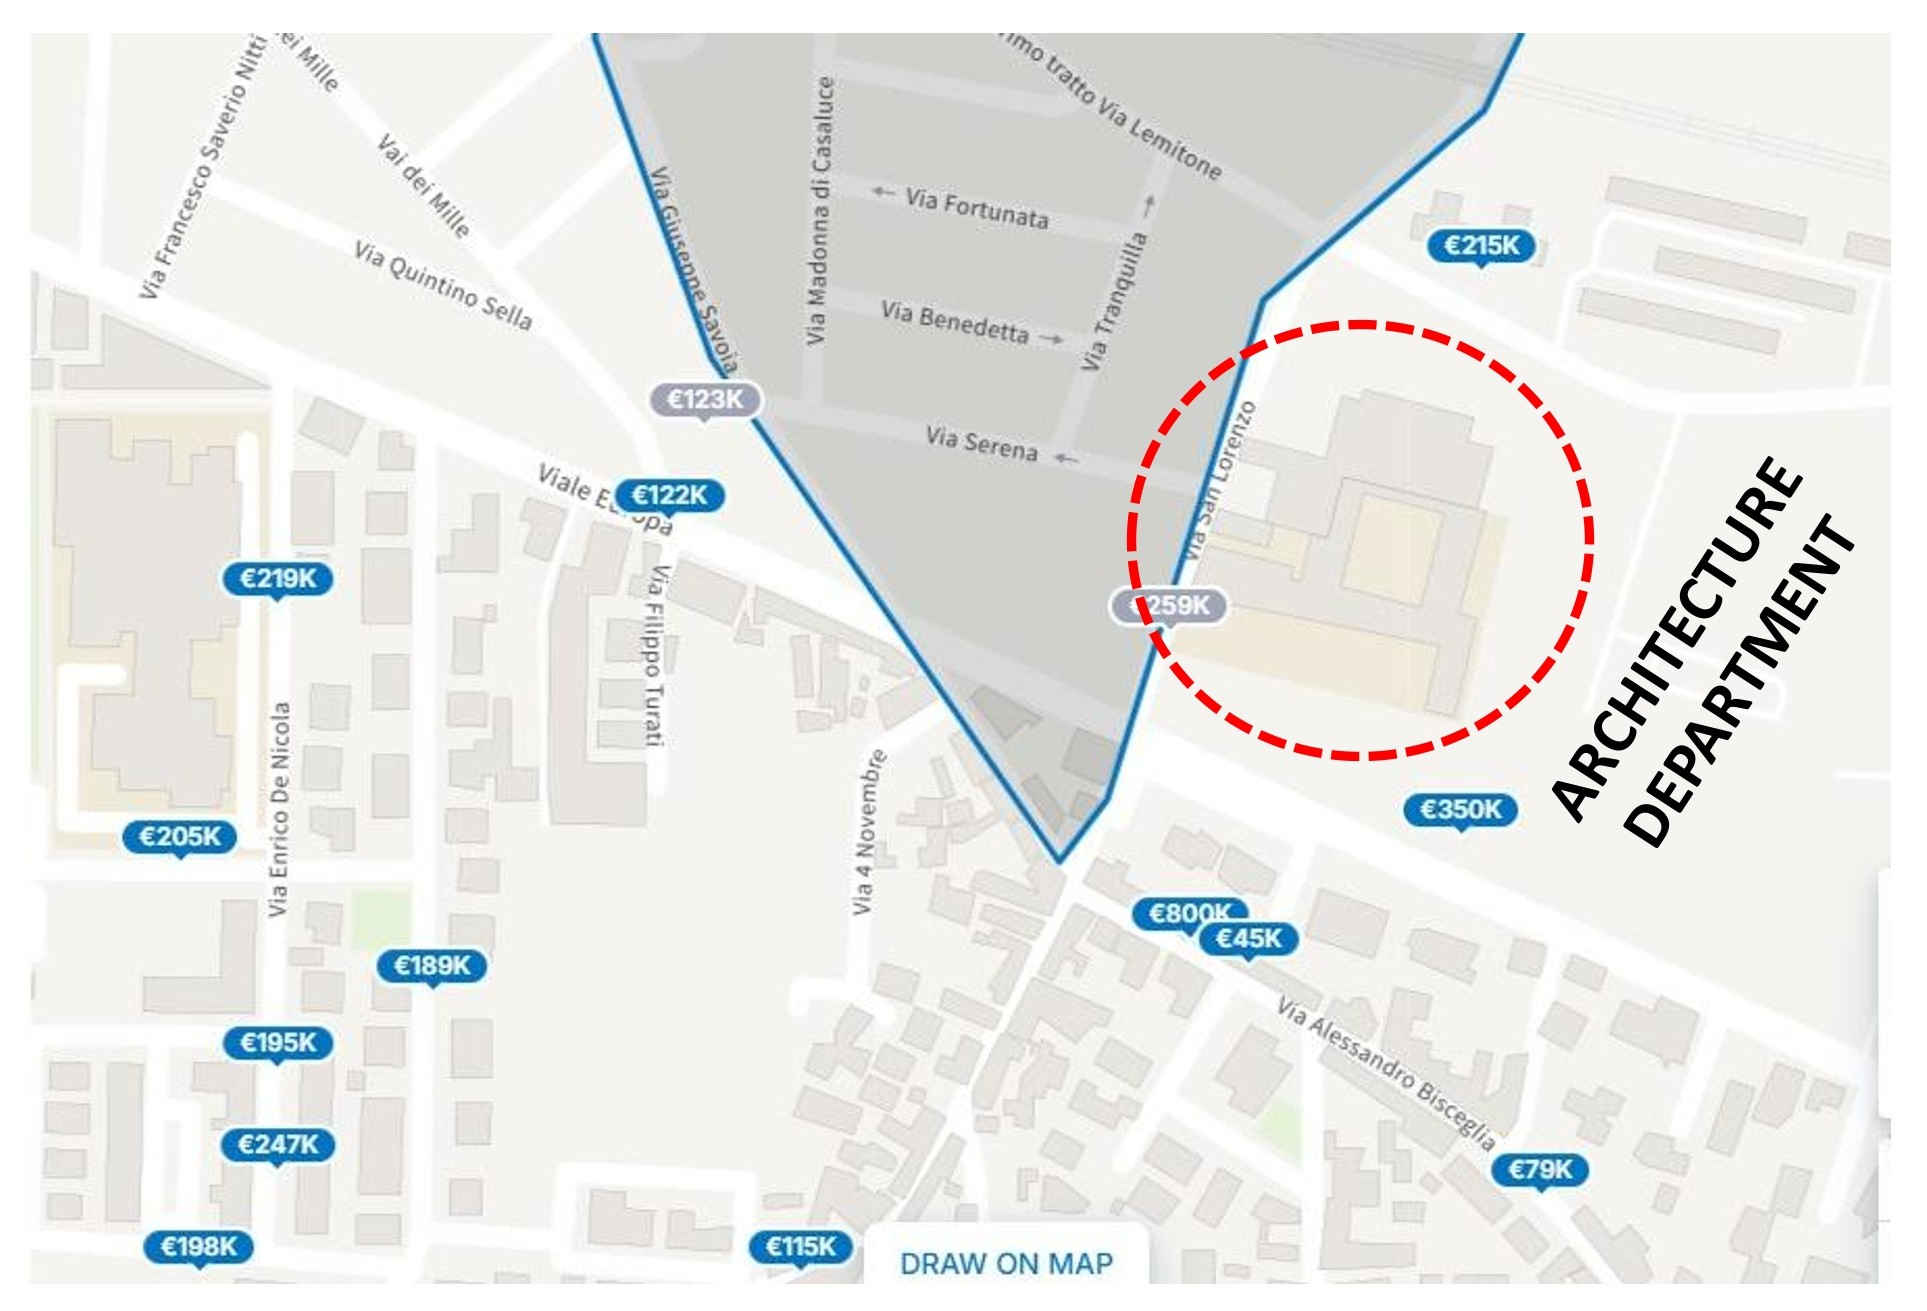
Fig. 14. Real estate prices near the Department of Architecture, Aversa.
Figure 15
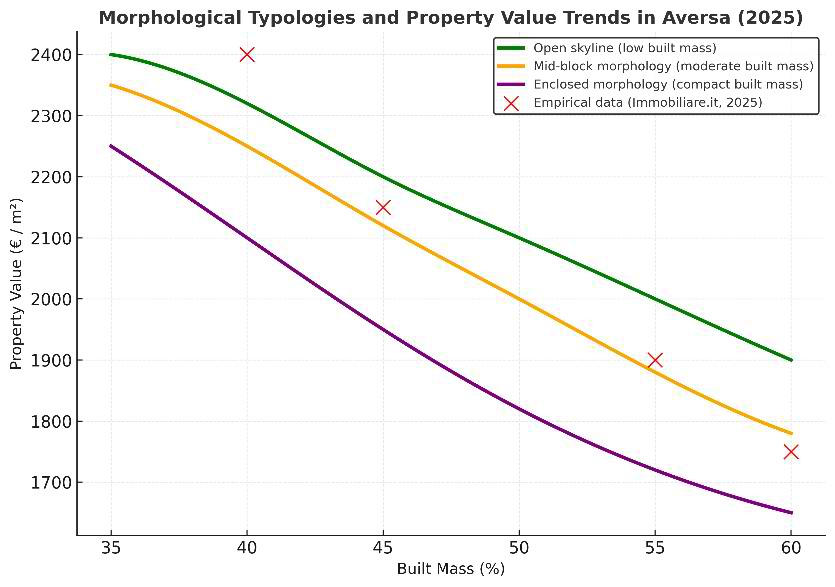
Fig. 15. Morphological typologies and property value trends in Aversa (2025).
Table 5
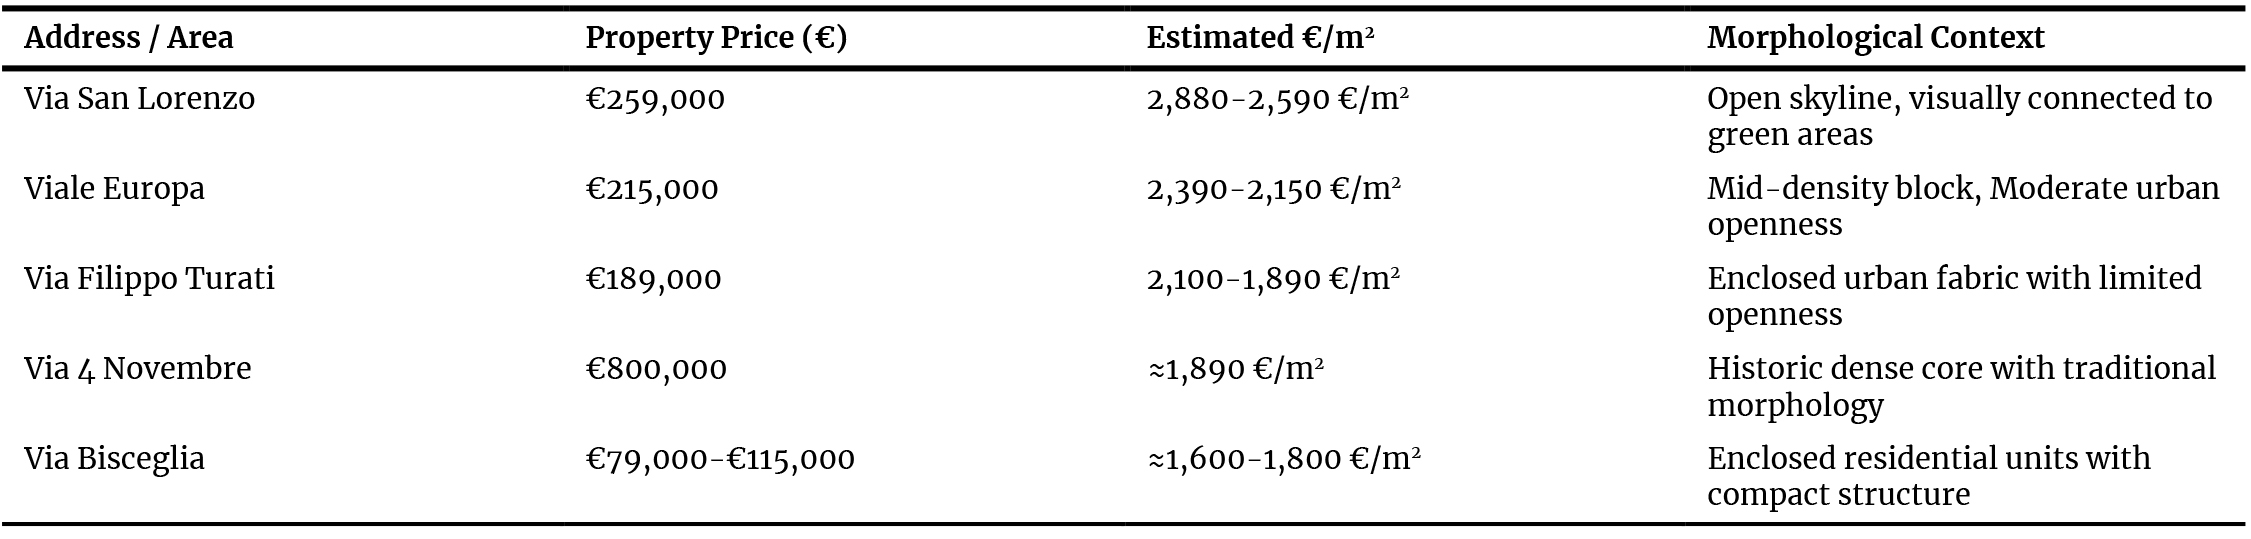
Table 5. Spatial distribution of real estate values and morphological characteristics, Aversa.
4. Discussion
The results establish a coherent and internally consistent relationship between window orientation, skyline morphology, and the synthetic indices proposed in this study. South- and west-facing orientations, characterised by semi-open concave skylines with high proportions of visible sky and greenery, systematically produce higher SPI and SOI values than the east-facing orientation, which is dominated by flat, obstructed built mass. This directional pattern is consistent with prior evidence linking sky visibility and vegetation to psychological restoration [1-2] and with recent housing market studies demonstrating that natural elements in window views are capitalized into property prices [22-23]. The orientation sensitivity observed here also corroborates parametric, standards-based evidence from a comparable case study, in which building rotation and window-to-wall ratio were shown to reshape the visible urban content of window views independently of formal EN 17037/LEED compliance scores [29]; taken together with the present SPI/SOI results, this reinforces the view that orientation and façade design exert a first-order influence on perceived skyline composition that is not always captured by standards-based view-quality scores alone.
The present framework extends existing view assessment tools in three important respects. First, it moves beyond purely geometric metrics: while VAI [26] captures window access geometry and VCI [27] addresses glazing optical properties, neither integrates the visual content of the view sky, greenery, and built mass which is the primary determinant of perceptual experience within the view field. Second, the framework provides a building-level decomposition of view quality through the SDI, enabling designers and planners to identify which specific structures are driving reductions in openness within a given composition. Third, the integration of indicative hedonic interpretation connects architectural and morphological variables to residential market outcomes, a linkage that has previously been addressed only through broad categorical classifications of view type [22-23].
The daylight-related rationale established in Section 1 for treating sky and built-mass proportions as connected to daylighting performance also has a direct bearing on the hedonic results reported in Section 3.5. Because sky visibility, greenery, and daylight access share the same underlying geometric determinant unobstructed angular exposure to the sky the property-value premiums associated with semi-open, concave skylines in this study plausibly reflect, at least in part, the market's valuation of daylight access itself, rather than visual or aesthetic openness alone. This interpretation is consistent with the manuscript's own case-study observation that units in dense, enclosed clusters with limited daylight access recorded the lowest prices in the study area (Section 3.5.1). Disentangling the daylight-specific and purely visual/aesthetic components of the reported hedonic premiums would require direct daylight metrics, such as daylight factor or annual daylight exposure, to be assessed alongside the pixel-based view-composition indices; this is identified as a further, specific direction for future work, complementing the multi-city and transaction-level extensions already discussed below.
This daylight linkage is offered as a plausible interpretation of the hedonic pattern observed, not as a tested causal pathway; the hedonic results in Section 3.5 speak directly only to view composition.
The SDI behaves as a complementary metric to SPI and SOI: while the latter two indices evaluate positive perceptual attributes, the SDI quantifies the spatial constraints that limit them. The three-index system therefore forms a complementary analytical structure in which perceptual quality and morphological density are jointly assessed – an approach that has no direct equivalent in the existing literature. The depth-weighting mechanism incorporated into the SDI represents a methodological contribution, addressing the well-known phenomenon that distant tall buildings exert less visual influence on occupant experience than their absolute height would suggest [8,40].
Several limitations of the present study merit explicit acknowledgement. The analysis is restricted to a single urban case study (Aversa), which limits the generalisability of the index calibration and the hedonic coefficients. Within this case study, the framework further relies on a single, fixed observation point. Because skyline perception is highly location-dependent and varies with viewpoint, viewing direction, surrounding buildings, and urban morphology, the three window orientations analysed here characterise the variability obtainable from a single room rather than the full range of viewpoint conditions found across a building or a city, and the resulting index values should not be read as representative of all vantage points in Aversa; this constitutes a significant methodological limitation of the present proof-of-concept. The perceptual weighting factors embedded in the SPI (ws = 0.4, wg = 0.4, wb = 0.2) are derived from literature rather than from empirical preference elicitation in this specific setting, and their sensitivity has not yet been formally tested. More broadly, the present proof-of-concept was not designed to include a systematic sensitivity analysis or ablation study of its parameters: the depth-attenuation coefficients (δ) were fixed at two predefined values rather than treated as a continuous function of viewing distance, and the effects of camera field of view and window geometry on the resulting indices were not varied or tested. Similarly, the SAM-based segmentation was not benchmarked against manually annotated ground truth, so quantitative accuracy metrics such as intersection-over-union or pixel accuracy, and inter-annotator agreement, are not available, and the effects of varying illumination, shadow, weather, and cloud conditions on segmentation reliability were not evaluated. Comparable quantitative validation protocols for semantic segmentation of window views have been demonstrated elsewhere in the literature, for example achieving a mean intersection-over-union of 0.53 against photorealistic ground truth [43] and represent an appropriate benchmark and template for future application to the present framework. The mapping between SDI classes and pixel-derived built-area fractions, and the associated SDI classification thresholds, were likewise set heuristically (Section 2.6.3) rather than through formal calibration or quantitative error analysis, and their validity outside the present case study has not been established. We further acknowledge that, of the five analytical dimensions introduced in Section 2.1, roof shape, skyline transition, and continuity are used only qualitatively, for the aesthetic and physical classification described in Section 2.4, and are not yet quantitatively incorporated into the SPI, SOI, or SDI formulations; formalising these dimensions into the synthetic indices, for example through a roofline-variance or transition-continuity term, is identified as a further direction for future development of the framework. The hedonic economic values are indicative estimates adapted from prior studies conducted in different geographic and cultural contexts, not local transaction-level regressions. They also do not yet incorporate a causal identification strategy; because view quality may itself be correlated with unobserved neighbourhood amenities, a transaction-level semi-logarithmic hedonic model with location and dwelling controls, fixed effects, and an instrumental-variable or comparable strategy to address this potential endogeneity is required before the reported premiums and penalties can be treated as causal estimates. Furthermore, the study does not include occupant surveys, physiological measurements, or behavioural data, which would be needed to validate the relationship between the proposed indices and actual human experience. Even a small-scale preference or ranking study, of the kind recently used to probe occupant tolerance of unfavourable window views [52], would provide anchor evidence for empirical calibration of the SPI weights. Taken together, these constraints a single case study, a single observation point, literature-derived rather than empirically fitted weights and thresholds, and the absence of occupant validation mean the reported index values and hedonic figures should be read as a proof-of-concept demonstration rather than as a validated, generalisable instrument.
Future research should address these limitations by: (i) applying the framework across multiple cities with contrasting morphological profiles, including high-rise Northern European contexts (Gdansk) and mixed-density Western European settings (London), the latter already the subject of a preliminary companion study by the authors applying comparable window-view content analysis to office buildings across floors and street-canyon widths in London [53], whose floor- and orientation-sensitivity findings are broadly consistent with the density effects reported here for Aversa, using hedonic regression on local transaction datasets, reported with model equations, coefficients, significance levels, confidence intervals, and diagnostic tests, and with the underlying code and data released in a public repository to enable independent replication in other markets; (ii) conducting occupant surveys and perceptual experiments to empirically validate and, if necessary, revise the SPI weighting factors, including small-scale preference studies of the type described above; and (iii) incorporating physiological and behavioral response metrics to validate the perceptual component. Future work should further include: per-image bootstrapping of the SAM segmentation to quantify pixel-level uncertainty; robustness testing of the framework across varying weather, lighting, and camera field-of-view conditions; a formal ablation of the depth-attenuation coefficient (δ), including its replacement with a continuous distance-weight function and an angular or solid-angle formulation of façade width; an inter-method comparison between SAM and dedicated semantic segmentation models trained on urban-scene datasets; and sampling of multiple observation points per building, and multiple buildings per city, to directly address the location-dependence of skyline perception. The framework is designed for transferability, and the authors anticipate that inter-city comparison studies will constitute the most productive avenue for its further development.
5. Conclusion
This study presented a methodological framework for quantifying window view quality in urban environments dominated by building skylines, integrating morphological analysis, SAM-based pixel segmentation, and exploratory hedonic interpretation. Three synthetic indices SPI, SOI, and SDI were introduced to characterise, respectively, the perceptual quality, visual openness, and volumetric density of window views, with SPI and SOI interpreted as related rather than independent measures under the present weighting. Proof-of-concept validation in Aversa, Italy demonstrated that the framework produces internally consistent and orientation-sensitive results: south- and west-facing views, characterised by semi-open concave skylines, yielded higher SPI and SOI values and were associated with indicative property value premiums of 4–7%; the east-facing view, dominated by flat, obstructed built mass, produced markedly lower index values and indicative price discounts of 5–8%.
The three indices operate as a complementary analytical system: SPI and SOI capture the positive perceptual attributes of the view field, while SDI quantifies the morphological constraints that limit them. Under the present literature-derived weighting, SPI is mathematically equivalent to a linear rescaling of SOI (Section 2.6.2); the two indices should therefore be read as one perceptual score reported in two complementary forms until empirically differentiated weights are available, rather than as independent lines of evidence. Together with SDI, they provide a transparent instrument, intended to be transferable and reproducible pending multi-city and empirical validation, for integrating view quality into urban design evaluation, residential planning, and property assessment. The framework is distinguished from prior work by its simultaneous treatment of three dimensions skyline morphology, occupant visual experience, and residential economic value that previous studies have addressed in isolation.
The study's primary limitation is its reliance on a single case study, a single fixed observation point, and adapted hedonic coefficients. Future research should validate the framework using transaction-level datasets across multiple cities and morphological contexts, refine the SPI weighting factors through occupant surveys and perceptual experiments, and incorporate physiological and behavioural response data. Three specific future directions are identified: (i) multi-city application encompassing high-rise Northern European and mixed-density Western European urban environments; (ii) empirical calibration of hedonic coefficients using local real estate transaction data; and (iii) physiological validation of the perceptual component through controlled environmental experiments.
In summary, the findings confirm that window view quality as characterised by skyline openness, visible greenery, and skyline configuration constitutes a measurable urban asset with simultaneous environmental and economic dimensions. As a proof-of-concept, the proposed indices illustrate a route towards an evidence-based tool for planners, designers, and researchers evaluating the visual quality of urban living environments; realising that tool in a form ready for routine application will require the empirical calibration and validation steps outlined above.
Funding
This research received no specific grant from any funding agency in the public, commercial, or not-for-profit sectors.
Author Contributions
Parinaz Sabet: Conceptualization, P.S., M.A.; Methodology, P.S., M.A.; Formal Analysis, P.S.; Investigation, P.S.; Writing Original Draft, P.S.; Writing Review & Editing, P.S., M.A.; Visualization, P.S., M.A.; Validation, P.S., M.A; Resources, P.S.; Supervision P.S. Both authors have read and agreed to the published version of the manuscript.
Acknowledgement
The authors gratefully acknowledge the Department of Architecture and Industrial Design, University of Campania "Luigi Vanvitelli", for providing the reference room and institutional infrastructure used in this study. The authors thank the IEA SHC Task 70 / EBC Annex 90 network for supporting discussions on window view quality methodologies.
Declaration of competing interest
The authors declare no conflict of interest.
References
- R. S. Ulrich, View through a window may influence recovery from surgery, Science 224:4647 (1984) 420-421. https://doi.org/10.1126/science.6143402
- R. Kaplan, S. Kaplan, The Experience of Nature: A Psychological Perspective, Cambridge University Press, Cambridge, UK, (1989).
- P. Sabet, G. Ciampi, M. Scorpio, S. Sibilio, The effects of urban morphology on window view, in: Proceedings of the 30th Session of the CIE (CIE x050:2023), Ljubljana, Slovenia, 15-23 September 2023 (Volume 1), International Commission on Illumination (CIE), Vienna, (2023), pp. 1418-1428. https://doi.org/10.25039/x50.2023.PO067
- L. Lottrup, P. Grahn, U. K. Stigsdotter, Workplace greenery and perceived level of stress: benefits of access to a green outdoor environment at the workplace, Landscape and Urban Planning 110 (2013) 5-11. https://doi.org/10.1016/j.landurbplan.2012.09.002
- N. Wang, M. Boubekri, Investigation of declared seating preference and measured cognitive performance in a sunlit room, Journal of Environmental Psychology 30:2 (2010) 226-238. https://doi.org/10.1016/j.jenvp.2009.12.001
- A.-M. Bolte, B. Niedermann, T. Kistemann, J.-H. Haunert, Y. Dehbi, T. Kötter, The green window view index: automated multi-source visibility analysis for a multi-scale assessment of green window views, Landscape Ecology 39:3 (2024) 71. https://doi.org/10.1007/s10980-024-01871-7
- M. Elsadek, Z. Deshun, B. Liu, High-rise window views: evaluating the physiological and psychological impacts of green, blue, and built environments, Building and Environment 262 (2024) 111798. https://doi.org/10.1016/j.buildenv.2024.111798
- A. W. Puspitasari, J. Kwon, Analysis of the visual quality of riverfront skyline through the feature of height and spatial arrangement of tall building, Architectural Research 21:4 (2019) 91-98.
- A. Chokhachian, K. Perini, S. Giulini, T. Auer, Urban performance, and density: generative study on interdependencies of urban form and environmental measures, Sustainable Cities and Society 53 (2020) 101952. https://doi.org/10.1016/j.scs.2019.101952
- T. Heath, S. G. Smith, B. Lim, Tall buildings, and the urban skyline: the effect of visual complexity on preferences, Environment and Behavior 32:4 (2000) 541-556. https://doi.org/10.1177/00139160021972658
- S. Bell, Elements of Visual Design in the Landscape, 2nd ed., Routledge, London, UK, 2019. https://doi.org/10.4324/9780367809935
- K. Lynch, The Image of the City, MIT Press, Cambridge, MA, USA, 1960.
- K. Al-Kodmany, Guidelines for tall buildings development, International Journal of High-Rise Buildings 1:4 (2012) 255-269.
- M. Karimimoshaver, M. A. Ahmadi, F. Aram, A. Mosavi, Urban views, and their impacts on citizens: a grounded theory study of Sanandaj city, Heliyon 6:10 (2020) e05157. https://doi.org/10.1016/j.heliyon.2020.e05157
- C. Guney, S. A. Girginkaya, G. Cagdas, S. Yavuz, Tailoring a geomodel for analyzing an urban skyline, Landscape and Urban Planning 105:1-2 (2012) 160-173. https://doi.org/10.1016/j.landurbplan.2011.12.016
- M. Ahmadi, J. Martyniuk-Pęczek, M. Kostrzewska, N. Sokół, Behavioral dimensions of user movement in daylit library spaces: a review, Budownictwo i Architektura / Civil and Architectural Engineering 25:1 (2024). https://doi.org/10.35784/bud-arch.7656
- P. Sabet, G. Ciampi, M. Scorpio, S. Sibilio, Window view quality in buildings: state of the art and future developments, in: Healthy Buildings Europe 2023: Beyond Disciplinary Boundaries, Vol. 2, Aarhus, Denmark, 2023, pp. 1166-1173.
- M. Ahmadi, N. Sokół, J. Francuzik, J. Martyniuk-Pęczek, The role of daylight in forming the traditional space: classification of traditional Iranian daylighting elements, Teka Komisji Urbanistyki i Architektury PAN 51 (2023) 387-421. https://doi.org/10.24425/tkuia.2023.148984
- E. D. Benson, J. L. Hansen, A. L. Schwartz, G. T. Smersh, Pricing residential amenities: the value of a view, Journal of Real Estate Finance and Economics 16 (1998) 55-73. https://doi.org/10.1023/A:1007785315925
- G. Pivo, J. D. Fisher, The walkability premium in commercial real estate investments, Real Estate Economics 39:2 (2011) 185-219. https://doi.org/10.1111/j.1540-6229.2010.00296.x
- M. Rodriguez, C. F. Sirmans, Quantifying the value of a view in single-family housing markets, Appraisal Journal 62 (1994) 600.
- A. Baranzini, C. Schaerer, A sight for sore eyes: assessing the value of view and land use in the housing market, Journal of Housing Economics 20:3 (2011) 191-199. https://doi.org/10.1016/j.jhe.2011.06.001
- S. H. Bostancı, M. Oral, Experimental approach on the cognitive perception of historical urban skyline, ICONARP International Journal of Architecture and Planning (2017). https://doi.org/10.15320/ICONARP.2017.25
- Y. Shi Ming, C. Chee Hian, Obstruction of view and its impact on residential apartment prices, Pacific Rim Property Research Journal 11:3 (2005) 299-315. https://doi.org/10.1080/14445921.2005.11104189
- A. S. Jayasekare, S. Herath, R. Wickramasuriya, P. Perez, The price of a view: estimating the impact of view on house prices, Pacific Rim Property Research Journal 25:2 (2019) 141-158. https://doi.org/10.1080/14445921.2019.1626543
- W. H. Ko, S. Schiavon, L. Santos, M. G. Kent, H. Kim, M. Keshavarzi, View access index: the effects of geometric variables of window views on occupants' satisfaction, Building and Environment 234 (2023) 110132. https://doi.org/10.1016/j.buildenv.2023.110132
- I. Konstantzos, Y.-C. Chan, J. C. Seibold, A. Tzempelikos, R. W. Proctor, J. B. Protzman, View clarity index: a new metric to evaluate clarity of view through window shades, Building and Environment 90 (2015) 206-214. https://doi.org/10.1016/j.buildenv.2015.04.005
- Y. Koga, T. Okamoto, R. Majima, F. Jarrin, Y. Kojima, C. Ohki, A. Kawano, N. Takagi, Green view factor and satisfaction with window views in urban offices, Journal of Physics: Conference Series 2600 (2023) 112016. https://doi.org/10.1088/1742-6596/2600/11/112016
- M. Scorpio, P. Sabet, N. Sokol, G. Ciampi, J. Martyniuk-Pęczek, S. Sibilio, Optimising building design through window view analysis: a case study in Gdansk, in: Proceedings of the International Commission on Illumination (CIE) Conference, Vienna, Austria, (2025).
- A. Stamps III, Visual permeability, locomotive permeability, safety, and enclosure, Environment and Behavior 37:5 (2005) 587-619. https://doi.org/10.1177/0013916505276741
- J. C. S. Gonçalves, The Environmental Performance of Tall Buildings, 1st ed., Routledge, London, UK, 2010. https://doi.org/10.4324/9781849776554
- K. Karaga, Urban skyline planning strategy analysis: case study London, master's thesis, University of Westminster, London, UK, (2014).
- S. E. Gill, J. F. Handley, A. R. Ennos, S. Pauleit, N. Theuray, S. J. Lindley, Characterising the urban environment of UK cities and towns: a template for landscape planning, Landscape and Urban Planning 87:3 (2008) 210-222. https://doi.org/10.1016/j.landurbplan.2008.06.008
- W.-B. Wu, Z.-W. Yu, J. Ma, B. Zhao, Quantifying the influence of 2D and 3D urban morphology on the thermal environment across climatic zones, Landscape and Urban Planning 226 (2022) 104499. https://doi.org/10.1016/j.landurbplan.2022.104499
- B. Lim, T. Heath, What is a skyline: a quantitative approach, Architectural Science Review 37:4 (1994) 163-170. https://doi.org/10.1080/00038628.1994.9697343
- R. Ardıçoğlu, Urban Design in Macro, Meso and Micro Scales, Fırat University, Elazığ, Turkey, 2022.
- D. H. Bui, L. Mucsi, From land cover map to land use map: a combined pixel-based and object-based approach using multi-temporal Landsat data, a random forest classifier, and decision rules, Remote Sensing 13:9 (2021) 1700. https://doi.org/10.3390/rs13091700
- TABULA, TABULA: European Building Typology. Available at: https://webtool.building-typology.eu/#bm (last accesses on 06 August 2026).
- N. Wang, F. Heath, Skyline analysis: a review of methodological approaches and applications, Architectural Science Review (2010).
- A. Stamps III, J. L. Nasar, K. Hanyu, Using pre-construction validation to regulate urban skylines, Journal of the American Planning Association 71:1 (2005) 73-91. https://doi.org/10.1080/01944360508976406
- Meta AI, Segment Anything Model (SAM). Available at: https://segment-anything.com (accessed 2025).
- S. N. Ingabo, Y.-C. Chan, Decomposition of dynamic window views using semantic segmentation, in: Proceedings of SimBuild 2024: Eleventh National Conference of IBPSA-USA, Denver, CO, USA, IBPSA-USA, (2024).
- A. M. Bolte, T. Kistemann, T. Kötter, Y. Dehbi, Validating a window view simulation engine based on open data and open source using semantic segmentation, in: The International Archives of the Photogrammetry, Remote Sensing and Spatial Information Sciences, Vol. XLVIII-G-2025, (2025) 219-225. https://doi.org/10.5194/isprs-archives-XLVIII-G-2025-219-2025
- C. Y. Jim, W. Y. Chen, Value of scenic views: hedonic assessment of private housing in Hong Kong, Landscape and Urban Planning 91:4 (2009) 226-234 https://doi.org/10.1016/j.landurbplan.2009.01.009
- F. Wang, J. Munakata, Assessing effects of facade characteristics and visual elements on perceived oppressiveness in high-rise window views via virtual reality, Building and Environment 266 (2024) 112043. https://doi.org/10.1016/j.buildenv.2024.112043
- M. Alkhresheh, Effects of levels of realism on perceived distance in computer-simulated urban spaces, Buildings 15:19 (2025) 3565. https://doi.org/10.3390/buildings15193565
- J. L. Nasar, K. Terzano, The desirability of views of city skylines after dark, Journal of Environmental Psychology 30:2 (2010) 215-225. https://doi.org/10.1016/j.jenvp.2009.11.007
- A. S. Mak, E. K. Yip, P. Lai, Developing a city skyline for Hong Kong using GIS and urban design guidelines, URISA Journal 17:1 (2005) 33.
- F. Rodriguez, V. Garcia-Hansen, A. Allan, G. Isoardi, Subjective responses toward daylight changes in window views: assessing dynamic environmental attributes in an immersive experiment, Building and Environment 195 (2021) 107720. https://doi.org/10.1016/j.buildenv.2021.107720
- Immobiliare.it, Mercato immobiliare Aversa (prezzi vendita e affitto). Available at: https://www.immobiliare.it (last accesses on 06 August 2026).
- Idealista.it, Prezzi immobiliari Aversa. Available at: https://www.idealista.it (last accesses on 06 August 2026).
- Ž. Kristl, A. Fošner, M. Zbašnik-Senegačnik, Tolerance to urban window views with various design features, Buildings 15:6 (2025) 914. https://doi.org/10.3390/buildings15060914
- P. Sabet, M. Scorpio, G. Ciampi, M. Jamil, S. Sibilio, Urban window view content analysis using 3D modelling and simulation: a case study of London City, Civil Engineering and Architecture 13:5 (2025) 543-555. https://doi.org/10.13189/cea.2025.130543
Disclaimer/Publisher’s Note: The statements, opinions and data contained in all publications are solely those of the individual author(s) and contributor(s) and not of Solarlits and/or the editor(s). Solarlits and/or the editor(s) disclaim responsibility for any injury to people or property resulting from any ideas, methods, instructions or products referred to in the content.