Volume 1 Issue 1 pp. 56-67 • doi: 10.15627/jd.2014.6
A Methodology to Link the Internal Heat Gains from Lighting to the Global Consumption for the Energy Certification of Buildings in Italy
Author affiliations
a Department of Energy, TEBE Research Group, Politecnico di Torino, corso Duca degli Abruzzi, 24 - 10129 Turin, Italy.
b Department of Energy, Politecnico di Torino, corso Duca degli Abruzzi, 24 - 10129 Turin, Italy.
c ENEA (Italian National Agency for Energy, Technical Unit UTTEI-SISP - Research Laboratories of Ispra, via Fermi 2749 Ispra (Varese), Italy.
* Corresponding author. Tel: +39 011 090.4508; fax: +39 011 090.4499
susiminas@uvigo.es (V. R.M. Lo Verso)
guglielmina.mutani@polito.it (G. Mutani)
laura.blaso@enea.it (L. Blaso)
History: Received 27 September 2014 | Revised 24 November 2014 | Accepted 30 November 2014 | Published online 22 Dec 2014
Copyright: © 2014 The Author(s). Published by solarlits.com. This is an open access article under the CC BY license (http://creativecommons.org/licenses/by/3.0/).
Citation: Valerio R.M. Lo Verso, Guglielmina Mutani, and Laura Blaso, A Methodology to Link the Internal Heat Gains from Lighting to the Global Consumption for the Energy Certification of Buildings in Italy, Journal of Daylighting 1 (2014) 56-67. http://dx.doi.org/10.15627/jd.2014.6
Figures and tables
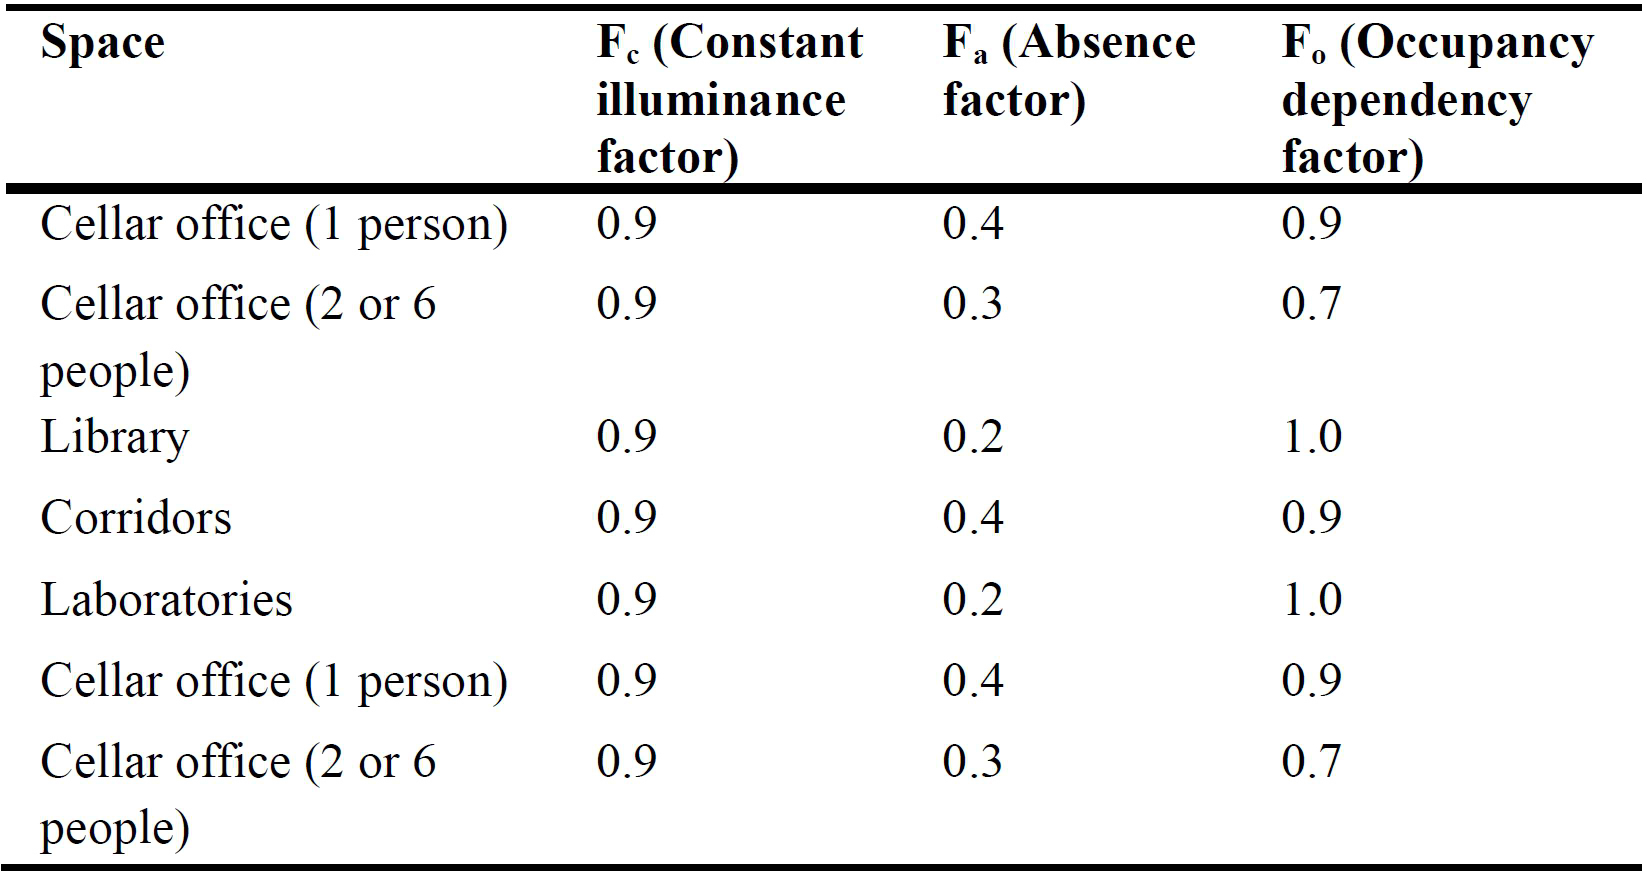 Table 2
Abstract
This paper critically discusses the procedure prescribed by the Italian Technical Standards to account for the internal gains in the calculation of the energy performance indices for a building. This procedure is based on a tabular value set depending on the building usage only (e.g., 6 W/m2 for office buildings), independently of the site and of the controls for blinds and lighting systems. Instead, the paper proposes a new procedure, which relies on the lighting energy numerical indicator (LENI) according to the European Standard EN 15193:2007. Basically, the procedure consists of the following steps: 1) internal gains from lighting are calculated accounting for the integration between electric appliances and daylighting; 2) these gains are summed to the internal gains from occupants and appliances; 3) the global gains are used as input data to calculate the energy performance indices for an office building (for space heating, space cooling, and lighting consumption) following the Italian Technical Standards. The office building which was used as case-study is the Department of Energy of the Politecnico di Torino. This was assumed to be located both in Turin (northern Italy) and in Palermo (southern Italy). In the study, the use of a manual on/off switch and of a photodimming sensor was also compared. For each configuration, the single and the global energy performance indices were calculated comparing two approaches to calculate the internal gains (Italian standard vs. new proposed procedure): a shift of one energy class for the building energy label was observed depending on the approach, which was used.
Keywords
Internal gains from lighting; Energy demand for lighting; Lighting energy numerical indicator; Building energy performance indices EP
1. Background
The demand for more energy efficient solutions has risen with the worldwide growing concern about energy consumption. Buildings have been identified to play a major role in potential energy saving and new directives and standards are being issued to bound the integrated energy performance of new or renovated buildings within prescribed limits: the implementation of the European energy performance of buildings directives (EPBD) [1–3] at various national levels requires all new buildings achieve a building energy rating (BER) lower than the prescribed target energy rating (TER) for the specific building type. Within the European Union, a formal commitment was agreed to reduce by 2020 the primary energy consumption and overall greenhouse gas emissions by at least 20% below 1990 levels [4].
Following a mandate received from the European Commission [5], the European organization for standardization (CEN) started elaborating the various standards concerned with the EPBD to define a methodology to calculate the integrated energy performance of a building. Although an EPBD-Project Group was established for this purpose, due to the delays in completing the whole process, several countries have already adopted national calculation methods. As a consequence, the energy performance of the same system may be evaluated differently in different countries [6]. With regard to the Italian context, the recent “National guide lines for building energy certification” [6,8] provided general criteria, calculation methods and minimum requirements for the design and construction of energy-efficient buildings. These address the building envelope, systems and equipment for heating, cooling, ventilation, hot water production and lighting, and the consumption of electric systems. Within this context, the global energy performance index of a building (EPgl) was introduced to assess its overall energy consumption: this is defined as the ratio of the global primary energy need for the whole building to the building heated floor area (for residential buildings) or to the gross heated volume (for non-residential buildings). The EPgl of a building is given by the sum of four disaggregated energy performance indices:
where EPh, EPhw, EPc, and EPl are the building energy performance indices for space heating, hot water production, space cooling, and electric lighting, respectively. All indices are expressed in (kWh/m2/a) or in (kWh/m3/a) for residential or non-residential buildings, respectively. They all account for the amount of primary energy consumed to provide a certain energy need for the building as well as for the auxiliary energy provided by the systems to produce energy from different sources. It is worth highlighting that at present the energy certification process is limited to the calculation of EPh and EPhw [9,10]. For the space cooling, the analysis is prescribed in terms of performances of the building envelope, without accounting for the cooling system efficiency. No prescription has been provided yet to calculate the energy performance index EPl.
The various energy consumptions need to be calculated on a monthly basis for the heating and cooling season, based on the energy balance between inlet energy flux, heat generation, and outlet energy flux. For internal heat gains, a constant value for the whole course of the year is provided in the standards, in (W/m2), depending on the considered building use [9,11]. This value has to be converted in an energy amount by multiplying it by the building floor area and by the time duration of each month. For example, a flat annual value of 4 W/m2 is provided for educational buildings, of 6 W/m2 for hotels, industrial or office buildings, of 8 W/m2 for museums, commercial and health care buildings, of 10 W/m2 for restaurants and swimming pools. The values which are provided are intended to comprehensively account for the internal gains from all internal heat sources: occupants, appliances and lighting fittings.
This approach, prescribed in the Italian reference standards, is critically discussed in the paper, with particular attention to the role played by internal gains from lighting systems. Assuming a flat value for the internal gains appears to scarcely account for the crucial role played by aspects such as [12]: lighting power density, LPD; equipment typologies (sources and luminaires) actually installed in the considered building, as well as their efficiencies; occupancy behavior; type of lighting and blind control systems (manual, daylight responsive, occupancy based etc.) which result in a different amount of hours during which lights are used.
In [13], they carried out a study on the energy and lighting performances for energy-efficient fluorescent lamps associated with electronic ballasts and high frequency photoelectric dimming controls installed in a school building. They showed that T5 fluorescent lamps associated with the electronic ballasts installed to replace the existing T8 light fittings with conventional ballasts lead to a 28% reduction in energy expenditure for electric lighting in a workshop room. A further lighting energy saving was observed when the high frequency lighting control dimmed the illuminance to the recommended value within a classroom. In [14], they analyzed the impact of shading and control systems on the energy demand for cooling and for lighting. Other studies similarly showed the potential energy savings concerned with high-efficiency lighting systems, window coating, occupancy profile and behavior or daylight-linked controls, with regard to quite different climates, from tropics to northern Europe [15–30]. The differences in lighting performances, demonstrated in all these studies, are not taken into account if a constant value is assumed for internal gains.
As summarized in [13], two different approaches can be used to get accurate input data to predict the energy consumption of a building: a top-down or a bottom-up approach. The top-down approach relies on macro-variables and “on long-time projections of energy demand according to historic response, but these are unable to model discontinuous advances in technology or to identify the end-use key areas for improvements”. Differently, the bottom-up approach adopts input data from a lower level (such as individual or groups of buildings) and extrapolates results for the whole sector according to the representative weight of the sample considered. It has the capability of discerning the effect of occupant behavior and uses engineering methods, which combine data on the use of lighting systems, appliances and systems with heat transfer and thermodynamic relationships. This kind of models requires a highly detailed input data and does not rely on historical information, but it can be extremely complex. The authors used a bottom-up approach in their study to define the electricity demand considering the end-use interaction for three types of buildings. Finally, they extrapolated the results for the whole sectors in the Italian context.
In [31], they conducted a study on the discrepancies between energy modeling predictions and in-use performance of occupied buildings (the so-called ‘performance gap’): they showed that unrealistic or approximate input parameters regarding occupancy behavior and facility management in building energy modeling result in significant sources of errors. In this regard, the internal gains should then be modeled as accurately as possible to describe the actual energy use of the considered building.
The studies conducted in [32,33] showed that for a country such as the UK “the more fundamental problem relates to the internal heat gains being generated from, in particular, IT equipment and lighting. Cooling systems in offices (and other non-domestic buildings) only exist at all due to these gains”. Accordingly, he proposed “an approach for reducing office cooling loads for a UK climate, using a defined exemplar London office building to demonstrate the effect of IT equipment and lighting on cooling for the existing buildings”. The mutual influence between internal gains from lighting and cooling loads is therefore highlighted. Similarly, a parametric study is presented, performed on a computer model of an existing large office building, to evaluate the net energy savings concerned with retrofit of the lighting systems [34]. This actually resulted in an increase in the energy consumption for heating and in a decrease in the energy consumption for cooling. The authors analyzed different parameters: site, type of fluorescent fixtures (suspended, recessed unvented, and recessed vented), installed electric lighting power density (30, 25, 20, 15, and 10 W/m2 of floor area), proportion of heat generated by the lighting fixtures emitted into the space and proportion of heat directly eliminated by the return air (circulated through the lighting fixture). Again, the important link between internal gains from lighting and other energy loads in office building is highlighted.
With regard to the tertiary sector, the EIE EL-TERTIARY (Monitoring Electricity Consumption in the Tertiary Sector) project on 123 tertiary buildings [35] showed that lighting has an important weight in the electricity consumption.
Starting from the analysis of the state-of-the-art, an investigation on the role played by internal gains from lighting on the energy certification process of a building was carried out, which is presented in the paper. Actually, lighting and control systems can play an important role on the energy certification process, leading to reduce the final energy demand for a building, which also affects its value in the real estate market. For this reason, this work studied the influence of lighting and control systems for two Italian locations, characterized by different daylighting conditions.
1.1 Objective of the study
The “National guide-lines for building energy certification” have the merit to adopt an integrated approach to determine the global energy certification [7]. This depends on multiple energy uses throughout the year (for space heating, cooling, hot water production and lighting) to account for different purposes (thermo-hygrometrical comfort, heating-cooling-hot water demand and visual comfort). It is important to highlight, though, how the four contributions in Eq. (1) are considered as independent of one another.
Following a different approach, the link between appliances, internal gains, and energy loads were analyzed. They developed a model, based on the use of a Neural Nertwork method, to determine causal relationships amongst a large number of parameters, such as appliances, lighting, and space-cooling component, which occur in the energy consumption patterns in the residential sector [36]. Therefore, it appears clear that the different energy contributions are somewhat linked together through a complex dynamic behavior that is not taken into consideration in Eq. (1): this may determine a discrepancy in the final value of EPgl for the building with respect to the approach prescribed by the Italian standards. Quantifying the amount and the relevance of this discrepancy is the core objective of this paper. A second goal is to understand the effect that the considered site has on this discrepancy. The paper especially focuses on the role played by the internal gains from lighting on the overall energy use of the analyzed building and has in particular three detailed goals:
- proposing a procedure to calculate more accurately the internal gains from lighting. This procedure should be used to account for the mutual effect between the actual energy need for lighting and the energy needs for heating and cooling for the calculation of EPgl. The procedure is based on a seasonal approach (i.e. the heating and cooling contributions are calculated separately and then combined). The core of the method is a more accurate tool to calculate the internal gains from lighting: this means that the contribution to internal gains from appliances and occupancy is assumed constant on the basis of literature reference values
- applying the proposed calculation procedure to a real case-study (the building hosting the Department of Energy at the Politecnico di Torino, Italy) and comparing the EPgl to the value which would be obtained through the assumption of 6 W/m2 for all internal gains, as prescribed by the technical standards
- estimating how the considered site influences the difference between the two approaches, repeating the calculations for a second Italian town, Palermo (southern Italy, with a Mediterranean hot-humid climate), to compare the results with the ones obtained for Turin (continental cold-humid climate).
It is worth stressing that the procedure which is proposed in this paper refers to the energy certification, based on the standard use of a building, and not to the real utilization profile (HVAC and lighting systems, appliances, internal gains, regulation systems etc.), like [13] did in their study. Internal loads and the electricity demand in real buildings depend on a high number of aspects. As pointed out in the European Standard 15603 [37], the consumption of electrical appliances in residential and office buildings can largely vary, with ranges that can reach ±50%. This paper focuses on the approach prescribed by the Italian technical standards for the energy certification process, considering the standard use of a building.
In the following, Section 2 describes the case-study. Section 3 presents the new proposed methodology; Section 4 shows and discusses the results that were obtained. Section 5 contains the most outstanding conclusions, as well as the on-going and future research.
2. Case study: the Department of Energy building in Turin, Italy
The energy performance of a real office building was determined. The building is on the main university campus of the ‘Politecnico di Torino’ in the central area of Turin (latitude: 45.1°N), Italy, and hosts the Department of Energy (DENERG). It consists of 67 offices, 1 library and 2 laboratories. All indoor spaces have external frontal obstructions. Figures 1 and 2 visualize the DENERG building and its surroundings.
Figure 1
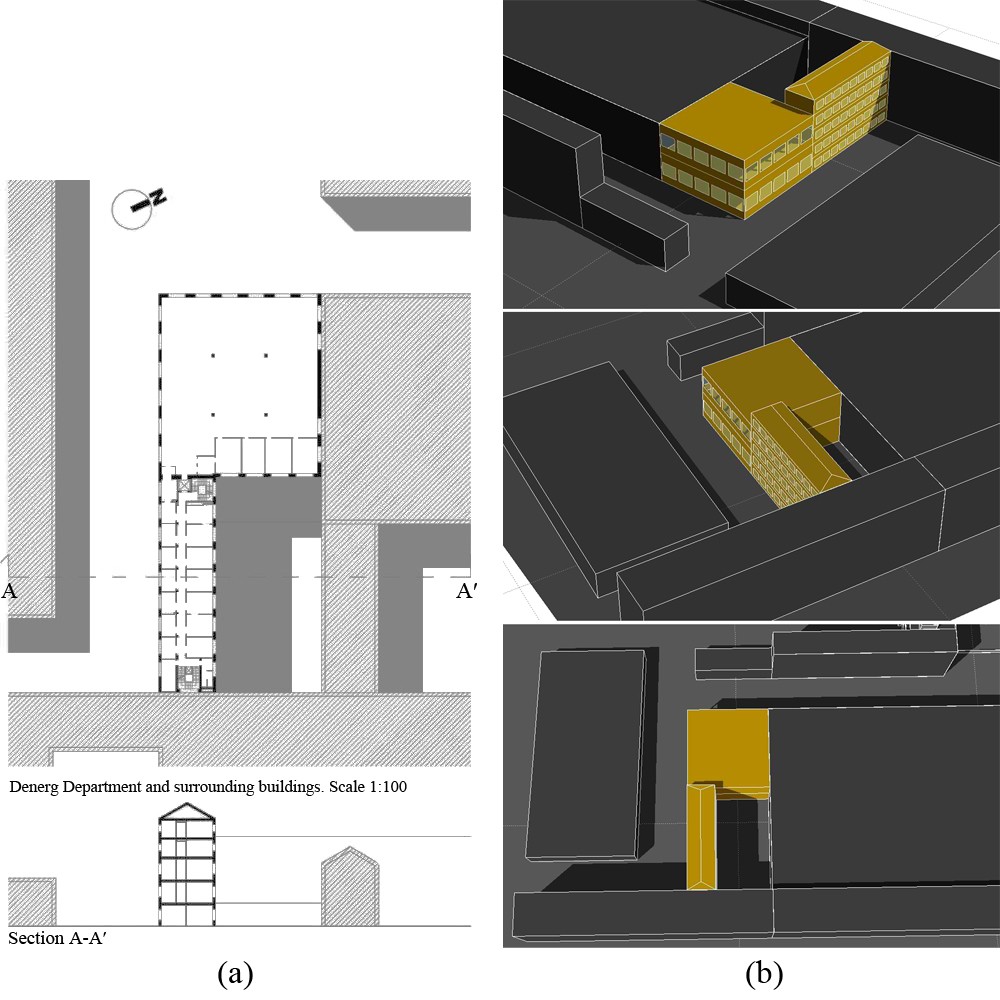
Fig. 1. Views of the DENERG building and of the surroundings: (a) plan view and crosswise section and (b) aerial views of the area (sketches).
Figure 2
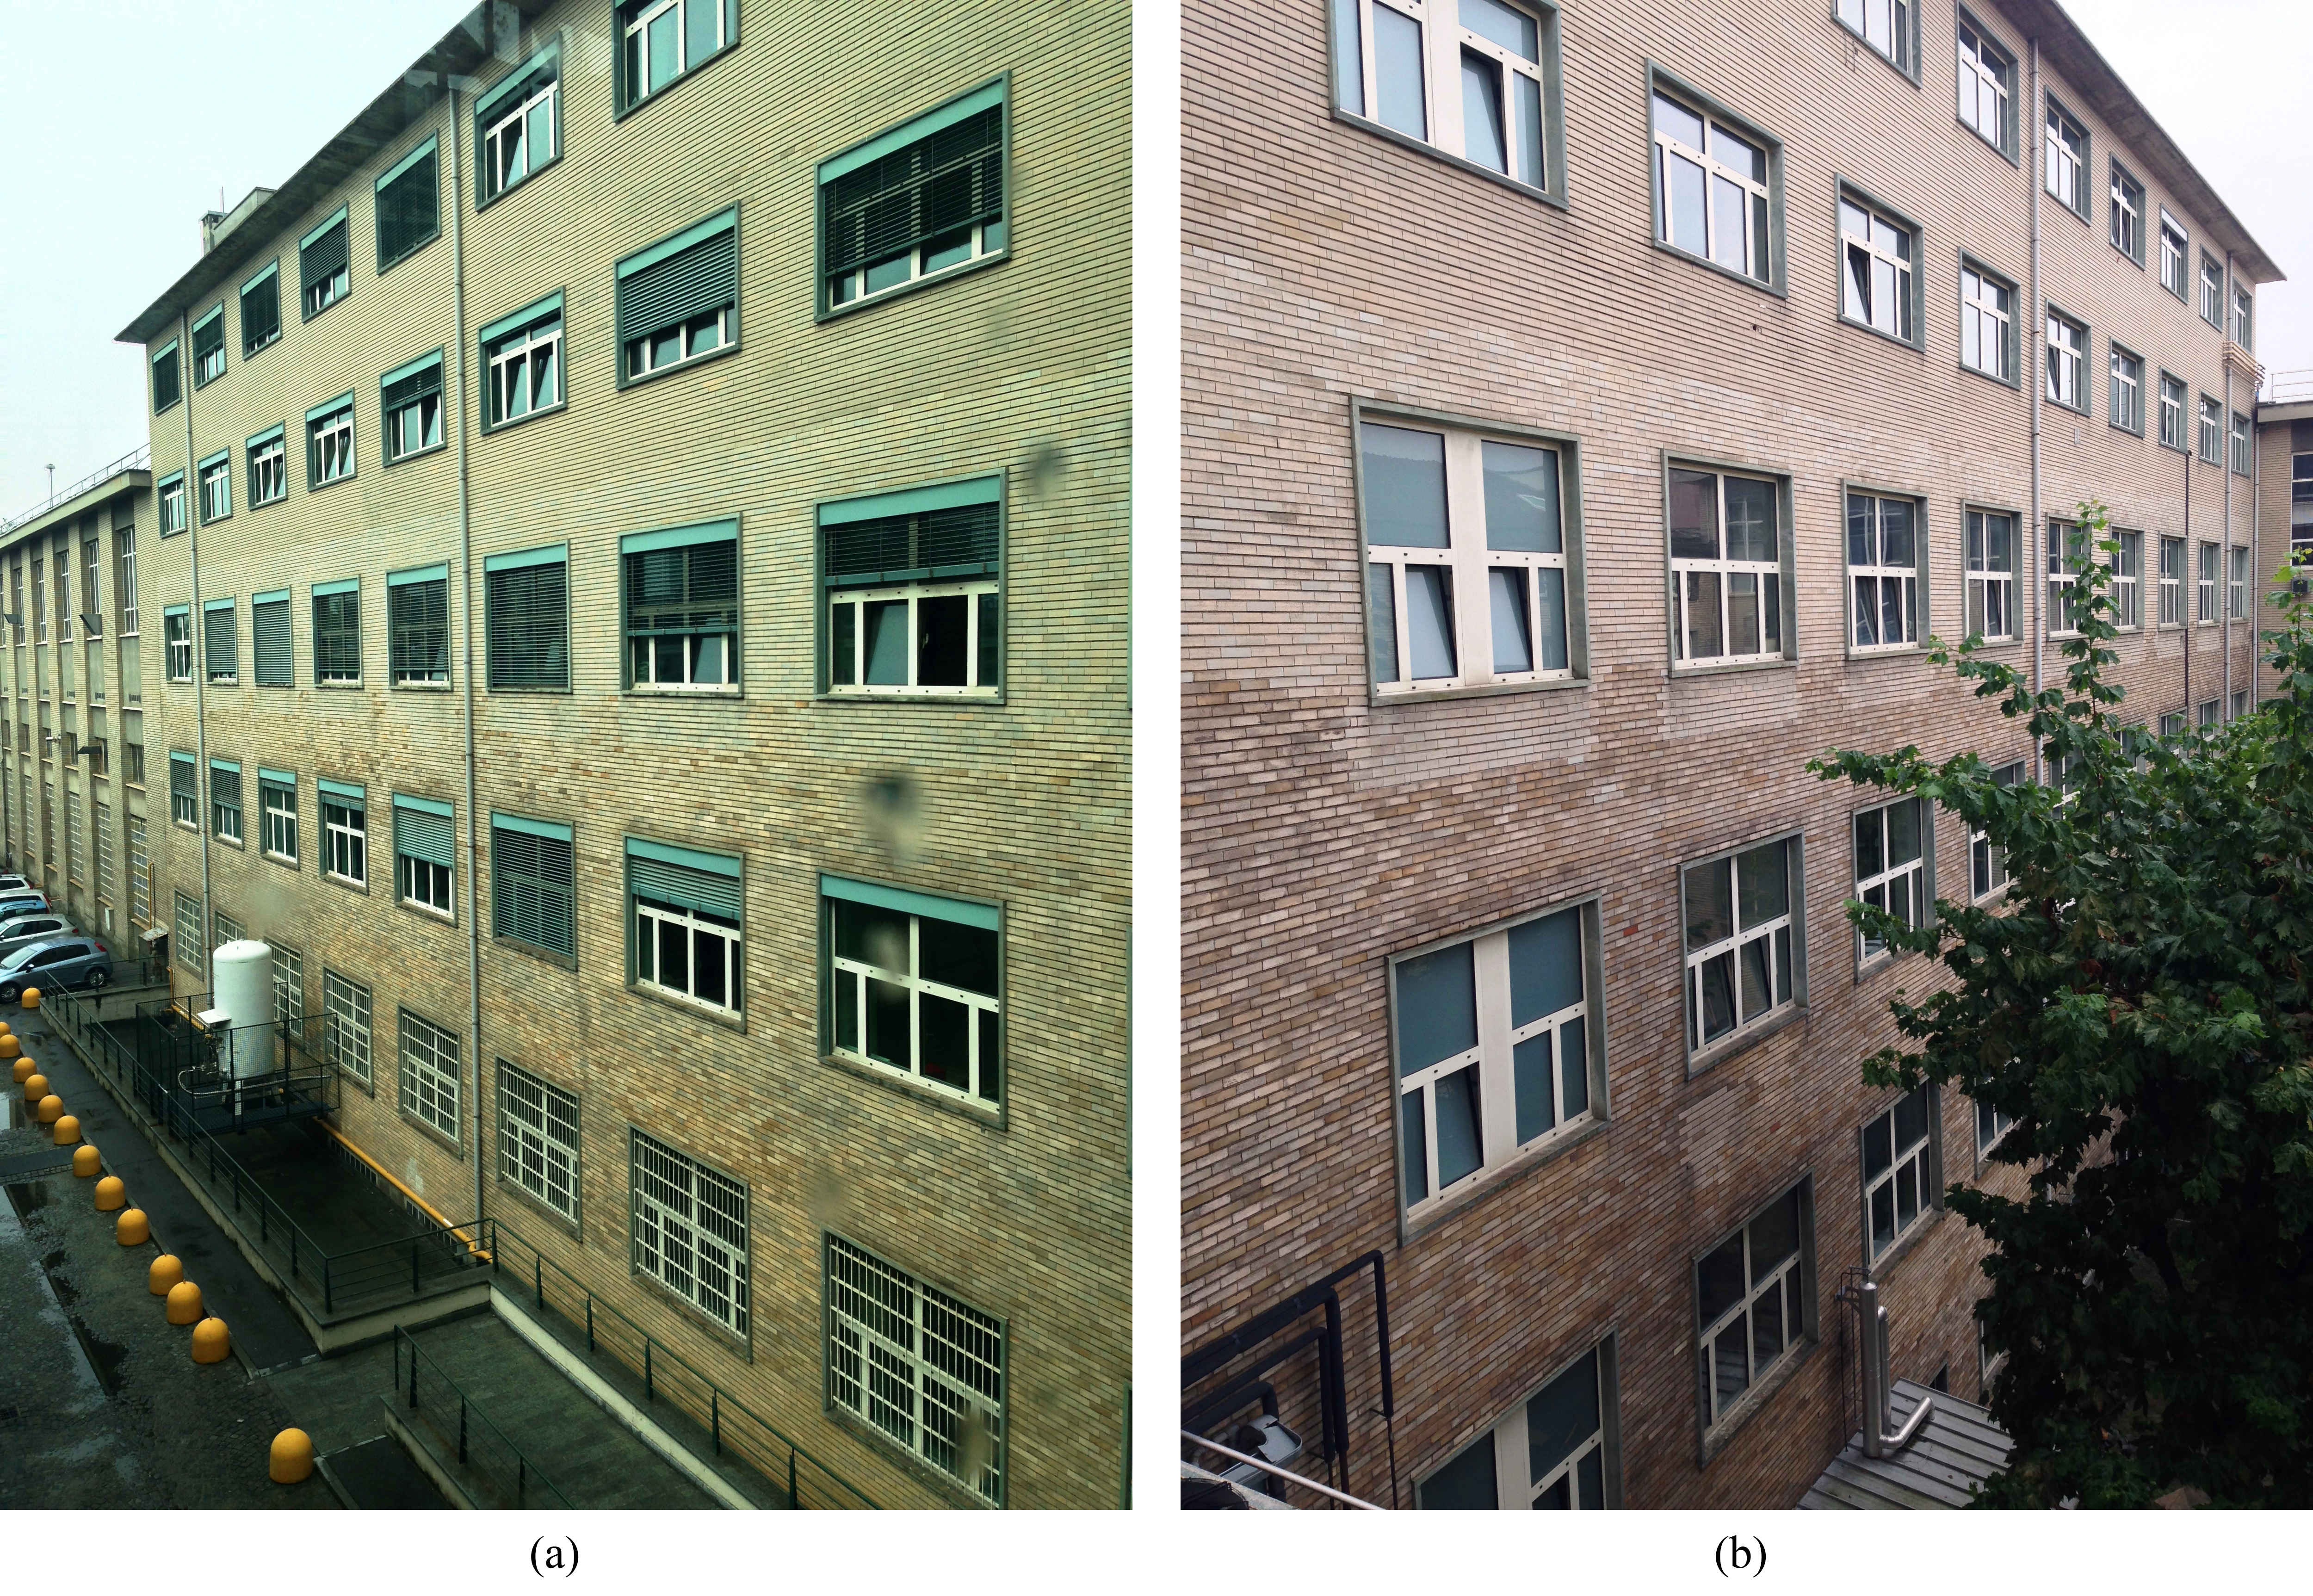
Fig. 2. Images of the DENERG building façades: (a) south-facing façade and (b) north-facing façade.
The library and 31 offices face north, 28 offices face south and 8 face west. The two laboratories face both south and east. The ground floor hosts the library and one of the two laboratories, while the other one is located on the second floor. The height of both the ground, first and second floor is 3.7 m, while it is 3 m for the third and fourth floor. The two laboratories have a height of 7 m (ground floor) and 4 m (second floor), respectively. Figure 3 shows the plan view of each floor.
Figure 3
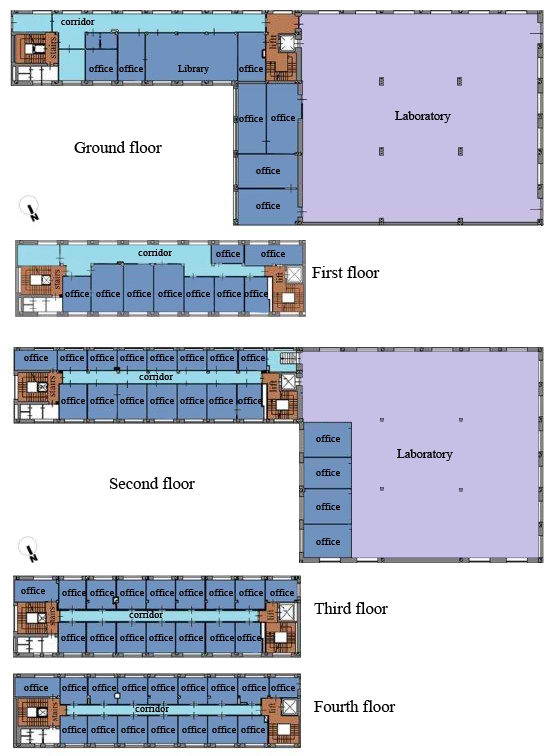
Fig. 3. Plan views of the five floors of the DENERG building.
All spaces of the building are daylit through side-lighting window. The north-facing offices have windows equipped with a single pane clear glazing (with a measured visible transmittance τvis of 84%), while the windows of south facing offices have been refurbished with double pane glazing (clear single glass plus selective glass, with a measured τvis of 55%). Most of the offices are equipped with manually controllable internal vertical blinds to shade daylighting, while in a few cases internal roller blinds (north-east-facing rooms) or external venetian blinds (south-east-facing rooms) are installed. These are also manually controlled. In all spaces, ceiling luminaires are installed, equipped with fluorescent lamps, except some luminaires in the corridors which are recessed. In all cases the lighting systems are manually controlled through a manual on/off switch). Table 1 summarizes the geometrical sizes of spaces and the installed lighting systems (power density and type of light sources).
Table 1
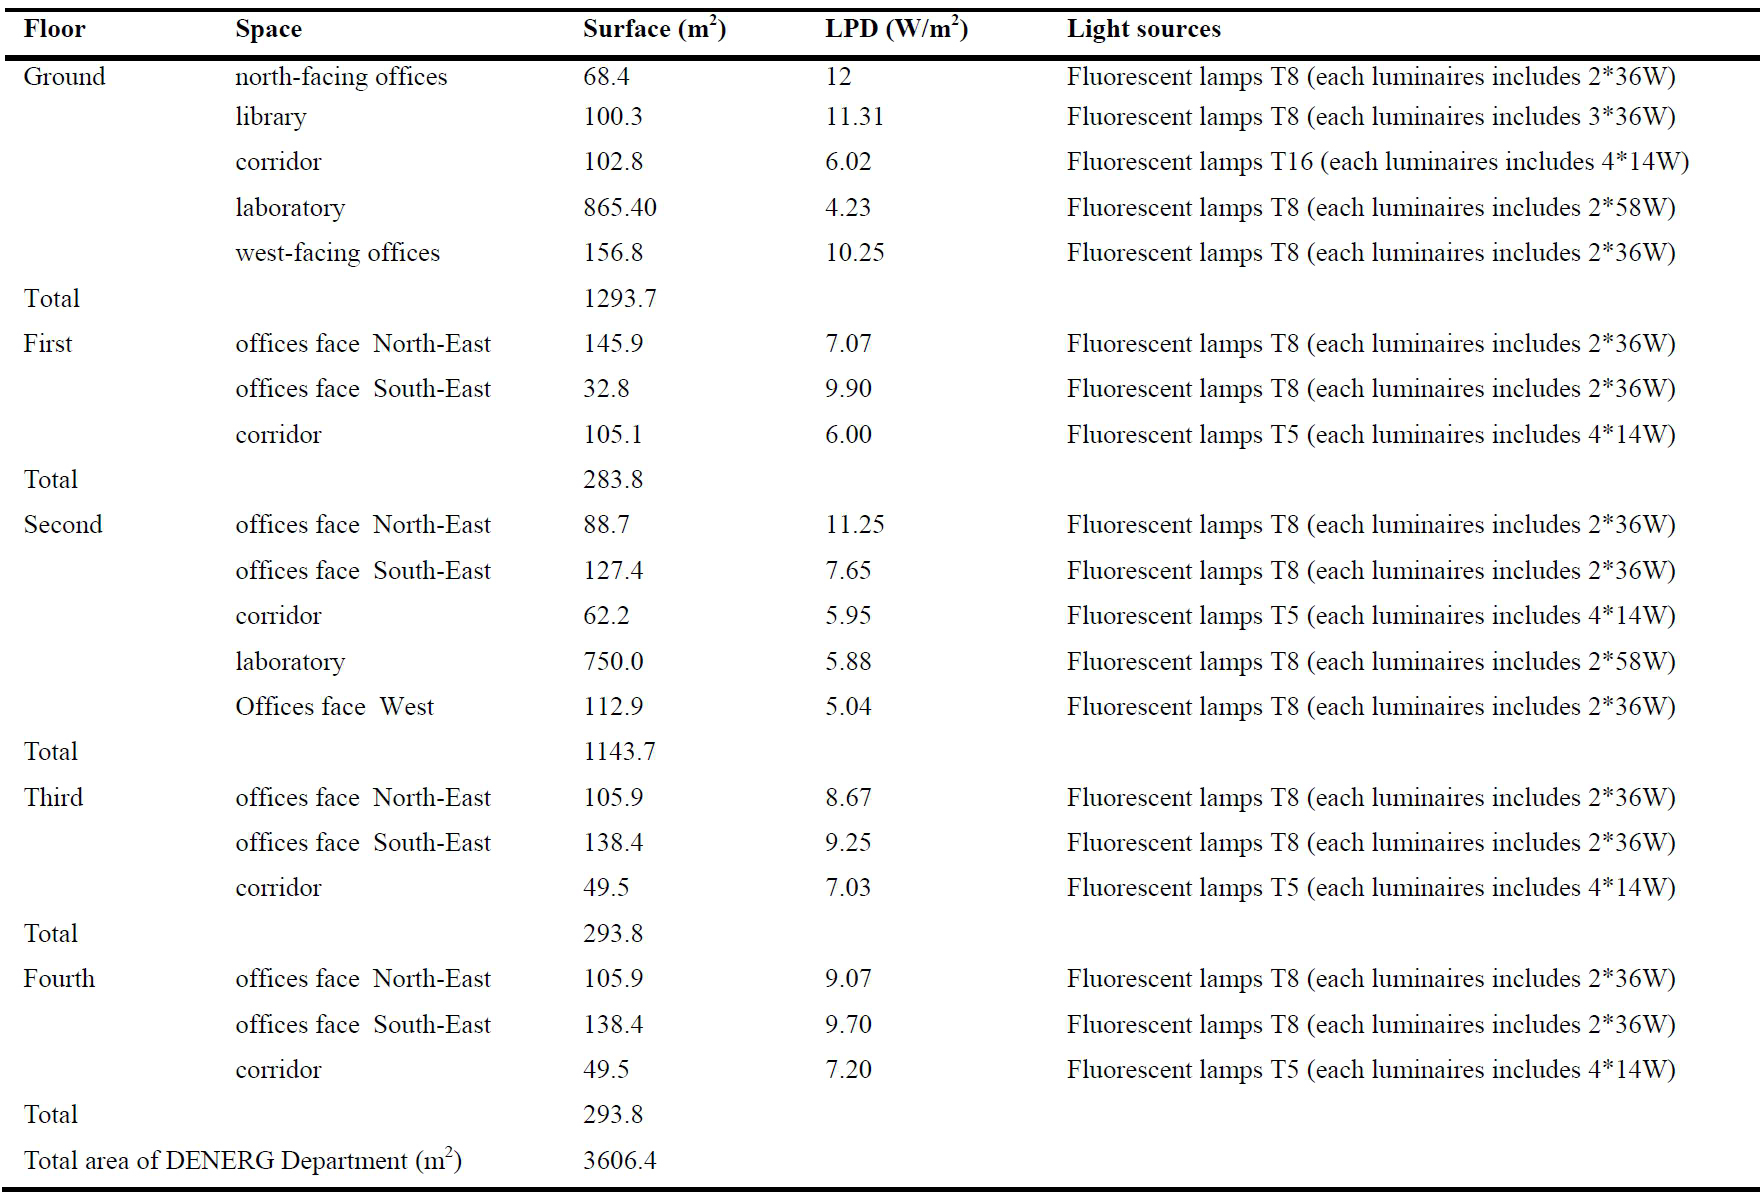
Table 1. Uniformity ratio achieved in the room through LCP (ratio of 4:6) under different ceiling geometries.
The DENERG building was built in 1958 with a not insulated envelope having the following average thermal transmittances [9]: U-value = 1.41 W/(m2K) for the walls; U-value = 3.68 W/(m2K) for the windows; U-value = 1.30 W/(m2K) for the roof and U-value = 1.15 W/(m2K) for the basement floor. The heating system is connected with the district heating network, while cooling is produced by a high efficiency heat pump with magnetic bearings (average COP = 4); the distribution system has no insulation and double pipe fan coil units (FCUs) are installed in offices, with a thermostat in each office. No ventilation system is installed in the offices, while laboratories are air-conditioned. Three rooftop air handling units (AHUs) provide heating/cooling as well as fresh air. Two gas-fired boilers provide hot water to all toilets and laboratories.
Heating, cooling, and hot water production consumptions were calculated with the continuous monthly method provided by the ISO/FDIS 13790 [11] and UNI/TS 11300 [9,10].
3. Method
The paper critically discusses the basic assumption of Italian standards for energy certification of a building, according to which internal gains are expressed through a flat value depending on the building use and the energy performance indices are calculated through Eq. (1).
An alternative procedure is proposed to calculate the internal gains, based on the role played by the internal gains from lighting on the energy demand for a building. From a theoretical point of view, unsuitable choices in terms of non-efficient light sources, luminaires and shading and light control systems result in an increased use of electricity (and hence in a higher EP1 value). This in turn results in an increase in the internal gains produced in the building, with more heat gains and a reduction in the net winter thermal losses resulting from the balance between inlet and outlet thermal fluxes. This balance is not considered in the procedure to calculate EPh. On the other hand, in summer the increased consumption for lighting determines a further thermal load for the cooling system, with a higher value of EPc, which is not accounted for in the energy certification process. The mutual influence between the various energy consumptions exchanged within a space was also highlighted in a study [38]. They showed how reductions in the lighting energy have secondary effects on cooling and heating energy consumption. This causes an increase in the heating and a decrease in the cooling requirements of a building. Furthermore, the authors also quantified that “the highest secondary savings, due to the lighting/HVAC interactions, on the HVAC energy consumption of the US building stock were generated in hospitals, large offices, large hotels; for every dollar saved through lighting energy efficiency in these building types, the additional savings as a result of reduced HVAC expenditures were $0.26, $0.16, and $0.14, respectively”.
The procedure developed uses internal gains from lighting as the key to connect internal gains to the energy demand for lighting and to the global energy demand for a building. Internal gains from lighting systems are determined according to the procedure prescribed in the European Standard EN 15193 [39] and used as input to calculate EPh, EPc and EPhw according to the Italian Technical Standards [10,11]. The procedure is described step-by-step in the following:
- The energy need for lighting was calculated in terms of LENI value, in (kWh/m2/a) for the DENERG building in Turin, Italy, according to the European Standard EN 15193 [39]. An Excel spreadsheet with macros in Visual Basics was specifically developed for this purpose. For validation purposes, the results which were obtained were compared with results from DIALux 4.10, which allows the LENI index for a room to be calculated according to the European Standard. Table 2 shows the values of the LENI dependency factors that were used for the evaluation [39]: Fc (constant illuminance factor) is the factor relating to the usage of the total installed power when constant illuminance control is in operation in the room or zone; Fa (absence factor) is the factor relating to the period of absence of occupants; Fo (occupancy dependency factor) is the factor relating of the usage of the total installed lighting power to occupancy period in the room or zone.
The LENI values were calculated on the basis of 2607 hours/year during which electric lights were switched on. This number of hours was quantified through a day-by-day calculation of the ‘daylight time usage (td)’ and the ‘non-daylight time usage (tn)’ throughout the year, using the sunrise and sunset times from solar geometries equations [39]. The LENI values were calculated for two different control systems for the lighting fittings:- a manual switch on-off control (which is the system currently installed in all spaces of DENERG)
- a daylight responsive photodimming control (a technology which allows energy saving to be obtained)
- For each annual LENI value, two partial values were also calculated so as to determine a LENI value for the heating period (lasting 7 months, October through April, for a total of 1514 hours of switching on of electric lights) and for the cooling period (3 months, June through August, for a total of 657 hours).
- From the annual energy need for lighting, the associated percentage emitted into the room as heat was derived: this represents an internal gain for the room. Based on a literature review, for linear fluorescent lamps (i.e. the typology of light sources currently installed in the DENERG building) such percentage was assumed to be equal to 75%: this value was considered as the best compromise between two different literature values of 79% [40] and 72.5% [41]. Furthermore, 75% is also the valued mentioned in a popular and widely used Italian reference book on lighting practice [42].
- The internal gains from lighting were converted and averaged into (W/m2).
- The total internal gains (in W/m2) were calculated by summing the internal gains from lighting (calculated in step 4) and from occupancy and appliances: this value was taken from the Table G9 of the Standard ISO/FDIS 13790 [11]: a value of 7.4 W/m2 is provided for the office spaces (assumed to cover 60% of the conditioned floor area), while for the remaining spaces (lobbies, corridors etc.) a value of 3.1 is provided. The area-weighted average value for internal gains from occupants and appliances is therefore equal to 5.68 W/m2; in this value, the gains from lighting are not considered, so the total gains were calculated as:
\[ Internal ~ heat ~ gains = (5.68+LENI)W/m^2 \]considering that the heat dissipated by the lighting devices is part of the internal heat gains.
- The value found for the total internal gains was used as input data for the calculation of all the individual and global energy performance indices EP for a building according to the Italian legislation and technical standards mentioned earlier.
- The energy performance indices for building heating, cooling, hot water production and lighting were calculated starting from the following three values assumed for the total internal gains:
- 6 W/m2 as set by the Italian legislation for offices;
- two values in (W/m2) obtained at step 5, one for switch on/off manual controls and one for photodimming controls; unlike the value of 6 W/m2, independent of the considered site and of the lighting control, the value obtained in step 5 is specific for the site of Turin and for the lighting control.
- The global energy performance index EPgl and the corresponding energy class for the DENERG building were calculated. The index EPl was calculated through the equation:
\[ EP_{l,floor} = \frac{LENI}{η_{el}}(KWh/m^2/a) \]where ηel is the average efficiency of the Italian thermal-electric plants and is assumed equal to 0.46 as specified by the Italian Regulatory Authority for Electricity Gas and Water with Resolution EEN 3/08 [43] (EEN 3:2008). Equation (3) is reported in the Italian version of the LEED protocol [44], so as to account for the European Standard EN 15193 [38], while it is not present in the original American version [45]. The LENI value, expressed in (kWh/m2/a), was subsequently converted in (kWh/m3/a):
- The whole procedure was reiterated assuming that the DENERG building was located in Palermo. The same time of switching on of electric lights (2607 hours/year) as for Turin was assumed. On the contrary, the heating and cooling periods for which calculating the LENI were changed: the heating period was set equal to 4 months (December through March, for a total of 864 hours of lights on), while the cooling period equal to 6 months (May through October, for a total of 1314 hours).
- Finally, the results obtained through the different approaches to calculate the internal gains (based on the flat standard value of 6 W/m2 and on the calculation of LENI values for manual and photodimming control systems for lighting) were compared.
The geographical and climatic characteristics of Turin and Palermo are summarized in Table 3. According to the Decree of the President of the Italian Republic n. 412:1993 [46], the Italian territory was subdivided into 6 climatic zones, based on the site specific Degree Days values during the heating season, ranging from warmest (labeled as ‘A’) to coldest (labeled as ‘F’) climate conditions. Nevertheless, only few sites actually are in the climatic zones A or F: for this reason, Turin (zone E) and Palermo (zone B) were selected as representative of climatic conditions for a large number of sites in southern Italy (Palermo) and northern Italy (Turin). Therefore, the comparison between the results obtained through the different methods was carried out with reference to these two sites.
Table 3
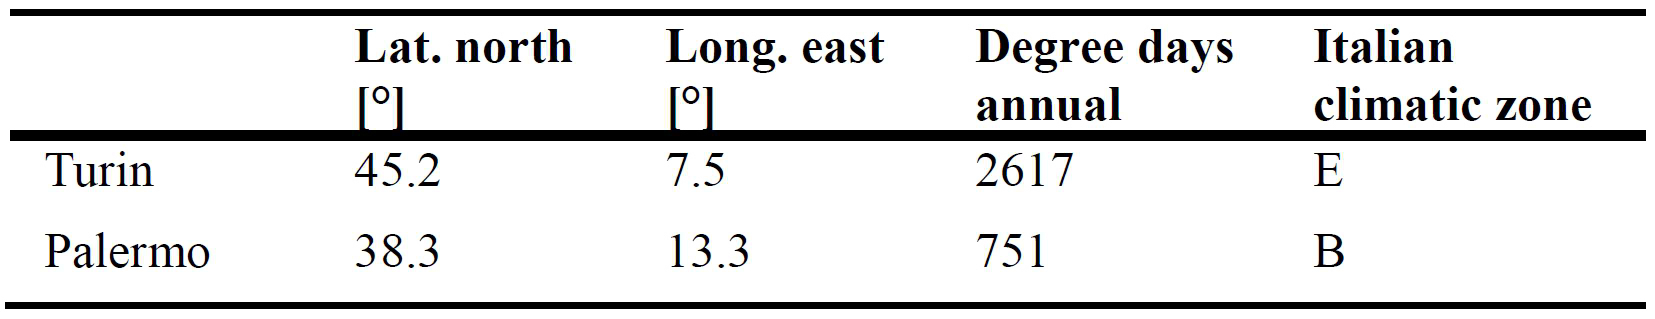
Table 3. Geographical and climatic characteristics of the Turin and Palermo are summarized.
A somewhat similar approach was adopted in [47], they carried out a study on the impact on the total energy need for a residential building for a number of alternative design options (concerning the envelope, in terms of insulation and thermal inertial properties, air renovation ratios, glazing, and shading systems) as well as three climates so as to account for the diversity of the Portuguese climate. If the approach can be considered somehow comparable, differences can be found in both the building usage (residential building in [47], office building in the present study) and the analyzed variables, as the internal gains (in particular from lighting) are not considered in [47].
For practical reasons, in the following sections the three above described approaches that were adopted for the calculation of the internal gains and of the building EPgl are in the following referred to as:
A: internal gains assumed equal to 6 W/m2 throughout the year (standard value)
B1: internal gains calculated starting from the LENI for the energy need for electric lighting when on/off switch controls are used (according to [39])
B2: internal gains calculated starting from the LENI for the energy need for electric lighting when photodimming controls are used (according to [39]).
4. Results and discussion
In this paragraph the main results from calculations and simulations are presented. Figure 4 shows the differences between the internal heat gain values determined through the three approaches A, B1 and B2. Figure 4(a) reports values calculated for the whole year: it can be observed that the standard approach A underestimates the heat gains compared to approaches B1 and B2; furthermore, using the on/off switch lighting control (approach B1), the heat gains are higher than what found in the presence of the photodimming control (approach B2). It is therefore evident that the implementation of a photodimming control allows a reduction in the energy demand for electric lighting, as expected. Figure 4(b) reports the internal heat gains values calculated through a seasonal approach, that is separately month-by-month with regard to the heating period (7 months for Turin vs. 4 months for Palermo) and to the cooling period (3 months for Turin vs. 6 months for Palermo). It can be observed that the internal heat gains are lower during the cooling than during the heating, thanks to the higher availability of natural lighting, especially with the photodimming control system.
Figure 4
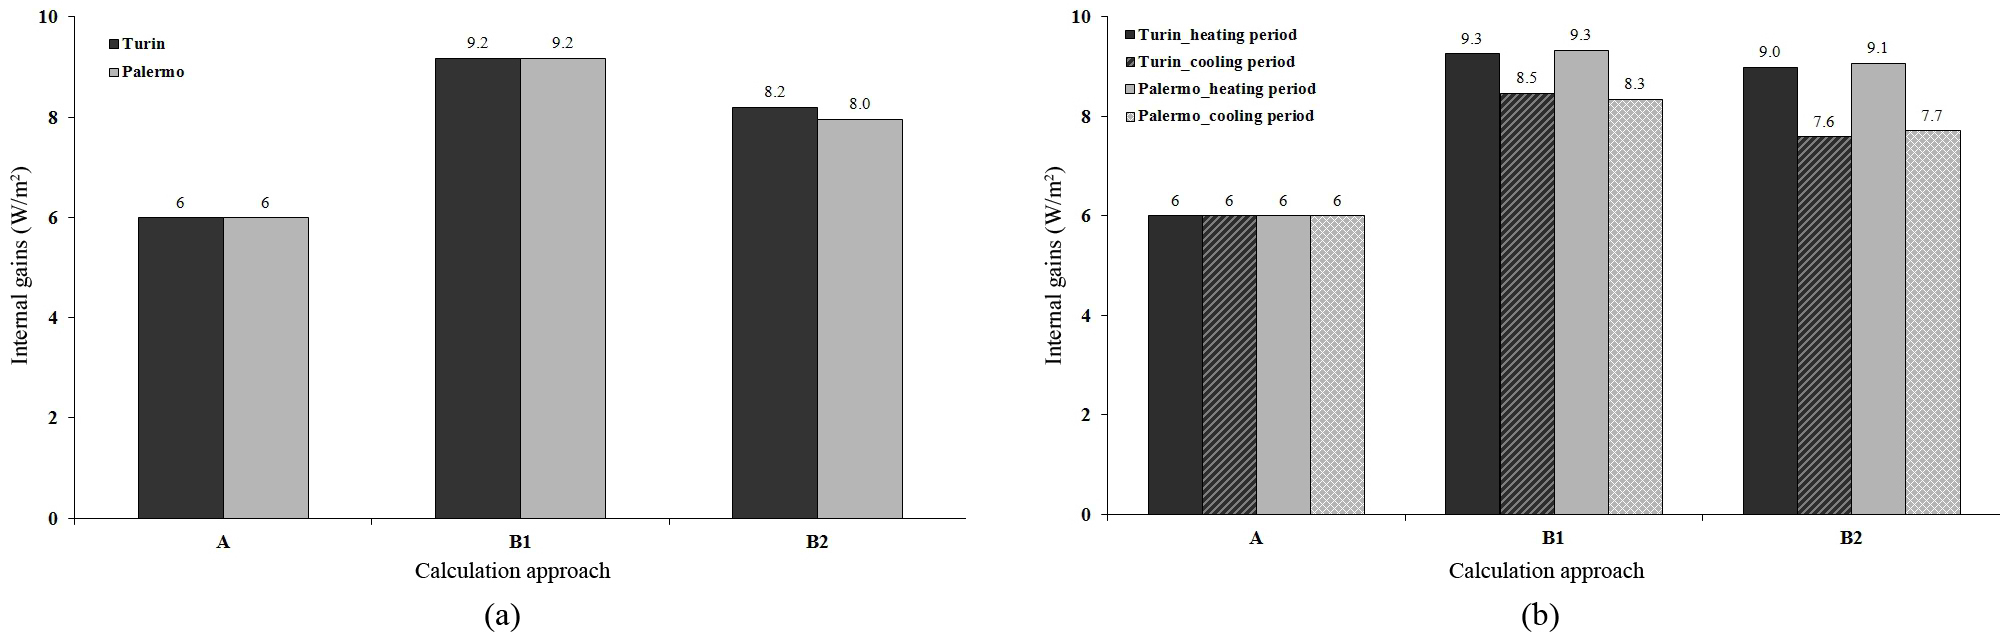
Fig. 4. Internal gains obtained for the DENERG building located in Turin and in Palermo for the flat value of 6W/m2 and for two lighting controls (manual switch on-off vs. photodimming): (a) reports the values obtained following the procedure for the whole year and (b) reports the values calculated month-by-month in winter and in summer.
From data shown in Fig. 4, the following considerations can be drawn:
- internal gains obtained introducing the LENI values are higher than the ones assumed from the reference standard value of 6 W/m2; the highest values were observed in the presence of a manual switch on-off control for lighting
- the difference between values for the same building in Turin or in Palermo is barely appreciable in the presence of a photodimming lighting control system, while internal gains have the same values in the presence of a manual switch on-off lighting control. This is due to the fact that the energy need for lighting in the presence of a manual control system is primarily concerned with the occupancy profile within the office building (which was assumed to be the same for Turin and Palermo) and does not account for the actual daylight availability within the indoor spaces. In other words, the presence of daylight is not exploited with this kind of control, unlike in the presence of a photodimming control
- internal gains calculated in a disaggregate manner through a seasonal approach for heating and cooling periods (Fig. 4(b)) are different compared to an average value of internal gains assumed for the whole year (Fig. 4(a)). As a result, seasonal internal gains may in turn have a different effect on heating and cooling thermal loads and subsequently on the energy consumptions. It is worth stressing that the monthly approach is more accurate in describing the variation of the internal gains and of the energy consumptions during the course of a year: the mutual interaction between the various EP indices is described avoiding the compensation derived from the approach based on an average value for the whole year. This suggests that internal gains need to be calculated separately for the heating and cooling summer period to calculate the EPgl value through Eq. (1).
In Fig. 5, we show the different EP values eventually determined as final output of the proposed procedure. The EPl can vary significantly of about 8 or 4 times depending on the calculation approach and on the presence of a photodimming sensor rather than a manual on-off switch, respectively. In Turin (six months of heating period), EPgl is highly influenced by EPh. The different calculation approach (B1, B2) and lighting control system can cause relative differences on the energy consumption of about 7% (compared to approach A). In Palermo, the heating season is comparable with the cooling season and the lighting consumption influences to a greater extent the global energy performance of the building. In this case, the relative differences between the approaches B1 and B2 and the approach A can reach 25%. The lower heat gains from lighting devices result in an underestimation of cooling and lighting consumptions, especially in Palermo; for these cases, the energy class of a building may change accordingly, considering lighting heat gains and devices consumption.
Figure 5
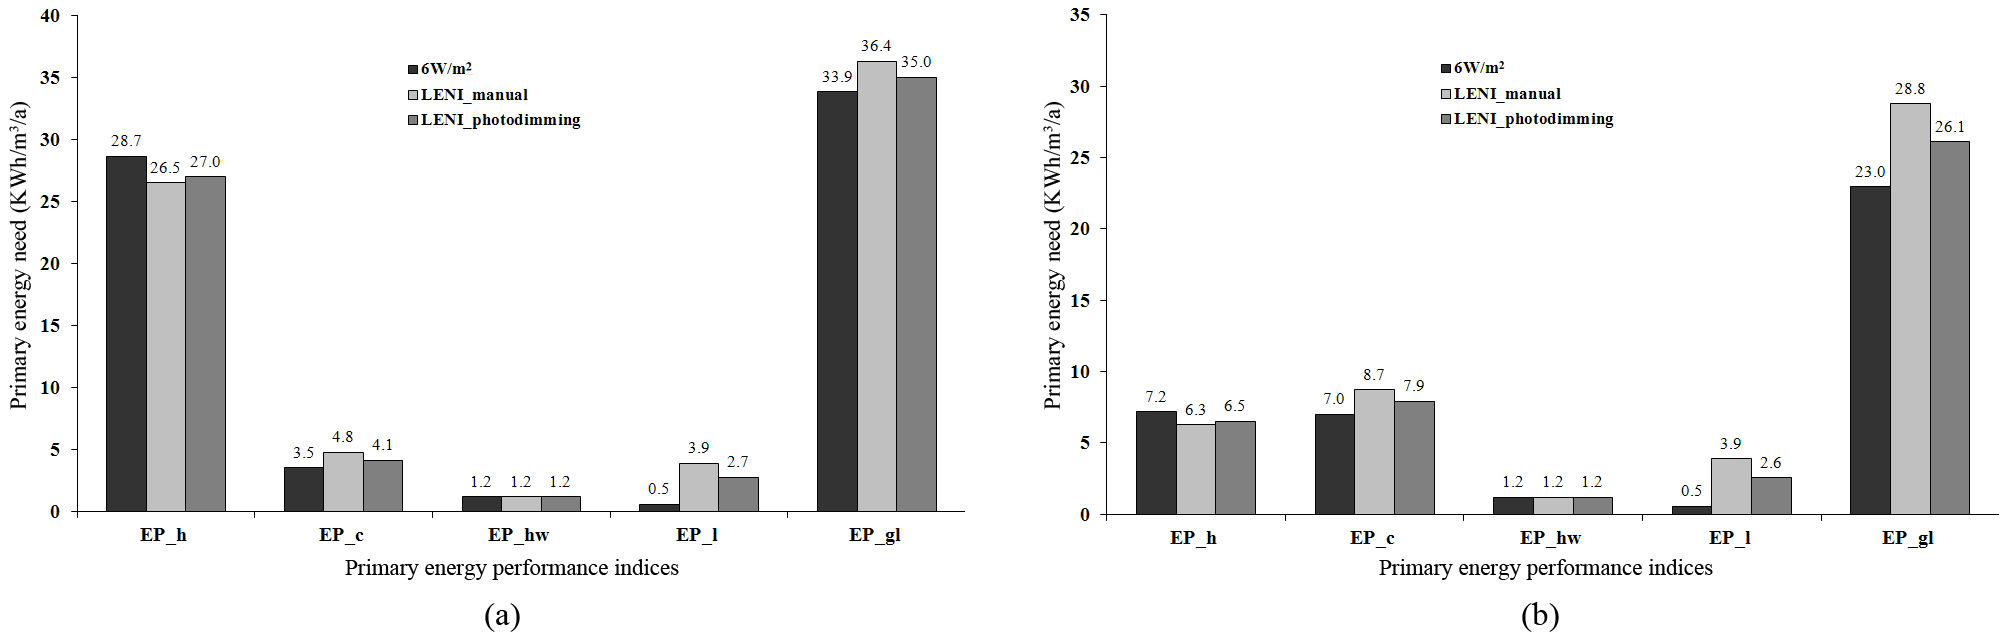
Fig. 5. Individual and global primary energy performance indices for the DENERG building located in (a) Turin (L=45.1°N) and (b) Palermo (L=38.3°N).
Table 4 summarizes the differences found in the various primary EP indices through approaches A, B1 and B2. The consumptions for hot water production are not reported as they are constant. The main differences were observed for the EPl values. In Turin, considering the higher lighting consumption which results in higher heat gains, EPh was lower using approaches B1 or B2 than using approach A, EPc was higher, EPl was much higher and EPgl was slightly higher. In Palermo, with lower consumption values during the heating season EPh, the results are much more evident with relative differences with the standard approach of about 25% or 14% with the manual on/off or the photodimming control, respectively.
Table 4
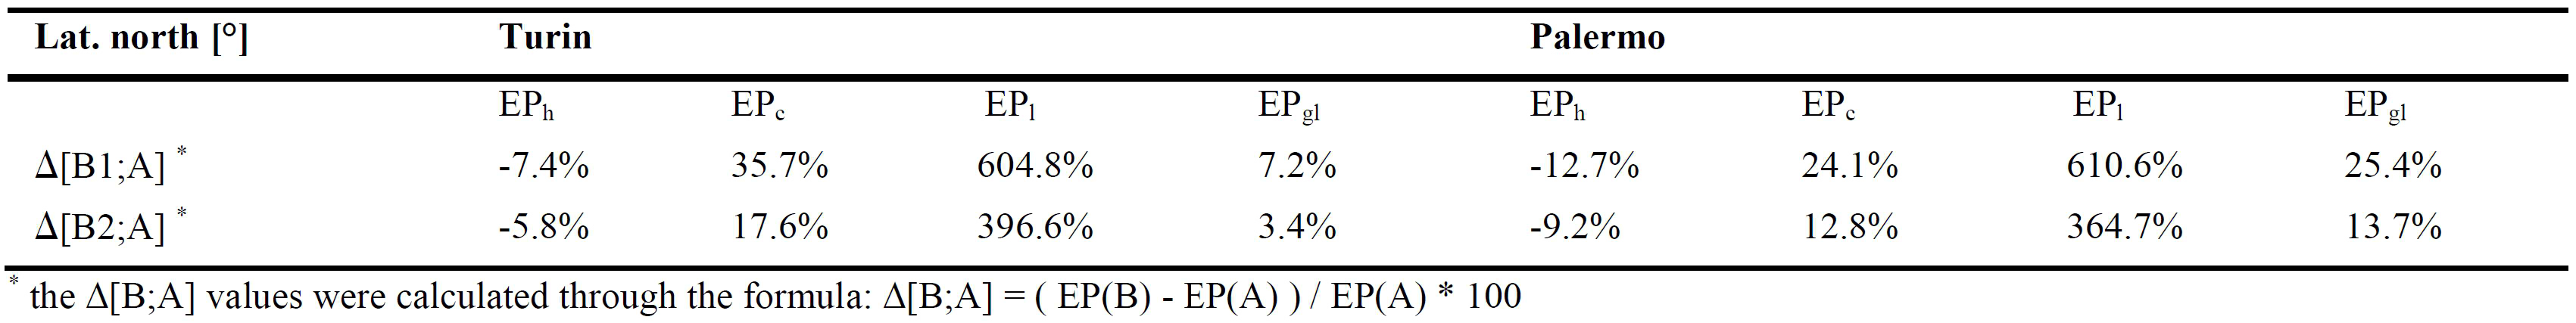
Table 4. Difference found in the various EP indices according tothe approaches A, B1, B2.
* the Δ[B;A] values were calculated through the formula: Δ[B;A] = ( EP(B) - EP(A) ) / EP(A) * 100
Analyzing the different EP indices calculated for the DENERG building (Fig. 5 and Table 4), the following main considerations can be drawn:
- the primary energy need for space heating, EPh, is higher for Turin than for Palermo (as expected); the values obtained through approaches B1 and B2 are higher than what found through approach A; the maximum difference was -7.4% for Turin and -12.7% for Palermo, in both cases in the presence of a manual switch on-off control. In spite of these differences, the DENERG building located in Turin is in the energy class (F) through all approaches A, B1, B2: this means that changing the procedure does not result in an energy class shift. Instead, a class shift was observed for the case of Palermo: a class (E) was found using approaches A or B2 and a class (D) using approach B1. Therefore, the use of manual on/off switch results in higher internal gains from lighting and hence in a lower energy demand for heating
- the primary energy need for space cooling, EPc, is lower for Turin than for Palermo (as expected); the maximum difference observed between approaches B1, B2 and approach A was +35.7% for Turin and +24.1 for Palermo (again, in both cases in the presence of a manual switch on-off control). In spite of these differences, the DENERG building located in Palermo results in the same energy envelope class (V) independently of the approach (A, B1, B2). Instead, a class shift was found for the case of Turin: class (II) with approach A and class (III) with approaches B1 and B2; the use of a photo-dimming control results in lower internal gains from lighting and hence in a lower energy demand for cooling
- the primary energy need for lighting, EPl, is practically the same for Turin and Palermo (consistently with what highlighted with regard to the internal gains from lighting, see Fig. 4); the maximum difference observed between the approaches B1, B2 and the approach A was +604% for Turin and +611% for Palermo. These high differences are due to the low values of the considered energy needs in absolute terms with the standard approach A
- the global primary energy need for all systems, EPgl, is higher for Turin than for Palermo (as expected) with an energy class of the building (F) and (D) or (E), respectively; the maximum difference observed between approaches B1, B2 and approach A was: +7.2% for Turin and +25.4% for Palermo (again, in both cases in the presence of a manual switch on-off control)
- the maximum difference was always observed when comparing approach B1 to the standard approach A.
The results which were obtained show that adopting a procedure based on the LENI index to calculate the internal gains from lighting and hence the EPh, EPc and EPl indices yields noticeable differences, compared to the approach of the Italian Technical Standards: an energy class shift may be caused and this plays a key role on the consideration of the overall energy use of a building and on its price in the real estate market.
According to the authors, this paper has the merit of highlighting a weakness in the procedure prescribed by the Italian Technical Standards for the energy certification of buildings, concerned with the way internal heat gains are considered, and to propose an alternate procedure, more accurate and based on scientific evidence. The proposed procedure relies on the LENI index, which quantifies the actual exploitation of daylighting and the integration between daylighting and artificial lighting, accounting for factors such as the installed lighting power density, the type of controls for lighting and blinds, the occupancy behavior and profile and the parasitic power contribution of lighting devices. With regards to the parasitic power contribution, it is necessary to highlight the important weight of such a value. For instance, a study carried out in [16] shows that the weight of the total energy required for standby system (WP,t) with respect to the total energy consumed (Wt) may be remarkable, taking into account the specific architecture of the control system designed to control the lighting system (the parasitic energy consumption monitored in the research activity was equal to about 1/4 of the total electric energy consumption for functional illumination).
As a matter of fact, the approach which was proposed has the merit to also include the design site, unlike the approach prescribed by the technical standards, which assume the same internal gain value for any site across the Italian territory. The proposed method accounts for the actual daylight availability which is a specific characteristic of the site to determine the energy use for lighting and hence the internal gains. Furthermore, it also takes the role played by different controls for the lighting systems into consideration, even though these are limited to a manual on/off switch and to a daylight responsive photodimming control. This way, the occupant behavior towards the lighting control is included into calculation procedure.
The definition of an appropriate way to account for internal gain is one of the factors which can cause discrepancies between energy modeling predictions and the actual in-use performance of occupied buildings. This study is somewhat complementary to a study in [48], which analyzed a number of parameters influencing the energy performance of a building and which states that “adopting different ways to calculate some significant input parameters can bring to a non-univocal determination of the energy performance indicator for the building. Since the energy certification should give a tool of comparison among buildings, the different calculation methodologies can introduce uncertainties and this is an important aspect to be considered in future developments of the National Standards and Laws. For this reason, it is important to define a univocal methodology for evaluating the energy performance of a building to preclude ambiguities in the energy class definition”. This study addressed factors such as the losses of heat generators, thermal bridges, thermal transmittance. It also showed how the procedure adopted to account for them may result in energy class shifts due to the variation of the EPgl values. Somewhat similarly, another study [49] critically reviewed recently developed models to accurately predict the building energy consumption, which include elaborate and simplified engineering methods, statistical methods and artificial intelligence methods. Each model has its advantages and drawbacks; therefore, it is difficult to say which one is better without a complete comparison under the same circumstances’. Internal gains from lighting are not specifically mentioned in their study: according to the authors, analyzing the role played by internal gains from lighting on the final energy need for a building represents a key factor of originality of the present study.
On the other hand, some limits concerned with the proposed procedure need to be stressed: the procedure is longer and more complex to achieve compared to the use of a flat value for internal gains and the difference is not always meaningful enough to justify the move towards the new procedure. Furthermore, this was applied to a case-study which consists of a single building, located in two sites characteristic of northern and southern parts of Italy. Before generalizing the findings, a larger number of case-studies should be analyzed, to verify how often the two different approaches eventually produce an energy class shift or significant differences.
Finally, it is important to highlight out that the EN15193:2007 standard is currently under revision by the Technical Committee CEN/TC 169 [50]. Besides, the TC is also working to draw up an informative Technical Report [51] to integrate the standard and better explain the procedure it reports. The results might be different if the new procedure for the LENI would be adopted.
5. Conclusions and future work
This paper critically discussed the procedure prescribed by the Italian Technical Standards to account for internal gains in a building energy certification process. This procedure is actually based on a tabular value set depending on the building usage only (that is 6 W/m2 for office buildings), independently of the site and of the controls for blinds and lighting systems. As main output of the study, a new procedure was proposed, which relies on the Lighting Energy Numerical Indicator (LENI) according to the European Standard EN 15193:2007 [39] to account for the integration between day- and electric lighting to calculate internal gains from lighting systems. These gains are summed to internal gains from occupants and appliances and then used to calculate the various energy performance indices for a building (for heating, cooling, hot water production and lighting). The proposed procedure is location-based as the exploitation of daylighting and its integration with electric lighting accounts for the site under consideration, as well as for the control systems installed for blinds and lighting systems: in the study, the use of a manual on/off switch and of a photodimming sensor was analyzed and the EP indices were calculated for a real case-study (the building hosting the offices and laboratories of Department of Energy of the Politecnico di Torino), assumed to be located both in Turin (northern Italy) and in Palermo (southern Italy). The EP values were calculated through the standard procedure and with the procedure proposed in the paper. It was found that LENI-based internal gains are higher than the standard value of 6 W/m2: this of course influenced the EPl, EPc and EPh values, in such a way that an energy class shift was observed depending on the approach which was used. This shift may in turn have an impact on the price of a building in the market and in the building’s construction. The economic aspects concerned with energy savings and the costs of lighting devices and control systems need to be studied to a larger extent.
Based on the findings highlighted in this paper, it is also worth noting that the choice of the simulation tool becomes of great importance: using a program based on the Italian standard is correct from a legislative point of view but may lead to a distorted final labeling of the building. The authors encourage the design team and the practitioners to adopt advanced dynamic simulation tools to predict with a higher level of accuracy the energy use and performance of a building, as “the thermal interactions between the electric lighting system and other systems, such as air-conditioning or heating systems, are too complex to be evaluated accurately using only indices previously developed for some typical buildings with ‘standard operating strategies’ ” [34].
As demonstrated in this study, the calculation methodology used can cause relevant uncertainties especially for low energy buildings: this is the case of the future new buildings from 2018-2020. In these cases, lighting can play an important role in the global energy consumption and a more accurate calculation methodology should be adopted considering the mutual influence of the different EP indices on one another.
The work is not considered fully completed by the authors. The procedure which was developed and proposed will be applied to a greater number of case-studies (other building types, other climates, both in Italy and in Europe). In this regard, it will be interesting to include in the analysis also non-European sites (i.e. sites non considered in the present version of the European Standard EN 15193:2007, which is valid for European sites whose latitude is between 38° and 60°N). For this purpose, the findings of the study [52] will be used: this study extended the validity of the European Standard to a high number of non-European locations. Furthermore, a parallel analysis will be run through validated dynamic simulation tools (such as Daysim and Energy Plus) so as to further assess the gap between standard and simulation approaches.
Moreover, the new version of the EN15193-1 of 2015 will be a further opportunity to extend the application of the procedure to some new case-studies taking into account of all the innovations introduced to calculate LENI values for both residential and non-residential buildings. All the planned future research will be integrated with an economic analysis, comparing the energy savings and the costs due to the installation and maintenance of control systems for lighting and shading systems.
Competing interests
None declared.
Contributions
V. R.M. Lo Verso conceived the project (together with Guglielmina Mutani) and coordinated the research team. He carried out the literature research, the daylighting analysis and the interpretation of the global results. He also wrote the manuscript. G. Mutani conceived the project (together with V. R.M. Lo Verso). She carried out the thermal-energy analyses to calculate the energy performance indices, and she cooperated in the interpretation of the results. L. Blaso wrote the Excel spreadsheet for the manual calculation of the LENI index and performed the manual and the DIALux simulations. She cooperated in the interpretation of the results.
References
- Directive 2009/28/EC. Directive of the European Parliament and of the Council of 23 April 2009 on the promotion of the use of energy from renewable sources and amending and subsequently repealing Directives 2001/77/EC and 2003/30/EC.
- Directive 2010/31/EU. Directive of the European Parliament and of the Council of 19 May 2010 on the energy performance of buildings (recast).
- Directive 2012/27/EU. Directive of the European Parliament and of the Council of 25 October 2012 on energy efficiency, amending Directives 2009/125/EC and 2010/30/EU and repealing Directives 2004/8/EC and 2006/32/EC (Text with EEA relevance).
- COM 772 008, Communication from the Commission - Energy efficiency: delivering the 20% target. Commission of the European Communities, COM (2008) 772 final Brussels, November 13, 2008.
- CEN M 343 – EN, Mandate to CEN, CENELEC and ETSI for the elaboration and adoption of standards for a methodology calculating the integrated energy performance of buildings and estimating the environmental impact, in accordance with the terms set forth in Directive 2002/91/EC, Comité Européen de Normalisation, 2004.
- B. W. Olesen and Michele de Carli, Calculation of the yearly energy performance of heating systems based on the European Building Energy Directive and related CEN standards, Energy and Buildings 43 (2011) 1040–1050. http://dx.doi.org/10.1016/j.enbuild.2010.10.009
- Decree, National guide lines for building energy certification (in Italian), Italian Ministry for the economic development, in: Gazzetta Ufficiale della Repubblica Italiana no. 158, July 10, 2009.
- Presidential Decree 59, Decree of the President of the Italian Republic DPR 59, 2009, Regulations for the application of the article 4, comma 1, letters a) e b), of the Legislative Decree 19 August 2005, no. 192, concerned with the application of the directive 2002/91/CE on energy efficiency of buildings (in Italian), In: Gazzetta Ufficiale della Repubblica Italiana n° 132, June 10, 2009.
- UNI/TS 11300–1, Building energy performance – Part 1: Evaluation of energy need for space heating and cooling (in Italian), 2008.
- UNI/TS 11300–2, Building energy performance – Part 2: Evaluation of primary energy need and of system efficiencies for space heating and domestic hot water production (in Italian), 2008.
- ISO/FDIS 13790, Energy performance of buildings - Calculation of energy use for space heating and cooling, International Standard Organization, 2007.
- CIBSE TM22, Energy assessment and reporting method, The Chartered Institution of Building Services Engineers, London, UK, 2006.
- P. Caputo, C. Gaia, and V. Zanotto, A Methodolohttp://dx.doi.org/10.3390/en6126274
- D. H.W. Li, K.L. Cheung, S.L. Wong, and T. N.T. Lam, An analysis of energy-efficient light fittings and lighting controls, Applied Energy 87 (2010) 558–567. http://dx.doi.org/10.1016/j.apenergy.2009.07.002
- A. Tzempelikos and A. K. Athienitis, The impact of shading design and control on building cooling and lighting demand, Solar Energy 81 (2007) 369–382. http://dx.doi.org/10.1016/j.solener.2006.06.015
- C. Aghemo, L. Blaso, and A. Pellegrino, Building automation and control systems: A case study to evaluate the energy and environmental performances of a lighting control system in offices, Automation in Construction 43 (2014) 10–22. http://dx.doi.org/10.1016/j.autcon.2014.02.015
- D. Wah Tong To, L. King Sing, T. Chung, and C. Leung, Potential energy saving for a side-lit room using daylight-linked fluorescent lamp installations, Lighting Research and Technology 34 (2002) 121–133. http://dx.doi.org/10.1191/1365782802li038oa
- S. Onaygıl and Ö. Güler, Determination of the energy saving by daylight responsive lighting control systems with an example from Istanbul, Building and Environment 38 (2003) 973–977. http://dx.doi.org/10.1016/S0360-1323(03)00034-9
- M. Krarti, P. M. Erickson, and T. C. Hillman, A simplified method to estimate energy savings of artificial lighting use from daylighting, Building and Environment 40 (2005) 747–754. http://dx.doi.org/10.1016/j.buildenv.2004.08.007
- M. Dubois and Å. Blomsterberg, Energy saving potential and strategies for electric lighting in future North European, low energy office buildings: A literature review, Energy and Buildings 43 (2011) 2572–2582. http://dx.doi.org/10.1016/j.enbuild.2011.07.001
- P. Benítez, J. C. Miñano, P. Zamora, R. Mohedano, A. Cvetkovic, M. Buljan, J. Chaves, and M. Hernández, High performance Fresnel-based photovoltaic concentrator, Optics Express 18 (2010) A25–A40. http://dx.doi.org/10.1364/OE.18.000A25
- R. Bull, N. Chang, and P. Fleming, The use of building energy certificates to reduce energy consumption in European public buildings, Energy and Buildings 50 (2012) 103–110. http://dx.doi.org/10.1016/j.enbuild.2012.03.032
- T.M.I. Mahlia, B.N. Taufiq, K.P. Ong, and R. Saidur, Exergy analysis for day lighting, electric lighting and space cooling systems for a room space in a tropical climate, Energy and Buildings 43 (2011) 1676–1684. http://dx.doi.org/10.1016/j.enbuild.2011.03.011
- A. Pino, W. Bustamante, R. Escobar, and F. Encinas Pino, Thermal and lighting behavior of office buildings in Santiago of Chile, Energy and Buildings 47 ( 2012) 441–449. http://dx.doi.org/10.1016/j.enbuild.2011.12.016
- X. Wang, C. Kendrick, R. Ogden, N. Walliman, and B. Baiche, A case study on energy consumption and overheating for a UK industrial building with rooflights, Applied Energy 104 (2013) 337–344. http://dx.doi.org/10.1016/j.apenergy.2012.10.047
- I. Yang, and E. Nam, Economic analysis of the daylight-linked lighting control system in office buildings, Solar Energy 84 (2010) 1513–1525. http://dx.doi.org/10.1016/j.solener.2010.05.014
- G. Young Yun, H. Joo Kong, H. Kim, and J. Tai Kim, A field survey of visual comfort and lighting energy consumption in open plan offices, Energy and Buildings 46 (2012) 146–151. http://dx.doi.org/10.1016/j.enbuild.2011.10.035
- G. Young Yun, H. Kim, and J. Tai Kim, Effects of occupancy and lighting use patterns on lighting energy consumption, Energy and Buildings 46 (2012) 152–158. http://dx.doi.org/10.1016/j.enbuild.2011.10.034
- S. Kim, and J. Kim, The impact of daylight fluctuation on a daylight dimming control system in a small office, Energy and Buildings 39 (2007) 935–944. http://dx.doi.org/10.1016/j.enbuild.2006.10.009
- D. H.W. Li, T. N.T. Lam, S.L. Wong, and E. K.W. Tsang, Lighting and cooling energy consumption in an open-plan office using solar film coating, Energy 33 (2008) 1288–1297. http://dx.doi.org/10.1016/j.energy.2008.03.002
- A. Carolina Menezes, A. Cripps, D. Bouchlaghem, and R. Buswell, Predicted vs. actual energy performance of non-domestic buildings: Using post-occupancy evaluation data to reduce the performance gap, Applied Energy 97 (2012) 355–364. http://dx.doi.org/10.1016/j.apenergy.2011.11.075
- D. Jenkins and M. Newborough, An approach for estimating the carbon emissions associated with office lighting with a daylight contribution, Applied Energy 84 (2007) 608–622. http://dx.doi.org/10.1016/j.apenergy.2007.02.002
- D.P. Jenkins, The importance of office internal heat gains in reducing cooling loads in a changing climate, International Journal of Low-Carbon Technologies, 4 (2009) 134–140. http://dx.doi.org/10.1093/ijlct/ctp019
- R Zmeureanu and C Peragine, Evaluation of interactions between lighting and HVAC systems in a large commercial building, Energy Conversion and Management 40 (1999) 1229–1236. http://dx.doi.org/10.1016/S0196-8904(99)00011-4
- EL-TERTIARY, Monitoring Electricity Consumption in the Tertiary Sector, 2008. Available at: http://www.eu.fhg.de/el-tertiary/
- M. Aydinalp, V. Ismet Ugursal, and A. S. Fung, Modeling of the appliance, lighting, and space-cooling energy consumptions in the residential sector using neural networks, Applied Energy 71 (2002) 87–110. http://dx.doi.org/10.1016/S0306-2619(01)00049-6
- EN 15603, Energy performance of buildings - Overall energy use and definition of energy ratings, European Committee for Standardization, Brussels, Belgium, 2008.
- O. Sezgen and J. G Koomey, Interactions between lighting and space conditioning energy use in US commercial buildings, Energy 25 (2000) 793–805. http://dx.doi.org/10.1016/S0360-5442(99)00085-7
- EN 15193, Energy performance of buildings – Energy requirements for lighting, European Standard, Distributed through the Comité Européen de Normalisation CEN, 2007.
- IESNA, Lighting Handbook, Illuminating Engineering Society of North America, New York, USA, 1999.
- R. Kane R and H. Sell H, Revolution in Lamps: A Chronicle of 50 Years of Progress, Second Edition, Taylor & Francis, London, UK, 2001.
- G. Forcolini, Lighting. Milan (Italy): HOEPLI (in Italian), 2004.
- EEN 3:2008, Aggiornamento del fattore di conversione dei kWh in tonnellate equivalenti di petrolio connesso al meccanismo dei titoli di efficienza energetica, Italian Authority for Electric energy and for gas EEN. GU n. 100, April 29, 2008 - SO n.107.
- GBC-Italy, Green building. Nuove costruzioni e ristrutturazioni (in Italian), Distributed through the Green Building Council Italy, 2009.
- USGBC, Green building, LEED 2009 for new constructions and major renovations, United States Green Building Council, USA, 2009.
- Presidential Decree 412, Decree of the President of the Italian Republic DPR 412, 2009, Regulations containing norms for designing, installing and maintaining HVAC systems aimed at reducing the energy need, as implementation of the Law n° 10 of the 9th of January 1991 (in Italian), in: Gazzetta Ufficiale della Repubblica Italiana n° 242, August 26, 1993.
- J. Ferreira and M. Pinheiro, In search of better energy performance in the Portuguese buildings—The case of the Portuguese regulation, Energy Policy 39 (2011) 7666–7683. http://dx.doi.org/10.1016/j.enpol.2011.08.062
- A. Magrini, L. Magnani, and R. Pernetti, The effort to bring existing buildings towards the A class: A discussion on the application of calculation methodologies, Applied Energy 97 (2012) 438–450. http://dx.doi.org/10.1016/j.apenergy.2012.01.012
- H. Zhao and F. Magoulès, A review on the prediction of building energy consumption, Renewable and Sustainable Energy Reviews 16 (2012) 3586–3592. http://dx.doi.org/10.1016/j.rser.2012.02.049
- PrEN 15193:1, Energy performance of buildings – Energy requirements for lighting – Part 1: Specifications. Standard under revision by the Technical Committee CEN/TC 169, 2015.
- PrCEN TR 15193:2, Energy performance of buildings – Energy requirements for lighting- Part 2: Technical Report to EN 15193-1, Technical Report under revision by the Technical Committee CEN/TC 169, 2015.
- M. Tian and Y. Su, An Improvement to Calculation of Lighting Energy Requirement in the European Standard EN 15193:2007, Journal of Daylighting 1 (2014) 16–28. http://dx.doi.org/10.15627/jd.2014.3
Copyright © 2014 The Author(s). Published by solarlits.com.

3169
Total views
Citations
SHARE ON


