Article Outline
5. Conclusions and future steps
Declaration of competing interest
Figures and tables
Volume 10 Issue 2 pp. 136-152 • doi: 10.15627/jd.2023.13
Sunlight-Daylight Signature: a Novel Concept to Assess Sunlight and Daylight Availability at Urban Scale
Valerio R. M. Lo Verso,⁎,a Giulio Antonutto,b Santiago Torresb
Author affiliations
a TEBE Research Group, Department of Energy ‘Galileo Ferraris’, Politecnico di Torino, 10129 Turin, Italy
b Ove Arup and Partners International, 8 Fitzroy St., London W1T 4BJ, UK
*Corresponding author.
valerio.loverso@polito.it (V. R. M. Lo Verso)
giulio.antonutto@arup.com (G. Antonutto)
santiago.torres@arup.com (S. Torres)
History: Received 13 July 2023 | Revised 14 August 2023 | Accepted 20 August 2023 | Published online 5 October 2023
Copyright: © 2023 The Author(s). Published by solarlits.com. This is an open access article under the CC BY license (http://creativecommons.org/licenses/by/4.0/).
Citation: Valerio R. M. Lo Verso, Giulio Antonutto, Santiago Torres, Sunlight-Daylight Signature: a Novel Concept to Assess Sunlight and Daylight Availability at Urban Scale, Journal of Daylighting 10 (2023) 136-152. https://dx.doi.org/10.15627/jd.2023.13
Figures and tables
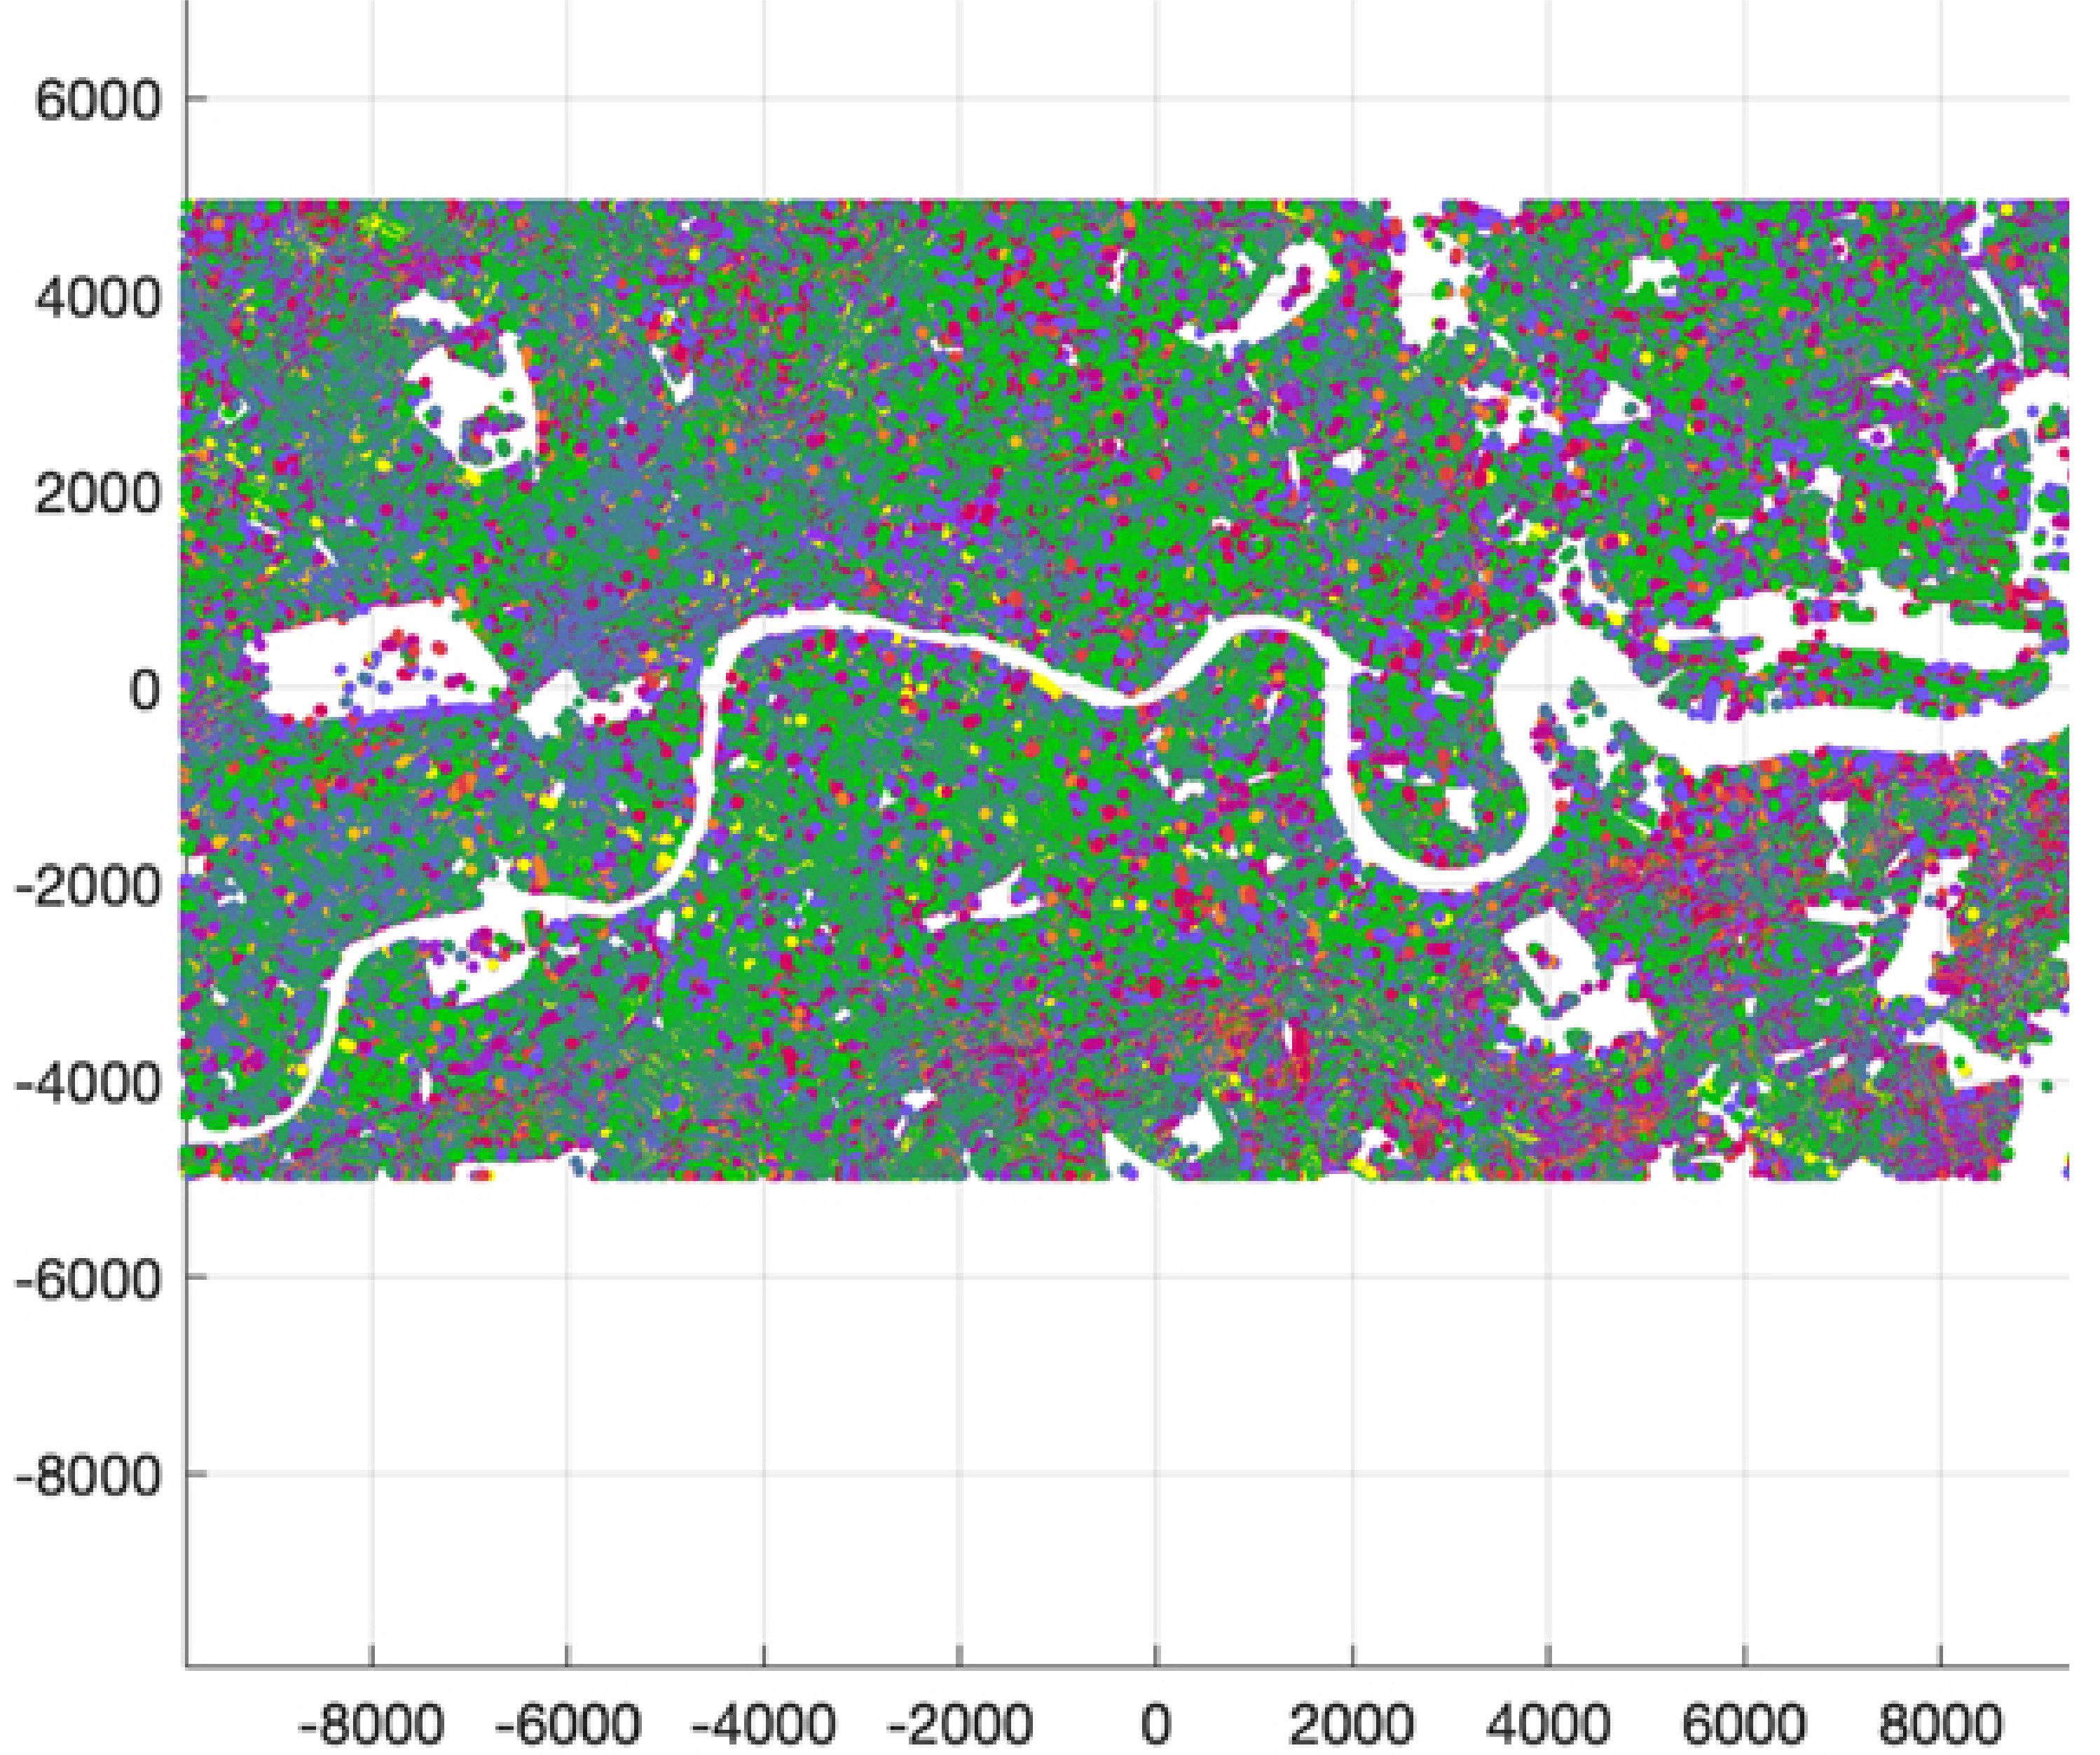 Figure 9
Abstract
Daylighting and solar availability at urban scale has come to play a crucial role in the perception of discomfort conditions for people, both in outdoor and indoor spaces, and on the energy consumption of buildings. Daylighting and solar analyses are typically done separately. The paper presents a novel method, called the ‘sunlight-daylight signature’ (SDS), which allows the qualitative analysis of urban settings with respect to sunlight and daylight. The method can be used to classify different urban settings in terms of daylight/sunlight access or to test new development proposals by referring to existing locations and confirm whether a certain daylight quality is met. The SDS relies on a new analysis tool, called ‘sunlight-daylight wedge’ (SDW), which combines obstruction (through the vertical sky component VSC) and sunlight access (through the annual probable sunlight hours PASH and the winter probable sunlight hours PWSH). The orientation of the façade at each point is also included as it will affect the times of the day when the sun-hours from PASH and PWSH occur, thus affecting the character of the corresponding sunlight. The SDS approach is based on a clustering technique to subdivide large datasets (in this case, daylight data points across entire cities or major urban areas) into smaller groups, using machine learning by way of the k-medoids clustering technique. This is used to derive typical daylight and sunlight scenarios representing groups of data points with similar conditions. Additional data is included to account for urban density and daylight availability in public areas. Final output of the clustering process consists of a map showing areas with the same daylight signature (SDS), which means areas with the same sunlight and daylight conditions. The SDS can be useful for urban planners and building practitioners to predict the access to both daylight and sunlight of large urban settings to optimize comfort for people and energy usage.
Keywords
Sunlight-daylight signature, Sunlight-daylight wedge, Urban daylighting, k-medoids clustering
1. Introduction
Studying daylighting and solar potential at urban scale has come to play a crucial role in the definition of two key issues: on the one hand, the perception of comfort/discomfort conditions for people, both outdoors and indoors; on the other hand, the energy consumption of buildings. While there is a vast literature on optimizing comfort conditions indoors (visual, thermo-hygrometrical, IAQ), along with the minimization of the energy demand due to both HVAC and lighting systems, the attention has been expanded from buildings to urban settings only more recently [1-12].
Daylighting and solar radiation are strongly interconnected, and the indoor environmental quality perceived by the occupants of an indoor space is directly affected by the amount of solar radiation admitted. This can cause overheating problems in summer, with an increased energy consumption for cooling, but have a beneficial role on the heat energy balance in winter, with a decreased energy demand for heating.
Thus, it has become more and more important to analyze the amount of solar radiation and daylight that can reach the external envelope surfaces of buildings, both on the roof and on the vertical façades, as a function of the climate of the considered city and the specific urban settings, in terms of density, urban canyons and/or mutual shading among different buildings, as well as the materials used to finish the building envelope [13-19]. For instance, Fernandéz et al. [20] studied for the city of Sevilla (Spain) the influence on daylighting inside buildings of several parameters, such as height, width of the street, orientation, vegetation, pavement, and materiality of the façades, with the goal of determining the optimal high-to-width ratio of a street to achieve optimum daylight and decrease the energy demand for lighting.
According to Ratti et al. [21], the energy performance of a building depends on four factors: (i) urban geometry; (ii) building design; (iii) efficient systems; and (iv) occupants’ behavior. Quantifying, modifying, controlling, and optimizing the amount of solar radiation and daylight that can reach buildings plays a crucial role in improving indoor environmental quality and global energy consumption. Moreover, it is a major factor in the potential of building envelopes (especially roofs) to collect solar radiation for photovoltaic electricity production [22]. Drago et al. [23] state that “The amount of daylighting indoors is related to the construction features, whose parameters are those of the urban legislation, as well as to the location features where the building stands”. Determining daylight/sunlight levels hitting building envelope in an urban context, especially in high-density ones, can also have an economic impact on the building value, or, within the same building, to specific units located on different floors: Turan et al. [24] carried out a study in Manhattan which showed that in a dense urban environment with a gradient in daylight levels, tenants greatly value high amounts of daylight, with a higher willingness to pay compared to spaces with a lower amount of daylight. They conclude that “daylight is a key design driver and thus should be considered in design, policy, planning, and project financing”.
It is therefore crucial to develop studies on the availability of sunlight and daylight at urban scale to support urban planning in addressing health, comfort, and sustainability issues, including the definition of massing geometry and materials for planning new districts, or retrofitting interventions of large urban areas [25,26]. Saratis et al. [27] point out that “it is now possible to quantify the performance of detailed design proposals before construction. Annual climate-based daylighting performance metrics for urban environments can be computed accurately, in high spatial resolution and in a timely manner. Massing design decisions at the urban planning level may make or break the long-term daylighting potential of a whole neighborhood, the adoption of these tools by zoning boards, developers and urban planners seems particularly relevant”. Several annual climate-based metrics have been defined, validated, and implemented in local standards and regulations for indoor spaces, such as spatial daylight autonomy, useful daylight illuminance, or daylight glare probability [28-31]. However, annual climate-based metrics for urban analyses are far more limited, which is a current methodological gap that research should bridge. Currently, some metrics and methods have been investigated as proxies to quantify the net radiation/daylight hitting a given surface within an urban context [32-36]. It is worth pointing out, though, that existing guidance and references often address the two fields, sunlight and daylight, separately. As a result, urban analyses have been approached in the literature with two, separated, main goals: (a) on the one hand, to calculate the temperature distribution over building surfaces and in surrounding outdoor spaces, to study urban heat islands UHI; (b) on the other hand, focusing on daylight availability over the building surfaces, particularly in the presence of the so-called urban canyons. One exception is a study by DeKay [37], where a method was developed to simultaneously address both sunlighting and daylighting (and wind) for the entire downtown district in the city of Chattanooga, Tennessee, USA. DeKay developed a composite technique, ‘Climatic Envelopes’, which regulates the shape of buildings on a block or site to protect access to both daylight from the sky and direct radiation from sun, by combining the ‘Daylight Envelope’ with the ‘Solar Envelope’. He used the result to develop a ‘Downtown Cooling Plan’ to cool the city by creating additional shade, channeling winds to bring ventilation to more buildings, and modifying the existing topography. However, it is worth stressing that there is a lack of studies and metrics that address sunlighting and daylighting simultaneously.
In the context of urban daylighting, it should be noted that existing guidance usually provides simplified, mostly geometrical references and requirements, based on the overcast sky worst-case scenario [38]. However, some methods were developed in the early 2000s to analyze urban daylighting: for instance, Capeluto and Shaviv [32,39] proposed two concepts to analyze urban daylight: the ‘solar envelope’, that is the space of all possible design solutions that either consider solar exposure or sun shading (depending on the problem addressed); and the ‘solar volume’, that contains all the building heights that allow solar access to each surrounding building, and at the same time are not shaded by the neighboring buildings. They also developed a tool, ‘SustArc’ for the calculation of the two concepts. Similarly, Miguet and Groleau [40] developed ‘Solene’, a set of numerical models for the simulation of natural light in both urban and indoor architectural spaces.
The progress in computer calculation capabilities allowed large datasets of daylight and sunlight levels to be computed for a very high number of sensors, to analyze daylighting and sunlighting in large areas and portions of cites. For instance, Nault et. al. [33] developed the UrbanSOLve decision-support tool for early-stage neighborhood design. It is intended as a novel workflow to enable practitioners to efficiently explore a space of design alternatives and compare them in terms of their energy and daylight performance, for conceptual neighborhood-scale design. The workflow includes a multi-criteria optimization algorithm, which is coupled to a performance assessment engine based on predictive mathematical models. The research presented in this paper is somewhat similar, as it is meant to provide a tool for urban daylight and sunlight availability by dealing with huge datasets that account for large city geometries (entire cities).
The next section (1.1) summarizes the main metrics used for urban daylighting analyses, while section 1.2. states the goal of the present study.
1.1. Overview of metrics used for urban daylighting analyses
The most pertinent metrics that are reported in some technical recommendations for urban daylighting analyses and that were used in the present study to build the sunlight-daylight signature SDS method are reported below:
1.1.1. Diffuse skylight
- Vertical Sky Component – VSC [38]: this the “ratio of the illuminance at a given point on a given vertical plane due to the light received directly from an overcast sky to the illuminance on an unobstructed outside plane under the same sky (which is the CIE standard overcast sky)”. Usually, the ‘given vertical plane’ is the outside of a window wall. VSC does not include reflected daylight, either from the ground or from other buildings. As is, it is a measure of the amount of sky visible from a centre point of a window.
The maximum percentage value for a vertical window with a completely unobstructed view under an overcast sky through 90° in every direction is about 39.6%. In order to maintain good levels of daylight the BRE 2011 guidance recommend that the VSC of a window should be 27% or greater. This corresponds to a sky angle θ visible from a given window (on a vertical plane, perpendicular to the window) of 65° or greater (with a complementary obstruction angle α of 25° or lower). If VSC is in the range 15%-27% (corresponding to θ between 45° and 65° and α between 25° and 45°), special measures, such as larger windows or changes in the room layout, are needed to provide adequate daylight. For a VSC lower than 15%, it becomes very difficult to provide adequate daylight, unless very large windows are used.
However, the BRE 2011 handbook makes allowance for different target values in cases where a higher degree of obstruction may be unavoidable such as historic city centres or modern high-rise buildings: the minimum VSC drops down to 15%-18%.
Nevertheless, it should be noted that the 27% VSC target value is derived from a low-density suburban housing model. The independent daylight and sunlight review states that in an inner-city urban environment, VSC values more than 20% should be considered as reasonably good, and that VSC in the mid-teens should be acceptable. However, where the VSC value falls below 10%, the availability of direct light from the sky will be poor. One thing to consider is that the range of VSC values is specific to the location of the receptors: for example, windows at ground floor will record lower values compared to windows of upper building levels. And so, for windows in courtyard corners it is impossible to have a clear view of the sky as the adjacent building massing stops 50% of the sky from being visible. This limit, to determine the suitable range of VSC for given city settings, has been one of the reasons for this study.
In general, it should be noted that the VSC-based criterion is intended as a worst-case scenario logic (referred to an overcast sky), based on the assumption that ‘If there is enough light when the sky is dark, then there is enough light the rest of the time’.
Starting from the VSC concept, Edward [41] developed a similar index for daylight design in high-density cities, called ‘Unobstructed Vision Area (UVA)’: it is defined as the sky angle ‘seen’ by the centre of a window, and it was adopted by the Government of Hong Kong.
1.1.2. Sunlight
- Annual Probable Sunlight Hours – PASH [38]: it represents the sunlight that a given window may expect over a year. PASH is defined as “the percentage of direct sunlight hours hitting the window centre divided by number of hours when sky was clear with sun”:
The sunny hours information is provided by the weather data file of the site considered.
- Winter Probable Sunlight Hours – PWSH [38]: similar to the previous APSH, it is defined as “the probable number of hours that sunlight will shine on the centre of a window, allowing for average levels of cloudiness for the location in question, during wintertime (6 month long)”:
Number of hours of direct sunlight on the surface during winter are considered from Sept. 21 to March 21, and number of sunny hours during winter are considered from Sept. 21 to March 21. Factors that impact PASH and PWSH include: orientation of the development; site weather; proximity and height of neighboring buildings; building articulation e.g. overhangs and balconies, skybridge; and location of towers or other high-rise buildings. Conversely, PASH and PWSH are independent on materials used on façades or environment and on building interiors.
BRE 2011 guidance states that only existing windows with an orientation within 90 degrees of South need to be assessed. In this case, the PASH received at a given window should be at least 25% of the total available (PASH ≥ 25%), including at least 5% in winter (PWSH ≥ 5%). Where the proposed values fall short of these, and the loss is greater than 4%, the proposed values should not be less than 0.8 times their previous value in each period.
The BRE 2011 has been recently replaced by a new edition of the guide [42]. The differences between the two standards are discussed later in the ‘Discussion’ section. For the present study, the PASH and PWSH concepts were used the method to build the sunlight-daylight signature SDS.
Table 1 summarizes and compares the properties of VSC, PASH, and PWSH.
Table 1

Table 1. Main features of SC, PASH, and PWSH, which are used for urban daylighting analyses.
1.2. Objectives of the research
As outlined earlier, two aspects represent a methodological gap for urban daylighting and sunlighting analyses: (i) existing guidance and analysis methods typically address sunlighting and daylighting separately, based on the concept of a worst-case scenario as design threshold between acceptance and failure; (ii) achieving a minimum threshold on a grid of receptors, though, does not provide any indication on the overall quality of a proposal: moreover, a district can include several thousand single receptors (for instance, VSC or PASH values), which means that some form of statistical analysis is needed to represent such heterogeneous contexts.
The research questions addressed in the study were:
- is it possible to produce a ‘performance vector’ which encapsulates at once all factors relevant to daylight in urban settings: orientation, latitude, climate, sunlight exposure and obstruction to daylight?
- is it possible to use this performance vector to analytically characterize an urban setting regarding sunlight and daylight availability and thus allowing comparison between different areas of a city to a set of reference scenarios?
2. Methodology
To bridge the research gaps outlined earlier, the study proposes a novel method, called ‘sunlight-daylight signature SDS’: this is meant to be allow characterizing, analyzing, and comparing different urban settings in the same city, or different alternatives for the same urban setting, in terms of both sunlight and daylight availability. The SDS approach is based on a clustering technique to subdivide large datasets into smaller groups, for analysis and comparison purposes. The methodology presented here uses machine learning and large datasets to derive typical daylight and sunlight scenarios which represent similar conditions.
In more detail:
- to address RQ 1, the SDS approach relies on a new concept that was specifically developed, the ‘sunlight-daylight wedge SDW’. This is the ‘performance vector’ and is defined as the locus of the points in the VSC/PASH/PWSH space. Each point can be defined by a combination of VSC, which purely accounts for level of obstruction under diffuse skylight, and PASH and PWSH, both able to account for obstruction, orientation of buildings, and climate of the site considered
- to address RQ2, the data generated through the SDW were classified and compared through a clustering technique that is based on one of the many unsupervised machine-learning algorithms: the k-medoids technique as implemented in Matlab.
The final output of the clustering process is a classification of a large number of areas of an urban setting (blocks of buildings, entire districts, up to a whole city) through the ‘sunlight-daylight signature SDS’: clusters of areas with the same signature can therefore be compared.
SDW and SDS were applied to the urban context of Central London, UK.
In short, the novel method presented in this paper, based on SDS, is meant to (Fig. 1):
Figure 1
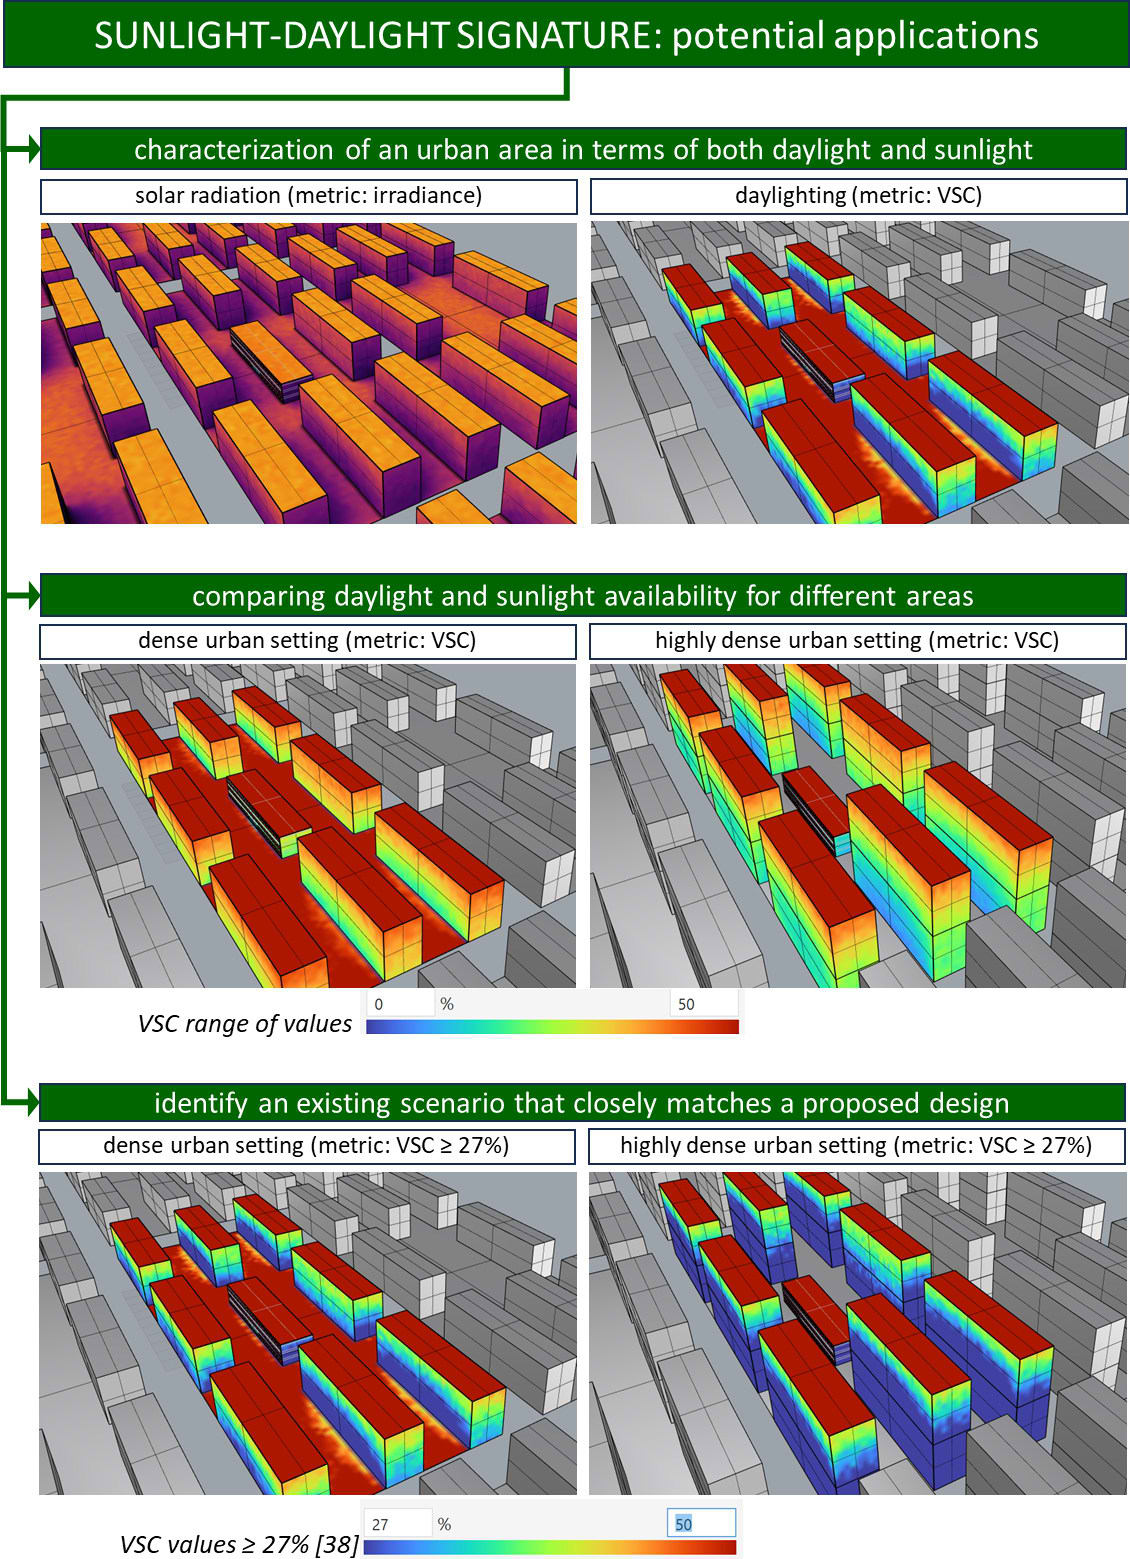
Fig. 1. Potential application of the method based on the sunlight-daylight signature SDS.
- allow the characterization of an urban area according to both its daylight and sunlight performance
- allow daylight and sunlight availability to be compared for different areas of an urban setting, and thus areas with a similar ‘daylight/sunlight’ footprint to be grouped, having a similar performance
- identify an existing scenario that closely matches a proposed design
- or inform a design to closely match an existing scenario.
The “what” and “what for” are concerned with the construction of the ‘sunlight-daylight wedge SDW’ and of the corresponding ‘sunlight-daylight signature SDS’ to simultaneously account for the sunlight and daylight footprint of an urban context. These clusters (SDW and above all SDS) allow for a comparative analysis in the same city of the following urban planning issues: analyzing common problems, and the approaches that the community of architects and designers found in different areas of different cities, who share common characteristics, etc. Cities are divided into sectors with common characteristics, and then work can be done on each one of them.
The ’how’ of the methodology is based on the k-medoids method is explained, in which k clusters of similar or close data are generated, according to a distance measure.
2.1. The sunlight-daylight signature method step-by-step
The sunlight-daylight signature SDS methodology consists of six steps, from the definition of receptors to the evaluation of their daylight/sunlight performance, to their clustering into typical receptors and then to the evaluation of their distribution within a large number of areas, which are finally classified into typical signatures. Figure 2 shows a diagram that illustrates the various steps.
Figure 2
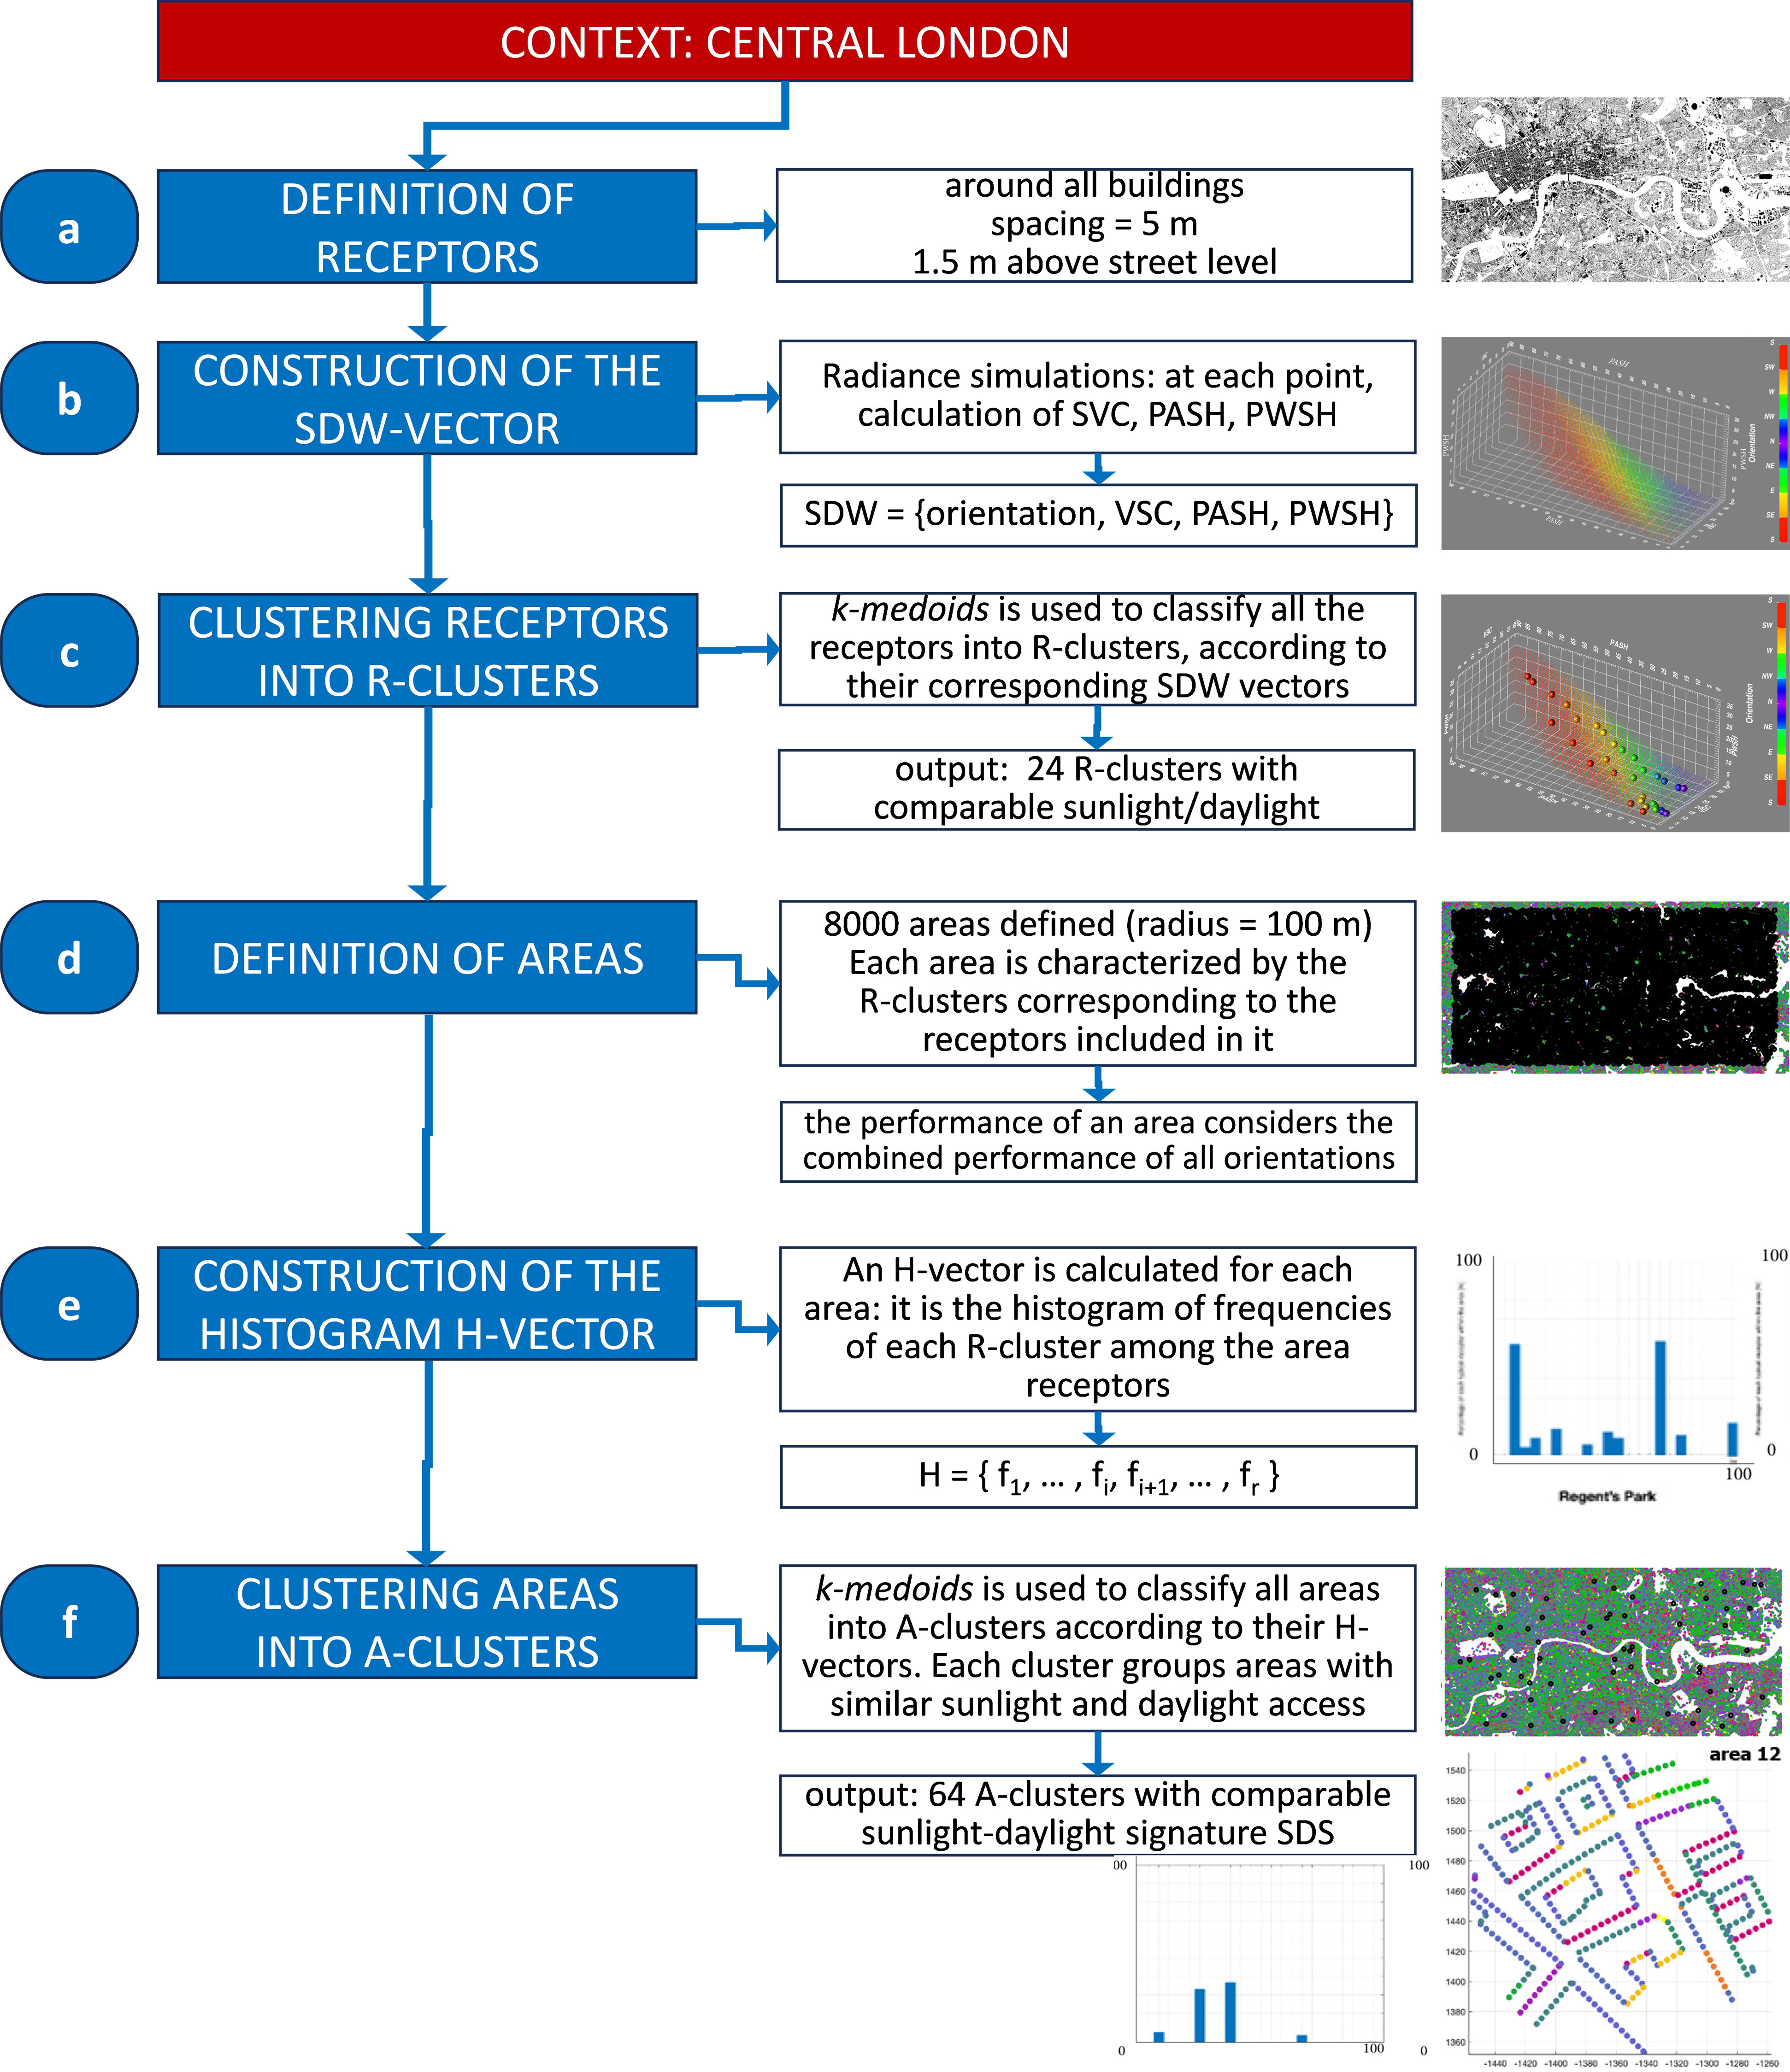
Fig. 2. Workflow of the process for the clustering into areas with a comparable sunlight-daylight signature SDS, applied to the case-study of Central London.
(a) Definition of receptors
These are the locations for each point where the daylight metrics are to be calculated. Receptor points are placed around all buildings in a 3D model at regular intervals and at a set height from the ground. In this study, a GIS model for Central London was adopted. The 3d computer model was then used in conjunction with the Radiance ray tracing system to calculate VSC, PASH, and PWSH for receptors located at ground floor, around all buildings, placed with 5m spacing, and 1.5m above the street level. This was done to refer to the lowest occupied level inside buildings. The points where daylight and sunlight were evaluated were determined based on the guidance by BR 209 [38], which is to place points at no more than 5m from each other, 1.6m above ground. This is a standard method which thus produces results which are comparable with other studies which use BR 209 as the basis.
(b) Calculation of VSC / PASH / PWSH / orientation: construction of the SDW-vector
The sunlight and daylight conditions were analyzed by collecting at each receptor the values of four data: orientation, PASH, PWSH, and VSC. This set of values was combined, for each receptor, the into a 4-dimensional vector, the sunlight daylight wedge SDW:
The visualization of these results through the sunlight-daylight wedge (SDW) allows the characterization of the urban fabric in relation to the local climate.
The orientation of the façade at each point was also considered, as it affects the times of the day when the sun-hours measured by PASH and PWSH occur, thus affecting the character of the corresponding sunlight. The graphical representation of the sunlight-daylight wedge SDW is used to analyze the distribution of values in each dimension, with the objective of showing how sensitive SDW is to the effects of orientation and sky obstruction at ground level.
To test how the graphical representations of the SDW can effectively visualize the sunlight/daylight footprint at a given site, other locations with a different climate and solar geometry were compared, with the objective of showing how sensitive SDW is to the effects of climate that is specific for the site considered. The SDW was plotted for 6 different weather files, using the same city geometry with the goal of compare the impact of the climate on the SDW:
- London/Gatwick_GBR.IWEC, lat. 51.15°N, long. 0.18°E, 62 mamsl
- IWEC, lat. 52.47°N, long. 13.40°E, 49 mamsl
- SWERA, lat. 27.70°N, long. 85.37°E, 1337 mamsl
- IWEC, lat. 25.07°N, long. 121.55°E, 6 mamsl
- ITMY, lat. 38.05°N, long. 46.17°E, 1361 mamsl
- ITMY lat. 31.88°N long. 54.28°E 1237 mamsl.
(c) Clustering receptors into R-clusters
An unsupervised learning algorithm (k-medoids) is used to classify all the receptors into clusters (R-clusters), according to their corresponding SDW vectors.
k-medoids clustering algorithm was used in MatLab to determine the different types of receptors. This algorithm is an unsupervised learning method, similar to k-means. Both the k-means and k-medoids algorithms are partitional (able to break the dataset up into groups) and attempt to minimize the distance between points labeled to be in a cluster and a point designated as the center of that cluster by minimizing the mean square error. However, in contrast to the k-means algorithm, k-medoids chooses actual data points as centers (medoids or exemplars), and thereby allows for greater interpretability of the cluster centers than k-means, where the center of a cluster is not necessarily one of the input data points.
The k-medoids technique splits the data set of n objects into k clusters, where the number k of clusters is selected a priori (which implies that the programmer must specify the value for k before the execution of a k-medoids algorithm).
In this case, the clustering uses the orientation and the sunlight and daylight metrics components of the SDW-vector. The output is a set of R-clusters of receptors based on orientation, obstruction, and solar/daylight exposure, where each ‘typical’ receptor (medoid) represents a group (cluster) of receptors with a comparable set of sunlight/daylight characteristics. The number R of clusters was defined ‘a priori’ and set to 24. After the clustering is completed, each receptor can be characterized by its cluster number rather than by its performance values.
The values corresponding to each reference area show the even distribution of clusters across the space of sunlight-daylight metrics.
(d) Definition of areas
A large number of areas is defined, covering the entire urban model of Central London. Each area is characterized by the R-clusters corresponding to the receptors included in it.
The character of an area can be determined by the combined performance of the receptors it contains. Obviously, a South-facing façade and a North-facing one will have different solar availability potentials; however, for each South façade there is a North one, as well as an East and a West façade. Therefore, the overall performance of an area considers the combined performance of all orientations.
Limited sections of the urban fabric were considered to analyze the character of their different configurations. In this case, 8000 urban areas of 100 m radius were defined across the whole area that was studied, covering a large part of the city model.
(e) Histogram H-vector
An H-vector is calculated for each area, composed by the histogram of frequencies of each R-cluster among the area receptors.
By clustering the receptors, the method for characterizing an area becomes a matter of determining the proportion of receptors within each cluster. This is effectively a histogram of the frequency of each receptor cluster in the area considered.
This histogram can be written as a vector with dimensionality equal to the number of receptor clusters (R clusters) and its components representing the fraction of receptors in each cluster, as follows:
where H is the histogram vector; fi is the number of receptors in the i th cluster divided by the total number of receptors included in the area; and r is the total number of receptor clusters.
Out of the 8,000 random samples, seven areas were selected as an example, and characterized through the H histogram vector. These areas are: (1) Fitzrovia; (2) Regent’s Park; (3) Camden; (4) Trafalgar; (5) North-East; (6) Canary Warf; (7) South of Battersea.
(f) Clustering areas into A-clusters
The k-medoids algorithm is used to classify all areas into clusters (A-clusters) according to their H-vectors. Each cluster groups areas with similar sunlight and daylight conditions. Typical areas are defined from the cases located at the centre of each cluster. In other words, by using the H-vector to characterize areas, it is possible to then cluster areas with similar H-vectors into groups of areas with a similar character, or daylight signature.
In the k-medoids approach, the medoid of a cluster is defined as the object in the cluster whose average dissimilarity to all the objects in the cluster is minimal, that is, it is the most centrally located point in the cluster. As a result, medoids are the reference conditions that characterize a certain type of area.
The procedure described at step ‘d’ for seven example areas was repeated for all the defined areas: as a result, 8000 H-vectors were obtained. The H-vectors were then clustered into 64 area clusters (A-clusters), again through a k-medoids approach. Each of these clusters is considered as a set of areas with a similar daylight signature and their medoids are the corresponding reference areas.
3. Results
3.1. Analysis of receptors: sunlight-daylight wedge SDW (steps a, b, and c)
(a) Definition of receptors
Figure 3 shows the extent of Central London which has been used to locate receptors. The receptors were placed with 5m spacing, and 1.5m above the street level, around all the buildings in Central London.
Figure 3
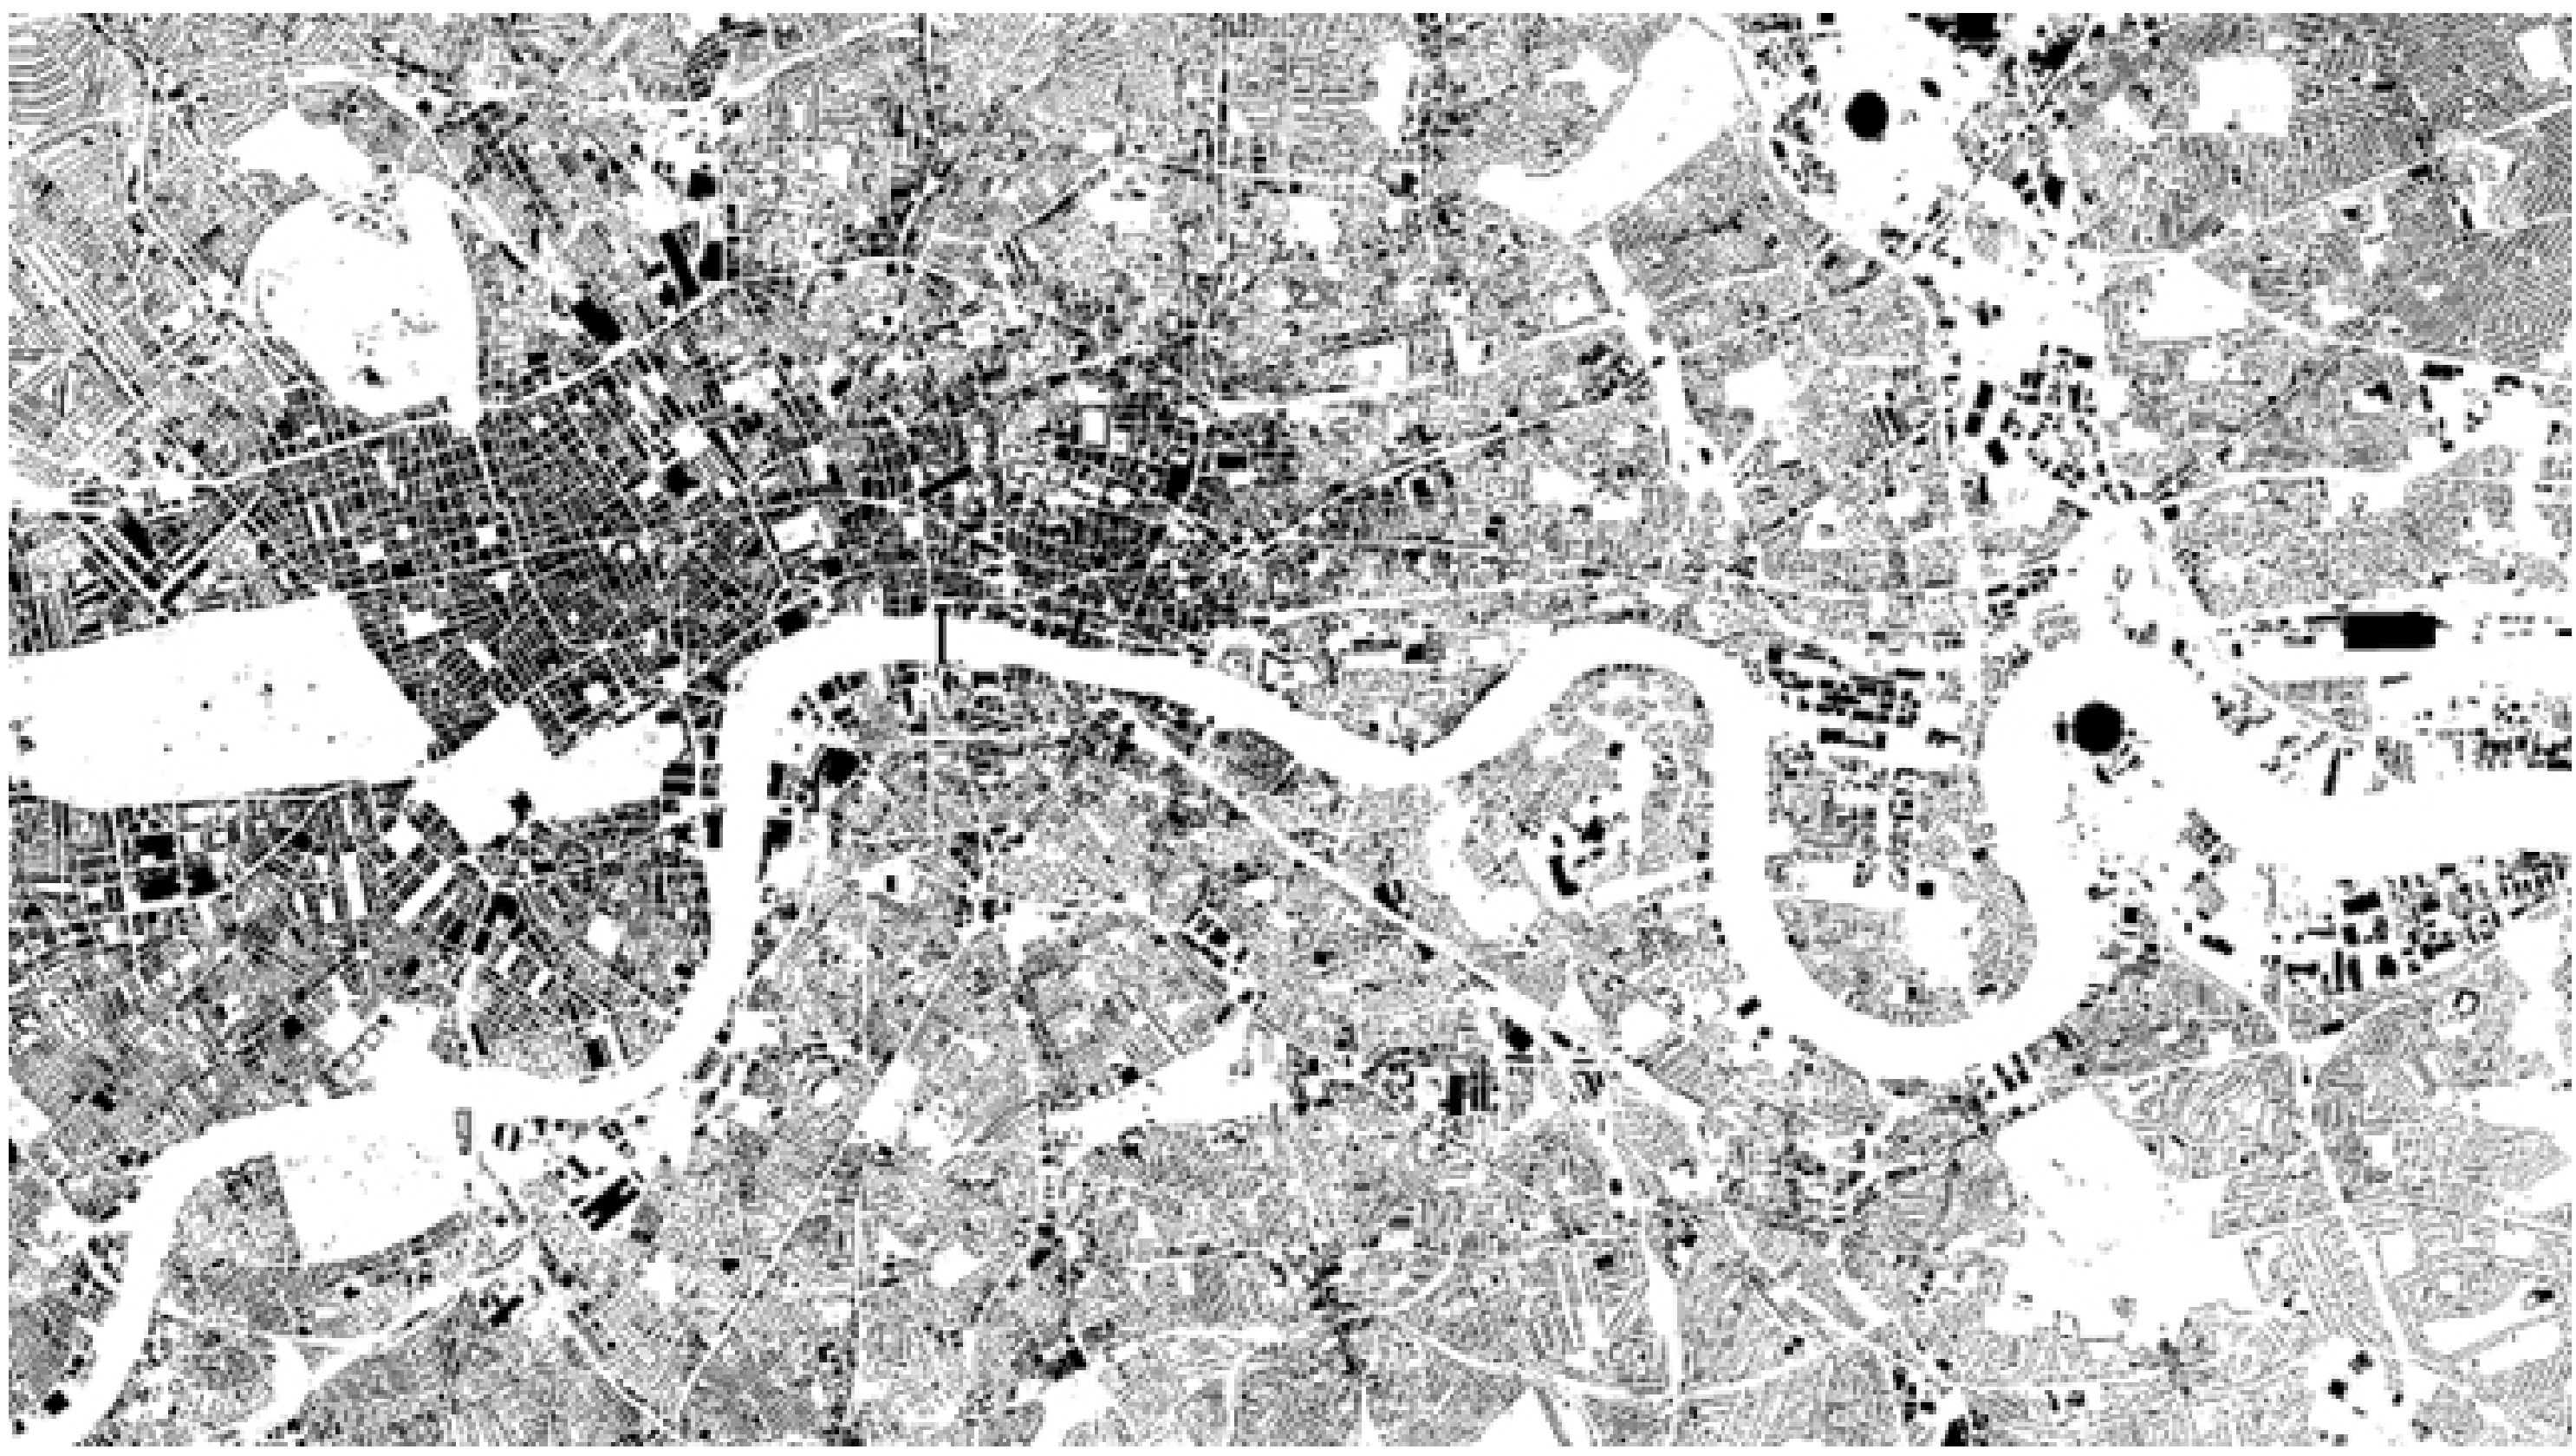
Fig. 3. Buildings outlines that were used to locate receptor points in the 3D model for Central London.
(b) Calculation of VSC / PASH / PWSH / orientation –SDW-vector
Figure 4 shows the sunlight-daylight-wedge SDW that was built for Central London, while Fig. 5 shows the SDW that were built (using the same urban setting of Central London) using the weather file of 6 different towns: London/Gatwick, Berlin, Kathmandu, Taipei, Tabriz, and Yadz.
Figure 4
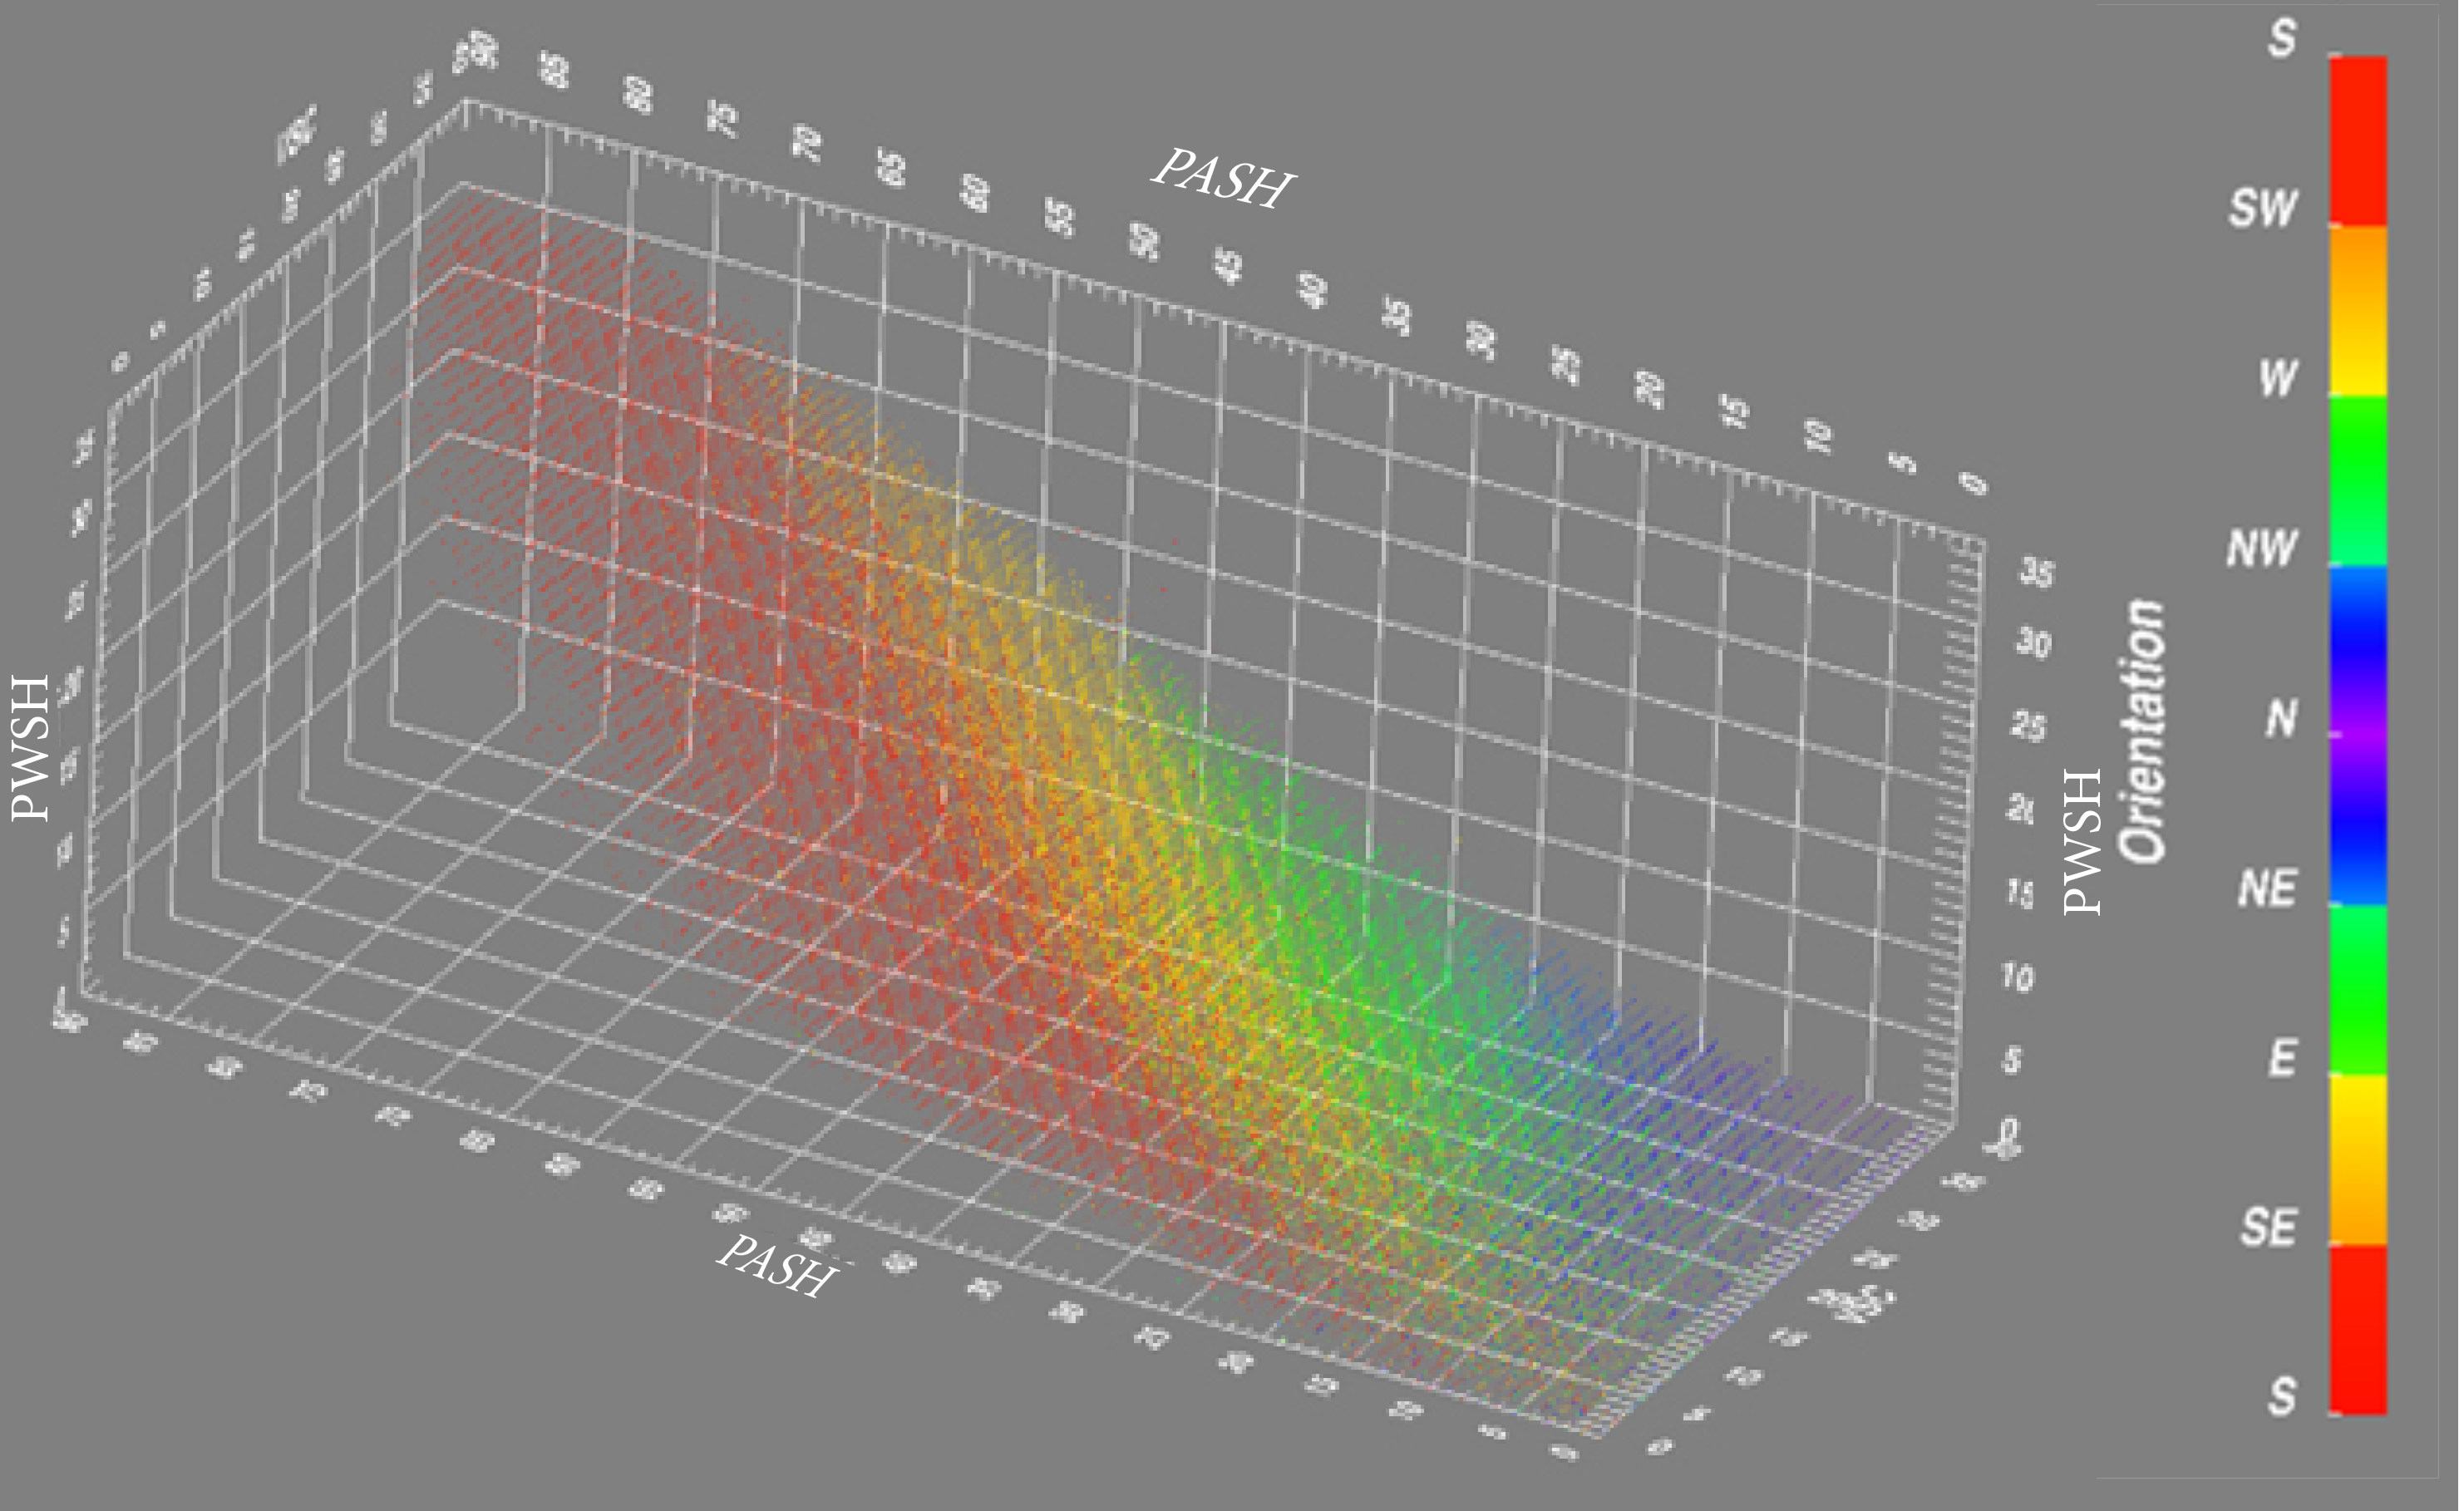
Fig. 4. Buildings outlines that were used to locate receptor points in the 3D model for Central London.
Figure 5
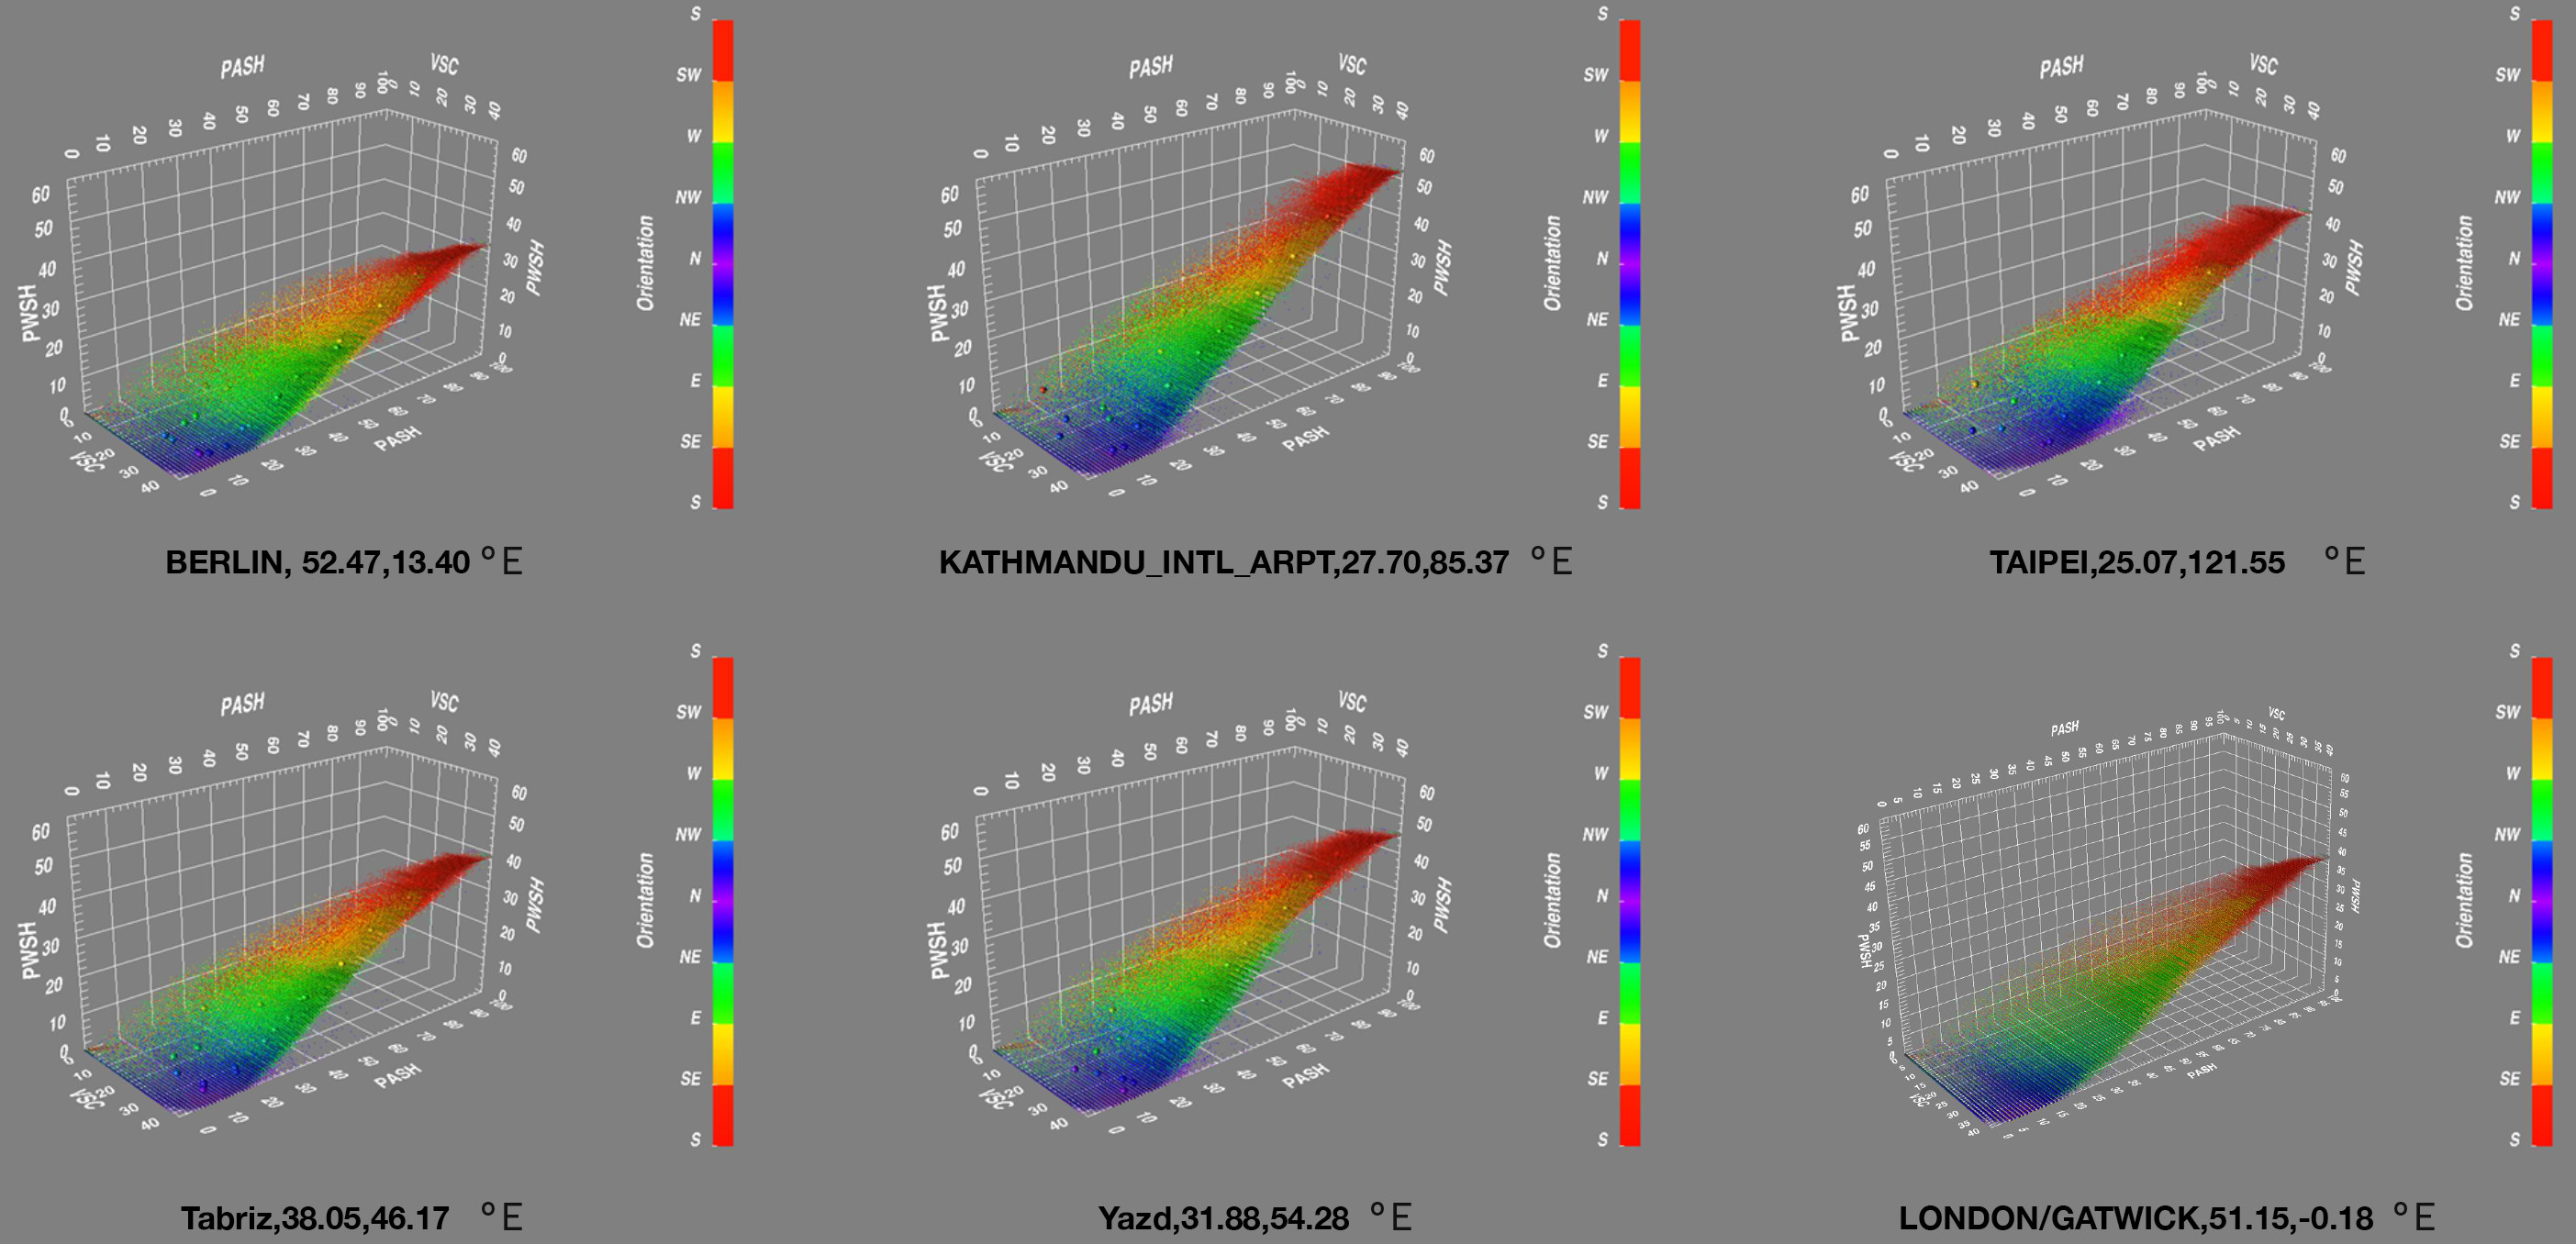
Fig. 5. Comparison of the SDW for 6 different climates (all using the same city geometry: London). Whilst the VSC values remain the same as these are determined by the geometry of the buildings, the probability of sunlight and the effects of orientation change the shape of the SDW.
The SDW results were plotted in different planes, to allow an easier reading of data. For example, the 2d VSC-PASH plane (Fig. 6) shows the effect of latitude, climate, and orientation, while plotting the SDW results in the 2d APSH-PWSH plane (Fig. 7) shows the effect of latitude and cloud cover that is typical of the site considered. As a further analysis, Fig. 8 plots the SDW in the 2d VSC-PASH plane again, with a particular focus on the effect of orientation.
Figure 6
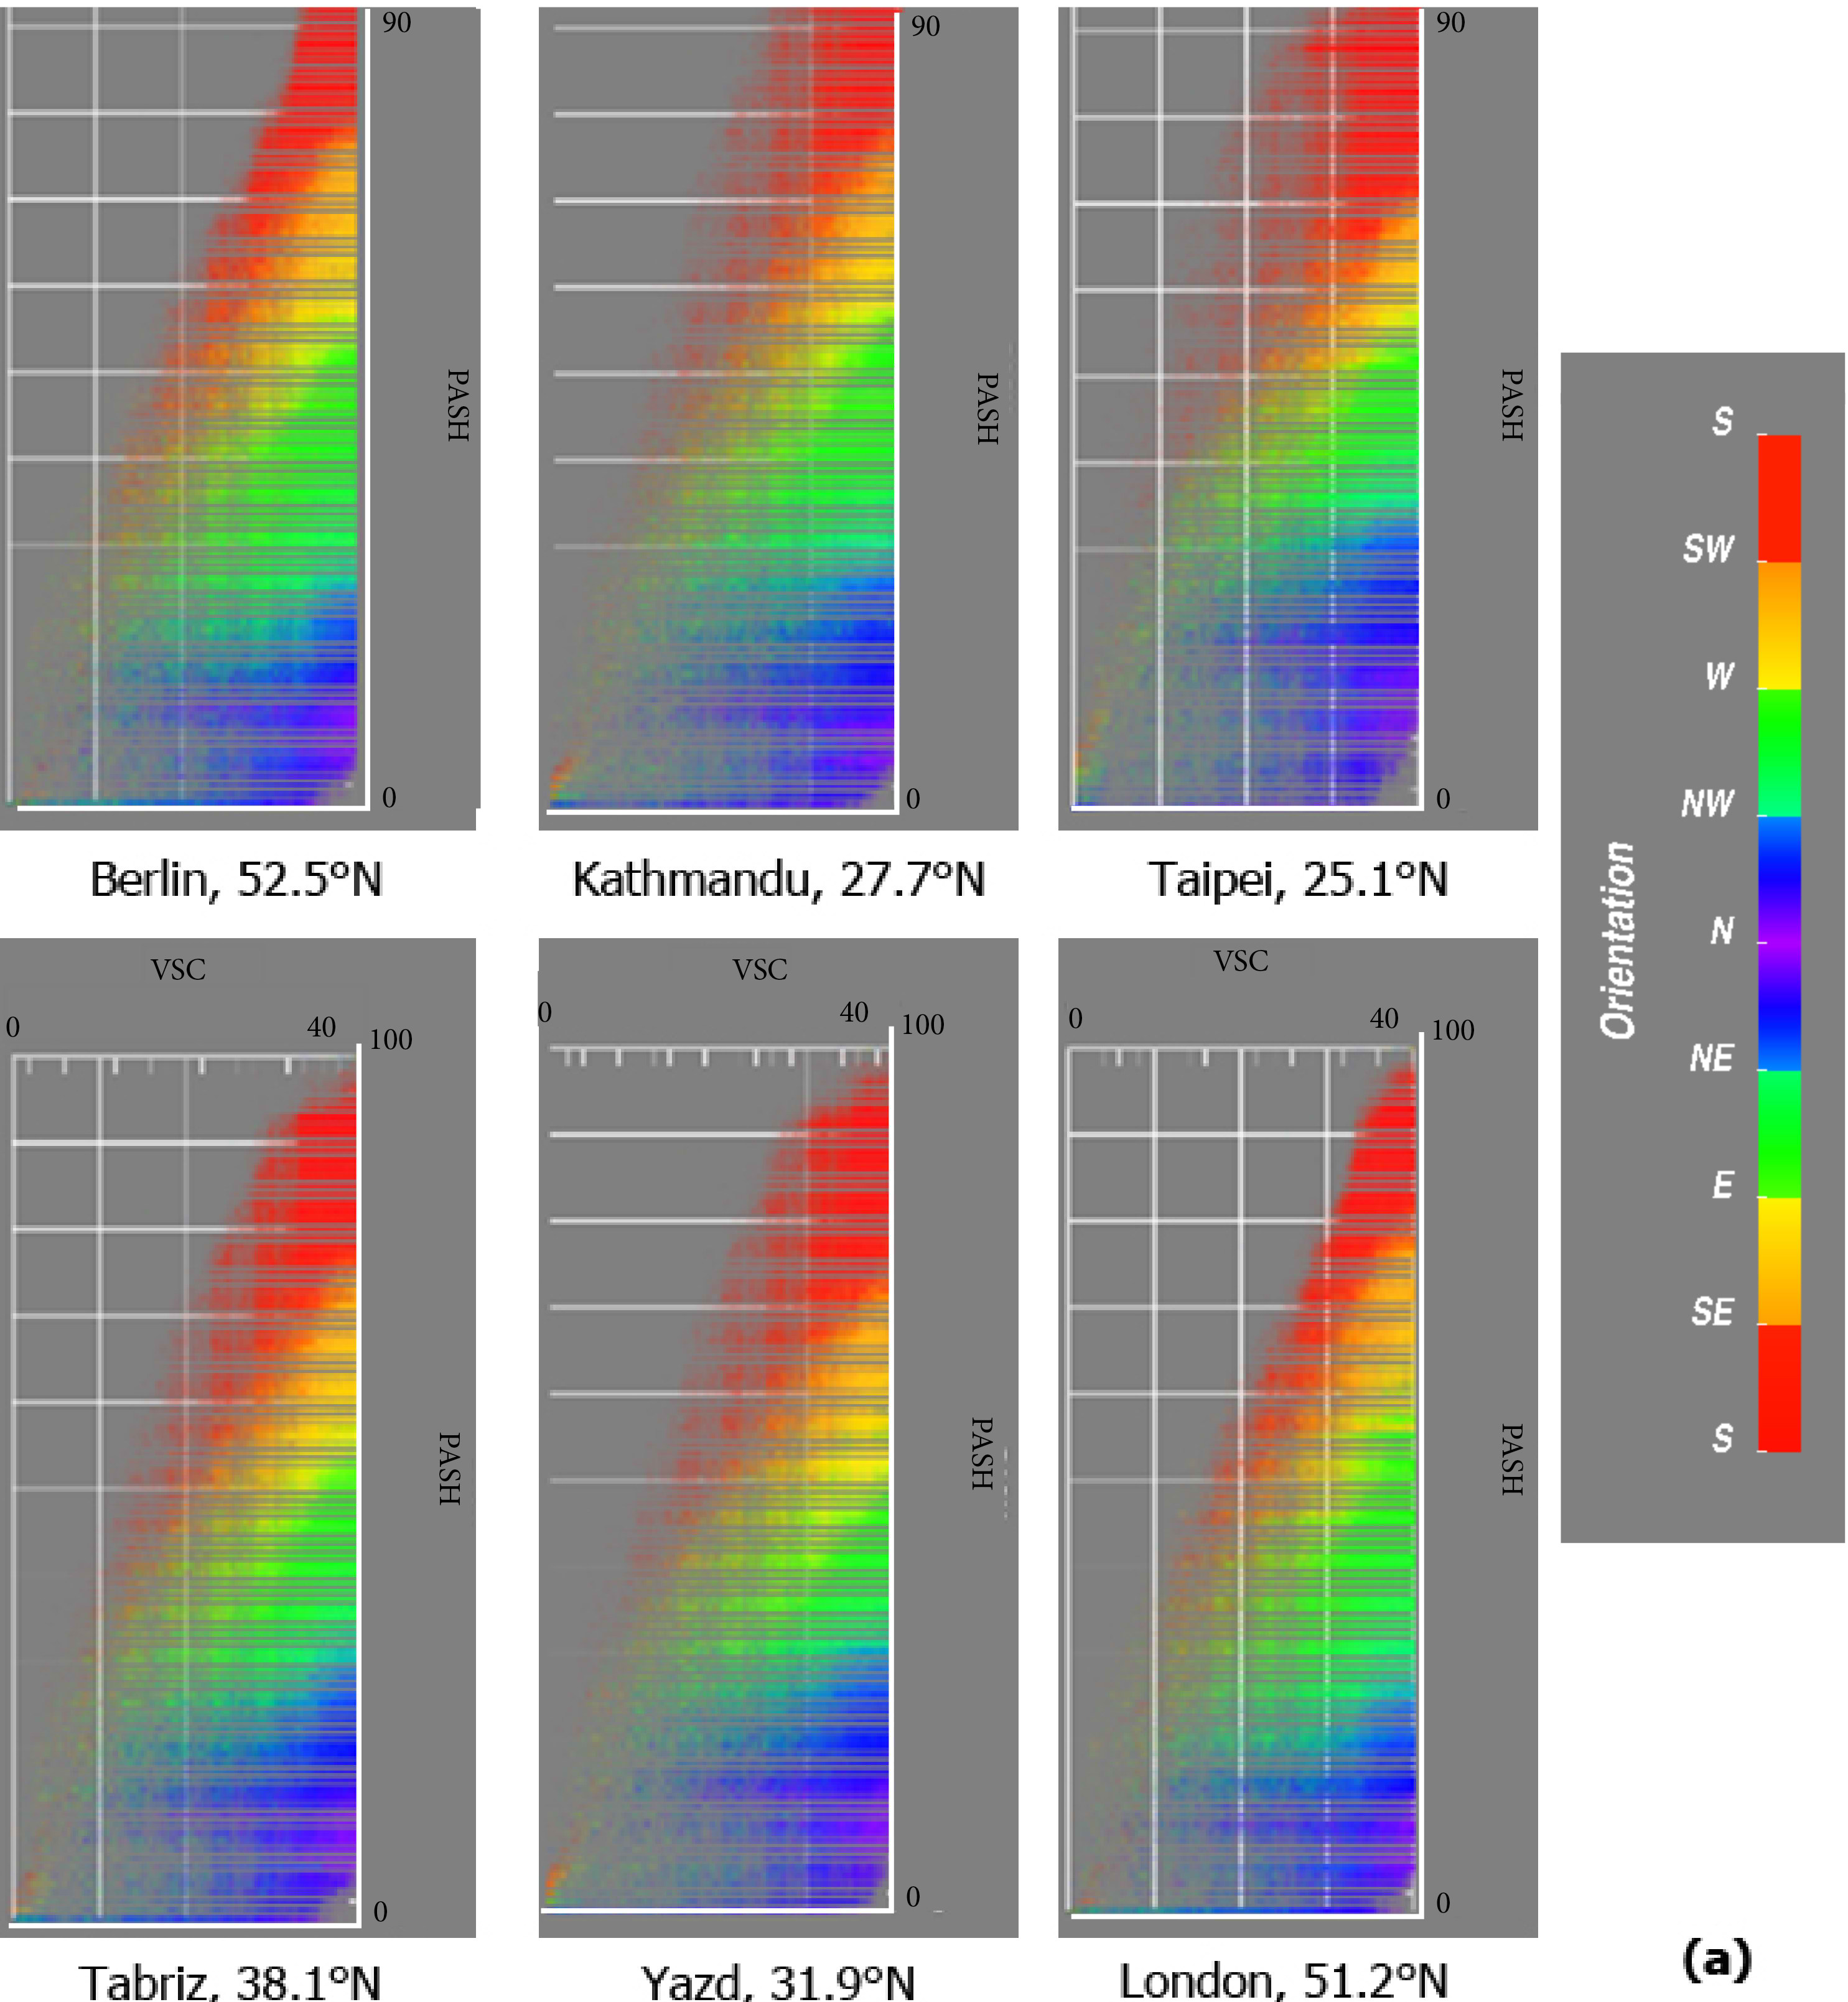
Fig. 6. (a) VSC vs. PASH for 6 different climates (all using the same city geometry: London) to show the effect of weather and latitude. To the same value of VSC it is associated a different value of sunlight probability; (b) visually of how the SDW diagrams thickens to the top when the local weather is sunnier.
Figure 7
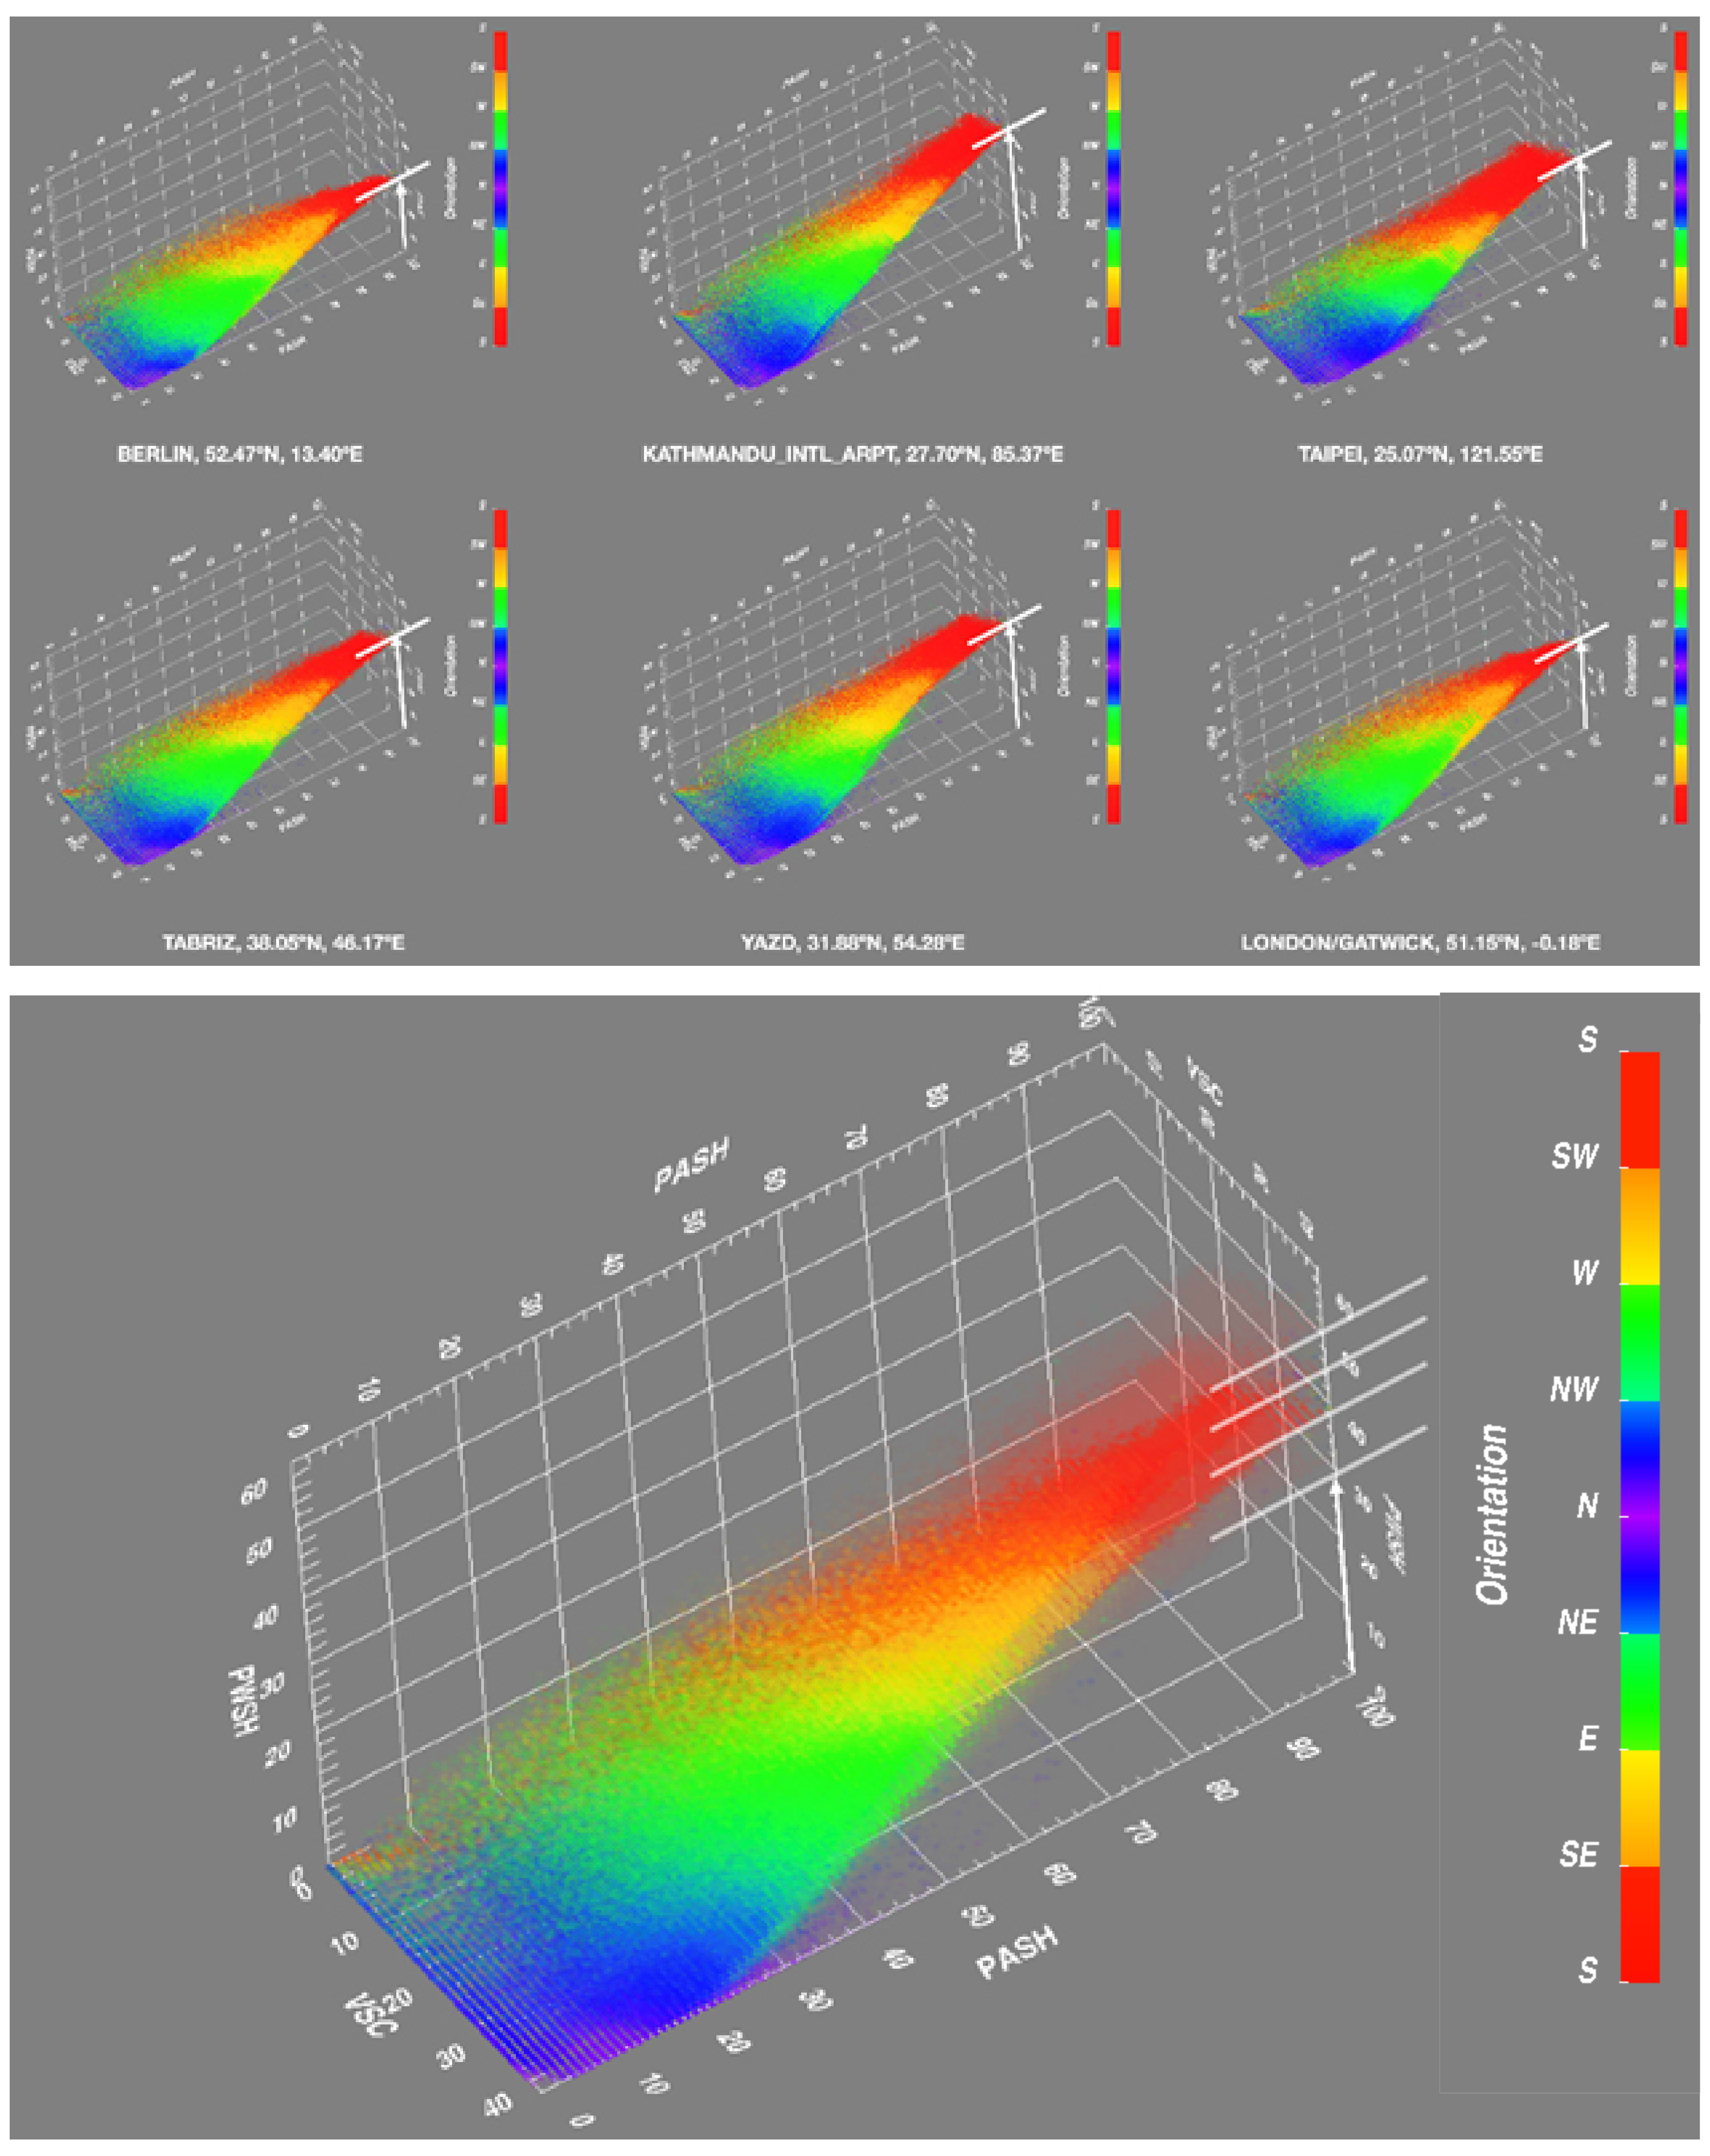
Fig. 7. Visualization of the SDW, highlighting the effect of latitude and cloud cover: the distribution of values between winter and summer seasons squashes the wedge, based on the peak value of PWSH. This is an indication of seasonal weather effects and latitude.
Figure 8
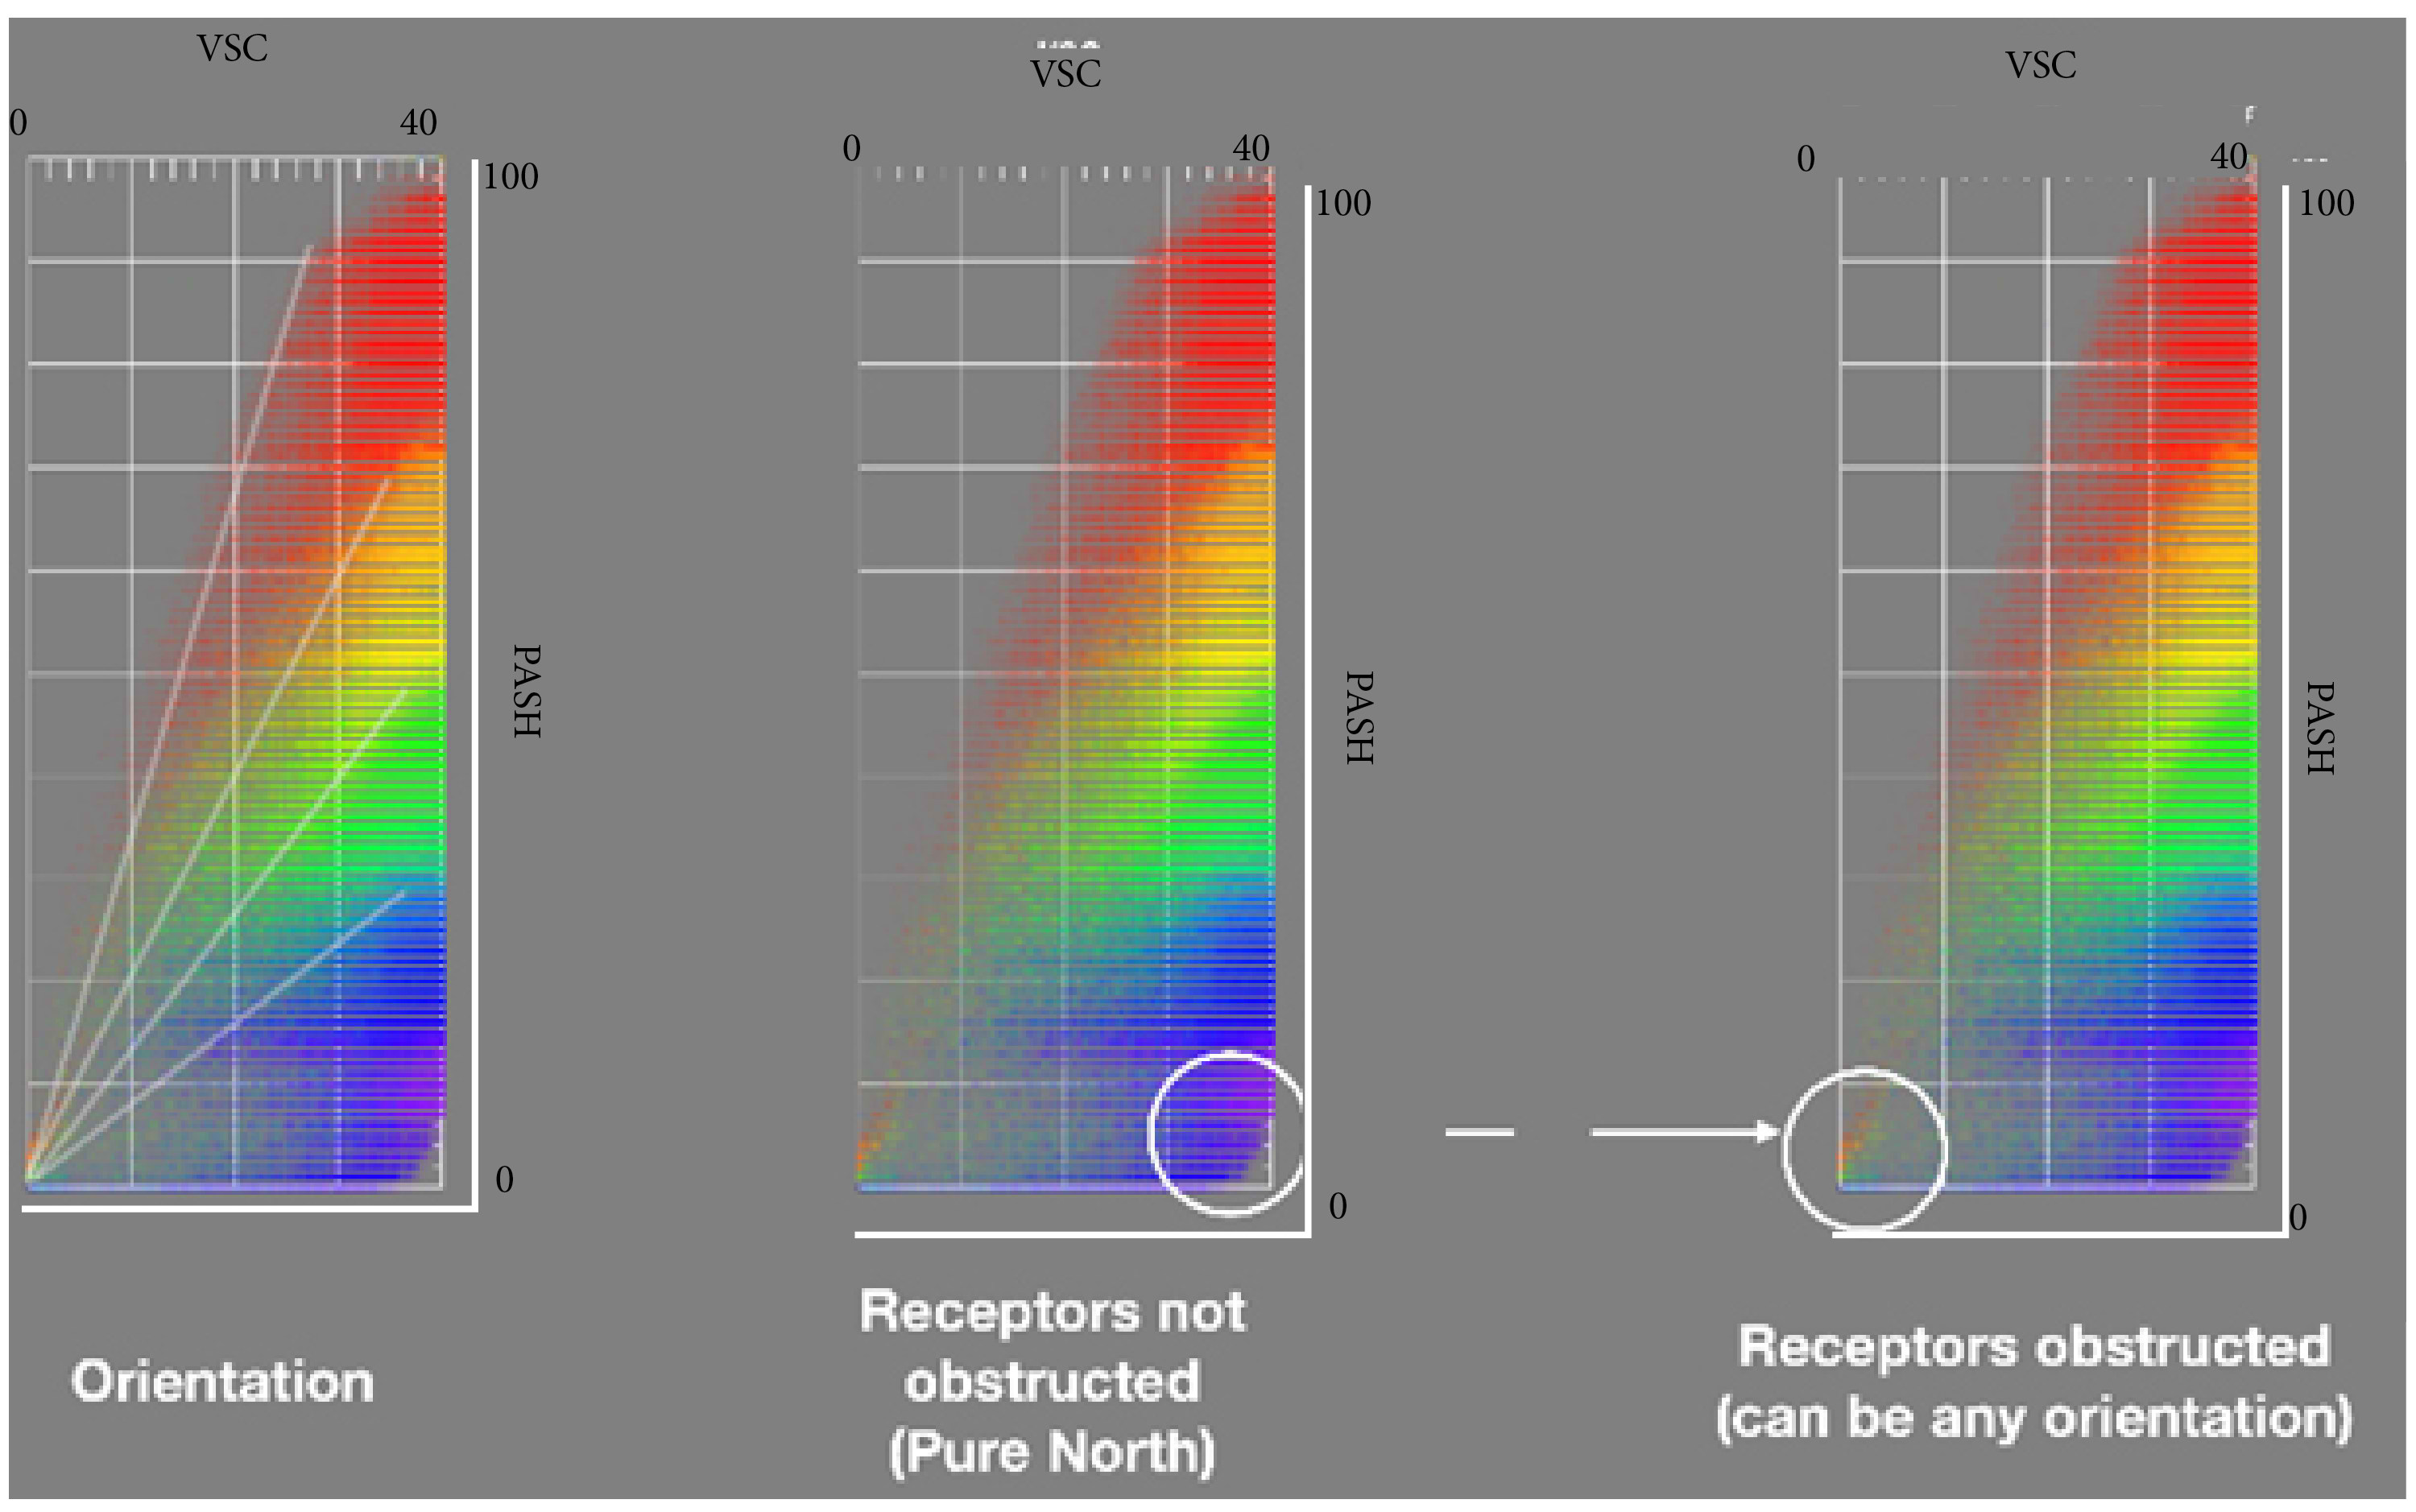
Fig. 8. Visualization of the SDW in the VSC-PASH, highlighting orientation of receptors. Visually, different orientations correspond to a set of curves funneling out from the origin of the diagram. For a given orientation, the maximum availability of sunlight is a function of the obstruction. If the obstruction is severe then such availability is small, hence values are close to each other. If the obstruction is low (high value of VSC), then the sunlight availability can be very different for different orientations (and therefore the lines diverge).
(c) Clustering receptors into R clusters
Figure 9 shows the location of the 24 receptors across the study area in Central London, while Fig. 10 shows the 24 typical receptors within the SDW dataset. Finally, Fig. 11 splits the 3d representation of the SDW database into various combinations of 2d planes: orientation-PASH, orientation-PWSH, orientation-VSC, VSC-PASH, and PASH-PWSH.
Figure 9
Fig. 9. 24 typical receptors distributed across the London study area.
Figure 10
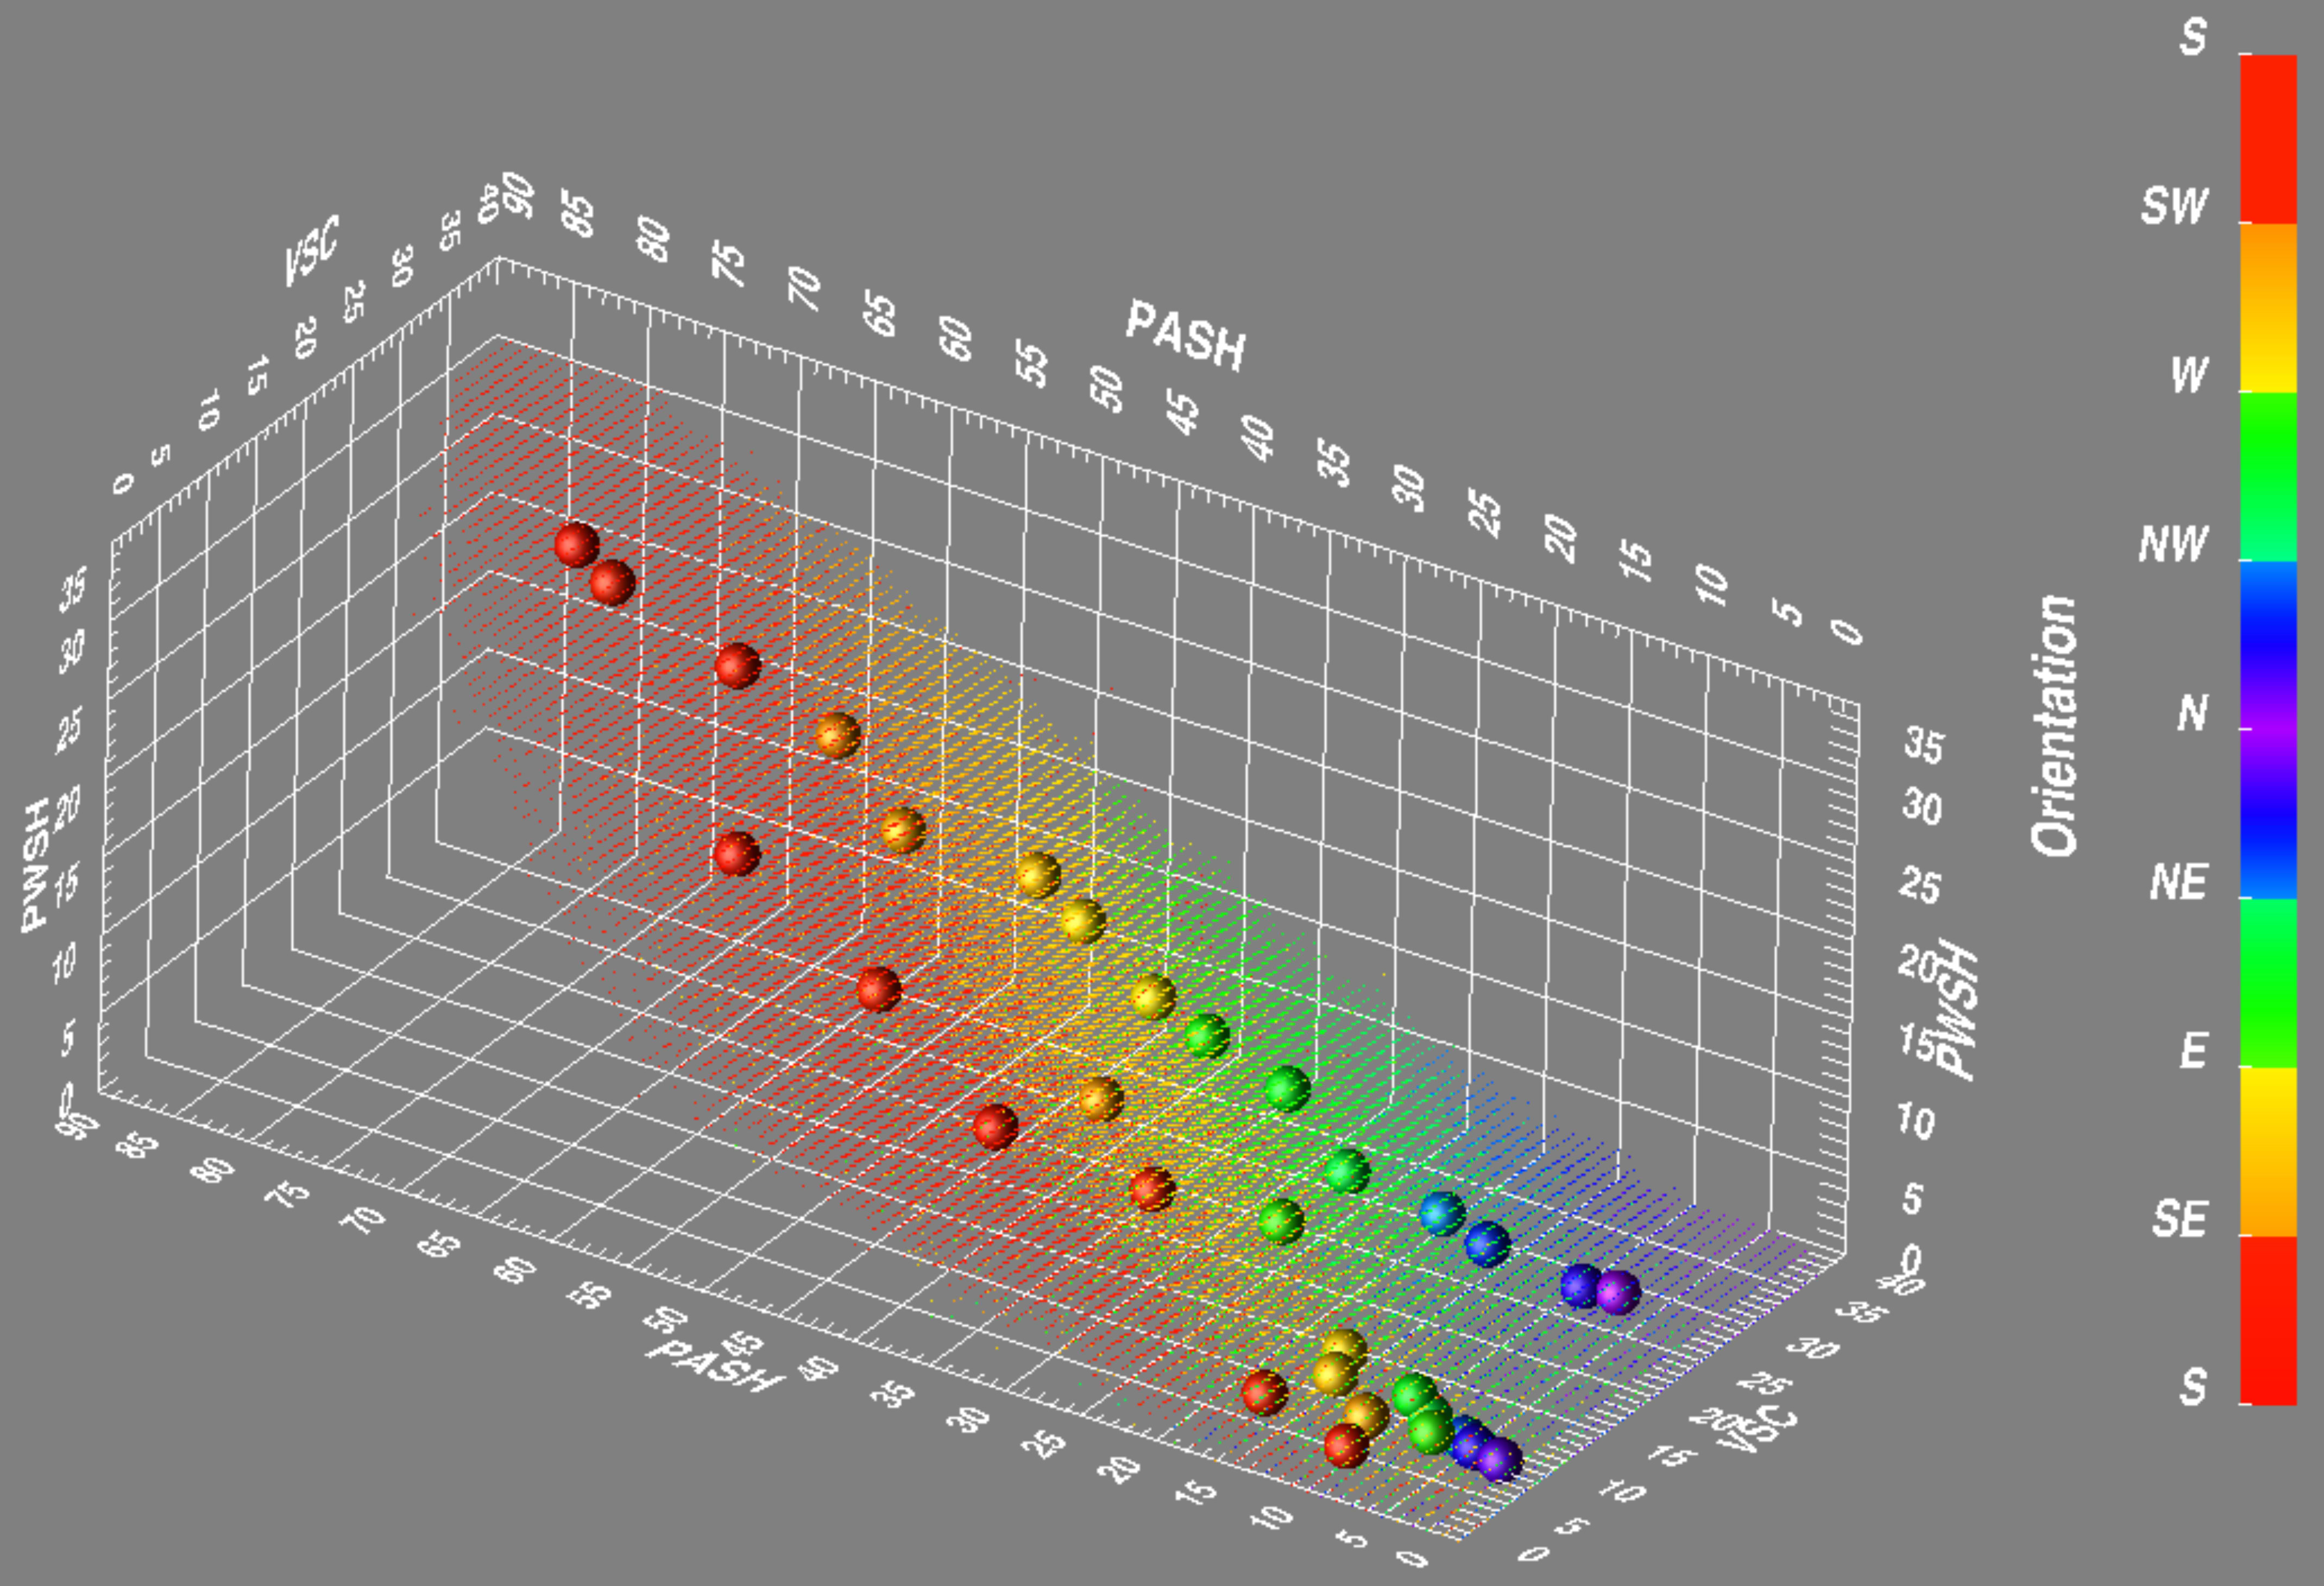
Fig. 10. 24 typical receptors within the SDW dataset that was collected for Central London.
Figure 11
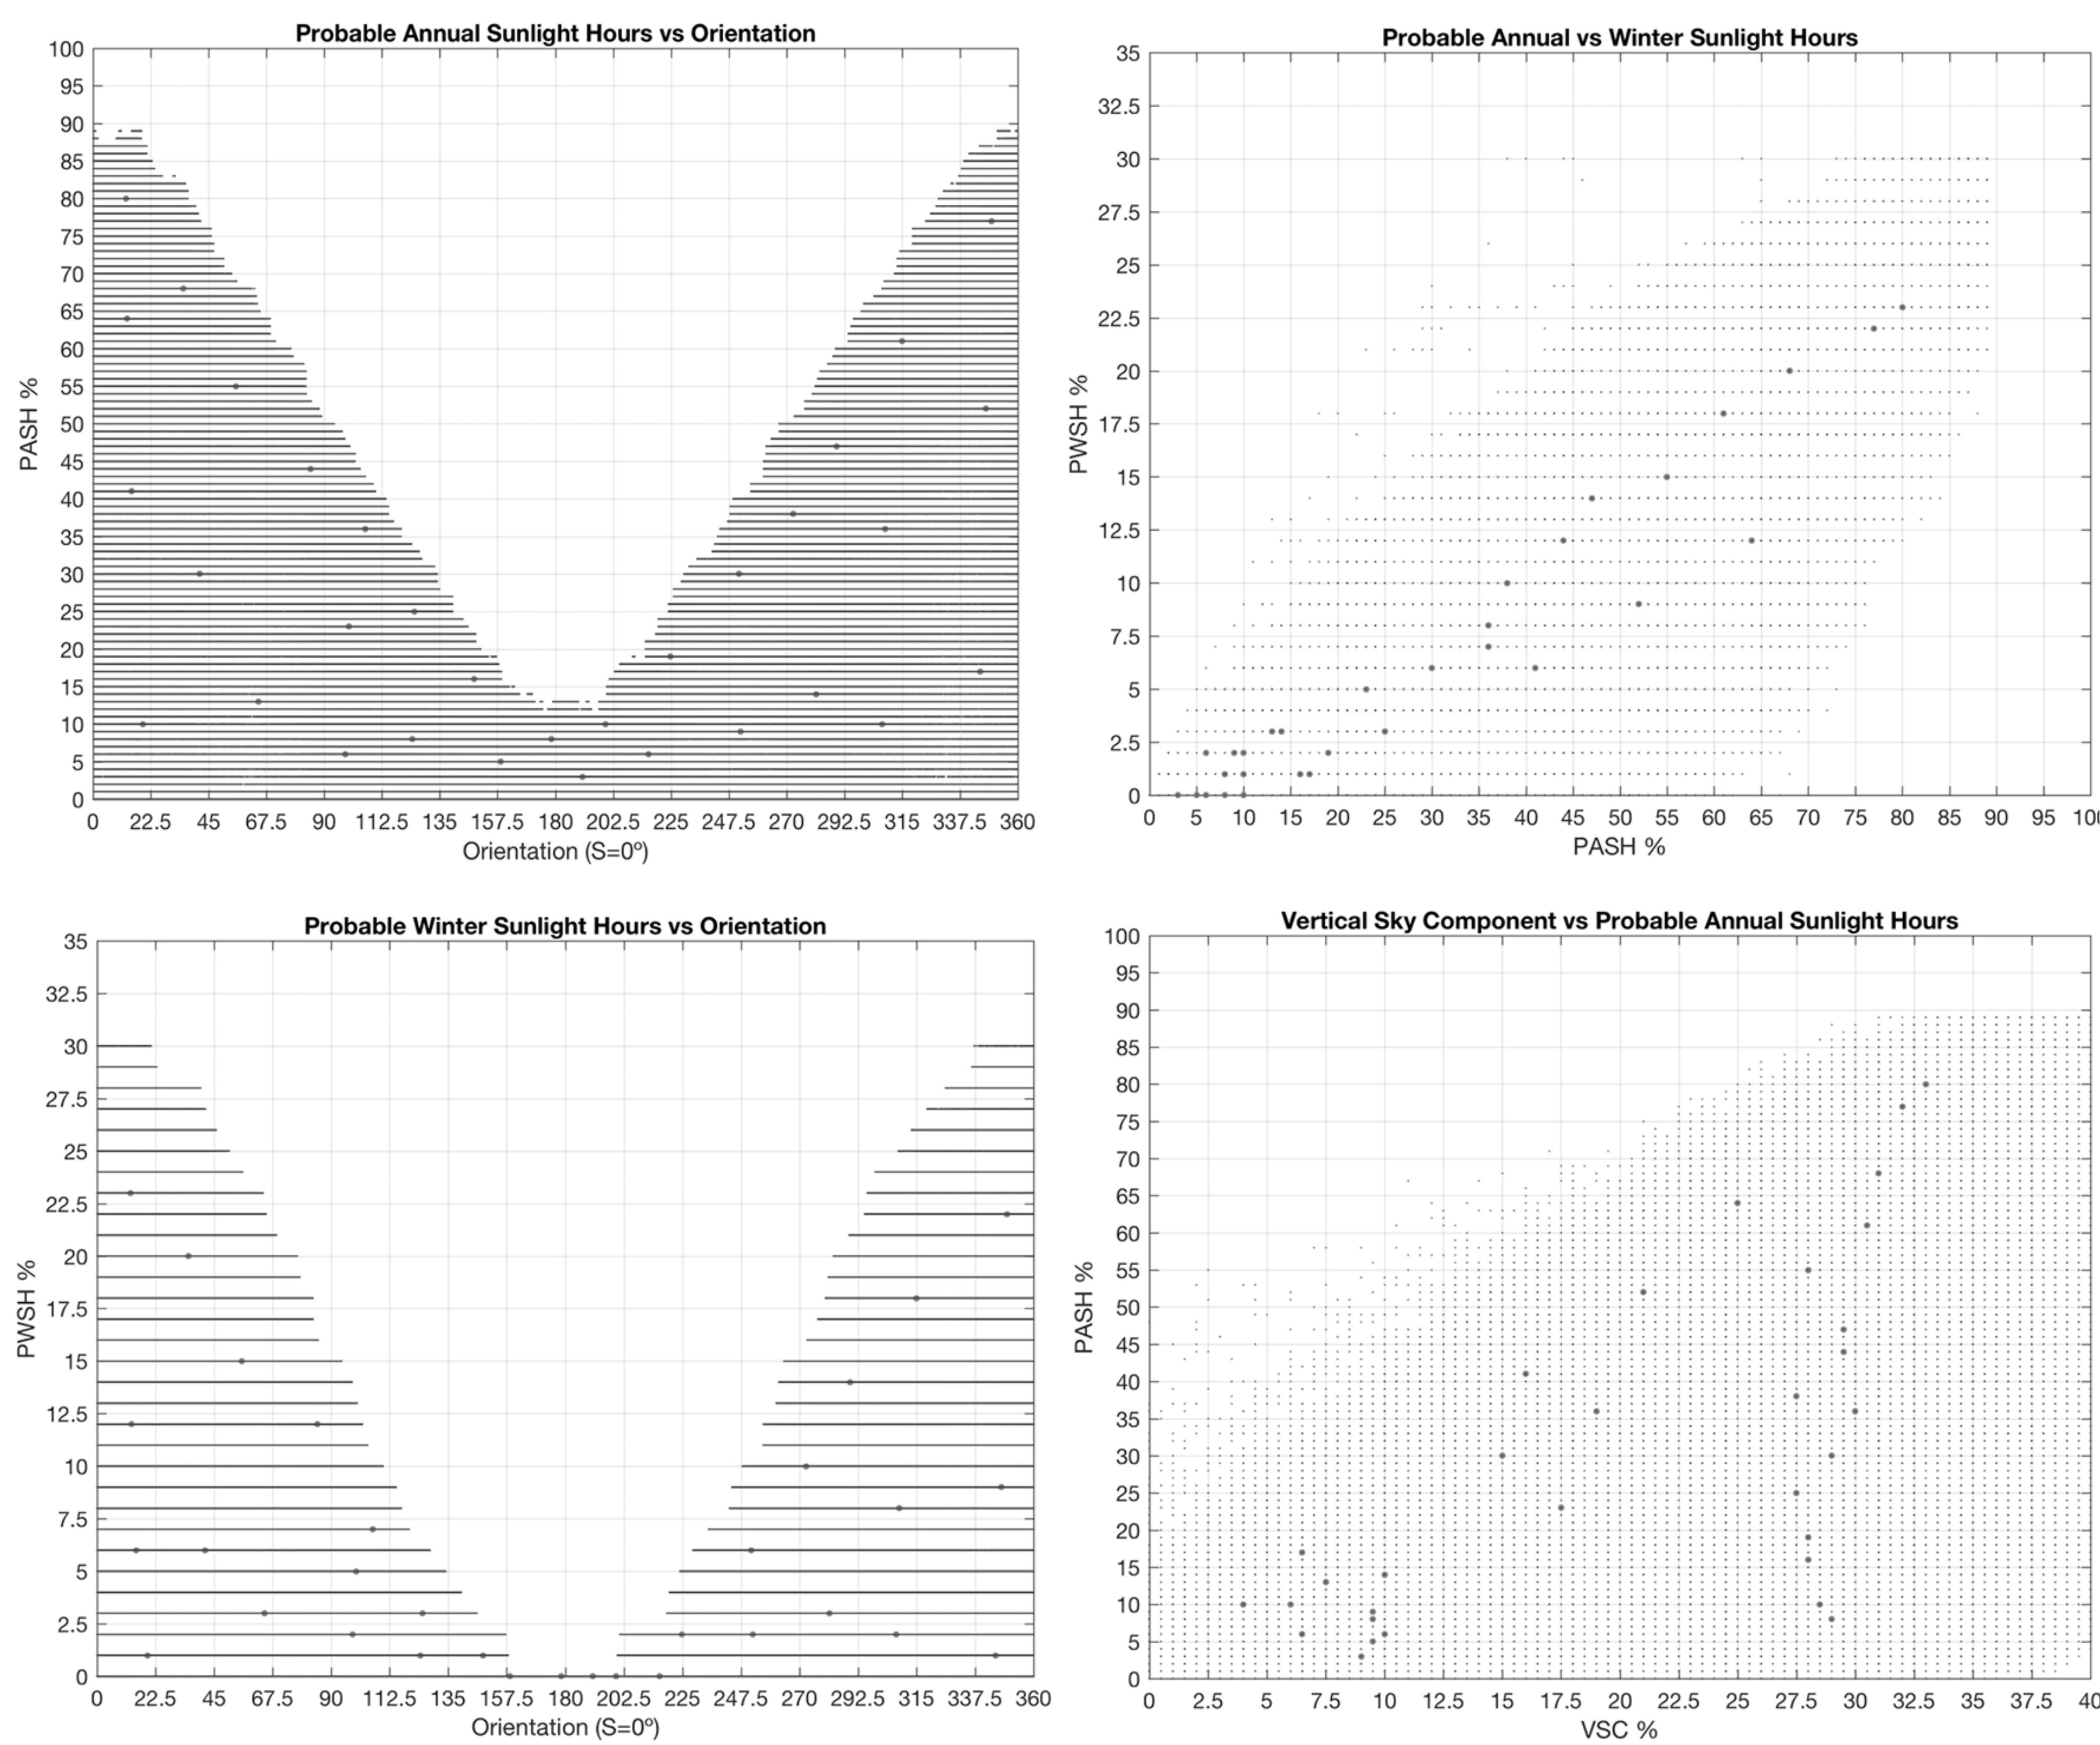
Fig. 11. 24 typical receptors (in red), SDW as seen in different 2d planes: orientation-PASH; orientation-PWSH; VSC-PASH; and PASH-PWSH.
3.2. Analysis of areas: sunlight-daylight signature SDS (Steps d, e, and f)
(d) Definition of areas
Figure 12 shows the location of the 8000 areas (each having a radius of 100 m) that were selected to build the sunlight-daylight signature.
Figure 12
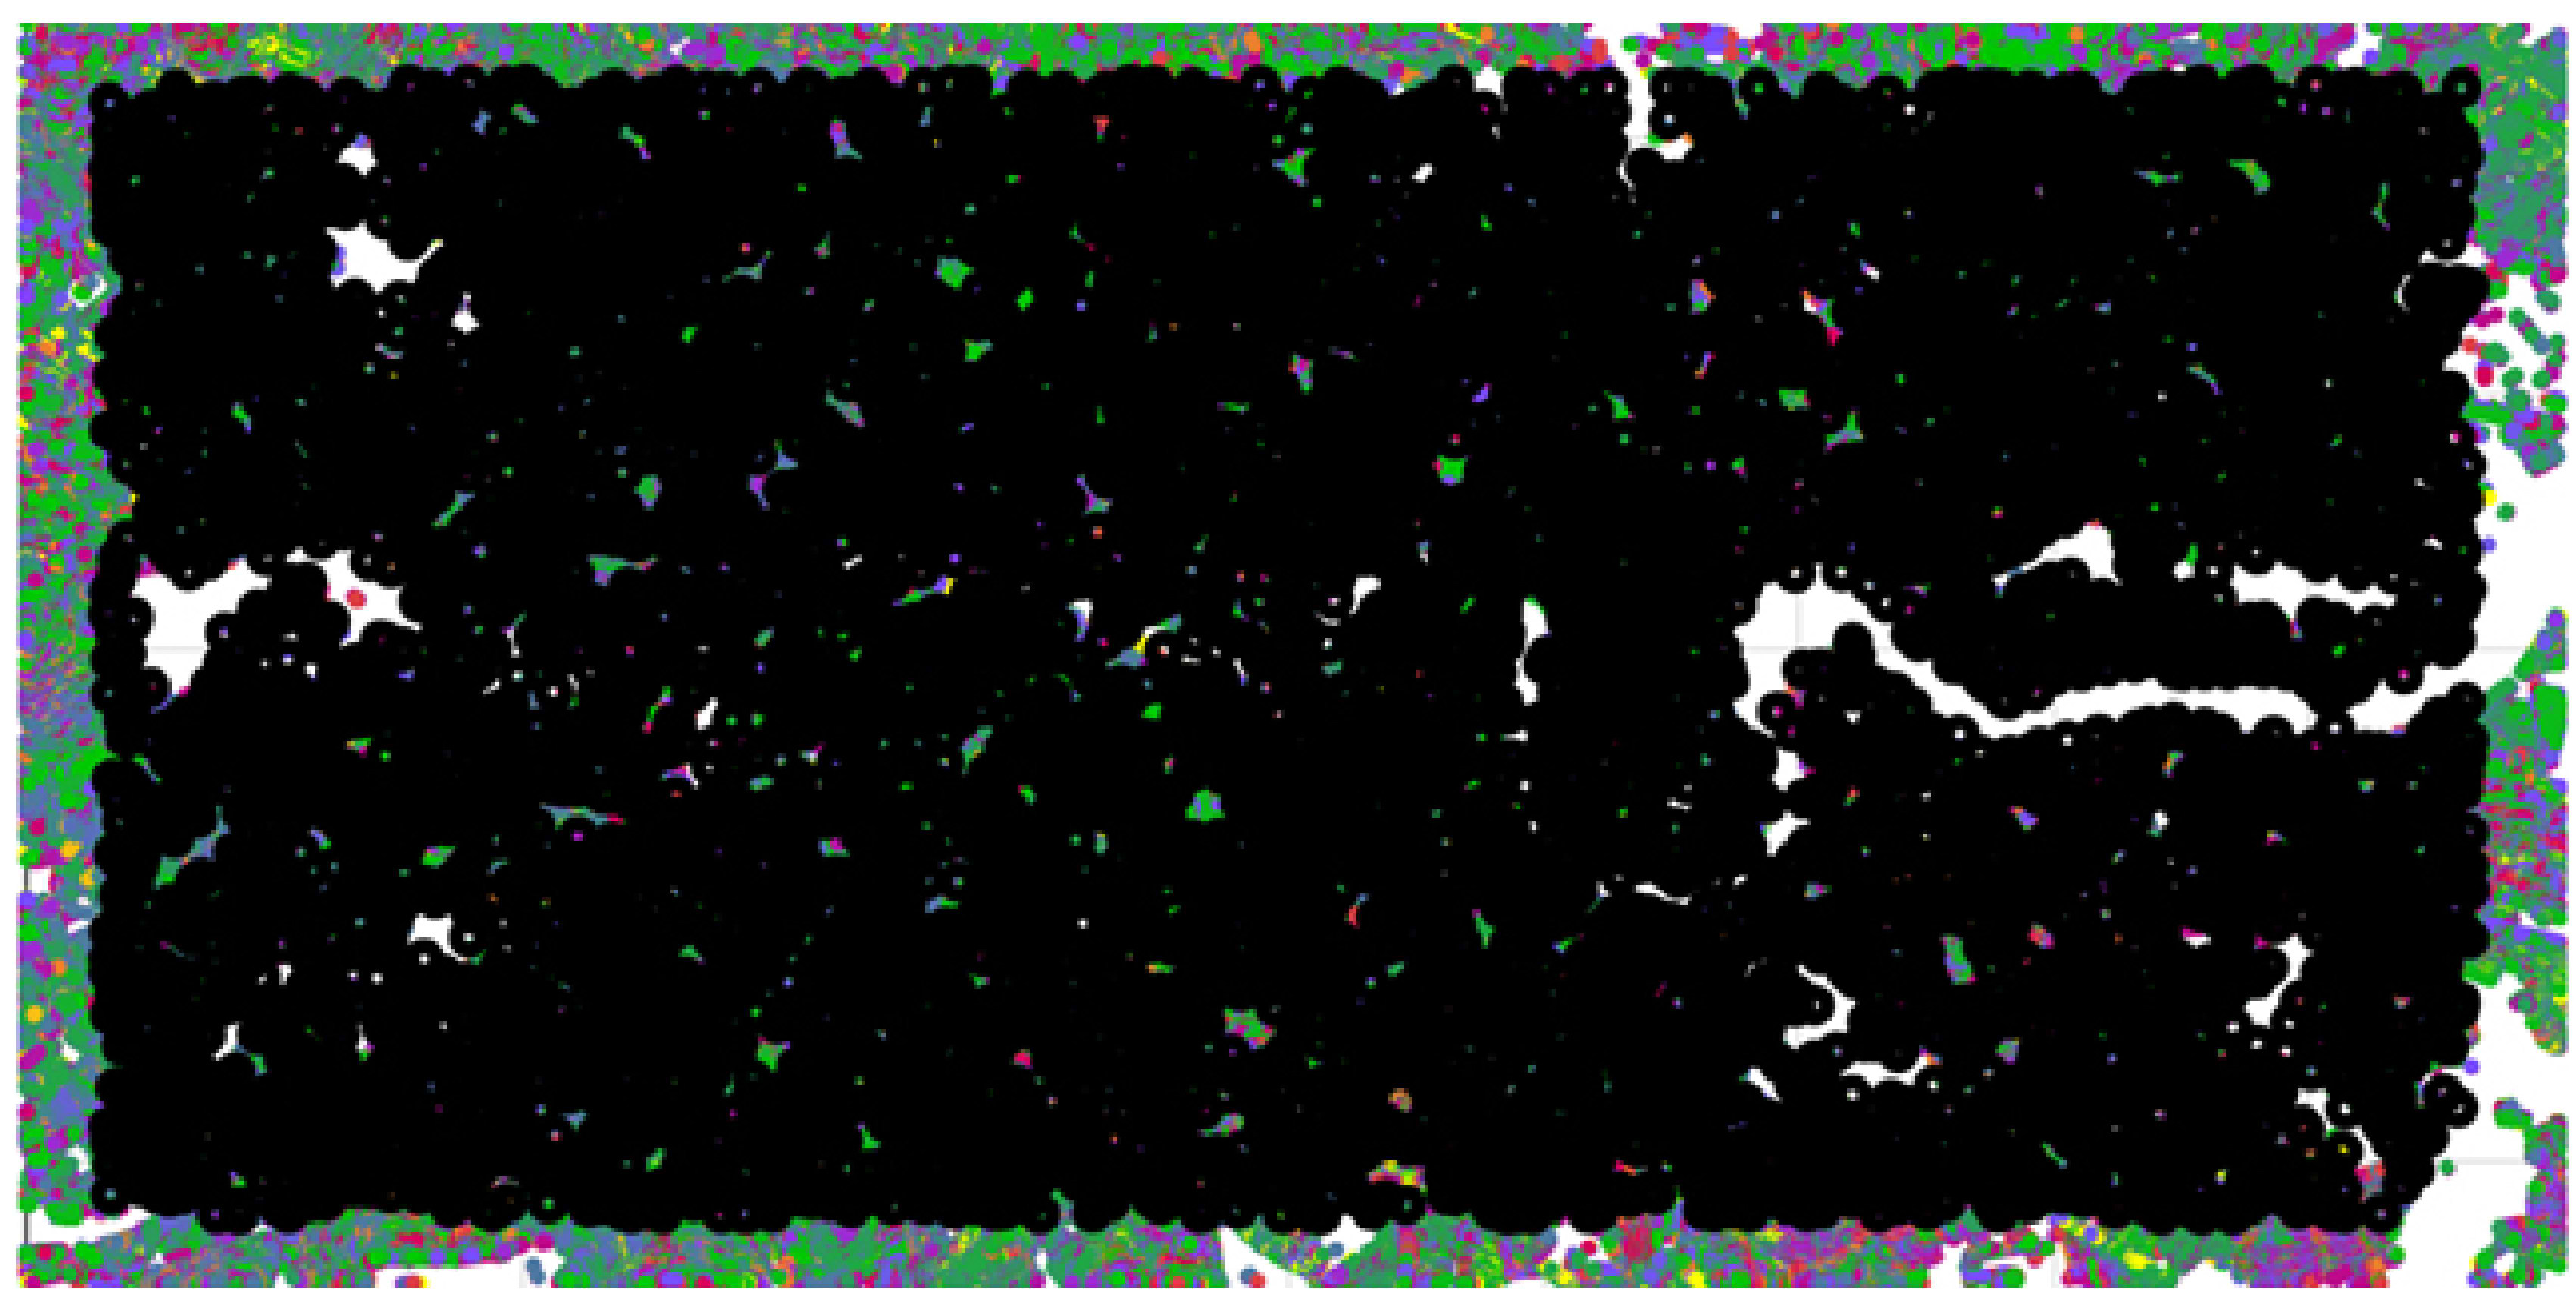
Fig. 12. Location of the 8000 analysis areas in the 3D model for Central London: each area has a radius of 100 m.
(e) Histogram H-vector
Figure 13 shows the H histogram that was built for 7 areas, selected as an example among the 8000 areas analyzed in Central London. These are: (1) Fitzrovia; (2) Regent’s Park; (3) Camden; (4) Trafalgar; (5) North East; (6) Canary Warf; (7) South of Battersea.
Figure 13
Fig. 13. Results found for 7 areas used in the process: (a) typical receptors; (b) H-histograms.
(f) Clustering of areas into A-clusters
Figure 14 shows the location of the 64 reference cluster areas (A-clusters) that were identified for each area studied in Central London.
Figure 14
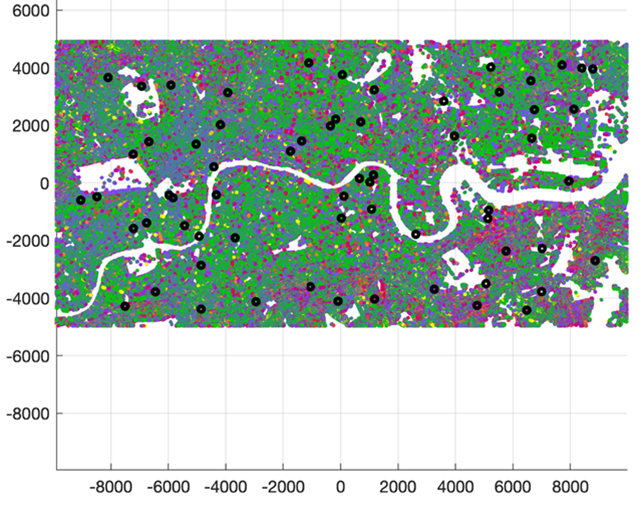
Fig. 14. Location of the 64 reference areas. Axes show extent of the area in meters.
The distribution of receptor types in some of the reference areas is shown in Fig. 15. The graphs show the difference between areas characterized by the orientation of their facades and the obstruction of the sky and consequent sunlight. Differently, Figs. 16 and 17 show a comparison between the seven areas in Central London which were selected and characterized through the H-histogram vectors in the example of Fig. 14: each area is associated to its k-medoids centres (Figure 16). The comparison is based on the minimum distance between H-vectors, and it is represented as the distribution of typical receptors and as H-histograms (Fig. 17).
Figure 15
![Distribution of receptor types in selected reference areas (4 out of 64 typical areas. The axes show the dimensions in [m] and can be used to locate each area. The dots are shown using a color code which represent the id of each typical receptors. These are 24 typical receptors in total.](figures/10-136-15.jpg)
Fig. 15. Distribution of receptor types in selected reference areas (4 out of 64 typical areas. The axes show the dimensions in [m] and can be used to locate each area. The dots are shown using a color code which represent the id of each typical receptors. These are 24 typical receptors in total.
Figure 16
![Distribution of receptor types in selected reference areas (4 out of 64 typical areas. The axes show the dimensions in [m] and can be used to locate each area. The dots are shown using a color code which represent the id of each typical receptors. These are 24 typical receptors in total.](figures/10-136-16.jpg)
Fig. 16. Distribution of receptor types in selected reference areas (4 out of 64 typical areas. The axes show the dimensions in [m] and can be used to locate each area. The dots are shown using a color code which represent the id of each typical receptors. These are 24 typical receptors in total.
Figure 17
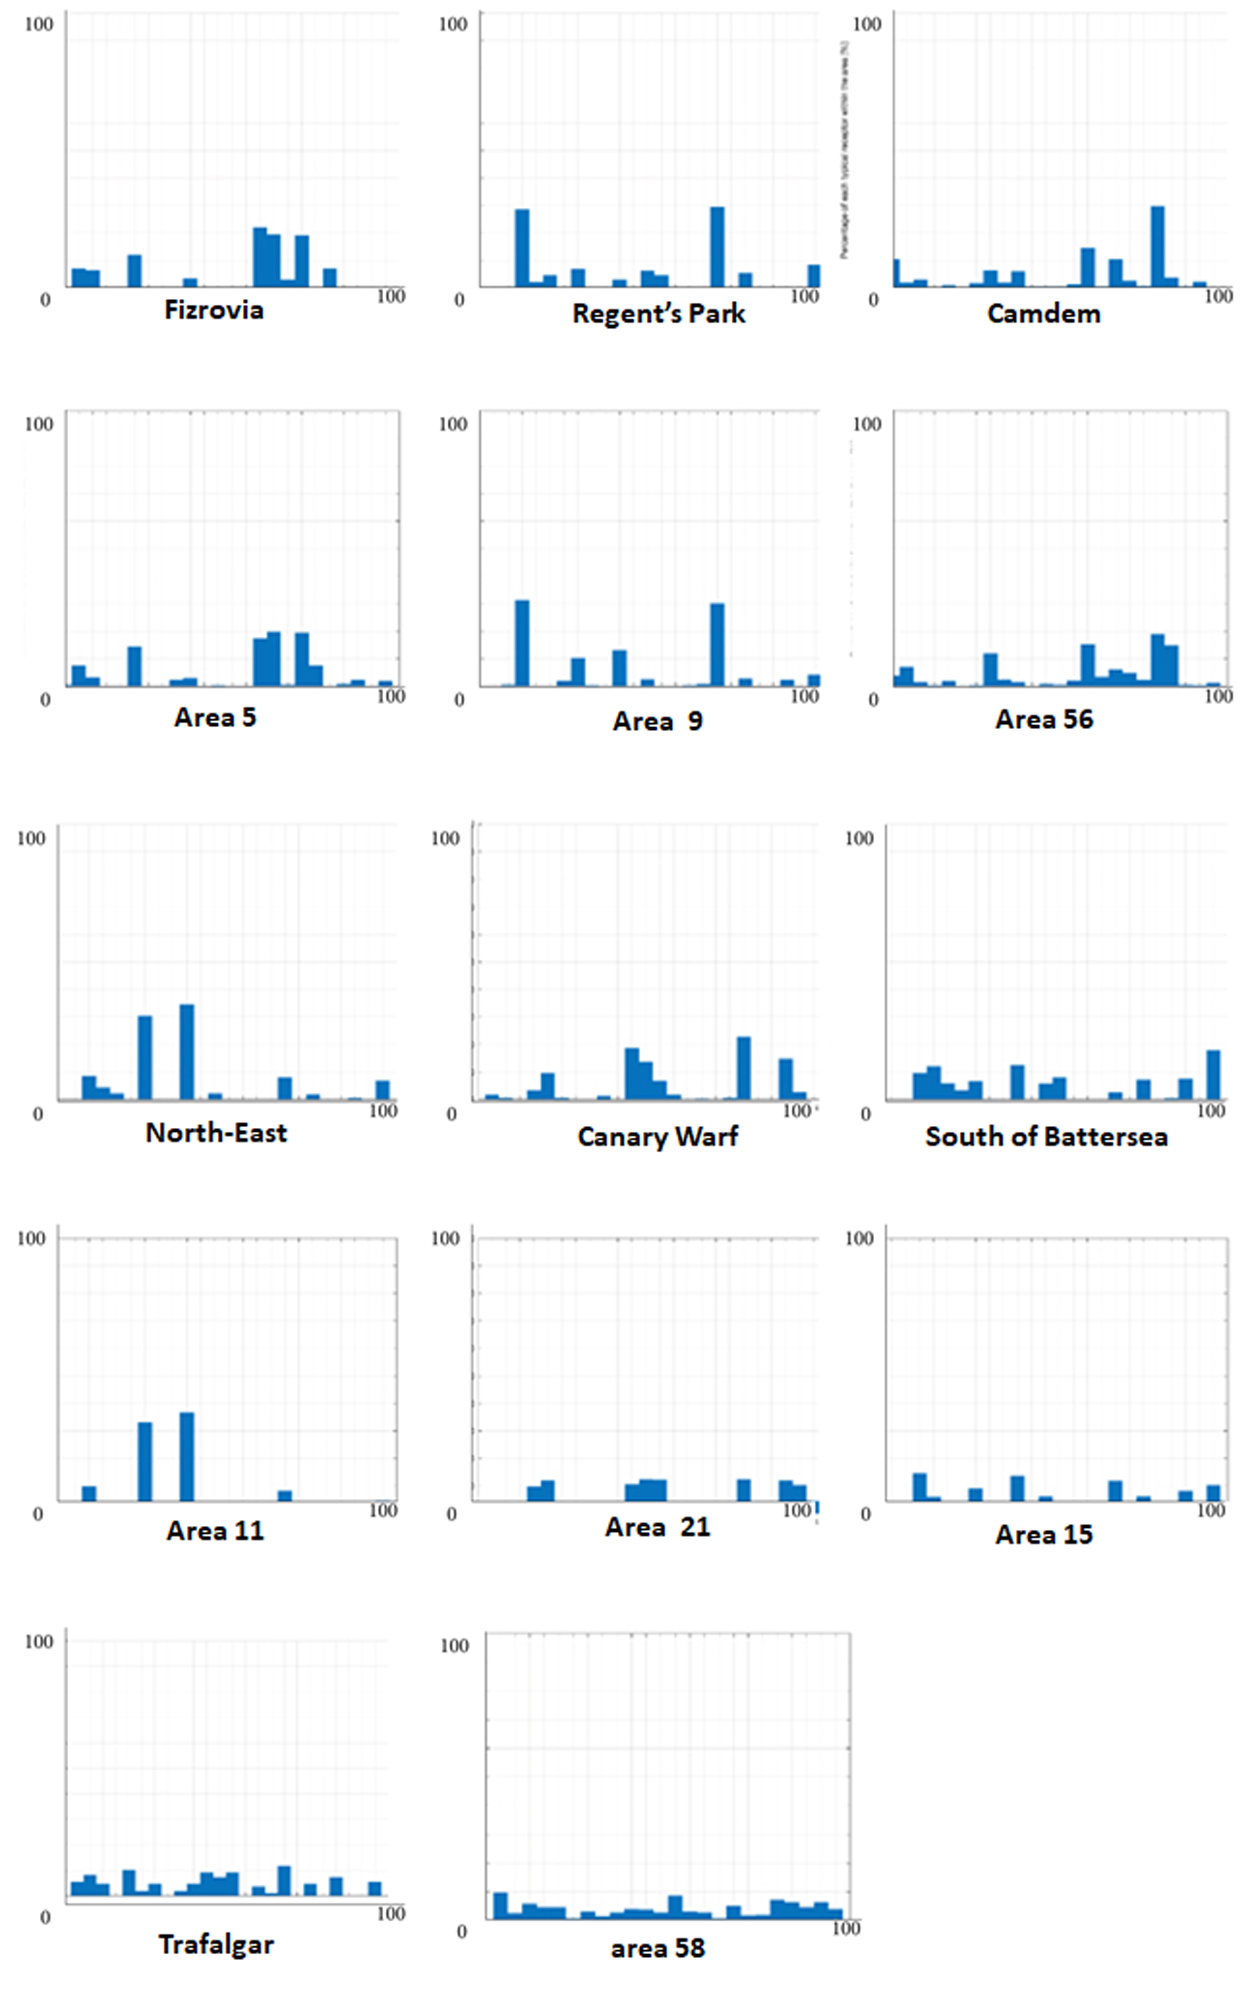
Fig. 17. Examples areas in London (same as in Fig. 16) associated to their H-histogram vector.
Many considerations can be done by comparing the various graphs, the amount of information displayed being huge. For instance, it can be noted in Fig. 15 that the same sunlight-daylight signature is obtained by buildings in quite different contexts, for orientation and obstruction: using the purple dots as an example, the same SDS characterizes buildings facing S in Area 11, facing N and S in Area 12, facing W and S in area 13, and facing W and E in area 14.
As an alternatively example, it can be observed in Fig. 15 that Regents Park and the Area 9 present a similar sunlight-daylight signature SDS in terms of H-vector: in both cases, the k-medoids n. 3 and 17 (out of the 24 typical) are the most recurring ones, and with the same occurrence percentage. A similar analysis can be done for Fitzroy and Area 5 (most recurring k-medoids: n. 6, 15, 16, and 18 in both areas) or for North-East and Area 11 (most recurring k-medoids: n. 7, and 12 in both areas).
4. Discussion
A novel method, called ‘sunlight-daylight signature SDS’, was developed to allow for qualitative analysis of urban settings in respect to daylight and sunlight availability. Through the method, different urban areas of city can be classified and compared in terms of daylight obstruction and access to sunlight, on annual basis and for the winter season. The method aims at bridging the research gap of sunlighting and daylighting analyses at urban scale, which are typically addressed through separate approaches.
The method relies on a new concept, the sunlight-daylight wedge SDW, which combines the most influencing factors on urban sunlight and daylight availability: obstruction (through the vertical sky component VSC), orientation, and sunlight access for the considered climate (through the probable annual sunlight hours PASH and the probable winter sunlight PWSH). These metrics are included in some technical reports, such as the BRE209:2011 [38], used in the UK. The approach of this standard refers to a worst-case scenario: the UK guidance for instance requires a minimum VSC value as a function of the amount of sky visible from the window considered (sky angle q). The approach therefore is based on a geometrical rule, without addressing the solar access for a given building. In contrast to this, the SDW combines the obstruction effect, through the VSC, with the sunlight availability of the site (also accounting for obstructions), through the PASH and PWSH: these account for site, through its specific weather file (or through other database of measured ground irradiances), obstructions, and orientation.
In the UK, policies nowadays refer to the Handbook ‘Site Planning for Daylight and Sunlight: A Guide to Good Practice, BR 209 2022 edition [42]. The BR 209:2022 handbook gives a set of not mandatory guidelines drafted primarily for use with low density suburban developments. It was issued in 2022 to supersede the previous version of 2011 and to account for the new paradigm introduced in the European Standard EN 17037 [43]. In short, the EN 17037 relies on a Climate Based Daylight Modelling (CBDM) methodology and/or daylight factor targets that are set to account for latitude, climate, and orientation, thus overcoming the limits of the obsolete average daylight factor (contained in the BRE 2011 version), which was based on a simplistic assumption that natural light from the sky is constant throughout each day and throughout the year and was independent of the orientation of the building. Besides, the latest version BR 2022 replaces the previous Probable Annual Sunlight Hours (PASH) method with a new, simplified approach: the test is now that the building must receive a minimum of 1.5 hours of sunlight on March 21st.
In the present study, the method still refers to PASH and PWSH, as these concepts have a wider applicability at an urban scale and allow a greater information to be considered by urban planners.
Differently from the study from DeKay [37], who developed a ‘Downtown Cooling Plan’ to cool the city through shadings, enhanced ventilation through channeling winds, and modified the existing topography, the sunlight-daylighting-signature SDS is meant to be more general. It is meant to be an instrument for town planners to analyze the impact of the urban morphology on sunlighting and daylighting access for buildings, which can be applied both for cooling and heating, while guaranteeing the potential daylighting resulting for the building occupants.
The method was developed first for London; London was selected and some of the Authors are based in London and are planning to follow up this research with site data acquisition via tools such as images and so forth. To the effect of the paper, the location is not important. The Authors are aware that different climate and different building geometries will influence the dataset and the idea of signature is the response to the ability of classifying such differences. Once London was selected, it was decided to use local PASH and PWSH as basis to build the SDW (along with VSC and orientation). This was done in accordance with the UK guideline BR 209:2022 [38]. Such a choice is linked to the specific climate that is characteristic for London (latitude 51.1°N), where a greater attention is paid to cold winters rather than to summers. However, the same procedure could include the ‘summer probable sunlight hours PSSH’, rather than PWSH into the construction of the SDW. This would be preferrable for those locations with a lower latitude and warm climates, like in southern Europe for instance, where the summer season typically represents the most challenging condition for both the comfort of users and the energy demand for cooling. The probable summer sunlight hours PSSH can be defined similarly to the probable winter sunlight hours PWSH, simply by considering the period March 21 throughout September 21.
Another key feature of novelty of the SDS procedure is the idea of reducing a large dataset of results into groups of receptors and then into representative areas by applying machine learning through the k-medoids clustering technique. This allows the qualitative analysis of urban settings to be classified and compared in respect to both sunlight and daylight conditions. A useful tool is therefore provided to urban planners and building practitioners. For a successful result of the clustering procedure, the following considerations need to be pointed out:
- the angles used in the clustering are all consistent in the way of their definition; however, as angles can be the same with two different values, it may be better to use the façade normal to cluster these
- the results are as correct as the number of clusters is; if the number of clusters is too high there will be overlap and noise. It the value is too small, then different areas will be grouped together. At this stage, a good balance was achieved with 24 typical receptors and 64 typical areas; the clustering was tested through a sensitivity analysis. Typical points and typical areas were identified, considering different partitioning for both. Based on the analysis, having 24 typical receptors works well, as it does provide, broadly speaking, 8 cardinal directions and 3 levels of obstruction
- however, using k-means or k-medoids has the limitation that the number of clusters needs to be defined a priori. This means that if the number of clusters is too high there will be some of them that could be grouped together. If the number is too low, then the results are not very specific
- the size of the area considered needs to be consistent with the one used during the clustering
- the number of typical receptors needs to be estimated by looking at how well the clusters represent the full dataset. A value of 24 can be used as a starting point
- the number of area clusters also needs to be estimated. It is possible to plot clusters and typical areas and verify that these are significant (i.e. the typical areas represent well the areas within the same cluster) and not redundant (two clusters contain similar areas)
- as the H-vector is based on the distribution of typical receptors, an area with very different density, but with similar orientation, could be misclassified. For this reason, a more robust clustering should include area density and sun over ground data
- the clustering technique and the conditions assumed in the study were optimized for the specific urban context of London: this means that, as is, the method and therefore the results that were obtained can be applied to London and cannot be successfully replicated for other contexts; in order to make the method more general and replicated, a fixed, pre-determined sampling of the sensors points should be defined and applied for any context of analysis: despite the generalization, this may yield a lower accuracy for each specific context considered, as some specific geometric features of the city considered could be missed. However, further research will address this issue at some point in the future.
As a general comment about the SDS method, it is worth stressing that it is intended for urban analysis of sunlight and daylight availability. It cannot be used to analyze the urban heat islands effect in cities, as the materials of building envelopes (roofs and façades) cannot be included in the construction of the sunlight-daylight wedge and hence cannot be classified as part of the sunlight-daylight signature.
5. Conclusions and future steps
A novel method was developed to carry out qualitative analyses of urban settings in terms of sunlight and daylight availability. The method was called ‘sunlight-daylight signature SDS’ as it provides a classification for urban areas (thus, a signature) in regards of daylight and sunlight access, accounting for obstructions, orientation, and climate of the specific site considered.
In other words, the signature of an area represents the character of its solar exposure and daylight obstruction: it therefore also allows areas with a comparable signature to be identified. The SDS can be effectively used to define the performance space of a city environment, as it does encapsulate its configuration (mass density) and the local weather conditions.
The SDS approach relies on the ‘sunlight-daylight wedge SDW’: this is a vector that combines orientation, obstruction, through the vertical sky component (VSC), solar exposure, through the annual probable sunlight hours (APSH) and the winter probable sunlight hours (WPSH), both derived from the weather data of the site considered. The specific latitude, climate and solar paths of the site are therefore considered.
The receptors are clustered into typical, representative receptors, through a first clustering, and then into representative areas, through a second clustering process: each area is characterized by its frequency of typical receptors.
The SDS was applied to the city geometry of central London, but it could be successfully applied to any other urban context, starting from a 3D GIS model. For the case of London, the final step of the procedure was the selection of 8000 areas, clustered into 64 typical signatures. Through a class color coding process, the areas with the same signature are highlighted on a map for a quick identification of the sunlight-daylight character of each area.
At this point, the clustering is not related to the subjective impression of daylight; for this, user data should be added to the dataset. We are currently looking at other GIS datasets to cross check.
The SDS is meant to be a useful tool to support both urban planners and building practitioners, as it allows both daylight and sunlight to be taken into consideration since the early design stages onward, and daylight and sunlight distribution in urban spaces can be classified and compared.
From a planning viewpoint, it is also important to stress that high-density areas require different “worst-case scenario” targets than low-density ones; these targets cannot be determined by simple guess (“a VSC of 15% is typical of a city centre, while a VSC of 27% for new edifications is a reliable value to guarantee a sufficient daylight amount inside the building”). Where an effective quantitative approach is required, the Authors recommend that the SDS approach be used.
The work is still on-going: in a first step, image recognition could be used to enhance the dataset to include also surface finishes, and extended to more experiential metrics, such as user preference, comfort, acoustics, noise, but also market value, etc.
The main goal of the future development is the proposal of a new metric for urban daylight access, beyond BR 209:2022, to consider the SDW and the comparison of the performance of different areas through the sunlight-daylight signature method. Another future goal concerns the study of advantages and disadvantages of having a fixed, predetermined a priori discretization of urban area for the position of the sensor points to be clustered.
Contributions
All the authors contributed equally.
Declaration of competing interest
The authors declare no conflict of interest.
References
- P. Rode, C. Keim, G. Robazza, P. Viejo, and J. Schofield. Cities and energy: urban morphology and heat energy demand (London School of Economics, Cities, and European Institute for Energy Research, Karlsruhe Institute of Technology, London, 2014. https://doi.org/10.1068/b39065
- N. Nasrollahi, and E. Shokri. Daylight illuminance in urban environments for visual comfort and energy performance. Renewable and Sustainable Energy Reviews 66 (2016) 861-874. https://doi.org/10.1016/j.rser.2016.08.052
- Y.Q. Ang, Z.M. Berzolla, and C.F. Reinhart. From concept to application: A review of use cases in urban building energy modeling. Applied Energy 279 (2020) 115738. https://doi.org/10.1016/j.apenergy.2020.115738
- J. Zhang, C. Kiang Heng, L.C. Malone-Lee, D.J. Chung Hii, P. Janssen, K. Shing Leung, and B. Kiang Tan. Evaluating environmental implications of density: A comparative case study on the relationship between density, urban block typology and sky exposure. Automation in Construction 22 (2012) 90-101. https://doi.org/10.1016/j.autcon.2011.06.011
- J.Y. Szcześniak, Y.Q. Ang, S. Letellier-Duchesne, and C.F. Reinhart. A method for using street view imagery to auto-extract window-to-wall ratios and its relevance for urban-level daylighting and energy simulations, Building and Environment (2021), 108108. https://doi.org/10.1016/j.buildenv.2021.108108
- D. Tsirigoti, A. Tsikaloudaki,and D. Bikas. Urban Form and Daylighting: Examining daylighting conditions with regard to building block typologies. Chapter 4 - Design and Technologies for Energy Efficiency. In Proc. of Portugal SB13, Contribution of sustainable building to meet EU 20-20-20 targets, October 30-November 1, 2013, Guimarães, Portugal. Last retrieved on August 31, 2021.
- L.A. Adolphe. A simplified model of urban morphology: application to an analysis of the environmental performance of cities. Environment and Planning B: Planning and Design 28 (2001) 183-200. https://doi.org/10.1068/b2631
- G. Baghaeipoor, and N. Nasrollahi. The Effect of Sky View Factor on Air temperature in High-rise Urban Residential Environments. Journal of Daylighting 6 (2019) 42-51. https://doi.org/10.15627/jd.2019.6
- M. DeKay. Daylighting and urban form: an urban fabric of light. Journal of Architectural and Planning Research, 27(1) (2010) 35-56.
- T. Dogan, C.F. Reinhart, and P. Michalatos. Urban daylight simulation - Calculating the daylit area of urban designs. Proc. of the Fifth National Conference of IBPSA-USA 'SimBuild 2012', Madison, Wisconsin, US, August 1-3, 2012.
- J. Liang, J. Gong, W. Li, and A.N. Ibrahim. A visualization-oriented 3D method for efficient computation of urban solar radiation based on 3D-2D surface mapping. International Journal of Geographical Information Science, 28(4) (2014) 780-798. https://doi.org/10.1080/13658816.2014.880168
- P. Littlefair, P. Daylight, sunlight and solar gain in the urban environment. Solar Energy 70 (3) (2001) 177-185. https://doi.org/10.1016/S0038-092X(00)00099-2
- Garcia-Nevado, E., Pages-Ramon, A., Coch, E. Solar Access Assessment in Dense Urban Environments: The Effect of Intersections in an Urban Canyon. Energies 9(10) (2016) 796. https://doi.org/10.3390/en9100796
- S. Ahmadi. An Analysis of Urban Form and Canyon for Performative Daylighting Design. Final thesis in Master of Science in Architecture, School of Architecture, University of Washington, 2019. https://doi.org/10.1002/hfm.20128
- J. Strømann-Andersen, and P.A. Sattrup. The urban canyon and building energy use: Urban density versus daylight and passive solar gains. Energy and Buildings 43 (2011) 2011-2020. https://doi.org/10.1016/j.enbuild.2011.04.007
- N. Mohajeri, A. Gudmundsson, T. Kunckler, G. Upadhyay, D. Assouline, J.K. Kämpf, and J.-L. Scartezzini. A solar-based sustainable urban design: the effects of city-scale street-canyon geometry on solar access in Geneva, Switzerland. Applied Energy 240 (2019) 173-190. https://doi.org/10.1016/j.apenergy.2019.02.014
- J. Huang, J.G. Cedeño-Laurent, and J.D. Spengler. CityComfort+: A simulation-based method for predicting mean radiant temperature in dense urban areas. Building and Environment 80 (2014) 84-95. https://doi.org/10.1016/j.buildenv.2014.05.019
- N. Šprah, and M. Košir. Daylight Provision Requirements According to EN 17037 as a Restriction for Sustainable Urban Planning of Residential Developments Sustainability 12 (2020) 315. https://doi.org/10.3390/su12010315
- E. Rynska, and M. Yanchuk. Dense and Proximate Development-Daylight in the Downtown Area of a Compact City. Sustainability 2022, 14, 774. https://doi.org/10.3390/su14020774
- M. Fernández, D. Moreno, P.M. Esquivias. Influence of daylight in urban design as a tool towards a more sustainable city. Proceedings of the II International and IV National Congress on Sustainable Construction and Eco-Efficient Solutions. Seville, Spain, May 25-27, 2015.
- C. Ratti, N. Baker, and K. Steemers. Energy consumption and urban texture. Energy and Buildings 37(7) (2005) 762-776. https://doi.org/10.1016/j.enbuild.2004.10.010
- R. Compagnon. Solar and daylight availability in the urban fabric. Energy and Buildings 36 (2004) 321-328. https://doi.org/10.1016/j.enbuild.2004.01.009
- K. Drago, S. Brunoro, and C. Engel. Daylighting analysis: a Contribution to the urban planning of the city of Marilândia - ES (Brazil). IOP Conf. Series: Earth and Environmental Science 503 (2020) 012082. https://doi.org/10.1088/1755-1315/503/1/012082
- I. Turan, A. Chegut, D. Fink, and C.F. Reinhart. The value of daylight in office spaces. Building and Environment 168 (2020) 106503. https://doi.org/10.1016/j.buildenv.2019.106503
- E. Compte Colona. Potential reduction in energy consumption in consolidated built environments. An analysis based on climate, urban planning and users. Vitruvio - International journal of Architecture Technology and Sustainability 3 (2018) 47-71. https://doi.org/10.4995/vitruvio-ijats.2018.10098
- R.A. Achsani, A.U. Paramitasari, M. Sugangga, S. Wonorahardjo, and S. Triyadi. Optimization of daylighting outdoor availability in urban kampung. 5th HABITechno International Conference. IOP Conf. Series: Earth and Environmental Science 1058 (2022) 012006. https://doi.org/10.1088/1755-1315/1058/1/012006
- E. Saratsis, T. Dogan, and C.F. Reinhart. Simulation-based daylighting analysis procedure for developing urban zoning rules. Building research & information 45(5) (2017) 478-491. https://doi.org/10.1080/09613218.2016.1159850
- V.R.M. Lo Verso, E. Fregonara, F. Caffaro, C. Morisano, and G.M. Peiretti. Daylighting as the driving force of the design process: From the results of a survey to the implementation into an advanced daylighting project. Journal of Daylighting 1 (2014) 36-55 https://doi.org/10.15627/jd.2014.5
- Carlin, A., Lo Verso, V.R.M., Invernizzi, S., Polato, A. Optimised daylighting for comfort and energy saving for the factory of the future. International journal of mechanics and control, 18-1 (2017) 15-29.
- V.R.M. Lo Verso, S. Invernizzi, A. Carlin, A. Polato. Towards the factory of the future: A new concept based on optimized daylighting for comfort and energy saving. Proc. of Environment and Electrical Engineering (EEEIC), 2015 IEEE 15th International Conference, Rome (Italy), June 10-13, 2015, pp. 701-706. https://doi.org/10.1109/EEEIC.2015.7165250
- S. Carlucci, F. Causone, F. De Rosa, and L. Pagliano. A review of indices for assessing visual comfort with a view to their use in optimization processes to support building integrated design. Renewable and Sustainable Energy Reviews 47 (2015) 1016-1033. https://doi.org/10.1016/j.rser.2015.03.062
- I.G. Capeluto, and E. Shaviv. On the use of 'solar volume' for determining the urban fabric. Solar Energy 70(3) (2001) 275-280, PII: S0038 - 092X(00)00088-8. https://doi.org/10.1016/S0038-092X(00)00088-8
- E. Nault, C. Waibel, J. Carmeliet, and M. Andersen. Development and test application of the UrbanSOLve decision-support prototype for early-stage neighborhood design. Building and Environment 137 (2018) 58-72. https://doi.org/10.1016/j.buildenv.2018.03.033
- K.N. Patil, S.C. Kaushik, and S.N. Garg. Qualitative and quantitative assessment of outdoor daylight on vertical surfaces for six climate specific Indian cities. Cogent Engineering (2014), 1: 962838. https://doi.org/10.1080/23311916.2014.962838
- M. Dirksen, R.J. Rondan, N.E. Theeuwes, and G.A. Pagani. Sky view factor calculations and its application in urban heat island studies. Urban Climate 30 (2019) 100498. https://doi.org/10.1016/j.uclim.2019.100498
- G. Besuievsky, E. Fernandez, K.P. Aguerre, and B. Beckers. A radiosity-based methodology considering urban environments for assessing daylighting. Journal of Physics: Conference Series, Volume 1343, CISBAT 2019 | Climate Resilient Cities - Energy Efficiency & Renewables in the Digital Era 4-6 September 2019, EPFL Lausanne, Switzerland, J. Phys.: Conf. Ser. 1343 012156. https://doi.org/10.1088/1742-6596/1343/1/012156
- R.M. DeKay. Climatic urban design: configuring the urban fabric to support daylighting, passive cooling, and solar heating. Southampton: WIT Press, Transactions on ecology and the environment 155 (2012), 155, 619-630. https://doi.org/10.2495/SC120522
- BRE (Building Research Establishment). Site layout planning for daylight and sunlight: a guide to good practice (BR 209). Written by P. Littlefair. Garston, Watford, UK, 2011.
- G. Capeluto. The influence of the urban environment on the availability of daylighting in office buildings in Israel. Building and Environment 38 (2003) 745-752. https://doi.org/10.1016/S0360-1323(02)00238-X
- F. Miguet, and D. Groleau. A daylight simulation tool for urban and architectural spaces - application to transmitted direct and diffuse light through glazing. Building and Environment 37 (2002) 833-843. https://doi.org/10.1016/S0360-1323(02)00049-5
- N.G. Edward. Studies on daylight design and regulation of high-density residential housing in Hong Kong. Lighting Research and Technology 352 (2003) 127-139.
- BRE (Building Research Establishment). Site layout planning for daylight and sunlight: a guide to good practice (BR 209, 2022 Edition). Written by by P. Littlefair, S. King, G. Howlett, C. Ticleanu and A. Longfield. Garston, Watford, UK, 2022.
- CEN (Comité Européen de Normalisation). European Standard EN 17037:2018 - Daylight in buildings. European Committee for Standardization, Brussel, 2018.
Copyright © 2023 The Author(s). Published by solarlits.com.

4813
Total views
Citations
SHARE ON


