Volume 10 Issue 1 pp. 31-44 • doi: 10.15627/jd.2023.3
Impact of Window Design on Dynamic Daylight Performance in an Office Building in Iran
Shiva Farivar, Shabnam Teimourtash⁎
Author affiliations
Department of Architecture, Mashhad Branch, Islamic Azad University, Mashhad, Iran
*Corresponding author.
shivafarivar@gmail.com (S. Farivar)
shabnam.teimourtash@iau.ac.ir (S. Teimourtash)
History: Received 13 January 2023 | Revised 26 February 2023 | Accepted 4 March 2023 | Published online 22 March 2023
Copyright: © 2023 The Author(s). Published by solarlits.com. This is an open access article under the CC BY license (http://creativecommons.org/licenses/by/4.0/).
Citation: Shiva Farivar, Shabnam Teimourtash, Impact of Window Design on Dynamic Daylight Performance in an Office Building in Iran, Journal of Daylighting 10 (2023) 31-44. https://dx.doi.org/10.15627/jd.2023.3
Figures and tables
Abstract
Window design affects the building's appearance. Besides, it has a significant impact on daylight performance and the visual comfort of interior spaces. Therefore, choosing the shape and position of windows can be a challenge for architects. This research aims to investigate the impact of window design on dynamic daylight performance to enhance visual comfort. The research examines five common window shapes that are located in two different positions on the southern-facing side. The most common dynamic daylight metrics of LEED v4.1 were used to investigate the spatial daylight autonomy (sDA), and annual sunlight exposure (ASE). Furthermore, useful daylight illuminance (UDI) was considered a complementary approach to assess useful daylight levels. The metrics are examined in three cities including Mashhad, Isfahan, and Bandar Abbas, which are located in the northeast, center, and south of Iran, respectively. Thirty simulations in each city are conducted by Grasshopper Graphical editor as a parametric interface and its plugins, ladybug, and honeybee for dynamic daylight analysis. The results emphasize that window design has a significant impact on dynamic daylight performance. The square window meets the LEED needs in three cities by achieving maximum sDA and minimum ASE by up to 68.8% and 20% in both positions, respectively. Moreover, the centrally positioned square window presents the lowest ASE level of 14.4% among other cases. However, the windows in a higher position, especially horizontal windows obtain the highest values of sDA, UDI, and ASE by up to 77%, 59%, and 30%, respectively. Therefore, the ASE rates deteriorate by increasing the sill height and head height of windows. This paper can provide window design recommendations based on the comparison of dynamic daylight metrics for five common window shapes.
Keywords
Window design, Dynamic daylight performance, Visual comfort, LEED
Nomenclature
| ADF | Average daylight factor |
| ASE | Annual sunlight exposure |
| BSk | Cold semi-arid climate |
| BWh | Hot desert climate |
| BWk | Cold desert climate |
| CBDM | Climate-based daylight modelling |
| Csa | Hot-summer mediterranean climate |
| DA | Daylight autonomy |
| DF | Daylight factor |
| Dsa | Mediterranean-influenced hot-summer humid continental climate |
| DGP | Daylight glare probability |
| EPW | Energyplus weather File |
| LEED | Leadership in energy and environmental design |
| sDA | Spatial daylight autonomy |
| UDI | Useful daylight illuminance |
| WDR | Width-to-Depth ratio |
| WFR | Window-to-Floor ratio |
| Wp | Working plane |
| WWR | Window-to-Wall ratio |
| FWR | Film-to-Window ratio |
1. Introduction
Window design is sometimes considered to be the result of an architectural style more than a determining issue of daylight performance. However, window design, the principal element to obtain daylight, has a significant impact on achieving visual comfort and reducing energy consumption in buildings. Thus, the proper position, area, size, number, and shape of the windows and the characteristics of the glass are vital in daylight distribution and reducing the need for artificial lighting.
Daylight provides a higher level of visual comfort to the occupants compared to electric light [1,2]. Therefore, it is a significant parameter in window design and a potential passive solution to improve energy efficiency and visual comfort, particularly in office buildings [2]. Daylight performance analysis and incorporation of the findings with the building façade design process can ensure the effective use of daylighting in buildings [3]. Daylight performance metrics are divided into two categories including static and dynamic that are based on the analysis period (point-in-time vs. annual) and sky model (standard vs. climate-based) [4]. daylight factors (DF) is a static daylight metric that calculates under overcast conditions. However, dynamic daylight metrics such as spatial daylight autonomy (sDA), useful daylight illuminance (UDI), and annual sunlight exposure (ASE) are according to annual daylight illuminance data, thus the room location, the window orientation, or building occupancy pattern affect the calculation of results [5,6].
Several studies have been conducted about window size, type, material, and orientation on dynamic daylight performance to achieve visual and thermal comfort. Examples include the effect of window-to-wall ratio (WWR) by providing the equivalence between energy and visual requirements [7-9]. Offering approaches to optimize the WWR, glazing, and film area film-to-window ratio (FWR) for spatial daylight autonomy [10]. Finding the appropriate values of WWR and width-to-depth ratio (WDR) for specific orientations and climate conditions [11], and wall reflectance on Hybrid-Model Simulations to equilibrate daylight and energy demand [12]. Presenting a multi-objective optimization framework as a decision-making tool for office windows to maximize the quality of view, daylight, and minimize energy usage [13], and influence of a glazing system using parallel slat transparent insulation material on daylight performance [14].
Other studies tried to demonstrate the impact of daylighting control systems on dynamic daylight metrics, such as the effects of daylight technologies to improve daylight illuminance levels, uniformity distribution, and energy saving, comprising the light shelf [15,16], anidolic systems, translucent materials, and light shelf coupled with external reflectors [16]. Proposing a new ceramic louver system for office buildings on dynamic daylight performance [17], Optimizing of louver shading devices by parametric and multi-objective optimization approaches to achieve maximum UDI and reduce energy consumption in an office room under three sky conditions [18], and improving the flexibility of shading to control daylight and glare quality of office spaces by dynamic shading system [19]. Increasing the efficiency of indoor daylight using optimal kinetic shading systems [21]. Enhancing visual comfort and lighting energy consumption by developing optimum fixed external shading systems [20], and optimizing passive daylight strategies through dynamic metrics to achieve simultaneous focus on maximizing daylight penetration and diminishing the risk of glare [22].
However, little attention has been paid to the influence of window shapes and positions on dynamic daylight performance in buildings. Lui et al. [23] investigated the illumination distribution and daylight glare with different windows, and determined that the rectangle window has the maximum illumination and glare. Whereas, the circular window and both circular, and square windows have the lowest amount of indoor illumination and glare, respectively. The other windows, including square window, vertical, and arched have little change in maximum and minimum internal illumination, respectively. Maleki and Dehghan [24] to find the optimal design of windows, considering four factors of WWR, window shape and position, demonstrated the values of average daylight factor (ADF), sDA, and UDI to achieve an acceptable range of daylight metrics in all orientations. While the ASE requires improvement. The north-facing WWR of 40% is a good selection, WWR of 30% with the square and horizontal shapes in the upper and central positions were optimal solutions for other window orientations. Acosta et al. [5] to quantify the daylight dynamic metrics for different window models and analyze the results, presented that horizontal windows in the side axis provided higher daylight autonomy (DA) values and more uniform illumination, and higher energy saving than other shapes of windows. Additionally, Acosta et al. [25] in another research quantified the daylight factors for different window models and analyzed the results, concluding that square windows provide a slightly higher daylight factor value than horizontal windows and significantly higher than vertical windows. However, horizontal windows present higher energy savings than other window shapes. In addition, few studies have been conducted on window design with identical window-to-floor ratio (WFR) and specific climate conditions based on the Köppen climate classification. In a study to determine the optimum window size based on WFR in the climates (CSa and DSa), through UDI, DA, and ASE metrics, the horizontal window was the best in these two climates. However, it receives higher illuminance levels and ASE in the upper position [26].
As shown in Table 1, a summary of previous studies demonstrate that horizontal and square windows show the best results of static and dynamic daylight performance among other window shapes. Nevertheless, the findings slightly change according to different climates and window orientations. The horizontal windows provide more uniform illuminance and higher energy savings for electrical lighting, the windows in higher positions present deeper daylight penetration into indoor spaces, and the windows in the central place at eye level presenting a view of the outside are also beneficial.
Table 1
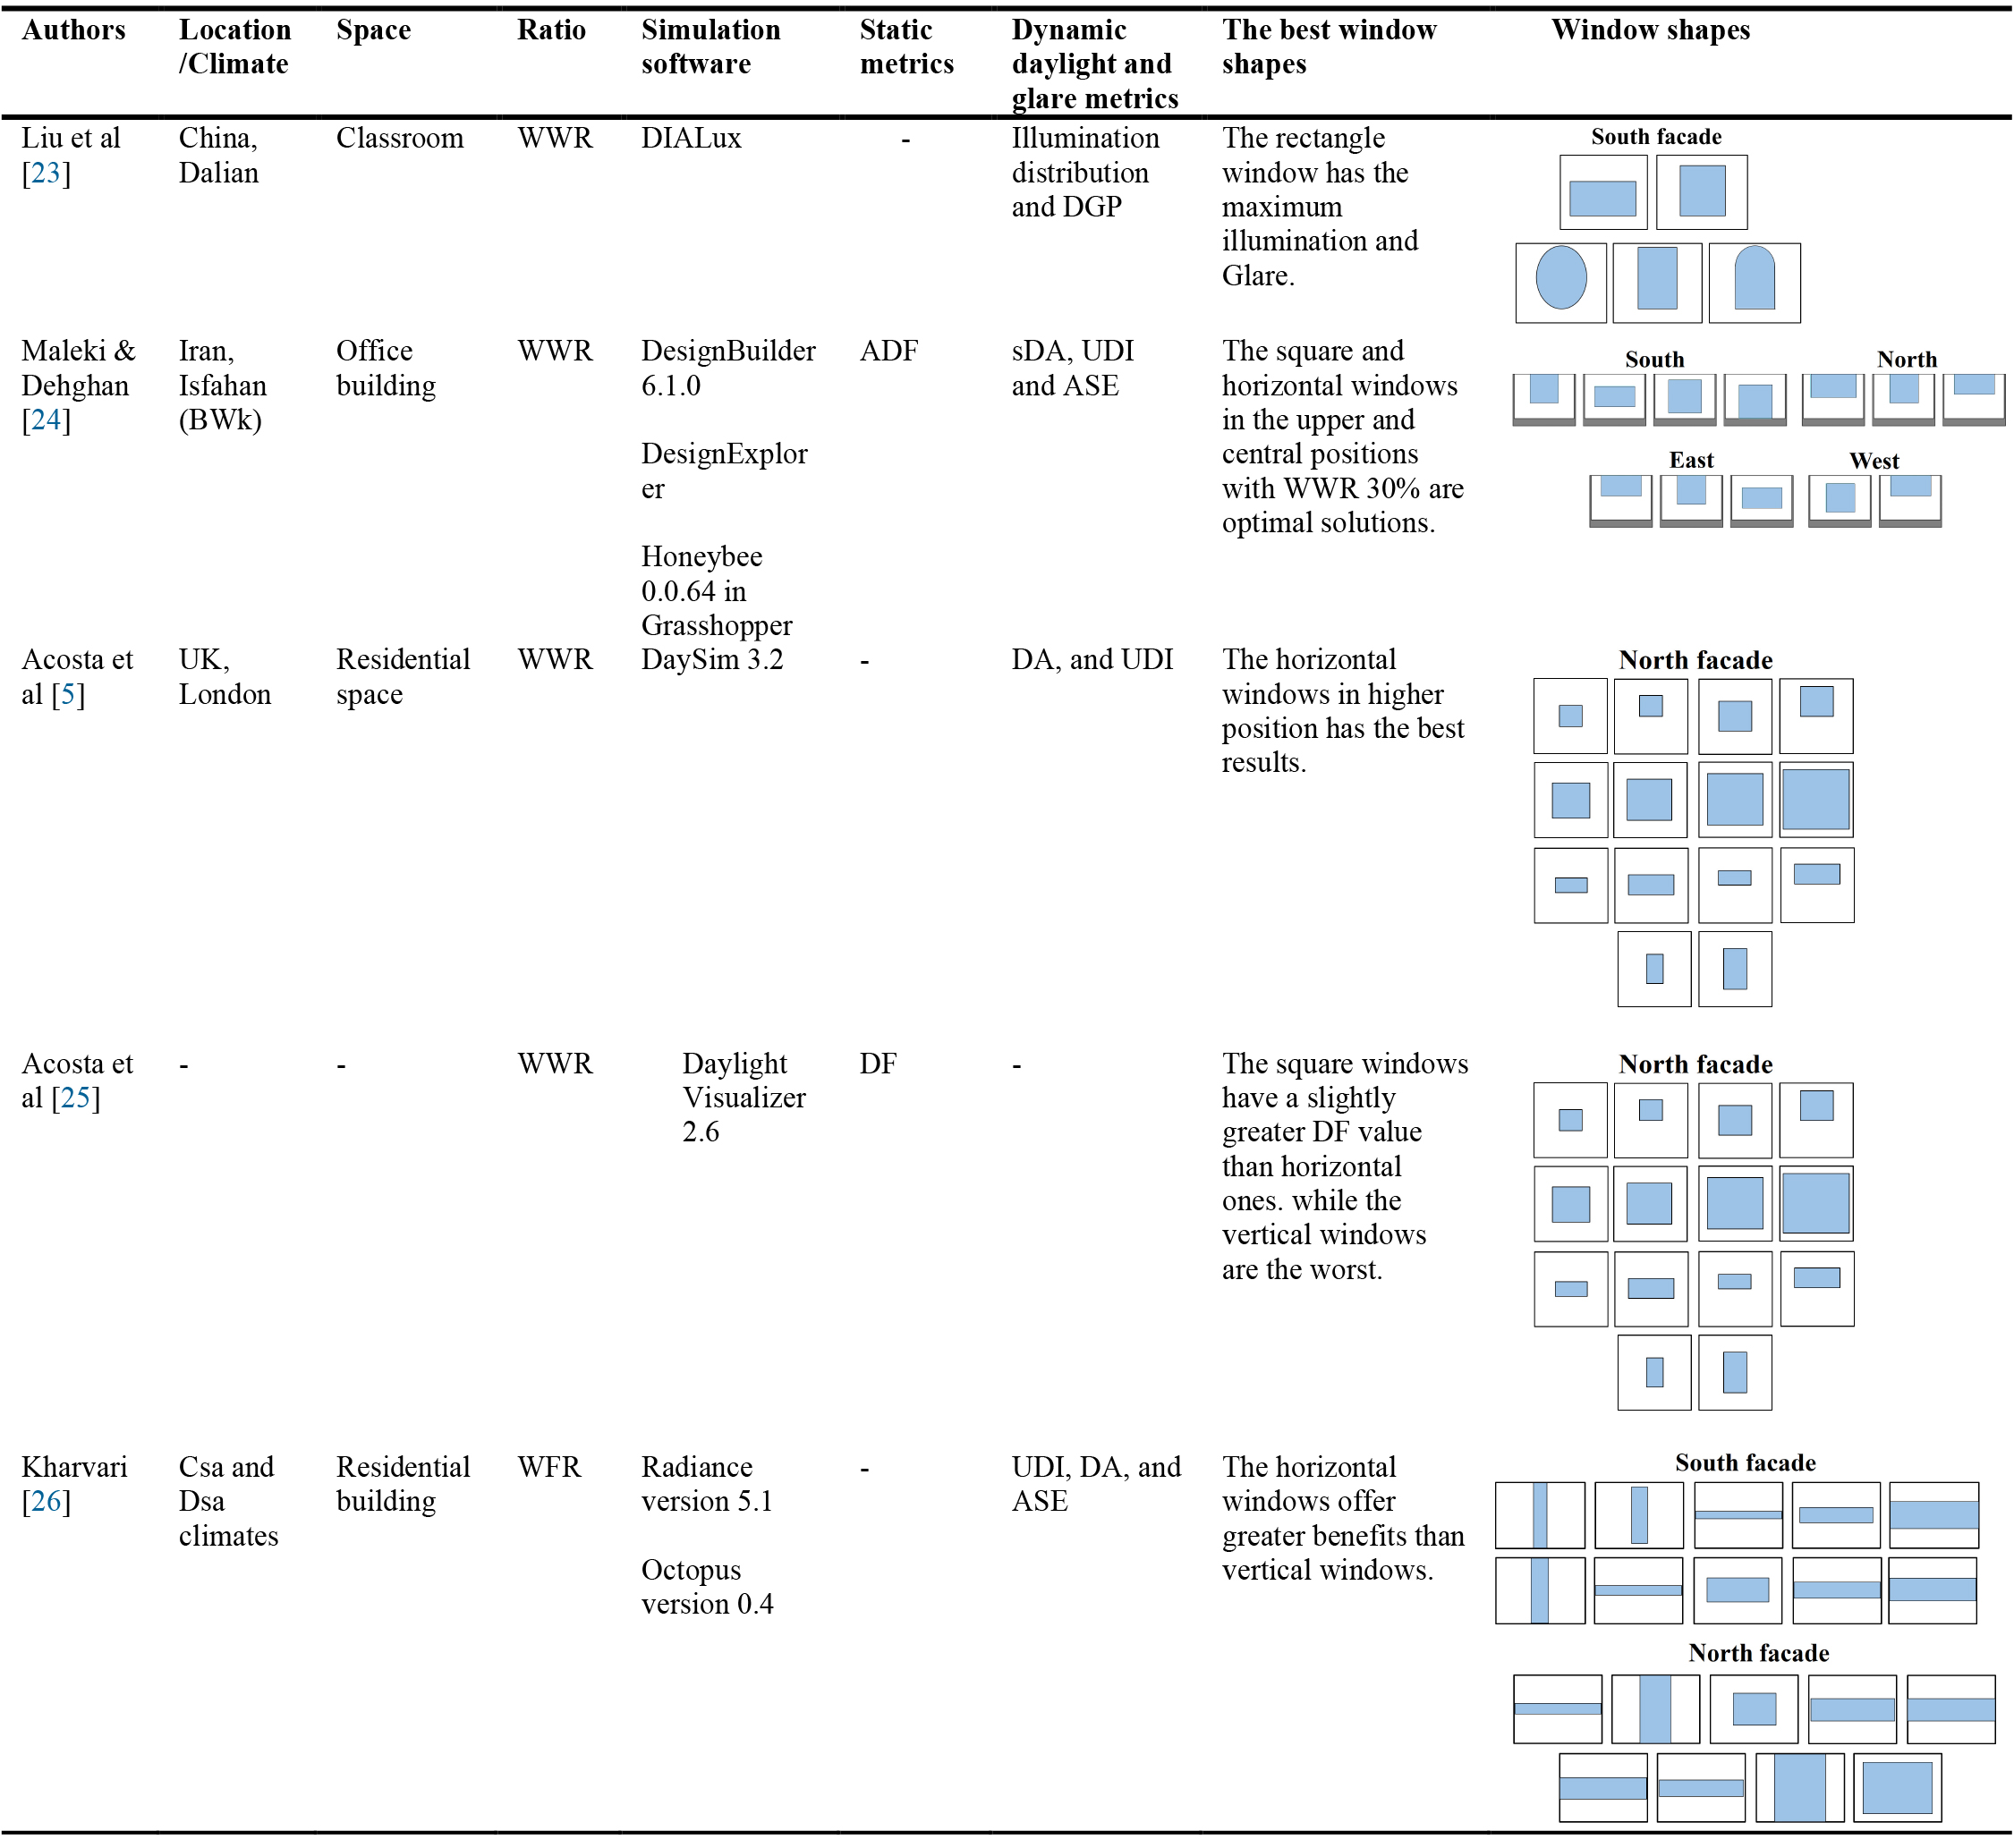
Table 1. Previous studies about window shapes and positions.
Based on previous studies, this research aims to assess the impact of window design on dynamic daylight performance. This paper investigates the effect of the most common window shapes and positions for an office building in arid and semi-arid climates of Iran respecting the limits imposed by the LEED rating system.
2. Methodology
2.1. Overview of the research methodology
In general, the research process is carried out in three phases which are presented as follows:
- In phase one, five window shapes in two different positions in geometry models of office space are parametrically modeled by Grasshopper 3D.
- In phase two, weather data of three different cities and other simulated properties are included as shown in Table 2, and dynamic daylight metrics namely, sDA, ASE, and UDI are simulated by Honeybee and Ladybug plugins for Grasshopper 3D.
- In phase three, optimum windows are selected by comparing dynamic daylight results based on LEED in three different climates. Figure 1 depicts the overall procedure employed.
Table 2
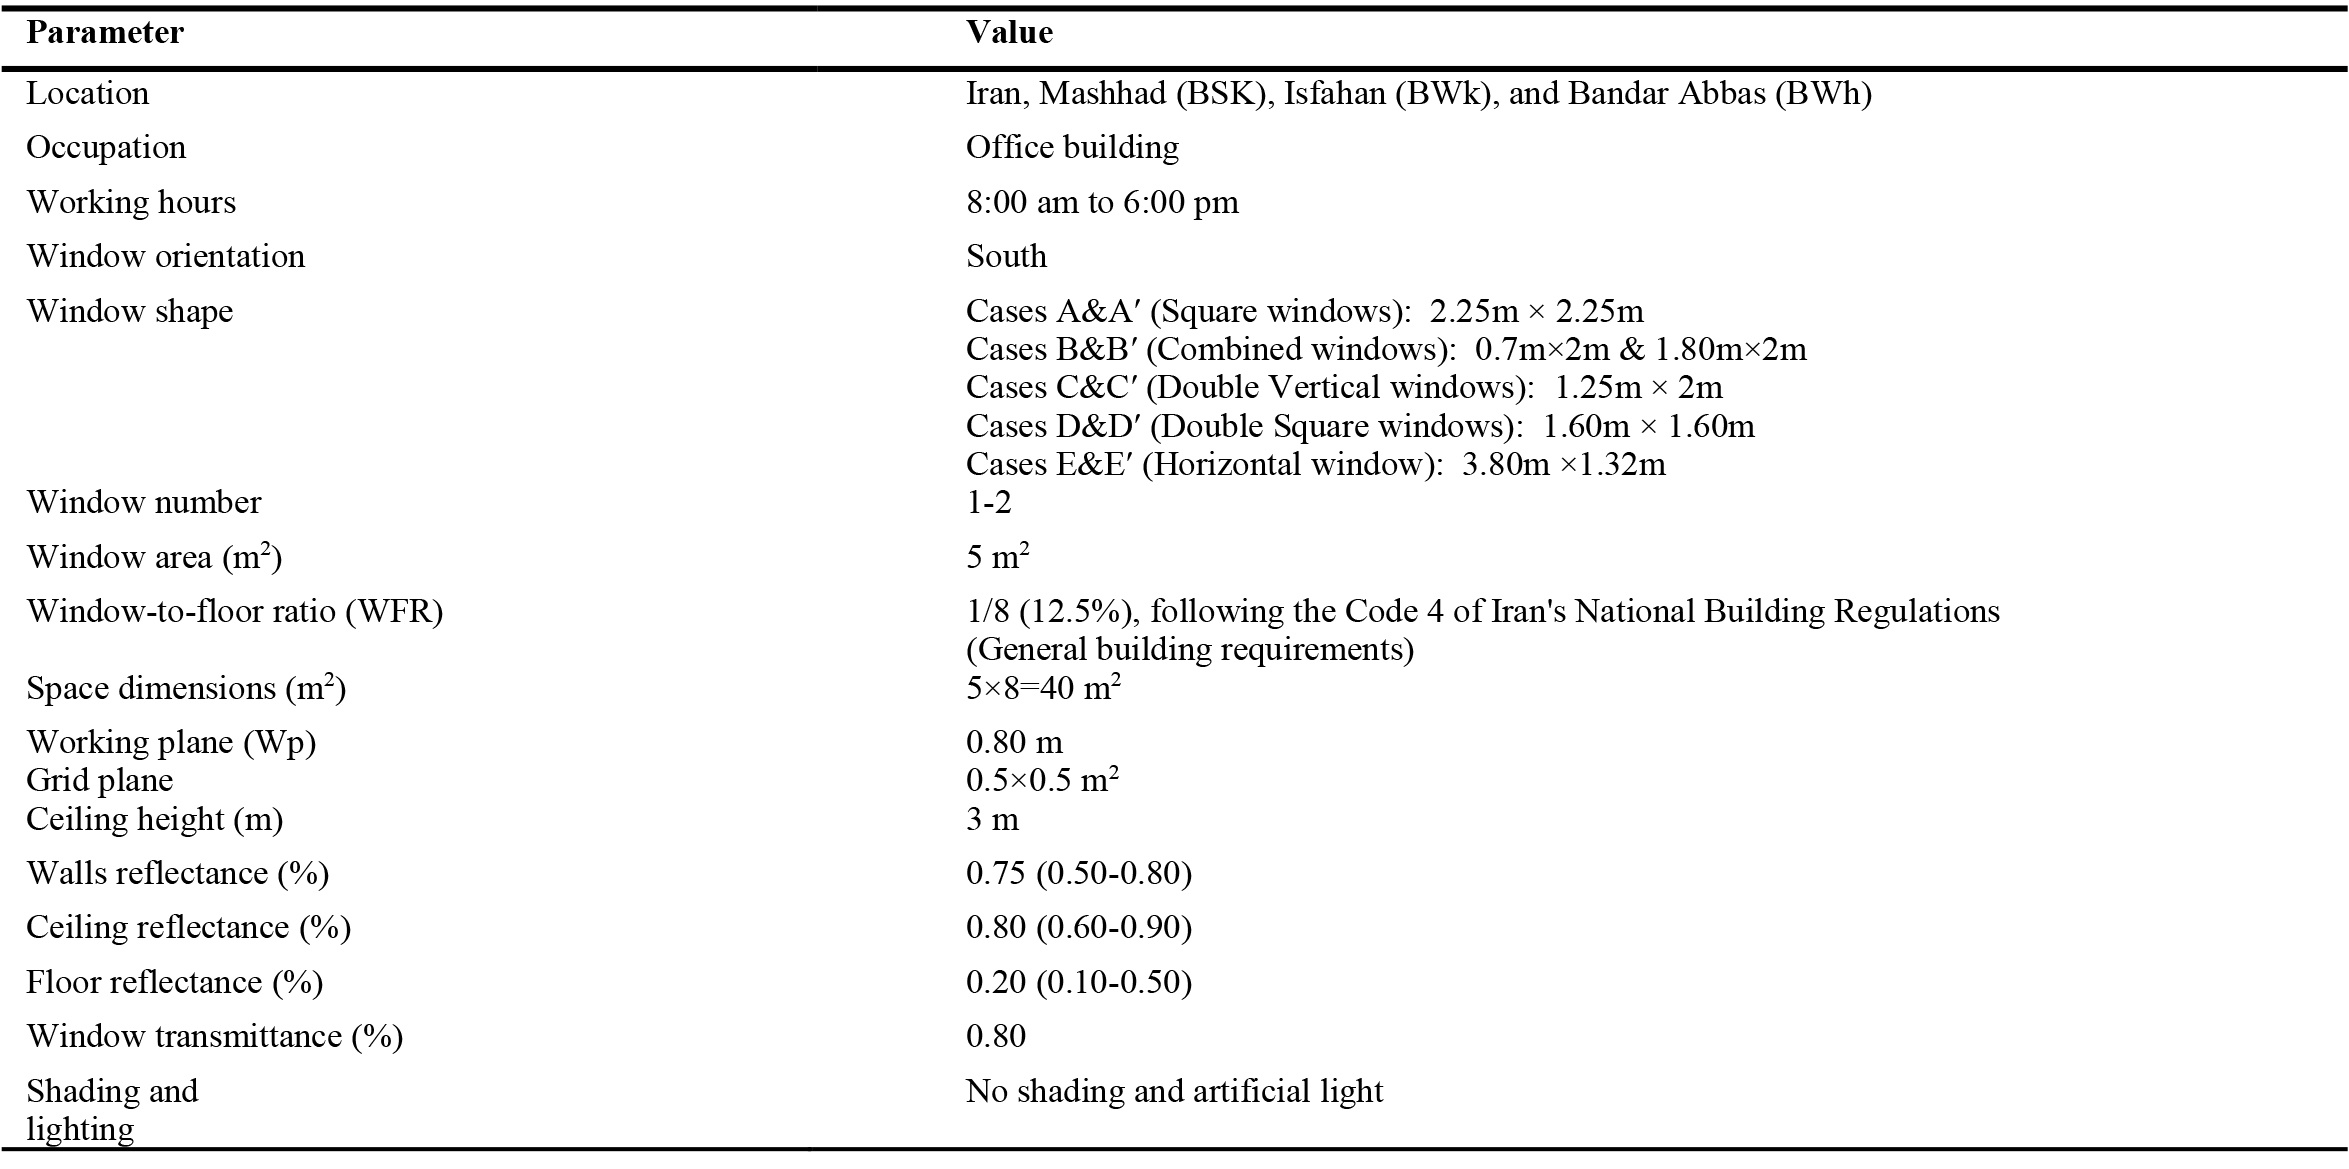
Table 2. Simulated properties of an office space.
Figure 1
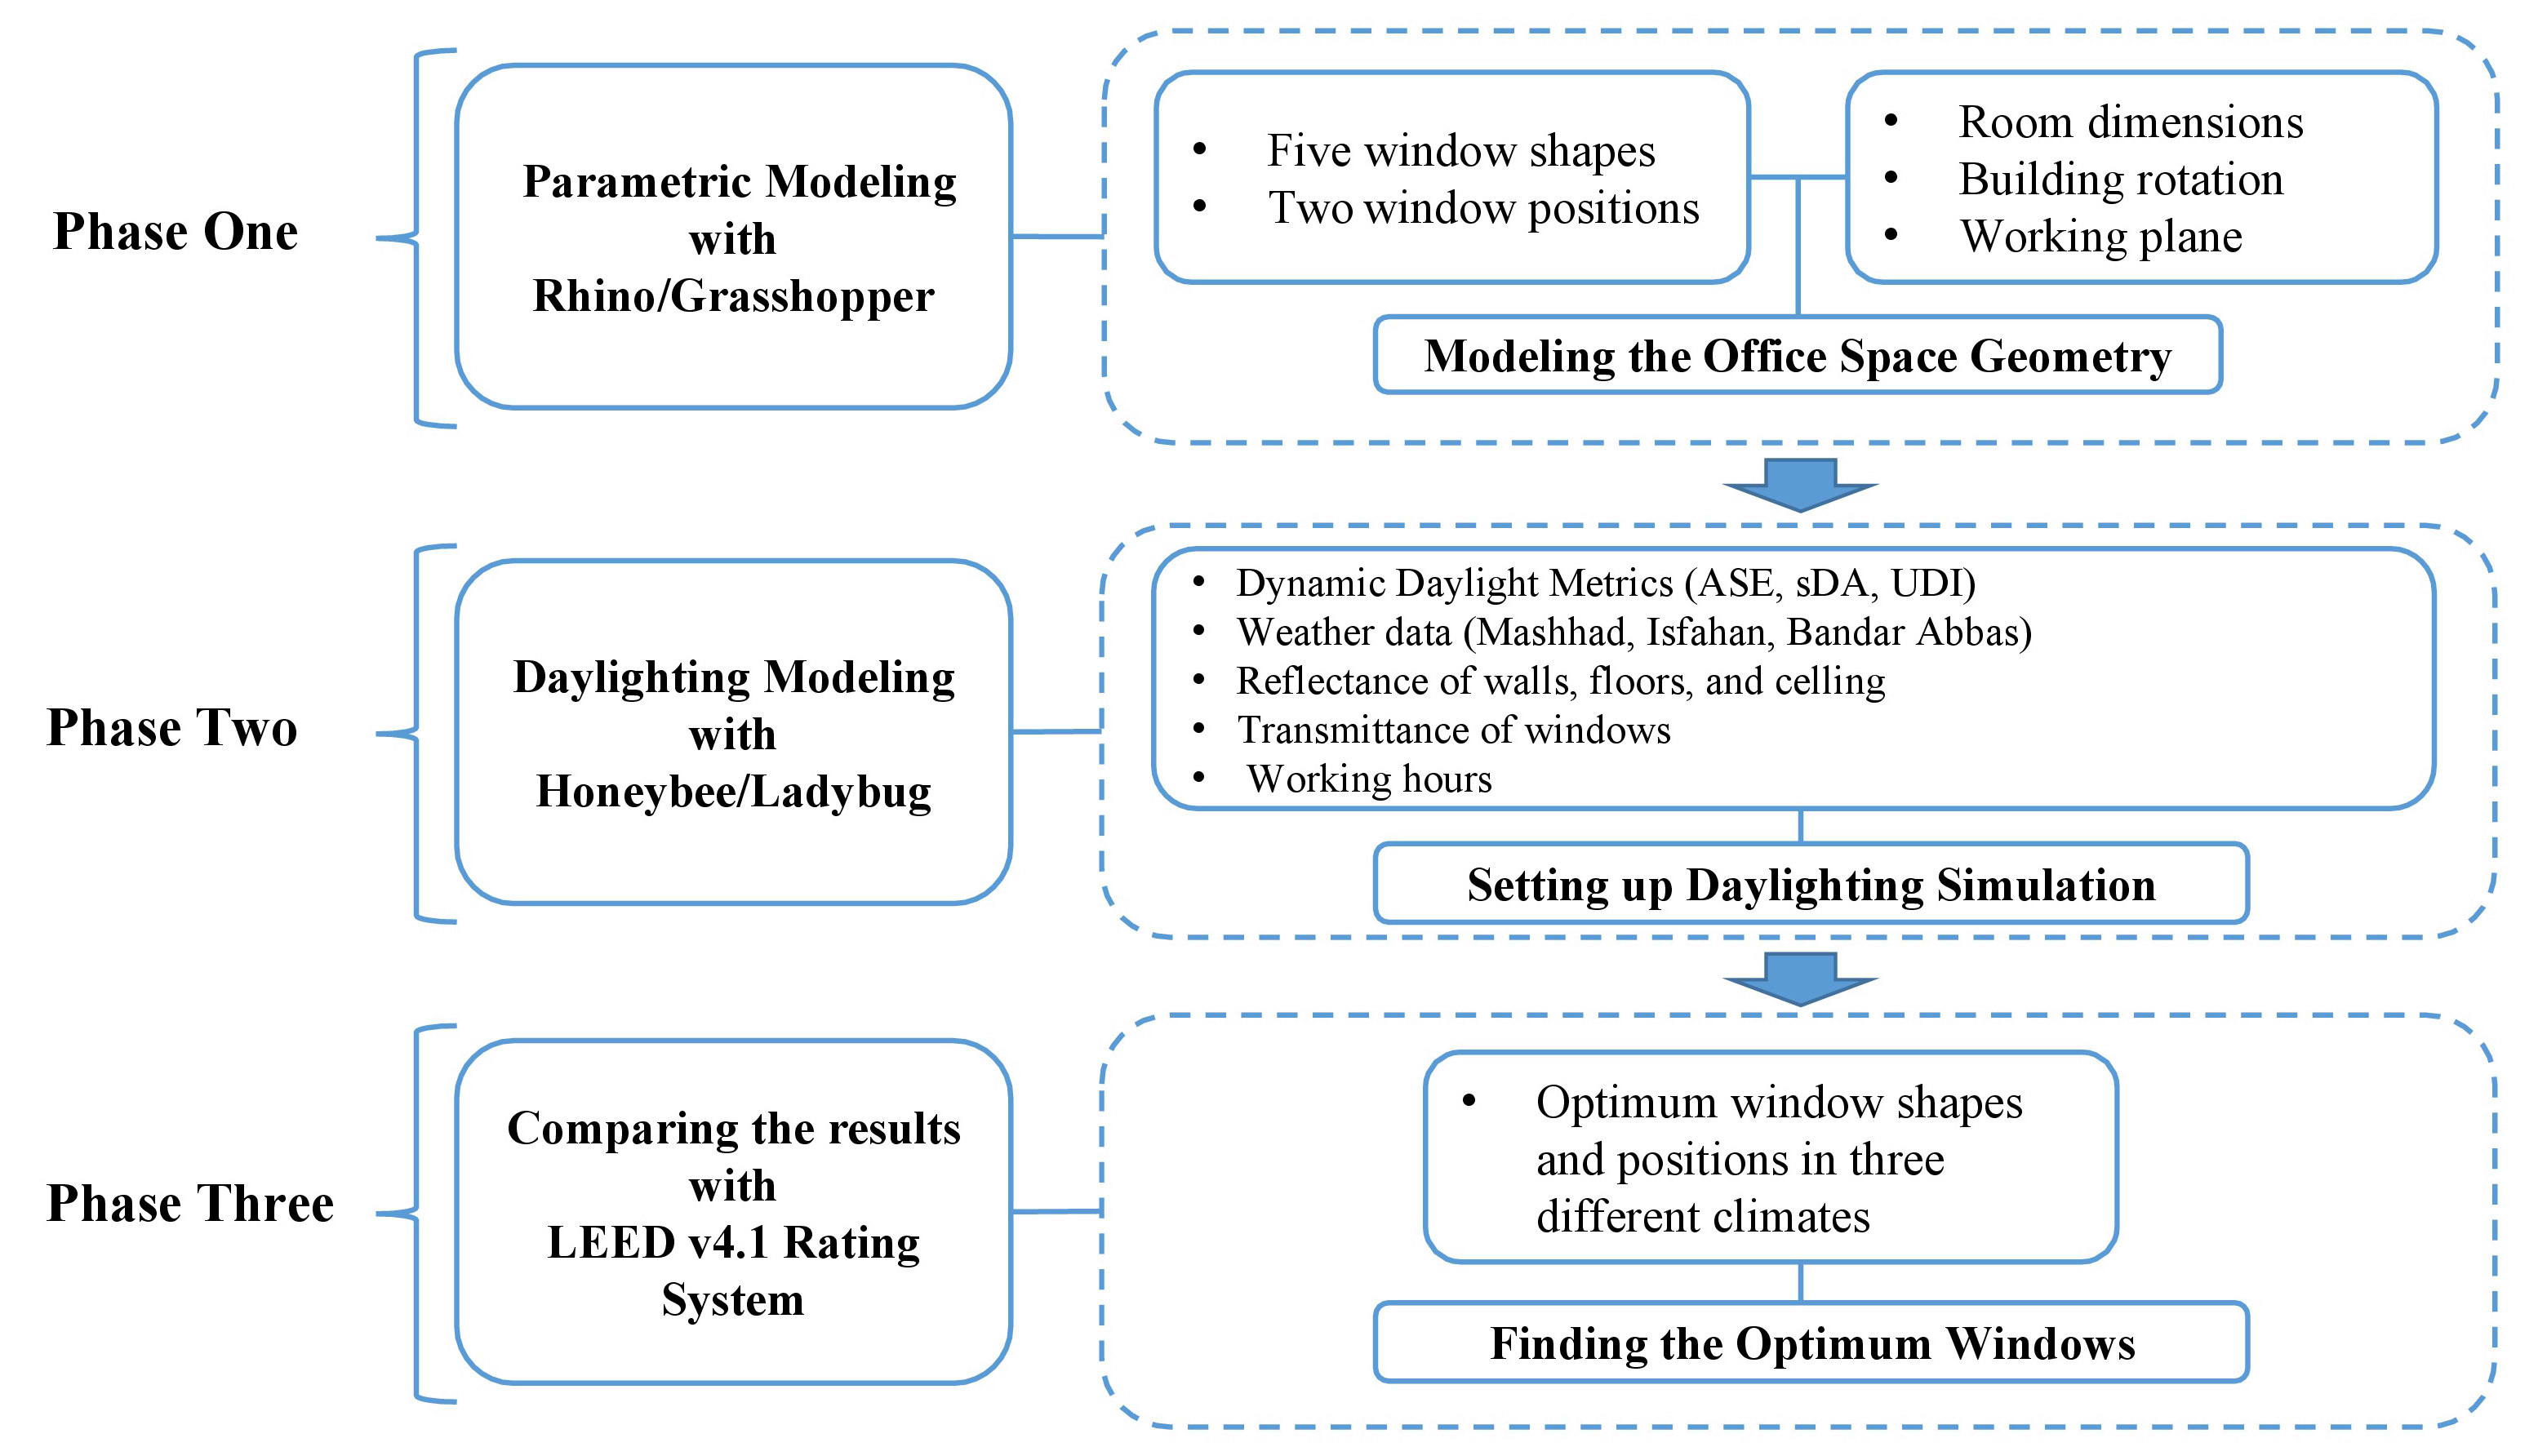
Fig. 1. Methodology flowchart.
2.2. Window shapes and positions
In this research, office space is determined with different window shapes and positions. As demonstrated in Fig. 2, five windows with the most common shapes of current architecture were utilized, including square, combined, double vertical with almost the same shapes and sill height, similarly double square, and horizontal windows in two positions (central and upper on the wall). The recommended WFR of 1/8 (12.5%), or WWR of 33.3% is provided based on Code 4 of Iran's National Building Regulations [27].
Figure 2
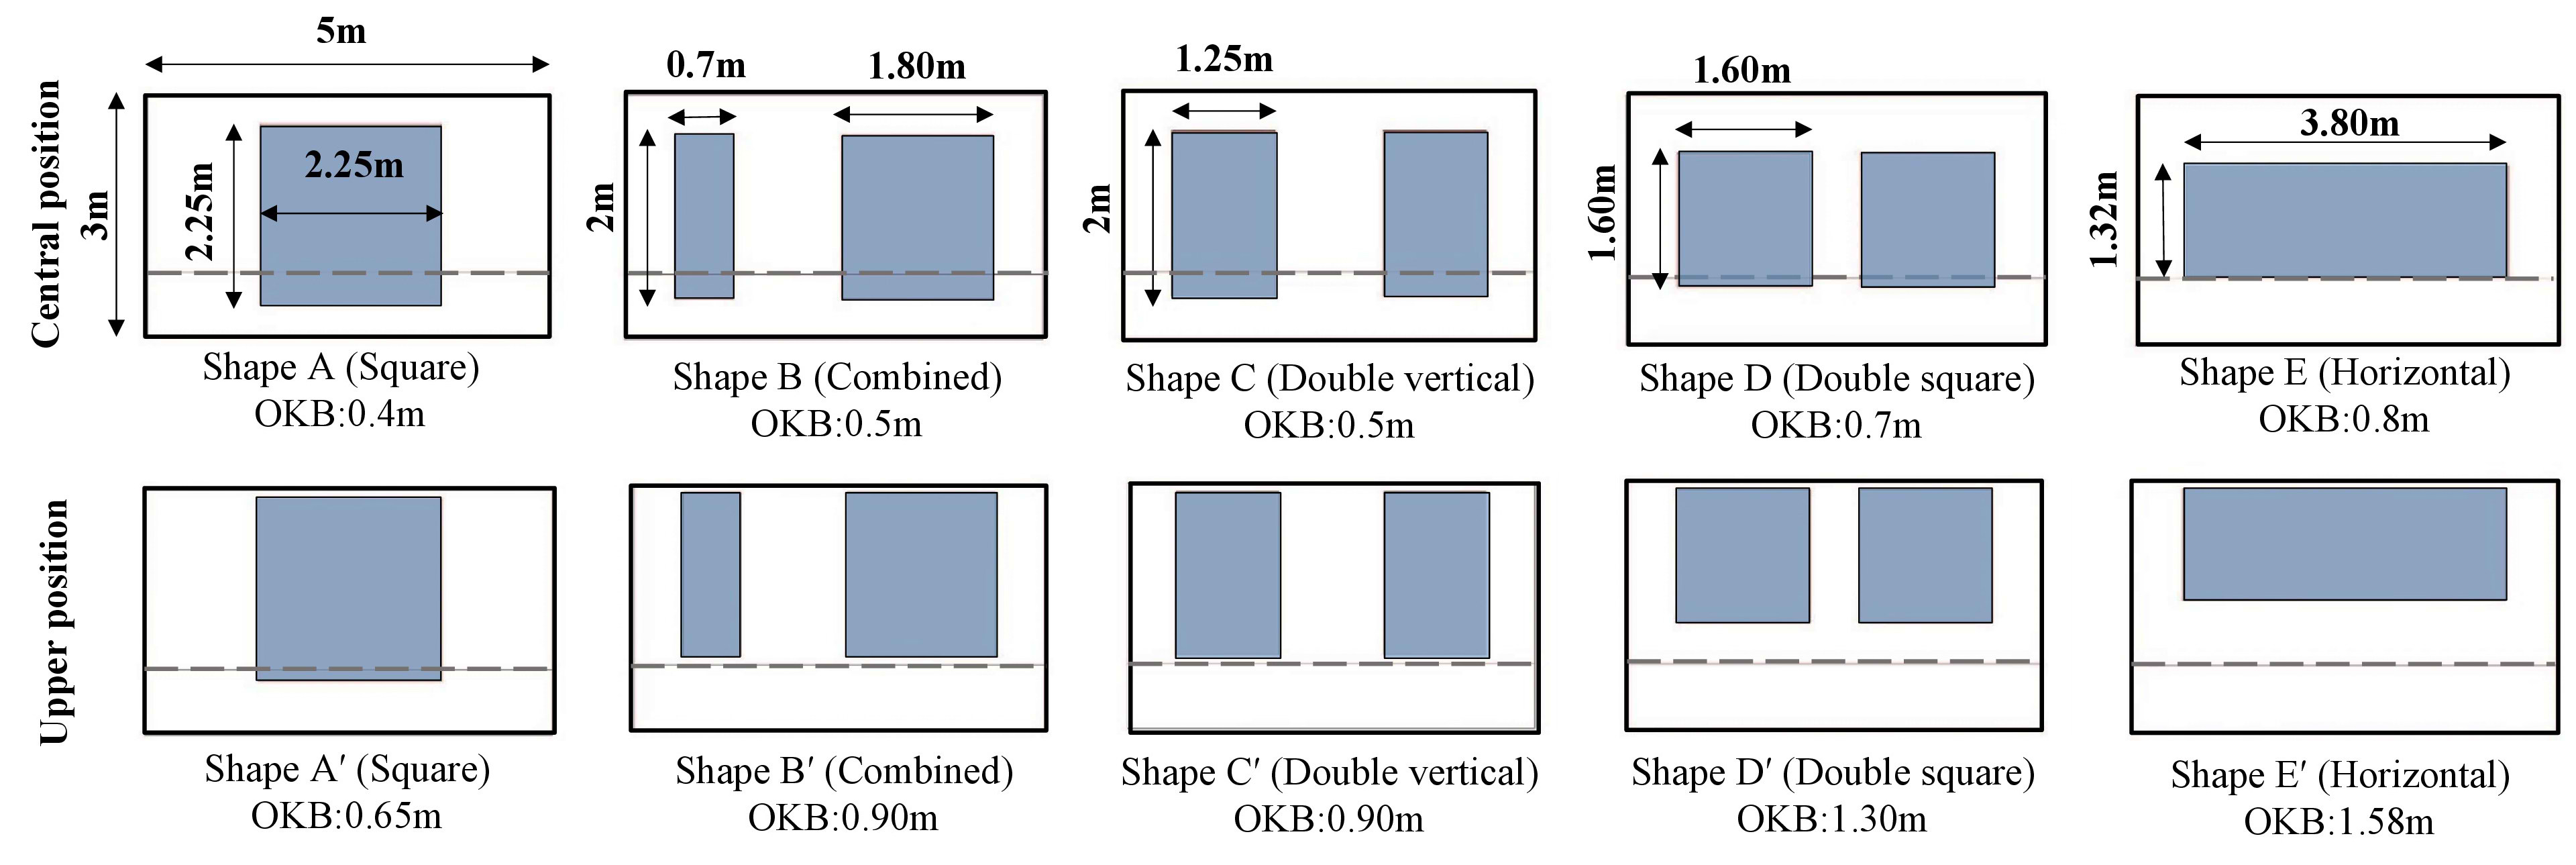
Fig. 2. Different shapes and positions of window.
2.3. Office space description
Daylighting affects the energy consumption, visual comfort of a work environment, productivity, and employee satisfaction, especially in office spaces [28]. In this study, a typical office space is chosen with the most common shapes and positions of the window to analyze daylight. A virtual office room measuring 5.0m wide×8m deep×3m high is modeled. Building surroundings have not been considered in simulations. The windows are located on the southern-facing side. The surface reflectance values are determined based on the European Standard EN 12464-1:2011 [29]. Moreover, working hours are considered when the zone is occupied from 8 AM to 6 PM. Table 2 and Fig. 3 present the characteristics of the case study.
Figure 3
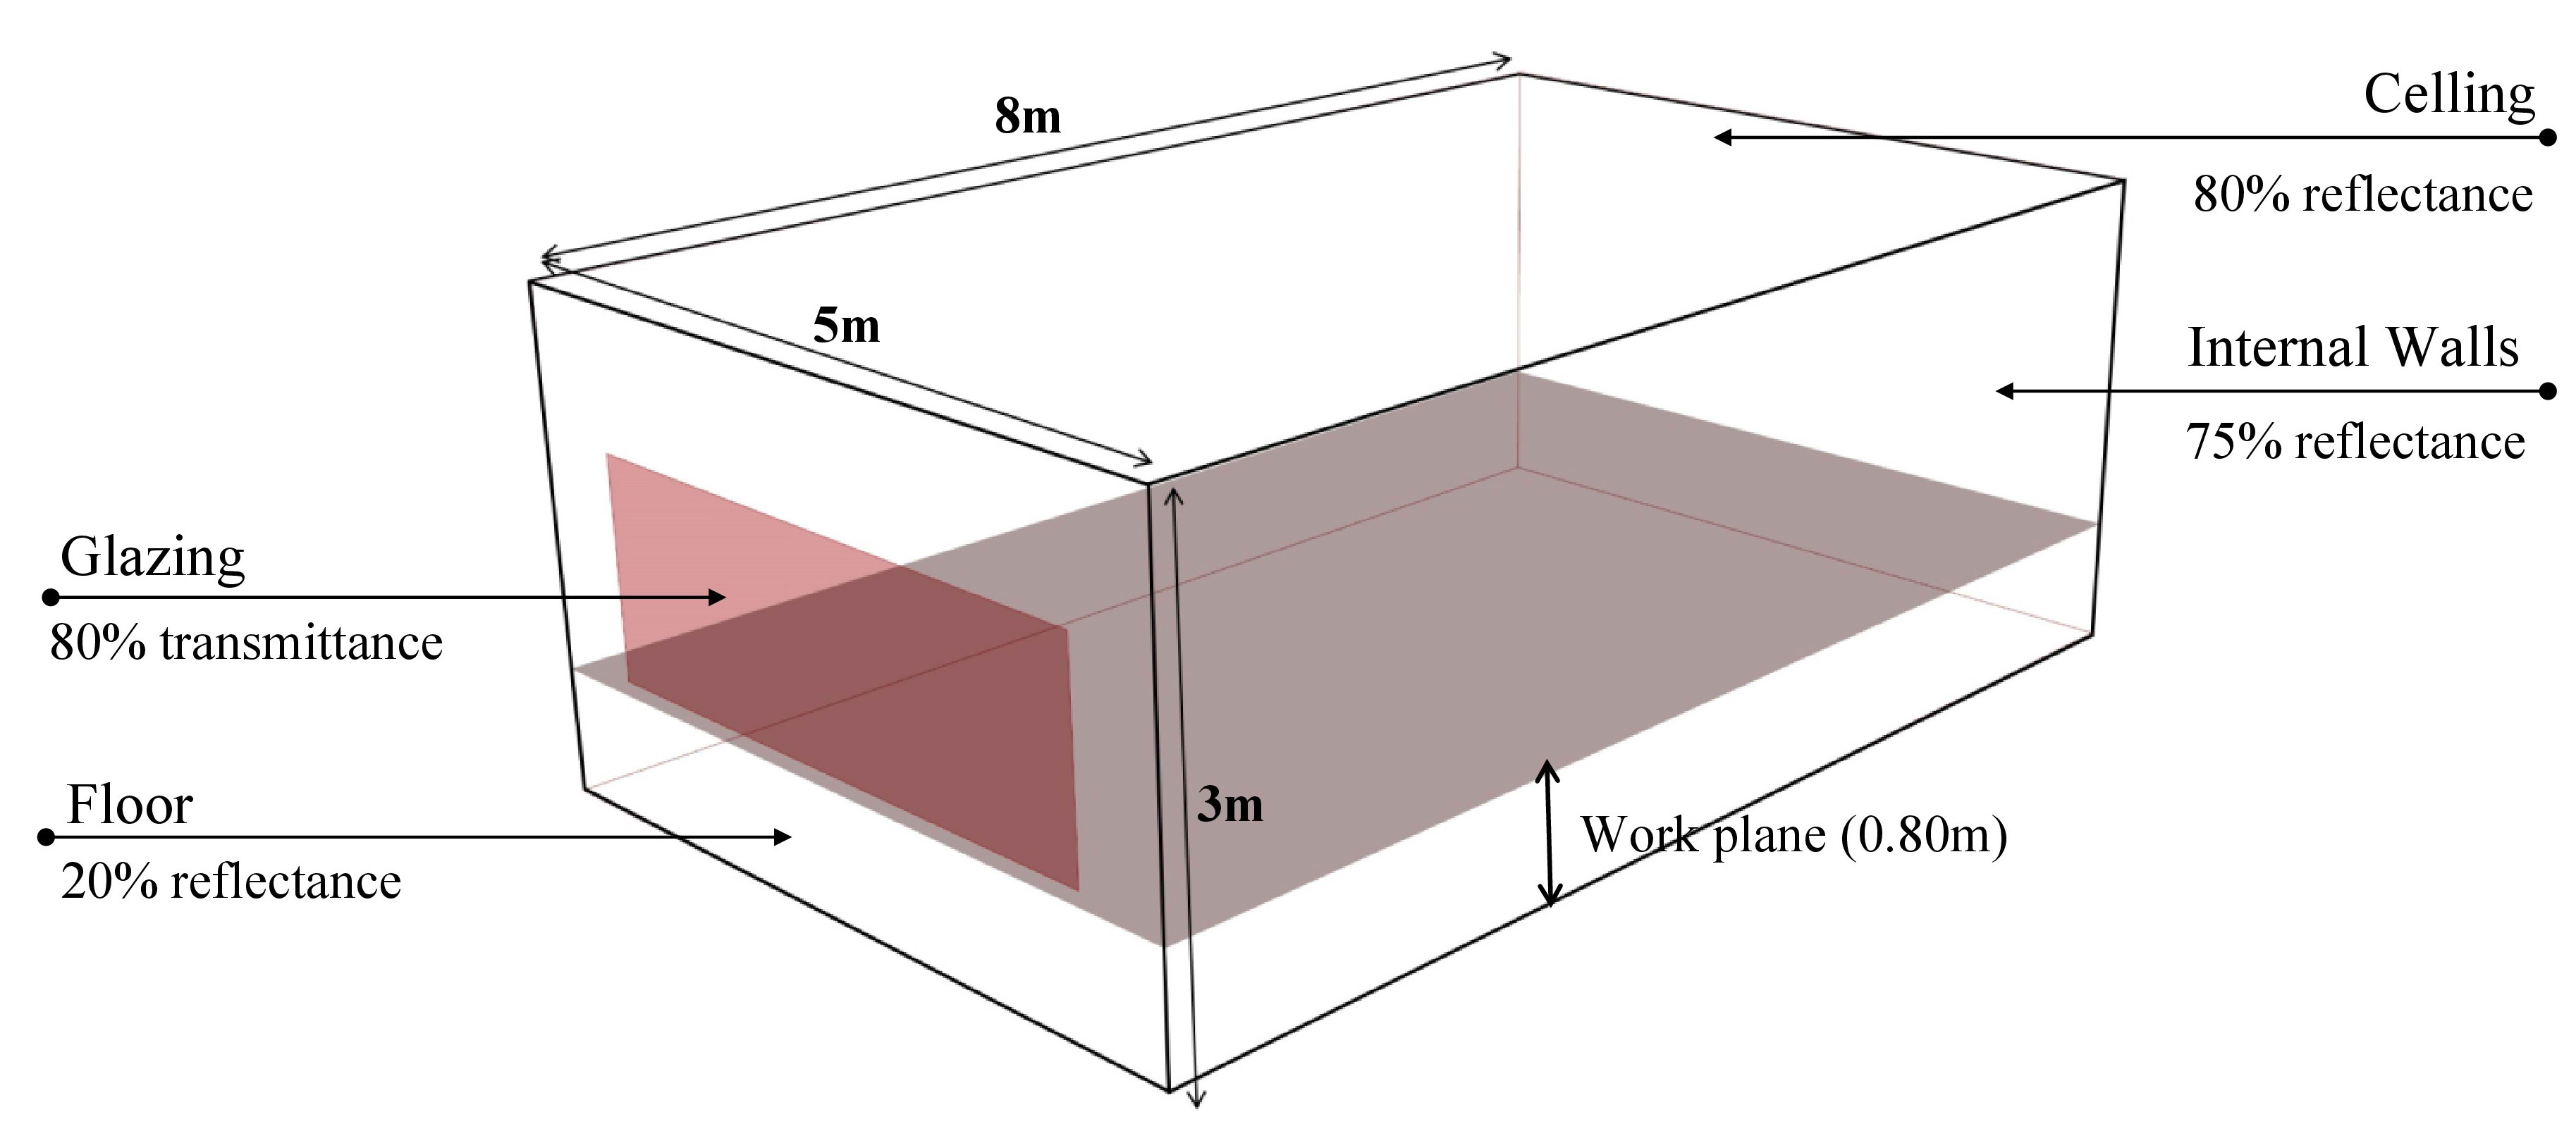
Fig. 3. Characteristics of the case study.
2.4. Location and climate data
The study is conducted considering three different climates based on the Köppen climate classification in the arid and semi-arid climates of Iran (BSk, BWk, and BWh). Three selected locations include Mashhad (36° 18' 38.5164'' N, 59° 35' 58.0452'' E), Isfahan (32° 39' 40.8348'' N, 51° 40' 49.3464'' E), and Bandar Abbas (27° 11' 1.3488'' N, 56° 16' 38.8092'' E) in the northeast, center, and south part of Iran, respectively. Considering that daylighting produces adequate internal lighting through the utilization of direct and diffuse radiation, in this section, these rates are obtained in three climate zones utilizing energyplus weather file (EPW) import data in the ladybug plugin. The results indicate that radiation is dominant in Mashhad with a maximum value of 240000 Wh/m2, while Bandar Abbas has prevailing diffuse radiation at the rate of a maximum of 144000 Wh/m2. Furthermore, direct and diffuse radiation are nearly the same in Isfahan with a maximum of 120000 Wh/m2, as shown in Figs. 4 and 5. This paper demonstrates that direct and diffuse radiation have an impact on the rates of dynamic daylight metrics.
Figure 4
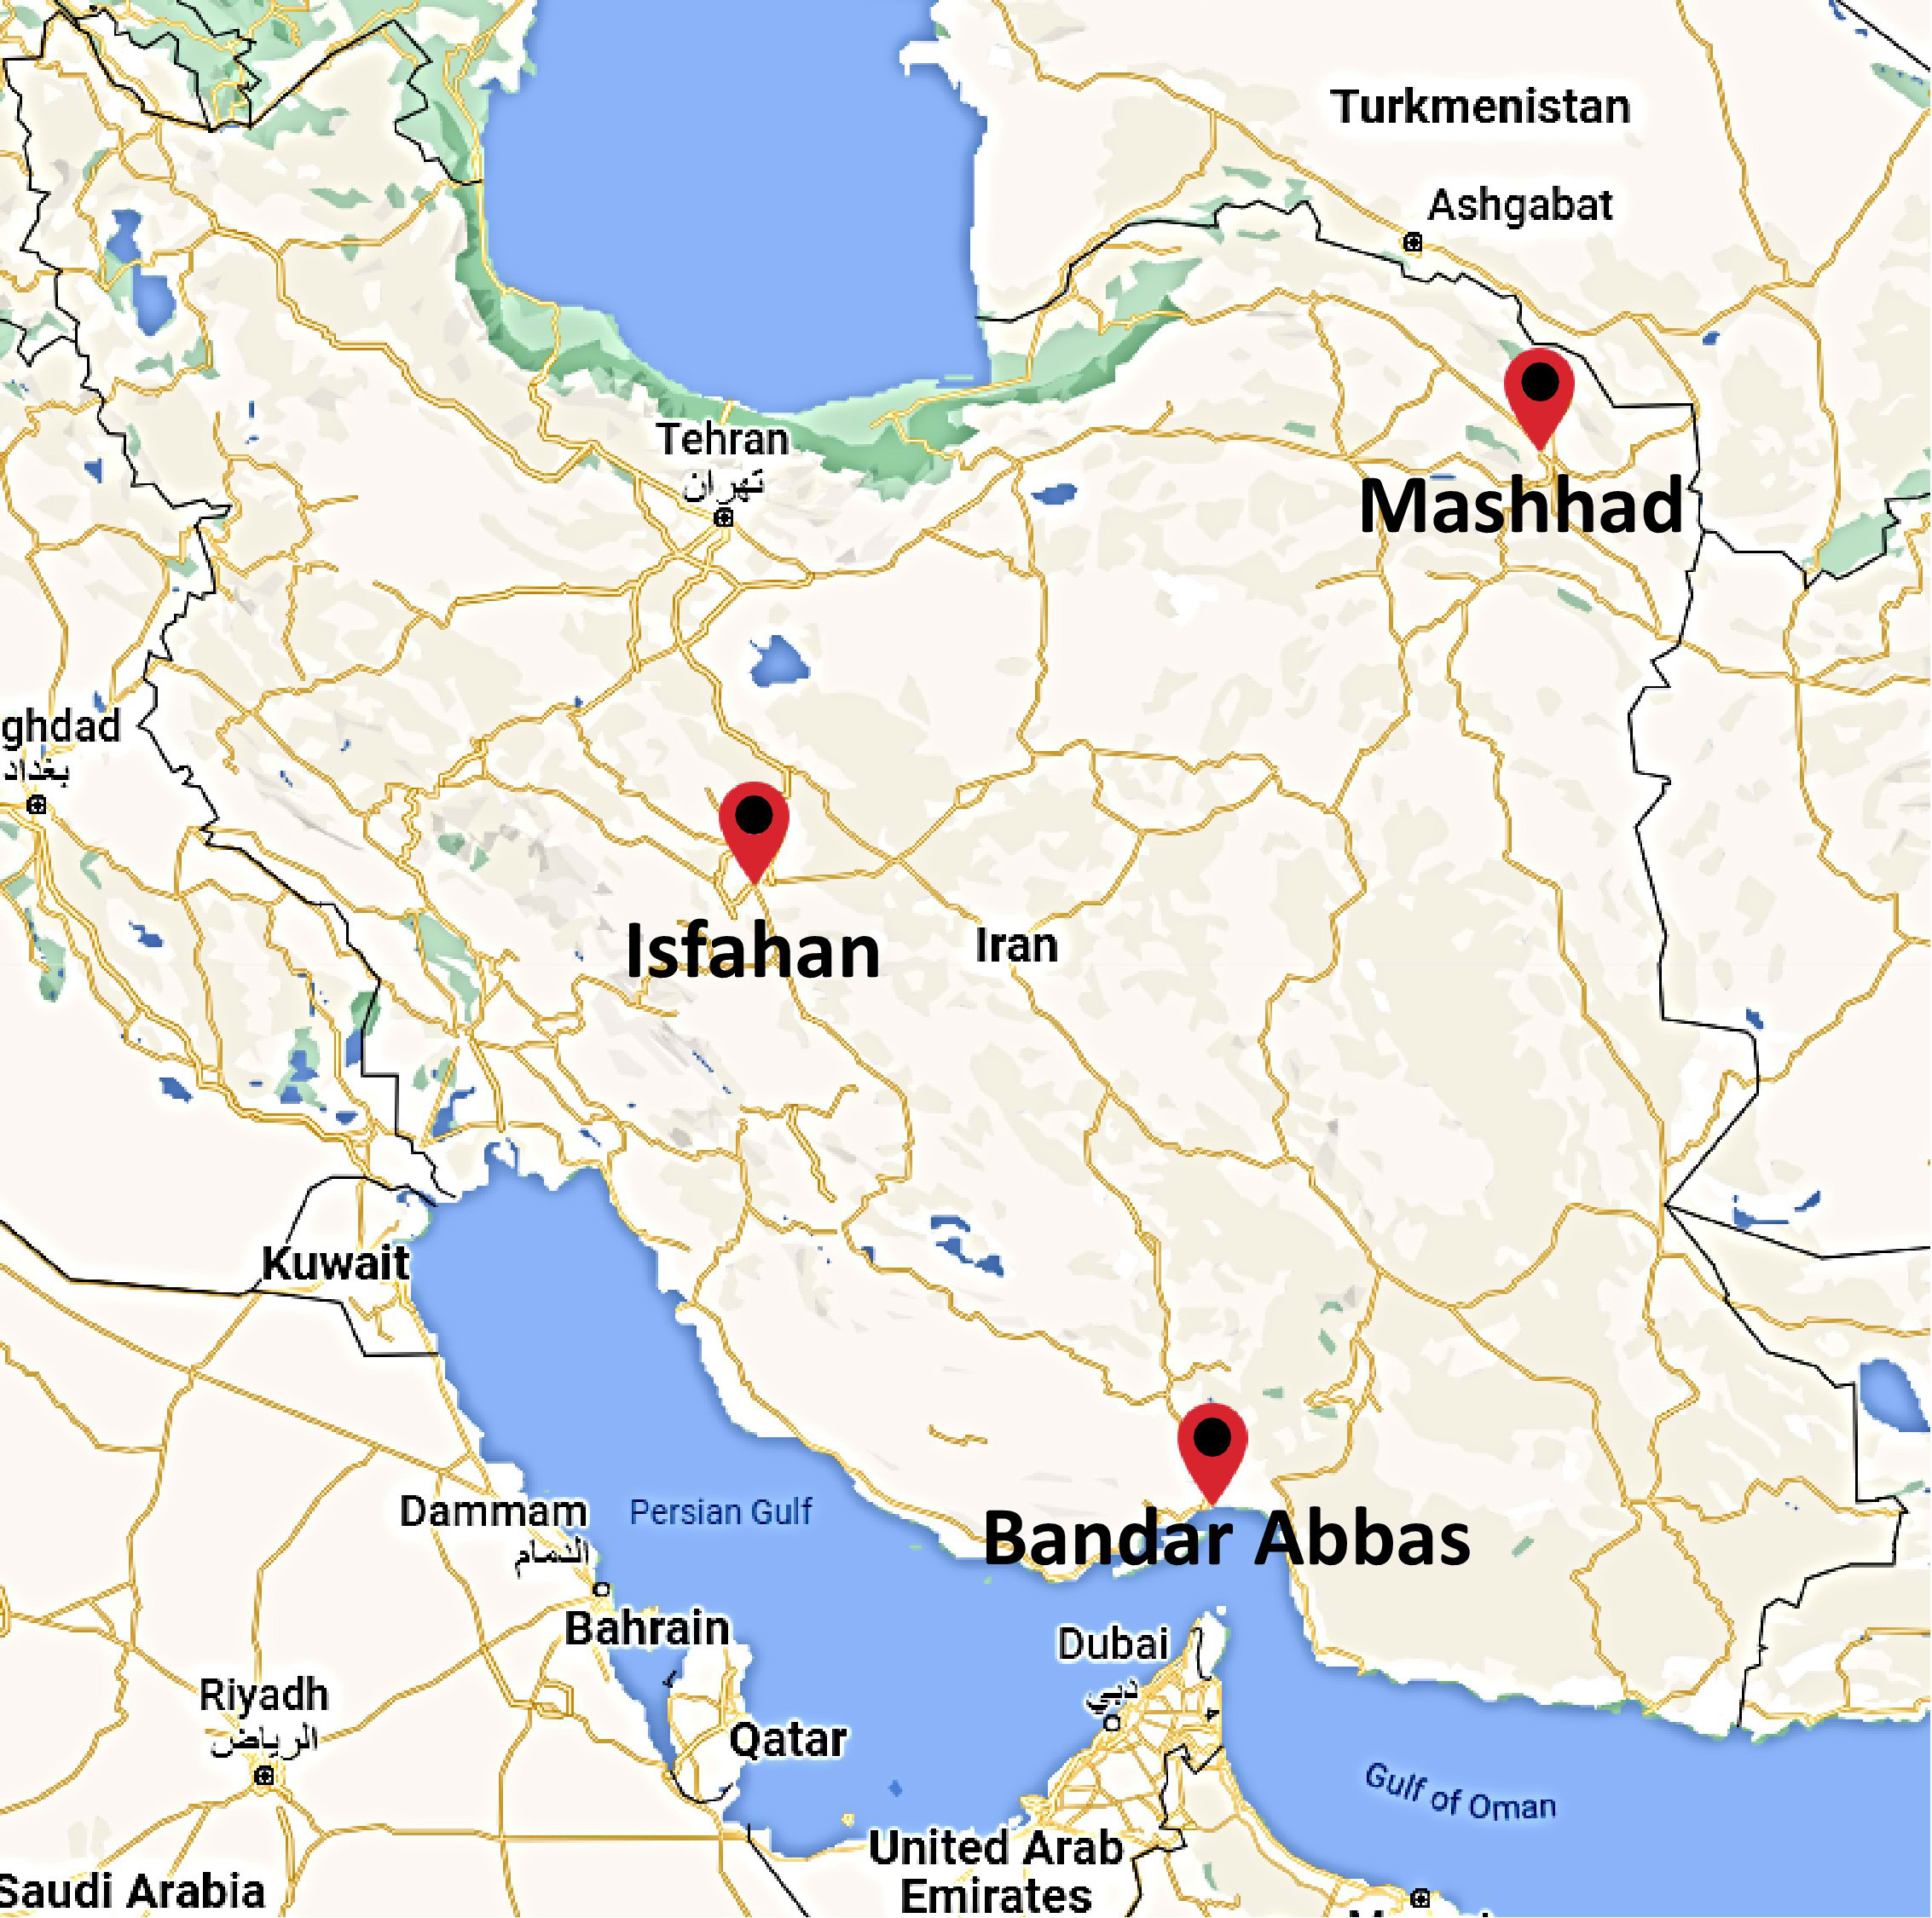
Fig. 4. Three different cities of Iran.
Figure 5
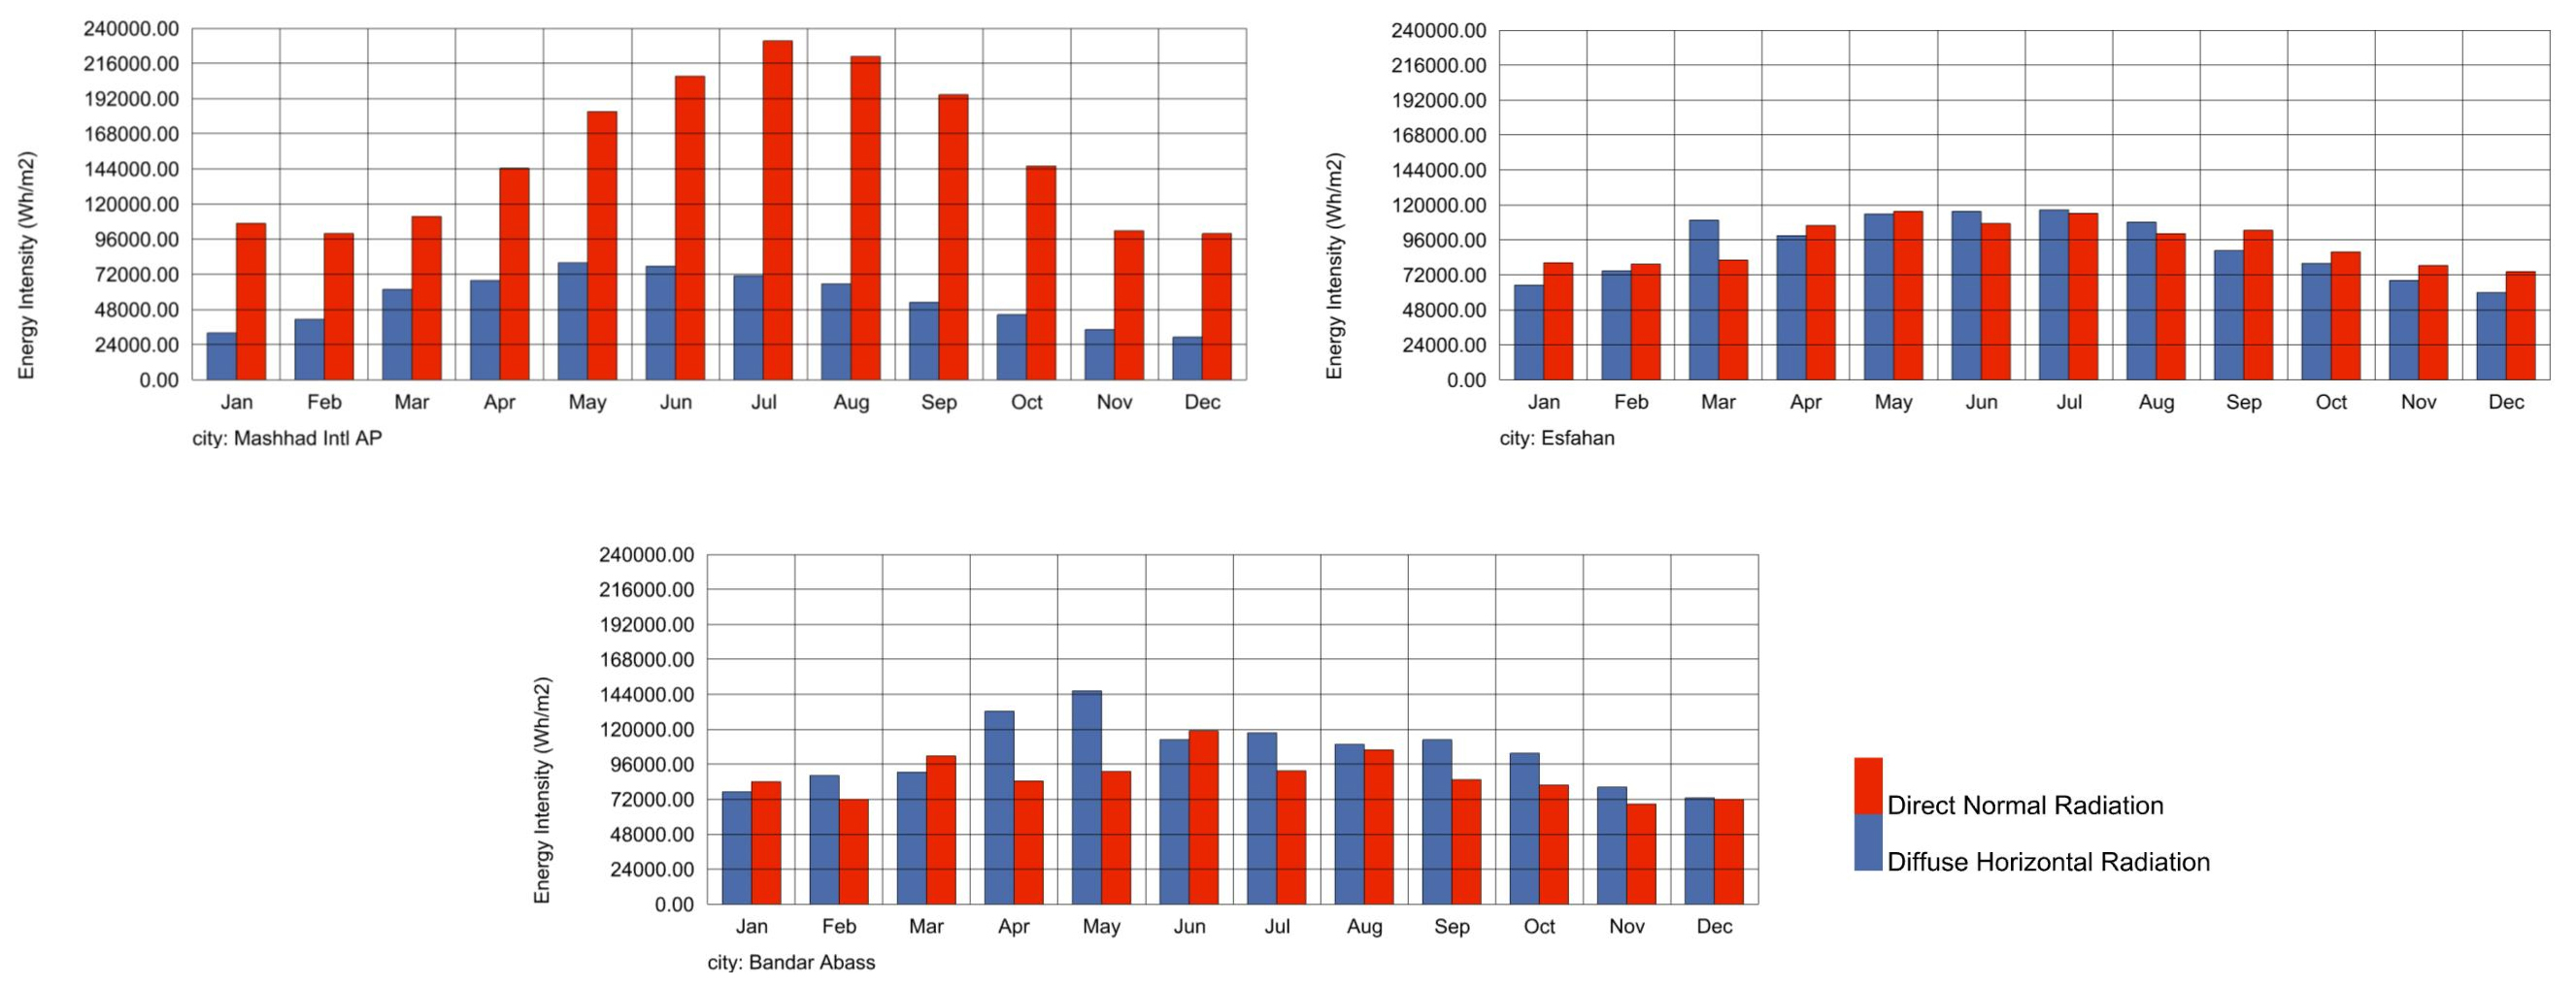
Fig. 5. Direct and diffuse radiation in three climates of Iran.
2.5. Calculation metrics
The main benefit of dynamic daylight performance metrics over static metrics is that they must be considered over time. So that, it incorporates daily and seasonal variations during a whole year [30,31]. Accordingly, an annual climate file for the building containing hourly data on direct and diffuse irradiance must be loaded to simulate dynamic daylight [30]. The purpose of daylight credits is to encourage and identify designs that provide the proper levels of daylight for building occupants [32]. Verifying window designs comply with LEED can lead to particular needed daylight values with the minimum thermal loads [33]. The LEED energy rating system considered climate-based daylight modeling (CBDM) metrics as part of its daylighting assessment. Designers can assess intricate, long-term luminous environment dynamics using the CBDM metrics [34].
The most common dynamic daylight metrics used in the LEED are sDA and ASE, both of which can help architects make good design decisions [13]. The two metrics are used in common workplace environments with similar visual tasks, such as open offices, classrooms, meeting rooms, multi-purpose rooms, and libraries or lobbies [35]. Occupied space must meet the requirements of ASE1000, 250 hr ≤ 10% to obtain daylight credits for the LEED. However, for values with ASE1000,250 greater than 10% should describe glare reduction solutions [36]. Moreover, increasing the UDI in interior spaces has been a priority for architects, building engineers, and designers [37]. Therefore, in this study, sDA, ASE, and UDI are applied to gain visual comfort. Table 3 presents the percentage of three dynamic daylight metrics combined with their points.
Table 3
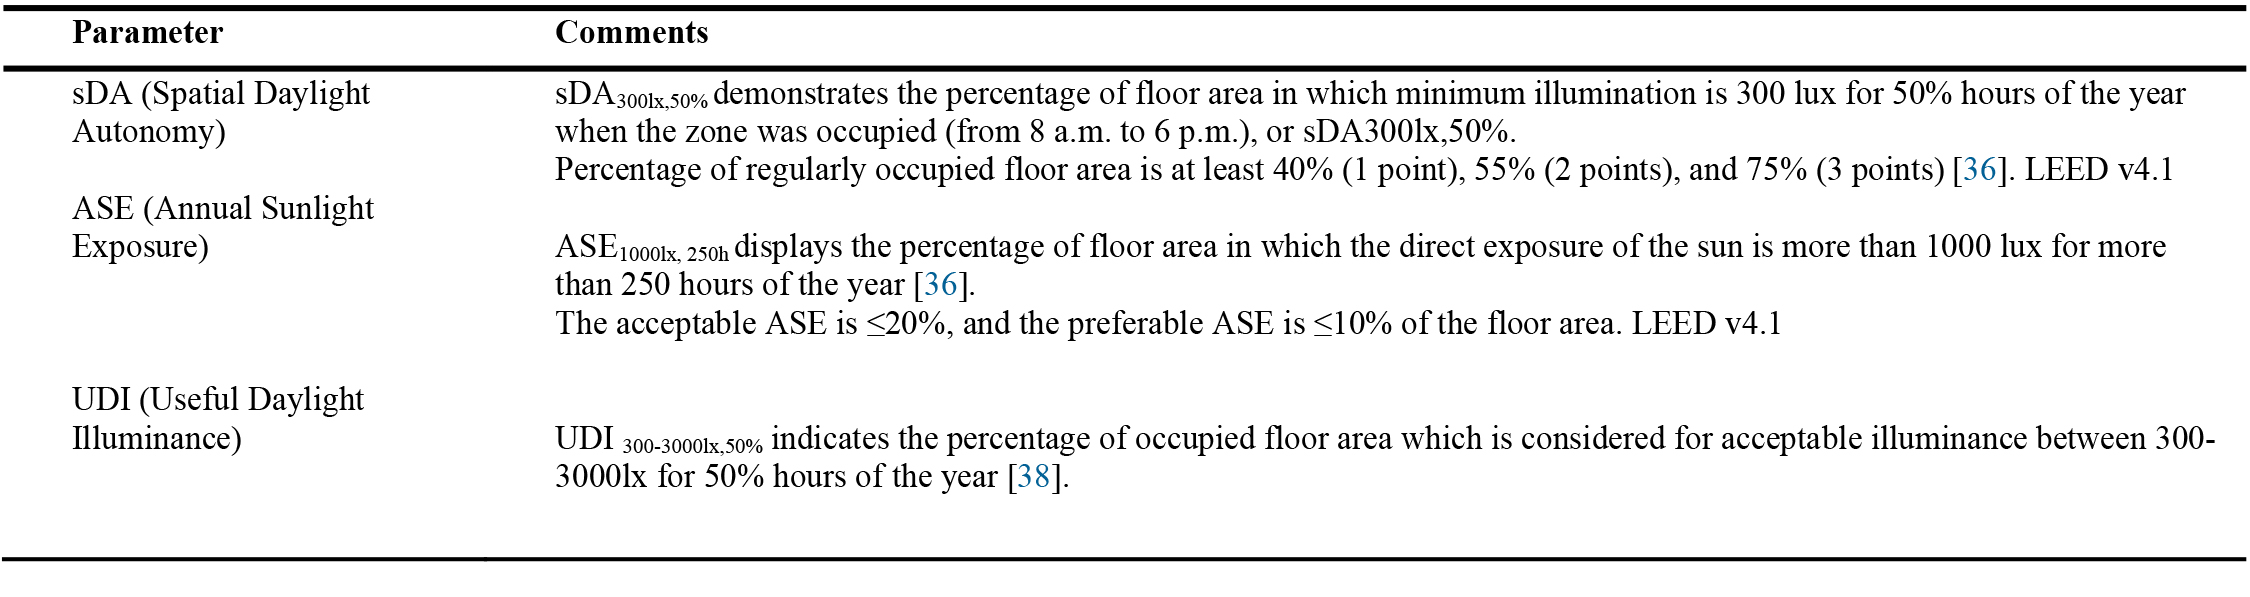
Table 3. Dynamic daylight metrics and thresholds.
The evaluation of daylight performance by utilizing advanced daylight simulation software should be considered for the building in the early stages of the design process [3]. Thus, the Ladybug and Honeybee plugins for Grasshopper 3D, a graphical algorithm plug-in for Rhinoceros, have been used to analyze dynamic daylight performance.
3. Results and discussion
As can be observed in Tables 4 to 9, the annual illuminance and direct sunlight distribution map are presented for each metric in three cities including Mashhad (BSk), Isfahan (BWk), and Bandar Abbas (BWh). Based on ASE ≤ 20%, sDA ≥ 40% and UDI ≥ 55% of floor area, the red contour range indicates acceptable limits of dynamic daylight values.
Table 4
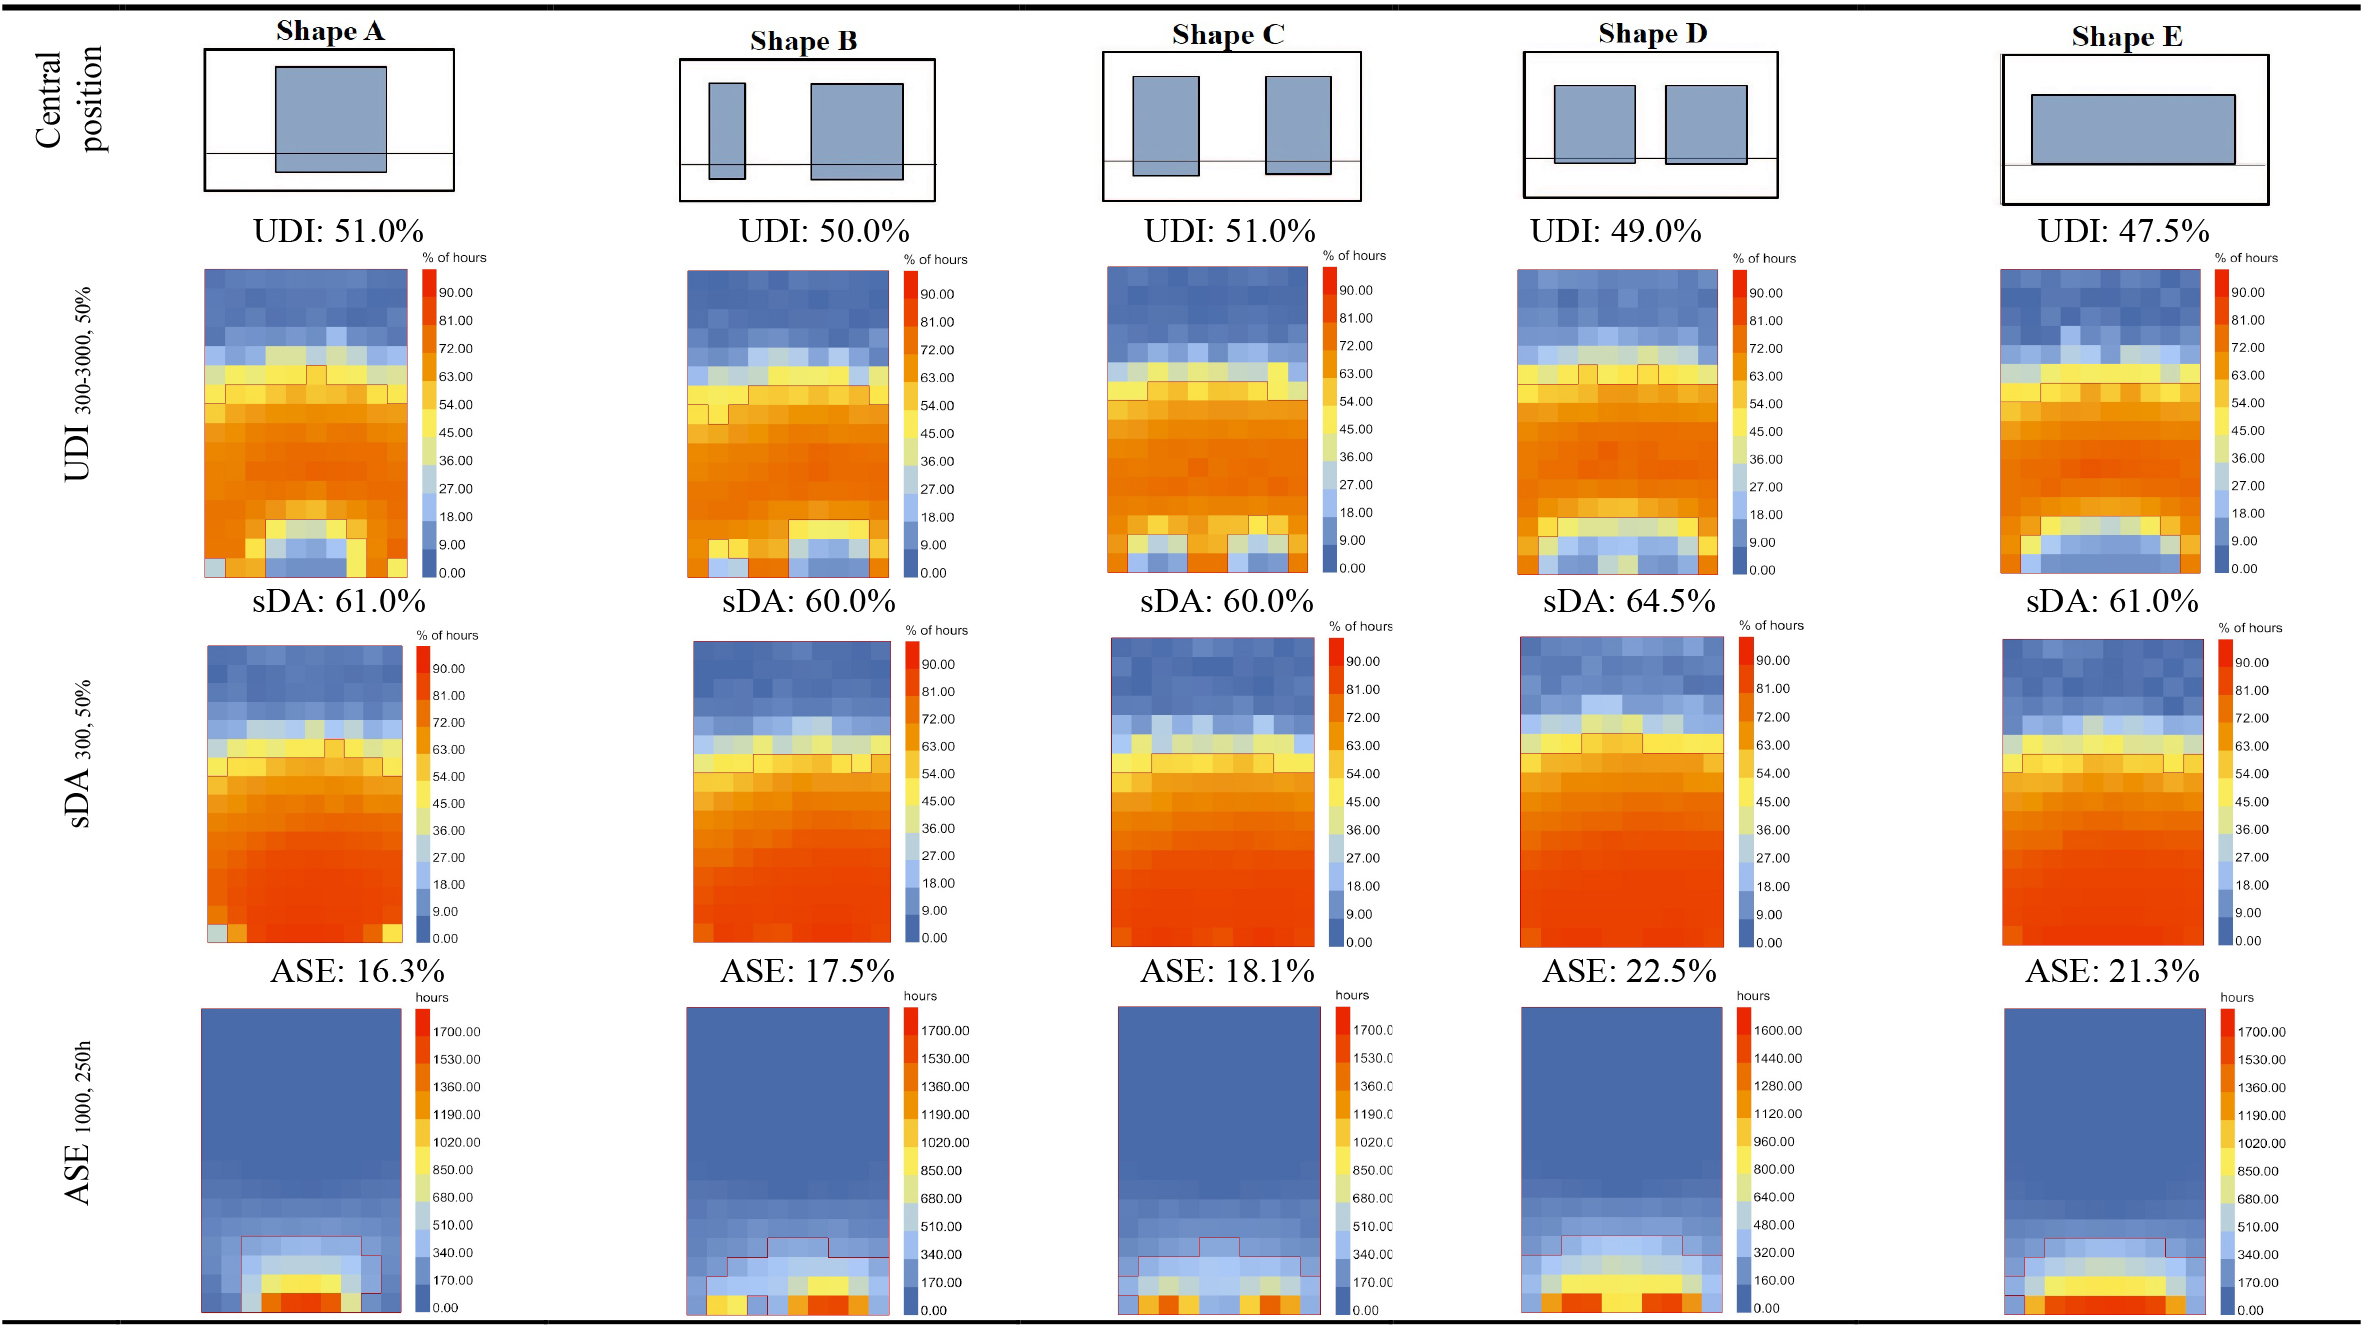
Table 4. Annual daylight metrics results for five window shapes in the central position in Mashhad with BSk climate.
Table 5

Table 5. Annual daylight metrics results for five window shapes in the upper position in Mashhad with BSk climate.
Table 6
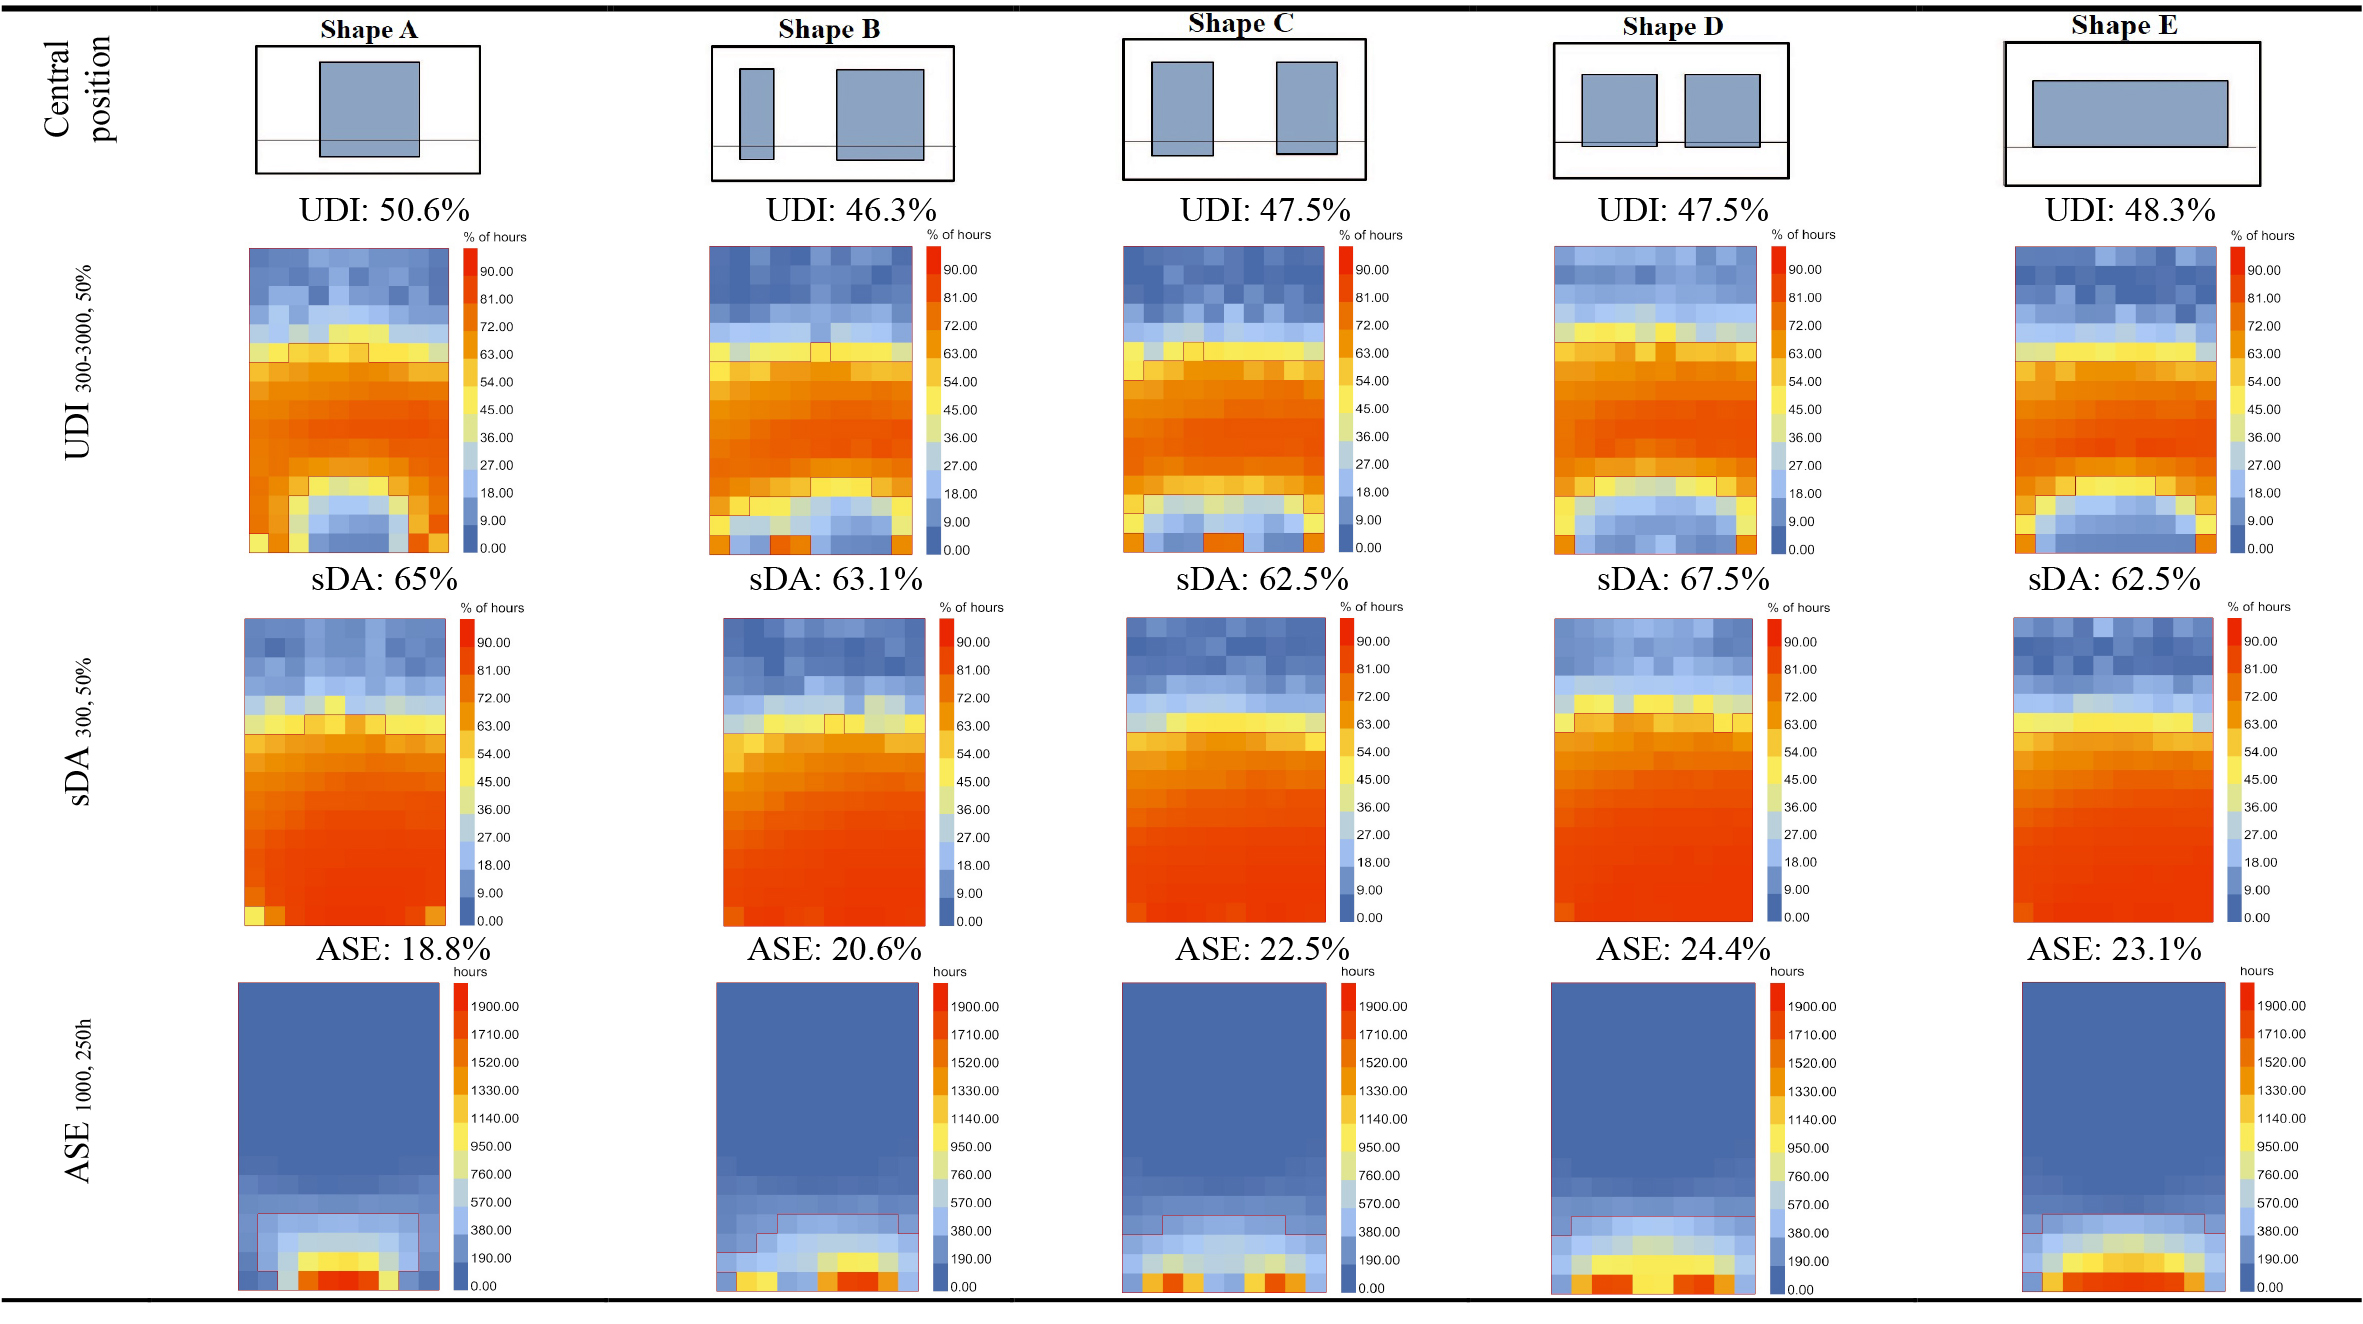
Table 6. Annual daylight metrics results for five window shapes in the central position in Isfahan with BWk climate.
Table 7
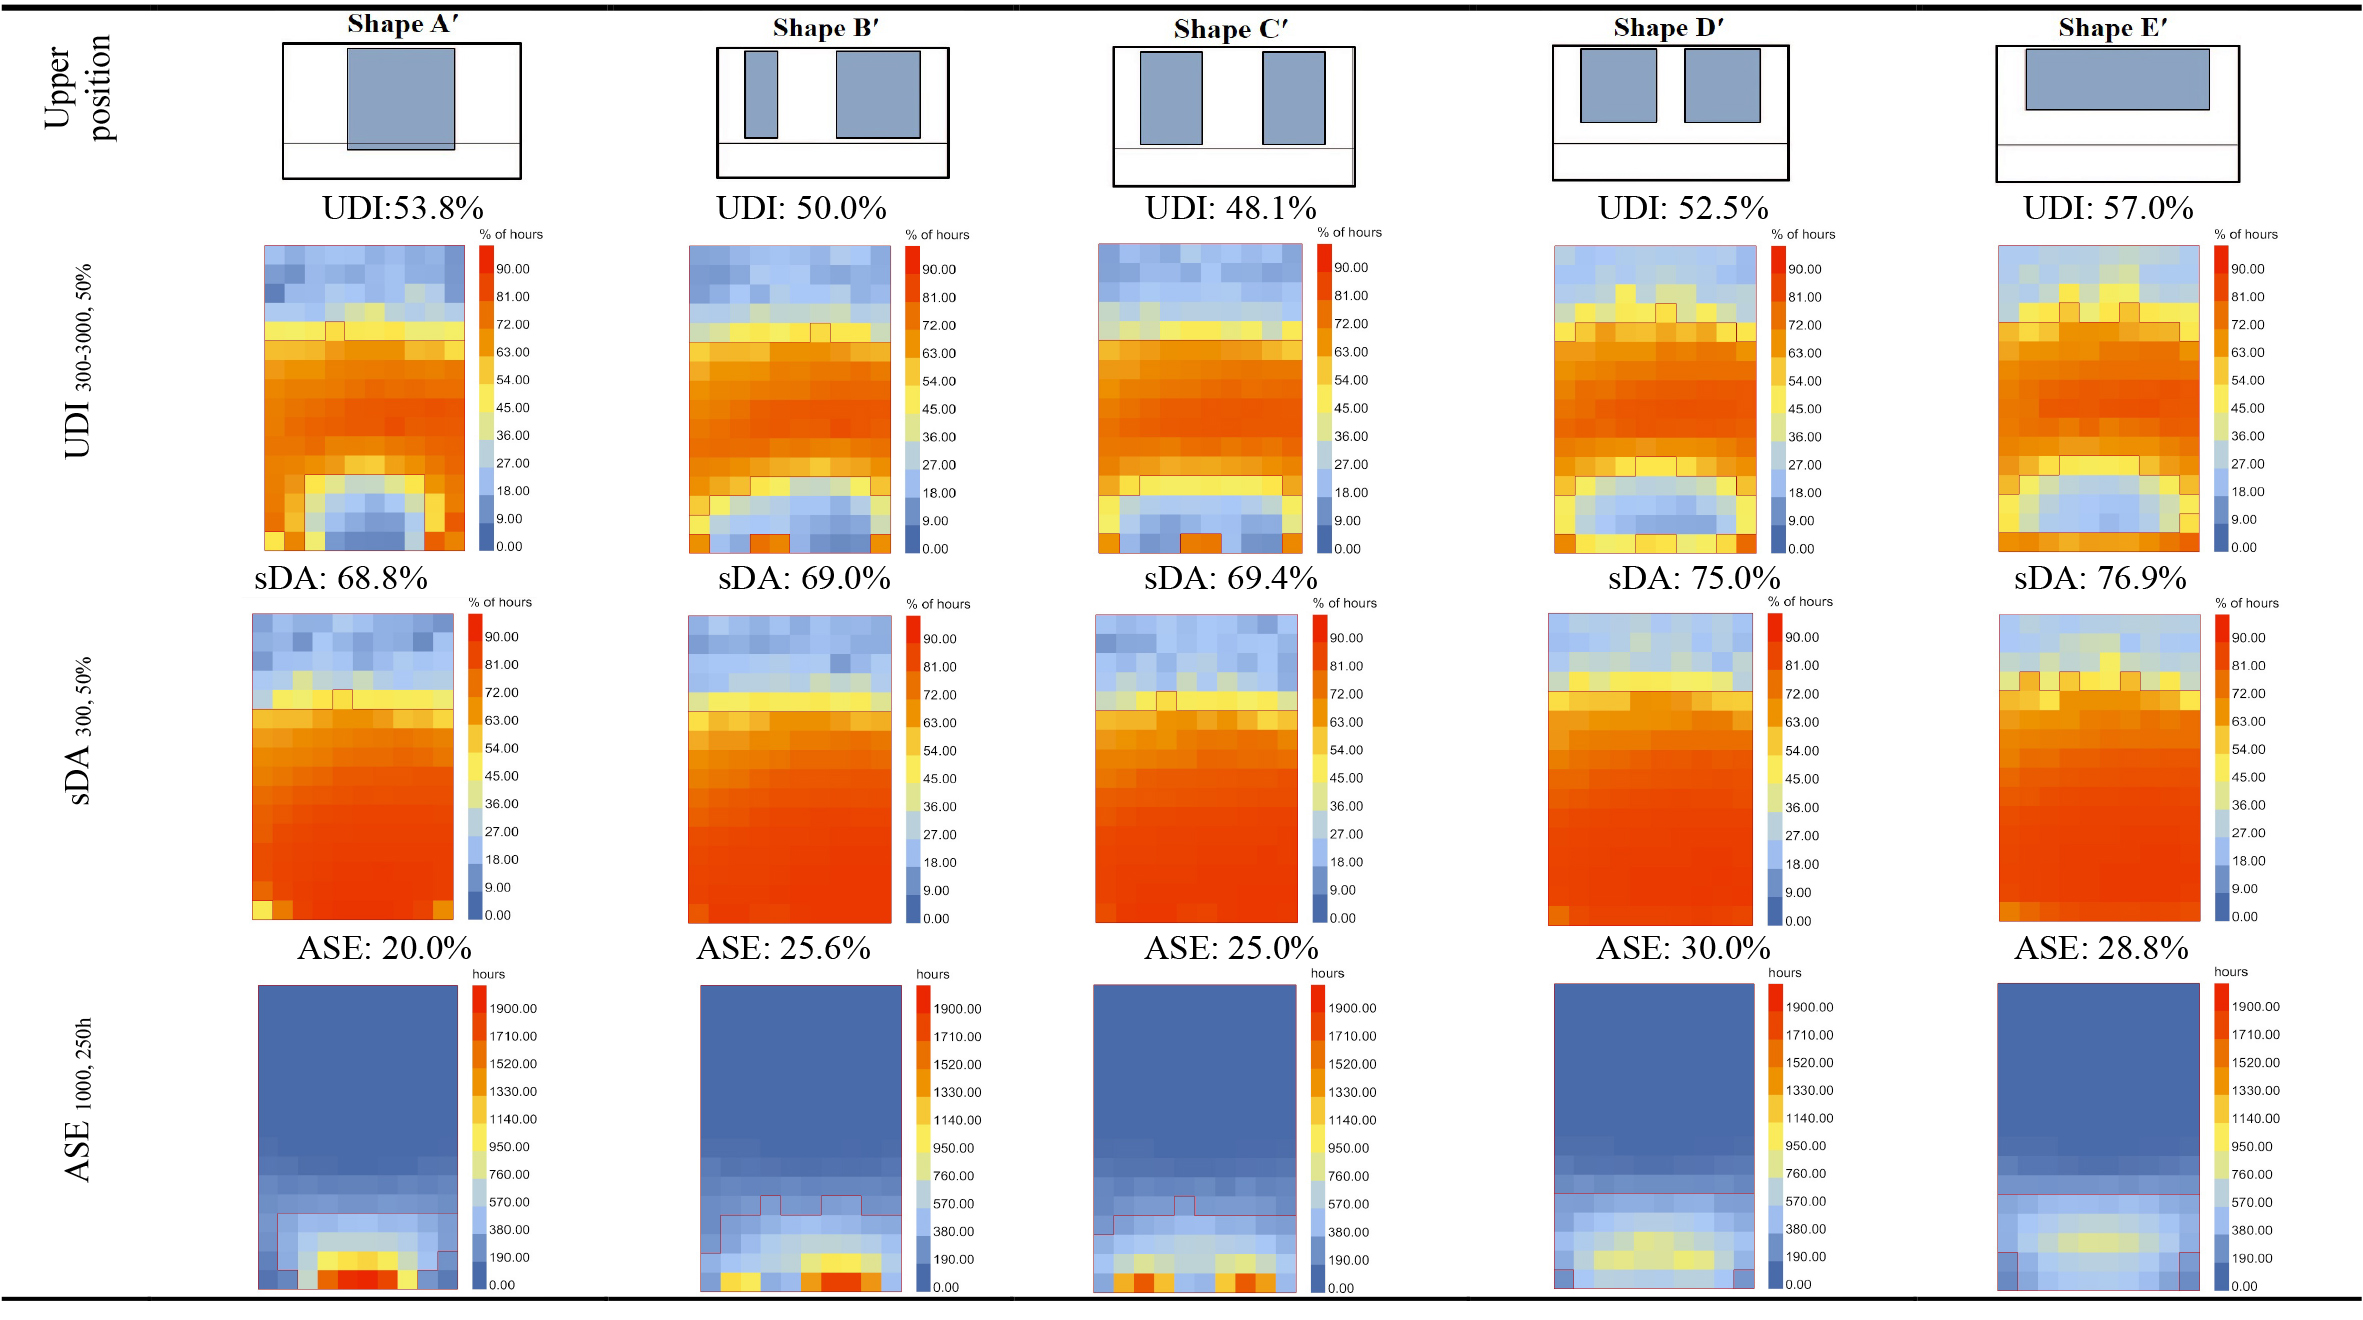
Table 7. Annual daylight metrics results for five window shapes in the upper position in Isfahan with BWk climate.
Table 8
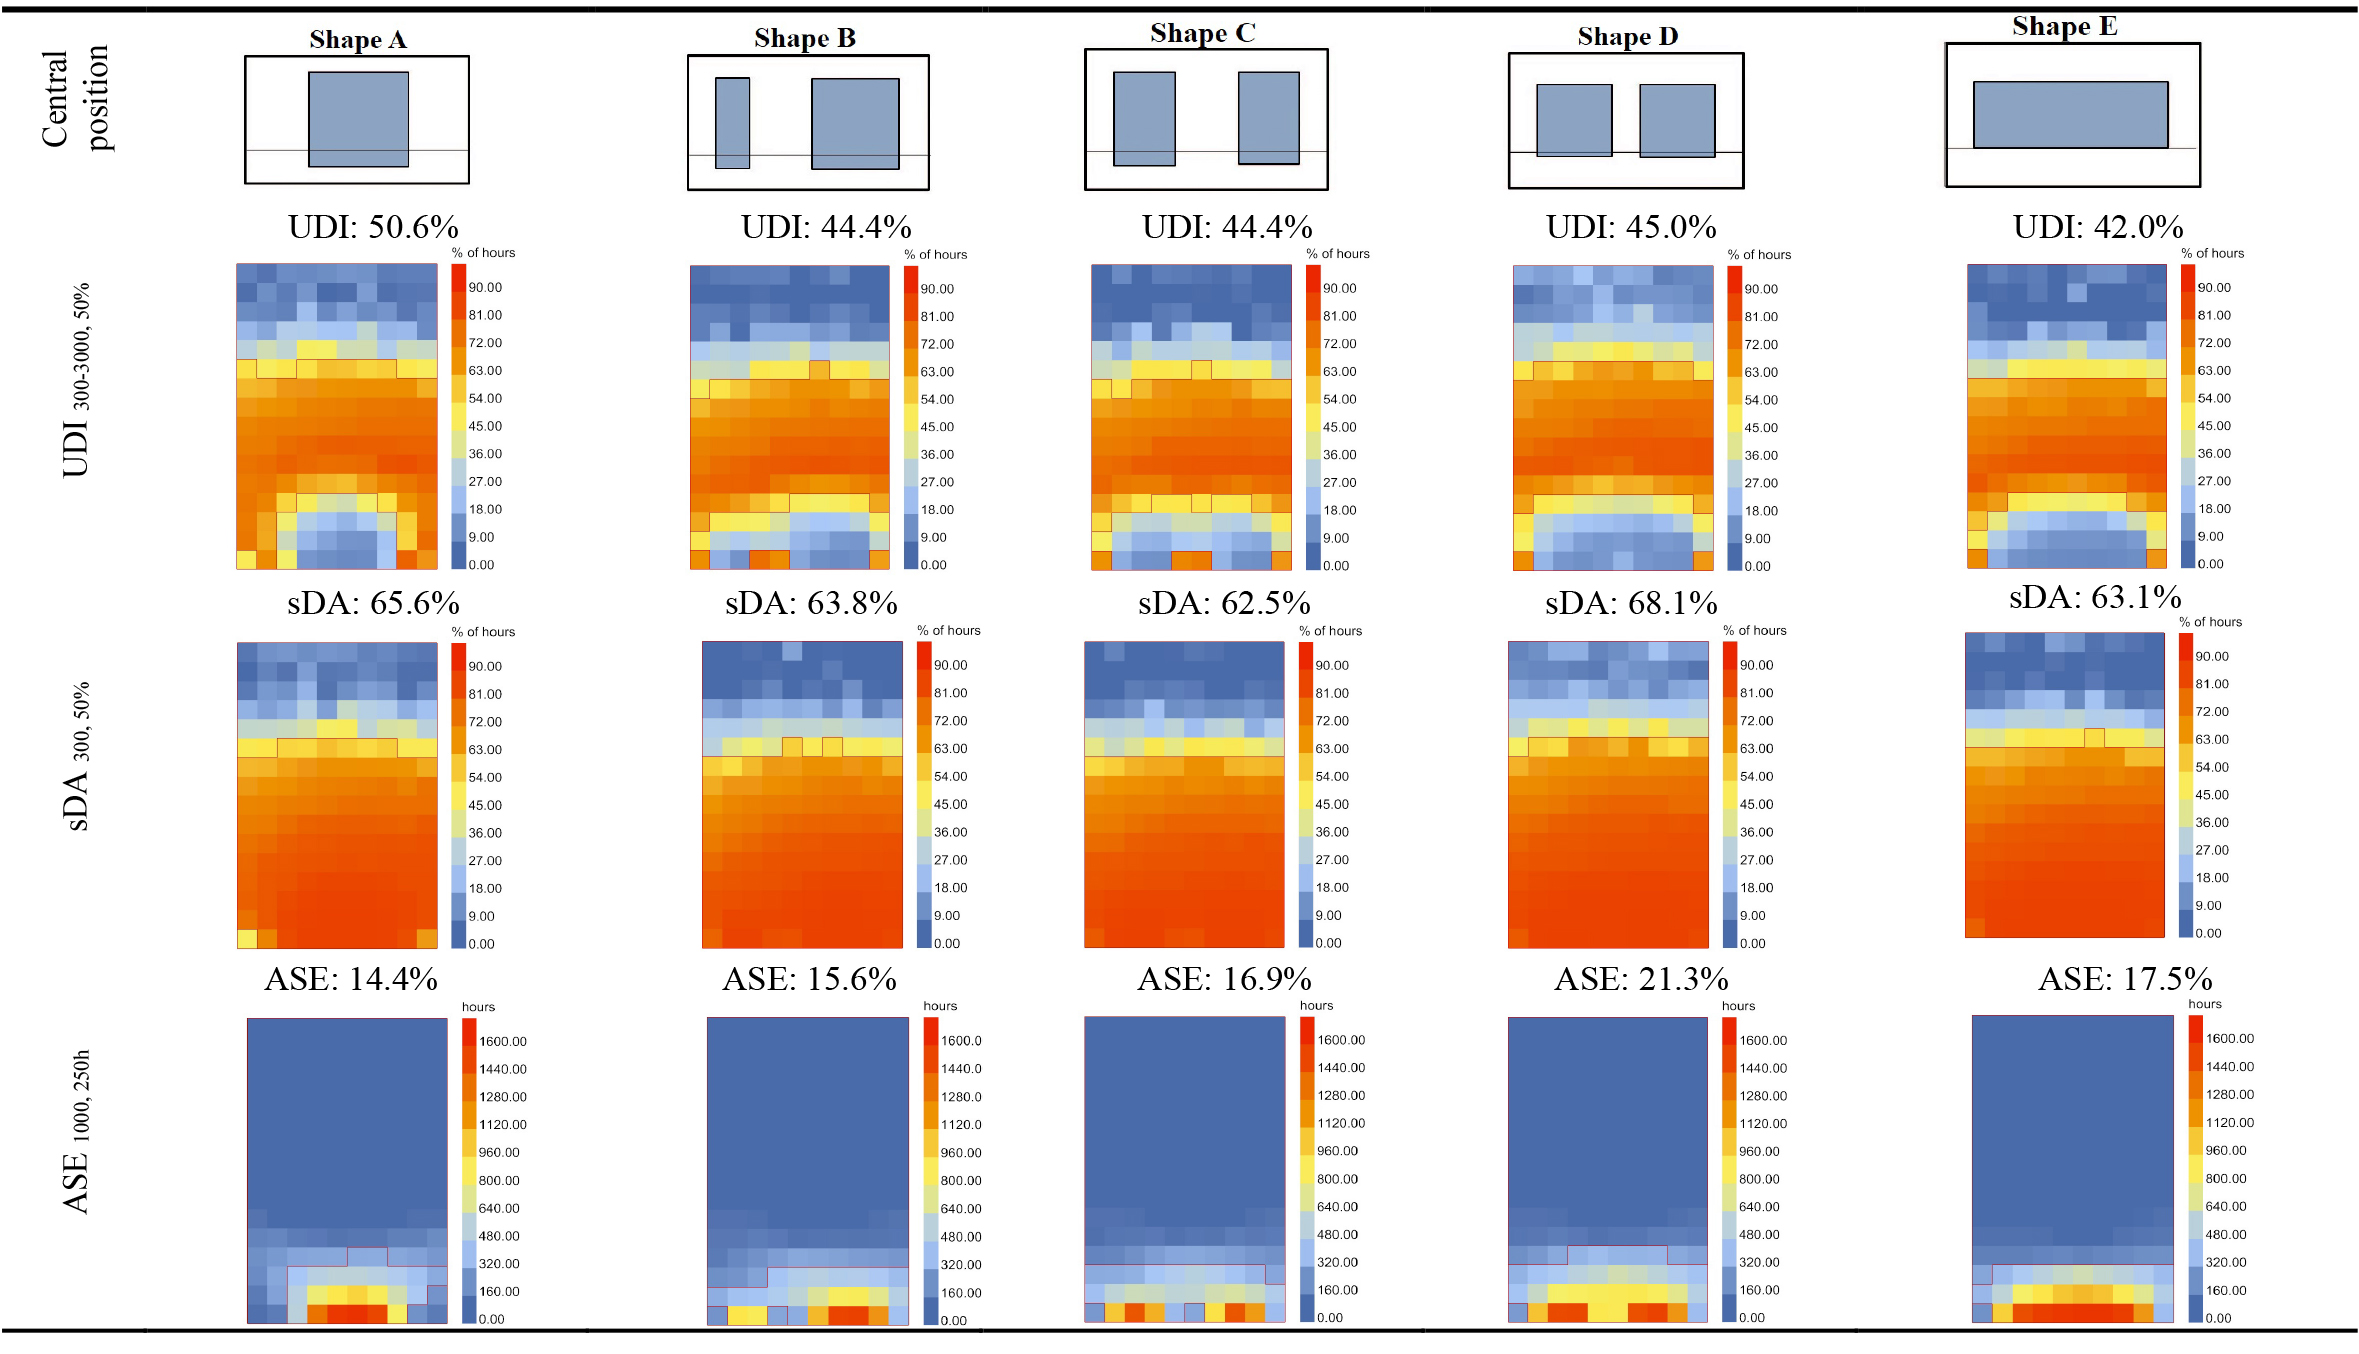
Table 8. Annual daylight metrics results for five window shapes in the central position in Bandar Abbas with BWh climate.
Table 9
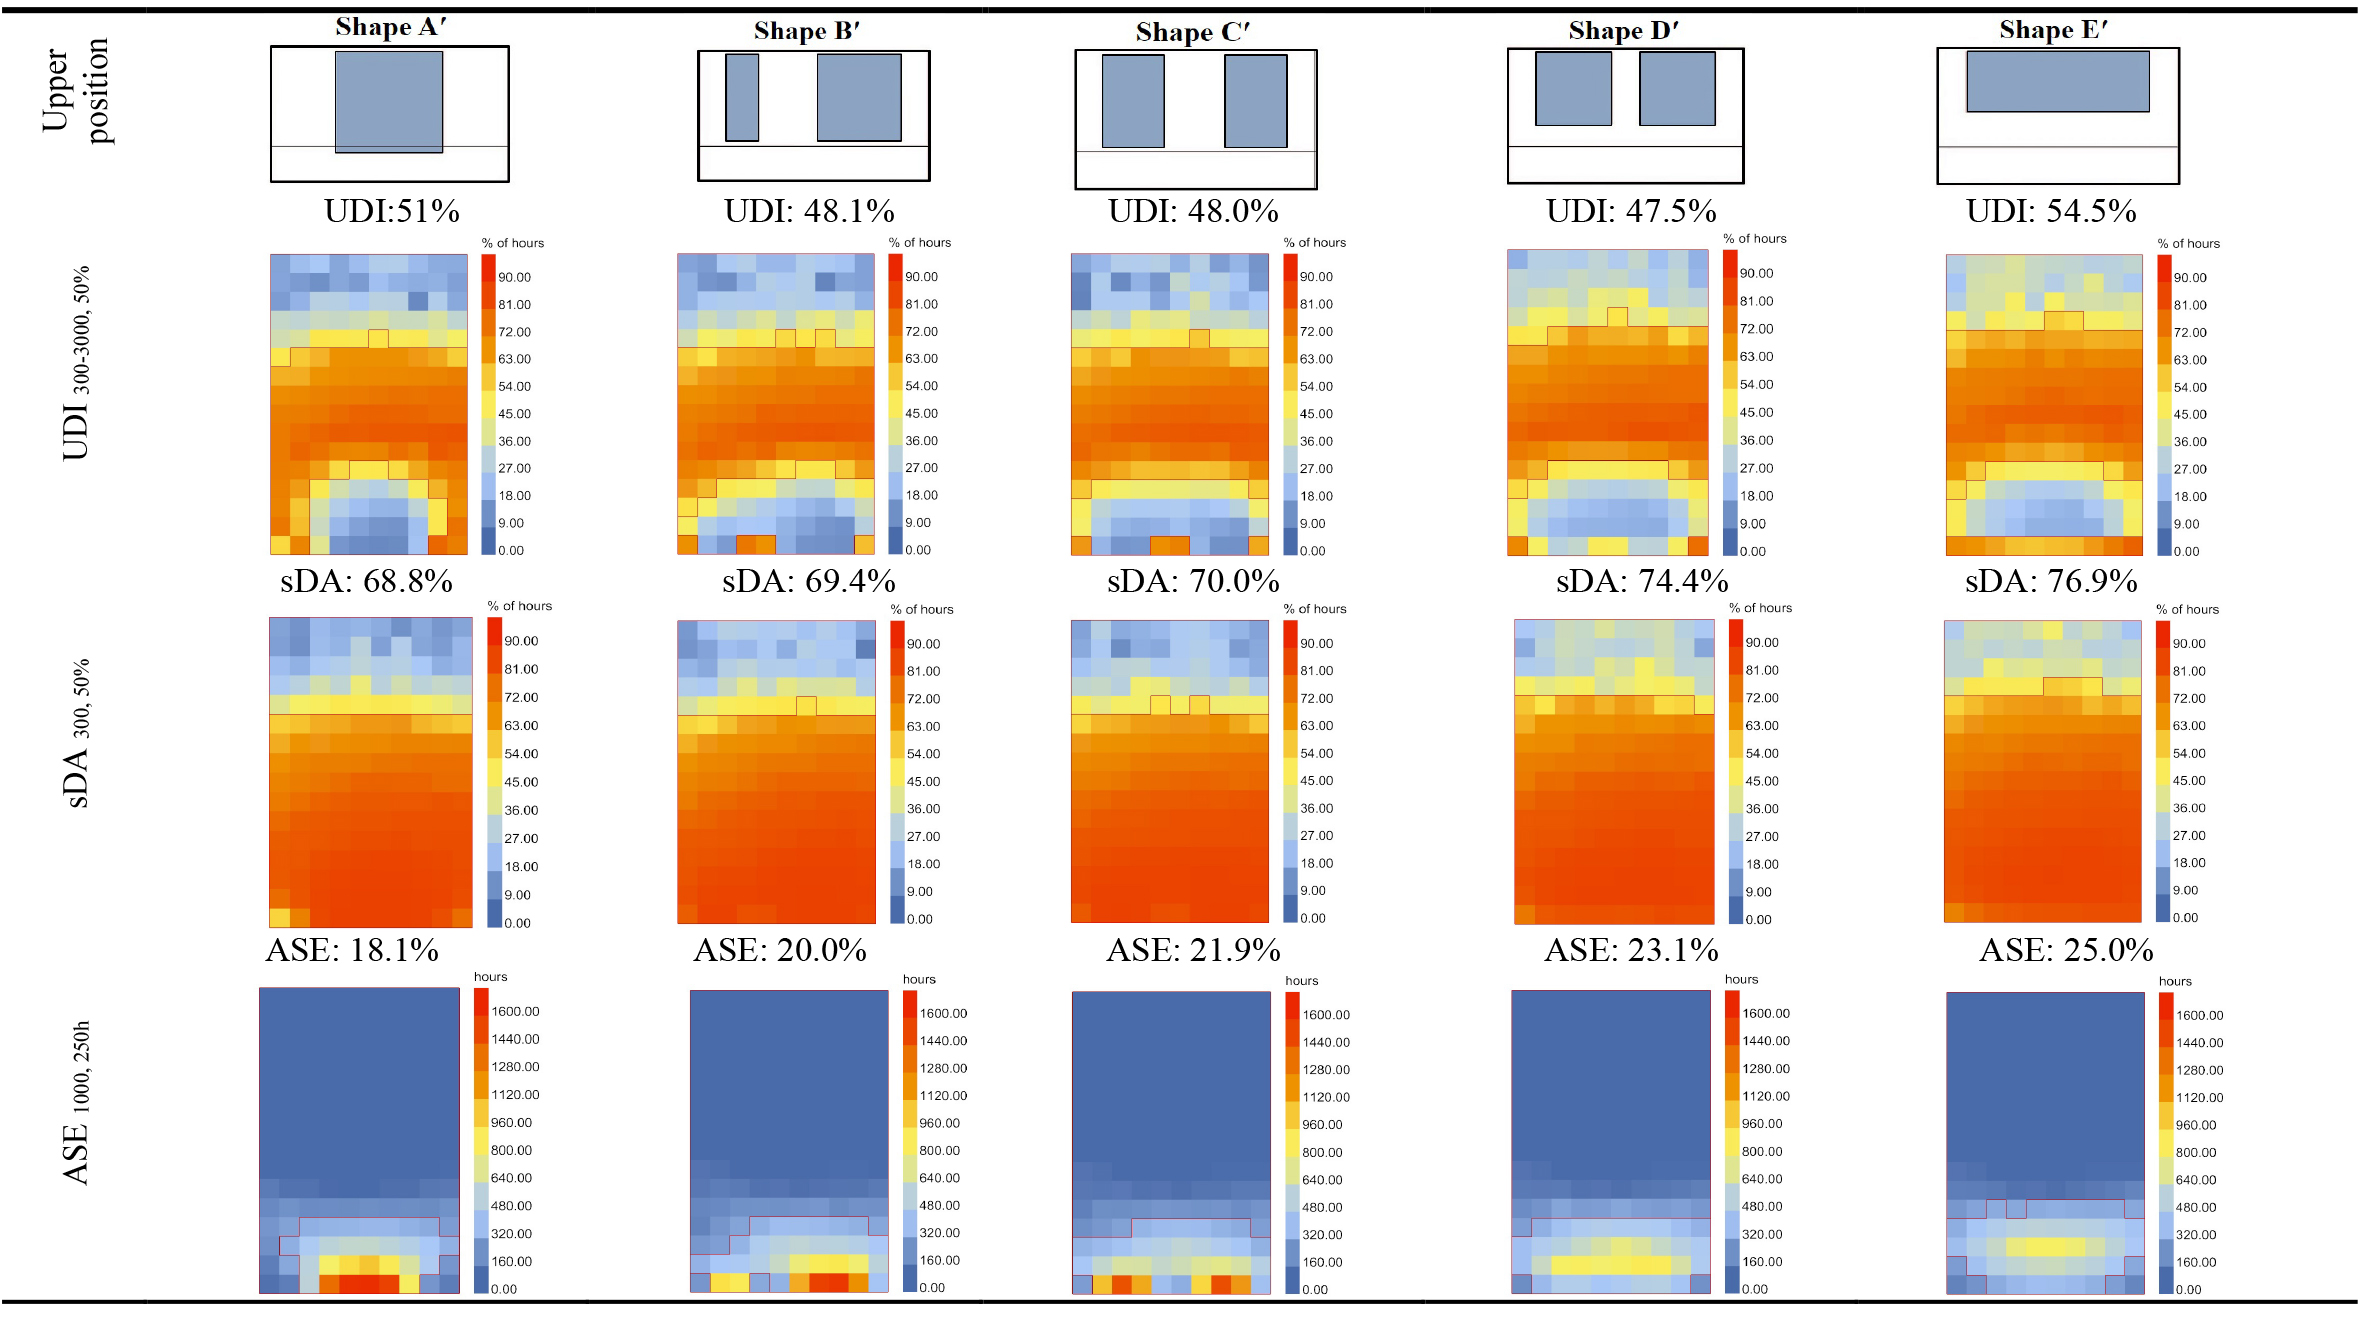
Table 9. Annual daylight metrics results for five window shapes in the upper position in Bandar Abbas with BWh climate.
To be in the LEED standard framework, it is necessary to increase sDA, and reduce ASE. The sDA does not specify an upper threshold for acceptable illuminance values that can cause visual discomfort due to glare from daylight. Accordingly, the ASE, an indicator of direct sun penetration into the occupied space [39], is used in conjunction with sDA to assess the risk of glare-induced visual discomfort. In other words, it can be considered a modifier of the sDA [40]. In addition, with increasing the WFR raises the sDA, which means illuminance levels surpass the 3000 lux threshold. Thus, UDI decreases [26]. Eventually, UDI is examined together with the two metrics to enhance the precision of the results, and provide useful illuminance in an acceptable range [14].
3.1. Impact of window design on useful daylight illuminance
As can be seen in Fig. 6, the simulation results for windows in three cities present that regarding the suggested UDI ≥ 55% of the floor area, The range of UDI is 42% to 59%. The useful daylight illuminance level is the highest in the center of the room, decreasing quickly in the room's rear, as expected. Moreover, some window shapes provide useful illuminance deeper into the room by increasing the sill height, achieving a slightly higher than UDI of 55%. Data analysis can be broadly classified into the following categories.
Figure 6
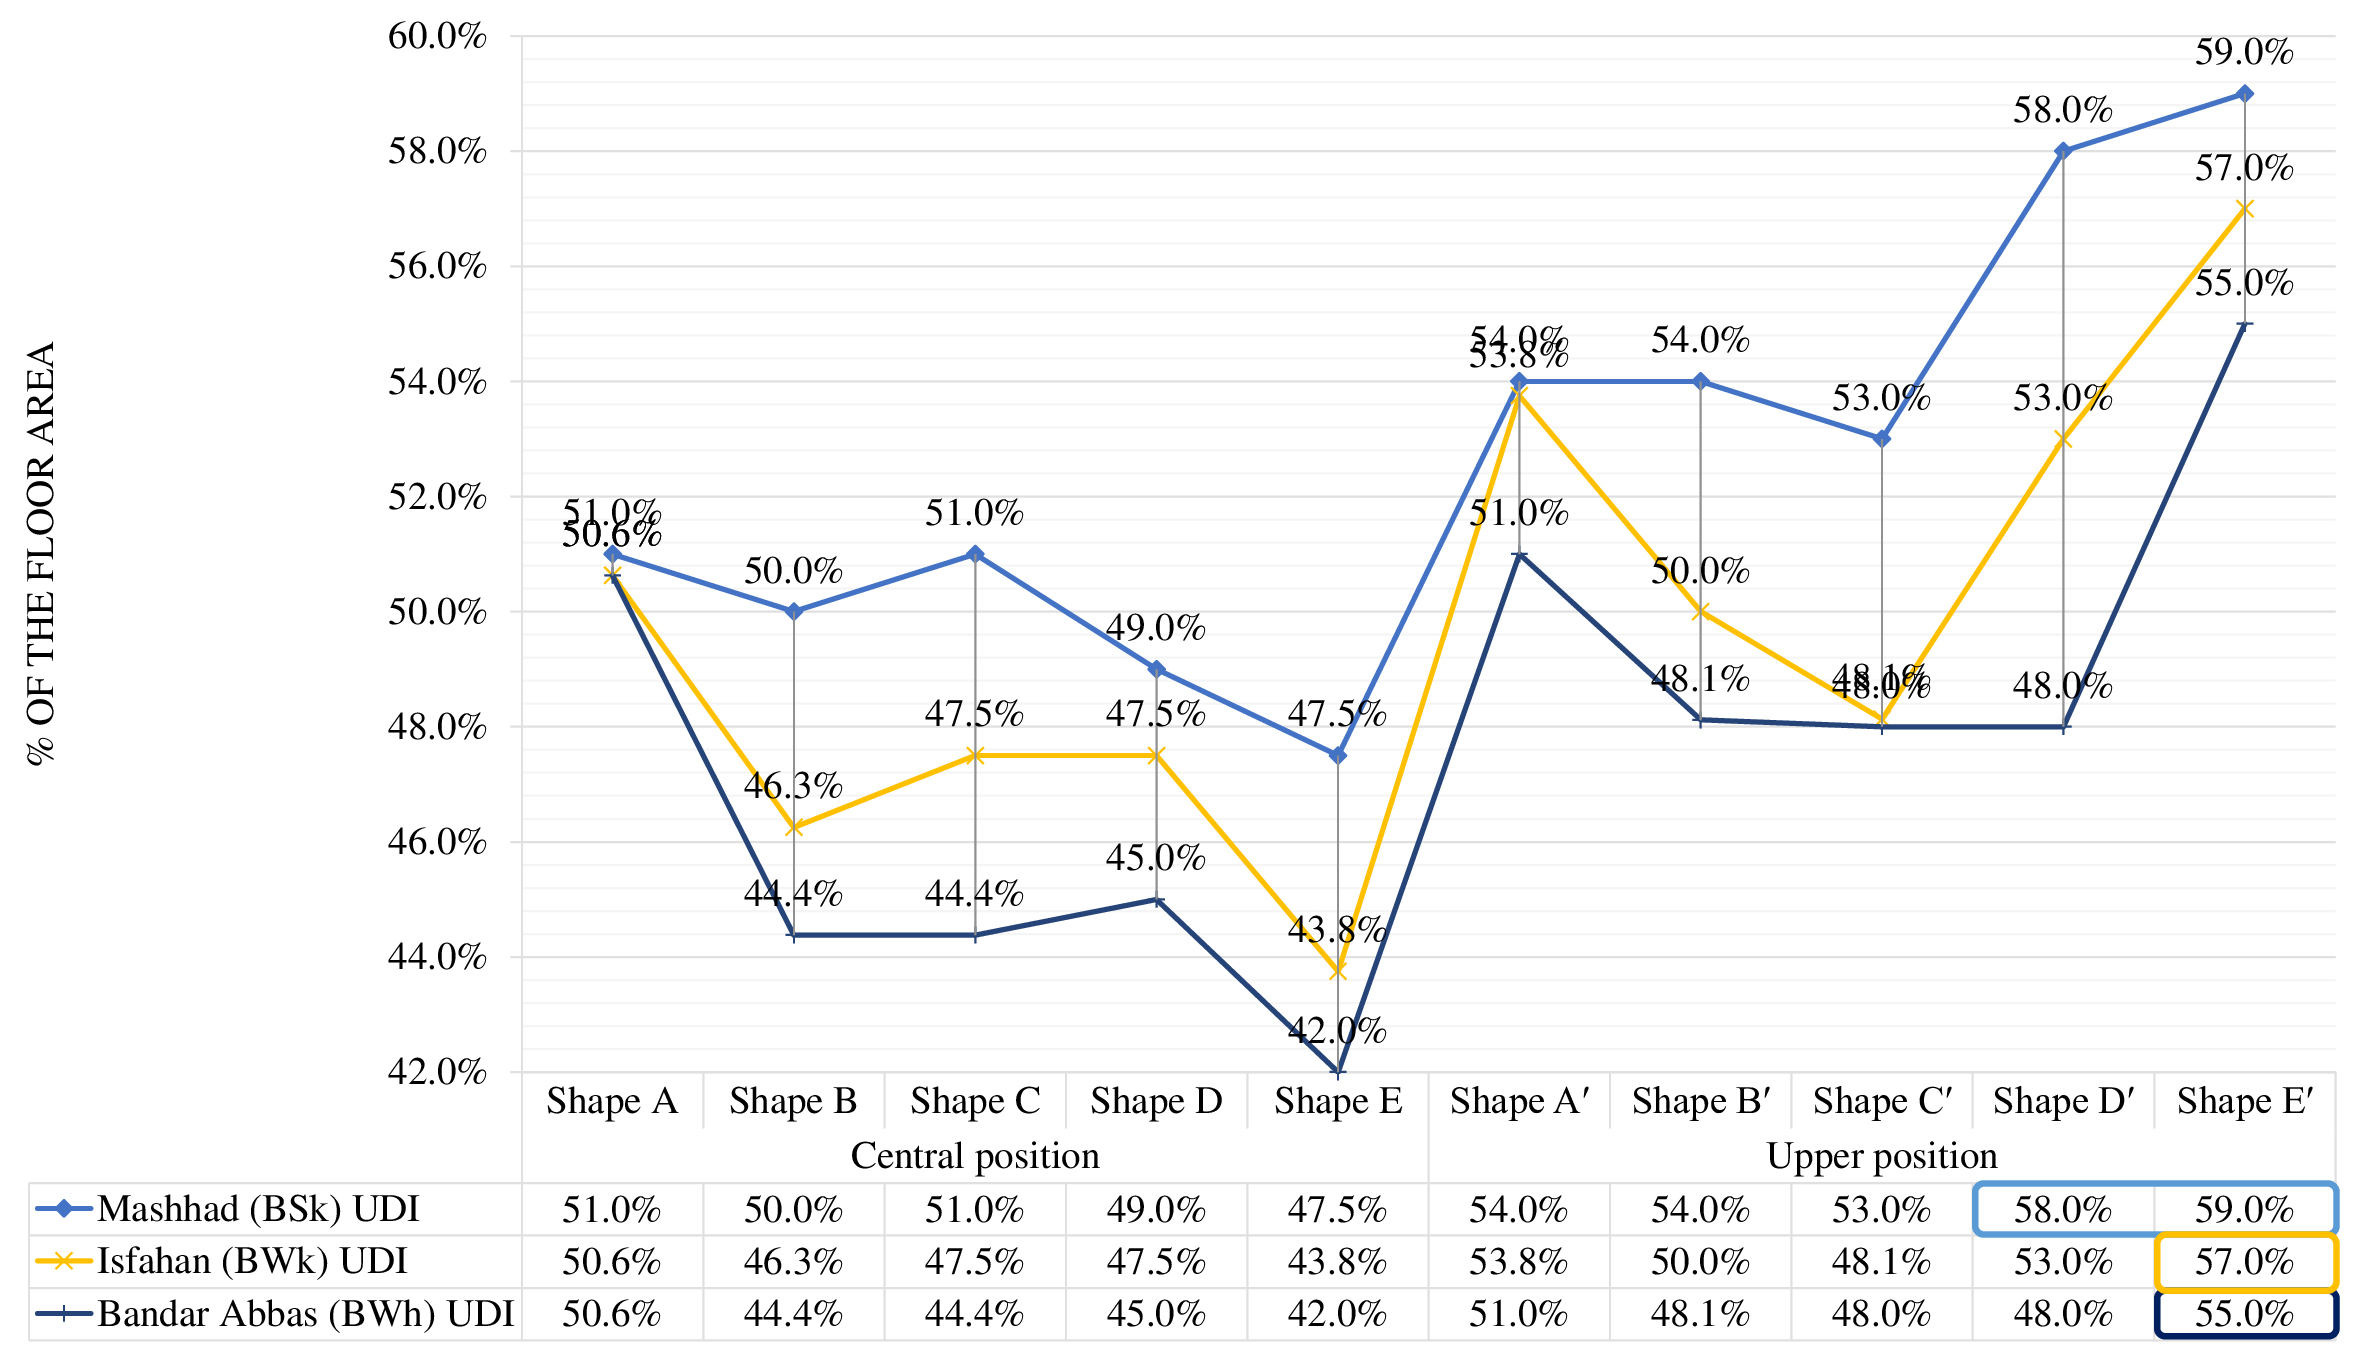
Fig. 6. Comparison values of UDI in central and upper windows.
3.1.1. Window shapes and positions
- Shapes Dʹ and Eʹ in the upper position have an acceptable UDI of 58%, and 59% in Mashhad City, respectively.
- Shape Eʹ meets the acceptable UDI in three climates.
- Shapes E and Eʹ with the minimum and maximum head height show the lowest and highest UDI values in all cities, respectively.
3.1.2. Climates
- In Mashhad, with dominant direct radiation, the range of UDI is 47.5% to 59%, and it is the highest value among the other two climates.
- In Isfahan, with nearly equal direct and diffuse radiation, the range of UDI is 43.8% to 57%.
- In Bandar Abbas, with dominant diffuse radiation, the range of UDI is 42 % to 55%, and it is the lowest rate compared to the other climates.
3.2. Impact of window design on spatial daylight autonomy
As can be deduced from Fig. 7, considering the recommended sDA ≥ 40% of the floor area, values are in the acceptable range of 60% to 76.9% in three climates. Analysis reveals that some window shapes achieve more than sDA of 65% by increasing sill height. Thus, windows at a higher position provide a larger level of daylight autonomy in the room's middle and back.
Data analyses are presented below.
Figure 7
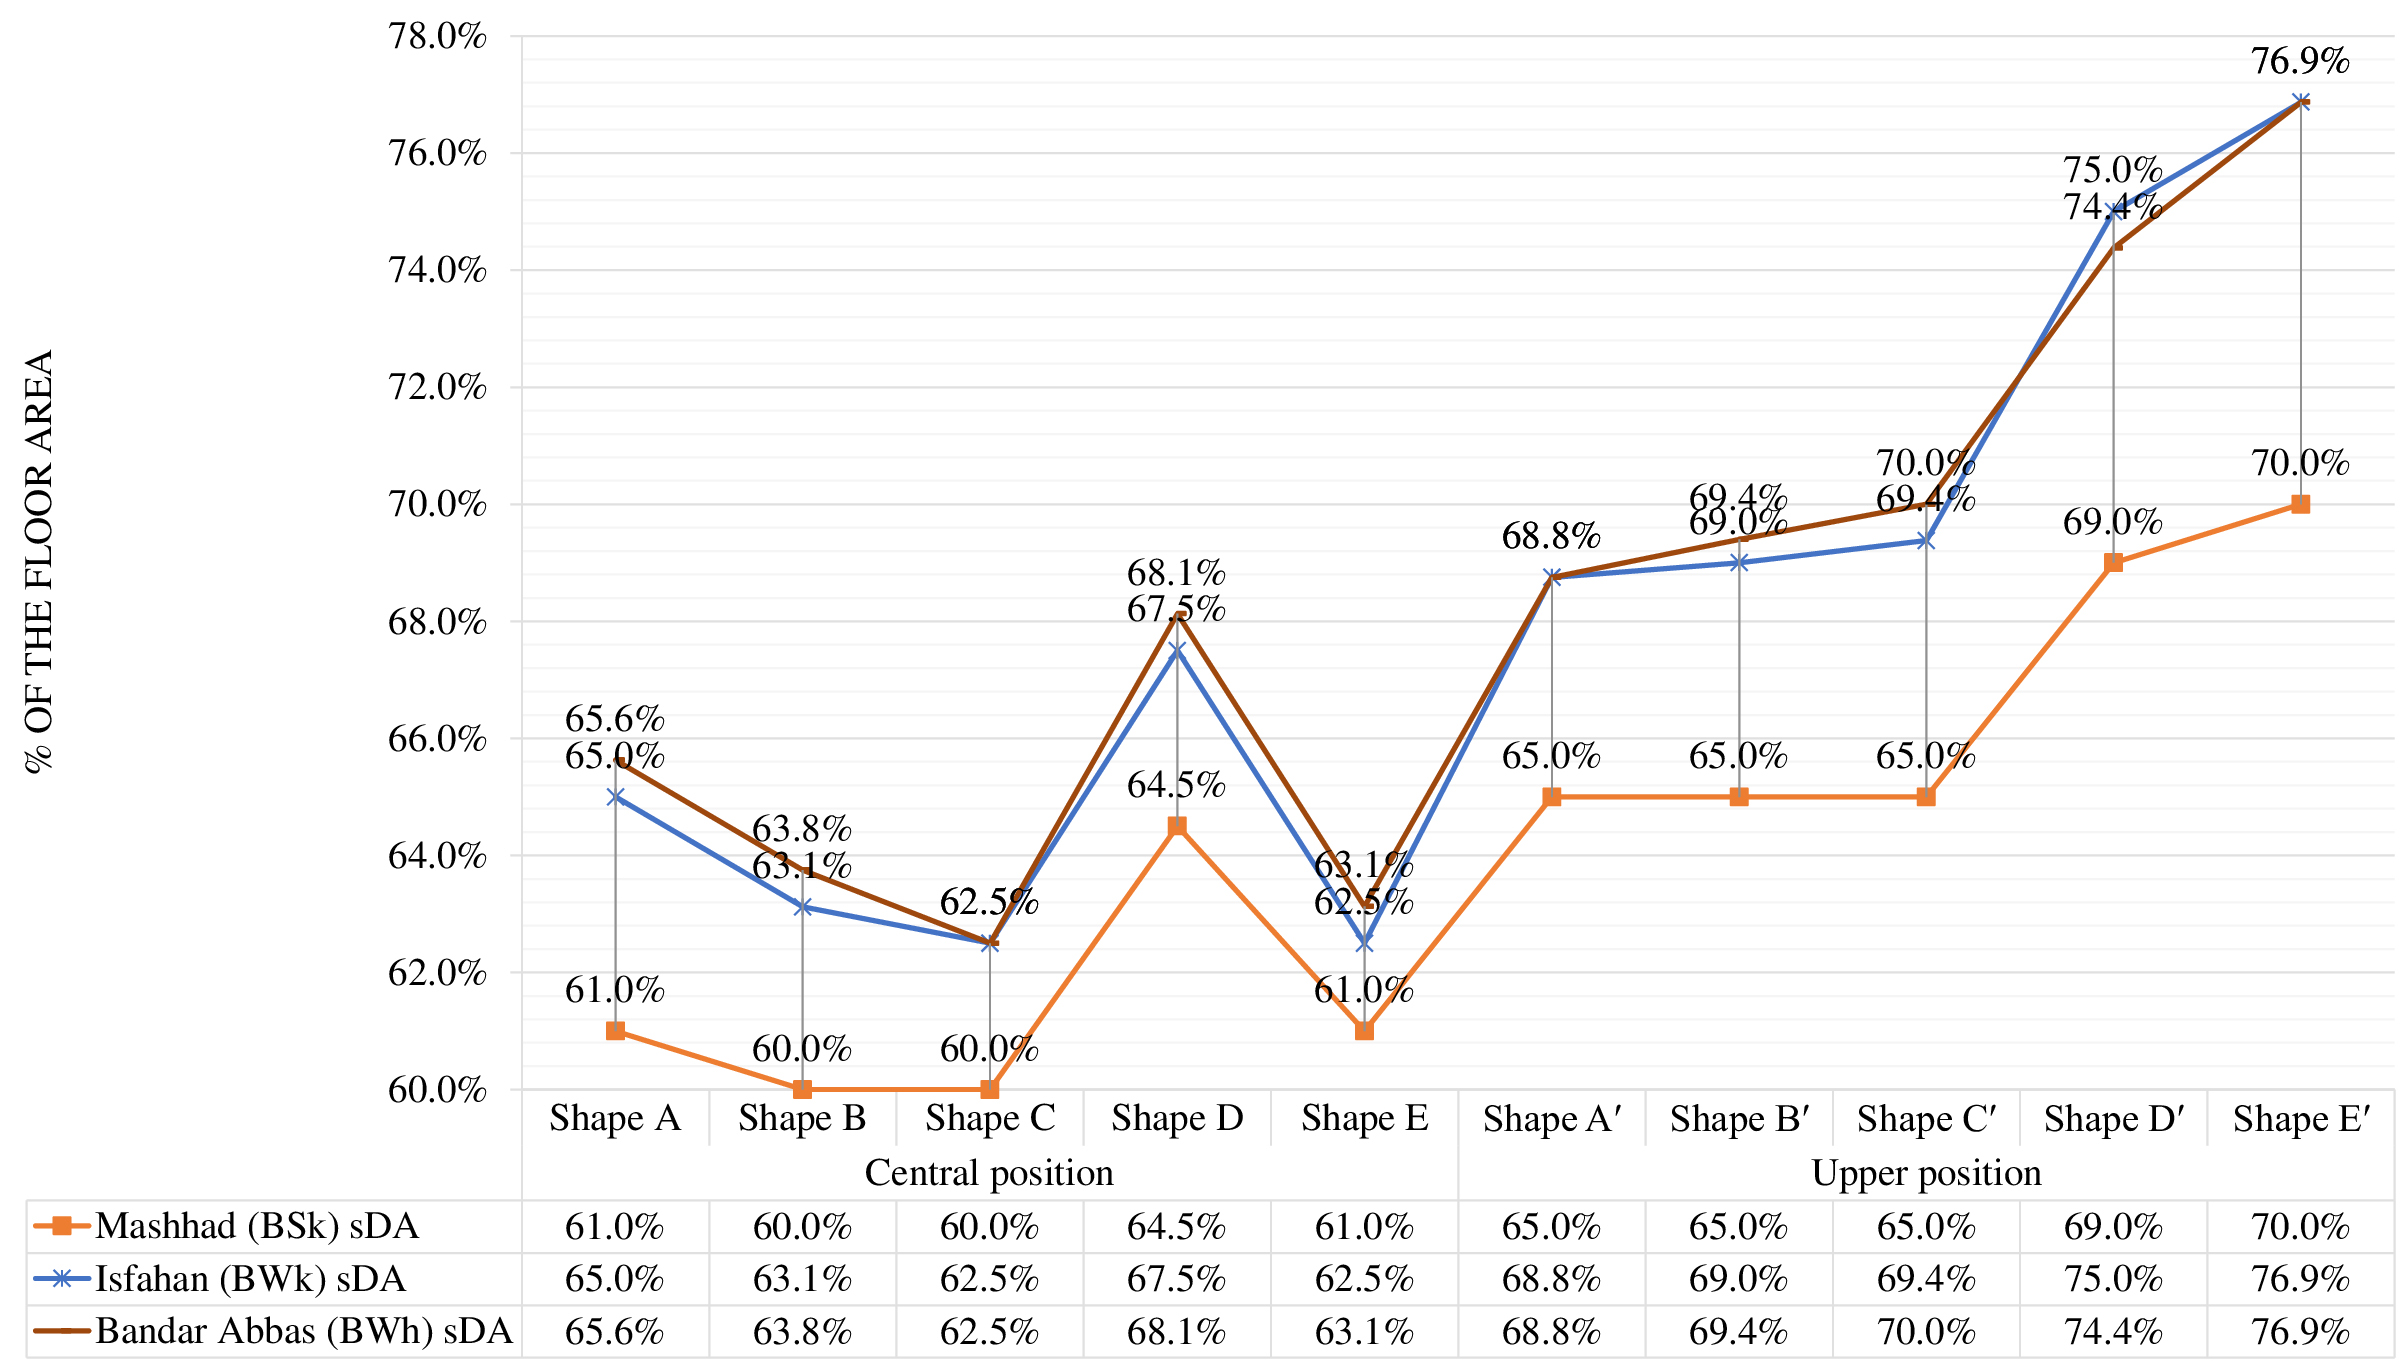
Fig. 7. Comparison values of sDA in central and upper windows.
3.2.1. Window shapes and positions
- All window shapes display nearly equal sDA values in both positions in all cities, except for shapes D, Dʹ, and Eʹ which indicate a significant increase in sDA rates.
- All window shapes in both positions produce acceptable sDA values within a higher limit of 60% of the floor area.
- Window shapes in the upper position achieve maximum sDA of 65% to 77%.
3.2.2. Climates
- Isfahan and Bandar Abbas with BWk and BWh climates provide similar sDA values around 62.5% to 76.9%, respectively.
- Isfahan and Bandar Abbas provide higher sDA rates than Mashhad with a BSk climate.
3.3. Impact of window design on annual sunlight exposure
As indicated in Fig. 8, according to ASE ≤ 20% of the floor area, the range of ASE is 14.4% to 30.0%. The results indicate that the ASE rates increase with rising sill height especially shapes of D′ and E′. Moreover, the square window in the centered position with ASE of 14.4% presents better results in three different climates. Data analyses are presented as follows:
Figure 8
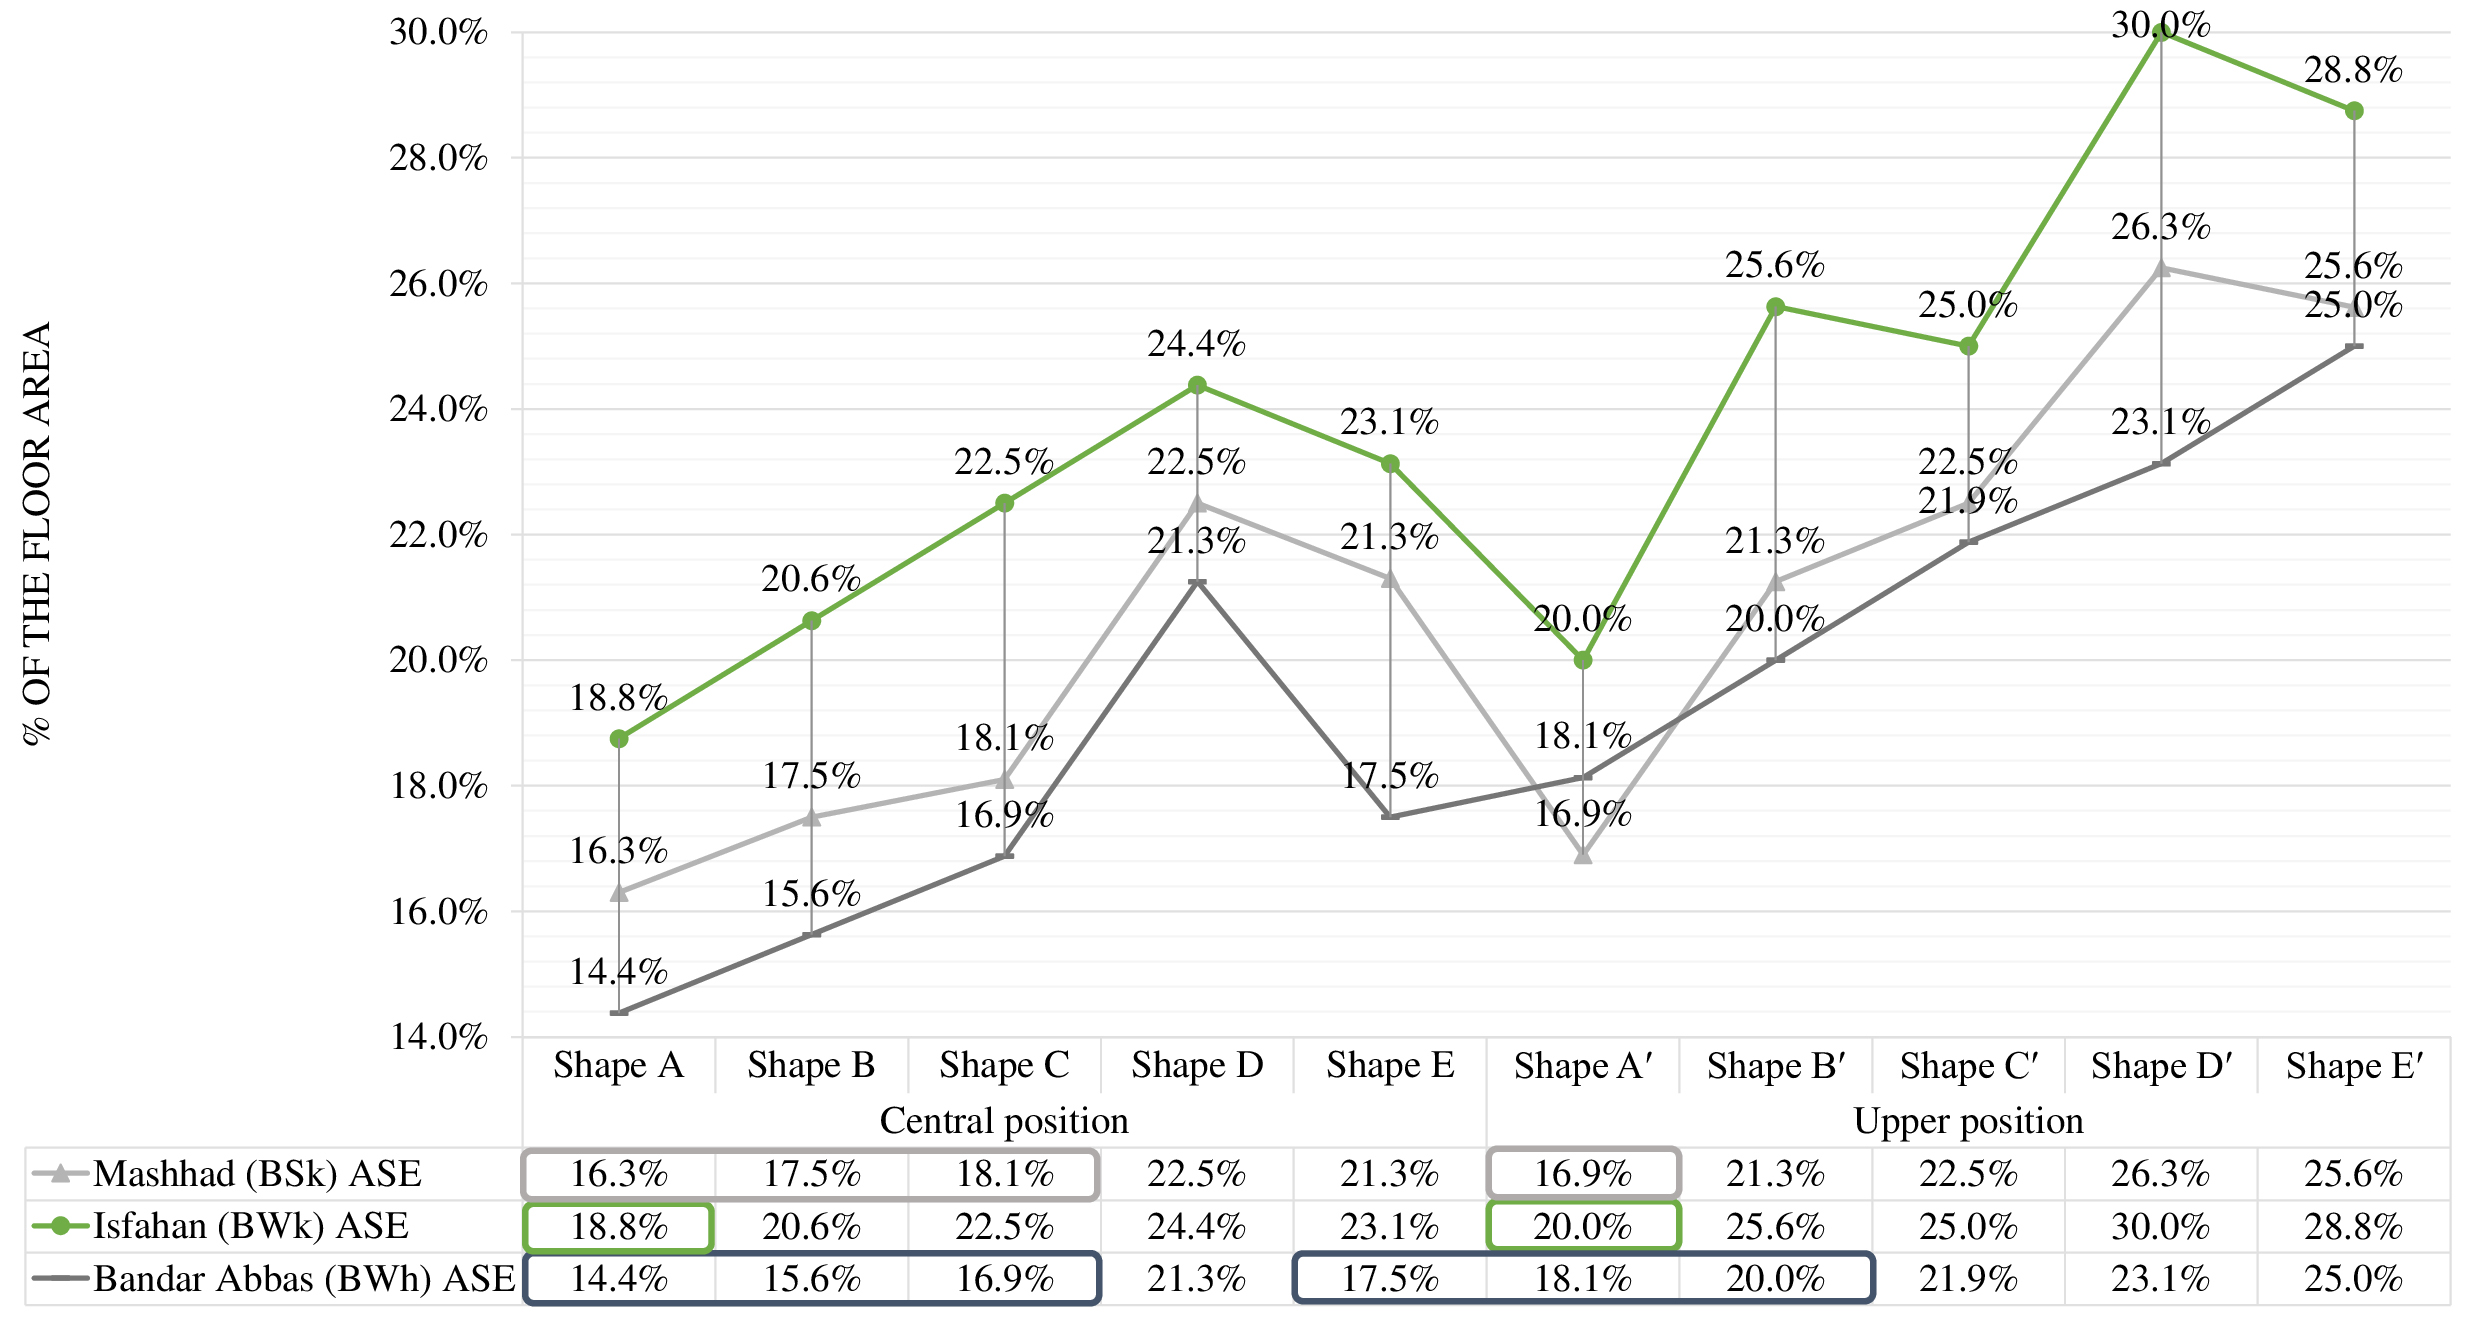
Fig. 8. Comparison values of ASE in central and upper windows.
3.3.1. Window shapes and positions
- Shapes A, Aʹ, B, and C obtain an adequate ASE of 16.3% to 18.1% among the central and upper positions in Mashhad.
- Shapes A and Aʹ achieve an acceptable ASE of 18.8% and 20.0% in Isfahan, respectively.
- Shapes A, B, C, E, Aʹ, and Bʹ offer a satisfying ASE of 14.4% to 20.0% in Bandar Abbas.
- Shape D gets a slight increase in ASE values among central windows in all cities.
- In Isfahan, shape D′ receives the highest ASE of 30% among the three climates, which indicate this value is out of range.
- In Bandar Abbas, shape A has the lowest ASE of 14.4% among other cities.
3.3.2. Climates
- In Mashhad, the range of ASE is 16.3% to 26.3%.
- In Isfahan, ASE ranges from 18.8% to 30.0%. Thus, compared to other cities, this one presents the highest ASE rate.
- In Bandar Abbas, the range of ASE is 14.4% to 25.0%. Therefore, this city has the lowest ASE rate.
3.4. Comparison of all results
As demonstrated in Fig. 9, the analysis's outcomes for dynamic daylight metrics are summarized as follows:
Figure 9
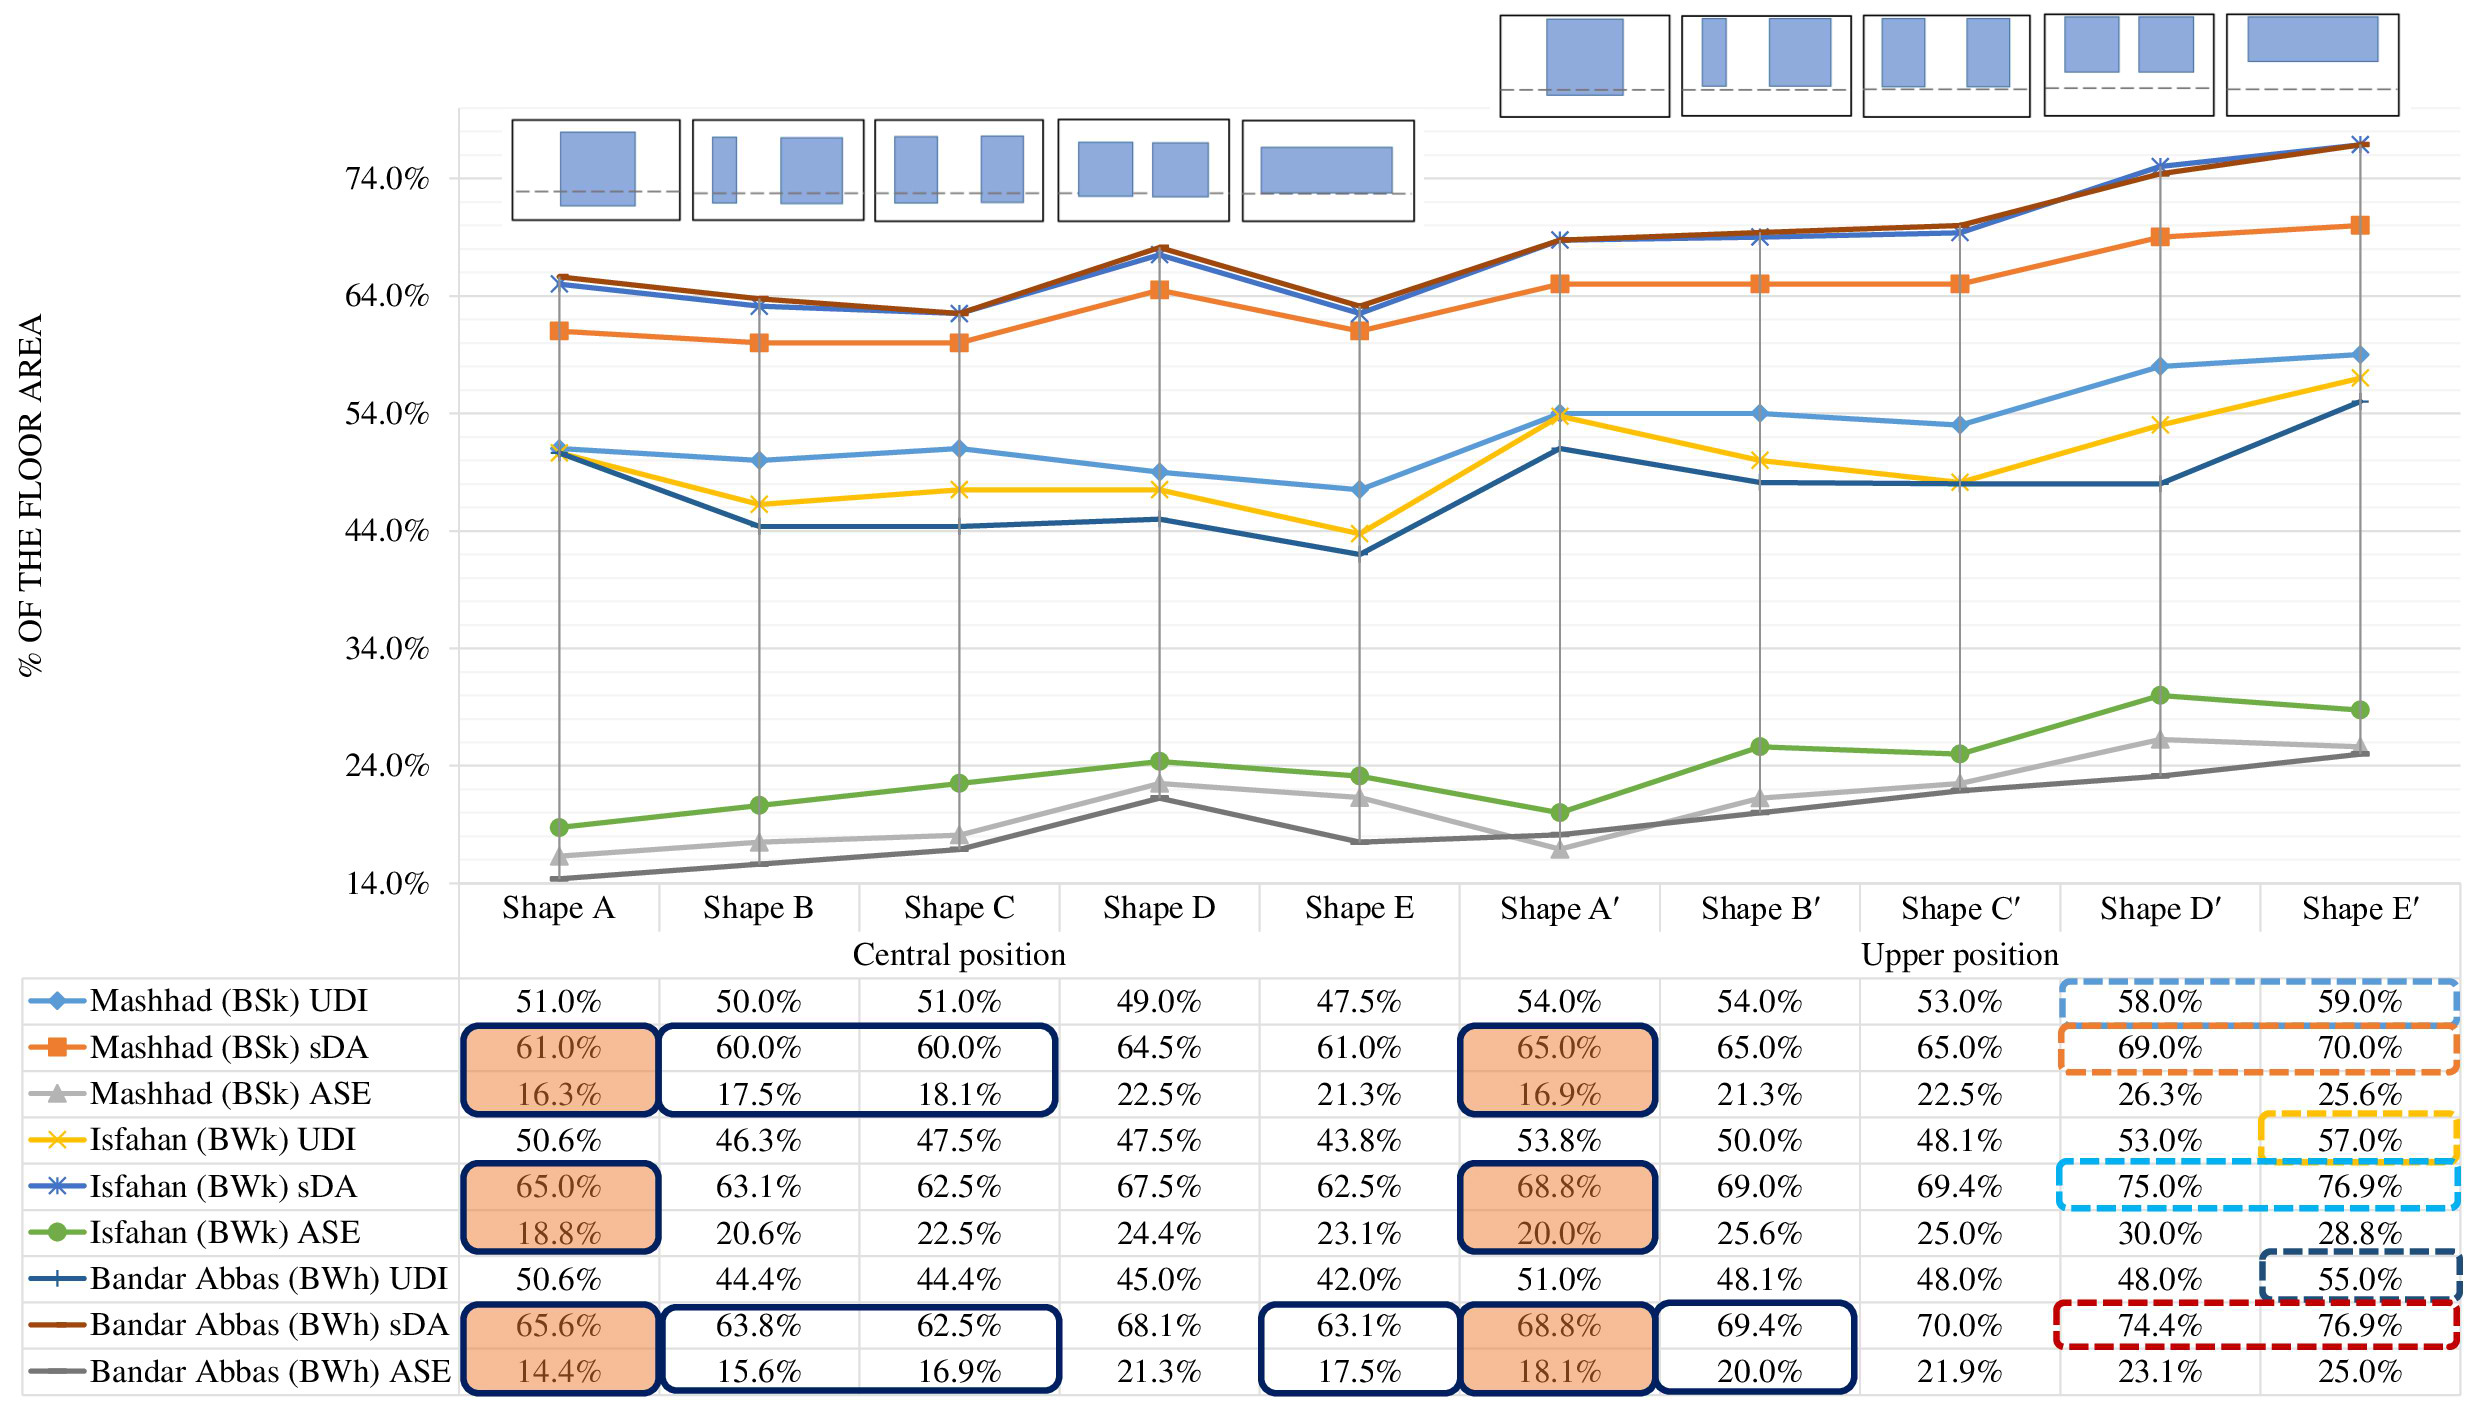
Fig. 9. Comparison values of dynamic daylight metrics in central and upper positions.
Figure 10
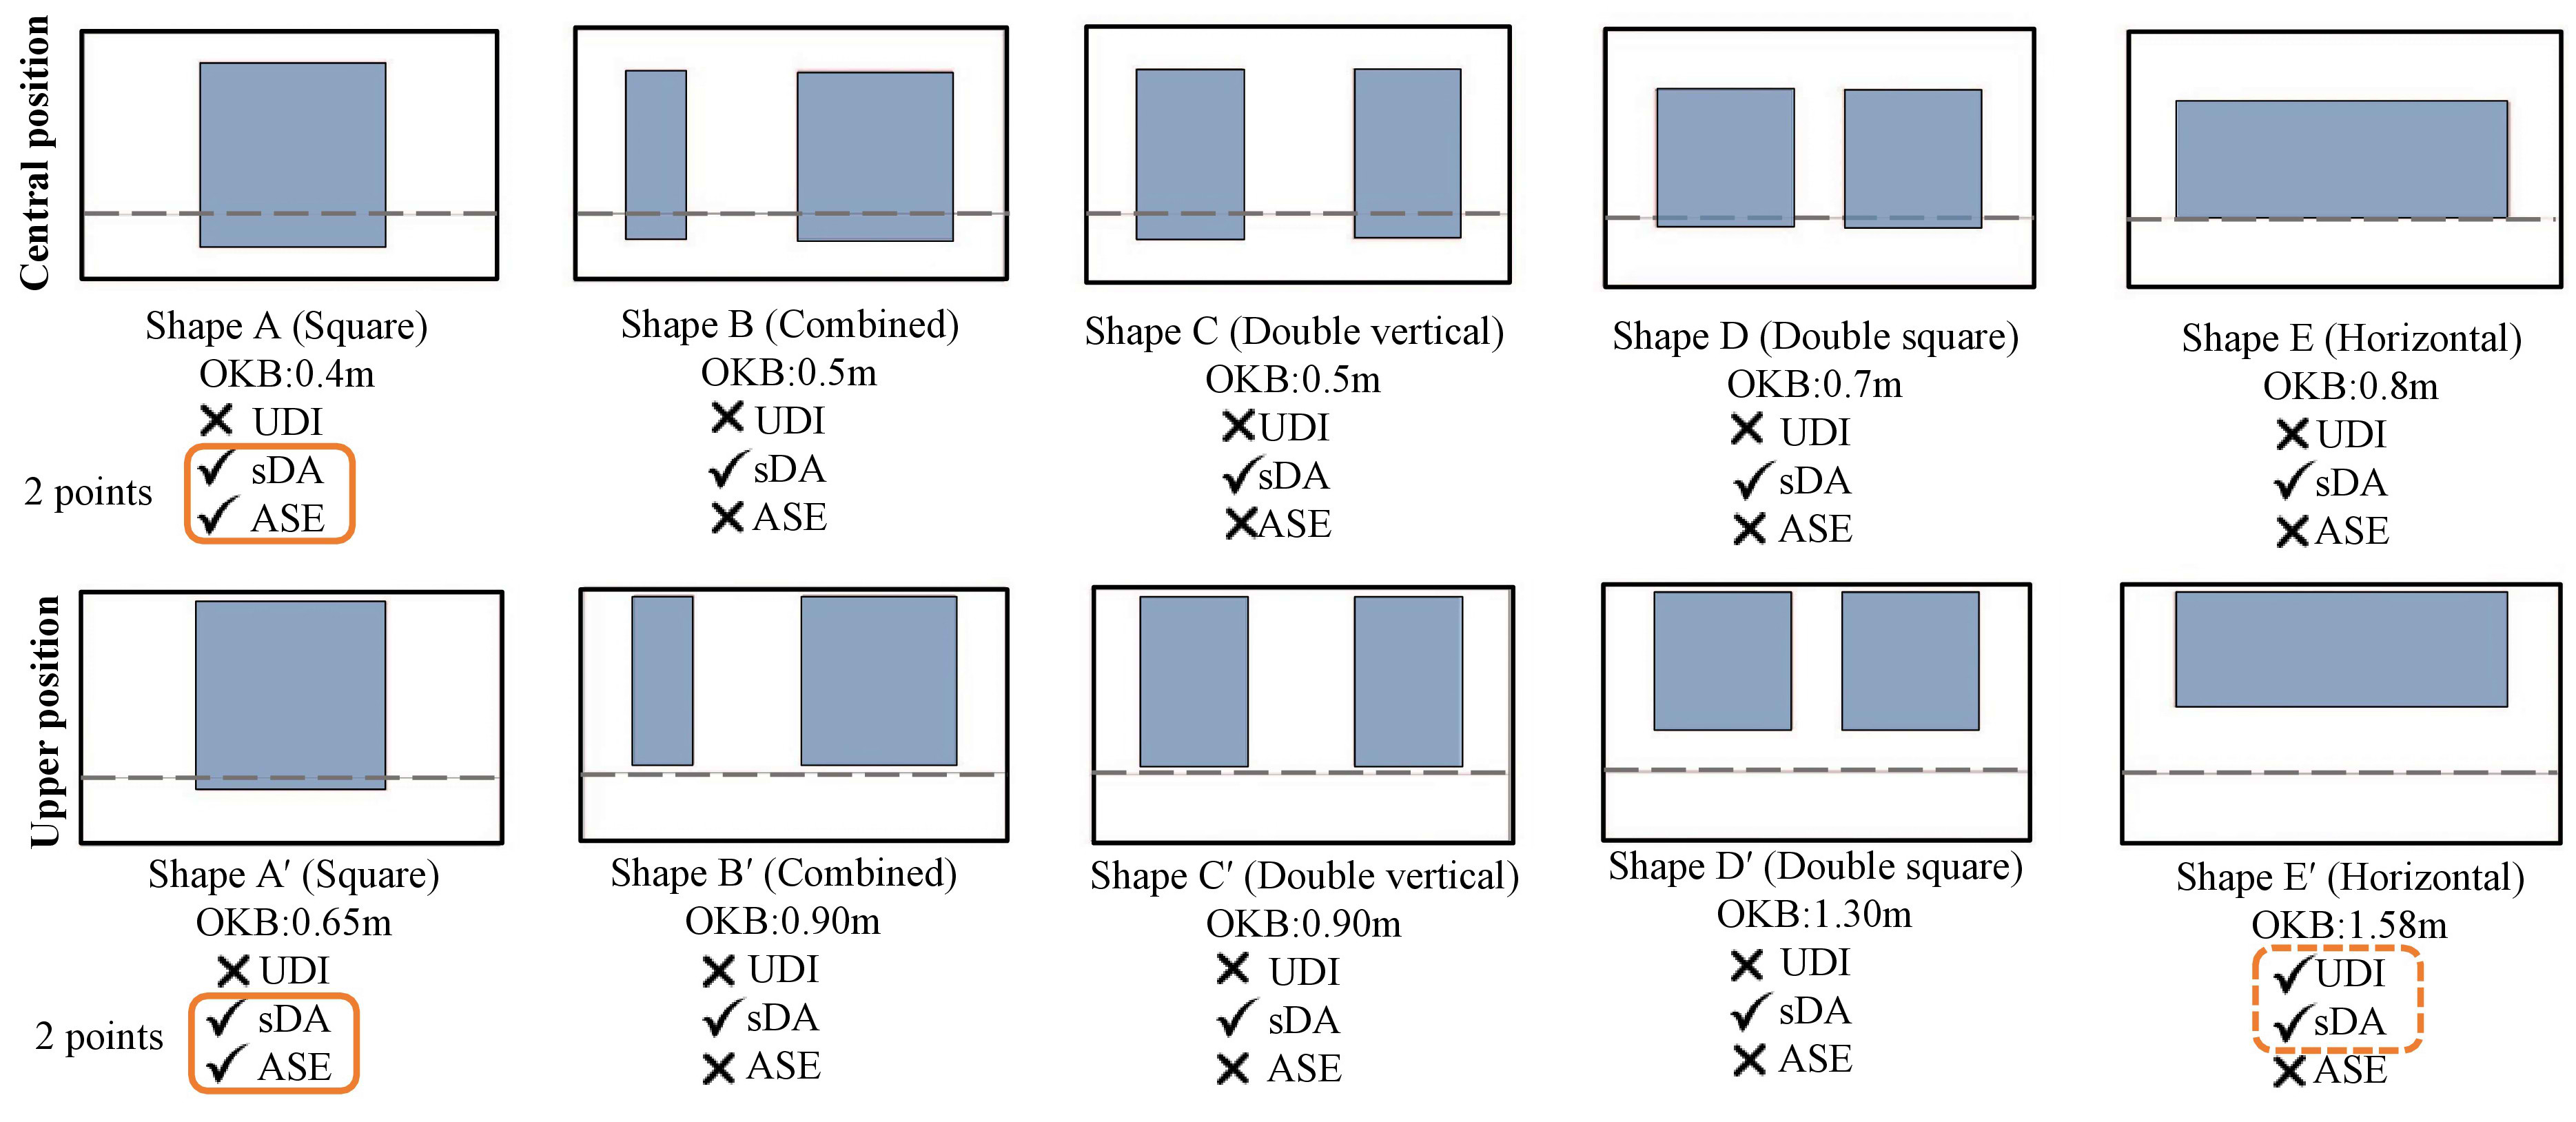
Fig. 10. Common shapes in terms of dynamic daylight result in the windows with central and upper position in three different climates.
3.4.1. Analysis of UDI
According to Table 3, shapes Eʹ and Dʹ produce adequate UDI rate in Mashhad. Shape Eʹ obtains acceptable UDI quantities in Isfahan and Bandar Abbas. Thus, shape Eʹ is a common shape for all cities and dedicates the maximum values compared to other cases.
3.4.2. Analysis of sDA and ASE
According to the LEED rating system, if two of the daylight metrics are provided with sDA from 55% to 75%, and ASE less than 20%, the space will achieve 2 and 3 points, respectively. Daylight analysis reveals that shapes A, A′, B, and C have acceptable sDA and ASE values in Mashhad. Then, shapes A and A′ receive adequate values in Isfahan. Then, shapes A, B, C, E, Aʹ, and B′ produce appropriate rates in Bandar Abbas. Moreover, shapes A and Aʹ are common shapes in all cities. As a result, this shape obtains 2 points based on LEED.
3.4.3. Analysis of sDA, ASE, UDI
According to Figs. 9 and 10, shapes of A and Aʹ achieve acceptable sDA, ASE, and insufficient UDI in all cities. Moreover, shapes Dʹ and E′ obtain the highest sDA and UDI levels among the windows. The UDI and sDA values analysis reveals that central windows present minimum values, which are raised by increasing sill height. Generally, there are almost similar values of sDA, and a noticeable difference in ASE rate between Isfahan and Bandar Abbas with arid climates. In comparison to the other cities, Bandar Abbas produces the best ASE values with dominant diffuse radiation, whereas Isfahan exhibits the worst ASE values with nearly equivalent direct and diffuse radiation. Mashhad with a semi-arid climate and dominant direct radiation presents the highest UDI and lowest sDA values among the other two climates.
4. Conclusions
Window design affects the building's appearance. Furthermore, windows as the primary factor to obtain daylight has a significant impact on daylight performance, and visual comfort, particularly in office buildings. Thus, an office space was considered in the study. The main research aim is to investigate the influence of window design on dynamic daylight performance based on the LEED v4.1 rating system in three cities in the northeast, center, and south of Iran including Mashhad, Isfahan, and Bandar Abbas. A virtual office room measuring 5.0 m wide × 8 m deep × 3 m high is considered to analyze the values of UDI, sDA, and ASE. Five window shapes (square, combined, double vertical, double square, and horizontal) are examined in two different positions (central and upper) on the southern-facing side. Based on Code 4 of Iran's National Building Rules, a WFR of 12.5% is provided.
The results indicate that window shapes and positions have a significant effect on dynamic daylight performance to enhance visual comfort. In general, the middle and upper square window meets the LEED requirements. However, it produces insufficient UDI, which can be improved by raising WFR or using light shelves to access more useful daylight penetration. In contrast, the horizontal windows with the upper position present the best values of UDI and sDA, and the worst ASE, which can be reduced by architectural solutions such as shading systems.
In addition, the special climate conditions have a noticeable effect on dynamic daylight performance. In Isfahan and Bandar Abbas with arid climates, the values of sDA are similar, and ASE rates are noticeably different. Bandar Abbas with high diffuse radiation and the lowest ASE rate satisfies the LEED needs better than other cities. In contrast, Isfahan with nearly equal diffuse and direct radiation provides the highest rates of ASE among other cities, thus only the square window in the central and upper placements meets the LEED needs. In addition, Mashhad, which receives high direct radiation, has the highest UDI and lowest sDA levels compared to the other climates. The main findings of this research are outlined as follows:
4.1. Window shapes and positions
- All of the window shapes have adequate sDA levels. In contrast, UDI and ASE results do not present acceptable values in some shapes based on LEED v4.1 standard.
- In all central windows, a significant reduction is observed in sDA, and UDI in the back of the room, which can be improved by placing the windows in a higher position. Therefore, the highest values of UDI and sDA have been acquired in the windows with upper positions, predominantly in horizontal (shape Eʹ) and double square (shape Dʹ) windows.
- The horizontal windows in the central and upper positions (shapes E and Eʹ), show the minimum and maximum UDI values due to head height, respectively.
- The ASE values deteriorate with increased sill height, especially for horizontal (shape Eʹ) and double square (shape Dʹ) windows that can be improved by architectural solutions such as shading systems to avoid excessive sunlight.
- The square window in the central placement (shape A), the minimum sill height and maximum head height, achieves the lowest rates of ASE in three climates.
- In three cities, the square windows in the middle and higher positions (shapes A and Aʹ) provide acceptable sDA and ASE, thus meeting the LEED needs. However, it produces low UDI, which can be improved by raising WFR to access more useful daylight penetration.
4.2. Climates
- Isfahan city (BWk) with an arid climate and nearly equal direct and diffuse radiation indicates the highest and worst values of ASE among other climates. Therefore, only the square windows in the central and upper placements (shapes A and Aʹ) achieve the best sDA and ASE results.
- Bandar Abbas city (BWh) fulfills the needs for LEED better than other cities due to its prevailing diffuse radiation and the lowest ASE values. Thus, the square (shape A), combined (shape B), double vertical (shape C), and horizontal (shape E) windows in the middle position, as well as square and combined windows in the higher placement (shapes Aʹ and Bʹ) receive acceptable sDA and ASE results, respectively.
- Mashhad city (BSk) with a semi-arid climate and dominant direct radiation has the highest UDI and the lowest sDA values compared to the other climates. Hence, the square windows in the central and upper positions (shapes A and Aʹ) have optimum sDA and ASE results, followed by the combined (shape B) and double vertical (shape C) windows in the central placement.
- In addition to shapes A and Aʹ, other shapes namely, combined (shape B) and double vertical (shape C) windows located in central positions satisfy the needs of the LEED in Bandar Abbas and Mashhad with respect to dominating diffuse and direct radiation, respectively.
It is significant to mention that the conclusions were based on a limited number of climates, and window shapes and positions. Thus, future studies can consider the influence of more variants of window designs in different climate zones on dynamic and static daylight performance along with regard to the impact of WFR, WWR, and architectural solutions.
Contributions
S. Farivar: Data curation, Formal analysis, Investigation, Methodology, Resources, Software, Validation, Writing - Original Draft, Writing - Review and Editing; S. Teimourtash: Supervision and Review.
Declaration of competing interest
The authors declare no conflict of interest.
References
- A. D. Galasiu and J. A. Veitch, Occupant Preferences and Satisfaction with the Luminous Environment and Control Systems in Daylit Offices: a literature review, Energy and Buildings 38 (2006) 728-742. https://doi.org/10.1016/j.enbuild.2006.03.001
- Y. W. Lim, M. Z. Kandar, M. H. Ahmad, D. R. Ossen, and A. M. Abdullah, Building Façade Design for Daylighting Quality in Typical Government Office Building, Building and Environment 57 (2012) 194-204. https://doi.org/10.1016/j.buildenv.2012.04.015
- F. Şener Yilmaz, Proposal of a Façade Design Approach for Daylight Performance Determination in Buildings, A|Z IUT Journal of Faculty of Architecture 13 (2016) 57-64. https://doi.org/10.5505/itujfa.2016.49140
- N. S. Shafavi, M. Tahsildoost, and Z. S. Zomorodian, Investigation of Illuminance-based Metrics in Predicting Occupants' Visual comfort (Case Study: Architecture Design Studios), Solar Energy 197 (2020) 111-125. https://doi.org/10.1016/j.solener.2019.12.051
- I. Acosta, M. Á. Campano, and J. F. Molina, Window Design in Architecture: Analysis of Energy Savings for Lighting and Visual Comfort in Residential Spaces, Applied Energy 168 (2016) 493-506. https://doi.org/10.1016/j.apenergy.2016.02.005
- L. Gábrová, Comparison between Dynamic and Static Metrics for Daylight Evaluation in the Case of Obstructed Buildings, Applied Mechanics and Materials 861 (2016) 477-484. https://doi.org/10.4028/www.scientific.net/AMM.861.477
- C. E. Ochoa, M. B. C. Aries, E. J. van Loenen, and J. L. M. Hensen, Considerations on Design Optimization Criteria for Windows Providing Low Energy Consumption and High Visual Comfort, Applied Energy 95 (2012) 238-245. https://doi.org/10.1016/j.apenergy.2012.02.042
- K. Alhagla, A. Mansour, and R. Elbassuoni, Optimizing Windows for Enhancing Daylighting Performance and Energy Saving, Alexandria Engineering Journal 58 (2019) 283-290. https://doi.org/10.1016/j.aej.2019.01.004
- H. baş, Hybrid-Model Simulations to Equilibrate Energy Demand and Daylight Autonomy as a Function of Window-to-Wall Ratio and Orientation For a Perimeter Office in Izmir, MEGARON / Yıldız Technical University Faculty of Architecture E-Journal 15 (2020) 537-552. https://doi.org/10.14744/megaron.2020.42223
- T. Kazanasmaz, L. O. Grobe, C. Bauer, M. Krehel, and S. Wittkopf, Three Approaches to Optimize Optical Properties and Size of a South-facing Window for Spatial Daylight Autonomy, Building and Environment 102 (2016) 243-256. https://doi.org/10.1016/j.buildenv.2016.03.018
- D. A. Chi, An Approach to Determine Specific Targets of Daylighting Metrics and Solar Gains for Different Climatic Regions, Journal of Daylighting 8 (2021) 1-19. https://doi.org/10.1016/j.buildenv.2016.03.018
- R. A. Mangkuto, M. Rohmah, and A. D. Asri, Design Optimisation for Window Size, Orientation, and Wall Reflectance with Regard to Various Daylight Metrics and Lighting Energy Demand: A Case Study of Buildings in the Tropics, Applied Energy 164 (2016) 211-219. https://doi.org/10.1016/j.apenergy.2015.11.046
- P. Pilechiha, M. Mahdavinejad, F. Pour Rahimian, P. Carnemolla, and S. Seyedzadeh, Multi-objective Optimisation Framework for Designing Office Windows: Quality of View, Daylight and Energy Efficiency, Applied Energy 261 (2020) 114356. https://doi.org/10.1016/j.apenergy.2019.114356
- Y. Sun, Y. Wu, and R. Wilson, Analysis of the Daylight Performance of a Glazing System with Parallel Slat Transparent Insulation Material (PS-TIM), Energy and Buildings 139 (2017) 616-633. https://doi.org/10.1016/j.enbuild.2017.01.001
- A. A. S. Bahdad, S. F. S. Fadzil, and N. Taib, Optimization of Daylight Performance Based on Controllable Light-shelf Parameters using Genetic Algorithms in the Tropical Climate of Malaysia, Journal of Daylighting 7 (2020) 122-136. https://doi.org/10.15627/jd.2020.10
- A. A. Y. Freewan and J. A. Al Dalala, Assessment of Daylight Performance of Advanced Daylighting Strategies in Large University Classrooms; Case Study Classrooms at JUST, Alexandria Engineering Journal 59 (2020) 791-802. https://doi.org/10.1016/j.aej.2019.12.049
- R. Urbano Gutiérrez, J. Du, N. Ferreira, A. Ferrero, and S. Sharples, Daylight Control and Performance in Office Buildings Using a Novel Ceramic Louvre System, Building and Environment 151 (2019) 54-74. https://doi.org/10.1016/j.buildenv.2019.01.030
- R. P. Khidmat, H. Fukuda, B. Paramita, M. D. Koerniawan, and Kustiani, The Optimization of Louvers Shading Devices and Room Orientation under Three Different Sky Conditions, Journal of Daylighting 9 (2022) 137-149. https://doi.org/10.15627/jd.2022.11
- H. Özdemir and B. Y. Çakmak, Evaluation of Daylight and Glare Quality of Office Spaces with Flat and Dynamic Shading System Facades in Hot Arid Climate, Journal of Daylighting 9 (2022) 197-208. https://doi.org/10.15627/jd.2022.15
- E. Sorooshnia, M. Rashidi, P. Rahnamayiezekavat, F. Rezaei, and B. Samali, Optimum External Shading System for Counterbalancing Glare Probability and Daylight Illuminance in Sydney's Residential Buildings, Engineering, Construction and Architectural Management 30 (2021) 296-320. https://doi.org/10.1108/ECAM-03-2021-0191
- S. Samadi, E. Noorzai, L. O. Beltrán, and S. Abbasi, A Computational Approach for Achieving Optimum Daylight inside Buildings through Automated kinetic shading Systems, Frontiers of Architectural Research 9 (2020) 335-349. https://doi.org/10.1016/j.foar.2019.10.004
- C. Palarino and M. B. Piderit, Optimisation of Passive Solar Design Strategies in Side-lit Offices: Maximising Daylight Penetration while Reducing the Risk of Glare in Different Chilean Climate Contexts, Journal of Daylighting 7 (2020) 107-121. https://doi.org/10.15627/jd.2020.9
- X. Liu, Y. Sun, S. Wei, L. Meng, and G. Cao, Illumination Distribution and Daylight Glare Evaluation within Different Windows for Comfortable Lighting, Results in Optics 3 (2021) 100080. https://doi.org/10.1016/j.rio.2021.100080
- A. Maleki and N. Dehghan, Optimum Characteristics of Windows in an Office Building in Isfahan for Save Energy and Preserve Visual Comfort, Journal of Daylighting 8 (2021) 222-238. https://doi.org/10.15627/jd.2021.18
- I. Acosta, C. Munoz, M. A. Campano, and J. Navarro, Analysis of Daylight Factors and Energy Saving allowed by Windows under Overcast Sky Conditions, Renewable Energy 77 (2015) 194-207. https://doi.org/10.1016/j.renene.2014.12.017
- F. Kharvari, A Field-validated Multi-objective Optimization of the Shape and Size of Windows Based on Daylighting Metrics in Hot-summer Mediterranean and Dry Summer Continental Climates, Journal of Daylighting 7 (2020) 222-237. https://doi.org/10.15627/jd.2020.19
- Code 4 of Iran's National Building Regulations (General Building Requirements), Third ed., Iran, 2017.
- I. Turan, A. Chegut, D. Fink, and C. Reinhart, The Value of Daylight in Office Spaces, Building and Environment 168 (2020) 106503. https://doi.org/10.1016/j.buildenv.2019.106503
- BSI Standards Publication Light and lighting - Lighting of work places, Part 1 : Indoor Work Places, 2021. https://knowledge.bsigroup.com/products/light-and-lighting-lighting-of-work-places-indoor-work-places-2/tracked-changes (accessed Apr. 29, 2022).
- C. F. Reinhart, J. Mardaljevic, and Z. Rogers, Dynamic Daylight Performance Metrics for Sustainable Building Design, LEUKOS - The Journal of the Illuminating Engineering Society 3 (2006) 7-31. https://doi.org/10.1582/LEUKOS.2006.03.01.001
- Approved Method: IES Spatial Daylight Autonomy (sDA) and Annual Sunlight Exposure (ASE), New York, N.Y., 2012. https://infoscience.epfl.ch/record/196436?ln=en (accessed Jul. 10, 2022).
- Z. S. Zomorodian, S. S. Korsavi, and M. Tahsildoost, The Effect of Window Configuration on Daylight Performance in Classrooms: A Field and Simulation Study, International Journal of Architectural Engineering & Urban Planning 26 (2016) 15-24.
- H. M. T. El Daly, Automated Fenestration Allocation as Complying with LEED Rating System, Alexandria Engineering Journal 53 (2014) 883-890. https://doi.org/10.1016/j.aej.2014.09.011
- E. Brembilla and J. Mardaljevic, Climate-Based Daylight Modelling for Compliance Verification: Benchmarking Multiple State-of-the-art Methods, Building and Environment 158 (2019) 151-164. https://doi.org/10.1016/j.buildenv.2019.04.051
- C. H. Lin and Y. S. Tsay, A Metamodel based on Intermediary Features for Daylight Performance Prediction of Façade Design, Building and Environment 206 (2021) 108371. https://doi.org/10.1016/j.buildenv.2021.108371
- LEED v4.1 Building Design and Construction, 2021. https://www.usgbc.org/leed/v41 (accessed Apr. 29, 2022).
- S. M. Hosseini, M. Mohammadi, and O. Guerra-Santin, Interactive Kinetic Façade: Improving Visual Comfort based on Dynamic Daylight and Occupant's Positions by 2D and 3D Shape Changes, Building and Environment 165 (2019) 106396. https://doi.org/10.1016/j.buildenv.2019.106396
- A. Nabil and J. Mardaljevic, Useful Daylight Illuminances: A Replacement for Daylight Factors, Energy and Buildings 38 (2006) 905-913. https://doi.org/10.1016/j.enbuild.2006.03.013
- IES Lighting Measurements (LM) 83-12, Approved Method: IES Spatial Daylight Autonomy (sDA) and Annual Sunlight Exposure (ASE) | U.S. Green Building Council. https://www.usgbc.org/resources/ies-lighting-measurements-lm-83-12-approved-method-ies-spatial-daylight-autonomy-sda-and (accessed Jul. 10, 2022).
- Daylight Metrics : PIER Daylighting Plus Research Program: Final Project Report. https://www.researchgate.net/profile/Lisa-Heschong/publication/328965606_DAYLIGHT_METRICS_REPORT_for_the_CEC_PIER_Daylighting_Plus_Research_Program/links/5bed9e694585150b2bb9fcb3/DAYLIGHT-METRICS-REPORT-for-the-CEC-PIER-Daylighting-Plus-Research-Program.pdf (accessed Sep. 11, 2022).
Copyright © 2023 The Author(s). Published by solarlits.com.

4554
Total views
Citations
SHARE ON


