Volume 10 Issue 1 pp. 45-59 • doi: 10.15627/jd.2023.4
Evaluation of Occupants’ Visual Perception in Day Lit Scenes: A Virtual Reality Experiment
Maedeh Sadat Mirdamadi,⁎ Zahra Sadat Zomorodian, Mohammad Tahsildoost
Author affiliations
Department of Architecture and Urban planning, Shahid beheshti University, Tehran, Iran
*Corresponding author.
m.mirdamadi@alumni.sbu.ac.ir (M.Mirdamadi)
m_tahsildoost@sbu.ac.ir (M. Tahsildoost)
z_zomorodian@sbu.ac.ir (Z. S. Zomorodian)
History: Received 29 January 2023 | Revised 14 March 2023 | Accepted 20 March 2023 | Published online 09 April 2023
Copyright: © 2023 The Author(s). Published by solarlits.com. This is an open access article under the CC BY license (http://creativecommons.org/licenses/by/4.0/).
Citation: Maedeh Sadat Mirdamadi, Zahra Sadat Zomorodian, Mohammad Tahsildoost, Evaluation of Occupants’ Visual Perception in Day Lit Scenes: A Virtual Reality Experiment, Journal of Daylighting 10 (2023) 45-59. https://dx.doi.org/10.15627/jd.2023.4
Figures and tables
Abstract
Daylight improves indoor environmental quality, the physical and mental health of occupants, and their efficiency. Research in the area of human-centric lighting that considers the visual and non-visual effects of light on human vision, have focused on examining human visual perception in response to a wide variety of lighting aspects. To investigate the effect of surface materials, window size, and shading patterns on participants’ evaluation of brightness, daylight distribution, contrast, and satisfaction with view, a virtual reality experiment is implemented in a university classroom. Moreover, responses are compared with metrics (i.e., RAMMG and illumines level) to evaluate their performance and robustness. Thirty-three subjects evaluated thirteen immersive virtual environments (IVEs) with different glazing visible light transmittance, reflectance coefficient of surfaces, window to wall ratio, number of windows, and shading geometry using a Likert-type scale survey. The results indicated that participants’ evaluation of brightness is influenced by reflection coefficient of the surfaces and WWR. While daylight distribution is affected by number of windows and shading geometry in addition to other studied parameters. Based on the subjects’ responses the contrast is only affected by reflection coefficient of the surfaces. Their satisfaction with amount of outside view is also influenced by WWR and number of windows. Moreover, based on statistical results defining a specific range of acceptable contrast based on the RAMMG metric is not suggested, and users' evaluation depends on the surface material in addition to the reflection coefficient of them. Furthermore, the level of lighting perceived by people is affected by materials and their color (beside the reflection coefficient of the surfaces), number of windows (even with similar WWR), and shading pattern (even with the same aperture ratio) as well as the glazing visible light transmittance.
Keywords
Virtual reality, Daylight perception, Material, Metrics
1. Introduction
Daylight has a profound effect on architectural design, energy consumption, occupant comfort and experience of space. People’s preference to access daylight and view has been acknowledged by several researchers [1,2]. Based on studies daylight exposure and sunlight penetration which are defined by the window size, the time of day and the season of the year, influence the occupants’ mood, alertness, stress levels, and well-being [3-5] in a wide range of spaces, including offices [6-8], schools [9], and residential buildings [10]. Human-centric lighting that considers the traditional elements of lighting quality that are rooted in human vision while simultaneously incorporating new insights about the non-visual effects of light, has been highlighted in many studies. Research in this area have focused on examining human perception in response to a wide variety of lighting aspects [11]. According to studies designers must consider brightness as a combination of light and shadow to provide visually attractive spaces. Non-uniformity of light in space is proved to be more interesting than uniformity of light in space [12]. Some studies have also assessed the effect of material properties and the glazing’s visual transmittance on occupants' satisfaction and perception of space size [13-14]. Based on studies, material properties or luminance in the space affect the dimensions of the room perceived by people and the high contrast at the edges helps the human visual system to evaluate the dimensions of the room correctly [15,16]. In addition, regarding the amount of view, occupants prefer larger windows (with the width, rather than the height) [17-19]. In two studies [20,19], it is indicated that windows should occupy at least 20% to 30% of the window wall and what can be seen from the window is important in investigating occupants’ satisfaction with the window [2].
Daylighting in educational spaces requires particular attention especially in classrooms. It is necessary to provide a well-lit environment that enables students and staff to carry out their tasks comfortably and adequately in attractive and stimulating surroundings [21]. A suitable window design in the classrooms reduces students stress and their absences due to their illness, increases students’ performance, and improves their growth [22]. According to studies both sufficient natural sunlight and/or dynamic lighting systems and a better view of outside from the window in the classroom improves learning performance, alertness, cognitive skills, behavior, mood, circadian rhythm, vocal strength, and productivity [23].
Daylight design is a complicated problem, and designers need to better understand how daylighting strategies affect building occupants. Based on literature review, well-performing daylight models and metrics may not always equate to positive user experience and it is crucial for designers to understand daylighting strategies and corresponding human perceptions of comfort. Especially in educational buildings, where there is a lack of studies on design parameter affecting occupant’s visual perception [24,25]. Using real spaces to assess users' perception is complicated to manipulate specific variables while controlling others in addition to problems such as daylight changes during the day and seasons [26,27]. Due to the problems in the real experiments, several alternate methods have been proposed, including slides [28], rendered images [29], stereoscopic images [30] and virtual reality (VR) [31,32] as a surrogate to real spaces in empirical studies. VR has created opportunities to study human behavior in novel ways and is used in this study for assessing design parameters on occupant’s visual perception in classrooms.
1.1. Literature review
VR technology is a suggested solution for the limitations of daylight studies [33,34], often used for empirical studies in laboratories to assess the visual preferences of participants in controlled conditions. The accuracy in simulating physical environment and its capability in providing a reliable method for presenting the physical space to users are proven by researchers [31,35-39]. Bellazza et. al (2022) classified and reviewed previous studies highlighting the advantages and disadvantages related to the use of VR for lighting research and design, through a systematic review [11]. Previous daylighting studies using VR could be divided in four groups based on their objectives:1) Evaluation of using VR in daylighting research, 2) Changing space features and assessing user’s perceptions, 3) Comparing participants' assessment of the space with daylight indices, and 4) Integrating VR and daylight simulation engines.
Participants’ subjective and objective visual responses and participants' interaction with the virtual environment have been studied vastly [32,40,41]. Subjective assessments included questions on luminous environment appearance (brightness, color-temperature, distribution, contrast, …), high-order perceptions (pleasantness, interest, spaciousness, excitement and complexity, …) [35,36,42] and perceived presence in the virtual and real space [31]. Objective assessments included physical symptoms (headache, dizziness, vision problems, etc.) and doing some tasks to assess visual performance across the two representation environments [35]. These studies showed that VR has a strong potential to be used as an empirical research tool in psychological and architectural research in comparison with other methods [32]. Most of the studies conducted experiments with 20–50 participants [11].
In other studies VR was used to assess occupants’ perception and behavior in different spaces which are divided in three categories [43]:
- analyzing people’s perception of the visual environment considering different parameters (e.g., multiple façade patterns, sky type, and window size) [39,44-48],
- assessing the correlation between lighting temperatures and occupants’ thermal perception [49,50] and
- analyzing users behavior in different conditions of light and control systems [51-53].
In recent years, utilizing Augmented Reality (AR), Mixed Reality (MR) ,and VR have been increased in building science to make complex building information more comprehensible . In a recent study, these Extended Reality techniques are developed to determine which technology is the most suitable for reviewing performance-based building design. Façade fenestration geometries and indoor illuminance simulations were assessed by 120 students and architects with task performance and engagement level. The authors resulted MR is more suitable than AR and VR for the aim of the study [54].
Castilla et al. (2023) investigated the effects of different illuminance conditions in a classroom on university students’ memories in VR. Forty subjects performed a psychological memory task in three environments with 100, 300 and 500 lux illuminance levels. Based on neurophysiological responses, their performance got worse and their neurophysiological activation decreased with increasing illuminance [55].
Occupants’ perceptions of daylight in space is influenced by two dominant factors; mean luminance and luminance variation in the field of view [56]. Luminance distribution in the field of view is a motivator for a satisfying daylit environment and it creates a stimulating and interesting environment [57] . Although this is an important issue in lighting research, measuring luminance in real spaces has limitations. Therefore, VR has been used to investigate the effect of luminance distribution on people's perception. In this regard, Rockcastle et al. (2017) conducted an experiment using VR headset to examine the users’ subjective evaluations of rendered daylit architectural scenes. The subjective evaluation of users was compared with algorithms, designed to predict the attractiveness of space in the field of view by changing the sky type and view directions from a fixed view position. The findings revealed a dependency between visual interest impressions and quantitative predictors [46].
In another study, Chamilothori et al. (2019) investigated the effect of façade and sunlight pattern geometry on occupant’s subjective perception and physiological responses in VR. An irregular, regular shadings and blinds with clear skies and the penetration of direct light in two different scenarios have been studied. Façade and sunlight pattern geometry significantly influenced subjective responses for both context scenarios. Façade and sunlight pattern geometry affected heart rate responses, but not skin conductance responses [45,44]. Moreover, Hong et al. (2019) compared the participants’ perceptual responses in the physical and virtual office spaces and then investigated the effect of window size on user’s satisfaction using VR. The results of this study showed that there was no significant difference in occupant’s responses between physical and virtual spaces. Besides, the participants expressed a significantly higher visual satisfaction, inner space, and openness with higher WWRs (i.e., 30%, 45%, and 60%) [39]. In the same vein, the effect of physical properties of the space on users’ perception have been investigated in some studies. For instance, Moscoso et al. (2020) showed that creating a pleasant, attractive, bright and spacious space and a sufficient amount of view, depends on window size. However, the size of the window depends on other factors such as the size of the space, especially to create a good view [47].
Omidfar and Chamilothori (2019) used VR to examine the effect of changing the sunlight pattern geometry, rendering materials and furniture on people's visual satisfaction. Result showed that there is a strong correlation between participants’ satisfaction with brightness and other perceptual attributes. Also, the effect of furniture on brightness satisfaction was not statistically significant, but colored materials had a significant effect on participants’ satisfaction with brightness [46]. While based on Chamilothori et al. (2022) among different parameters (i.e., façade geometry, sky type, spatial context and country), the participants’ subjective impressions is only affected by façade geometry [58].
1.2. Research gap and objectives
Based on the literature review, occupants’ preference regarding artificial or natural light, window direction, WWR, spatial context, shading geometry, sky condition, material properties, and size of space in VR experiments are assessed mostly in working environments and less attention has been paid to educational spaces. This paper, presents a high accuracy and fast method for simulating virtual environments in comparison to previous studies by using the V-Ray in 3Ds Max for rendering daylight scenes to evaluate the effect of design parameter on user's visual perception in an educational space in Tehran, Iran. Besides statistical analysis of participants’ answers, participants’ evaluation of space contrast and brightness have been compared with the RAMMG and illuminance indices.
The rest of the paper is organized as follows: The second section gives an overview of the methodology starting with the process of simulating VR scenes and followed by experimental procedure and statistical analysis method. Afterwards, the results, limitations and suggestions for future research are discussed and presented in section 3. The last section serves the conclusion and discusses research implications.
2. Methodology
The method in this study consists of three main steps: modeling and validation, the VR experimental design, and the statistical analysis (Fig. 1). The following sections provide detailed explanations of each step.
Figure 1
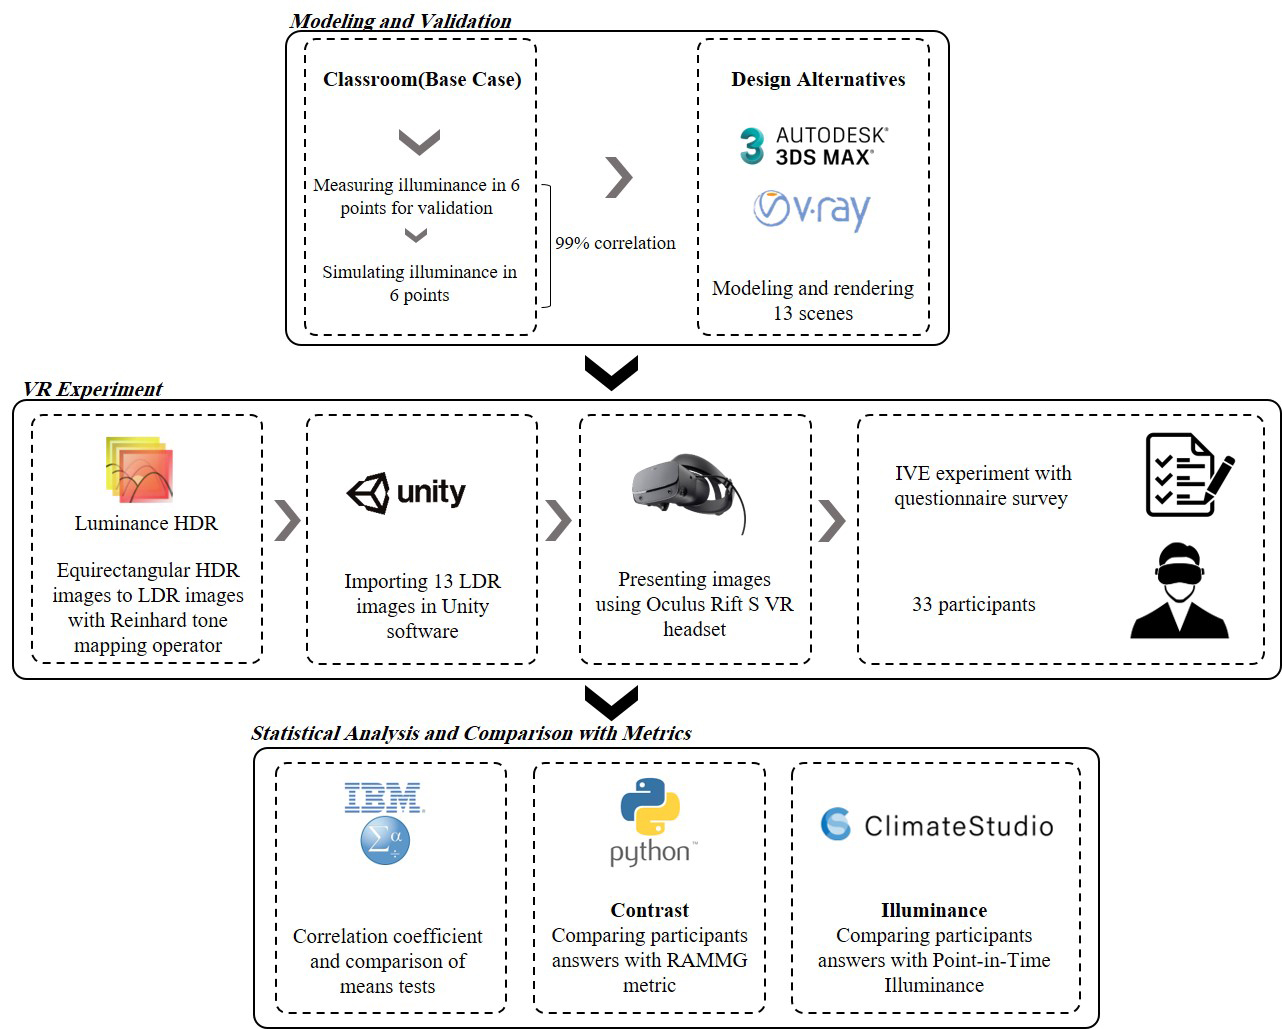
Fig. 1. Illustration of the methodological approach in the study.
2.1. Modeling and validation
The studied space is a classroom (6.5×7.5 and 3.5 m height), with 45% WWR (on the southern wall) and 0.5 m light shelf (Fig. 2) in Faculty of Architecture at Shahid Beheshti University (SBU) campus in Tehran, Iran, 35480 19.5"N and 51230 38.0"E.
Figure 2
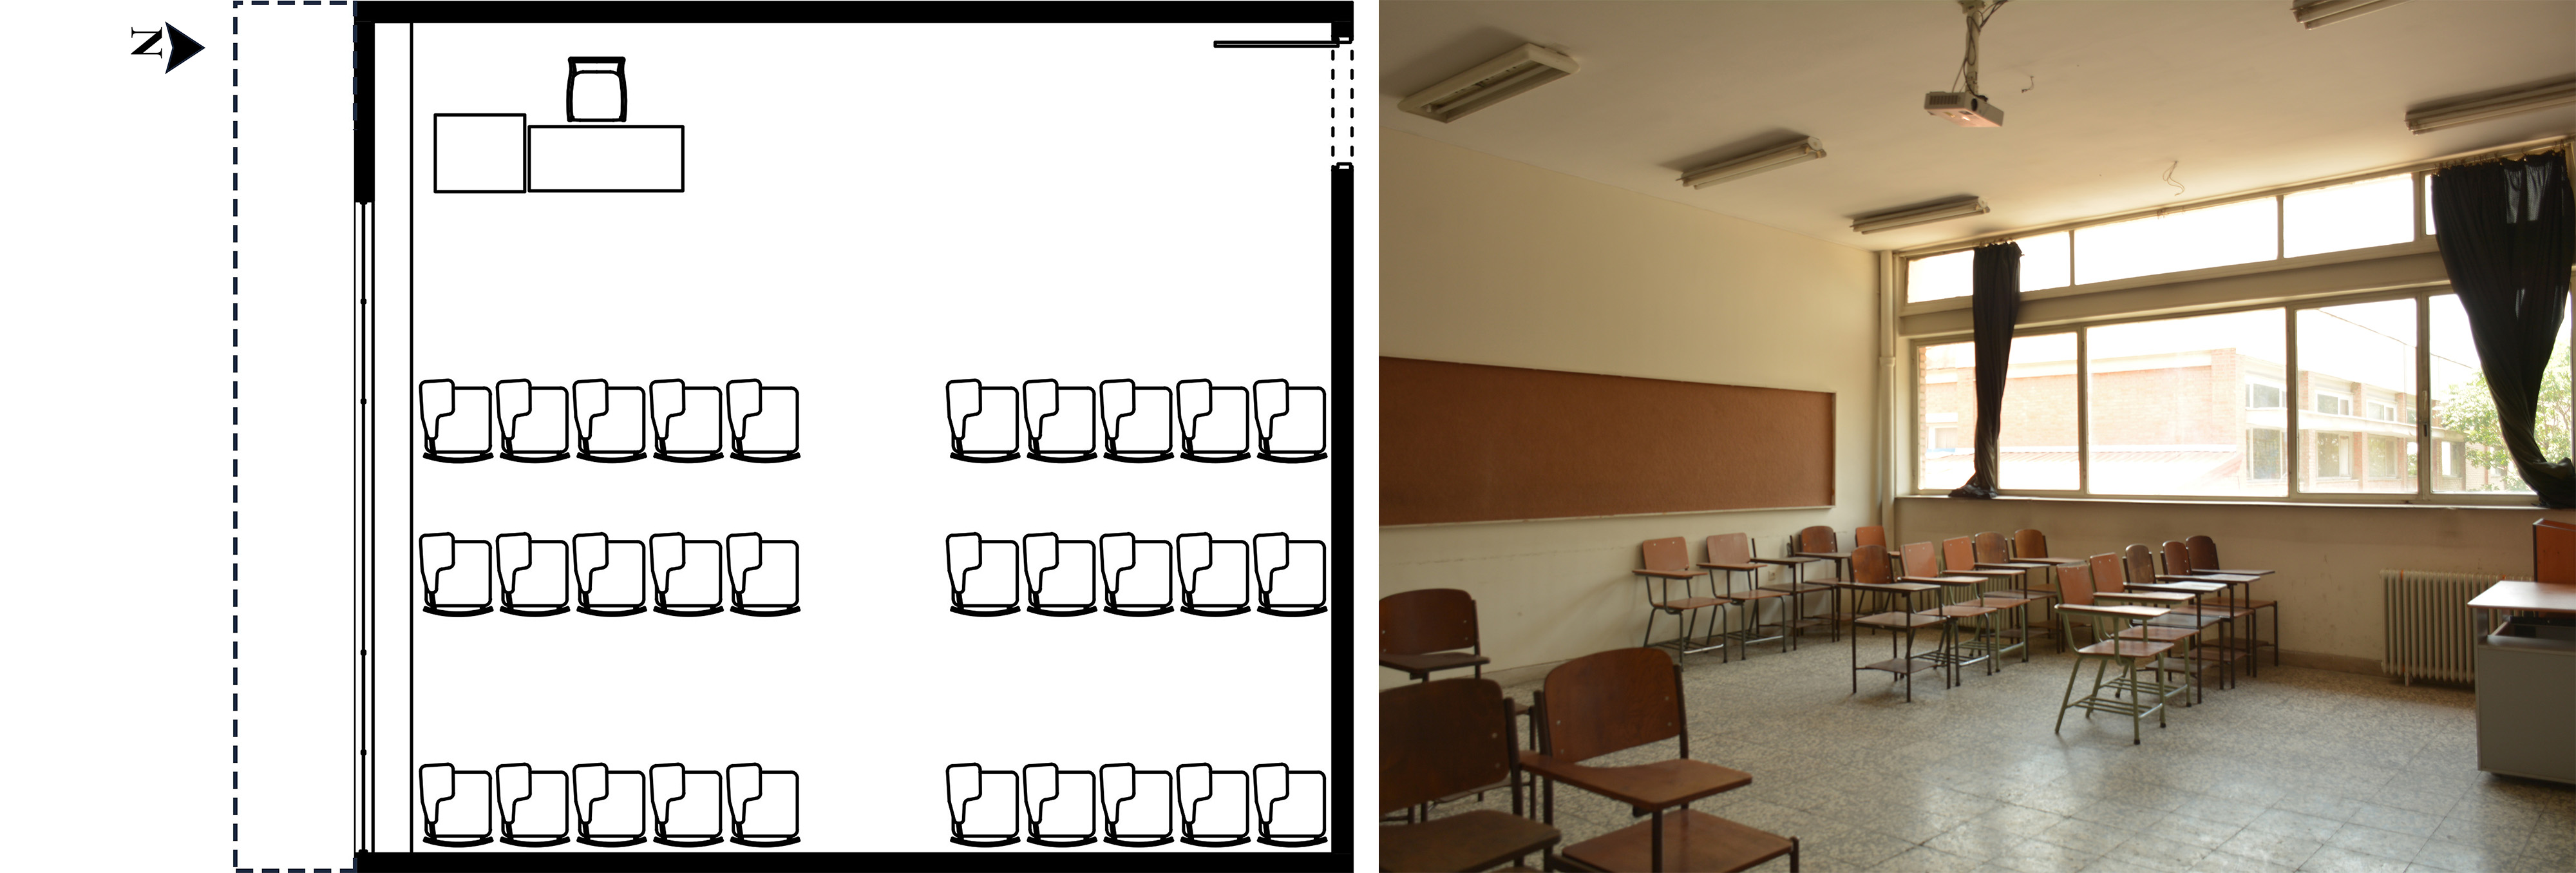
Fig. 2. The classroom in Shahid Beheshti University - the real environment that is the basis to the simulated spaces shown in VR.
To simulate the classroom environment with high accuracy, materials and the colors of all the surfaces in the class were measured and registered using TES-1332A lux meter and then used to derive the surfaces’ reflectance and glazing visible light transmission in VRAY, shown in Table 1. To determine that the simulated scene is similar to the real class, the illuminance values of the classroom were measured using TES- 1332A at 6 different points 0.78 m above the floor at 11 A.M on June 7th. The illuminance values in a grid of 15 x 23 points (6 x 7 square meters), were simulated using the "V-ray lighting meter" tool at a height of 0.78 cm above the floor. The correlation coefficient of the measured and simulated values in these six points is 0.99, which shows that virtual environment is an appropriate representation of the physical one.
Table 1
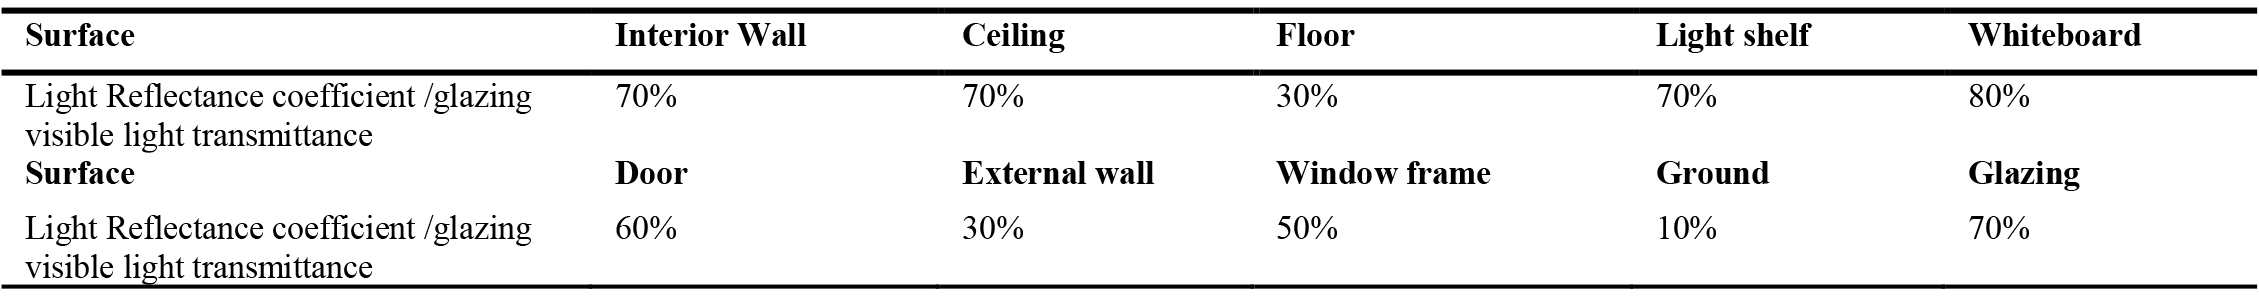
Table 1. Material properties of the classroom.
2.1.1. Design alternatives
Glazing visible light transmission, WWR, number of the windows, the surfaces reflectance (floor, ceiling, wall, furniture), and the shading patterns are selected as design variables resulting in thirteen design alternatives to investigate their effect on the lighting level, light distribution and perceived contrast, brightness preference and the view satisfaction. The studied variables are presented in Table 2.
Table 2
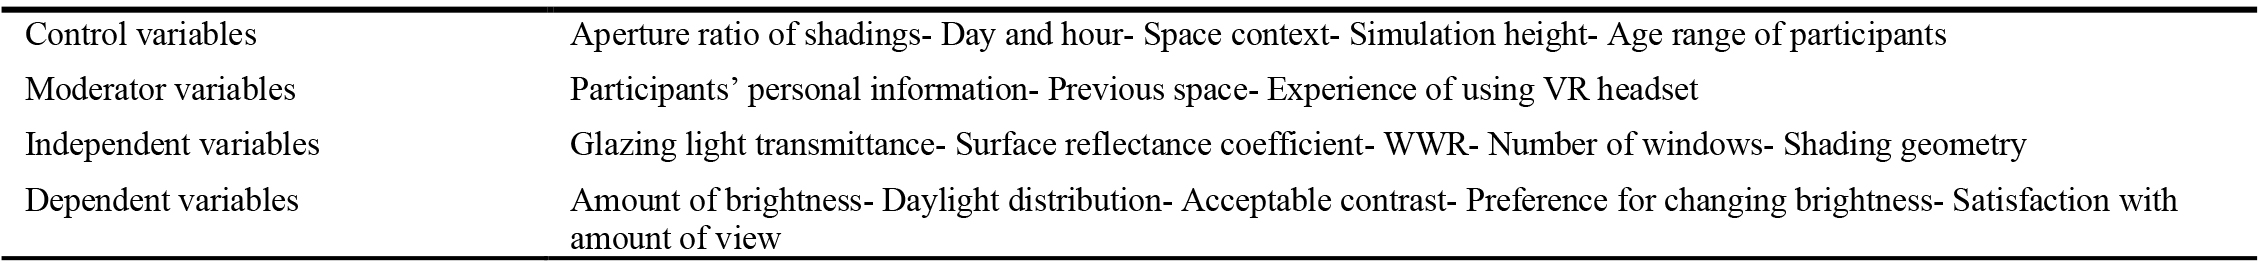
Table 2. Variables in this study.
The reflection coefficients of surfaces included three levels: low (*), medium (**) and high (***) as presented in Table 3. Models are defined by considering three materials (i.e., mosaic concrete, wood and ceramic) for the floor and two materials (i.e., wood and plastic) for the desks. The classroom is modeled with three WWR (i.e., 30%, 45% (real environment) and 60%).
Table 3
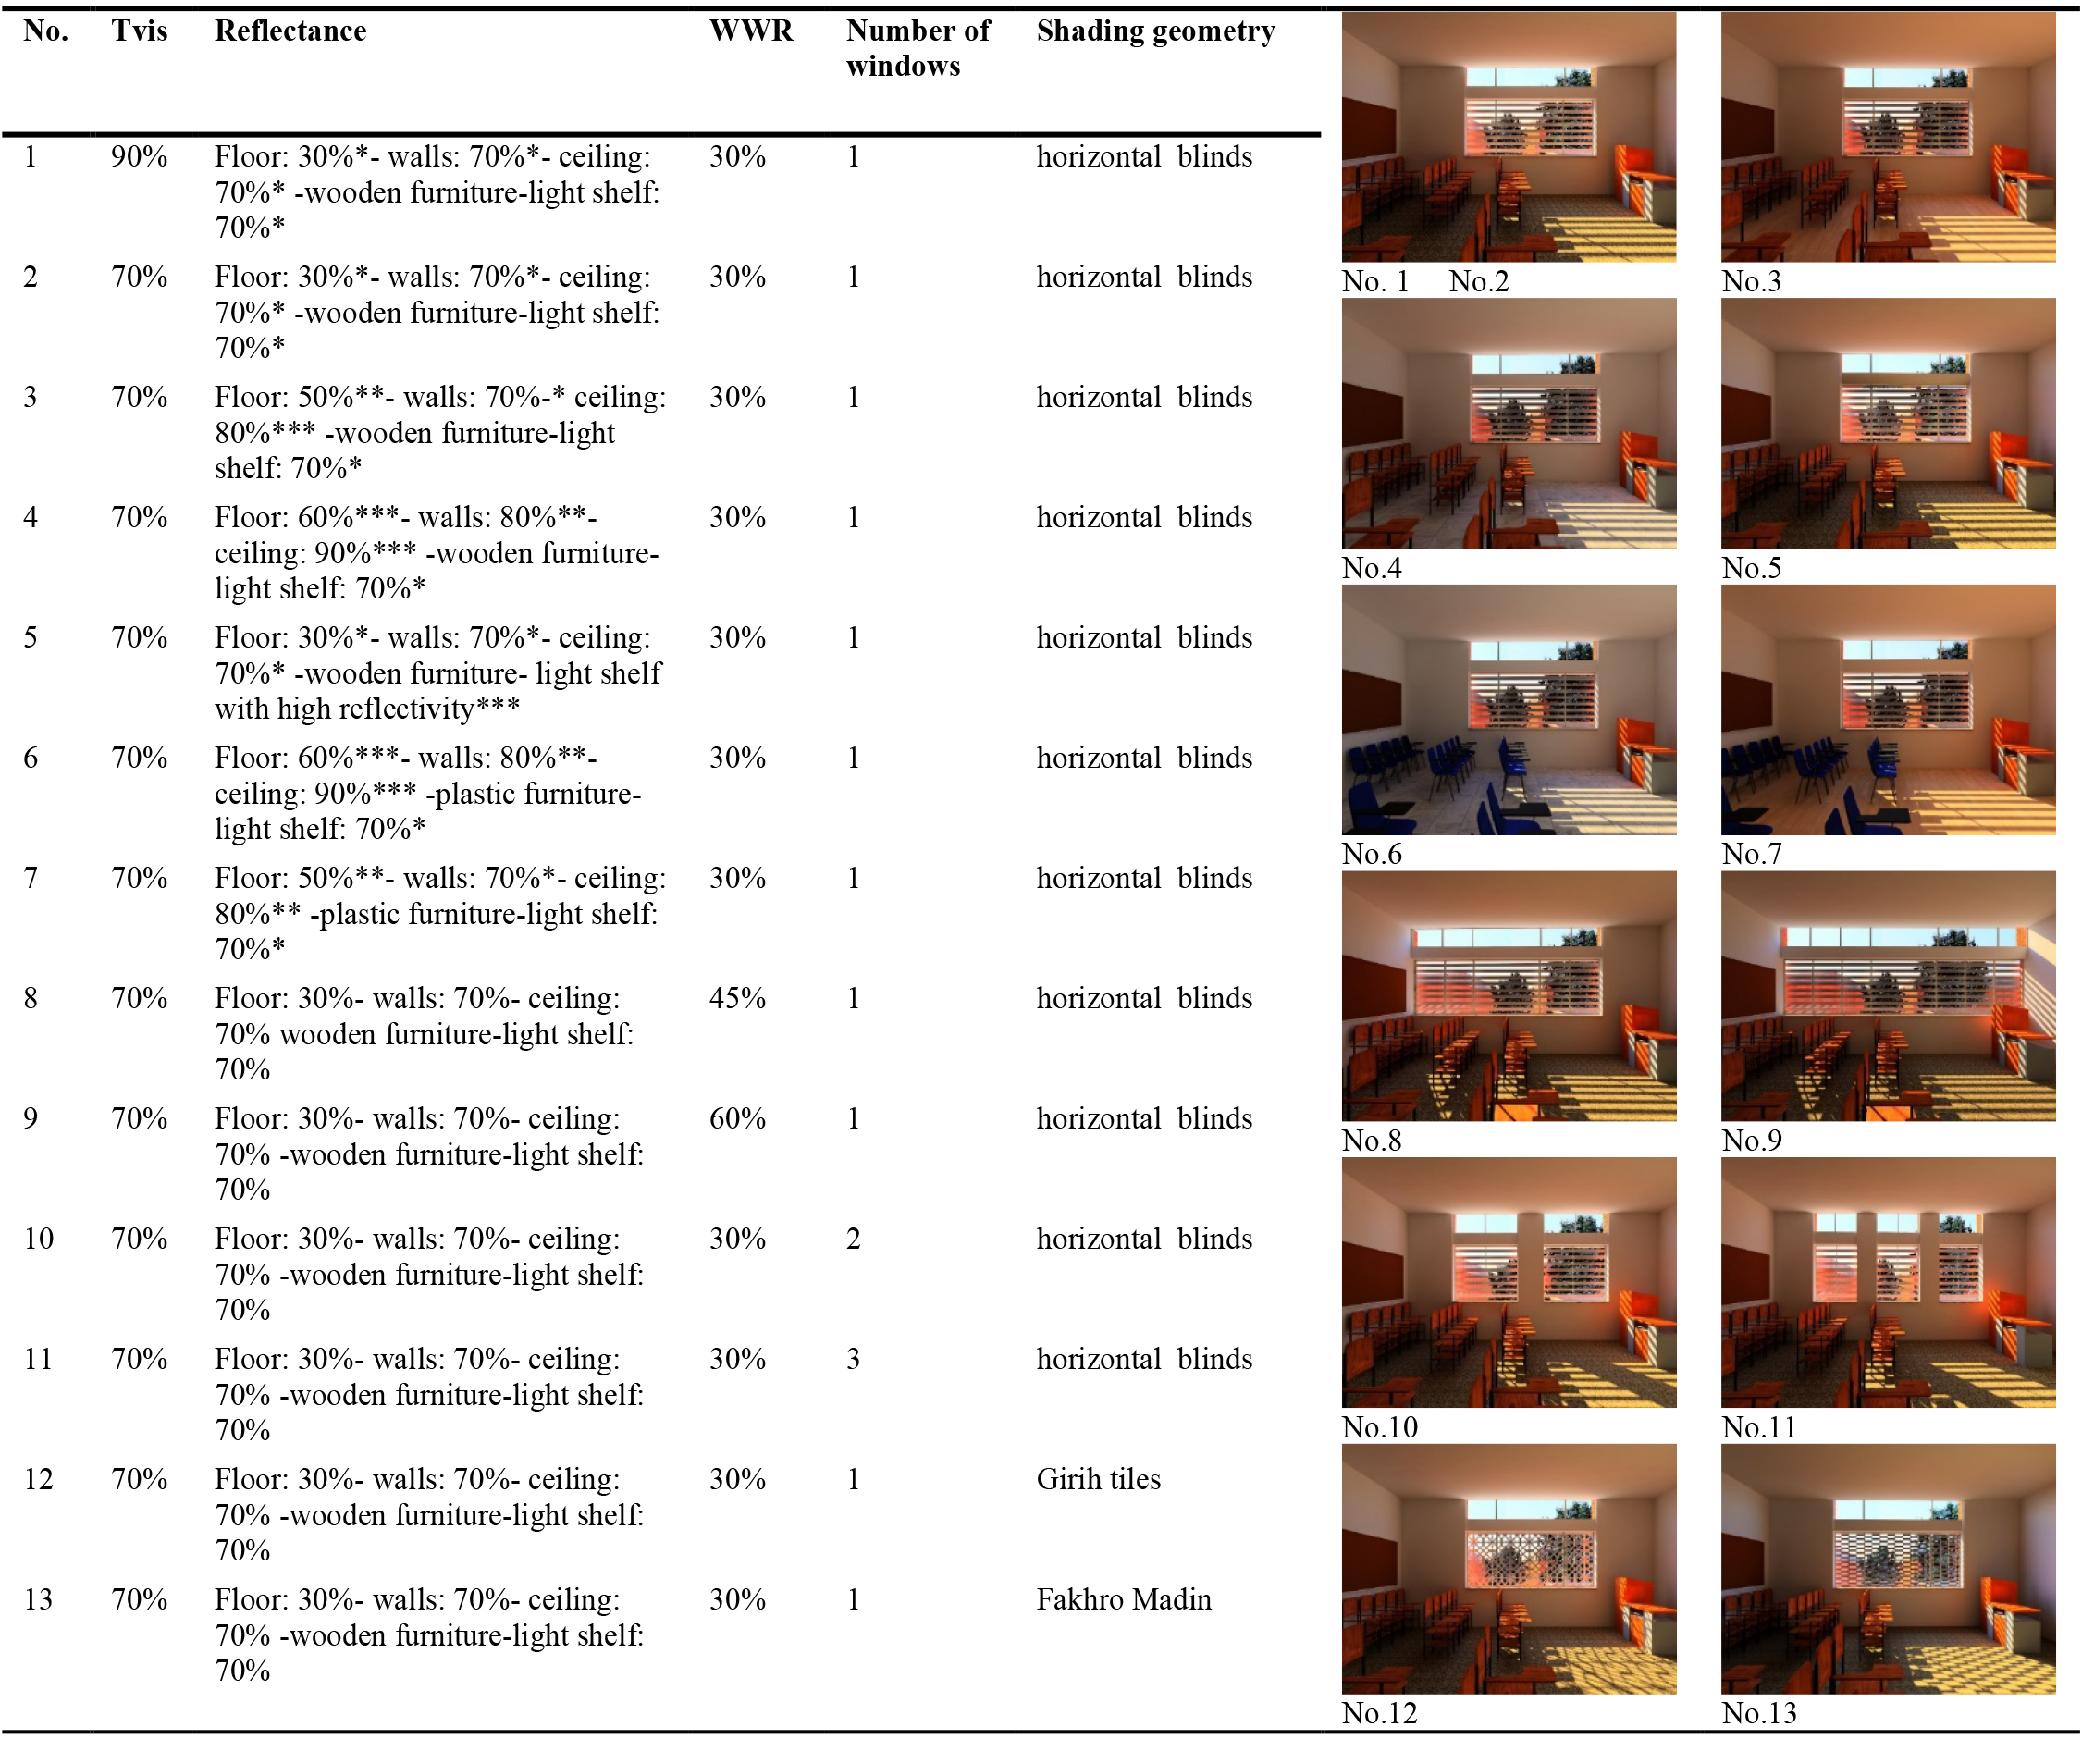
Table 3. 13 models rendered for 360 immersive scenes for projecting in VR- surfaces’ reflection coefficient: low(*), medium(**) and high(***).
Seventy samples of building facades, which have been built in Iran since 2001, were collected to select and model shading geometry in this study. Based on the samples, the three geometries of the horizontal Louvre, Fakhro Madin and Girih tiles, which are commonly used as traditional Iranian architectural pattern, are considered (Fig. 3). The aperture ratio of shadings is considered 50% (± 2%) of the glazing area and the height of the camera 150 cm above the finishing floor. Consequently, thirteen different daylit scenes are defined as presented in Table 3. The daylight scenes are simulated at 10 A.M on December 21 and the sky is clear with sun in all samples.
Figure 3
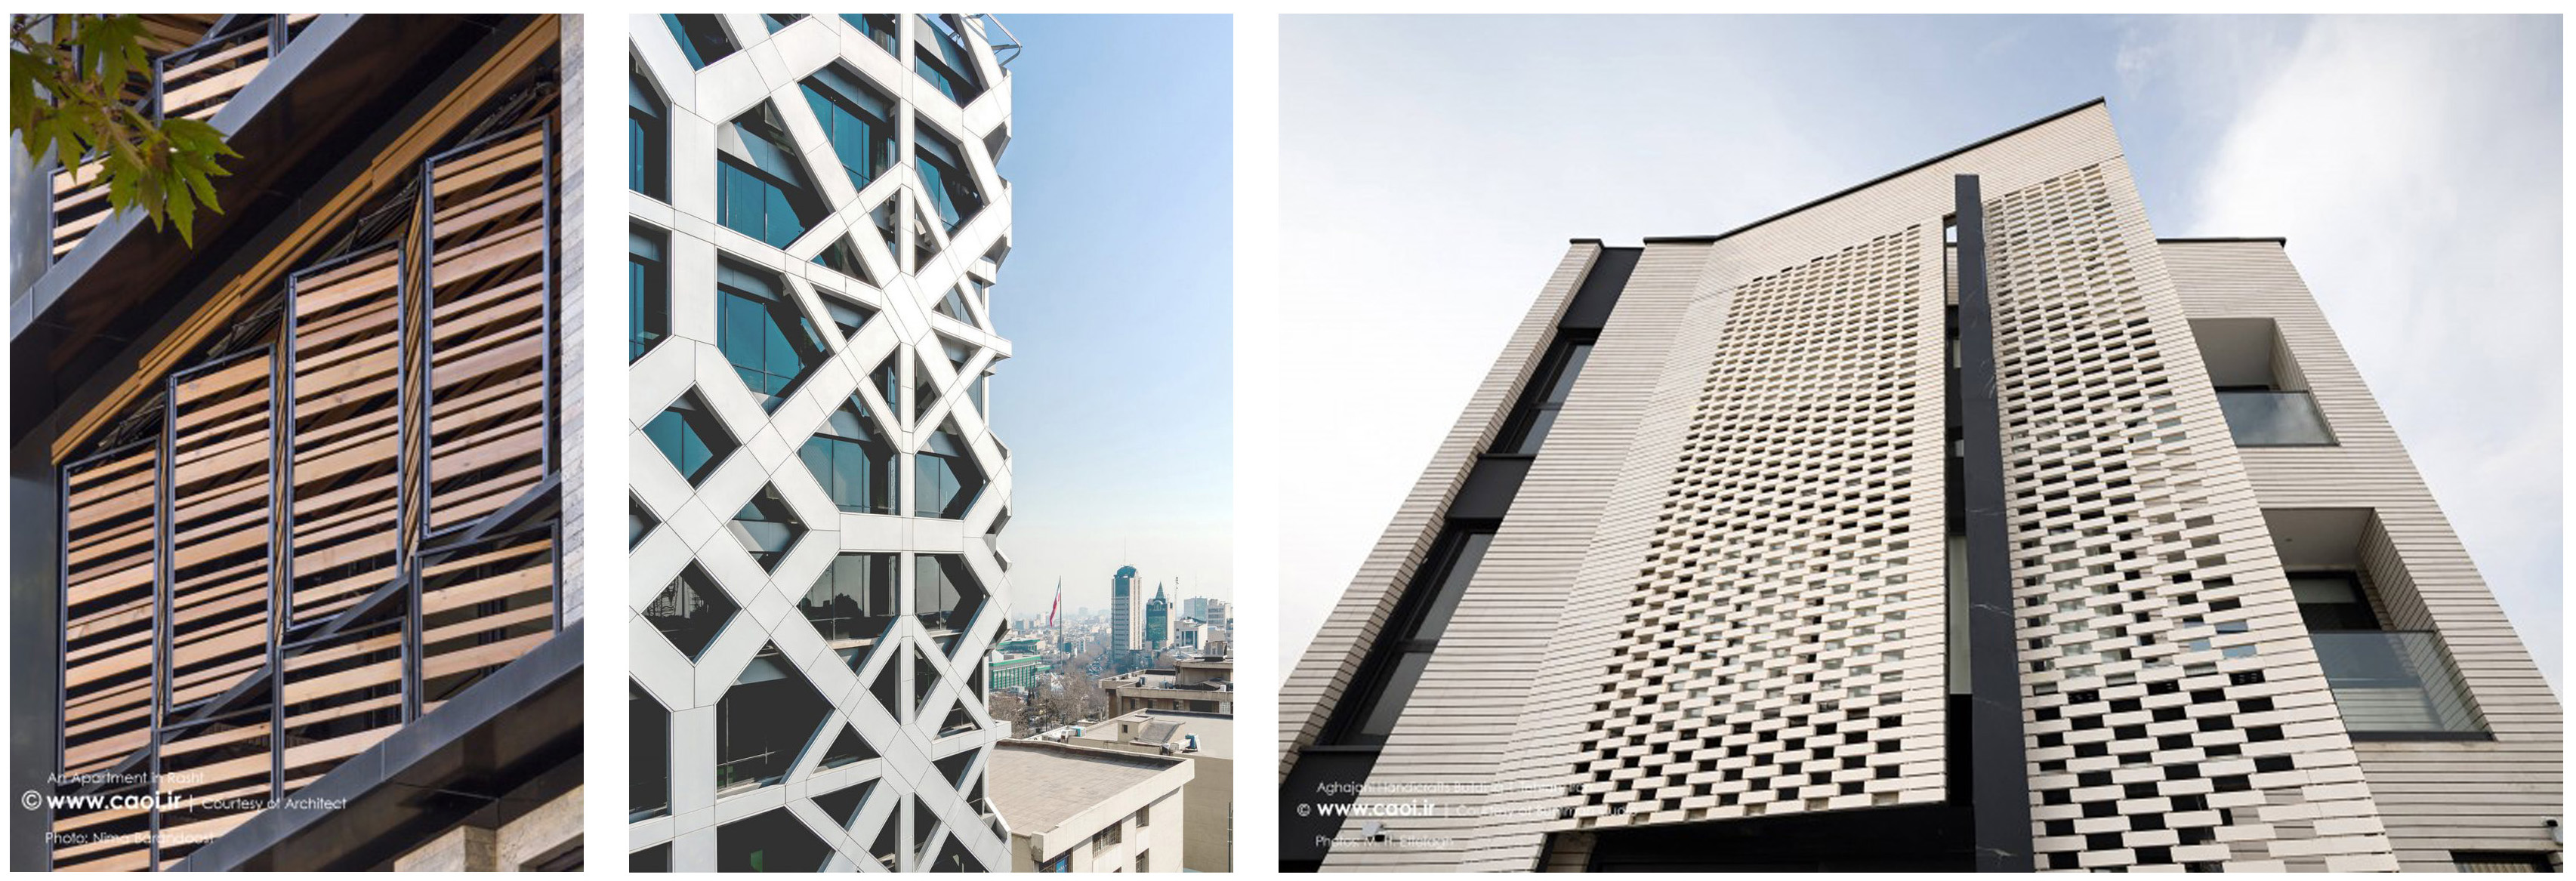
Fig. 3. Left: Horizontal Louvre Shading (An apartment in Rasht, Gilan)- Middle: Girih tiles shading (Alvand office building, Tehran)- Right: Fakhro Madin shading (Aghajani Handicraft central building, Tehran) - www.caoi.ir, www.archweb.ir.
2.1.2. Simulation procedure
The class is modeled in 3D Max 2020 and V-ray 5 software is used for the daylight simulations. Since the daylight setup is not supported in V-Ray 5, a single V-Ray Light type dome is set. The Dome’s texture is set to Physical Sun and Sky Environment map which is being calculated with the weather file placed in a Sun Positioner helper. The Dome texture resolution is increased to its maximum (8192) for most accurate sampling of the texture [59]. To simulate the space in V-Ray, the reflection coefficient of wall, ceiling and door surfaces is adjusted using color mapping on materials based on previous studies [59,60]. Furthermore, texture images are used for the floor, the board on the wall, and the chairs and the teacher's desk, while their reflection coefficients are adjusted through modelling a pair of simple similar rooms with and without texture in 3ds Max. The visible light transmission of the glass is also defined in V-Ray software using its light refraction value.
The center point of the class is selected for 360° stereoscopic simulations and displaying on the headset. The images’ resolution is set 4000×8000 pixels, and the spherical camera is selected. The primary engine for Global Illumination (GI) is the irradiance map and the secondary engine is light cache. Other settings are presented in Table 4. The simulations are performed on a system which is supported by an Nvidia GeforcGTX 1060, 6 GB GPU1. Each simulation lasts about three to four hours.
1 Intel(R) core (TM) i7- 8700 CPU-3.2 GHz.3.19 GHz, installed memory 8 GB.64 bit.
Table 4

Table 4. V-Ray rendering settings.
2.2. Virtual reality (VR) experiment
Due to the limited range of luminance of the VR display, the resulting HDR (High Dynamic Range) images should be converted to LDR (Low Dynamic Range) format. The image reproduction method proposed by Reinhard (2002) [61] has shown the most realistic, detail expression in bright spaces, space perception, and luminous contrast images in [45,62]. According to these studies, in the present research, Reinhard 2002 operator is used to convert HDR images to LDR using Luminance HDR software with the gamma correction factor of 2.2 and key value of 0.54.
Thirteen simulated images are converted to LDR using Luminance HDR software and imported into Unity 2019.3 (unity 2019.3.14f1) software. Each 360-degree image is set and saved as the sky background in Unity software and displayed in VR headset (Fig. 4). The VR headset used (Oculus Rift S) has an LCD display with a 2560 × 1440-pixel, with a refresh rate up to 80 Hz.
Figure 4
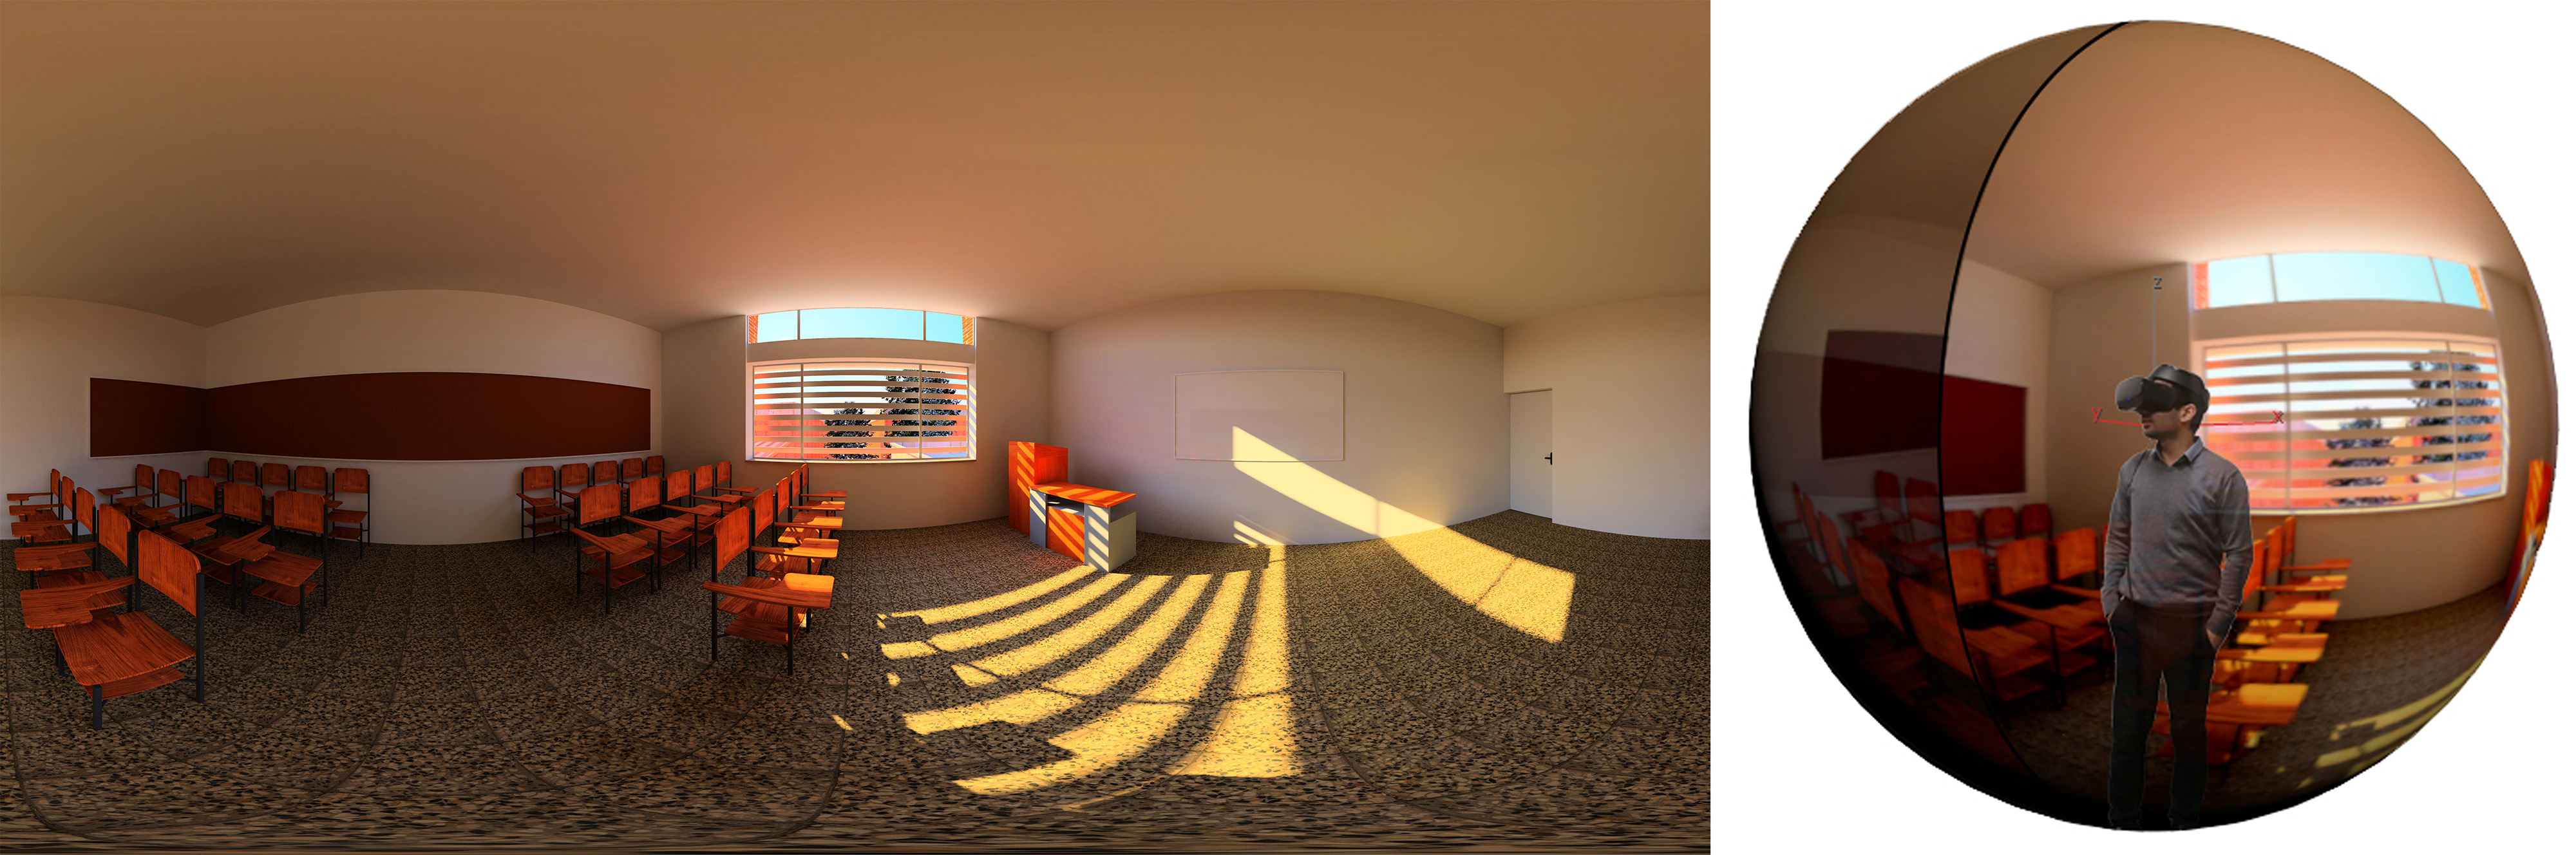
Fig. 4. Equirectangular image applied as the sky background in the software Unity to create 360 immersive scene- model No.2.
The questionnaire can be divided into two parts. The first part is filled by the participants and the second part is asked orally by the researcher. In the first part of the questionnaire, personal information included age, gender, level of education, field of study, the previous environment (in which they were before the test) and their familiarity with VR headset were asked. The participants’ visual evaluation of lighting in the space including contrast, brightness, lighting distribution, changing the brightness and the satisfaction with the view are asked in the second part of the questionnaire (Table 5). Verbal questionnaires have been used in experiments using VR headsets in previous studies[31,47,49]. The questions were bipolar ratings with 10-point scale (1 corresponding to not at all and 10 corresponding to very much) and were based on the studies conducted in the field of "perception and evaluation of environment lighting by people” [25,31,36,35,46,63-67].
Table 5
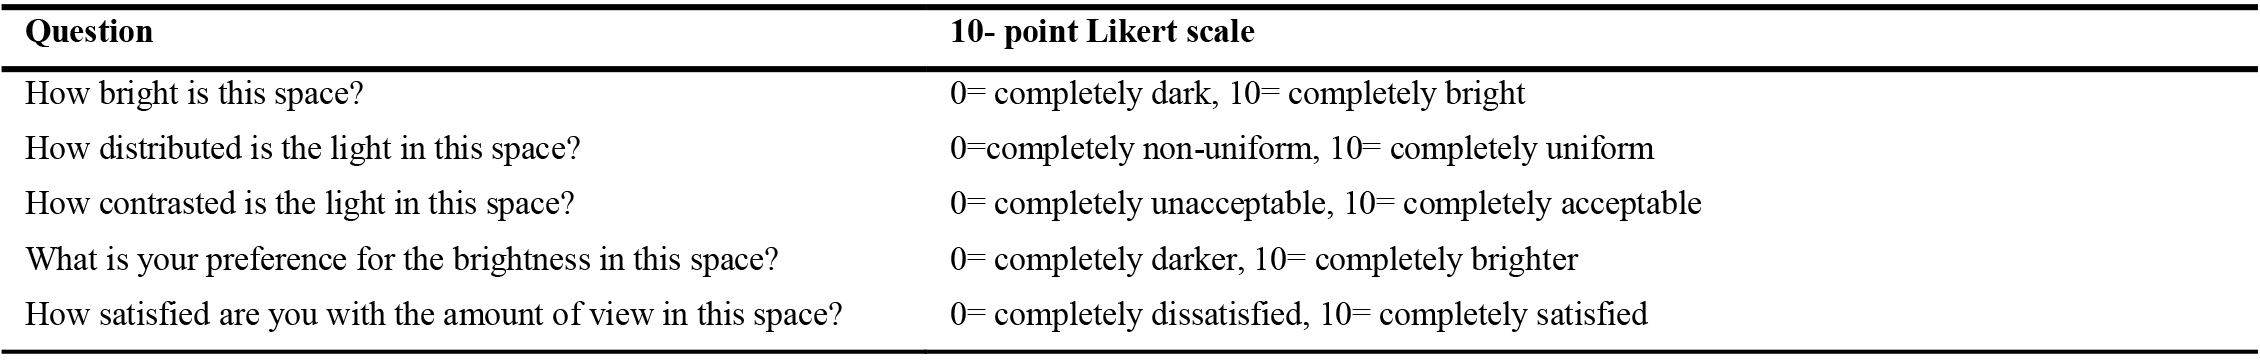
Table 5. The verbal questionnaire.
The experiment is conducted in the VR laboratory in Shahid Beheshti University on November 11-19, 2020. Five students took part in a pilot experiment to investigate the comprehensibility of the questionnaire and some changes were made in the order of the questions. The participants were invited via posts on social media groups and verbal invitations and they were volunteers. The initial total sample size was considered 40 according to the number of sample size in similar studies[31,35,36,38,68,69]. Due to the limitations of the research during COVID-19, the test was conducted with the 33 people (13 women and 20 men).
The age range of participants are considered similar. Participants’ characteristics, their previous space (before the test), and their experience of using VR headsets were asked in the questionnaire. At first, subjects were asked to read a document containing information about the experiment and then they answered some questions about their personal information. Then they were asked to put on the headset. For adjusting the headset on their eyes, simulated scene on a summer day in which the light was diffused in the space was shown to the participants. Before asking the questions, all the images were shown to the participants once (each image for 3 to 5 seconds). The images were shown sequentially without break to participants and questions were asked orally. The participants were given enough time to answer each question, and it was possible to go back to the previous images during the experiment. The duration of the experiment was 30 to 40 min per participant, conducted in scheduled appointments from 9:00 AM to 4:30 PM (Fig. 5).
Figure 5
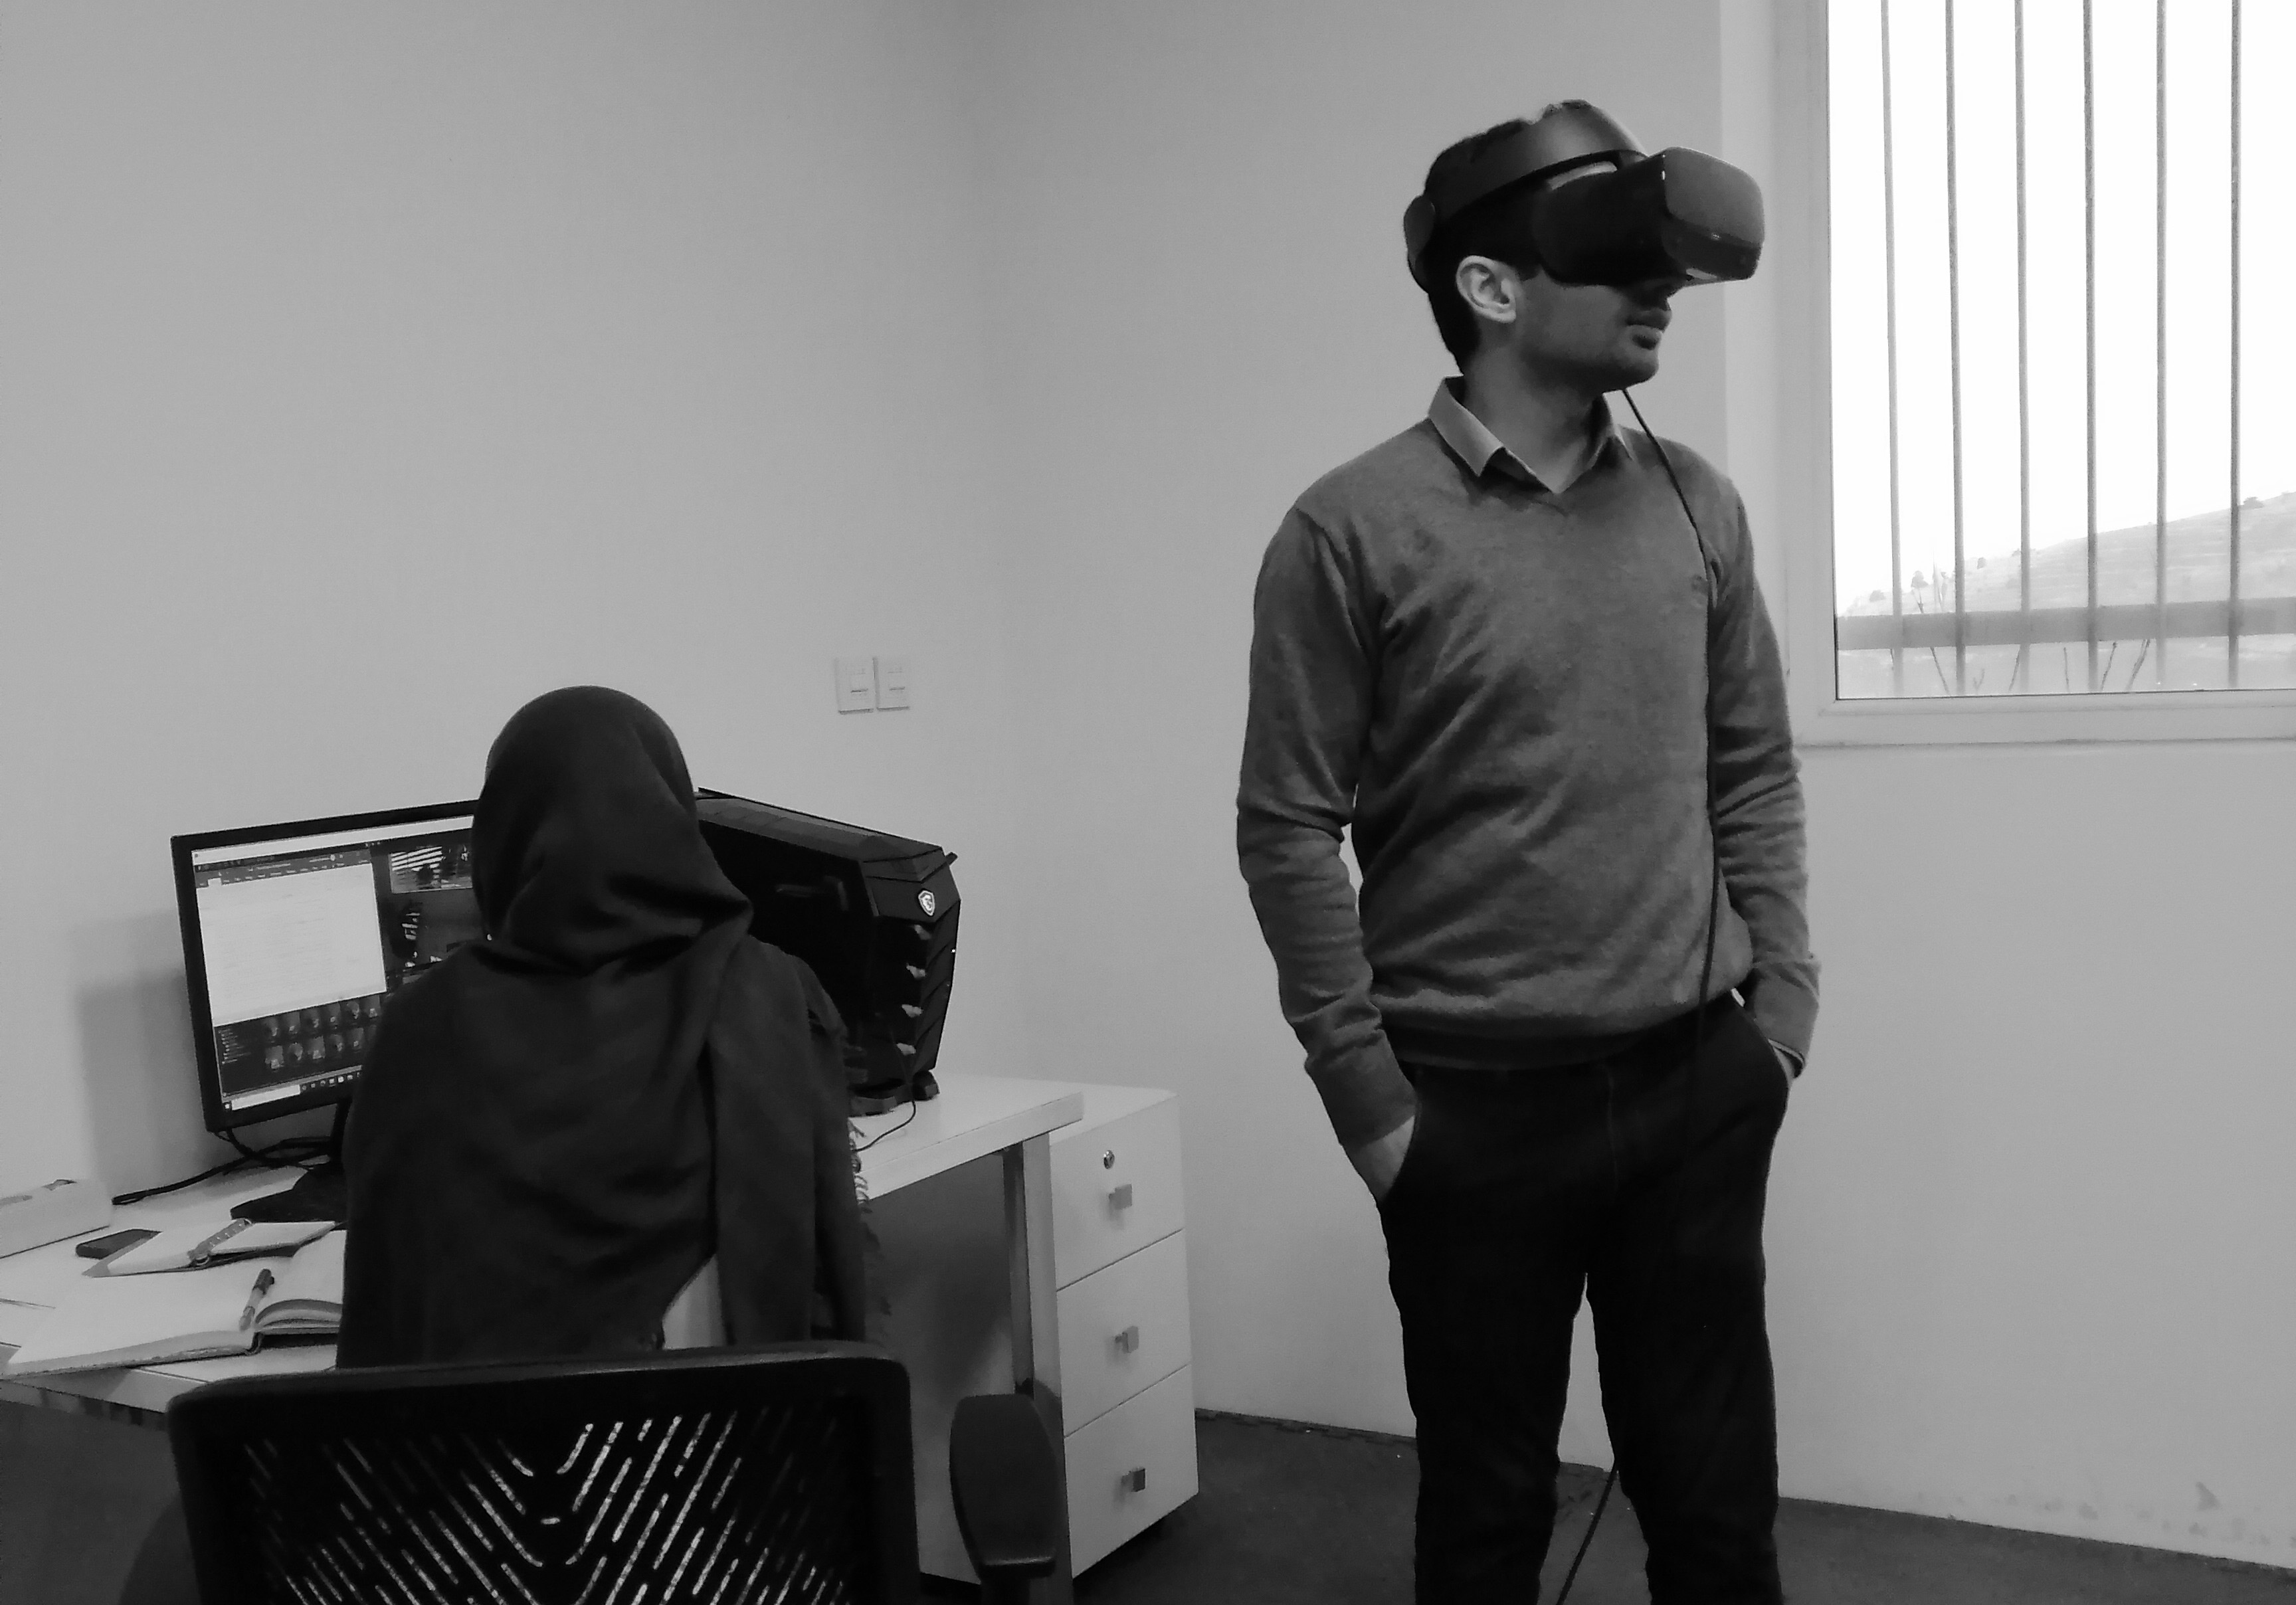
Fig. 5. The photograph of a participant doing the experiment and exploring the virtual environment.
2.3. Statistical analysis and comparison with indices
Statistical analyses are conducted using statistical software SPSS. The significance of each independent variable on users' responses is examined by mean comparison tests and the relationship of questions (interrelated variables) by correlation tests. Due to the small number of samples and according to the results of the studies [70] and [71], Shapiro-Wilk test is used for assessing normality of data distribution. Based on the results of normality tests, the distribution of all data was non- normal and Spearman correlation test, U-mean (Mann-Whitney), H (Kruskal-Wallis) and Friedman test are used with a significance level of 0.05.
Moreover, participants’ evaluation of space contrast and brightness have been compared with the RAMMG and illuminance indices. RAMMG is one of the local contrast algorithms developed by Rizzi et al. [72] which measures the contrast of the image by considering the luminance difference of a pixel and its neighborhood or the local features of an image. RAMMG applies a multi-level approach to compute mean local pixel variations across a subsampled pyramid structure, to account for perceived differences in brightness across multiple image resolutions [73]. In some studies by Rockcastle [73-75,65], this index has also been found significantly related to participants' evaluation of the contrast, stimulation, excitement, and complexity of the space. Each of the 13 scenes is analyzed in Python 3.7 using the RAMMG contrast metric [76]. In addition, daylight levels are simulated in each model by Climate Studio software (Table 6) at 10 am on December 21. The point-in-Time Illuminance data are calculated in a 0.6*0.6 m grid at the eye level (elevation of 1.5 m). The area with useful illuminance (between 300-3000 lux) in each model is calculated and compared with participants’ responses.
Table 6

Table 6. Radiance parameters values used in Climate Studio simulations.
3. Results and discussion
3.1. Survey results
Thirty-three people, between 20 and 32 years (39% female and 61% male, μ: 24.64 years old, SD = 3.86) participated in the test, which 45% of them had experiences of using VR headset before the test. To assess the impact of their previous environments on light perception in the VR headset, participants were also asked about their previous space, where 55% were indoors before the test. Half of the participants studied architecture (Fig. 6).
Figure 6
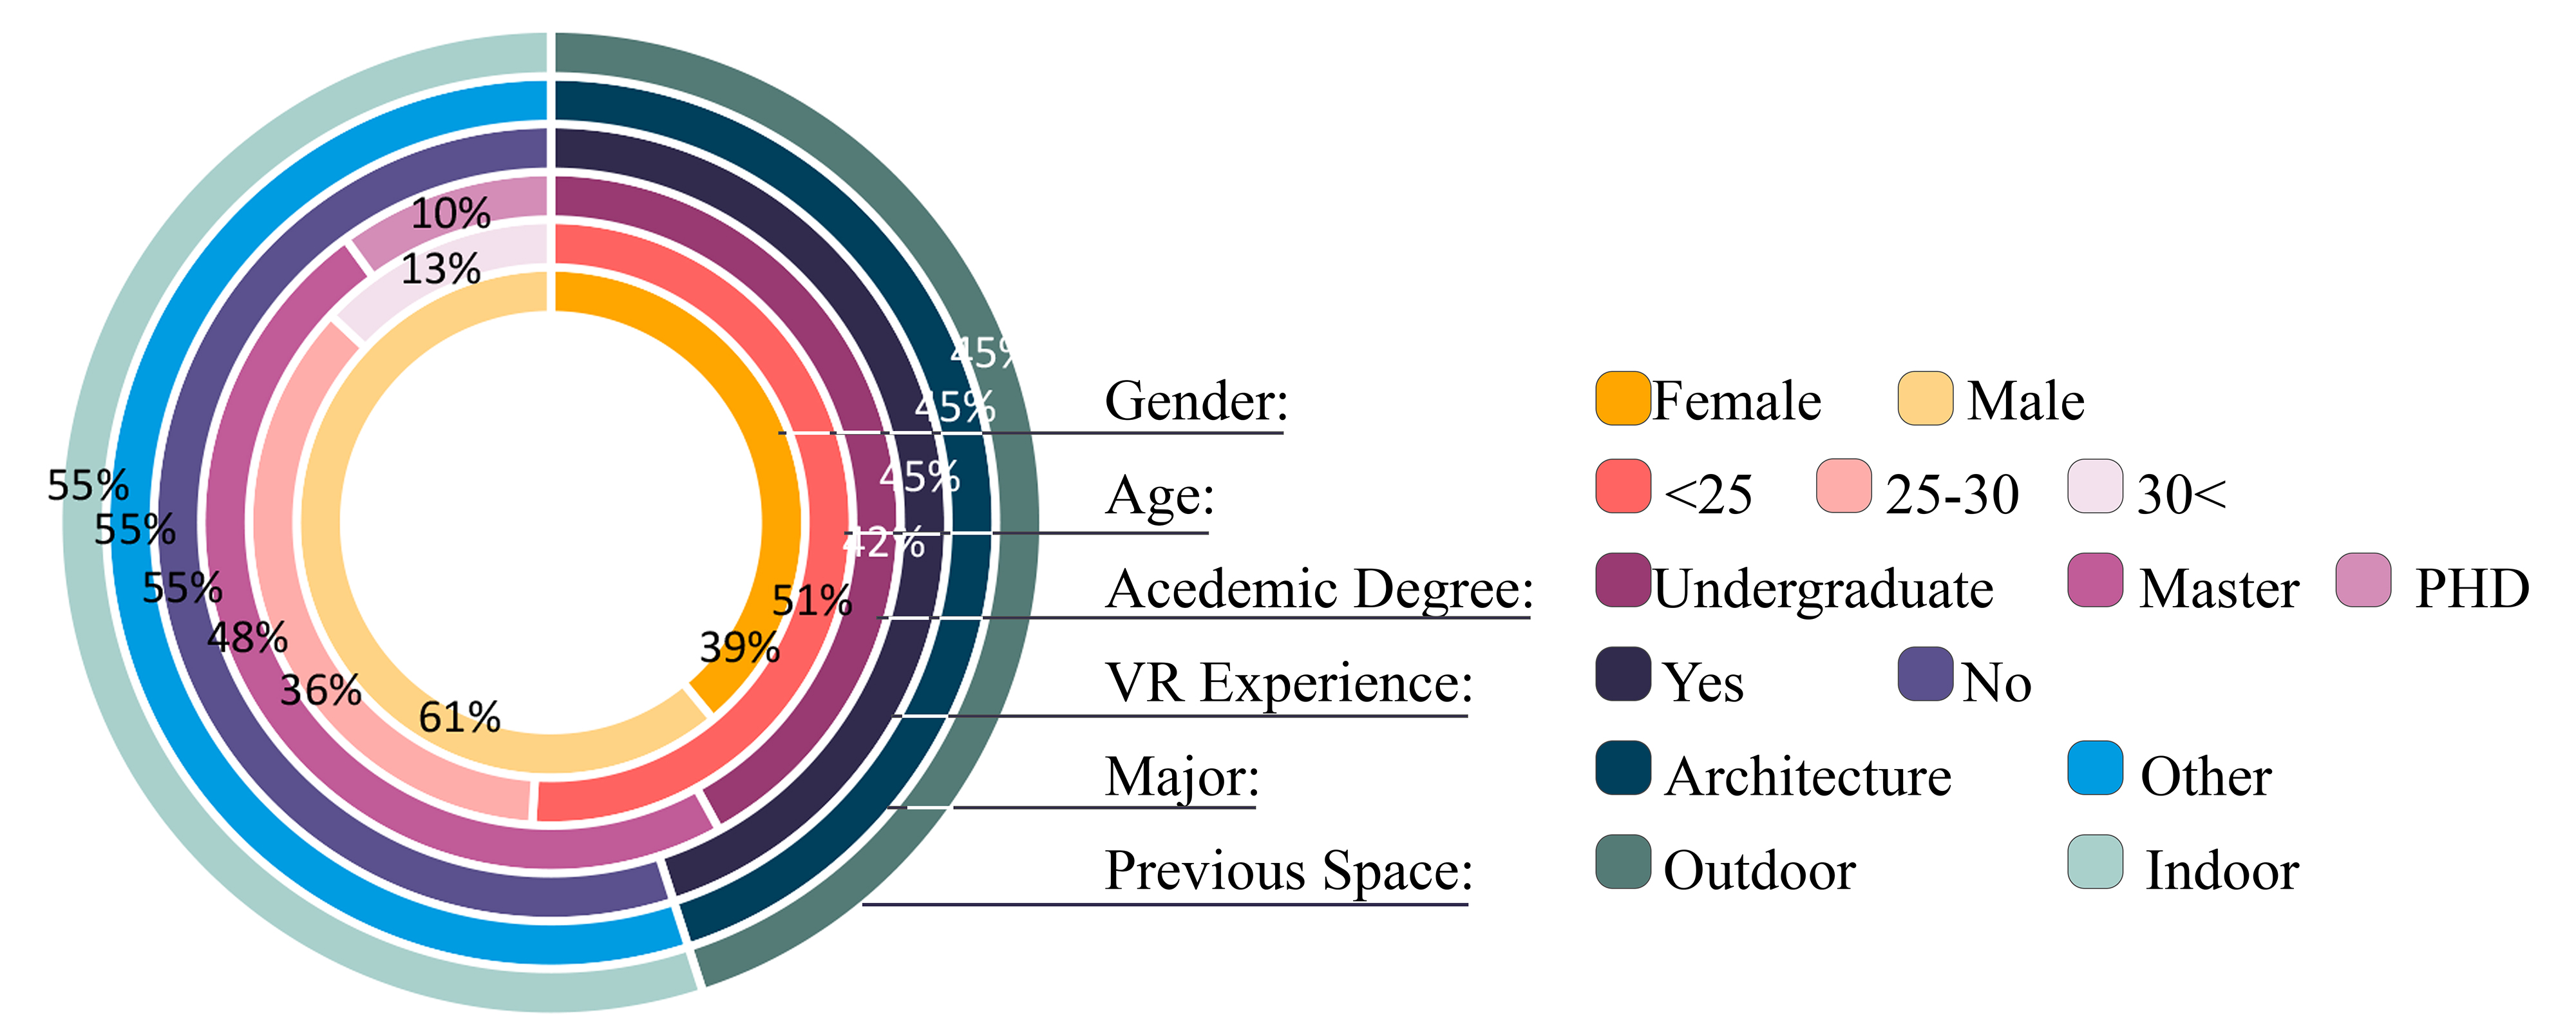
Fig. 6. Participants' information asked in the first part of questionnaire.
Testing the effect of participants’ age, gender, major, experience of using the VR headset and their previous space, shows that the experience of using the headset has a significant effect on participants’ perception of daylight distribution and their preference for brightness. In addition, the previous space participant attended before the test is effective on users' assessment of the brightness, daylight distribution and the acceptable contrast. The participants’ field of study has a significant effect only on people's assessment of the amount of brightness and the preference for brightness and does not affect other dependent variables (Table 7).
Table 7
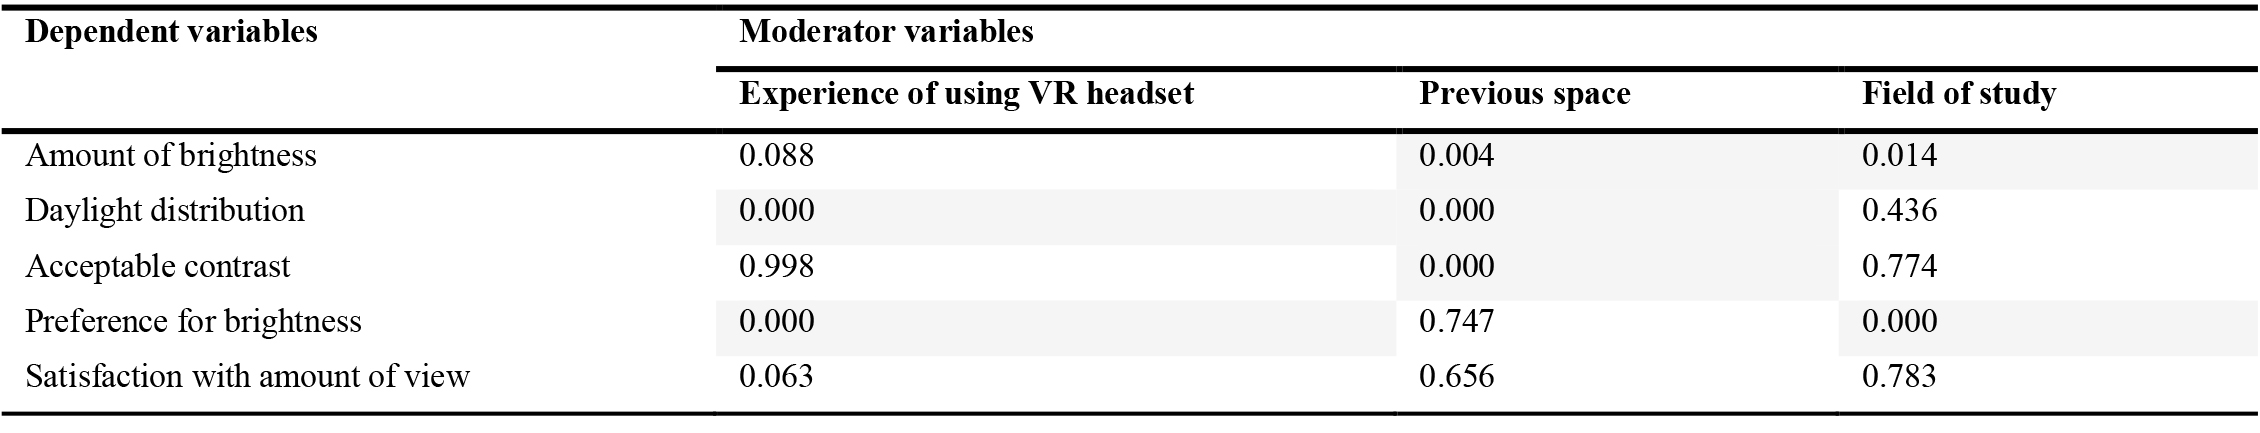
Table 7. The effect of participants’ experiences and major on 5 aspects of visual perception.
In order to evaluate the effect of the studied parameters on the participants' evaluation of each design alternative, the participants’ responses in each group is analyzed separately.
According to results, shown in Table 8, among the studied parameters, only changing the reflectance of surfaces and WWR have a statistically significant effect on participants’ evaluations of brightness in the space (p<0.05) Besides, daylight distribution is affected by changing reflectance coefficients, WWR, number of windows and shading geometry. Moreover surface reflectance have a significant influence on both acceptable contrast participants’ preference for the brightness, while the latter is also influenced by WWR. In addition, changing glazing visible light transmittance, WWR and number of windows significantly affect their satisfaction with the amount of outside view. Also other findings of parameters’ influence on participants’ evaluations confirm the calidity of the model, according to the similarity of the results to the previous studies (e.g., window size effects on participants’ spatial perception and satisfaction with amount of view as in [47] and higher occupants’ satisfaction of visual comfort, inner space and openness with higher WWRs as in[39]). However in other studies [48], participants’ perception and emotional states for instance satisfaction with view and amount of view is influenced by facade clarity and in [58] façade geometry has significant effects on perceived brightness and amount of view.
Table 8
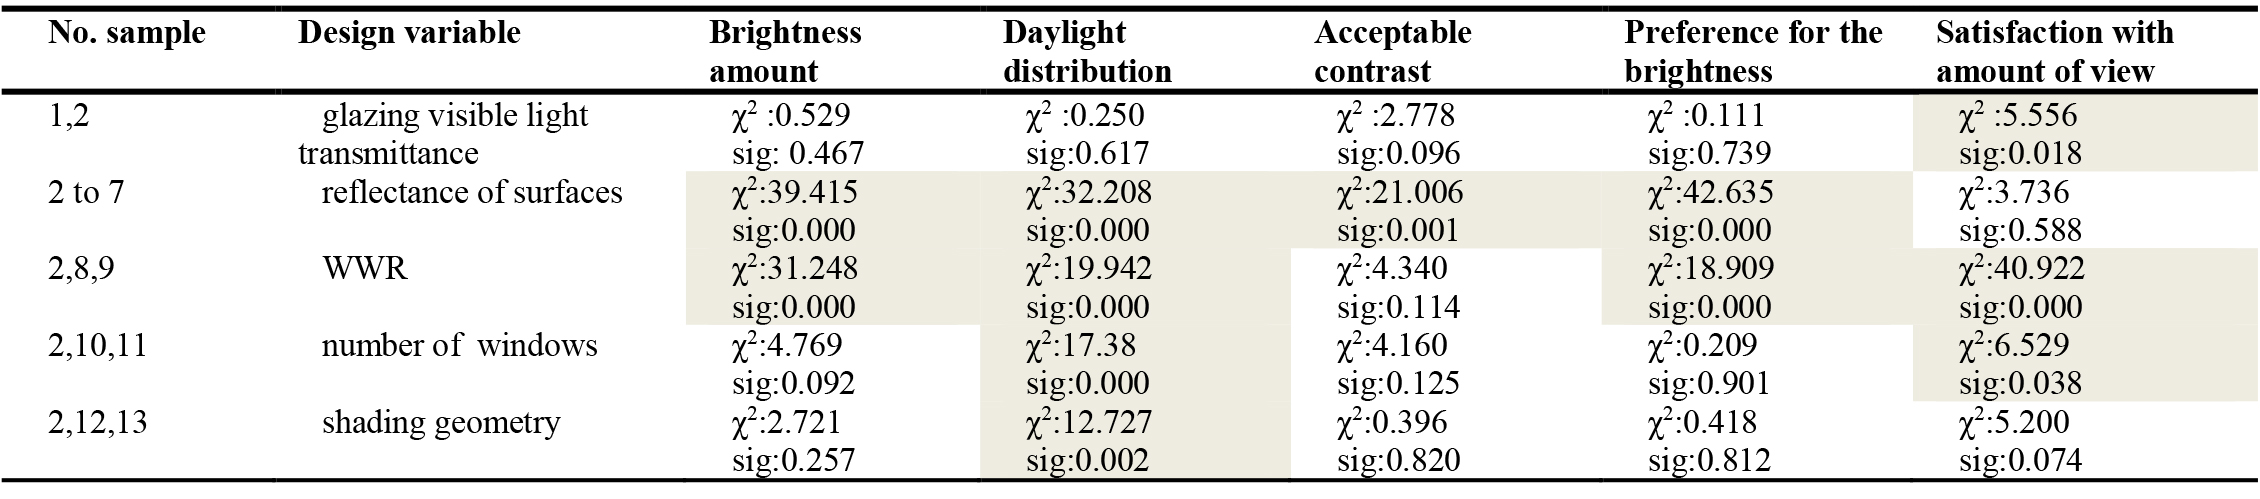
Table 8. The effect of independent variable on dependent ones using Friedman test with p-value of 0.05.
In the next step, further analyses are performed to investigate the association between examined attributes. Table 9 presents the correlation between studied variables and shows that there is a weak (0.3 < p < 0.5) to moderate (0.5 < p < 0.7) uphill degrees of correlation for almost all the variables. Also, the minimum correlation coefficients are between acceptable contrast with brightness and daylight distribution (0.096 and 0.144 respectively) and the maximum correlations are between the question about amount of brightness with preference of changing it and satisfaction with the amount of view (0.407 and 0.386 respectively).
Table 9
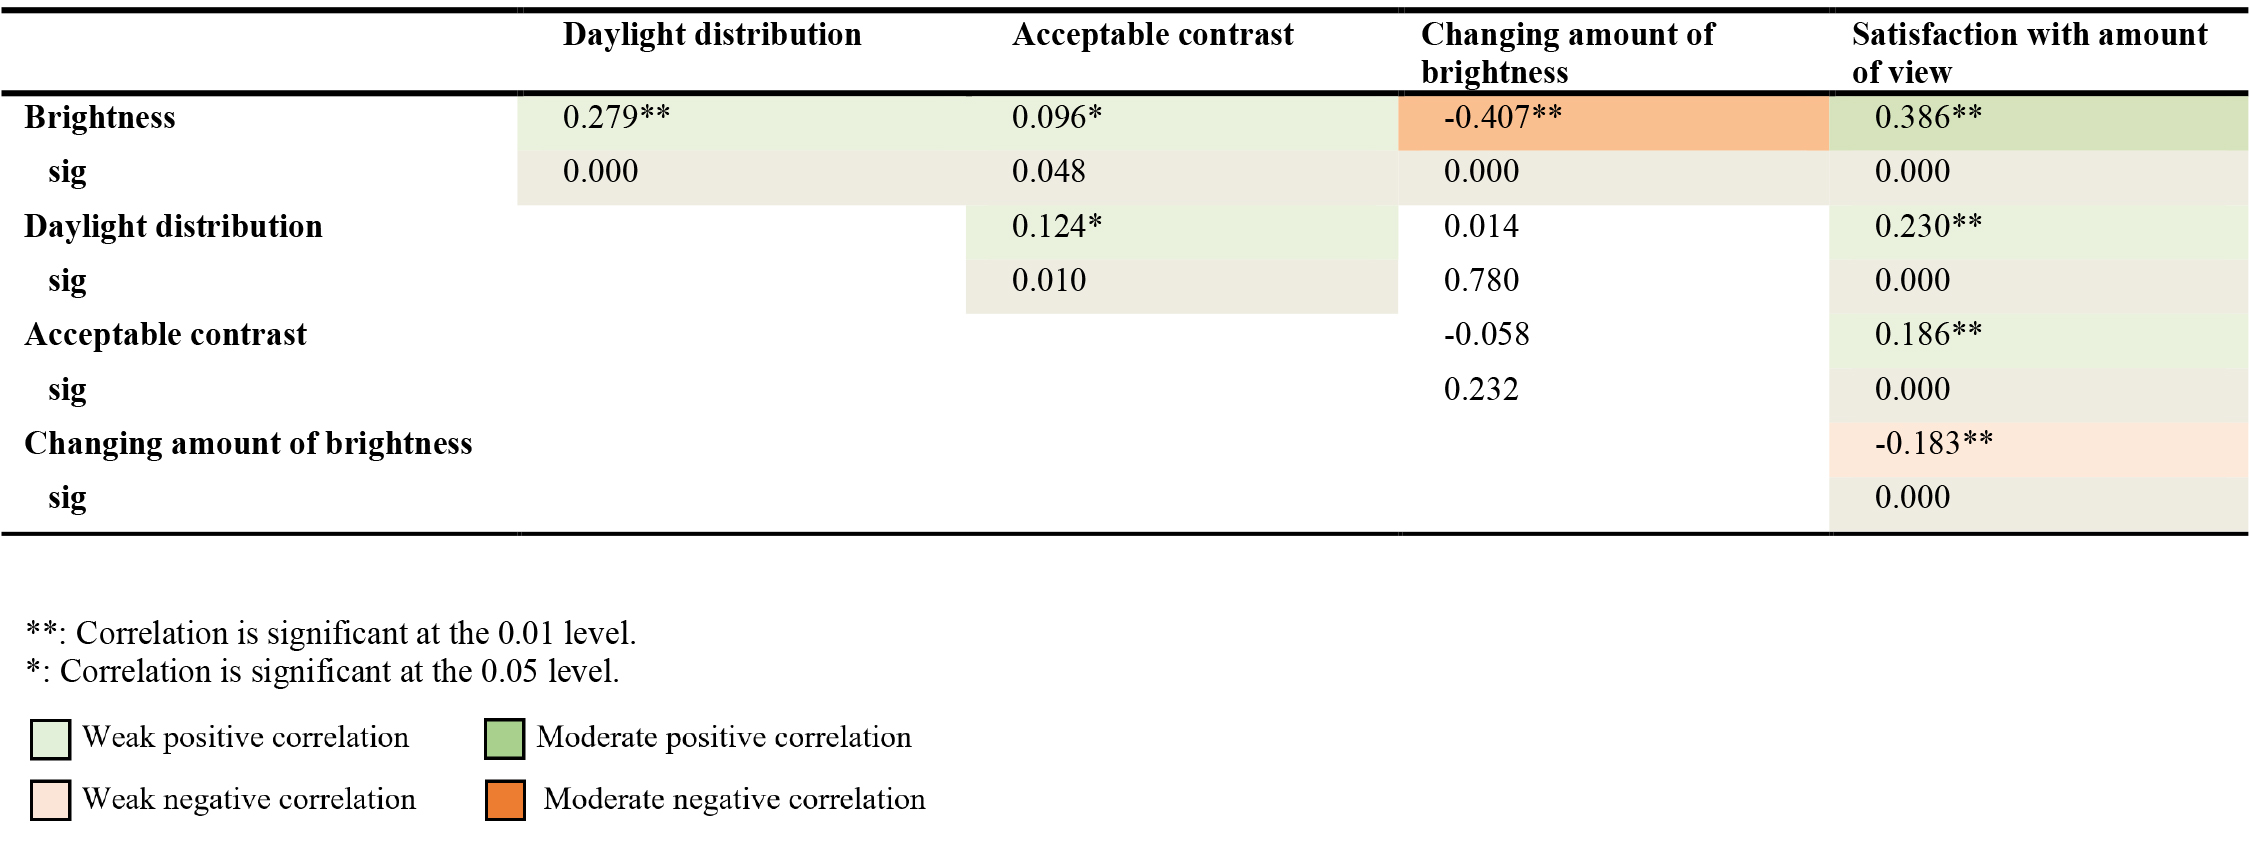
Table 9. The correlation between studied variables using Spearman correlation test.
Statistically, significant (positive) associations are found between the brightness and participants’ satisfaction with amount of view and between the brightness and their preference to change the brightness (negative). Moreover, a weak positive correlation is found between brightness and acceptable contrast, brightness and daylight distribution, and also between daylight distribution with contrast and view, and finally a negative weak correlation between satisfaction with view and changing the brightness. Indeed, the results align with the findings by Omidfar Sawyer and Chamilothori [46] who indicated that there is an association between participants’ evaluation of brightness and other visual perceptions (e.g. outside view) and the occupants’ perception of brightness must be studied with considering other visual attributes.
3.2. Comparison of the participants' assessment of the contrast acceptability with RAMMG
In order to compare participants' evaluation of the acceptable level of contrast with the RAMMG, the correlation coefficient between all participants' answers and the RAMMG metric is calculated. Using Spearman test, the correlation coefficient of participants' evaluation and RAMMG index is -0.093 (p-value<0.1), which shows a weak correlation. Figure 7 shows the percentage of participants’ answers of contrast for each scene with different RAMMGs.
Figure 7
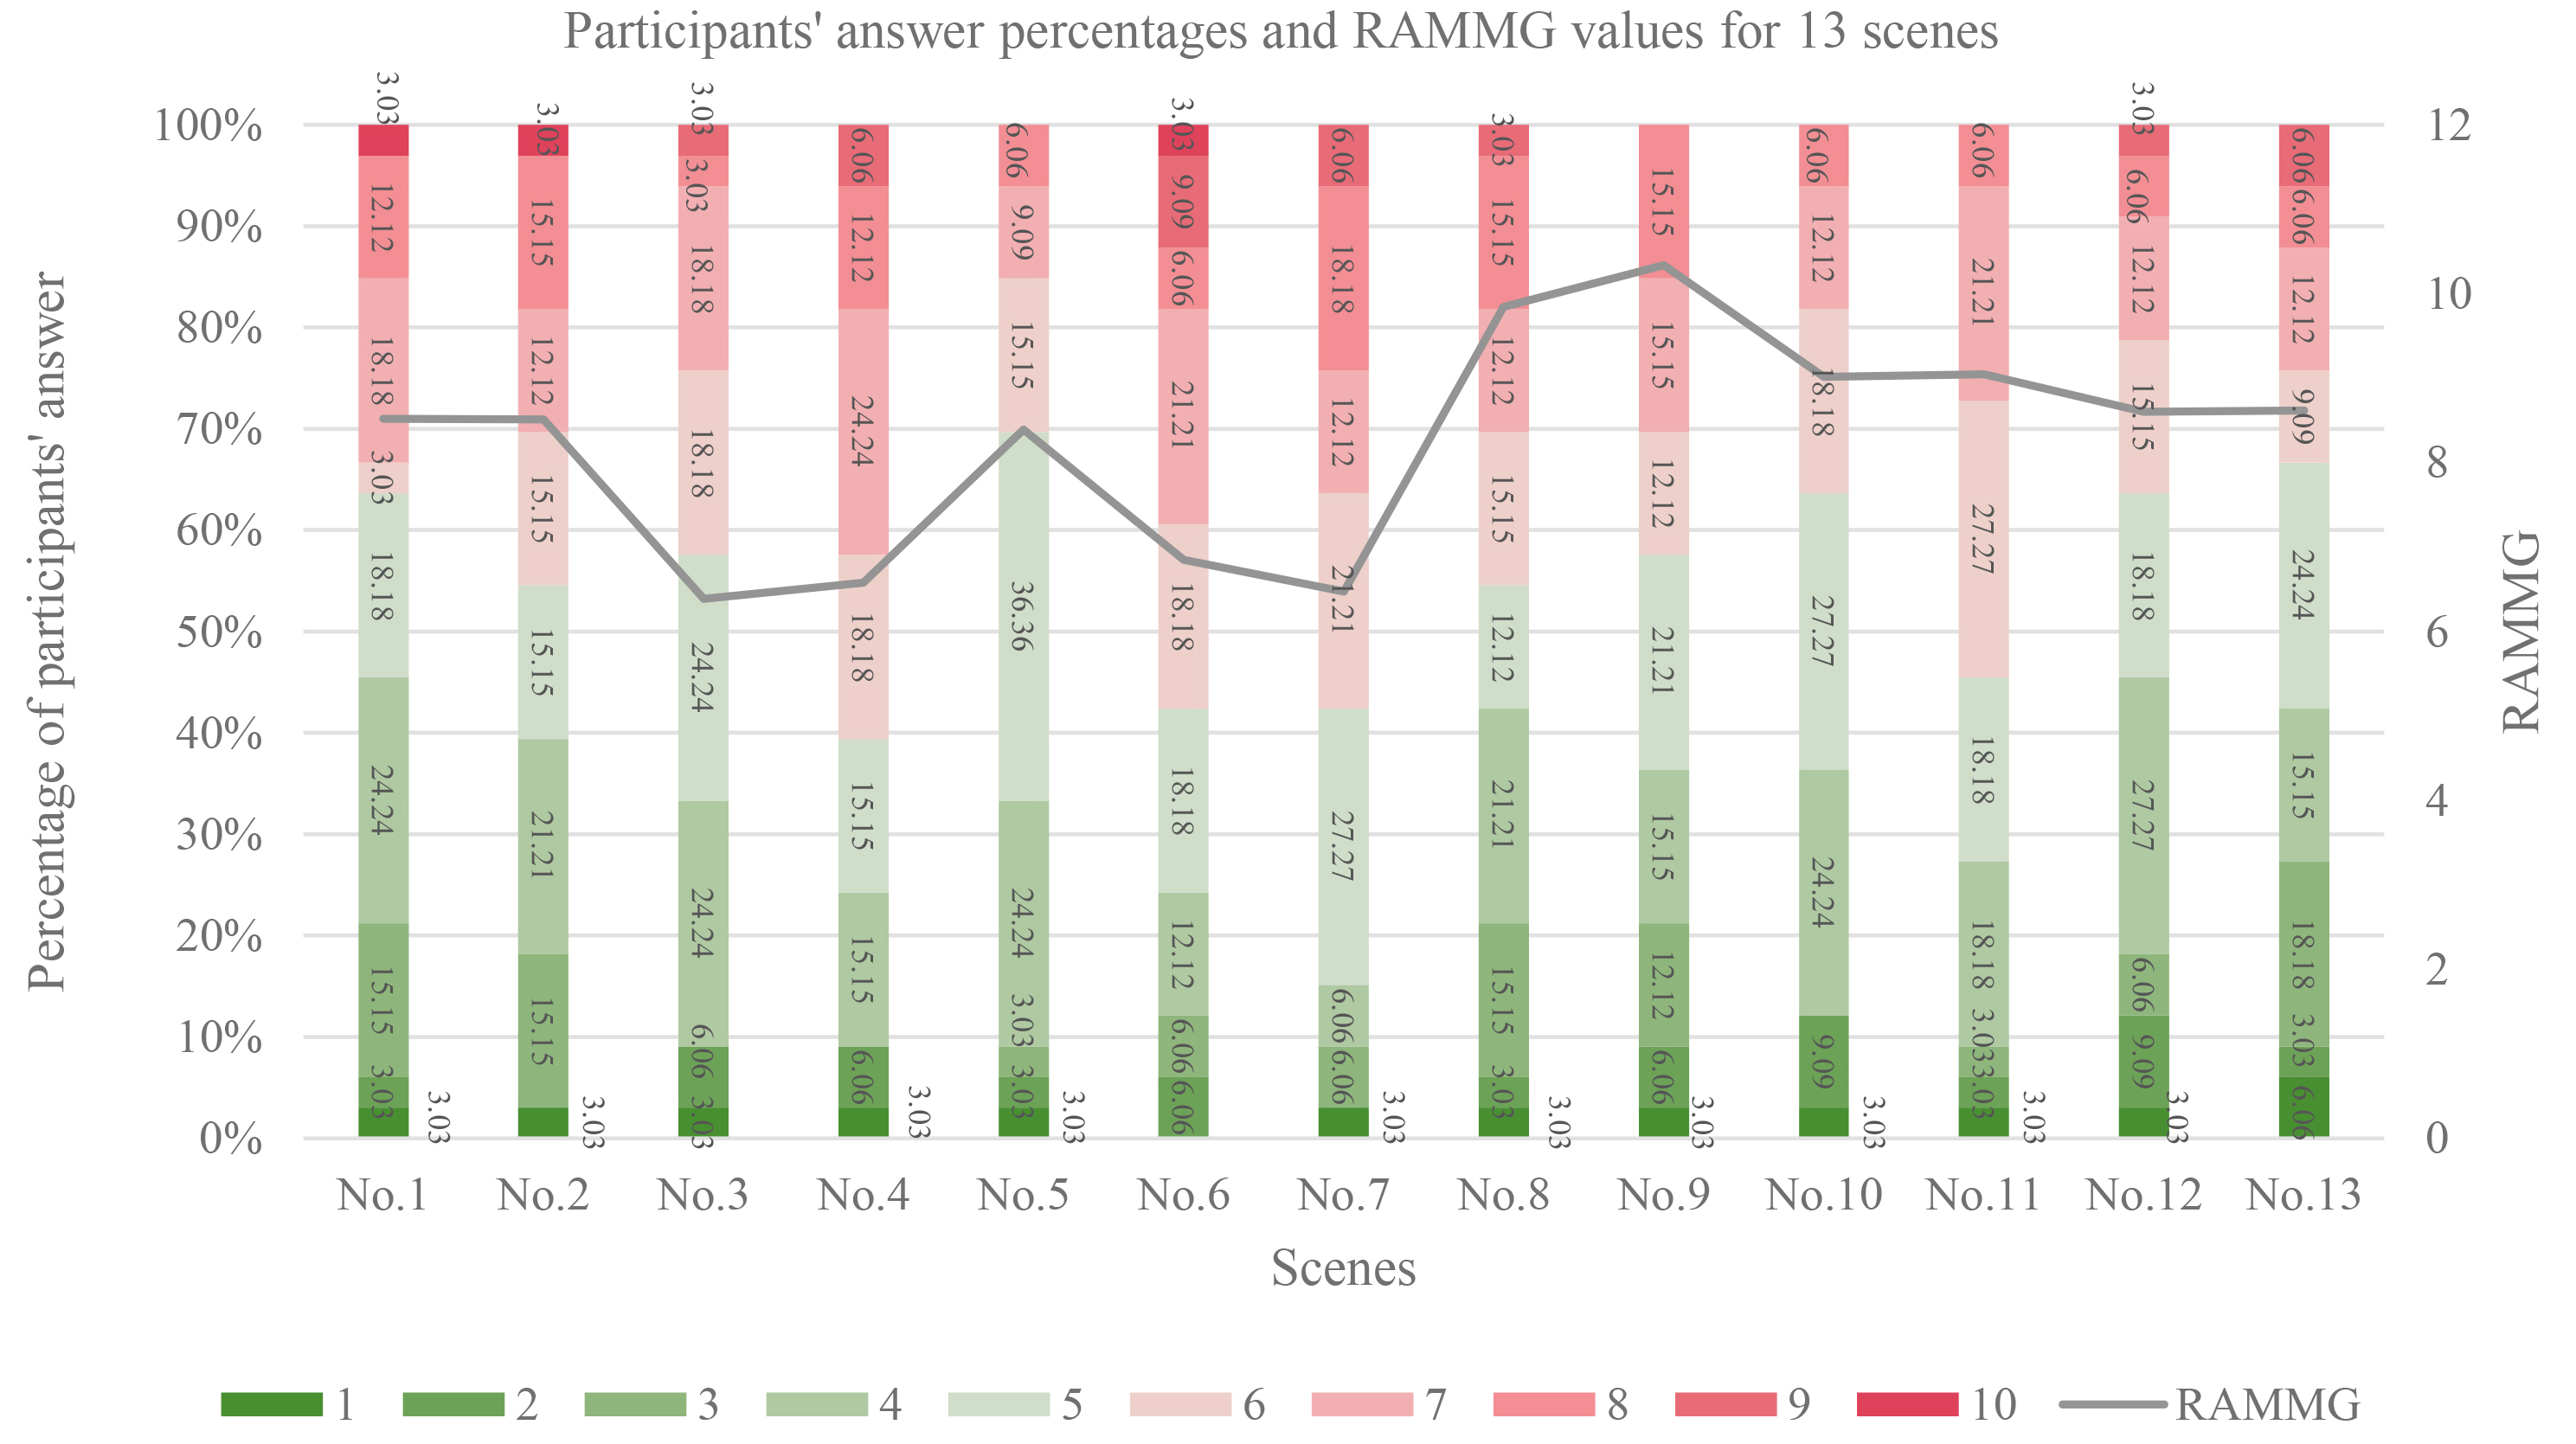
Fig. 7. Percentage of participants' assessment of the acceptable contrast of each image on a Likert scale for different values of RAMMG.
The highest values of RAMMG belongs to models No.8 and 9, with 45% and 60% WWR. More than 50% of participants evaluated the contrast in these scenes unacceptable. The models No. 11 and No. 12 with two and three windows respectively, have almost equal RAMMG index. However, the contrast is acceptable in the class with three windows and unacceptable in the class with two windows (model No. 10) and one window (model No. 2 ) based on more than 50% of participants’ answers.
The RAMMG is almost equal in models No. 12,13 and 2 with different shading geometry, but according to the participants’ opinion, contrast in model No. 2 with louvre shading geometry is more acceptable than the geometry of Fakhro-Madin and Girih tiles. The contrast in the class with high reflectivity light shelf is unacceptable for nearly 70% of participants, while RAMMG is almost similar to class No.1 and No. 2. The contrast in classes with ceramic and wooden floor and blue desks is evaluated acceptable by more than 50% of participants (No. 4, 6, and 7). In class No. 3 (wooden floor and chair), even though the value of RAMMG is the lowest and close to samples 7 and 4, the participants rated the contrast of this scene lower than 6 and unacceptable. Ultimately, the occupants’ evaluation of the contrast in the space depends on the materials and their colors ( in addition to their reflectance coefficient) , the number and dimensions of the windows and shading geometry (variables investigated in this research) and it is not possible to define certain ranges for acceptable or unacceptable values for indices like RAMMG (the spearman correlation test p-value = 0.053 (>0.01)). In previous studies, RAMMG is correlated with visual interest impressions [65] and is a good predictor of contrast-based visual effects (diffuse – direct, calming – exciting and subdued – stimulating) [74] . In previous studies VR scenes are rendered in grayscale so it is necessary to conduct more experiments to investigate the correlation between occupants’ contrast assessment and such quantitative predictors.
3.3. Comparison of the participants' assessment of the brightness with point in time illuminance
To identify the gap between lighting standards and occupants’ perception of lighting some attempts have been made to propose new acceptable ranges for daylight metrics or address more correlated metrics to explain the perceived brightness in the space more accurately [24,77,78].
The percentage of area with illuminance lower, between, or higher than 300 - 3000 lux, versus the percentage of participants’ answers to perceived brightness (1 to 10 in Likert scale) are shown in Fig. 8. Participants assess model No.1 with 90% glazing light transmittance and more illuminance values brighter than model No.2. The percentage of area with illuminance between 300 and 3000 lux in models No. 3, 4, 6, and 7 is the same, however the reflection coefficient of the surfaces and the illuminance values of points of models No. 4 and 6, are higher than those of model No.3 and 7 (respectively). Model 4 is assessed brighter than 3, but models 6 and 7 are evaluated almost the same. In model 5 with high reflective light shelf, the brightness of the points is higher than in model 2, the percentage of the space with lighting is 300 to 3000 lux is equal, and there is not much difference in the responses of the participants. The percentage of area with more than 3000 lux illuminance in model No. 9 (with 60% WWR) is more than other scenes. Despite the larger windows in samples 8 and 9 and higher brightness in these two models, participants assessed the models with higher reflection coefficient (for example, No. 4) brighter. In scenes 10 and 11 with a WWR of 30%, illuminance at the eye level is almost equal to scene No. 2, but according to the participants, model 11 with three windows is brighter. The amount of brightness in models 12 and 13 is almost equal to model 2, but the participants rated model 2 with the horizontal louver shading brighter. In summary, the brightness perceived by people depends on the color of the surface material in addition to the reflection coefficient of the surfaces, which is in line with the results of previous study by Omidfar Sawyer and Chamilothori [46] who indicated that colored materials have significant effect on people’s satisfaction with brightness. These results as well as the results of [55] that students’ memory improves in less illuminated classrooms (100 lux rather than 300 and 500 lux) have important effects on energy use of lighting in spaces.
Figure 8
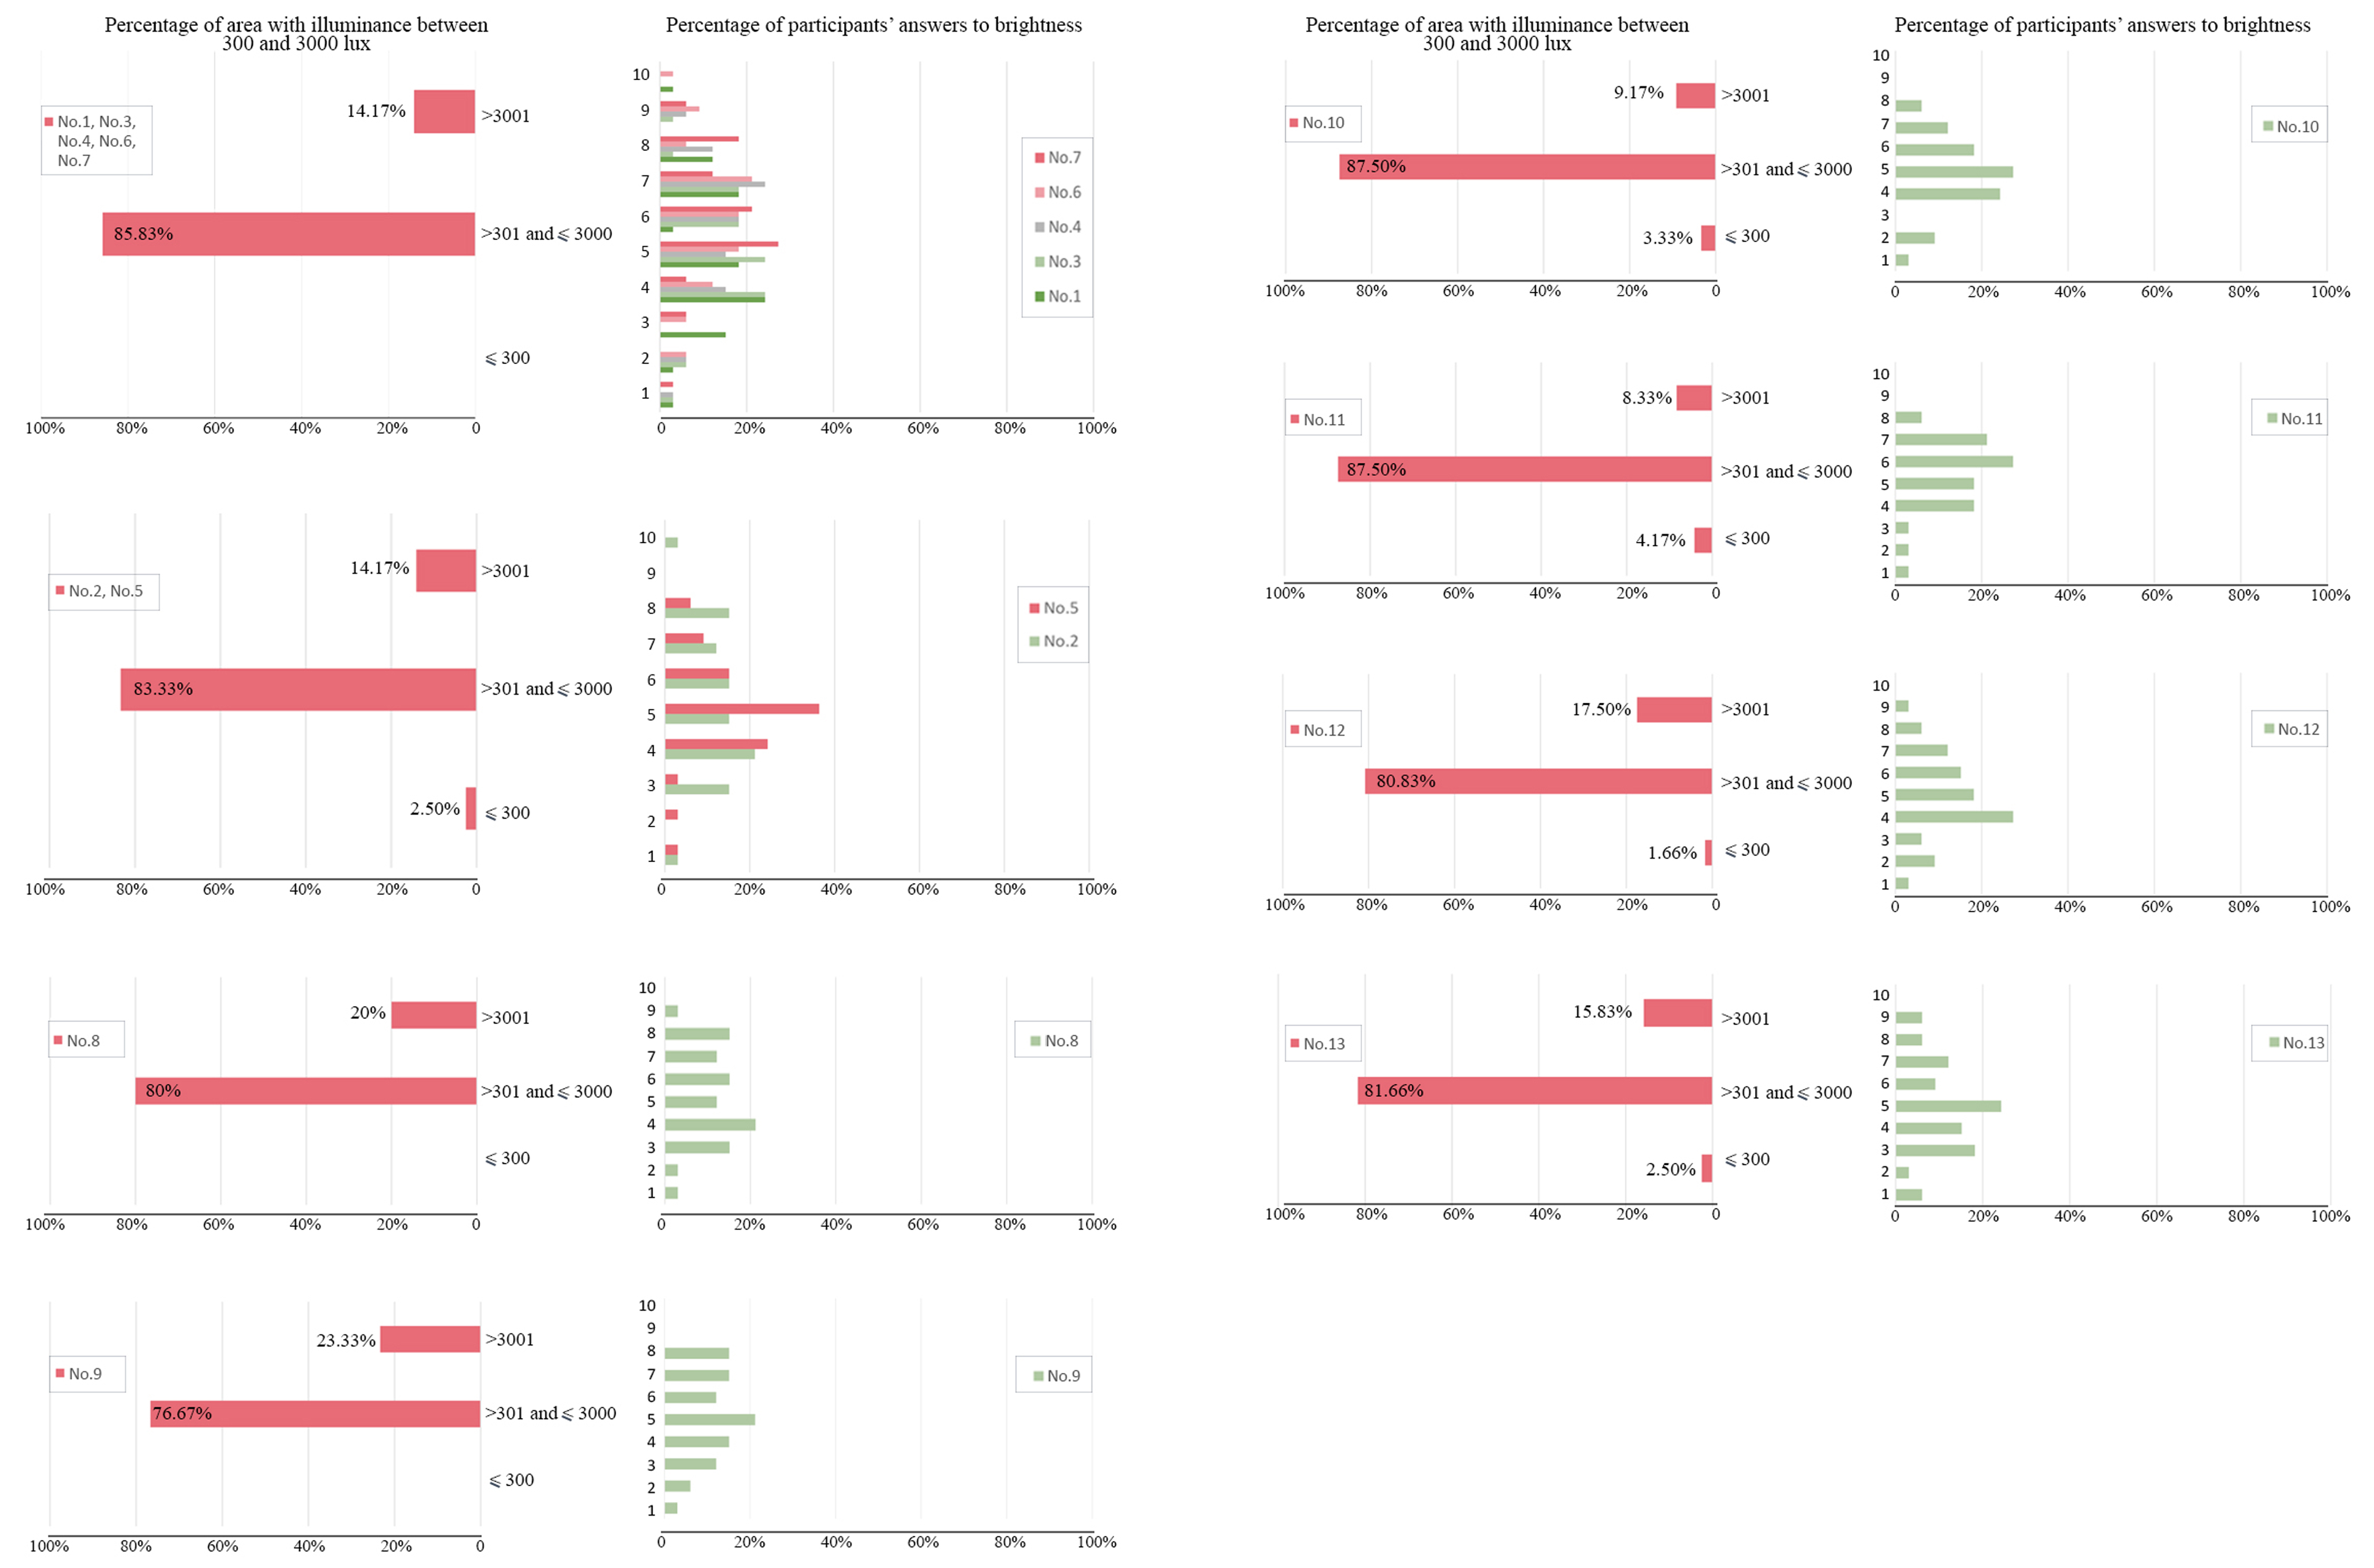
Fig. 8. Comparing percentage of participants' answers and area with illuminances between 300 and 3000 lux.
The luminance range of VR displays is one of the main limitations of the present study. The maximum brightness of Oculus Rift S display is 74 cd/m². Therefore, it is not possible to study glare or an annoying luminance with a VR headset. Furthermore, at the time of the test, due to restrictions because of the spread of the Covid-19, this research was conducted with 33 participants and it is suggested that future experiments will be conducted with more people. This experiment is conducted in a VR scene with the perspective view of a fixed point of a standing subject in the center of a university classroom. In future studies it would be useful to conduct similar experiments for other buildings such as offices, hospitals and schools with other points of view (e.g. sitting at the desk) to uncover additional correlations between lighting parameters and occupants’ perception and increase their performance. In some previous studies, conducting a visual task (e.g. reading a text [52,79] discriminating colors [35,80]) was asked of the subjects, which can be beneficial to figure out IVR realism and compare different environments. Lastly, five features of the space with a clear sky were investigated in this paper and future research with other spaces’ features, sky condition and age ranges of participants is needed.
4. Conclusion
This paper, presented an experiment in VR in which participants assessed their perceptions and impressions of a daylit classroom across series of variations of glazing light transmittance, surface reflect coefficients (materials), WWR, number of windows and shading geometry. The main purpose of this study was to investigate variables in the interior spaces, which have more effects on occupants’ perception of daylight. For these aims, 13 physically based classrooms were simulated with high speed and accuracy in V-Ray software. Then, participants' visual perception and evaluation of the brightness, lighting distribution, contrast, and view were questioned in an immersive VR using a 10-point Likert scale survey. The findings in this study demonstrate that changing some parameters affecting the lighting of the space has no significant effect on occupants’ visual perception of lighting, lighting distribution, acceptable contrast and satisfaction with amount of view. The results of the correlation between the dependent variables also indicates that people’s visual perception and evaluation aspects depends on each other and can not be investigated without considering the features of the environment, which immerse human’s visual perception. Afterwards, the local contrast metric (RAMMG) is calculated for all thirteen images. Results of RAMMG is compared with the opinion of the participants regarding the contrast acceptable. Based on the statistical results, there is no correlation between people's opinion and this index. By comparing the results of RAMMG and the opinion of the participants, using ceramic floor (with high reflection coefficient) and furniture with blue color made the contrast of the surfaces more acceptable for participants despite no significant change in RAMMG. Also, by increasing the number of windows (with constant WWR), the contrast of the surfaces is evaluated as more acceptable. This study emphasizes the need to consider the evaluation of users in addition to quantitative metrics for assessing the lighting of indoor spaces. Lastly, the Point-in-Time Illuminance of scenes in eye height of participants is calculated using Climate Studio software. By comparing the results of illuminance values in thirteen scenes with participants’ evaluation of brightness it can be concluded that the perceived brightness by people may change by changing the material with the same reflection coefficient, despite of no changing in illuminance. Therefore, further research is encouraged to explore a wide range of stimuli on human’s visual perception in indoors to discover the validity of the present study findings in other spaces, sky types and interior space features.
Appendix A1
Table A1
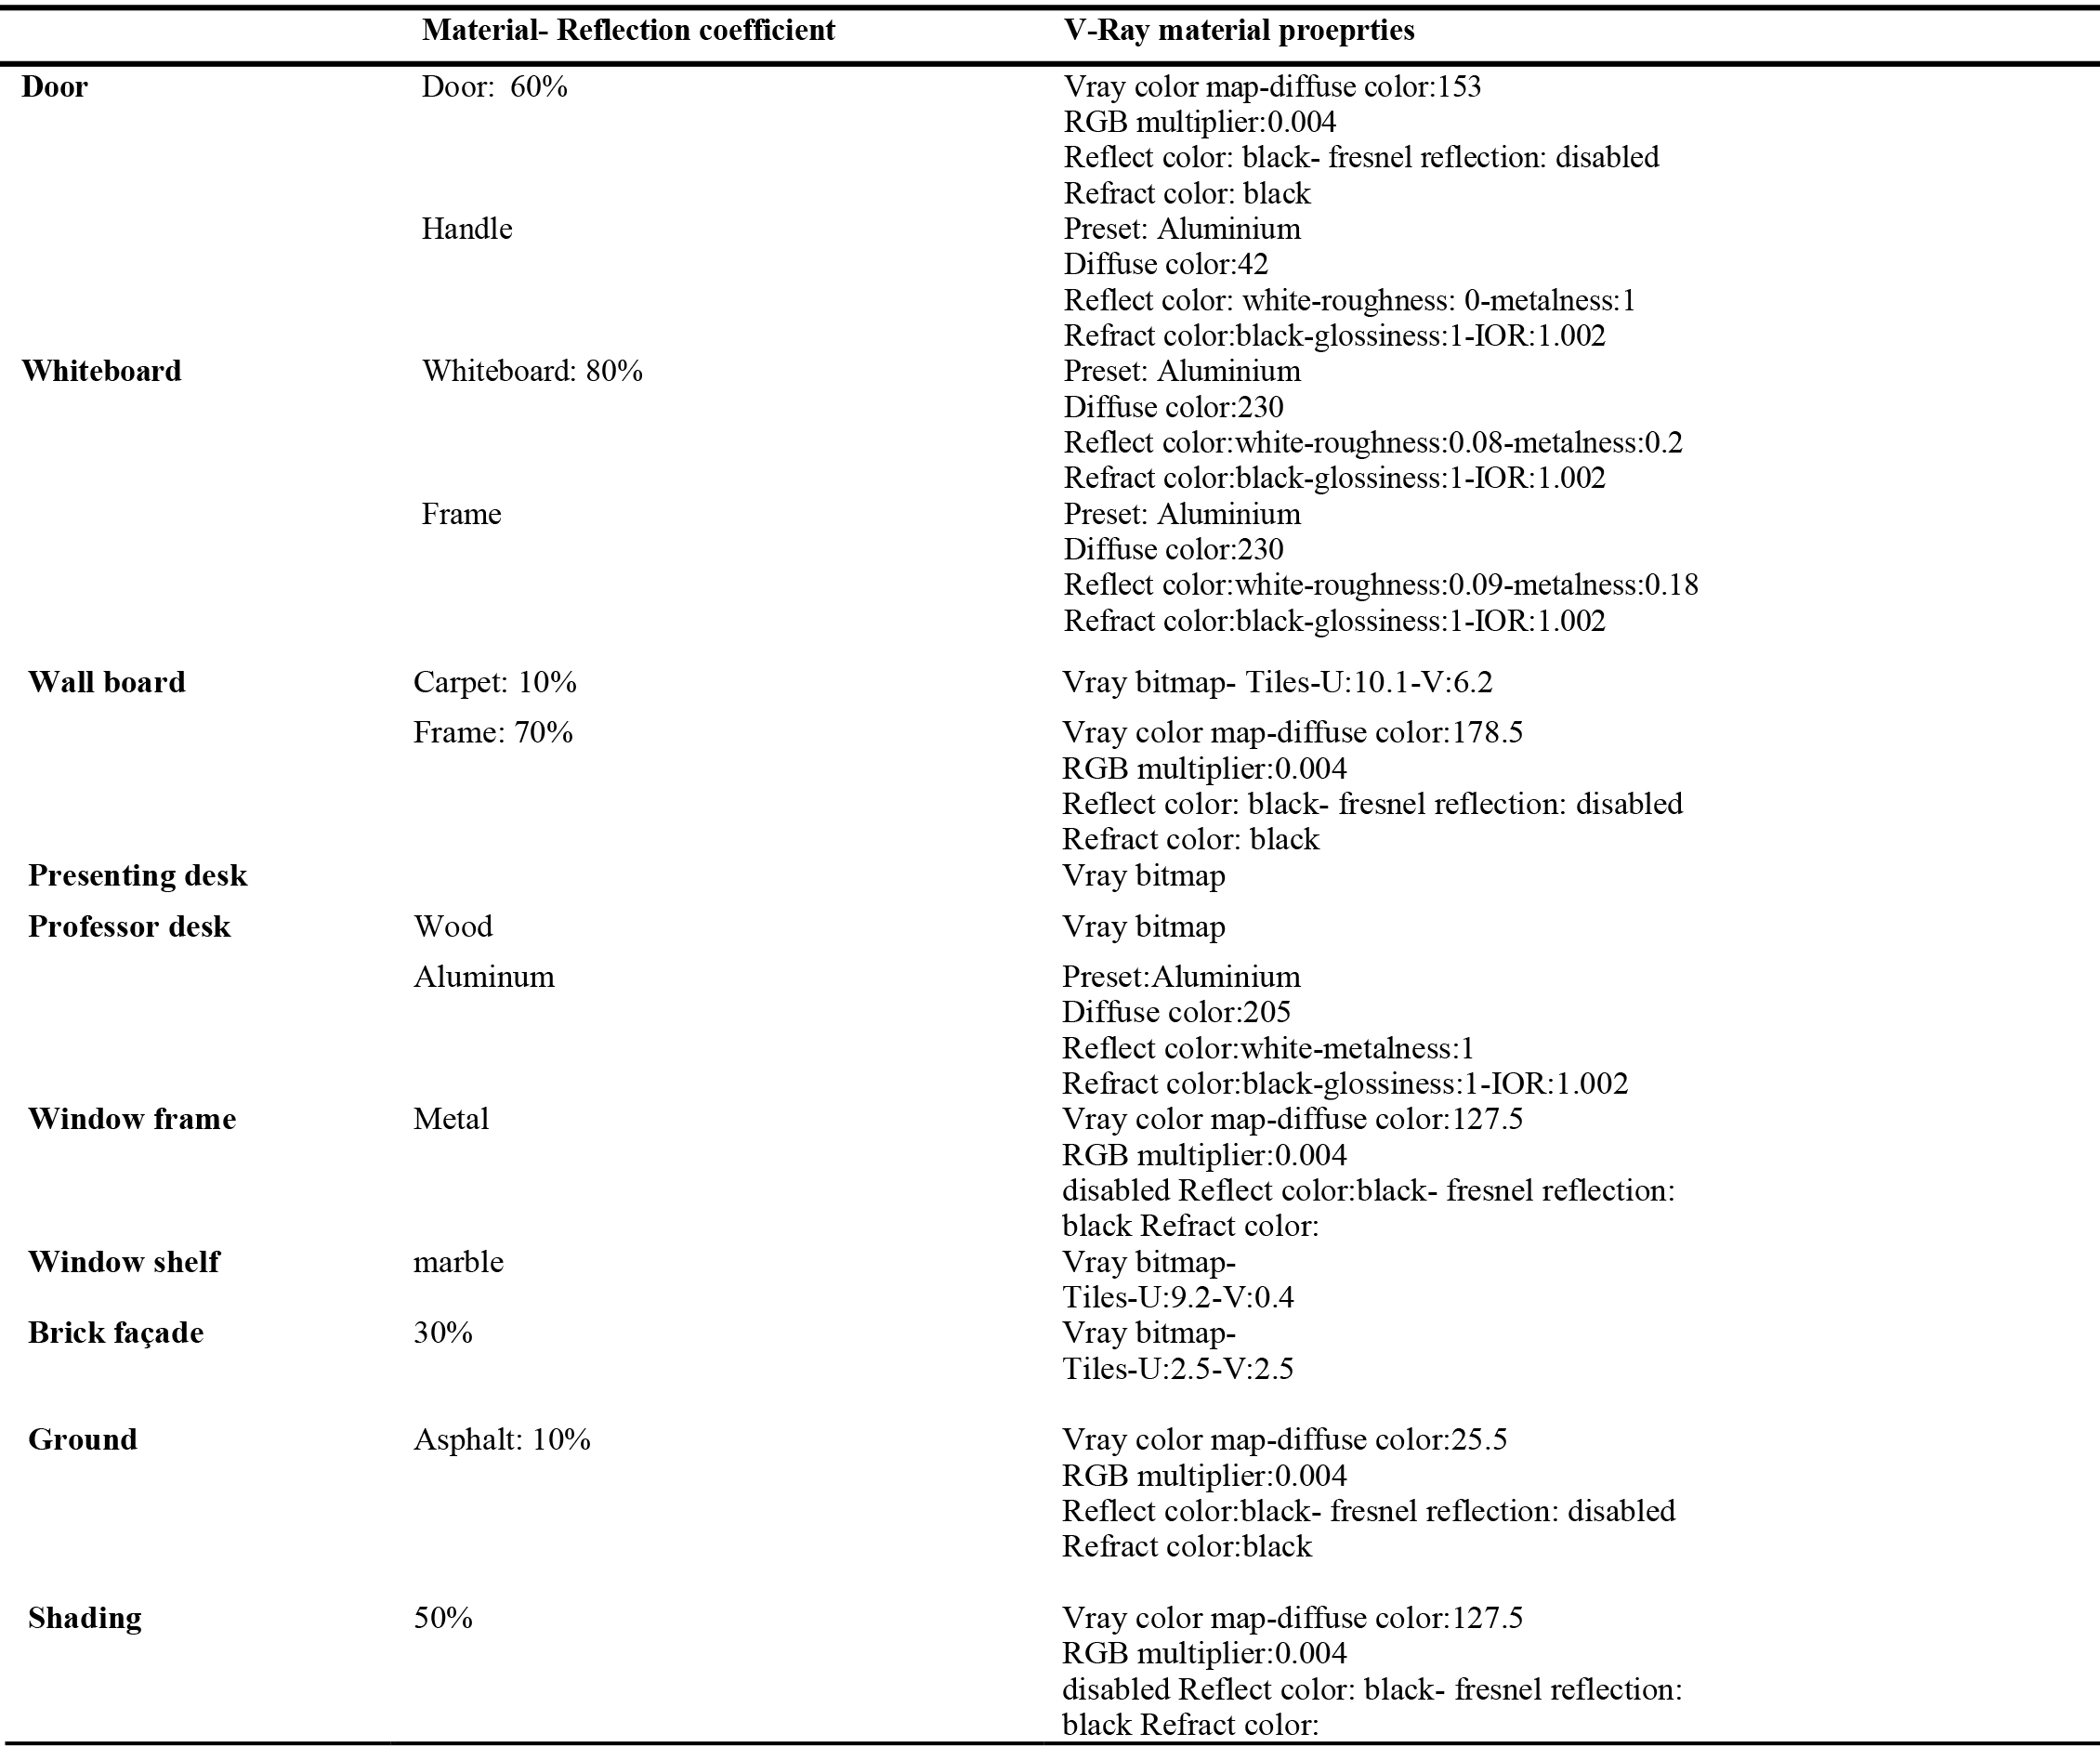
Table A1. V-Ray material properties for the surfaces (invariable).
Table A2
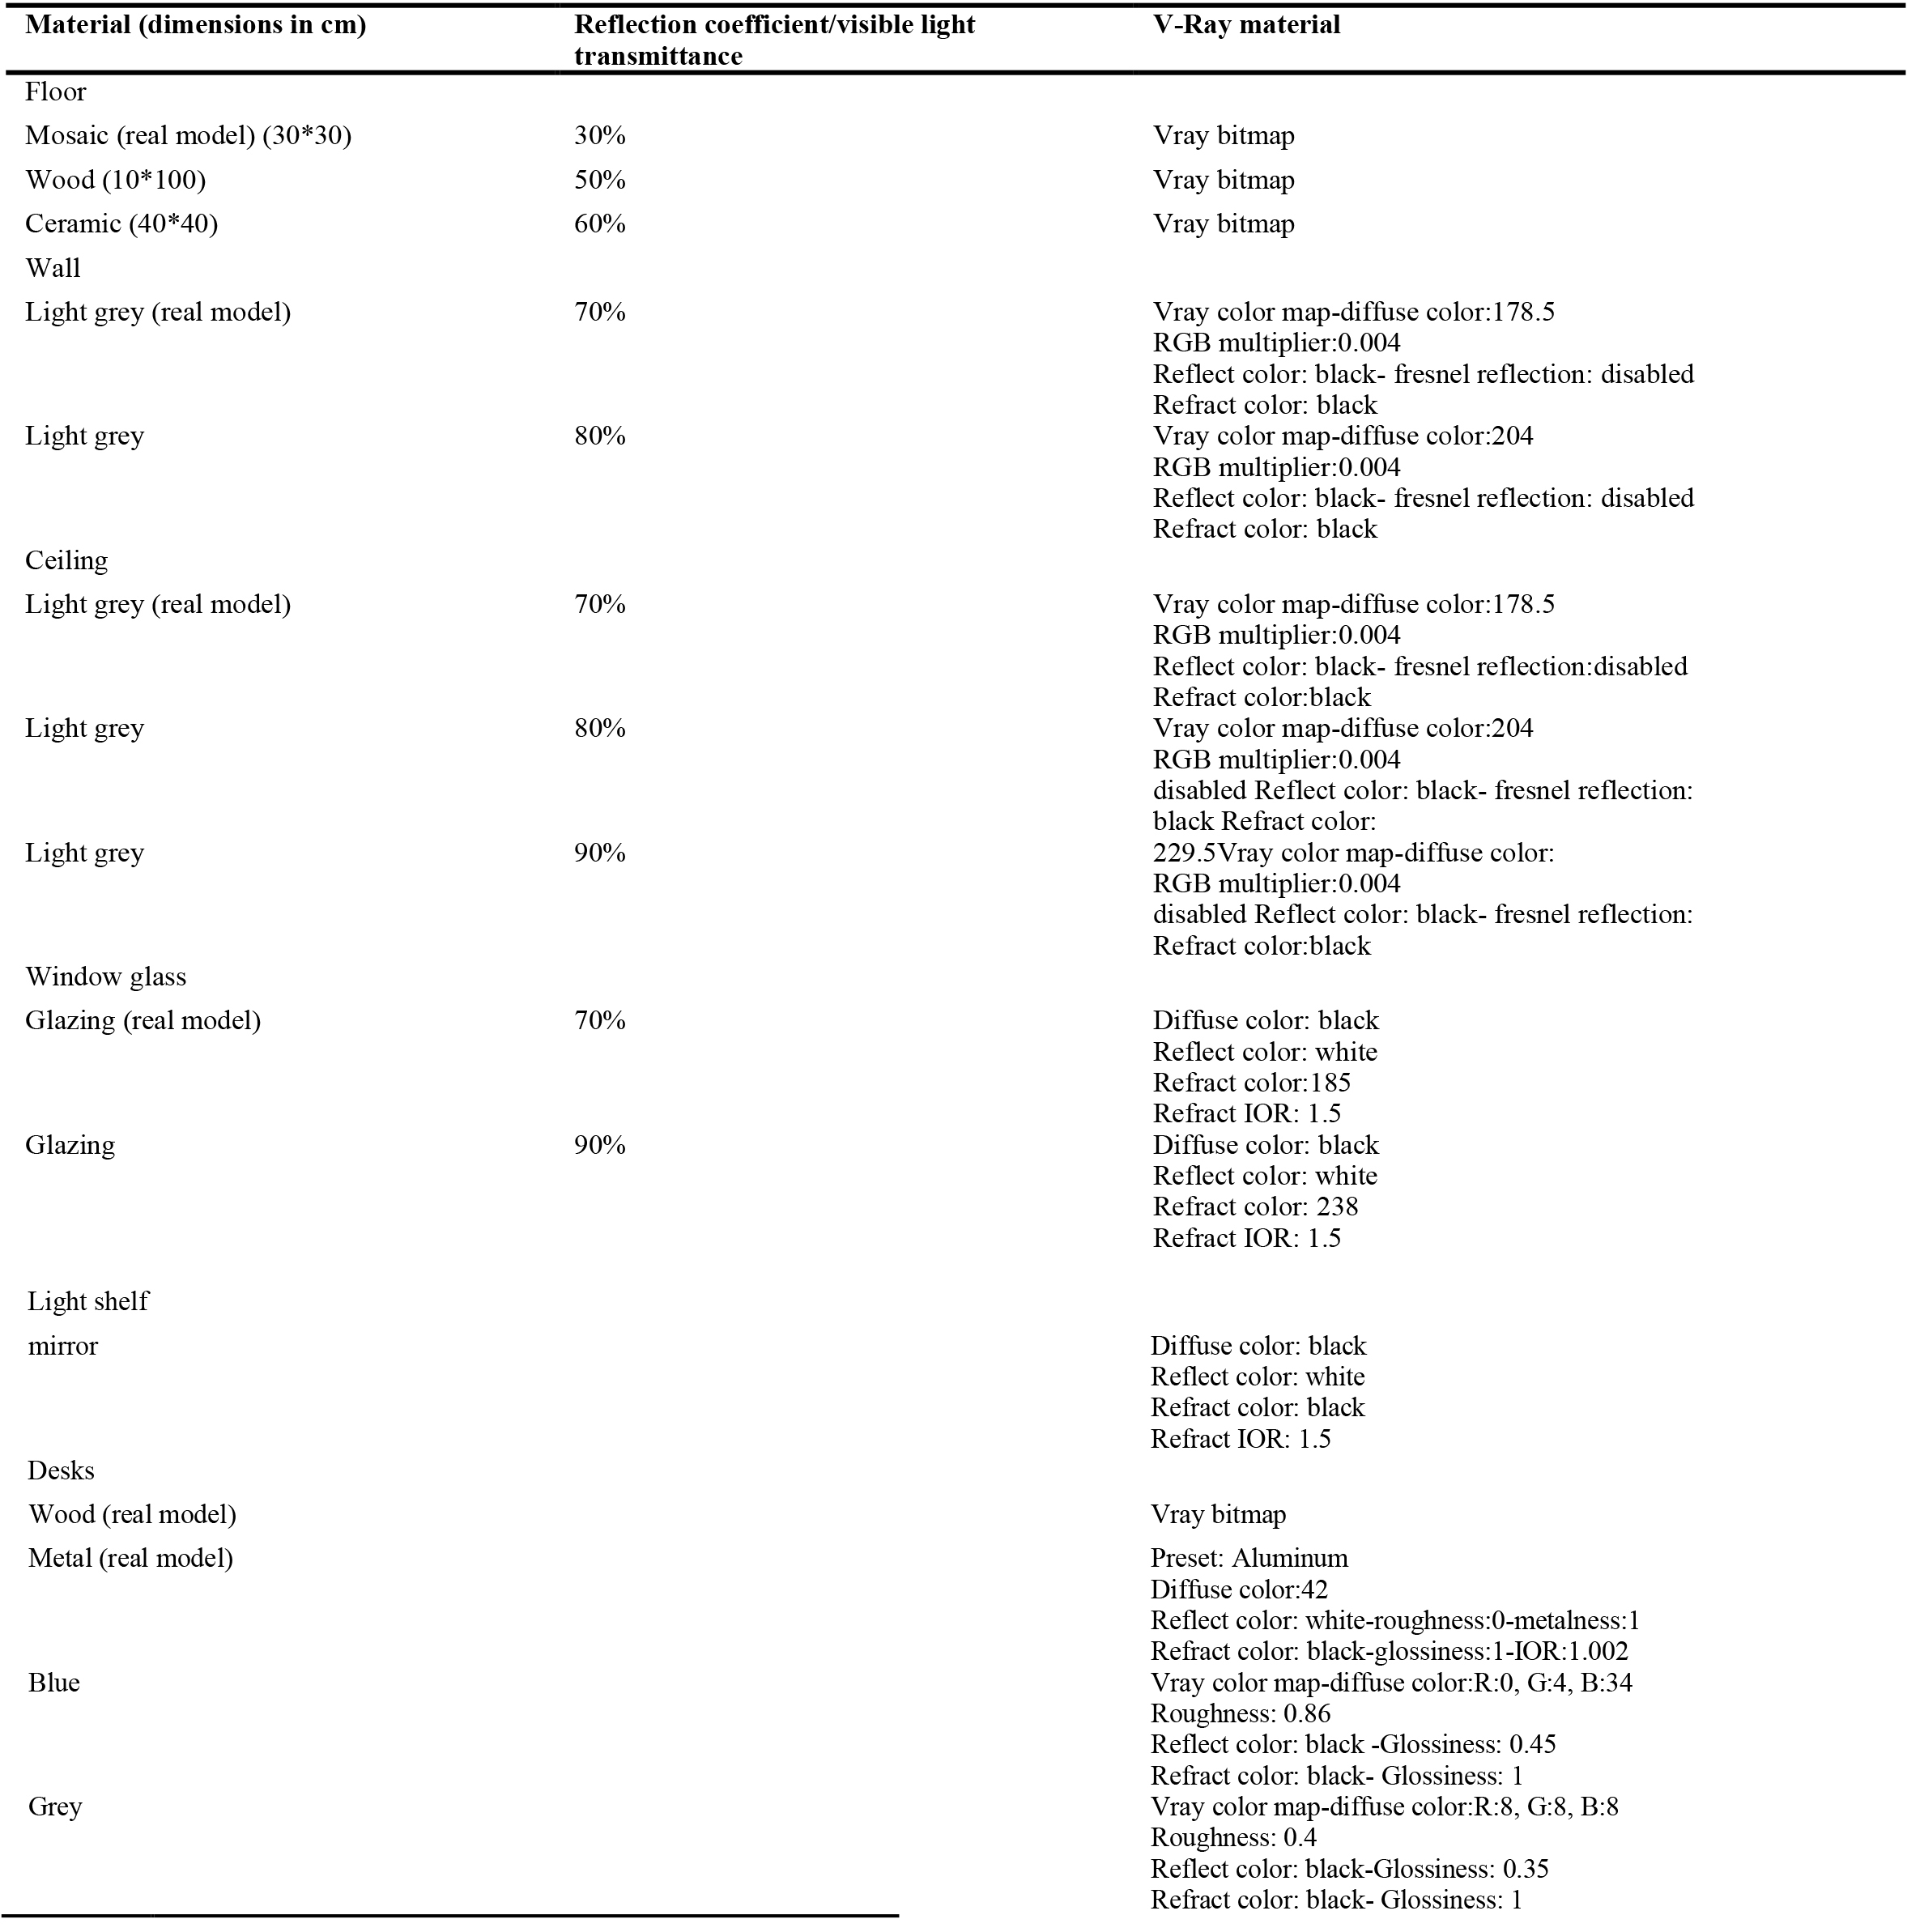
Table A2. V-Ray material properties for the surfaces (variables).
Appendix A2
Gender:
Age:
Major:
Academic Degree:
Undergraduate
Master of Science
PhD
Have you ever experienced VR Headset?
Yes
No
Your previous space:
Indoor
Outdoor
Table A3
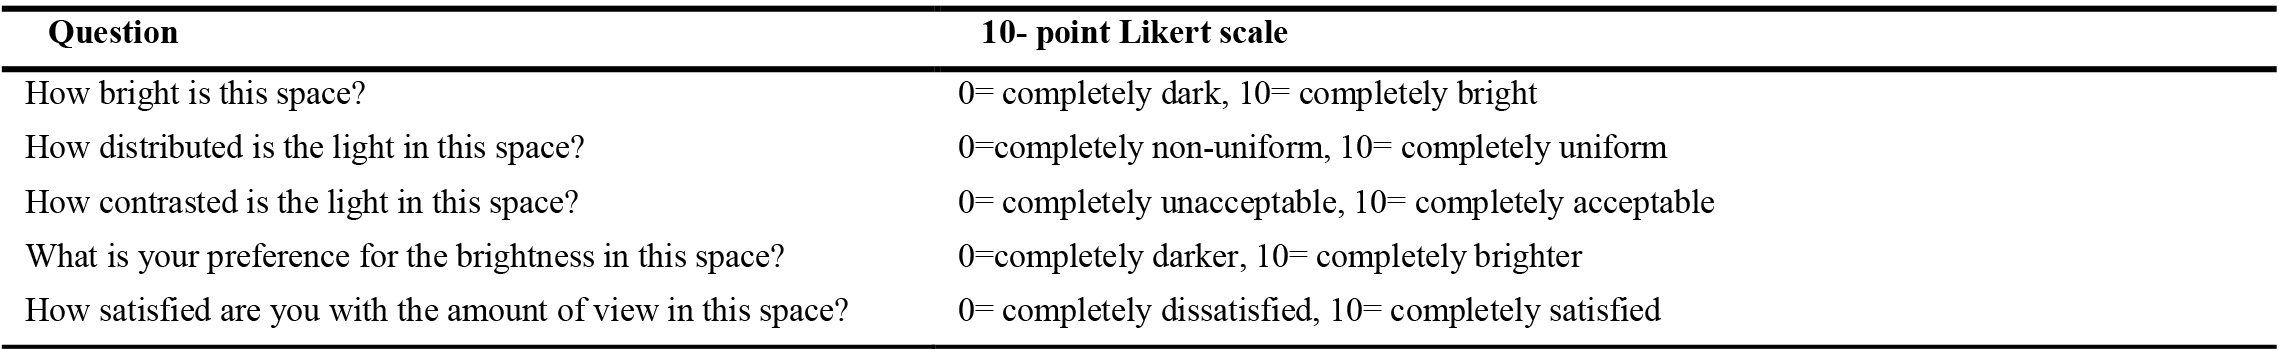
Table A3. The verbal questionnaire of the experiment.
Contributions
All authors contributed equally in the preparation of this article.
Declaration of competing interest
The authors declare no conflict of interest.
References
- B. Lowenhaupt Collins, A Literature Survey - Psychological Reaction to environments with and without windows, natural bureau of standards building science series (Thesis), NBS Building Science Series, 1975.
- K. M. J. Farley and J. a. Veitch, A Room With A View: A Review of the Effects of Windows on Work and Well-Being, National Reserch Council Canada, (2001). https://doi.org/10.1037/e668402012-001
- P. R. Boyce, Human factors in lighting, third ed. CRC press, 2014. https://doi.org/10.1201/b16707
- L. Edwards and P. Torcellini, A Literature Review of the Effects of Natural Light on Building Occupants A Literature Review of the Effects of Natural Light on Building Occupants, Contract, (2002). https://doi.org/10.2172/15000841
- J. A. Veitch and A. D. Galasiu, The physiological and psychological effects of windows, daylight and view at home, National Research Council of Canada, (2011). https://doi.org/10.1037/e554552013-001
- J. A. Veitch and G. R. Newsham, Lighting quality and energy-efficiency effects on task performance, mood, health, satisfaction, and comfort, Journal of the Illuminating Engineering Society 27 (1998) 107-129. https://doi.org/10.1080/00994480.1998.10748216
- L. T. Wong, K. W. Mui, and P. S. Hui, A multivariate-logistic model for acceptance of indoor environmental quality (IEQ) in offices, Building and Environment 43 (2008)1-6. https://doi.org/10.1016/j.buildenv.2007.01.001
- P. M. Bluyssen, M. Aries, and P. van Dommelen, Comfort of workers in office buildings: The European HOPE project, Building and Environment 46 (2011) 280-288. https://doi.org/10.1016/j.buildenv.2010.07.024
- A. Astolfi and F. Pellerey, Subjective and objective assessment of acoustical and overall environmental quality in secondary school classrooms, The Journal of the Acoustical Society of America 123, (2008), 163-17. https://doi.org/10.1121/1.2816563
- A. C. K. Lai, K. W. Mui, L. T. Wong, and L. Y. Law, An evaluation model for indoor environmental quality (IEQ) acceptance in residential buildings, Energy and Buildings 41 (2009) 930-936. https://doi.org/10.1016/j.enbuild.2009.03.016
- A. Bellazzi et al., Virtual reality for assessing visual quality and lighting perception: A systematic review, Building and Environment 209 (2022) 108674. https://doi.org/10.1016/j.buildenv.2021.108674
- K. Parpairi, N. V. Baker, K. A. Steemers, and R. Compagnon, The Luminance Differences index: A new indicator of user preferences in daylit spaces, Lighting Research & Technology 34 (2002) 53-66. https://doi.org/10.1191/1365782802li030oa
- D. L.Buttler and P. M.Biner, Effects of setting onwindow prefrences and factors associated with those prefrences, Environment and Behavior 21 (1989) 17-31. https://doi.org/10.1177/0013916589211002
- N. J.Stone, Windows and environmental cues on performance and mood, Environment and Behavior 30 (1998) 306-321. https://doi.org/10.1177/001391659803000303
- B. Matusiak, The impact of lighting/daylighting and reflectances on the size impression of the room. full-scale studies, Architectural Science Review 47 (2004) 115-119. https://doi.org/10.1080/00038628.2004.9697034
- U. P. Moscoso, C., Matusiak, B., and Svensson, Impact of window size and room reflectance on the perceived quality of a room, Journal of Architectural and Planning Research 32, (2015).
- E. Ne'eman and R. G. Hopkinson, Critical minimum acceptable window size: A study of window design and provision of a view, Lighting Research and Technology 2 (1970) 17-27. https://doi.org/10.1177/14771535700020010701
- R. D. and J. L. P. CHAUVEL, J. B. COLLINS, Glare from windows: current views of the problem, Lighting Research & Technology 14 (1982) 31-46. https://doi.org/10.1177/096032718201400103
- E. C. Keighley, Visual requirements and reduced fenestration in offices - a study of multiple apertures and window area, Building Science 8 (1973) 321-331. https://doi.org/10.1016/0007-3628(73)90017-0
- E. Ne'eman and R. G. Hopkinson, Critical minimum acceptable window size: A study of window design and provision of a view, Light. Res. Technol. 2 (1970) 17-27. https://doi.org/10.1177/14771535700020010701
- Department for Education & Employment, Departmental Report, United Kingdom,1999.
- R. Küller and C. Lindsten, Health and behavior of children in classrooms with and without windows, Journal of Environmental Psychology 12 (1992) 305-317. https://doi.org/10.1016/S0272-4944(05)80079-9
- R. P. Don Aumann, Lisa Heschong, Roger Wright, Windows and classrooms : a study of student performance and indoor environment, CLIMA 2007 Wellbeing Indoors 2, 2003.
- N. S. Shafavi, M. Tahsildoost, and Z. S. Zomorodian, Investigation of illuminance-based metrics in predicting occupants' visual comfort (case study: Architecture design studios), Solar Energy 197,(2020), 111-125. https://doi.org/10.1016/j.solener.2019.12.051
- N. S. Shafavi, Z. S. Zomorodian, M. Tahsildoost, and M. Javadi, Occupants visual comfort assessments: A review of field studies and lab experiments, Solar Energy 208, (2021), 249-274. https://doi.org/10.1016/j.solener.2020.07.058
- H. Bulow-Hube, Subjective reactions to daylight in rooms: Effect of using low emittance coatings on windows, Lighting Research & Technology 1 (1995). https://doi.org/10.1177/14771535950270010601
- G. R. Newsham, D. Cetegen, J. A. Veitch, and L. Whitehead, Comparing lighting quality evaluations of real scenes with those from high dynamic range and conventional images, ACM Transactions on Applied Perception 7 (2010) 1-26. https://doi.org/10.1145/1670671.1670677
- C. Hendrick, O. Martyniuk, T. J. Spencer, and J. E. Flynn, Procedures for Investigating the Effect of Light on Impression, Environment and Behavior 9 (1977) 491-510. https://doi.org/10.1177/001391657794003
- G. R. Newsham, C. Richardson, C. Blanchet, and J. A. Veitch, Lighting quality research using rendered images of offices, Lighting Research and Technology 37 (2005) 93-112. https://doi.org/10.1191/1365782805li132oa
- C. Moscoso, B. Matusiak, U. P. Svensson, and K. Orleanski, Analysis of stereoscopic images as a new method for daylighting studies, ACM Transactions on Applied Perception 11 (2015) 1-13. https://doi.org/10.1145/2665078
- K. Chamilothori, J. Wienold, and M. Andersen, Adequacy of Immersive Virtual Reality for the Perception of Daylit Spaces: Comparison of Real and Virtual Environments, LEUKOS 15 (2019) 203-226. https://doi.org/10.1080/15502724.2017.1404918
- C. Moscoso, M. Nazari, and B. S. Matusiak, Stereoscopic Images and Virtual Reality techniques in daylighting research: A method-comparison study, Building and Environment 214 (2021) 108962. https://doi.org/10.1016/j.buildenv.2022.108962
- C. DeCoro and N. Tatarchuk, Real-time mesh simplification using the GPU, Proceedings - I3D 2007, ACM SIGGRAPH Symposium on Interactive 3D Graphics and Games, 2007, pp. 161-166, New York. https://doi.org/10.1145/1230100.1230128
- W. R. S. and A. B. M. K. Craig, Understanding Virtual Reality-Interface, Application, and Design, second ed, Morgan Kaufmann, United States, 2003.
- F. Abd-Alhamid, M. Kent, C. Bennett, J. Calautit, and Y. Wu, Developing an Innovative Method for Visual Perception Evaluation in a Physical-Based Virtual Environment, Building and Environment 162 (2019) 106278. https://doi.org/10.1016/j.buildenv.2019.106278
- Y. Chen, Z. Cui, and L. Hao, Virtual reality in lighting research: Comparing physical and virtual lighting environments, Lighting Research and Technology 51 (2019) 820-837. https://doi.org/10.1177/1477153518825387
- J. Marín-Morales, C. Llinares, J. Guixeres, and M. Alcañiz, Emotion recognition in immersive virtual reality: From statistics to affective computing, Sensors 20 (2020) 1-26. https://doi.org/10.3390/s20185163
- M. Hegazy and K. Yasufuku, Visualizing user perception of daylighting : a comparison between VR and reality Visualizing user perception of daylighting, 2020.
- T. Hong, M. Lee, S. Yeom, and K. Jeong, Occupant responses on satisfaction with window size in physical and virtual built environments, Building and Environment 166 (2019) 106409. https://doi.org/10.1016/j.buildenv.2019.106409
- M. Marzouk, M. ElSharkawy, and A. Mahmoud, Analysing user daylight preferences in heritage buildings using virtual reality, Building Simulation 15, (2022) 1561-1576. https://doi.org/10.1007/s12273-021-0873-9
- L. Grace, Evaluating daylight lighting appearances in virtual environments (Thesis), Undergraduate Research Scholars Program, 2022.
- S. F. Kuliga, T. Thrash, R. C. Dalton, and C. Hölscher, Virtual reality as an empirical research tool - Exploring user experience in a real building and a corresponding virtual model, Computers, Environment and Urban Systems 54 (2015) 363-375. https://doi.org/10.1016/j.compenvurbsys.2015.09.006
- A. Bellazzi et al., Virtual reality for assessing visual quality and lighting perception: A systematic review, Building and Environment 209 (2022) 108674. https://doi.org/10.1016/j.buildenv.2021.108674
- K. Chamilothori, G. Chinazzo, J. Rodrigues, E. S. Dan-Glauser, J. Wienold, and M. Andersen, Subjective and physiological responses to façade and sunlight pattern geometry in virtual reality, Building and Environment 150 (2019) 144-155. https://doi.org/10.1016/j.buildenv.2019.01.009
- K. Chamilothori, Perceptual effects of daylight patterns in architecture (Thesis), Laboratoire de Performance Intégrée au Design, 2019.
- A. O. Sawyer and K. Chamilothori, Influence of Subjective Impressions of a Space on Brightness Satisfaction: an Experimental Study in Virtual Reality, Simulation For Architecture and Urban Design (SimAUD), (2019).
- C. Moscoso et al., Window Size Effects on Subjective Impressions of Daylit Spaces: Indoor Studies at High Latitudes Using Virtual Reality, LEUKOS (2020) 1-23. https://doi.org/10.1080/15502724.2020.1726183
- J. F. Flor, M. Aburas, F. Abd-AlHamid, and Y. Wu, Virtual reality as a tool for evaluating user acceptance of view clarity through ETFE double-skin façades, Energy and Buildings 231 (2020) 110554. https://doi.org/10.1016/j.enbuild.2020.110554
- G. Chinazzo, K. Chamilothori, J. Wienold, and M. Andersen, Temperature-Color Interaction: Subjective Indoor Environmental Perception and Physiological Responses in Virtual Reality, Human Factors, 2020. https://doi.org/10.1177/0018720819892383
- A. Latini, E. Di Giuseppe, M. D'Orazio, and C. Di Perna, Exploring use of immersive virtual reality to assess occupants' productivity and comfort in workplaces: An experimental study on the role of walls colour, Energy and Buildings 231 (2021) 110554. https://doi.org/10.1016/j.enbuild.2021.111508
- S. Niu, W. Pan, and Y. Zhao, A Virtual Reality Supported Approach to Occupancy Engagement in Building Energy Design for Closing the Energy Performance Gap, Procedia Engineering 118 (2015) 573-580. https://doi.org/10.1016/j.proeng.2015.08.487
- A. Heydarian, E. Pantazis, J. P. Carneiro, D. Gerber, and B. Becerik-Gerber, Lights, building, action: Impact of default lighting settings on occupant behaviour, Journal of Environmental Psychology 48 (2016) 212-223, . https://doi.org/10.1016/j.jenvp.2016.11.001
- A. Heydarian, J. P. Carneiro, D. Gerber, B. Becerik-Gerber, T. Hayes, and W. Wood, Immersive virtual environments: Experiments on impacting design and human building interaction, in: Rethinking Comprehensive Design: Speculative Counterculture - Proceedings of the 19th International Conference on Computer-Aided Architectural Design Research in Asia, CAADRIA 2014, 2014, pp. 729-738, Kyoto, Japan https://doi.org/10.52842/conf.caadria.2014.729
- S. Zhao, Y. Ni, G. Dong, J. Tian, and Y. Chen, Comparing three XR technologies in reviewing performance-based building design: A pilot study of façade fenestrations, Computer animation and virtual worlds, 2023. https://doi.org/10.1002/cav.2139
- N. Castilla, J. L. Higuera-Trujillo, and C. Llinares, The effects of illuminance on students′ memory. A neuroarchitecture study, Building and Environment 228 (2023) 109833. https://doi.org/10.1016/j.buildenv.2022.109833
- J. A. Veitch and G. R. Newsham, Preferred luminous conditions in practice recommendations, Lighting Research and Technology 32 (2000) 24-30. https://doi.org/10.1177/096032710003200404
- K. Van Den Wymelenberg, M. Inanici, and P. Johnson, The effect of luminance distribution patterns on occupant preference in a daylit office environment, LEUKOS 7 (2010) 103-122. https://doi.org/10.1582/LEUKOS.2010.07.02003
- K. Chamilothori, J. Wienold, C. Moscoso, B. Matusiak, and M. Andersen, Regional Differences in the Perception of Daylit Scenes across Europe Using Virtual Reality. Part II: Effects of Façade and Daylight Pattern Geometry, LEUKOS 18 (2022) 316-340. https://doi.org/10.1080/15502724.2021.1999257
- Chaosgroup, 2017, V-Ray Illumination Relevance Test, [Online], Available: https://docs.chaos.com/display/VMAX/V-Ray+Illumination+Relevance+Test, Accessed 31 August 2020.
- C. Reinhart and P. Breton, Experimental Validation of Autodesk 3ds Max Design 2009 and Daysim 3.0, LEUKOS (2009) 7-35. https://doi.org/10.1582/LEUKOS.2009.06.01001
- E. Reinhard, M. Stark, P. Shirley, and J. Ferwerda, Photographic tone reproduction for digital images, in: Proceedings of the 29th Annual Conference on Computer Graphics and Interactive Techniques, SIGGRAPH '02, 2002, pp. 267-276, Texas. https://doi.org/10.1145/566570.566575
- C. Cauwert, Influence of presentation modes on visual perceptions of daylit spaces, Thesis, 2013.
- J. Duff, K. Kelly, and C. Cuttle, Perceived adequacy of illumination, spatial brightness, horizontal illuminance and mean room surface exitance in a small office, Lighting Research and Technology 49 (2017) 133-146. https://doi.org/10.1177/1477153515599189
- M. C. Dubois, F. Cantin, K. Johnsen, and W. K. E. Osterhaus, The effect of coated glazing on visual perception: A pilot study using scale models, Lighting Research and Technology 39 (2007) 283-304. https://doi.org/10.1177/1477153507080074
- S. Rockcastle, K. Chamilothori, and M. Andersen, An Experiment in Virtual Reality to Measure Daylight-Driven Interest in Rendered Architectural Scenes, Building Simulation (2017) 2577-2586. https://doi.org/10.26868/25222708.2017.828
- C. Tamura, M. Schweiker, and C. Moosman, Visual Perception and Daylight Variables : Experiments in a Climate Chamber, in: PLEA 2017 - Design to Thrive, 2017,pp. 8, Edinburgh.
- E. Guidolin, Impact of window amount and size on user perception , daylighting and energy demand in an office space(Thesis), Università degli Studi di Padova , 2014.
- A. Bartosh and B. Krietemeyer, Virtual Environment for Design and Analysis (VEDA): Interactive and Immersive Energy Data Visualizations for Architectural Design, Technology Architecture and Design 1 (2017) 50-60. https://doi.org/10.1080/24751448.2017.1292794
- M. Hegazy, K. Yasufuku, and H. Abe, Evaluating and visualizing perceptual impressions of daylighting in immersive virtual environments, Journal of Asian Architecture and Building Engineering (2020) 1-17. https://doi.org/10.1080/13467581.2020.1800477
- Y. B. W. Nornadiah Mohd Razali, Power comparisons of Shapiro-Wilk, Kolmogorov-Smirnov, Lilliefors and Anderson-Darling tests, journal of statistical modeling and analytics 2 (2011) 21-33.
- M. Lund, Testing for Normality using SPSS Statistics, Lund Research Ltd, 2018. C:\Users\irfan\OneDrive\Desktop\410\zzzzzzzz
- A. Rizzi, T. Algeri, G. Medeghini, and D. Marini, A proposal for contrast measure in digital images,in: CGIV 2004 - Second European Conference on Color in Graphics, Imaging, and Vision and Sixth International Symposium on Multispectral Color Science, 2004, pp. 187-192, Germany.
- S. Rockcastle and M. Andersen, Human perceptions of daylight composition in architecture: A preliminary study to compare quantitative contrast measures with subjective user assessments in hdr renderings,in: 14th International Conference of IBPSA - Building Simulation 2015, 2015, pp. 1205-1212, India.
- S. Rockcastle, M. L. Amundadottir, and M. Andersen, Contrast measures for predicting perceptual effects of daylight in architectural renderings, Lighting Research and Technology 49 (2017) 35-40. https://doi.org/10.1177/1477153516644292
- S. F. Rockcastle, Perceptual Dynamics of Daylight in Architecture (Thesis), Ecole polytechnique fédérale de Lausanne, 2017.
- S. Rockcastle, ML. Amundadottir, M. Andersen, Contrast measures for predicting perceptual effects of daylight in architectural renderings, Lighting Research & Technology 49 (2016) 35-40. https://doi.org/10.1177/1477153516644292
- Z. S. Zomorodian and M. Tahsildoost, Assessing the effectiveness of dynamic metrics in predicting daylight availability and visual comfort in classrooms, Renewable Energy 134 (2019) 669-680. https://doi.org/10.1016/j.renene.2018.11.072
- A. Michael and C. Heracleous, Assessment of natural lighting performance and visual comfort of educational architecture in Southern Europe: The case of typical educational school premises in Cyprus, Energy and Buildings 140 (2017) 443-457. https://doi.org/10.1016/j.enbuild.2016.12.087
- A. Heydarian, E. Pantazis, A. Wang, D. Gerber, and B. Becerik-Gerber, Towards user centered building design: Identifying end-user lighting preferences via immersive virtual environments, Automation in Construction 81 (2017) 56-66. https://doi.org/10.1016/j.autcon.2017.05.003
- A. Heydarian, J. P. Carneiro, D. Gerber, and B. Becerik-Gerber, Immersive virtual environments, understanding the impact of design features and occupant choice upon lighting for building performance, Building and Environment 89 (2015) 217-228. https://doi.org/10.1016/j.buildenv.2015.02.038
Copyright © 2023 The Author(s). Published by solarlits.com.

3530
Total views
Citations
SHARE ON


