Volume 10 Issue 1 pp. 60-71 • doi: 10.15627/jd.2023.5
The Architectural Design of Building Façade Models Related to Optimizing Daylight Distribution
Nurul Jamala,⁎,a Baharuddin Hamzah,a Rosady Mulyadi,a Isty Cahyanib
Author affiliations
a Department of Architecture, Faculty of Engineering, Hasanuddin University, Indonesia
b Faculty of Engineering, Hasanuddin University, Indonesia
*Corresponding author.
nuruljamala@unhas.ac.id (N. Jamala)
baharsyah@unhas.ac.id (B. Hamzah)
rosady@unhas.ac.id (R. Mulyadi)
istythecat@gmail.com (I. Cahyani)
History: Received 10 February 2023 | Revised 12 March 2023 | Accepted 3 April 2023 | Published online 7 May 2023
Copyright: © 2023 The Author(s). Published by solarlits.com. This is an open access article under the CC BY license (http://creativecommons.org/licenses/by/4.0/).
Citation: Nurul Jamala, Baharuddin Hamzah, Rosady Mulyadi, Isty Cahyani, The Architectural Design of Building Façade Models Related to Optimizing Daylight Distribution, Journal of Daylighting 10 (2023) 60-71. https://dx.doi.org/10.15627/jd.2023.5
Figures and tables
Abstract
Lighting control integrated with daylighting is recognized as an important and useful strategy in energy efficient building design. One of the right factors to reduce energy consumption for artificial lighting during the day is the maximum utilization of sunlight. The aim of this research, distribution of daylight into the building analysis with five models of building facades and value of illuminance in the morning, afternoon and evening with orientation of the window openings to the northeast and southwest. Bank Mega is one of the tall buildings in Makassar Indonesia, which is located in a coastal area that is not blocked by other tall buildings, so this building is the object of research as a basis for designing façade models on building envelopes. The methodology this study is quantitative, analyzing the performance of sunlight as a source of daylighting in office buildings. This paper presents field measurements in office buildings, namely in rooms that are oriented northeast and southwest. The analysis in the two spaces is a reference to determine the effect of sunlight on the orientation of the building. In this study also conducted visual perception experiments by submitting questionnaires to 43 respondents. the results show that there are some complaints for employees, because of the high illuminance value in certain areas. Furthermore, simulate using the Radiance Illuminance Program software to determine the illuminance value of room in the morning, noon and afternoon with five building facade model designs, i.e., massive glass, vertical, horizontal, diagonal, and vertical-diagonal model. The results presented in this paper show that the distribution of daylight in an east-oriented room is higher in the morning than in the evening and noon. Whereas in the southwest orientation it is inversely proportional, the value of light distribution is higher in the afternoon than in the morning and noon. Accordingly, orientation of the building affects distribution of daylight. The massive glass facade model without using sun shading has the highest light distribution value compared to other façade models, but can cause glare and excessive brightness. Furthermore, the second highest distribution of daylight with the vertical facade model, but there are also areas that exceed the standard illuminance level for workspaces, but only in areas near window openings. The combined model of the vertical-diagonal facade which also has a high distribution of illuminance value and to redirect daylight deep into building interior simultaneously in the morning, afternoon and evening. Accordingly, façade model on envelope of building affects distribution of daylight. The aesthetic value of architectural design shows that the appearance of the building does not look monotonous or massive, when using the building facade models because there are attractive areas in the building envelope.
Keywords
Building façade, Illuminance value, Daylight, Energy
1. Introduction
Utilization of sunlight as a source of daylight is one way to minimize the consumption of electrical energy in buildings. Climate change also has an impact, because solar radiation causes excessive heat and light. This results in increased energy requirements as a cooling load as well. In terms of lighting, it can reduce energy consumption when utilizing daylight, but still consider the negative effects it causes, including glare, high brightness and illuminance value ratio. The percentage of utilization of daylighting can be different, if the architectural design of the building facade is also different. This is the basis for knowing the level of lighting in space by designing a building facade model and can be a reference in designing energy-efficient based buildings. The purpose of this study was to determine the effect of the shape of the building facade on the distribution of daylight that can enter the building. In this study analyzed five different forms of building facades, namely the massive glass, sun shading vertical, horizontal, diagonal and vertical diagonal models. This facade design is to find out the facade model that can distribute daylight into the building, so as to minimize energy use.
The daylight factor during the day is the ratio of the level of lighting at a point in the room to the level of illuminance at open field, this is a measure of the performance of the opening window on building. The standard recommendation for illuminance levels in office workspaces is 350 lux [1]. The requirements for natural lighting codes and guidelines, do so from two different points of view. The Standard General Skies of the World Organization for Standardization (ISO) and Commission International de l'Eclairage (CIE) are a set of standard skies that can mathematically represent the distribution of brightness in a sky [2]. Standards and regulations are the first considerations and subsequently focus on the development and scope of climate-based daylight modeling [3].
The aesthetic qualities are influenced by both the lighting system and the kind of sky, and the strong interaction effect suggests that the aesthetic perception of the daylighting system is dependent on the sky type. According to subsequent statistical data, the natural lighting system that performs best under both clear and cloudy sky situations is made up of high-reflective blinds [4]. The façade opening design has a significant impact on how well a building performs in terms of daylighting, solar heat gain, and natural ventilation. Under various housing conditions, the positions before opening are the most important influential factor on overall energy consumption. Meanwhile, natural ventilation and daylighting are significantly impacted by the east and west sheltering walls [5].
The results of past research show that in both climates, adaptability leads to higher energy savings, consistent with the current very low energy building definition [6]. The sunshine occurrence analysis also determined similar results using three weather statistical approach data files daylight autonomy (DA), useful daylight illuminance (UDI) and maximum difference was 5% independently of orientation [7]. Annual calculated dynamic daylight metric indicates variations of up to 13% under the different weather files analysis. This is a relevant topic since the accurate prediction of daylight levels for indoor environments guides daylighting design [8].
In addition to design solutions aimed at enhancing occupant comfort, controlling physical environmental variables like heat, light, and sound should be taken into account during the design process [9]. Previous research has shown that different facades and building facade styles affect the distribution of daylight. While the area massif glass façade in workspace has the highest level of illuminance, the vertical and horizontal strip facade models are more illuminated than the hyperbolic parabolic facade models. [10] Subsequent studies on the performance of buildings with different physical configurations and facades [11,12].
According to previous research, the building facade model affects the distribution of daylight into the room [13-15] Likewise, the orientation of the building also affects the distribution of daylight into the room [16]. This system and algorithm assess the efficiency of a smart facade, which is made up of a number of kinetic grids that respond to artificial light and take occupant preferences into account [17]. These reducing envelope technologies enable meeting the need to enhance indoor environmental quality and to simplify the building scale utilization of renewable energy sources. Because they can respond to external stimuli and change their behavior and functioning as a result, adaptive building envelopes can actually be seen as the next major advancement in façade technology [18].
The importance of building envelope design is increasing, and in this situation, the usage of passive and climate-adaptive building shells (CABS) is being looked into as a potential for energy savings and improved thermal and visual comfort for users. The findings demonstrate that systems that undergo continuous mechanical changes as a result of temperature changes offer a higher level of adaptation, energy efficiency, and thermal and visual comfort in the spaceg [19]. The model-based control (MBC) method was created and is being used for lighting and shading activities. The intention is to reduce lighting energy use and prevent glare. At an early point of the design process, the offered approaches and tools can assist the designer in examining the effects of various louver designs and operational options. Comparing the potential effects of various dynamic louver movement situations on the interior lighting is another option. This can make it easier for designers to assess and contrast different dynamic systems, which can lead to more cost-effective designs [20].
Distribution of daylight will cause glare, if the illuminance value is very high. The building facade is one of the forms that prevent glare on the building. Analysis of the quantity of daylight glare, it is better to use the CSWD(C) or Meteonome files in normal climate conditions and the Chinese average year weather file when considering extreme weather conditions [21]. It's possible that the traditional physical and photometric criteria used in glare indices and formulas are insufficient to accurately define and forecast the frequency and intensity of uncomfortable glare from both natural and artificial lights [22]. Several previous researchers have discussed glare in buildings [23-27]. Façade and shading systems have evolved into major building features that play an important role in passive design strategies [28]. Louvre is a common type of shading devices and has been increasingly used in office [29].
Those who felt more satisfied with their access to daylight were also more likely to perceive their productivity and contentment as being higher [30,31]. According to its dynamic luminous properties, sunlight is a multisensory phenomenon that can improve occupants' comfort, health, and connection to their surroundings[32,33].
Explanations from several previous studies are closely related to this research, so it can be understood the need to analyze various models of building facades for the utilization of daylight.
2. Method
The research method is a quantitative, namely describing the simulated data into a statistical program, namely SPSS to determine the increase or decrease in the illuminance value of the result on measurement in workspace. This research used the Autodesk Ecotect export to Radiance Illuminance to determine the distribution of daylight into the building.
Bank Mega Building in Makassar Indonesia is the object of this research and it’s located in the coastal area of Makassar city in Indonesia. The building has 12 floors with various functions including work space, meeting room, conference room and others. On the 6th floor there is a work space that is directly related to window openings in the building envelope. The Promotional Staff workspace (Room A) is oriented towards the northeast and the processing credit card workspace (Room B) is oriented towards the southwest, so this space is the object for measuring of illuminance value in this building, as shown in the following Fig. 1.
Figure 1
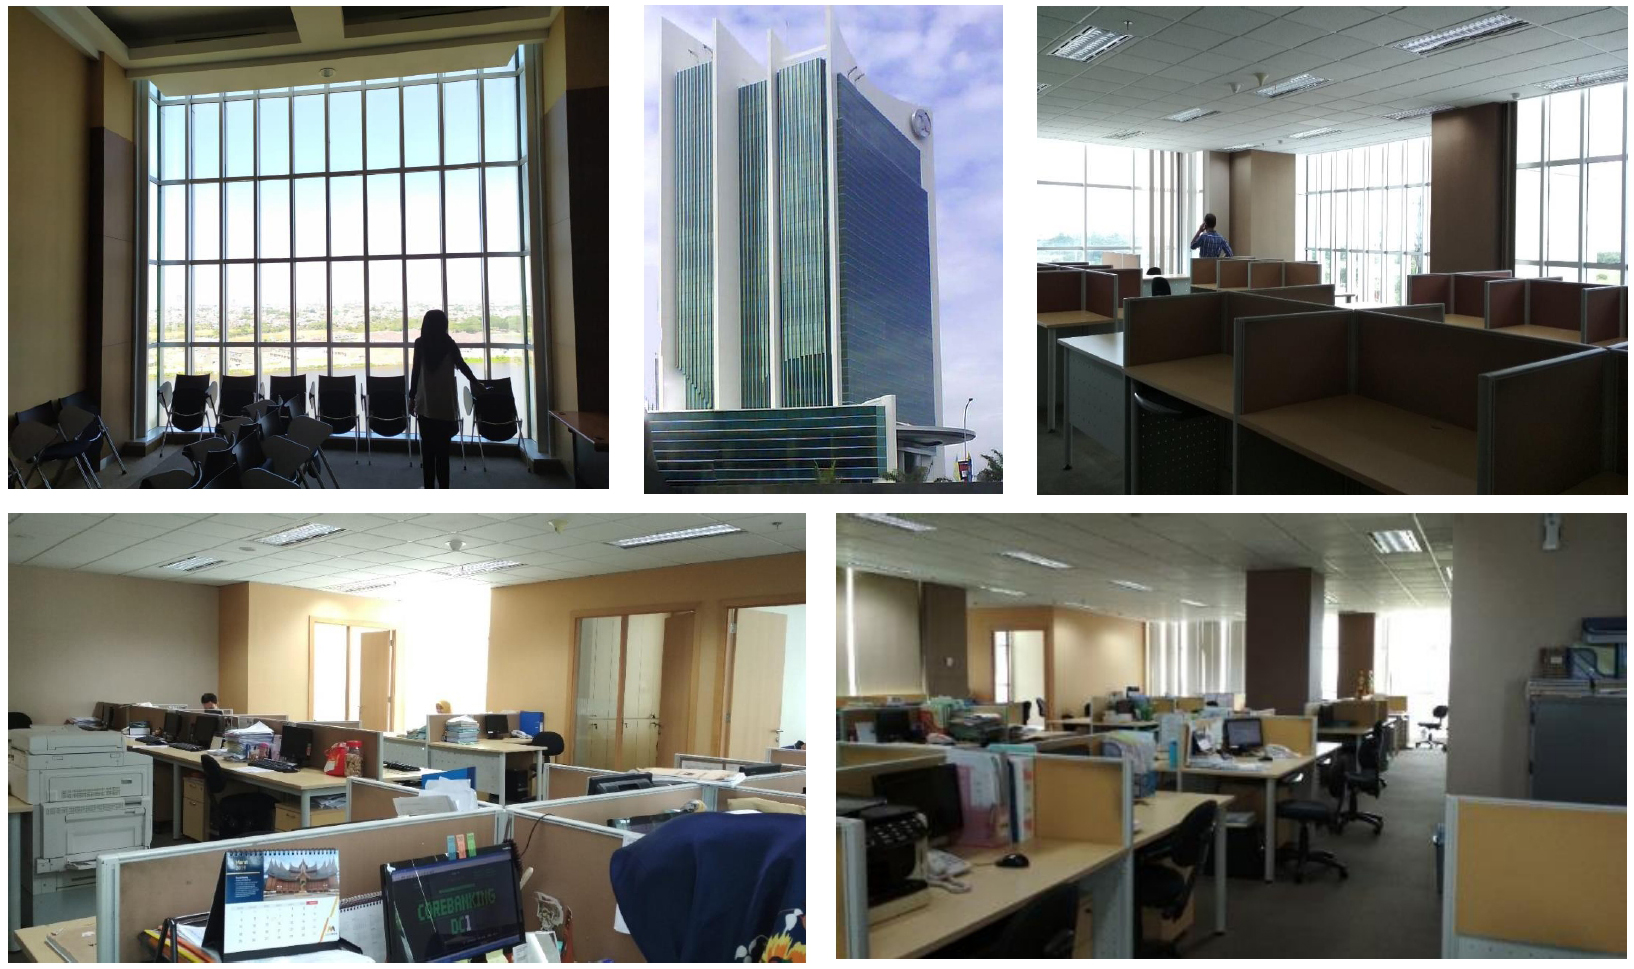
Fig. 1. Workspace in the Bank Mega Building in Makassar Indonesia.
In this research conducted simulation Radiance Illuminance Program with Makassar position is latitude of -5.1° longitude 119.5° (+8.0 DPL). All of the facade models used in this study were simulated using Makassar weather in June (23°27′ North latitude) at 8.00 (morning), 12.00 (noon) and 16.00 (afternoon).
The building's floor plan and position of the measurement points in rooms A and B are shown in Fig. 2. Building orientation is northeast (behind the building) and southwest (front the building). The distribution of daylight into the building is very excessive, especially in the building envelope area, because the building facade is massive glass and does not use sun shading. Figure 2 shows the condition of room A and B. Room A only has window openings on one side of the building envelope while room B is on two sides of the building. The layout of the workstation is arranged according to the shape of the room and does not pay attention to the condition of the distribution of daylight which can cause glare and brightness are possible effect and interfere with the activities of users.
Figure 2
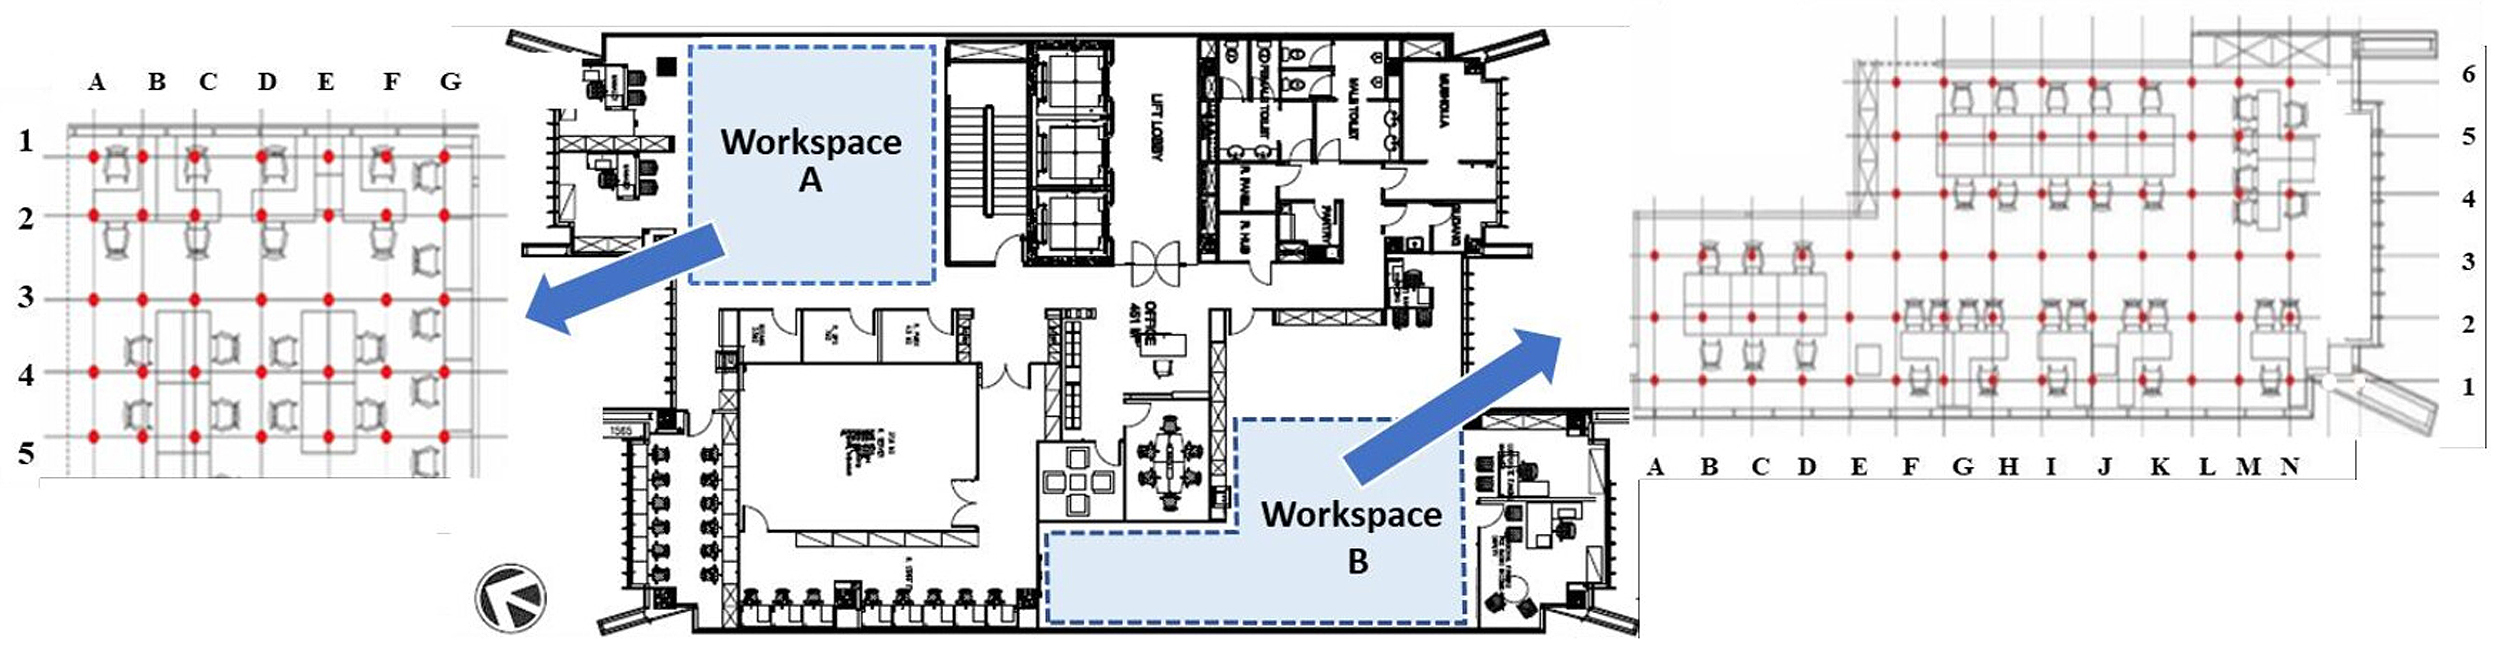
Fig. 2. Floor plan 6th and position and measurement point of room A and B in Bank Mega Makassar Indonesia.
This study analyzes the distribution of daylight into the space, with several facade models i.e. massif glass, vertical, horizontal, diagonal and vertical-diagonal facade. The distribution of daylight illuminance value for these five facade models was analyzed in room A at measuring points zone 1-5 and zone A-G in room B.
3. Result of research
3.1. Measurement result analysis of illuminance value in workspace of northeast orientation (Room A)
Measurements point on the 6th floor workspace, namely points A1-A5 to G1-G5 (Room A). Measurement of the illuminance value in the room was carried out for 3 days in the morning, noon and afternoon. The graph of the average value of the measurement results in room A is shown in Fig. 3.
Figure 3
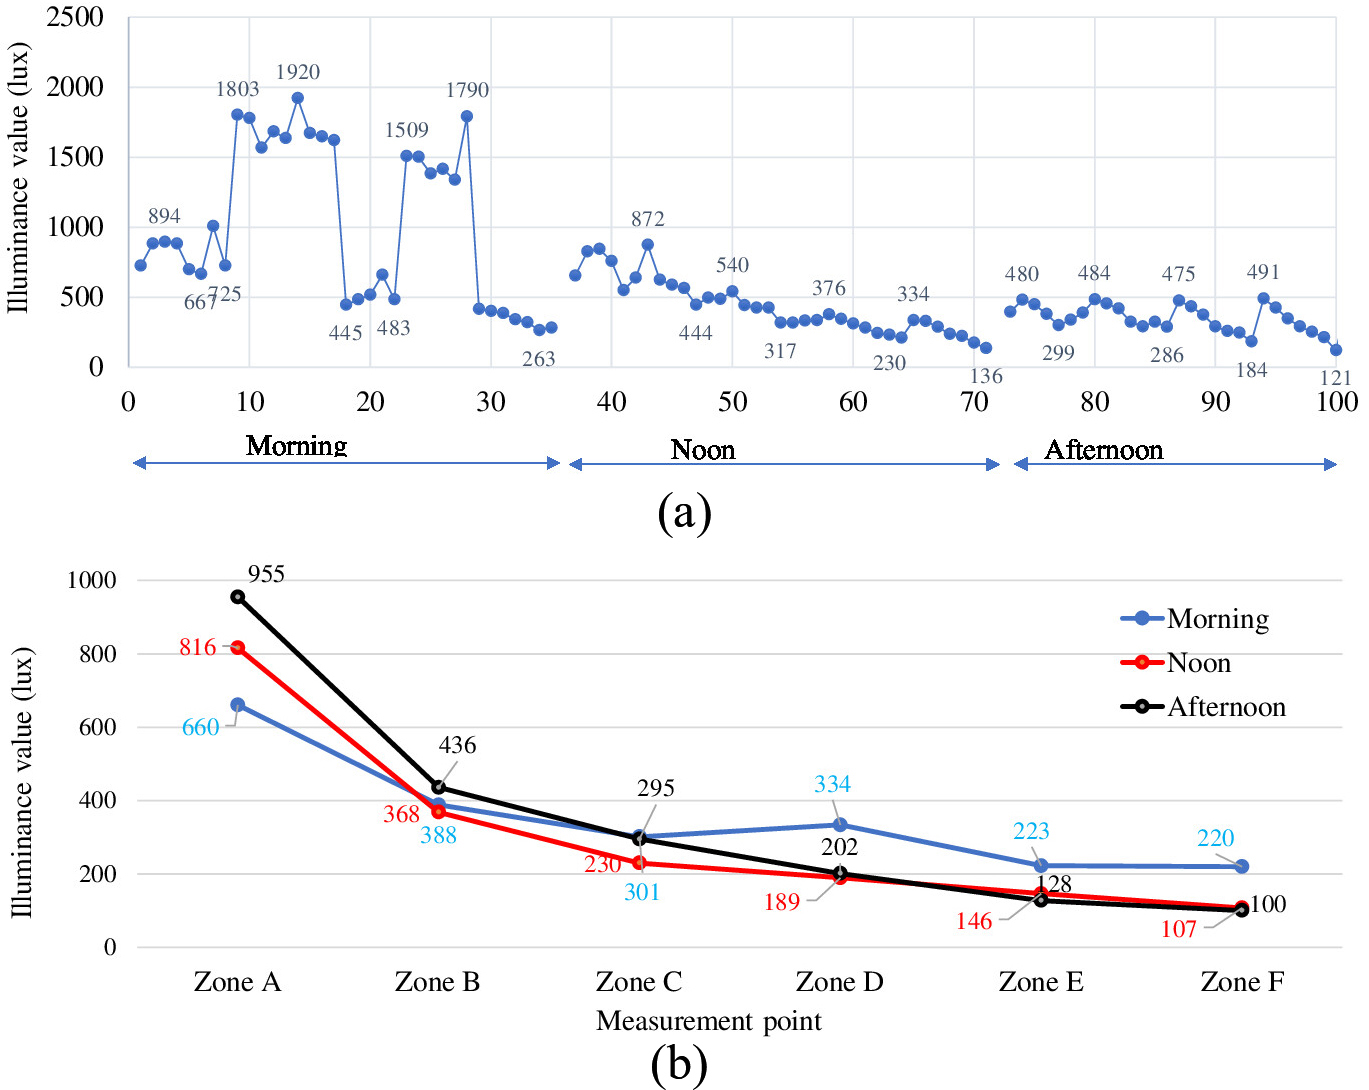
Fig. 3. (a) Mean value of measurement results in room A in the morning, noon and afternoon and (b) graph of decreasing illuminance value average at measuring points A1-G1 to A1-G5.
The measurement results show that the illuminance value decreases from morning to afternoon and evening, especially at the building envelope area, namely points A1-G1 (Zone 1) in the morning an average of 2356 lux, afternoon of 1302 lux and evening of 530 lux. The results of average illuminance value in the morning measurements are A1-G1 (zone 1) of 2356 lux, A2-G2 (Zone 2) of 791 lux, A3-G3 (Zone 3) of 439 lux A4-G4 (Zone 4) of 214 lux and A5-G5 (Zone 5) of 137 lux. This shows that the illuminance value decreases based on the depth of space or the distance from the measuring point to the window opening in the building envelope.
Figure 3 shows that there is a decrease in the percentage of illuminance values for measuring points A1-G1 to A5-G5 in the morning, afternoon and evening. Point of zone 1 to 2 is 61%, point of zone 2 to 3 is 41%, point zone 3 to 4 is 46% and point zone 4-5 is 12%. Likewise, the measurement of the illuminance value during the noon and afternoon decreases the farther from the window opening on the building envelope. To clarify the decrease in illuminance value from the morning to afternoon, it can be seen in the following graph. Then analyze the illuminance value in the area closest to the window, namely points A1 to G1 to determine the distribution of daylight in that area in the morning, afternoon and evening (Fig. 4).
Figure 4
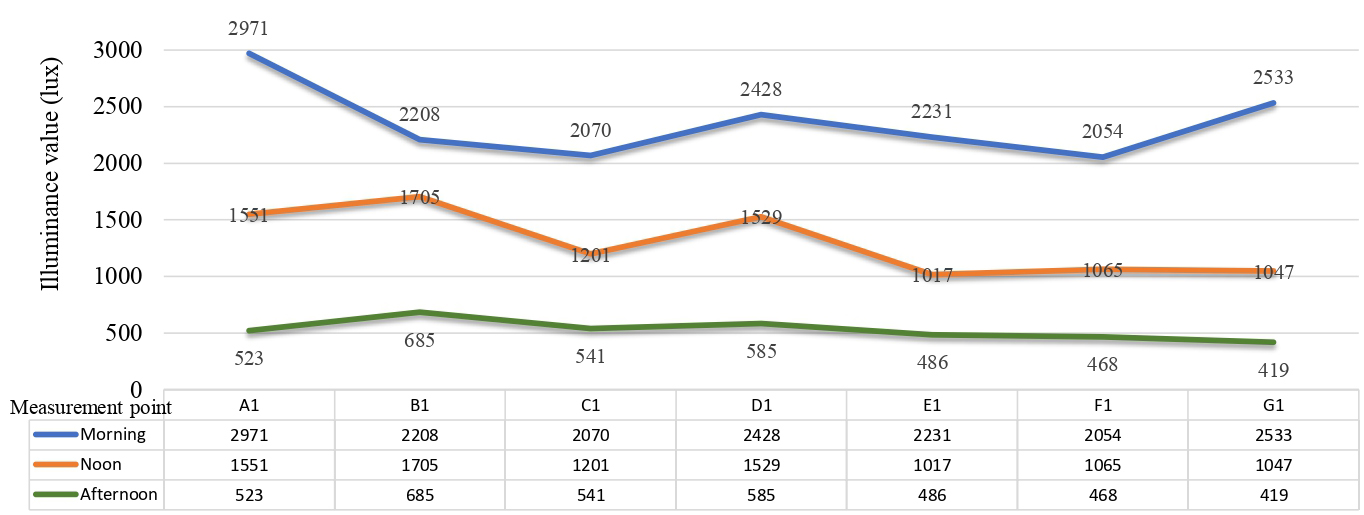
Fig. 4. The illuminance value of points A1-G1 in the morning, noon and afternoon.
Figure 4 shows a graph of the illuminance value at point A1 the highest illuminance value is 2971 lux in the morning and the lowest is 523 lux in the afternoon. The illuminance value at points B1 to G1 is also highest in the morning and lowest in the afternoon and noon. The average illuminance value at points A1-G1 is 2356 lux (morning), 1302 lux (noon) and 530 lux (afternoon). The results of the analysis show that if the orientation of the building is to the northeast, then the distribution of light in the morning is higher than in the afternoon and noon at the same position.
3.2. Illuminance value analysis in workspace of southwest orientation (Room B)
Measurement of the illuminance value in the room was carried out for 3 days in the morning, noon and afternoon. The measuring points in room B are points A1-N1 to A1-N3 and F4-N4 to F6-N6. The measuring point in room B consists of zones A-F as follows: zone A (A1-N1), zone B (A2-N2), zone C (A3-N3), zone D (F4-N4), zone E (F5-N5) and zone F (F6-N6).
Figure 5(a) shows a graph of the illuminance value of all measuring points and Fig. 5(b) shows a graph of the average value in Zone A-F. This space is oriented to the southwest and shows that in the evening the illuminance value is higher than in the afternoon and evening. Based on the average illuminance value, zone A to C is also higher in the evening compared to morning and afternoon. But in Zone C to Zone F on the inside of space is higher in the morning.
Figure 5
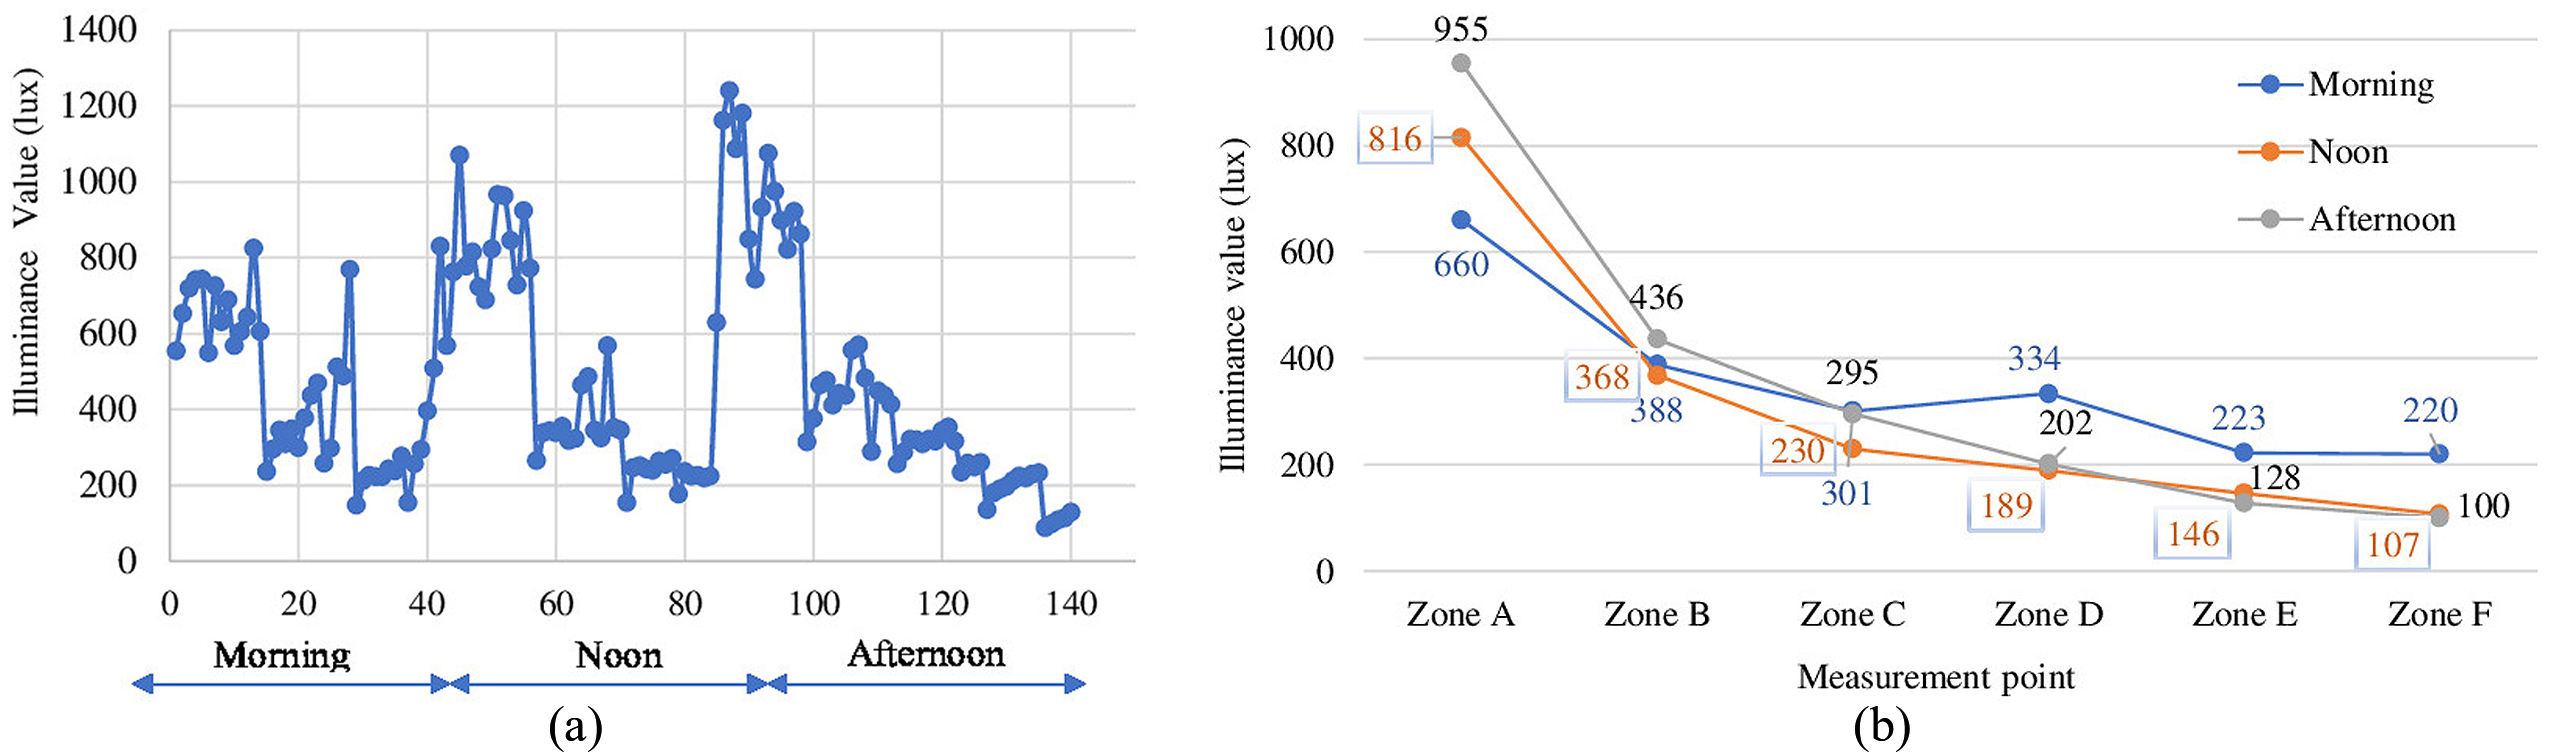
Fig. 5. (a) Mean value of measurement results in room B in the morning, noon and afternoon (b) Graph of decreasing illuminance value at measuring points Zone A-F (Room B).
Figure 5 shows the illuminance value in the northeast orientation workspace is inversely proportional to the south west orientation, especially at the measuring point in the window opening area. The graph shows that the illuminance value increases from morning to afternoon. The results of the analysis show that there are differences between rooms A and B due to different orientations. Based on the results of this analysis, it can be seen that the orientation of the building affects the distribution of daylight in to the room.
Next, we analyze the percentage of decrease in the value of illuminance against the distance of the measuring point to the window opening, this can be seen in Fig. 6. The average value of the percentage decrease in the value of illuminance for points zone A-B is 41%, zone B-C is 22%; zone C-D is 29%; zone D-E is 33%; and zone E-F is 1%. The results of the analysis show that the farther the measuring point is from the window opening, the lower of daylight distribution. Then analyze the illuminance value in the area closest to the window, namely points A1-N1, to determine the distribution of daylight into the room in the morning, afternoon and evening (Fig. 6).
Figure 6
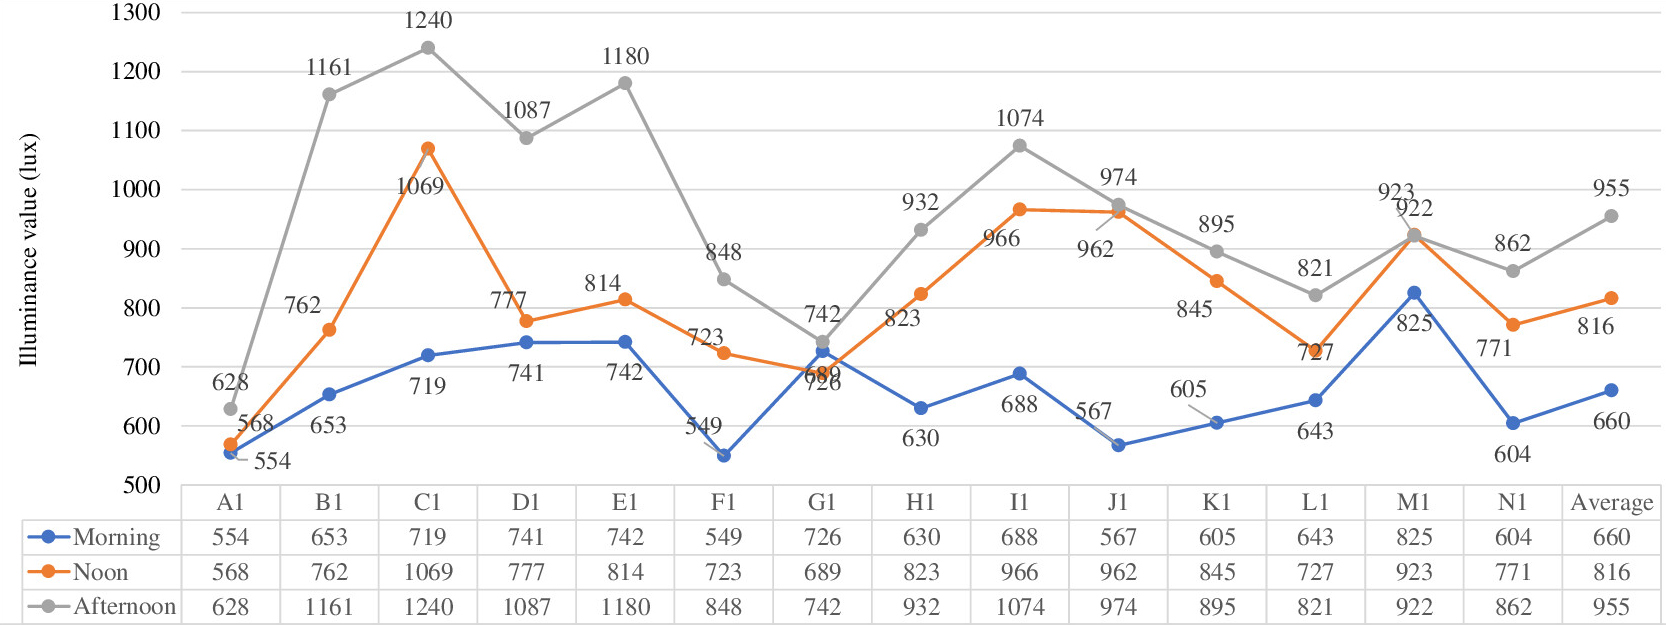
Fig. 6. The average value of the illuminance of points A1-N1 in the morning, afternoon and evening.
Figure 6 shows that the room illuminance value in the window opening area is 549 (point F1) lux to 1240 lux (point C1). This shows that the zone A area has an illuminance value above the standard recommendation. In Fig. 5 it can be seen that in zone B it is the same, but it is not overly high, whereas zones C and F have very low light levels, ranging from 301 to 100 lux. Based on this description, it appears that it is necessary to analyze the distribution of daylight into a room, in order to approach the standard illuminance recommendations for the whole space, by seeking uniformity in the distribution of daylight. To understand how daylight affects space users, it is required to conduct a visual perception experiment prior to analyze the distribution of daylight with various building façade model designs.
3.3. Visual perception
Respondents are employees who work on the 6th floor of the Bank Mega building, totaling 43 people and aged between 22-52 years. Respondents consisted of 33 men and 10 women. Most employees work more than 8 hours a day and use computers for work, with a duration of more than 4 hours of computer use. Employees who use glasses are 27.9% and do not use glasses 72.1%. Those who had a history of eye disease were 16.3% and those who did not have a history of eye disease were 83.7%.
The visual perception experiment was carried out by answering the questionnaire, namely: (1) Q1: Good lighting for work; (2) Q2: lighting helps concentration; (3) Q3: lighting helps vision when working; (4) Q4: lighting makes eyes glaring; (5) Q5: the workspace lighting is very bright; (6) Q6: lighting makes eyes tired. Before analyzing the questionnaire data, validity and reliability tests were carried out. The validity test is r count > r table (df=41 and r table= 0.3008) and the validity value of Q1-Q6 is between 0.534-0.796, so it can be said that all questionnaires are valid because the value is> 0.3008. The reliability test used the Cronbach's Apha method and showed a result of ≥ 0.6, namely 0.807.
Based on the results of this test, the 7 questionnaires were declared valid and reliable. Figure 7 shows that respondents perceive their work space as follows: a lighting system is needed to work but the lighting in their work space disturbs their work concentration. Lighting really helps vision when working, but makes eyes dazzle because it is very bright and makes eyes tired.
Figure 7
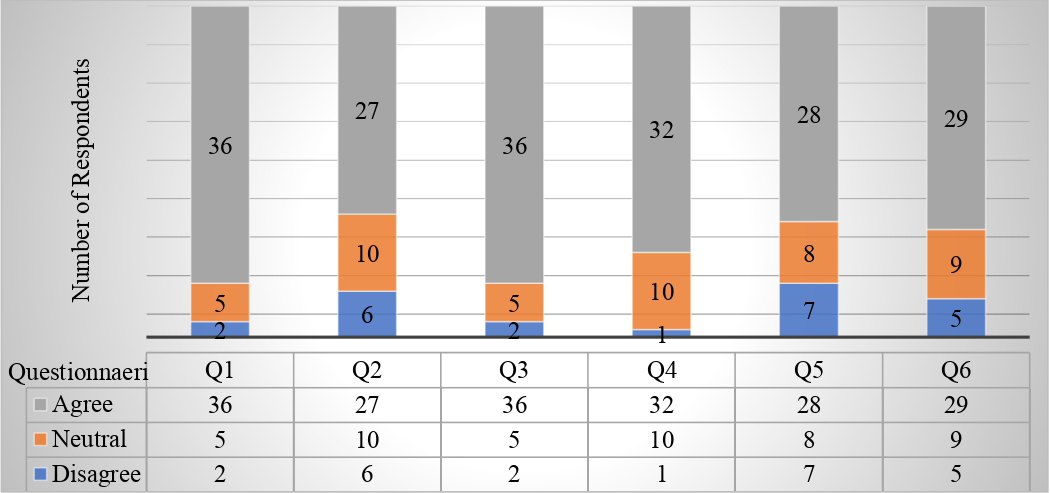
Fig. 7. Graph of result experiment of visual perception.
Based on the light conditions in the room, it can be concluded that space users in certain areas feel disturbed because the illuminance value is above 1000 lux which causes glare. In Table 1, a questionnaire related to employee complaints about the lighting in their work space.
Table 1
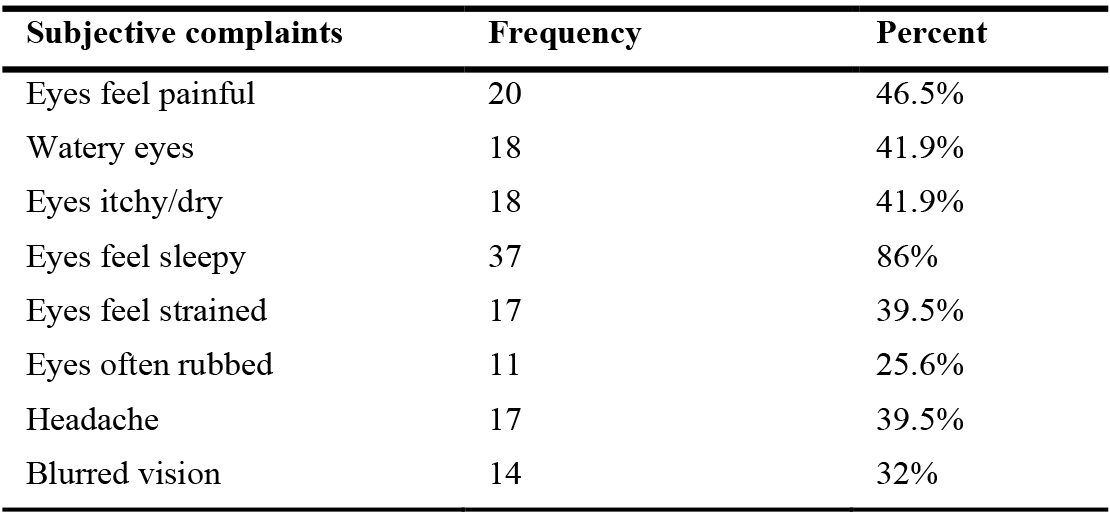
Table 1. Frequency of respondents' subjective complaints against workspace lighting.
Based on the results of this questionnaire, it can be perceived that many space users complain about very high lighting in their work space at certain times. Based on this, the research is continued with an analysis of the value of illuminance in the work space, with the alternative of using sun shading on the facade of this building so as to create a different building facade model.
3.4. The shadow of the building
Building shadows are related to the distribution of daylight, because they cover direct sunlight, so it is necessary to analyze building shadow. The shadow of the building is different in the morning, noon and afternoon, because the sun rises in the east and sets in the west. In the morning, the shadow of the building is on the front of the building, and it can be assumed that the illuminance level in the behind area of the building is higher than the front area of the building (Fig. 8). Meanwhile, in the afternoon, the front area of the building is higher than the behind area of the building. Based on the shadow that occurs in this building, it can be assumed that time and orientation affect the illuminance value in space.
Figure 8
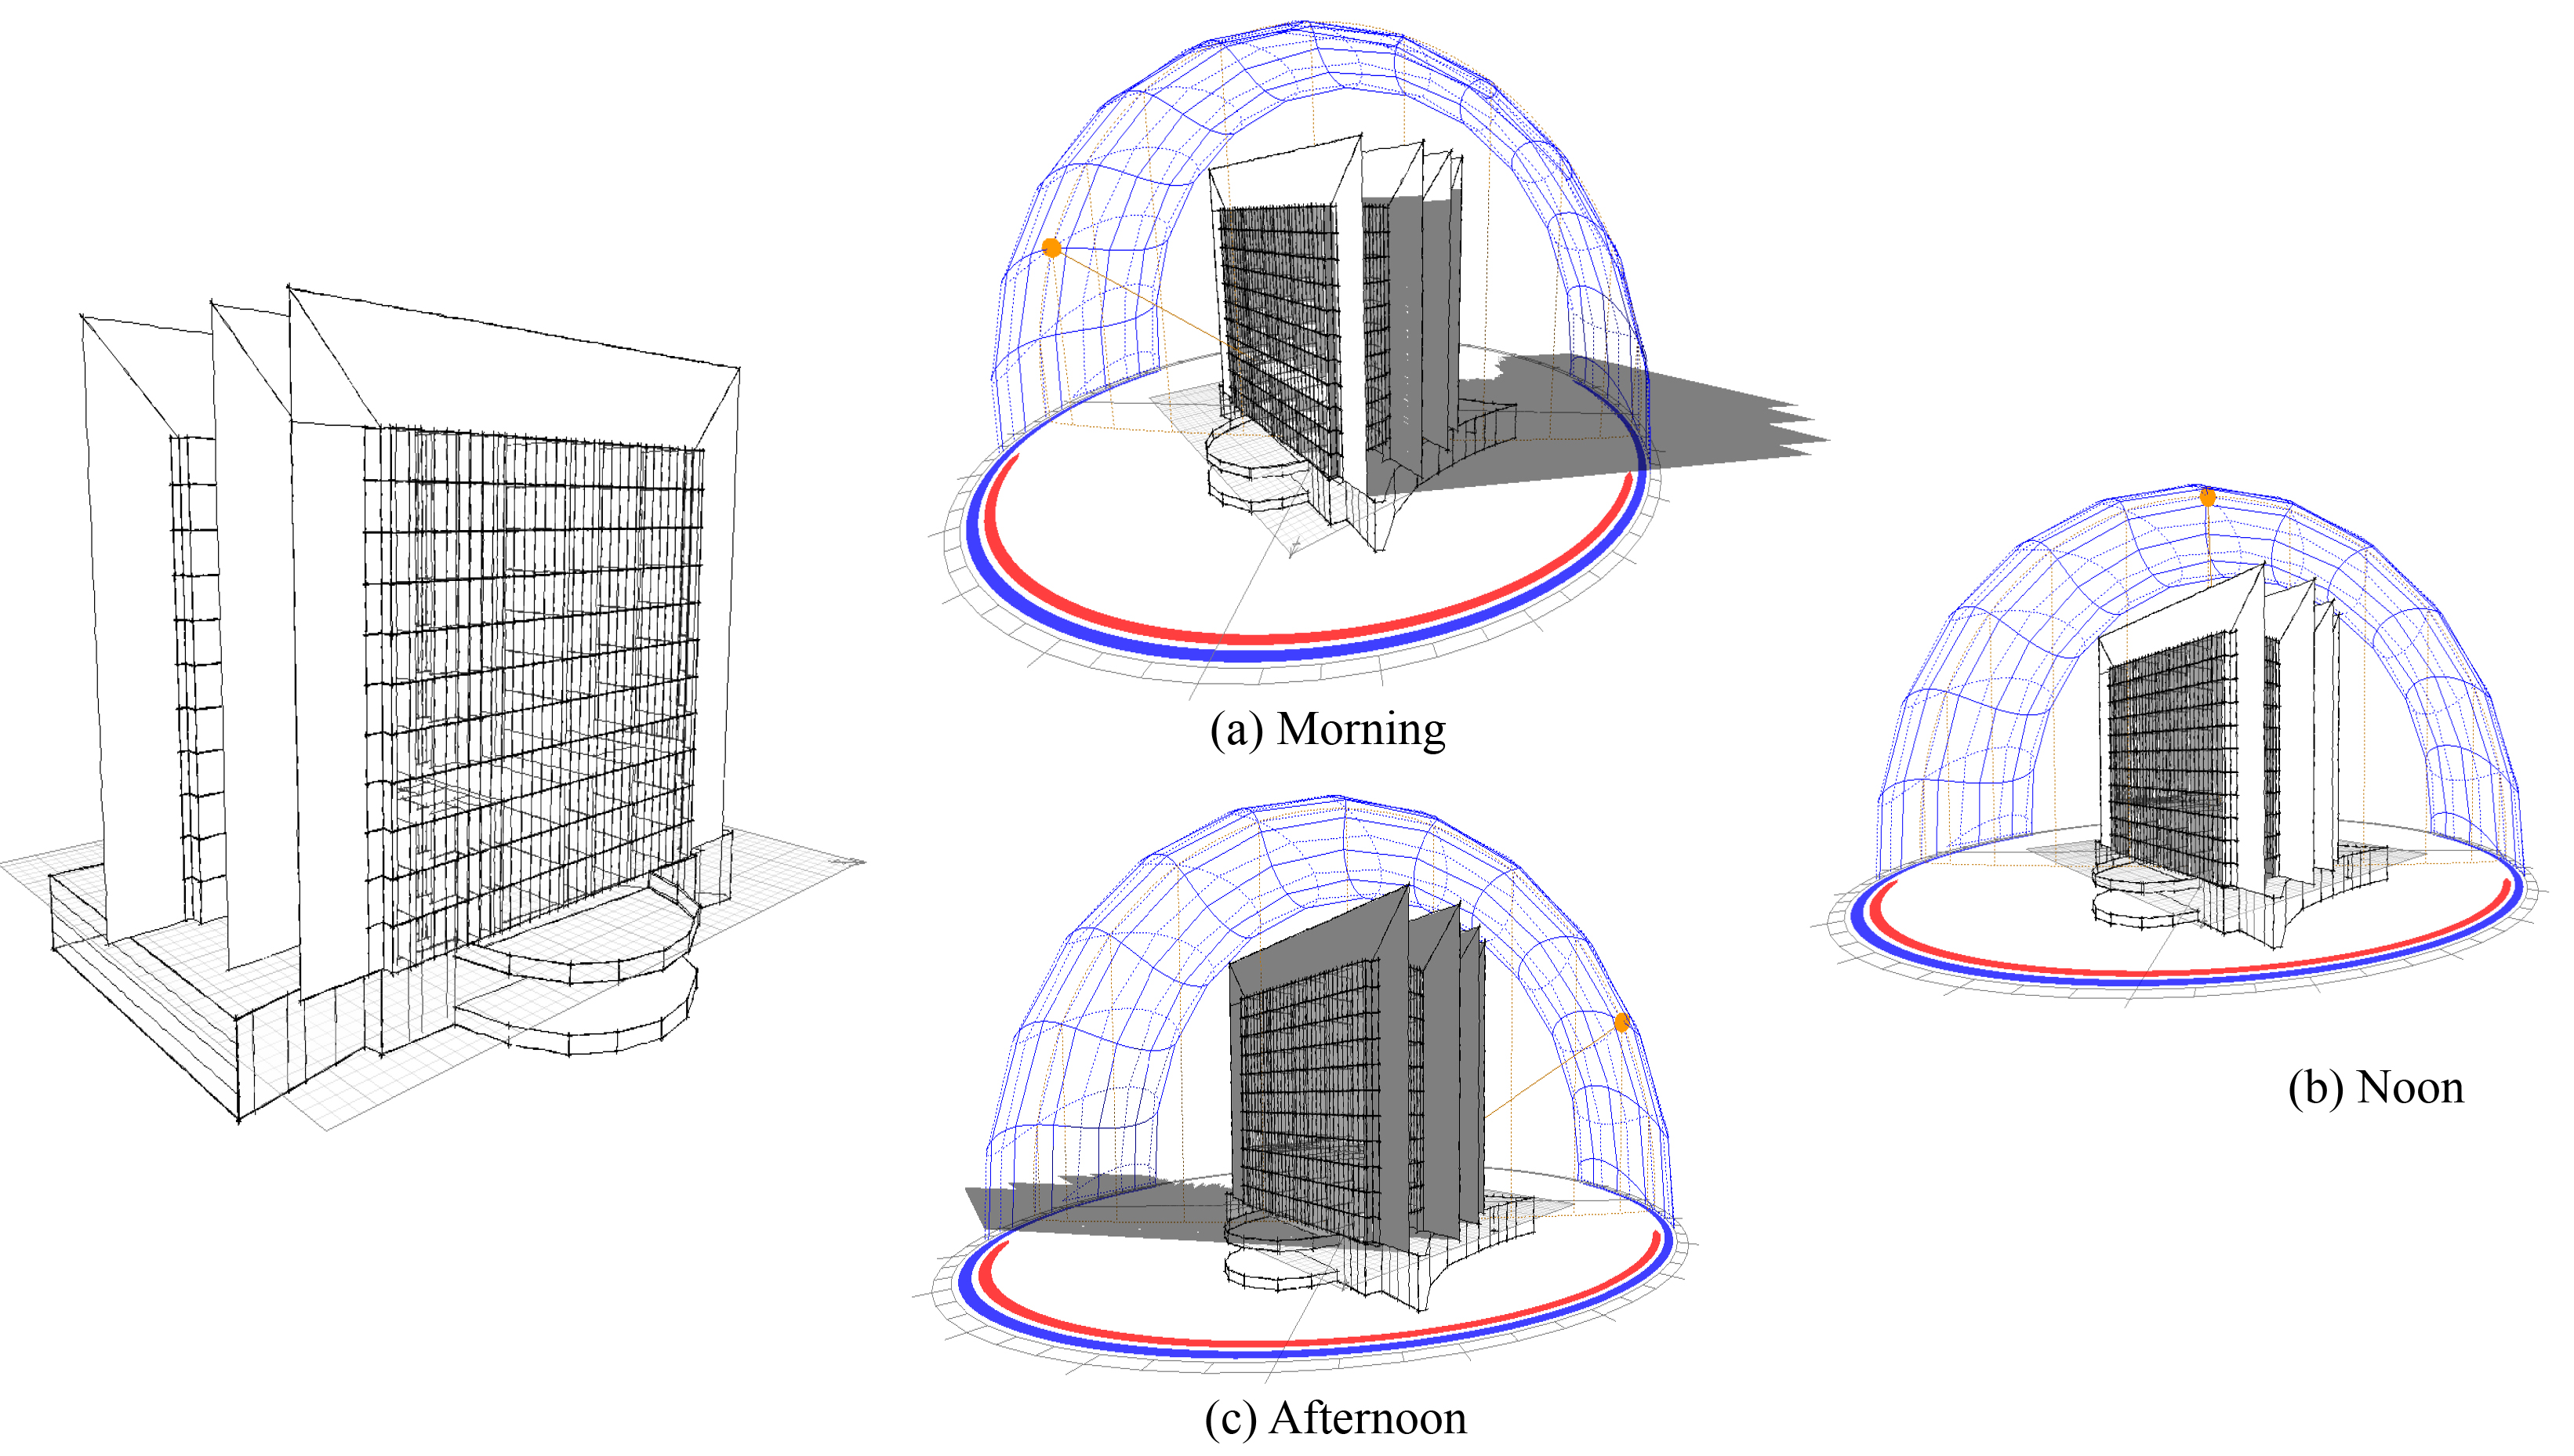
Fig. 8. The shadow of the building in the morning, noon and afternoon.
The Radiance Illuminance Program is used to simulate the illuminance value based on this shading model in order to calculate the distribution of daylight inside the room, particularly at points A1-G1 (Room A) and A1-N1 (Room B) in the morning, noon, and afternoon. The simulation's findings demonstrate how the position of the building's shadow fluctuates according to where the sun is shining. Room A is located at the back of the building (Northeast) and the shadowing in the morning occurs on the front of the building so that the distribution of direct light is not obstructed by shadows and the illuminance value is relatively high compared to noon and afternoon, and conversely in room B.
Figure 9(a) shows the illuminance values in the building envelope area, namely points A1-G1 to A5-G5 (northeast orientation). The distribution of daylight at points A1-G1 with the highest value in the morning of 2496 lux, noon of 1402 lux and afternoon of 762 lux. Overall at points A1-G1 to A5-G5 there is a decrease in the illuminance value in the morning, afternoon and evening. Figure 9(b) shows the illuminance value at points A1-N1 (Southwest orientation) and highest in the morning of 606 lux, 821 lux in the afternoon and 1884 lux in the afternoon. The results of the analysis show that buildings in northeast and southwest orientation are inversely proportional to the light distribution value. Northeast orientation decreases from morning to evening and otherwise of southwest orientation is increasing, so that it can be seen that the orientation of the building affects the distribution of daylight. Furthermore, to find out the value of the illuminance distribution of daylight, a simulation is carried out as shown in Fig. 10.
Figure 9
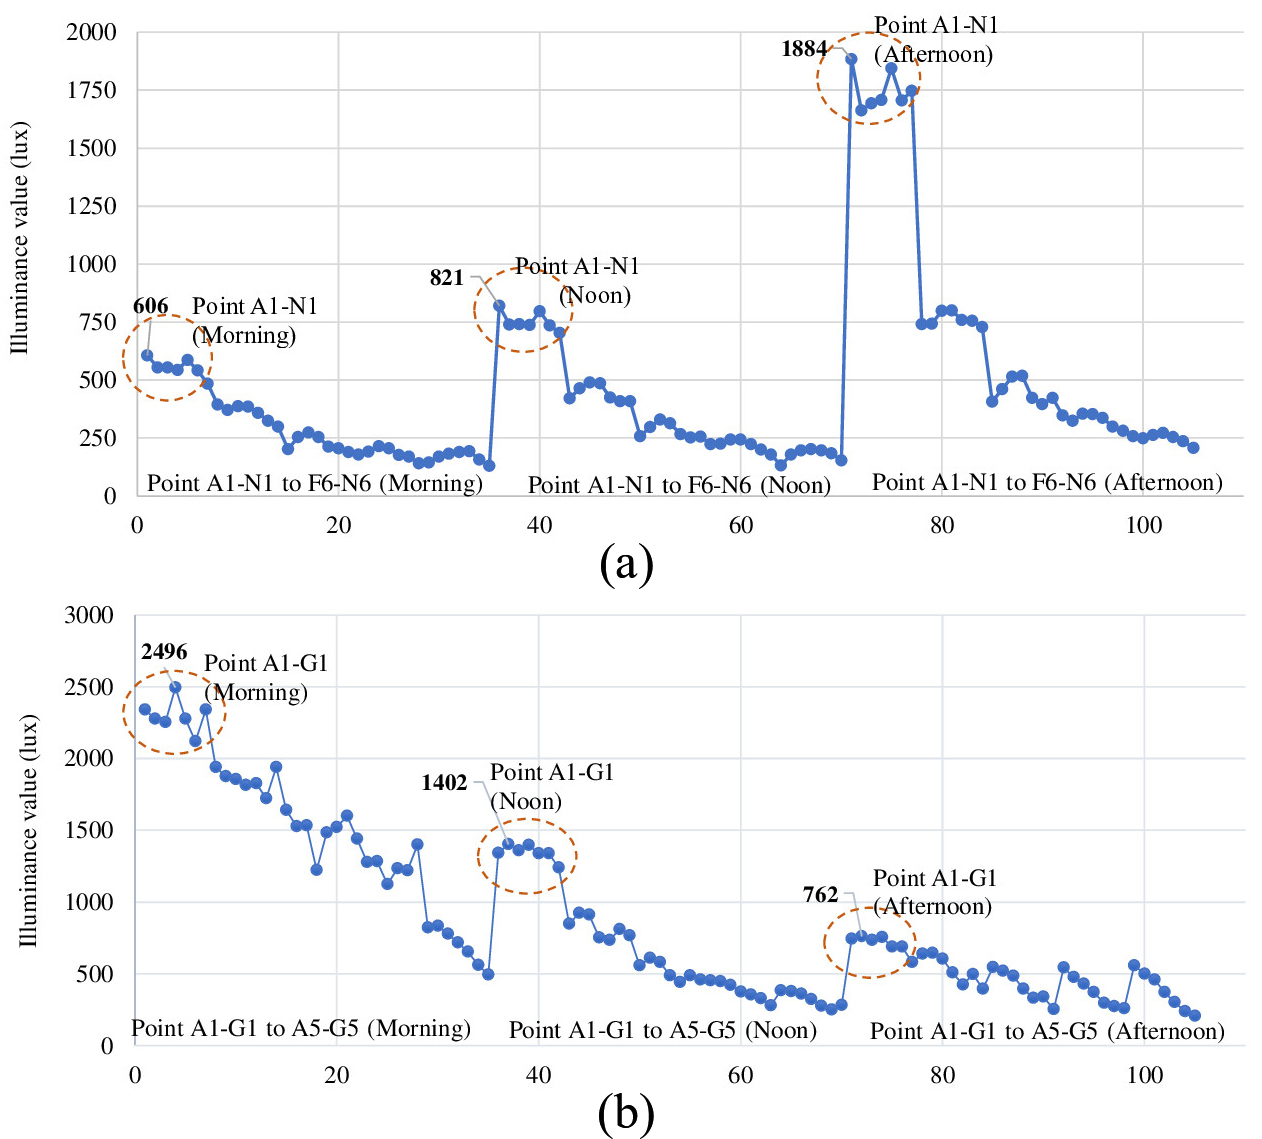
Fig. 9. Simulation results of illuminance values (a) room A and (b) room B.
Figure 10
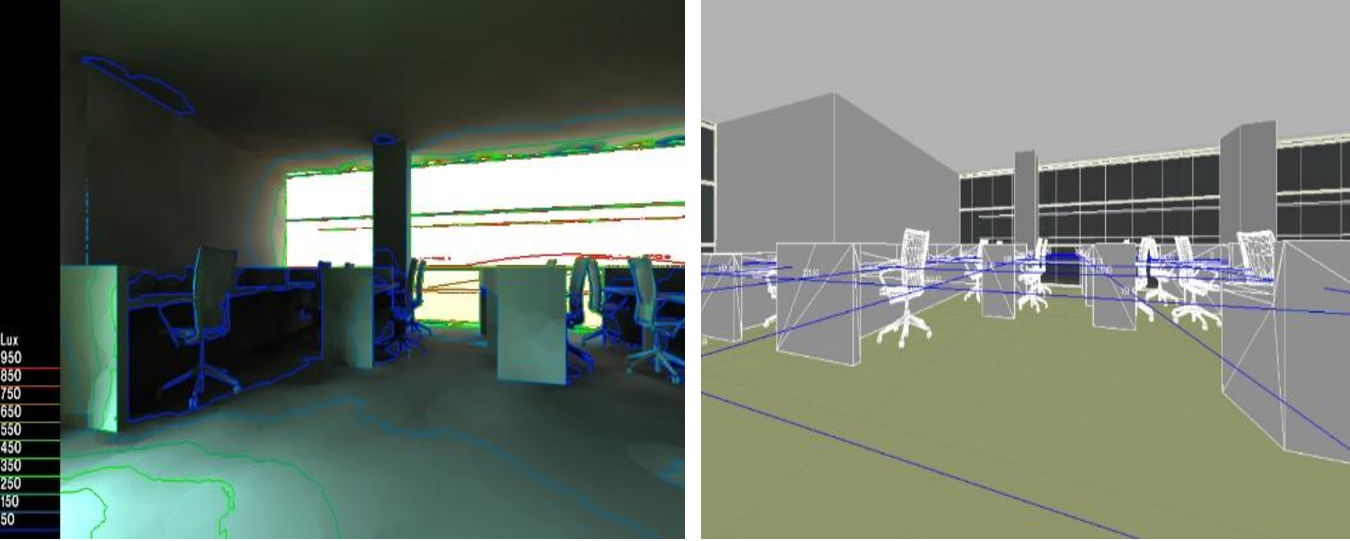
Fig. 10. Result of simulation of radiance illuminance of contour line.
3.5. Façade building models
This study uses a sun shading of facade model on the building envelope to assess the distribution of light in to building. To evaluate the distribution of daylight inside the building, this study applies a sun shading of facade model to the building envelope.
The building facade model will appear more inventive when sun shading is employed. Nonetheless, caution must be used to prevent glare from being caused by the distribution of daylight. Next, an analysis of the illuminance value of the distribution of light in room A was carried out using several models of building facades.
3.5.1. Massive facade mode
A graph of the simulation results in the shape of a massive glass facade is shown in Fig. 11.
Figure 11
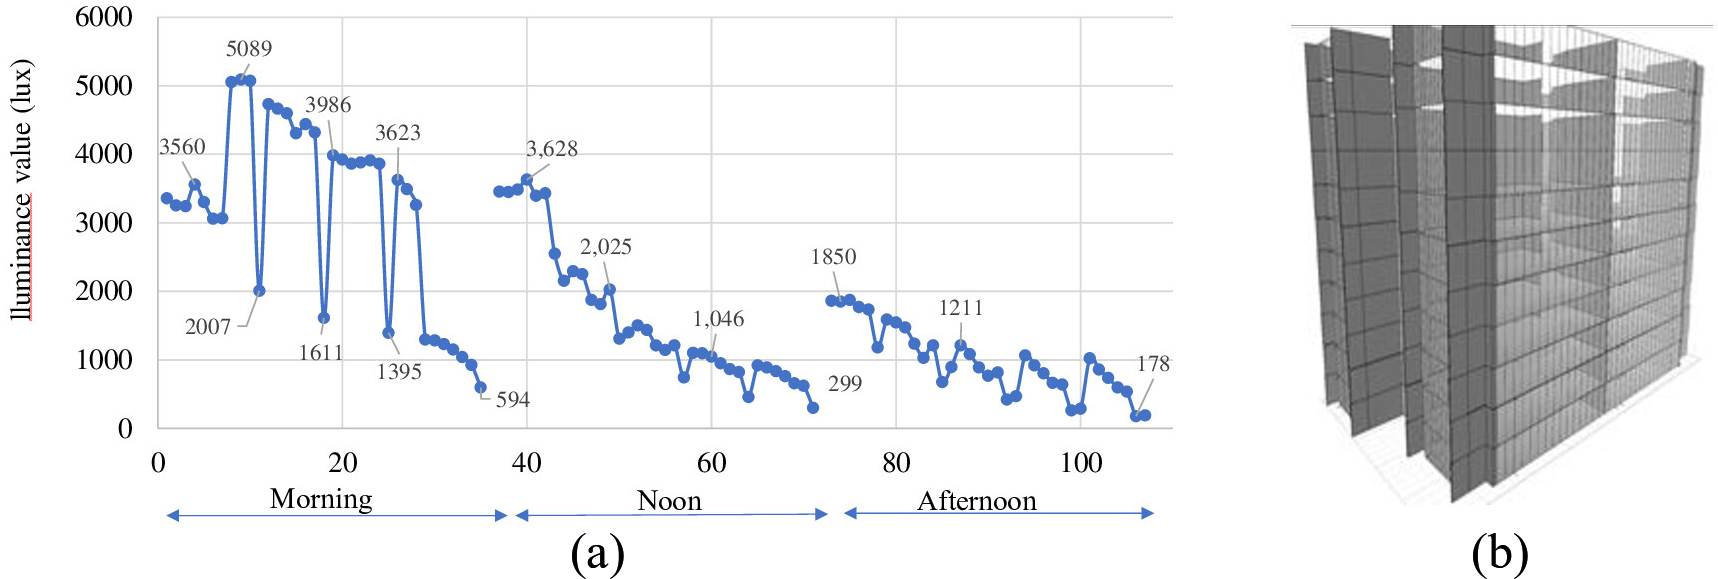
Fig. 11. (a) Simulation result of illuminance value point A1-G1 to A5-G5 and (b) Massive glass façade model.
The brightness value for this facade model ranges from 589 lux to 3342 lux, with zone 5 in the afternoon having the minimum illuminance and zone 1 in the noon having the maximum illuminance.
The illuminance value in the room that is oriented to the northwest and on the windows openings using massive glass material will distribute daylight into the tallest building in the morning, as shown in Fig. 11. The average illuminance value in zones 1-5 has the highest illuminance value in zone 2 in the morning which is 4460 lux and the lowest in zone 5 in the afternoon of 589 lux, as shown in Table 2.
Table 2
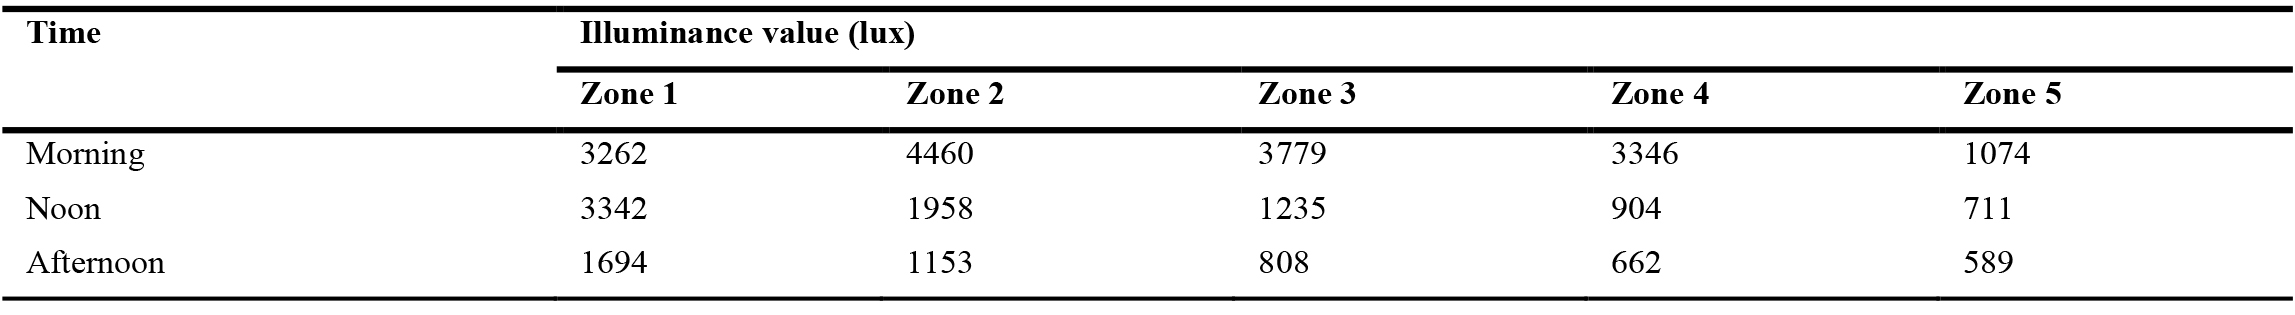
Table 2. The average of illuminance value massive façade model.
3.5.2. Vertical façade model
The vertical facade model is a model that reflects the formal value of the building and looks like the height of the building. The simulation was carried out at 8 am o’clock so that the back area of the building has a higher illuminance value than the front area of the building. The illuminance values in room A (Northeast orientation) are points A1-A6 with illuminance values of 1337-1402 lux in the morning, 754-8997 lux during the day and 689-762 lux in the afternoon (Fig. 12). The analysis's findings demonstrate that the distribution of daylight is influenced by the time of day and the direction of the building.
Figure 12
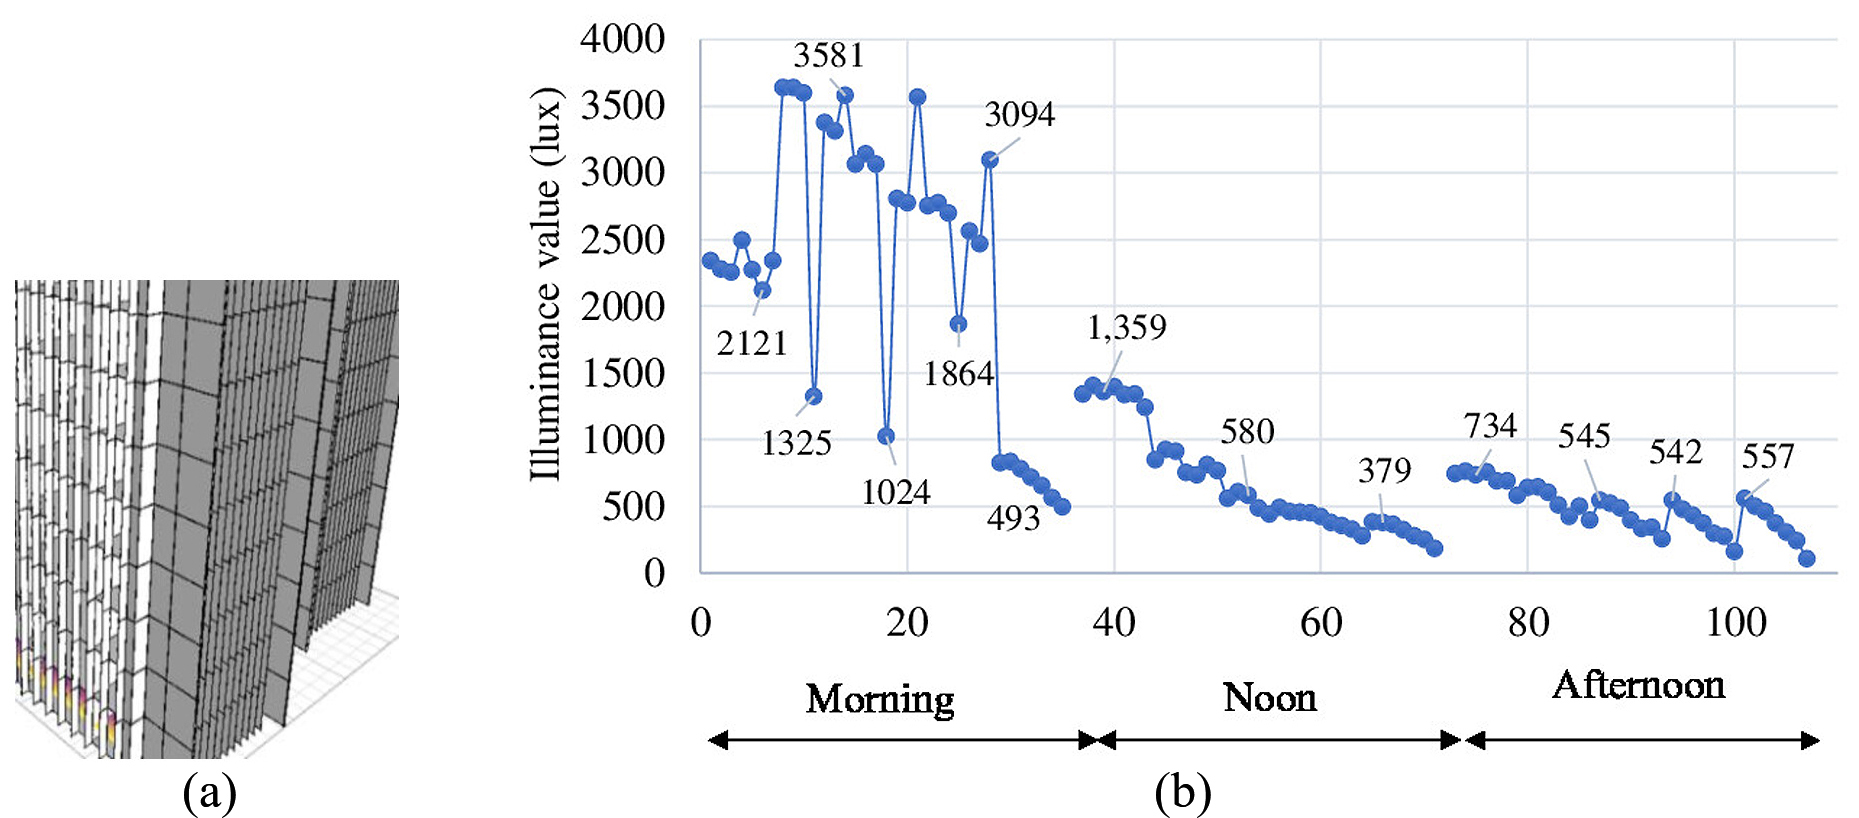
Fig. 12. (a) Vertical façade model and (b) Simulation result of illuminance value at point A1-G1 to A5-G5.
Table 3 show that daylight distribution into the room and illuminance value is not uniformity, especially at point Zone 1-5 in the morning. Daylight distribution in the afternoon and noon is more even in the illuminance value.
Table 3

Table 3. The average of illuminance value massive façade model.
3.5.3. Horizontal façade model
The horizontal facade of the model shows that the value of daylight distribution decreases until the afternoon, for example at measurement point A1 is 697 lux (morning), 644 lux (noon) and 355 lux (afternoon) (Fig. 13). The horizontal facade model has an effect on time, even though at all points there is only a slight difference in the illuminance value between morning and noon, with an average value between 759 lux and 683 lux or 11%. Meanwhile, between noon and evening there is a relatively high difference in illuminance value of 68%.
Figure 13
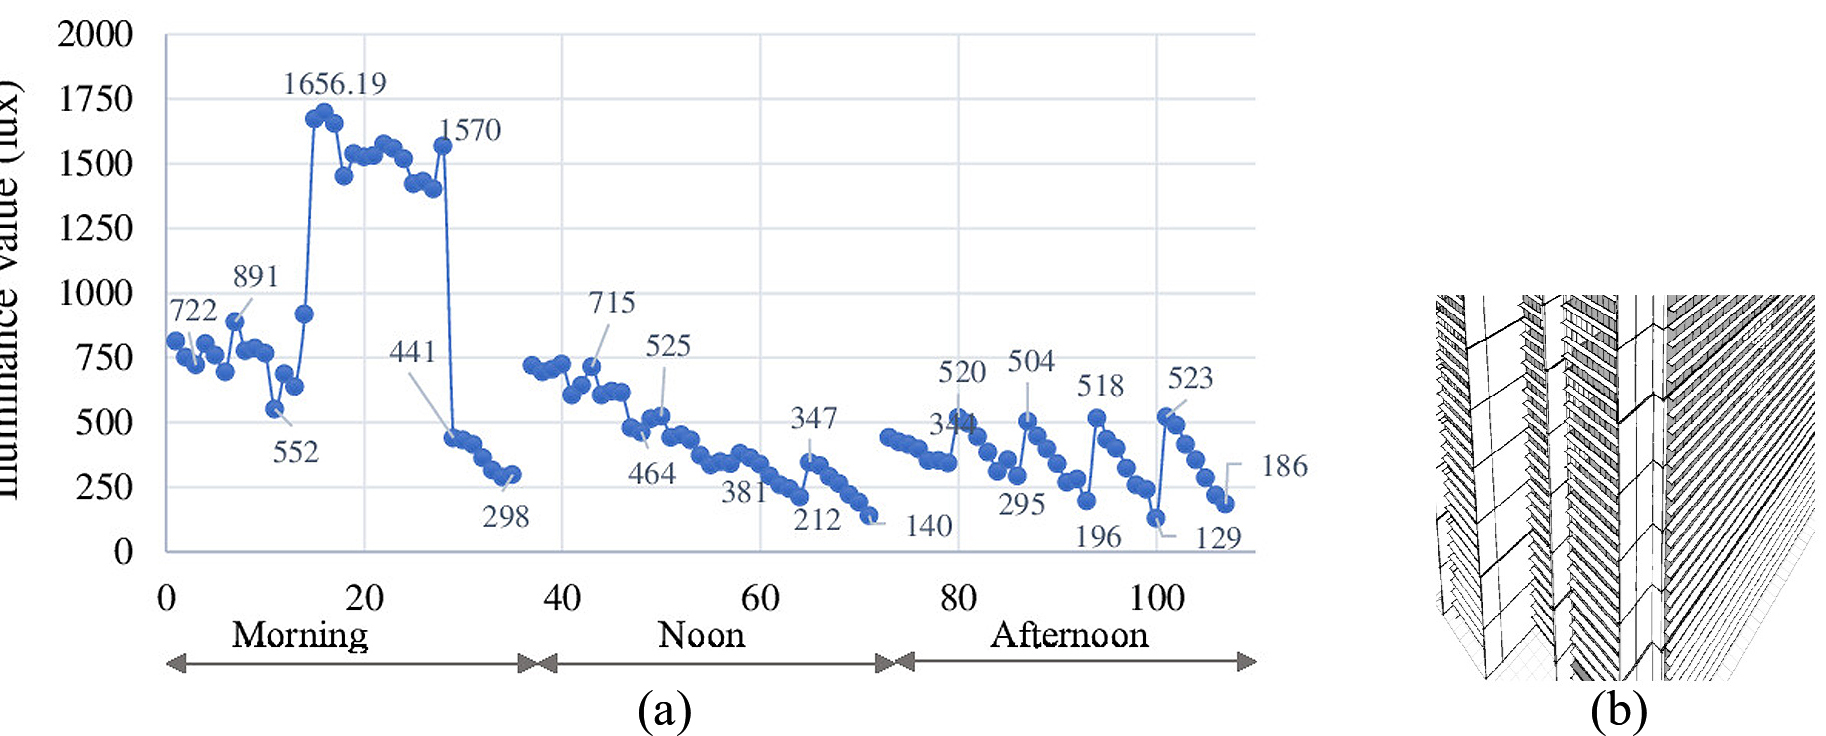
Fig. 13. (a) Simulation result of illuminance value at point A1-G1 to A5-G5 and (b) Horizontal facade model.
Figure 13 shows that the value of illuminance distribution of daylight with a horizontal model of the building facade. The highest illuminance value in this space is in the morning, but not evenly distributed in zones 1-5. During the noon and afternoon, there is a steady descent from zone A to the next. But in the afternoon, this space gets low light distribution in zone 1-5. The average illuminance value in zones 1-5 has the highest illumination value in zone 3 in the morning which is 1654 lux and the lowest in zone 5 in the afternoon of 330 lux, as shown in Table 4.
Table 4
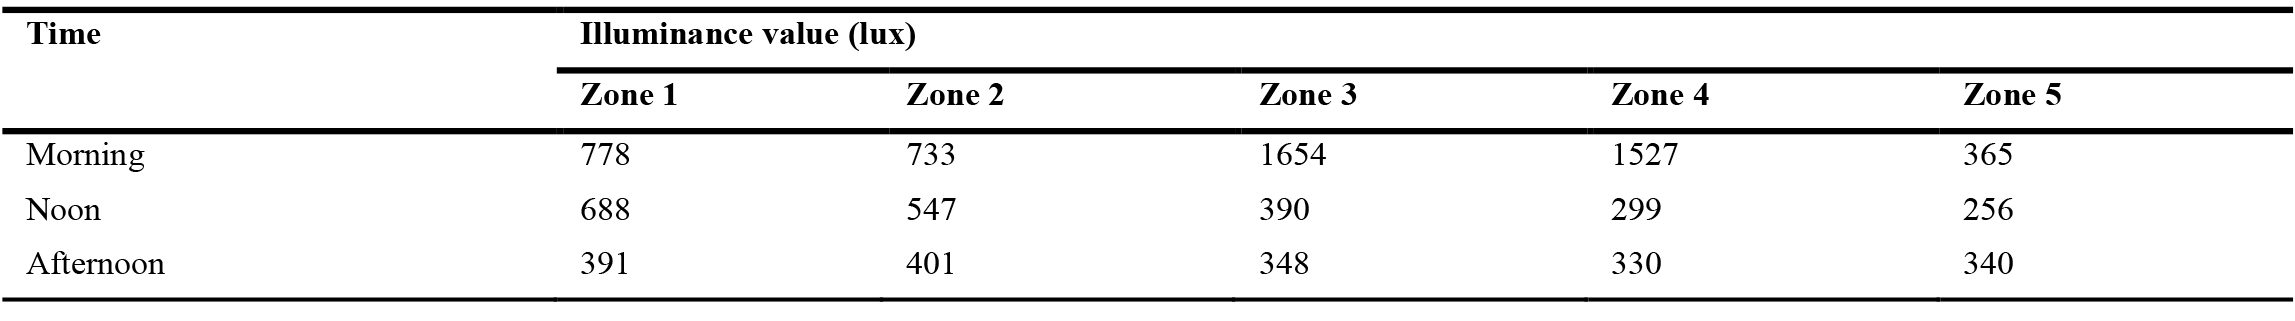
Table 4. The average of illuminance value horizontal façade model.
3.5.4. Diagonal façade model
The sun sets in the west so that the front of the building that is oriented towards the southwest produces more light distribution, height compared to the rear of the building or northeast orientation. When the sun sets in the west, a building's front that faces southwest will create greater light dispersion and height than a building facing northeast or its back. Based on the results of this analysis, it can be seen that the orientation of the building and time affect the distribution of daylight. The distribution of daylight is affected by the building's orientation and the time, as shown by the analysis's result.
Figure 14 shows that the diagonal and horizontal facade models have relatively the same decrease, but the diagonal facade model has a higher value. The illuminance value on the diagonal facade is between 408-759 lux while diagonal facade is between 536-1040 lux.
Figure 14
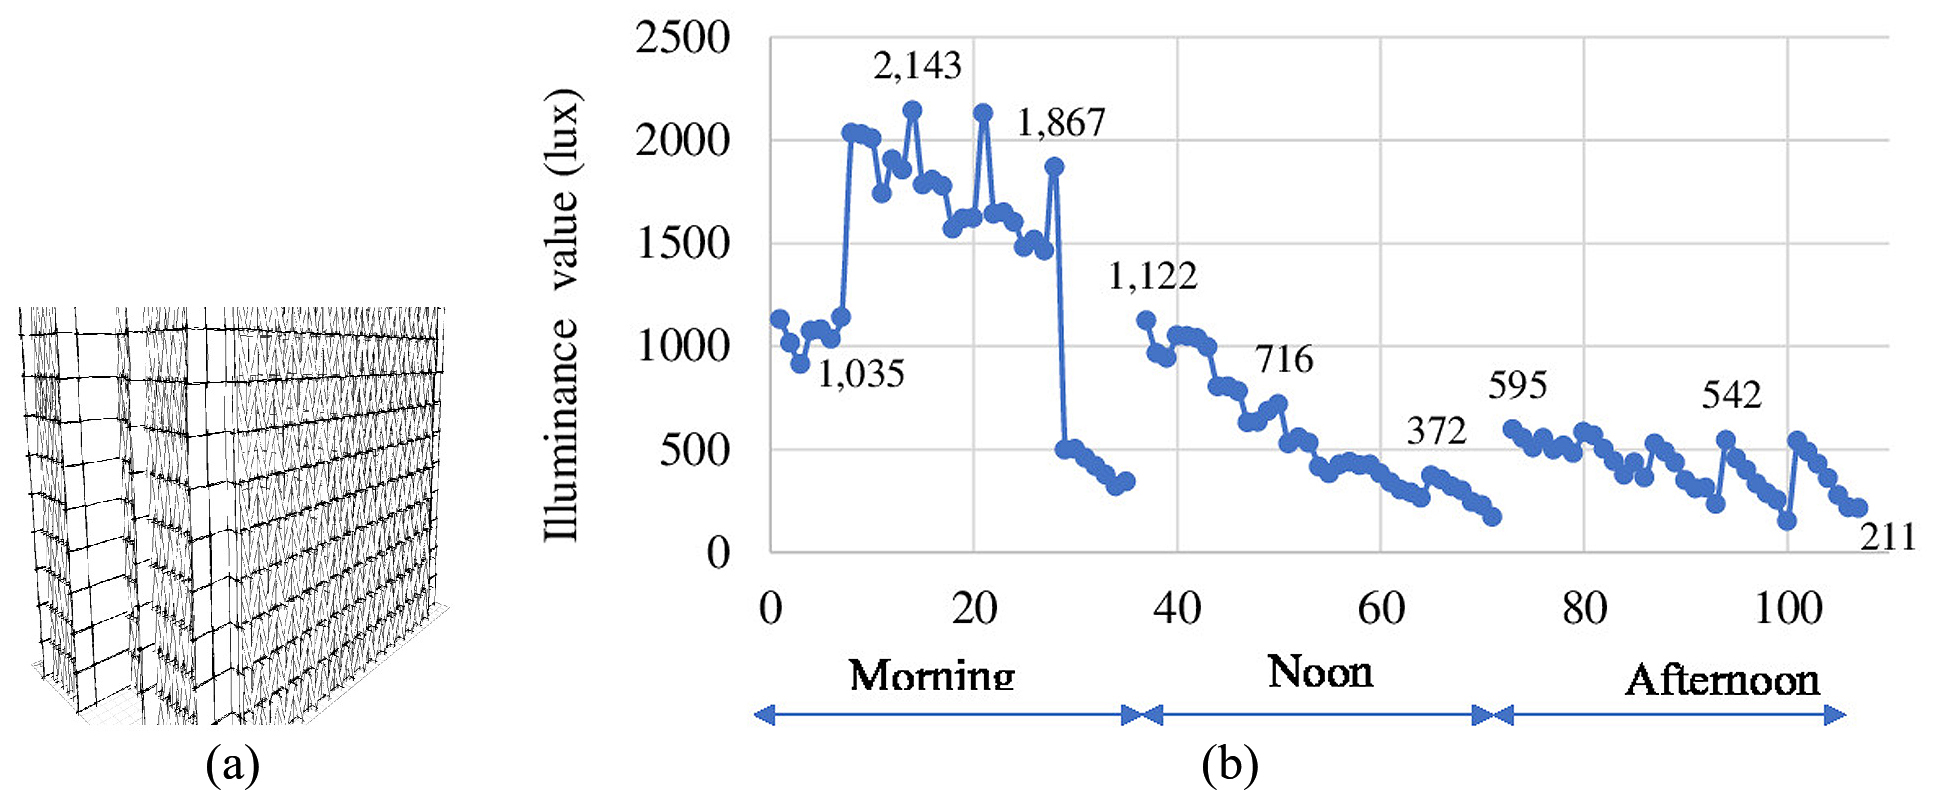
Fig. 14. (a) Diagonal façade model and (b) Simulation result of illuminance value at point A1-G1 to A5-G5.
The distribution of daylight with a diagonal sun shading model on the building envelope (Fig. 14). The highest illumination value in this space is in the morning, but the illumination value is uneven in zones 1-5. During the day and evening, there is a steady descent from zone A to the next. But in the afternoon, this space gets low light distribution in zone 1-5. The average illuminance value in zones 1-5 has the highest illumination value in zone 2 in the morning, which is 1815 lux and the lowest in zone 5 in the afternoon, which is 400 lux, as shown in Table 5.
Table 5
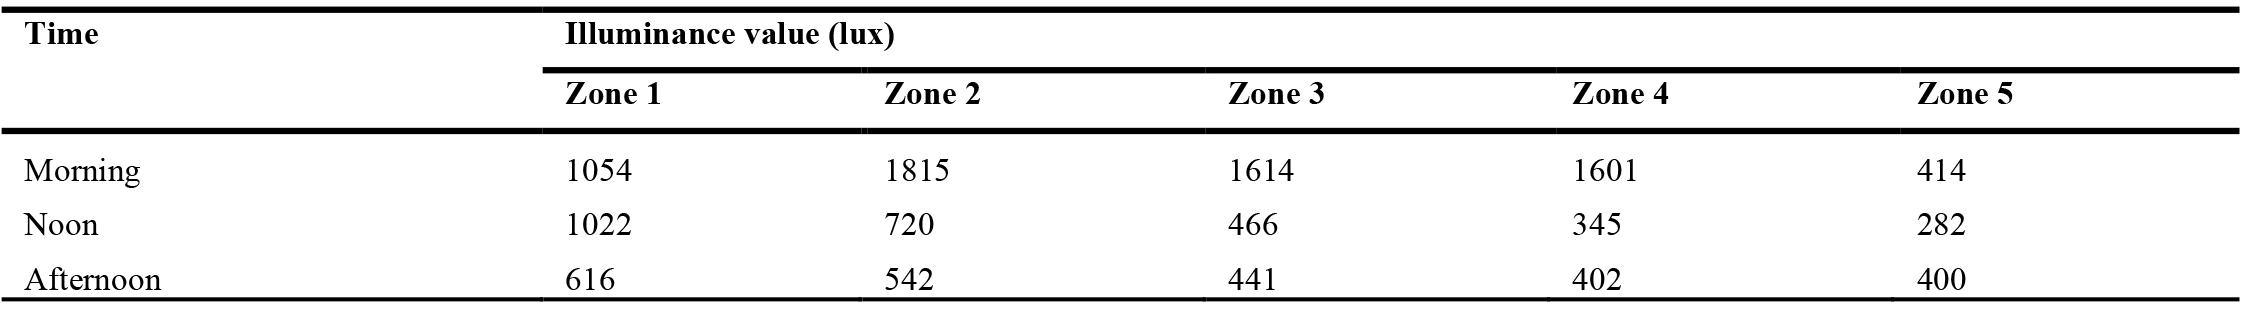
Table 5. The average of illuminance value diagonal façade model.
3.5.5. Vertical-diagonal façade model
Figure 15 shows a design with a vertical-diagonal model and a graph of the illuminance value point A1-A6 with illuminance value of 667-894 lux in the morning, 549-844 lux during the day and 689-762 lux in the afternoon. This model shows that the distribution of light entering the space is lower, because the building envelope is covered by this facade model.
Figure 15
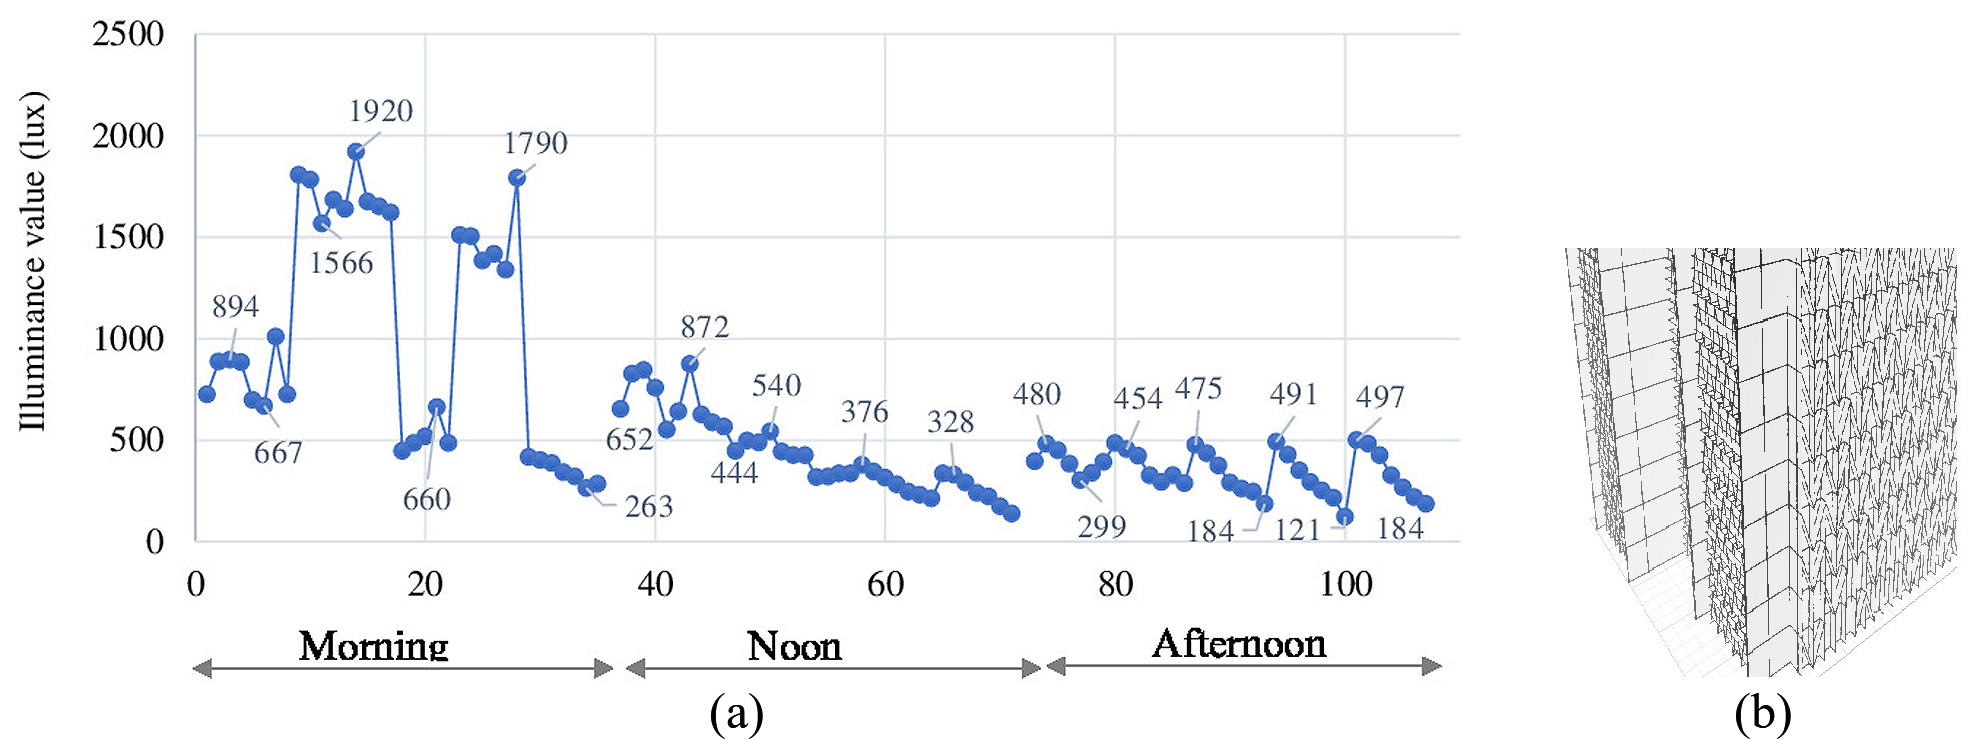
Fig. 15. (a) Simulation result of illuminance value at point A1-G6 and (b) vertical-diagonal façade model.
The average of illuminance value of the vertical-diagonal façade model (Table 6) shows the highest illumination value in the morning, afternoon and evening is 1203 lux and the lowest is 306 lux.
Table 6
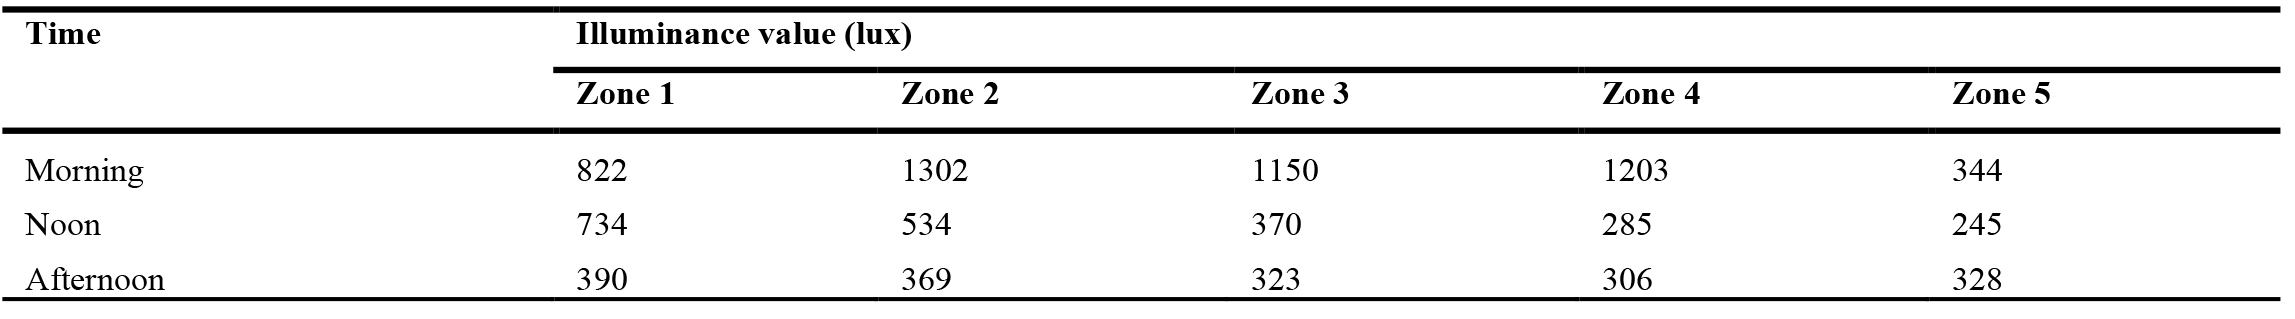
Table 6. The average of illuminance value vertical-diagonal façade model.
3.5.6. Analysis of building façade model (Room A/ northeast orientation)
In this study, the design of the facade model of the Bank Mega building with the form of a massive glass, vertical, horizontal, diagonal and vertical-diagonal facade. These five models have architectural aesthetic values, each of which gives a different impression, for example the massive glass facade model reflects the formal principle of an office building. Other facade models can give the impression of a tall/wide/ attractive building in the vertical/ horizontal/ diagonal facade model. The vertical-diagonal facade model can be perceived as an impressive building model that is inviting and does not seem monotonous.
In this study, in addition to the perception of the building facade model, an analysis of the distribution of daylight values was also carried out on the five facade models using the Radiance Illuminance program. The simulation results show different illuminance values for each facade model, as shown in the following Fig. 16.
Figure 16
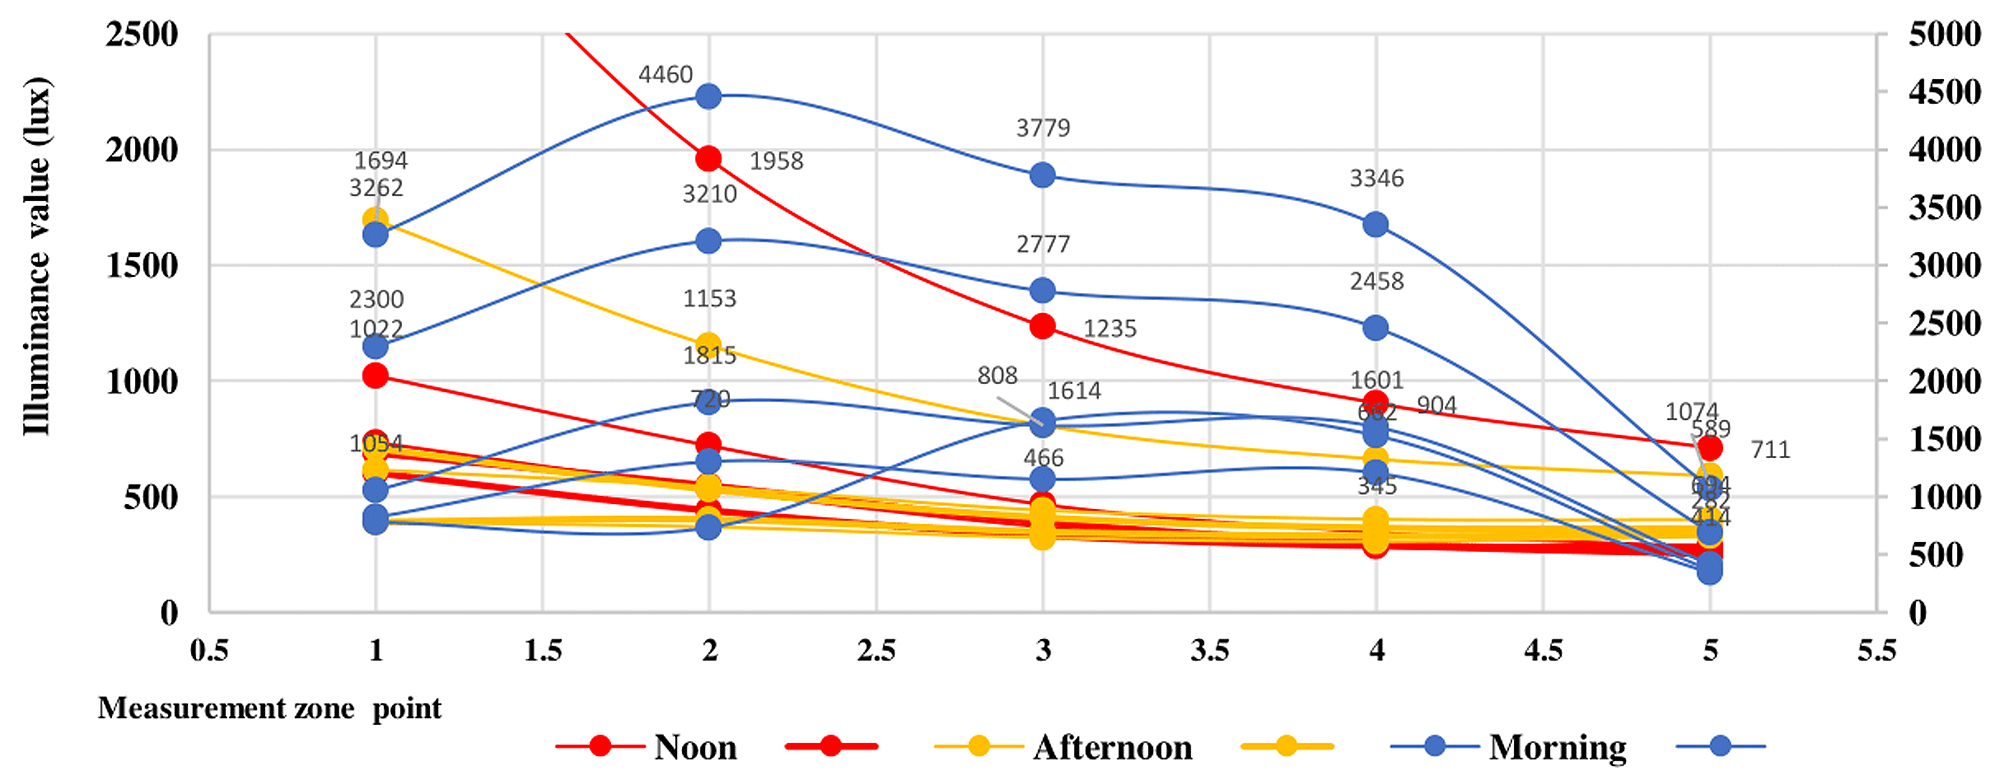
Fig. 16. Illuminance values on five building façade models.
Figure 16 shows a decrease in the value of illuminance on each facade model in the morning, afternoon and evening. The massive facade model has the highest illuminance value every time, namely the lowest 589 lux (zone 5 in the afternoon) and the highest 4460 lux (zone 2 in the morning).
4. Discussion
Research on building facade models has been carried out by several previous researchers [5-8], but did not measure the research object as a performance parameter of daylight distribution in buildings. In addition, previous research did not conduct visual perception experiments to find out the perceptions of space users regarding the light in their workspaces.
The experimental results show that room employee feel that visual comfort is not created in the existing light conditions in this building. From the results of direct measurements in the field it is known that there is glare and a high level of brightness, so the window is always closed with curtains which results in areas far from the window opening being dark, so artificial lighting must be used. In this study is to analyze how the influence of the building facade model on the illuminance value of the distribution of daylight into the building. The facade model of the Bank Mega building uses massive glass on the building envelope and the measurement results show that the illuminance value is very high. Based on this, it is necessary to know how the natural light conditions are when using sun shading on the building envelope.
The research results show that among the facade models, it is known that the vertical model is higher than the horizontal, diagonal and vertical-diagonal facade models. However, in terms of room lighting uniformity, it is known that the vertical-diagonals can even out the distribution of daylight in the morning, afternoon and evening. The research results can be a guide in designing buildings that can maximize the distribution of daylight into space, and can minimize the consumption of electrical energy as a source of artificial lighting.
5. Conclusion
Sky condition, orientation, and building facade model affect the distribution of sunlight and its amount entering the building. Radiance illuminance program is a software used to determine the value of daylight distribution with various facade model designs on building envelopes. The results showed that in addition to the existing Bank Mega Makassar model, namely the massive glass facade model, it has the highest light distribution value compared to other models. from the utilization of energy is very beneficial, but it is necessary to pay attention to the negative effects such as glare, excessive ratio of illuminance and brightness.
The results also show that the distribution of natural light in the vertical facade model has a higher illuminance value than the horizontal, diagonal and vertical-diagonal models. This vertical facade model still exceeds the illuminance standard for work spaces recommended by SNI, which is 350 lux and the morning it causes a glare effect in the work space. The researcher presented the results of the analysis that among the five facade models, the vertical-diagonal facade model is the best choice in terms of architectural aesthetics and an even illuminance level in the morning, afternoon and evening, but still above the workstation illuminance standard. However, there is still an alternative furniture layout design that does not approach the window opening area in the building envelope, due to a decrease in the illuminance value in areas far from the window opening, which is around 400-500 lux and does not yet cause glare in the work space. Based on the results of this study, it is hoped that it can become a guideline in planning the design of building facades that have architectural value and meet recommended standards illuminance for workspace.
Contributions
All the authors contributed equally.
Declaration of competing interest
The authors declare no conflict of interest.
References
- Badan Standarisasi Nasional Indonesia, SNI 03-6575 Procedures for designing natural lighting systems in buildings (Book), 2001.
- K. Alshaibani and D. Li, Sky type classification for the ISO/CIE Standard General Skies: A proposal for a new approach, International Journal of Low-Carbon Technologies 16 (2021) 921-926. https://doi.org/10.1093/ijlct/ctab020
- P. Tregenza and J. Mardaljevic, Daylighting buildings: Standards and the needs of the designer, Lighting Reserch Technology 50 (2018) 63-79. https://doi.org/10.1201/b16707
- C. Moscoso and B. Matusiak, Aesthetic perception of a small office with different daylighting systems, Indoor and Built Environment 27 (2018) 1187-1202. https://doi.org/10.1177/1420326X17711490
- W. You and W. Ding, Building façade opening evaluation using integrated energy simulation and automatic generation programs, Architectural Science Review (2015) 205-220. https://doi.org/10.1080/00038628.2015.1018118
- G. Capeluto, Adaptability in envelope energy retrofits through addition of intelligence features, Architectural Science Review (2019) 216-229. https://doi.org/10.1080/00038628.2019.1574707
- L. Bellia, A. Pedace, and F. Fragliasso, Dynamic daylight simulations: Impact of weather file's choice, Solar Energy 117 (2015) 224-235. https://doi.org/10.1016/j.solener.2015.05.002
- J. M. Monteoliva, A. Villalba, and A. E. Pattini, Variability in dynamic daylight simulation in clear sky conditions according to selected weather file: Satellite data and land-based station data, Lighting Research and Technology 49 (2017) 508-520. https://doi.org/10.1177/1477153515622242
- A. Aksamija, High-Performance Building Envelopes : Design Methods for Energy Efficient Facades, BEST4 Conference Proceedings, (2015) https://www.semanticscholar.org/paper/High-Performance.
- N. Jamala, R. Rahim, and R. Mulyadi, Comparison of Building Envelope Models to Illuminance Level in Phinisi Tower Building, IOP Conference Series: Material Science and. Engineering 875 (2020) 012006. https://doi.org/10.1088/1757-899X/875/1/012006
- M. Ayoub, A multivariate regression to predict daylighting and energy consumption of residential buildings within hybrid settlements in hot-desert climates, Indoor and Built Environment 28 (2019) 848-866. https://doi.org/10.1177/1420326X18798164
- S. G. Koç and S. Maçka Kalfa, The effects of shading devices on office building energy performance in Mediterranean climate regions, Journal of Building Engineering 44 (2021) 102653. https://doi.org/10.1016/j.jobe.2021.102653
- N. Jamala, The Effect of Building Facade Model on Light Distribution (Case Study: Menara Phinisi Building of UNM), Dimensi. (Journal Architecture and Built Environment) 44 (2017) 149-153. https://doi.org/10.9744/dimensi.44.2.149-154
- Y. K. Yi, Building facade multi-objective optimization for daylight and aesthetical perception, Building and Environment 156 (2019) 1-41. https://doi.org/10.1016/j.buildenv.2019.04.002
- Y. Lu, T. Wolf, and J. Kang, Optimization of facade design based on the impact of interior obstructions to daylighting, Building Simulation 9 (2016) 1-14. https://doi.org/10.1007/s12273-015-0253-4
- N. Jamala, R. Rahim, and S. mohmad shukri, The Architectural Analysis of the Illuminance Level in the Workspace, Using Natural and Artificial Lighting in Graha Pena Building in Makassar, Indonesia, Journal Design and Built Environment 21 (2021) 1-12. https://doi.org/10.22452/jdbe.vol21no1.1
- M. M. El Sheikh, Intelligent building skins: Parametric-based algorithm for kinetic facades design and daylighting performance integration, (Thesis), 2011.
- P. Gallo and R. Romano, Adaptive Facades, Developed with Innovative Nanomaterials, for a Sustainable Architecture in the Mediterranean Area, Procedia Engineering 180 (2017) 1274-1283. https://doi.org/10.1016/j.proeng.2017.04.289
- A. Ricci, C. Ponzio, K. Fabbri, J. Gaspari, and E. Naboni, Development of a self-sufficient dynamic façade within the context of climate change, Architectural Science review (2021) 87-89. https://doi.org/10.1080/00038628.2020.1713042
- X. Ding, X. Song, P. Li, Z. Ai, and L. Zhang, Efficient visible light driven photocatalytic removal of NO with aerosol flow synthesized B, N-codoped TiO2 hollow spheres., Journal of Hazardous. Materials 190 (2011) 604-612. https://doi.org/10.1016/j.jhazmat.2011.03.099
- Q. G. Deng et al., Annual daylight glare evaluation: Impact of weather file selection, Lighting Research and Technology 50 (2018) 446-455. https://doi.org/10.1177/1477153516664206
- M. G. Kent, S. Altomonte, R. Wilson, and P. R. Tregenza, Temporal effects on glare response from daylight, Building and Environment 113 (2017) 49-64. https://doi.org/10.1016/j.buildenv.2016.09.002
- J. Wienold and J. Christoffersen, Evaluation methods and development of a new glare prediction model for daylight environments with the use of CCD cameras, Energy and Buildings 38 (2006) 743-757. https://doi.org/10.1016/j.enbuild.2006.03.017
- J. Wienold et al., Cross-validation and robustness of daylight glare metrics, Lighting Research and Technology 51 (2019). https://doi.org/10.1177/1477153519826003
- J. Y. Suk, M. Schiler, and K. Kensek, Absolute glare factor and relative glare factor based metric: Predicting and quantifying levels of daylight glare in office space, Energy and Buildings 130 (2016) 9-19. https://doi.org/10.1016/j.enbuild.2006.03.017
- J. Y. Suk, M. Schiler, and K. Kensek, Investigation of existing discomfort glare indices using human subject study data, Building and Environment 113 (2017) 121-130. https://doi.org/10.1016/j.buildenv.2016.09.018
- M. G. Kent, S. Fotios, and T. Cheung, Stimulus range bias leads to different settings when using luminance adjustment to evaluate discomfort due to glare, Building ans Environment 153 (2019). https://doi.org/10.1016/j.buildenv.2018.12.061
- R. P. Khidmat, H. Fukuda, B. Paramita, M. D. Koerniawan, and Kustiani, The optimization of louvers shading devices and room orientation under three different sky conditions, Journal of Daylighting 9 (2022) 137-149. https://doi.org/10.15627/jd.2022.11
- A. Eltaweel, M. A. Mandour, Q. Lv, and Y. Su, Daylight distribution improvement using automated prismatic louvre, Journal of Daylighting 7 (2020) 84-92. https://doi.org/10.15627/jd.2020.7
- J. K. Day, B. Futrell, R. Cox, and S. N. Ruiz, Blinded by the light: Occupant perceptions and visual comfort assessments of three dynamic daylight control systems and shading strategies, Build and Environment 154 (2019) 107-121. https://doi.org/10.1016/j.buildenv.2019.02.037
- K. Yildirim, A. Akalin-Baskaya, and M. Celebi, The effects of window proximity, partition height, and gender on perceptions of open-plan offices, Journal Enviromental Psychology 27 (2007) 154-165. https://doi.org/10.1016/j.jenvp.2007.01.004
- B. Abboushi, I. Elzeyadi, K. Van Den Wymelenberg, M. Sereno, and G. Jacobsen, The Journal of the Illuminating Engineering Society Assessing the Visual Comfort , Visual Interest of Sunlight Patterns , and View Quality under Different Window Conditions in an Open-Plan Office, LEUKOS 17 (2020) 1-17. https://doi.org/10.1080/15502724.2020.1785309
- Z. S. Zomorodian and M. Tahsildoost, Assessing the effectiveness of dynamic metrics in predicting daylight availability and visual comfort in classrooms, Renewable Energy 134 (2019) 669-680. https://doi.org/10.1016/j.renene.2018.11.072
Copyright © 2023 The Author(s). Published by solarlits.com.

5150
Total views
Citations
SHARE ON


