Volume 11 Issue 1 pp. 119-130 • doi: 10.15627/jd.2024.7
Geometry Optimization of Industry Buildings for Energy-Driven Design Development in Bangladesh
Syed Monirul Islam,∗,a Fahmida Chowdhury,a Faysal Bhuiyan,b Masud Ur Rashidc
Author affiliations
a Department of Architecture, Military Institute of Science & Technology, Bangladesh
b Department of Architecture, University of Kansas, Bangladesh
c Department of Architecture, Southeast University, Bangladesh
*Corresponding author.
monirul1971@gmail.com (S. M. Islam)
arch.2mist1625@gmail.com (F. Chowdhury)
F245b107@ku.edu (F. Bhuiyan)
masudurrashid@yahoo.com (M. U. Rashid)
History: Received 20 June 2023 | Revised 15 April 2024 | Accepted 16 April 2024 | Published online 22 June 2024
Copyright: © 2024 The Author(s). Published by solarlits.com. This is an open access article under the CC BY license (http://creativecommons.org/licenses/by/4.0/).
Citation: Syed Monirul Islam, Fahmida Chowdhury, Faysal Bhuiyan, Masud Ur Rashid, Geometry Optimization of Industry Buildings for Energy-Driven Design Development in Bangladesh, Journal of Daylighting 11 (2024) 119-130. https://dx.doi.org/10.15627/jd.2024.7
Figures and tables
Abstract
Even though the manufacturing industry consumes roughly 54% of total available energy globally, little consideration has been devoted to optimizing energy in the early stages of industry design, particularly in densely populated cities. With the increased demand for green buildings, energy performance has a greater influence on design results. As a result, this paper provides an envelope optimization technique that can assist architects and computational designers in analyzing the environmental performance of various alternatives and developing optimal design solutions, especially for Bangladesh and the building of these regions. First, an existing industrial site in Dhaka, Bangladesh's capital was chosen as a case study, and a hypothetical industry building, as well as its surroundings, were parametrically developed. Then, for the optimization method, the design factors linked to the building envelopes were chosen. Finally, a Multi-objective Optimization (MOO) procedure was utilized for defining performance measures including daylighting, energy and comfort measures, UDI, EUI, and PPD. According to the MOO results, the UDI may be enhanced by 25.286% as compared to the least favorable scenario. Consequently, the EUI may decreased by 38.718 kWh/m2 while the PPD can be increased by 41.78%. The geometric configuration of East, West, North, and South played a significant role when designing the industrial building. According to the analysis, the geometric configuration of a South WWR of 50%, a West WWR of 30%, an East WWR of 70%, and a sill height of 0.75m is the most feasible option. A statistical analysis of design factors and performance measures demonstrated that the window-to-wall ratio, particularly on south walls, has the greatest impact on industrial building design in densely populated areas. The proposed approach is expected to be used by architects and municipal planners to develop design metrics based on simulation results.
Keywords
Climate-responsive building design, Multi-objective optimization, Building energy analysis, Generative design
1. Introduction
More than 6 billion people live in high-density cities around the world. Because of the city's infrastructure needs, governing bodies initiate various types of infrastructure development. Among the most visible recent developments in Bangladesh has been the growth of industry. However, due to a lack of emphasis on carbon emissions in the rules and regulations, industry buildings are being developed in such a way that they generate a significant amount of carbon emissions each year. According to studies, the manufacturing industry consumes roughly 54% of overall available energy worldwide. As a result, energy-driven building geometry design is critical during the early stages of design development to make industry buildings sustainable.
With increased demand for green buildings, energy performance has a greater impact on building sustainability [1]. Furthermore, daylight is another parameter that must be met in order to achieve comfortable interior spaces as well as decrease the carbon emissions in the built environment. Several geometrical features of the building, i.e., window-wall ratio (WWR), shading depth, building length and width, as well as courtyard ratio, may have an impact on these energy metrics (Fig. 1). As a result, before developing the building, it is critical to properly configure the building features so that the building can be sustainable in the long run. This method not only reduces energy consumption and thus carbon emissions, but it also makes the post-occupancy interior environment healthy and comfortable.
Figure 1
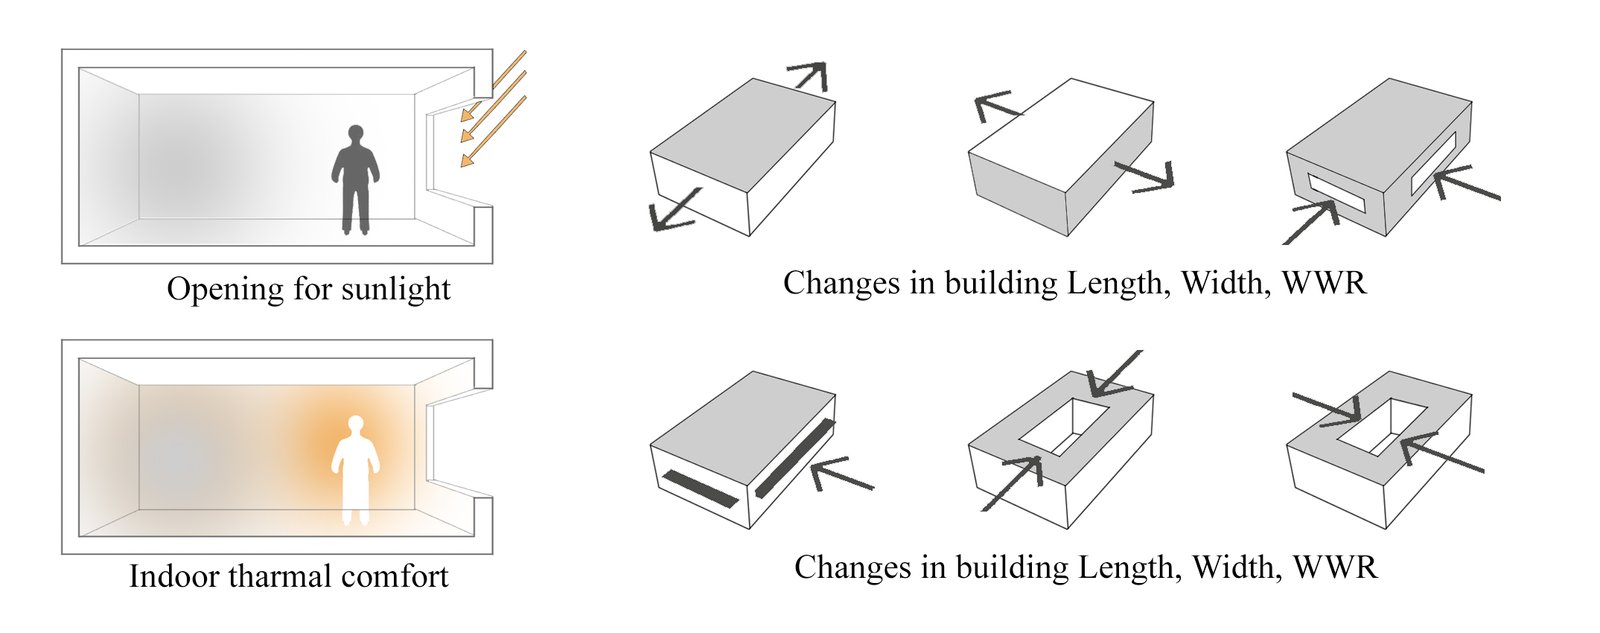
Fig. 1. Building configuration (building length, width, window-wall-ratio, shading device configuration, courtyard length-width) to get energy performance.
The innovation of this workflow lies in its tailored approach to industrial building design within the context of Bangladesh and neighboring regions, addressing specific challenges and considerations unique to this geographical area. While workflows for optimization have been previously implemented, the novelty of this study lies in the development of an analytical framework that specifically targets the optimization of energy consumption and environmental impact in industrial buildings in this particular region. The aspect of the workflow can be primarily attributed to the Diagnosis section, where the analytical framework is deployed to assess energy consumption patterns and identify inefficiencies. Unlike generic approaches, this framework is customized to account for the socio-economic dynamics, climatic conditions, and resource constraints prevalent in Bangladesh and neighboring regions. By integrating localized data, industry insights, and stakeholder perspectives, the Diagnosis section ensures a nuanced understanding of the factors influencing energy consumption in industrial buildings. This proactive approach distinguishes the workflow from conventional methodologies, offering practical solutions that are not only effective but also feasible within the constraints of the local context. In essence, the innovation of this workflow lies in its ability to bridge the gap between theoretical frameworks and practical applications, thereby empowering designers and architects with actionable insights to drive sustainable outcomes in industrial building design specific to Bangladesh and neighboring regions.
Even though several approaches to optimizing buildings have been explored in previous research projects, no research has been conducted to optimize the industry building geometry to reduce energy consumption and increase occupant comfort. As a result, this paper presents an envelope optimization technique for industrial buildings in Bangladesh's climatic context in order to reduce carbon emissions and make the city more sustainable. The authors established two hypotheses to achieve the research goal.
Hypothesis 1: Multi-objective optimization-based framework can predict the most feasible geometry configuration that can improve the energy efficiency for future energy-driven city development.
Hypothesis 2: Different independent variables have dissimilar influence on the outcome objectives.
The research established a set of specific objectives to achieve these hypotheses:
- Develop a multi-objective optimization workflow which can predict the most feasible geometry configuration.
- Recommend the most feasible geometry variable for the best daylighting, percentage of people dissatisfied and energy consumption trade-offs.
- Identify the most influential predictor geometry variable on daylighting, percentage of people dissatisfied and energy consumption.
This paper is expected to be useful to architects and computational designers in analyzing the environmental performance of various alternatives and developing optimal design solutions.
2. Literature
2.1. Energy-driven industry design development
The goal of energy-driven manufacturing design development is to provide proper envelopes variable layout that reduces energy requirements, particularly considering and responding to inter - dependencies among energy and lighting systems with the built form for greater energy achievement. Choosing the best solution option for a more efficient building is essential and decisions should be made at the early stage [2]. Large scale urbanization is causing cities in developing countries to grow as more and more people are migrating in everyday in search of work and livelihood. Over 19.5 million people resides in the 300 sq km metropolitan area of Dhaka, Bangladesh and an increasing number which is predicted to reach 26 million by 2035 [3]. These people cluster around their place of work contributing to the ever-growing city density. The city grows as more infrastructures are built in order to support it. With this growth comes an increase in energy demand for the city to sustain itself, as buildings are among the major energy consumers in terms of overall energy consumed [4].
As the world embraces globalization, cities are becoming hubs for business and communications [5]. An important part of these developing cities is the industrial area that provides work for a large number of the city dwellers. These areas consist of factory buildings that have large machines on their production lines consuming even more energy. These buildings also emit heat and other substances that is detrimental to the environment and also to the mental and physical health of its workers [6]. Buildings don’t just need energy to run its machineries but also to maintain a comfortable work or living environment for its occupants as the quality of the building interior contributes immensely to wellbeing and working efficiency of its users [7]. Thus, energy is needed not just to run a building but also to sustain it. Our cities are densely packed and there is a constant need for energy in order to provide for everyone.
In order to reduce the load on the city power grid, factories are thus designed to be as energy efficient as possible. They should be engineered to take the maximum advantage of the natural resources available. Their design should be such that they take advantage of natural light and ventilation when necessary and balance the energy obtained from the national grid in order to maintain optimum working conditions. The building may allow natural ventilation during summer in order to keep cool and prevent loss of heat during winter. Every aspect of the industrial building should be designed according to the bio climatic architecture for the minimization of energy needs and the environmental impact of them [8]. Such design decisions are to be taken in the early stages of design because it is at this stage that the possibility of conceiving a high performance design is at its peak [9]. This is how an energy driven industry design development will help optimize these buildings so that they may consume as little energy as possible.
2.2. Performance assessment metrics
2.2.1. Day lighting metrics
One of the major purposes of an energy driven industry design development is to provide a comfortable interior work or living environment for the occupants without the expense of too much energy. In order to do so, several Day Lighting Metrics are developed to analyze the performance of an interior environment under a certain fenestration design. Listed and described are some showing how they measure and evaluate daylight performance [10].
(DA: Daylight Autonomy): the percentage of inhabited period during the certain amount of time when daylight intensity surpasses luminance of 300 lux [11]. DA provides a visual representation of how daylight will spread in a given space, allowing the designer to estimate the associated electric energy savings. Because this matrix multiplication does not have an upper limit, it has a disadvantage in that it does not account for the visual discomfort caused by excessive sunlight.
In the realm of workspace ergonomics and productivity optimization, it is recommended that environments tailored to accommodate predominantly paper-based tasks maintain a lux level of 500. As a foundational principle, office lighting standards advocate for an average illumination level falling within the range of 300 to 500 lux. It is imperative to underscore that any operational space should not descend below the threshold of 300 lux to ensure conducive conditions for effective task performance and occupant well-being. However, general guidelines suggest that areas involved in detailed inspection or fine stitching might require higher lux levels, around 500-1000 lux, while general production and assembly areas could aim for 300-500 lux for adequate lighting conditions- Light intensity requirement according to Bangladesh National Building Code-BNBC 2021 [12].
(UDI: Useful Daylight Illuminance) [13]: The UDI is made up of three metrics that are evenly distributed around each juncture in a room. The markers show proportion of period a place lower than a lowest limit (set to 100 lux) and between a helpful minimum and maximum value (often set to 2000 lux).
2.2.2. Energy use intensity (EUI)
The EUI is used to calculate a building's overall performance. It is expressed as a ratio of a building's total annual energy consumption to its floor area. Because the energy used for natural lighting is a component of total power consumed, EUI is linked to it in part.
(PMV: Predicted Mean Vote): The PMV is an ISO standard that predicts the mean vote of a large group of people [14]. It decides the effectiveness on a scale of +3 to -3, with +3 being hot, -3 being cold, and 0 being neutral. According to the ASHRAE Standard 55-1992, a PMV vote between -0.5 and +0.5 is regarded a satisfactory zone [15], because as values step away from 0 to extreme, it becomes uncomfortable.
(PPD: Predicted Percentage of Dissatisfied): The proportion of residents who are dissatisfied through the interior thermal situations is predicted by PPD. It is derived from an extension of Fanger's PMV range of thermal comfort concept. [15].
The PPD increases as the PMV moves away from the neutral zero in any direction. However, it is also important to take into consideration that it is impossible to satisfy all occupants at the same time. As per ASHRAE 55, the recommended PPD for a given interior space is less than 10% unsatisfied occupants. Different people will perceive the interior climate of a building in different ways, and it is not possible to satisfy all. Thus when considering a building as a whole it is considered adequate to satisfy at least 80% of the occupants, attaining a PPD of 20% or less [16].
2.3. Data diagnostic measures for measuring impact of individual input parameters
Diagnostics for linear regression are tools that assess a model's adherence to its presumptions and investigate whether there is a single assessment or group of observational data that the model does not adequately represent. These capabilities allow researchers to determine whether a model adequately describes the data from their study. The following are the five linear regression assumptions for generalizations:
- A linear relationship is understood to be required for both the independent variable (x) and the outcome objective (y).
- The residuals must be normally distributed. The residues are assumed to be widely dispersed.
- Residue variability is consistent. The difference between the residues is expected to be continuous (homoscedasticity).
- The residual inaccuracy terms are unbiased.
- Multicollinearity is absent or minimal.
If the regression analysis assumptions are met, the errors affiliated with one variable are not found to correlate with the uncertainties associated with any other variables. Regression diagnostics are often used to assess assumptions and determine even if there aren't any observations that have a large, undue influence on the analysis.
3. Optimization framework
3.1. Methodology
There are four steps to the approach. The research's framework is depicted in Fig. 2. The initial step was to choose a site area based on the research needs. The industrial building on the design plot, as well as the surrounding conditions, were included in the site area. Production scale, building size, breathable formation of building in traditional building design practice, occupancy type, etc. were considered. Furthermore, the typical courtyard patterns were studied in the light of Bangladesh's meteorological conditions. For the optimization study, the appropriate meteorological data and construction timetable were also obtained. The number of tenants in an industry setting during the year, as well as building operating time, were included in the building schedule. The weather data was linked with the model to get the specific climate based result. In the second step, many parameters were used to create a parametric industry building geometry. The opening to individual façade, the depth of shading device/ sunshade, the size of courtyard, the length and width of the building along with other parameters were input. For the research analysis, the parameters were then used as predictor variables.
Figure 2
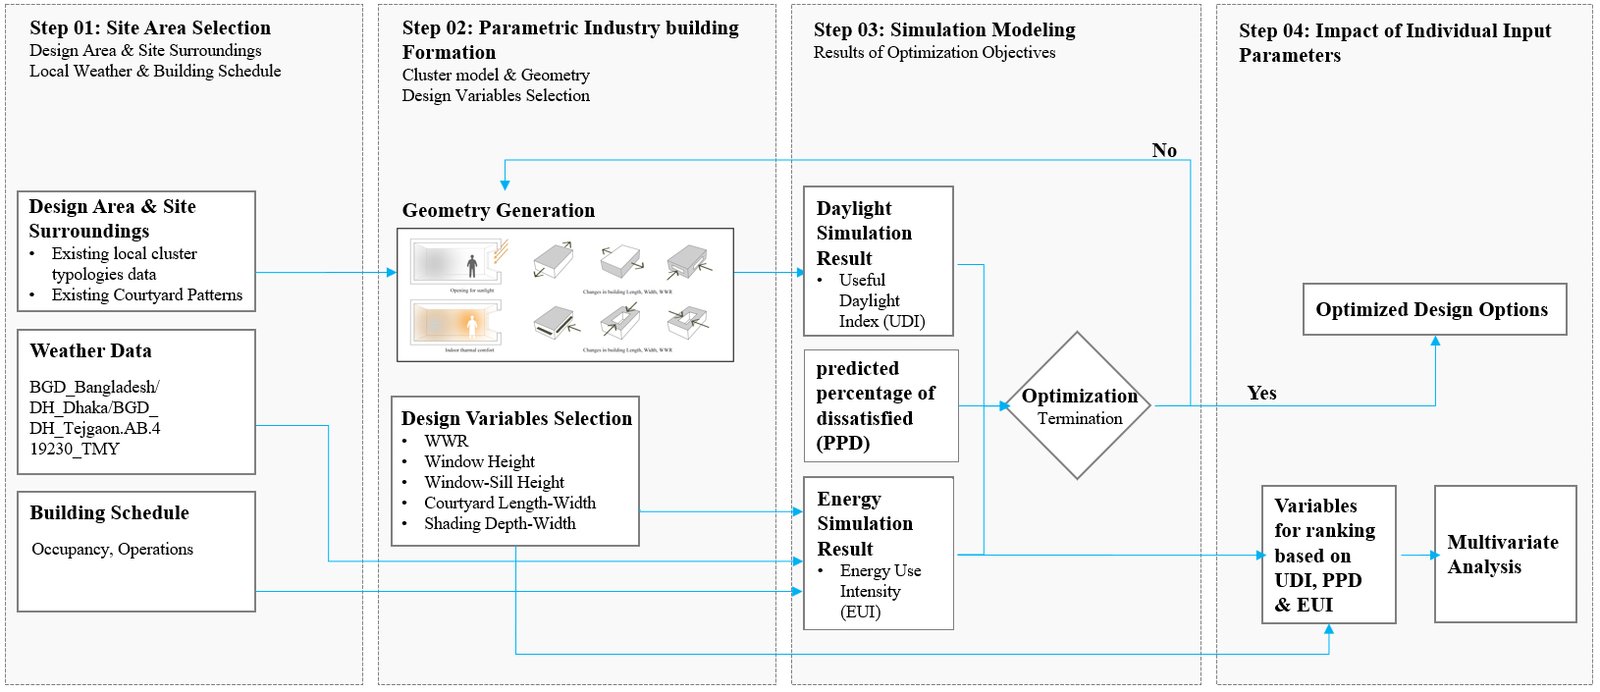
Fig. 2. Framework of the research, order and connection with flowchart -choosing site, input of weather related data, generating model with options for variables, simulation and result of the simulation.
The parametric model was connected to the simulation module in the third step of the research to calculate three dependent variables as outcome targets. The objectives were chosen to be Useful Daylight Illuminance (UDI), Predicted Percentage of Dissatisfied (PPD), as well as Energy Use Intensity (EUI). A crucial statistic in architectural design, useful daylight illumination (UDI) gives information on the amount and caliber of natural light in a building. Architects and designers can optimize window configurations and building layouts to maximize energy efficiency, reduce dependency on artificial lighting, and guarantee occupant comfort by using UDI analysis. Understanding UDI levels allows designers to create spaces that support productivity, well-being, and aesthetic comfort—all of which contribute to the creation of sustainable and hygienic buildings. Moreover, UDI assessment can help ensure that buildings satisfy both functional and regulatory needs by facilitating compliance with daylighting standards and laws. In the end, UDI is a vital tool for architectural projects that aim to maximize building design, advance energy efficiency, and cultivate occupant well-being. One important metric used in environmental engineering and building design to assess occupants' thermal comfort in a place is the Predicted Percentage of Dissatisfied (PPD). PPD helps designers optimize building envelope design and heating, ventilation, and air conditioning (HVAC) systems to reach maximum comfort levels by projecting the proportion of occupants likely to be unhappy with the thermal conditions. Insights into potential thermal discomfort are provided by this statistic, which helps designers make well-informed decisions to maximize energy efficiency and improve occupant satisfaction and productivity. Furthermore, In building energy analysis, Energy Use Intensity (EUI) is a crucial statistic used to calculate how much energy is used per unit area in a structure during a certain time period. EUI offers important insights into how efficiently a building uses energy by comparing energy consumption to building size. It makes it possible for legislators, engineers, and architects to assess the energy efficiency of various buildings, pinpoint problem areas, and put cost- and energy-saving measures into action. Furthermore, EUI is used as a benchmarking tool to evaluate adherence to energy efficiency certifications and standards, directing the development and maintenance of ecologically conscious and sustainable buildings. All things considered, EUI is vital to the advancement of energy-efficient construction techniques, decision-making processes, and energy efficiency.
The predictor variables and outcome objectives were then connected to a multi-objective optimization module, which iterated the design possibilities until the most practicable design options were found. The third step was to determine the impact of various independent factors on the result goals. The most effective predictor variables for effecting daylight, energy, and occupant comfort were determined by correlation and multi-linear regression analysis in the final step.
3.2. Prototyping
The research was conducted using several domains (Fig. 3). It is comparable to the research undertaken by Aman, J. et al. 2021. The footprints of the structures and their environs were created on the Rhinoceros platform in the first phase of the investigation. The parametric geometry was then created in 3D using a visual programming tool called Grasshopper, which is a Rhinoceros plugin. Grasshopper is one of the most widely used parametric platforms, with the ability to specify geometric parameters [17]. The authors then employed ClimateStudio, a cutting-edge energy simulation tool. To obtain correct UDI, EUI, and PPD findings, it is critical to use a proven simulation tool. ClimateStudio has been widely utilized to measure energy-related analysis in recent years.
Figure 3
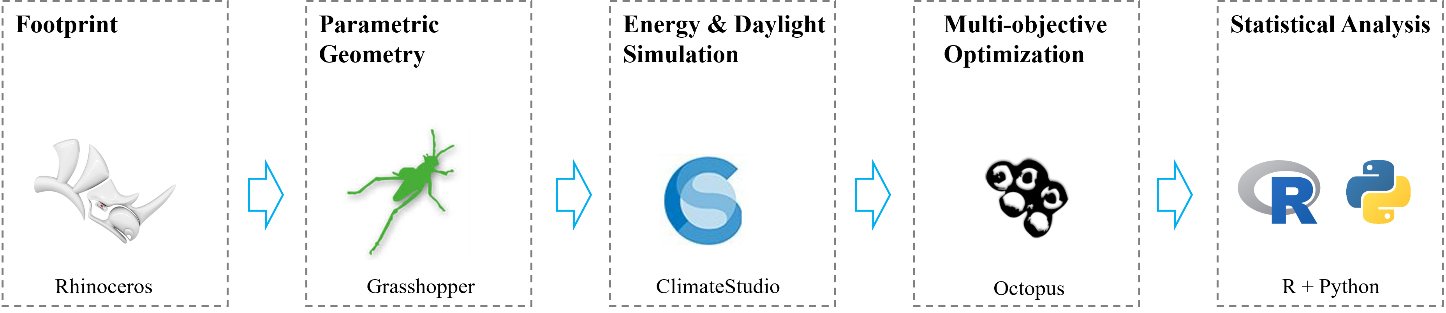
Fig. 3. Prototype domains of the workflow; shows the program used in each steps accordingly.
The next stage was to optimize the design options, which the authors accomplished using Octopus, a Grasshopper plugin. To aggregate the optimization process, the plugin can take the predictor variables and outcome targets as inputs. This technique can identify a tradeoff geometry configuration solution that can be used early in the design phase. The statistical programming script R and python programming were used in the last step to calculate multivariate analysis and visualize the results.
Seamless extraction of data from Octopus plugins within Rhino-Grasshopper to Python presents a pivotal capability for researchers. Leveraging the interoperability between Grasshopper, a graphical algorithm editor tightly integrated with Rhino, and Python, a versatile programming language widely adopted in computational design workflows, researchers can tap into the rich dataset generated and manipulated within the Octopus plugin environment. Initially, researchers establish communication between Grasshopper and Python through plugins or scripting components. Subsequently, utilizing Python's extensive ecosystem of libraries such as Rhino3dm, researchers access Octopus plugin-generated data structures directly or through intermediate data formats such as JSON or CSV. This process empowers researchers to perform advanced data analysis, visualization, and integration with external tools and databases, thereby enhancing the analytical capabilities and insights derived from computational design methodologies. Ultimately, this interdisciplinary integration fosters innovation and facilitates the exploration of complex design spaces in architectural, engineering, and other creative domain.
4. Implementation
4.1. Site area
The plot for this research was chosen at Savar, Chandra. A hypothetical production factory building was chosen for this study. The site area is 29 acres which is surrounded by other industrial buildings and has natural green with water on the south zone. Surrounding environment and other factors were also considered while working with this project.
Different types of geometry were applied to create the building prototype, including: (a) the incorporation of extensive standards, guidelines, and restrictions into conventional project preparation. (b) Differing on the magnitude and output size. (c) Combination developing, which takes into account how well a structure performs. Standards for industrial buildings and the policymaker's rules and regulations serve as guidelines for the hypothetical model. The area around the location was considered. Differing on the demand for manufacture range and enterprise requirements, a fundamental geometric form was also established. On the way to improve the ventilation procedure, a courtyard was added into the design. Windows, blinds, and the floor height were all designed in accordance with requirements. For this study, weekdays from 8 am to 5 pm operation time and occupancy were taken into consideration. Dhaka Tejgaon was utilized for weather data in the .tmy format [18].
4.2. Parametric industry building formation
The traditional Manufacturing building proportions and variable quantity were established using rules and criteria for industrial design. The factory building's width and length were measured in accordance with regional regulations and the proportions of the production plan, while the courtyard's width and length were measured in accordance with Nationwide Code Compliance requirements. The manufacturing area and layout will surely affect the facility's basic size, however in order to achieve our goal, we have prioritized building dimension flexibility. The interval of the variables depending on the size of the production capacity and standard design of an industrial building with the production size. Such as, the allocated space for building length was 100m to 110m, building width flexibility was 55m to 65m, the courtyard length’s & width’s variables came from the functional organizations and flexibility (Table 1). For the opening, the basic rules were followed. “The opening on a single façade should be more than 35% -14m Depth [12].
Table 1

Table 1. Variables with minimum & maximum values.
When building the parametric model in the Rhino-Grasshopper platform, the design aspects were taken into consideration. Factors included the WWR on the north, south, east, and west facades, the length and width of the courtyard, the height of the windows and windowsills, their orientation, and the depth of the shading device (Fig. 4). Building codes were followed in the implementation of the variable range. The typical quantity of each variable's assortment was taken into consideration while calculating the dimensions for the hypothetical building model.
Figure 4
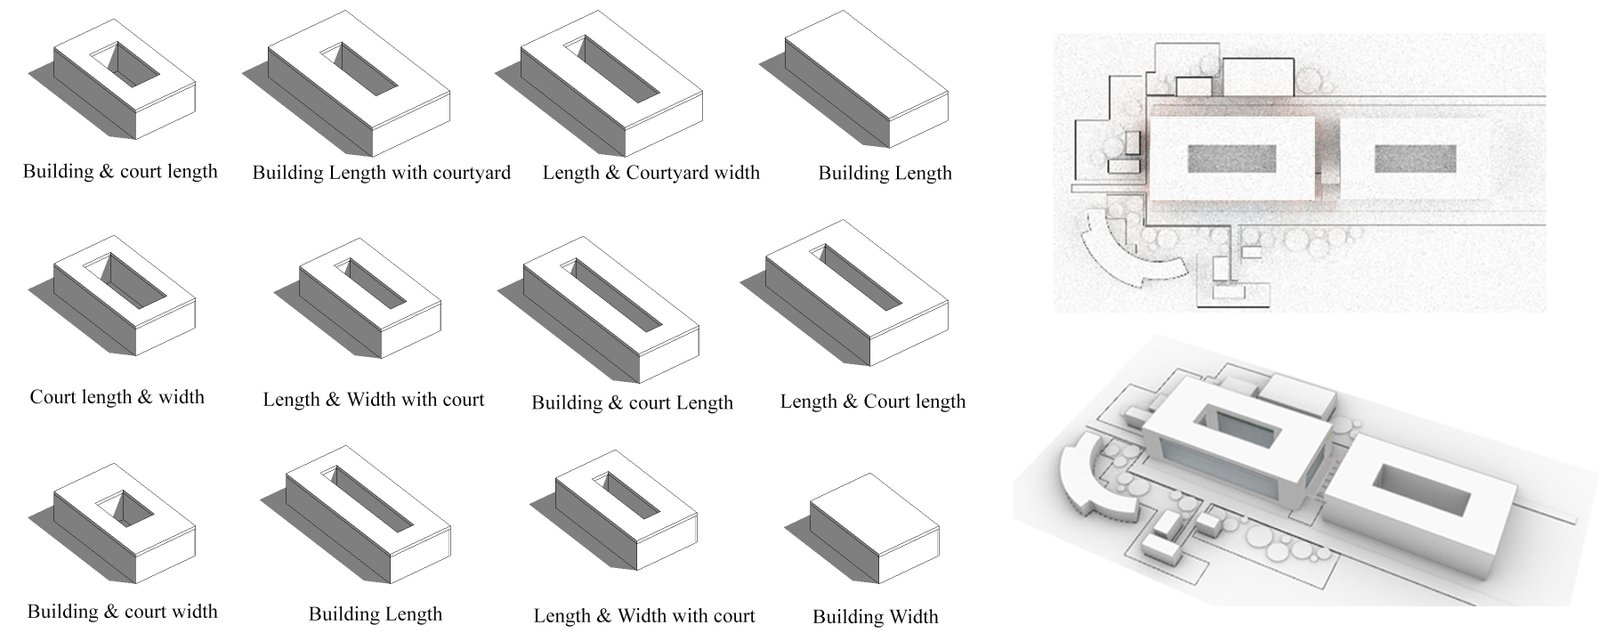
Fig. 4. Building & courtyard length and width variations with constant surrounding contexts and greeneries.
Building Schedule- In the context of Bangladesh, usually the workers actively work from 9am to the 5pm. As it is an industrial building, the zones are divided considering the type of work done into that particular space, like cutting, sewing, polishing, packing, loading, unloading etc. In our targeted building, the building is mainly used for press cutting and machine-based sewing, starts from 9am to 5 pm. The building starts its operations -preparation of the day, 1hour prior the actual production starts- when the optimum light condition is not the main necessity and closes 30 minutes after the workers leave the building. During the working time (9am to 5pm), natural ventilation is required along with sufficient light with is no less than 300 lux. Within Bangladesh- adjacent to the regions on this equator-, the outside temperature is closely 32-37 degree Celsius where comfortable temperature for working considered from 22-25 degree Celsius. Hence, we have used 25 degrees Celsius as desirable temperature in the schedule.
The space is considered as Large Office Room, with .333 p/m2 (People density) with 1.2 metabolic rate with is taken for moderate movement. Light 11 W/m2 with 500lux continuous light. For Heating- constant temperature is 25.5 degree Celsius (comfortable temperature for human) with maximum Supply Air temperature 25 degrees. For Cooling, Constant set point is 27 degrees, minimum air supply temperature 24 degrees, cooling limit 100 W/m2, flow limit 100 m3/s/m2, cooling COP 3, Natural Ventilation Set point 22, Maximum Outdoor Temperature 30 degree Celsius, Max Rel. Humidity 90%.
The primary objective of the research was to make recommendations for an environmentally responsible and worker-friendly industrial design that would maximize daylighting while consuming less energy. In order to produce these results, Window-Wall Ratio and Shading were used as independent variables. Energy use and daylight are significantly impacted by these two variables [19,20]. The impact of solar radiation on the interior, indoor temperature, and daylight access are all impacted by WWR. The proportion can be found by splitting the overall glazing area by the exterior front wall area [21]. For instance, if the glazed opening is 40 sqm in size and the facade's wall area is 100 sqm, the WWR ratio will be 0.40. It is converted in percentage for better understanding of the opening ratio of a facade. For the iteration process, at the Window Wall Ratio range of 0.30 to 0.60 for eastern and western facades and 0.30 to 0.80 for northern and southern facades were taken – depending on the orientation of the building considering the Bangladeshi climate. Also, factory building length and width of 100 to 110 and 55 to 65 meters, and courtyard length and width of 50 to 60 and 19 to 24 meters, which came from requirements and flexibility limit. The (EUI) Energy Use Intensity and (UDI) Useful Daylight Index are the outcome variables. To calculate UDI, the ratio of the total annual occupied hours to the number of useable hours was used [13]
In addition to the energy unit of KWh/m2, the EUI takes into account the total calculation of lighting, annual heating and cooling, equipment, and loads. In this study, several end goals—including Useful Daylight Illuminance (UDI) and Energy Use Intensity (EUI)—were investigated to learn more about the best feasible options and to examine the impact of design components on the solutions.
4.3. Multi-objective optimization settings
The optimization generator used in the research was Octopus, a multiple dependent objective optimization generator. Holland proposed the genetic method algorithm, used for Octopus in the 1970s [22]. This is predicated on the organic choice method generally used in biological progression. The first-generation population size in this research was 100, implies that 100 iteration resolutions are chosen randomly across the candidate choices. All subsequent generations have a population of 50. Octopus adjusts the population of candidate solutions using natural principles including such selection, inversion, and mutation. Then Octopus chooses solutions with high results at irregular intervals from existing number of options and utilizes the options as parents for generating the next generation options.
There have been two main methods for dealing with various conflicting objectives. The first technique is the weighted sum model, in which different weights are assigned to different dependent objects, such as, 60% on UDI while 30% on EUI and 10% on PPD. The issue is then reduced to a single dependent objective problem to minimize the complexity. Even though the weighted sum technique is simple to use, the outcome is heavily dependent on the defined weight assigned to every objective, and that process can often be error some. The other approach is Pareto front optimization that involves determining a trade-off between different objects, also known as the Pareto front, between each objective. The concept of dominance underpins the definition of the Pareto front. The Pareto front is made up of nondominated solutions, which means they are not possible to be enhanced in results.
The study used three dependent objectives, and the Pareto front algorithm was used to determine the best geometry options based on EUI, UDI and PPD (Fig. 5). The goal of design was to obtain designs with the least amount of energy, least amount of PPD and the most amount of useful daylight.
Figure 5
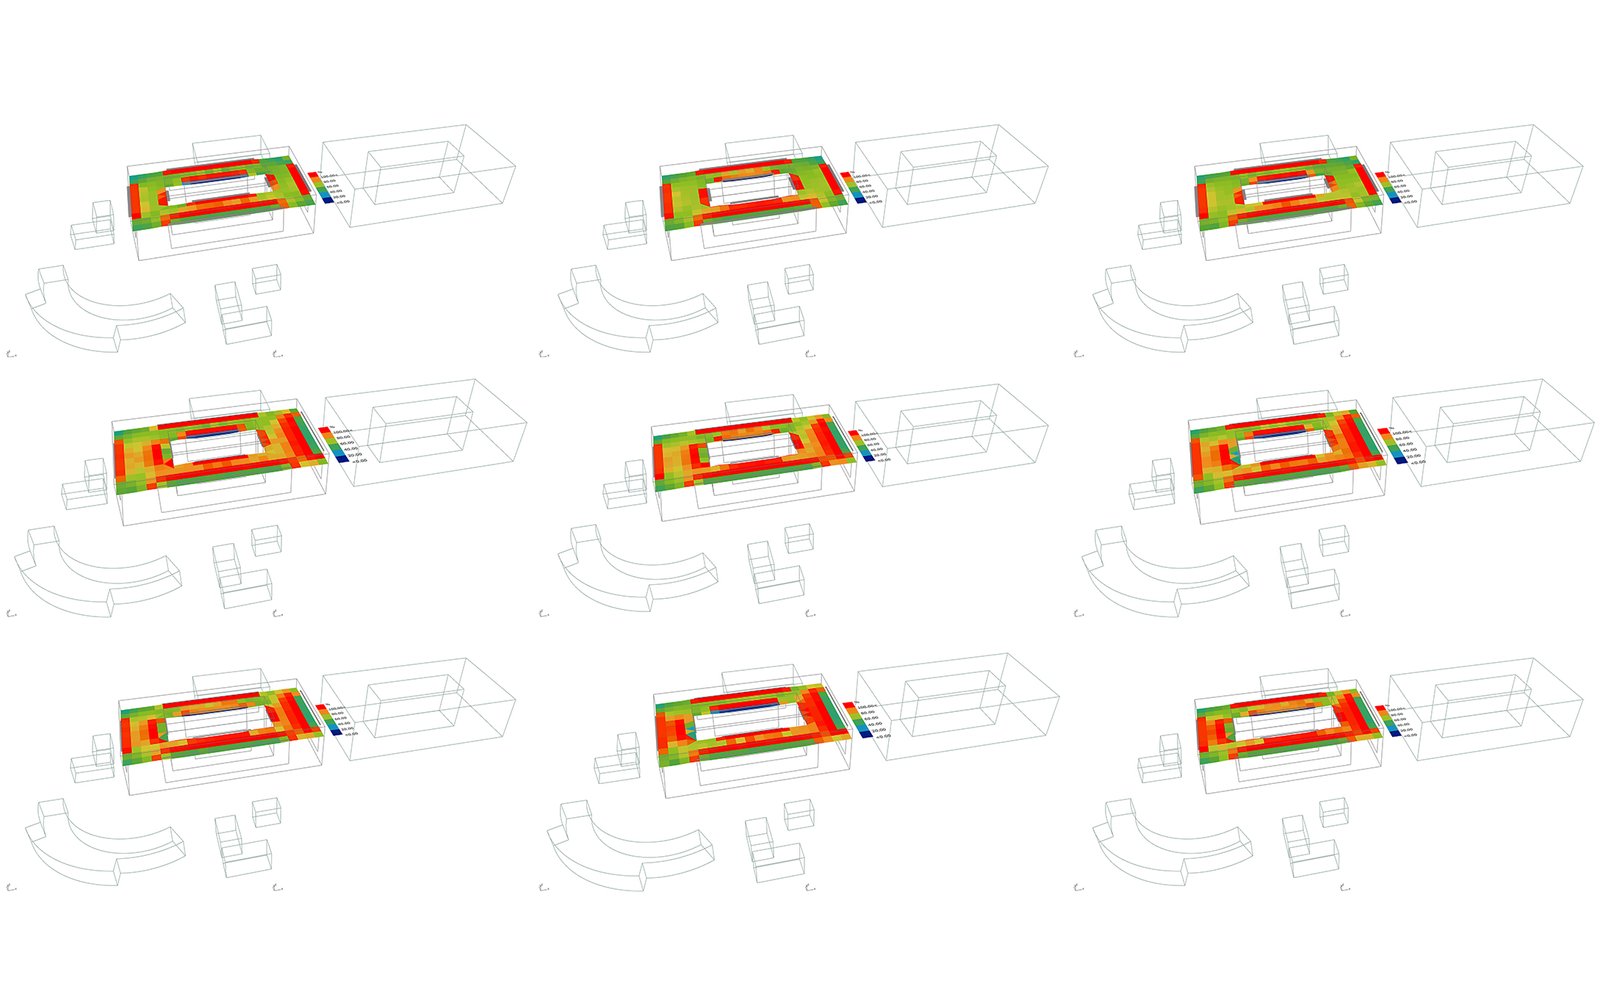
Fig. 5. Visualization samples of simulation outputs for UDI, EUI and PPD. The warmer area represents area with more workable lights (Green and blue color shows best and worst result; which is the outcome of a particular opening ratio).
5. Results & Discussion
The final result is divided into two stages. In the first phase, the multi-objective optimization result was analyzed to predict the most feasible geometry configuration. Multi-linear regression was used in the second stage of the results to determine whether different independent variables have dissimilar effects on the outcome objectives and to identify the most influential predictor variable in predicting the outcome objectives.
5.1. Optimization results
The optimization results were examined to determine whether the first hypothesis was satisfied. Figure 6 shows the scatterplot of UDI against EUI to depict the most feasible and least feasible design options.
Figure 6
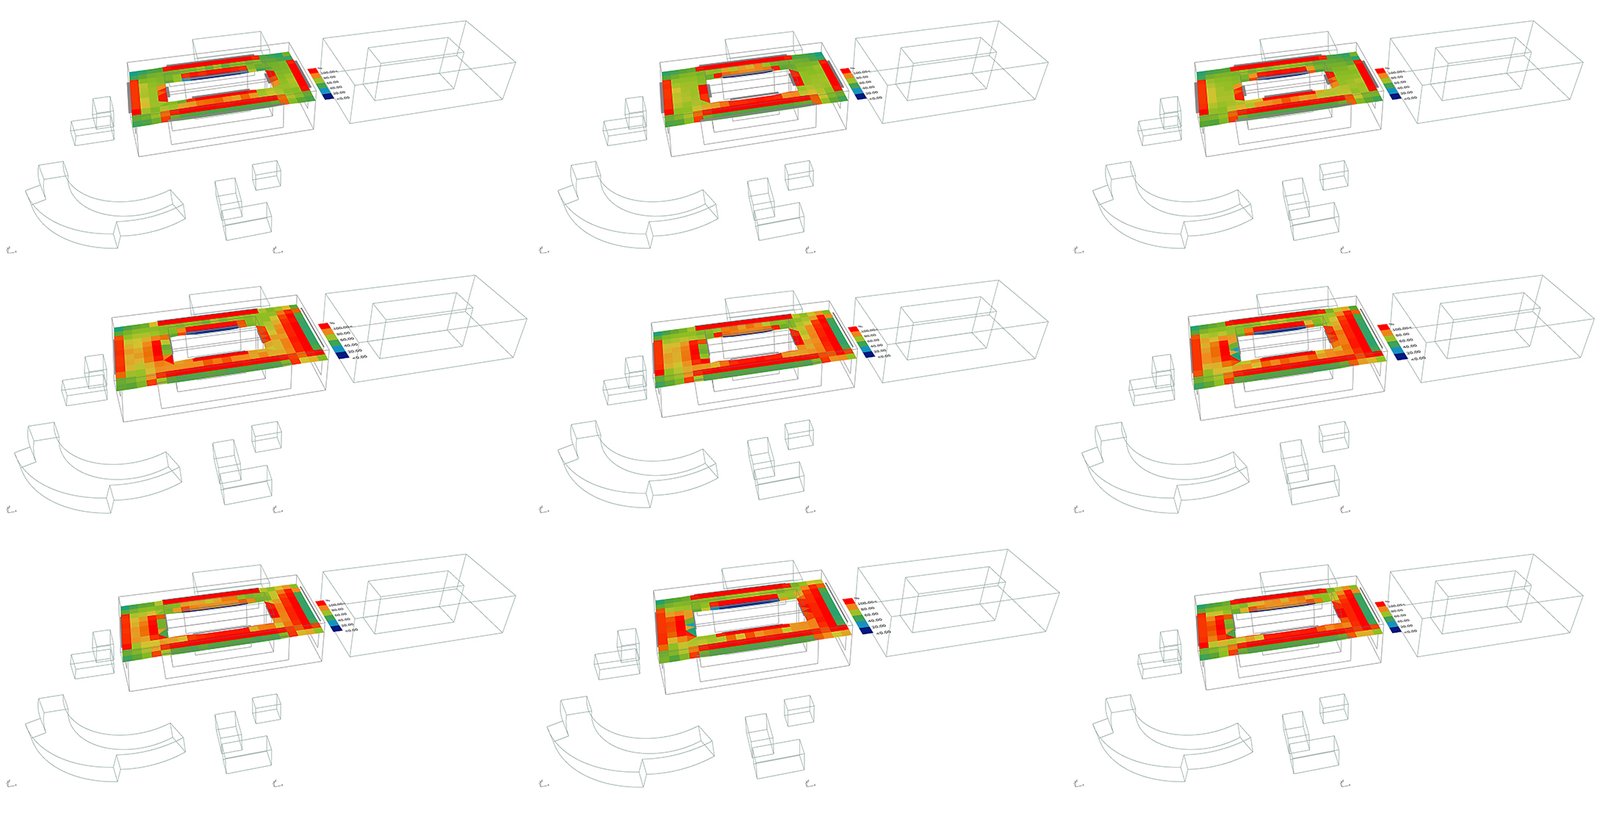
Fig. 6. Scatterplot of UDI against EUI (Top points are Most Feasible Options with more UDI and Less EUI results. The bottom points are Least Feasible Options with More EUI and less UDI).
According to the MOO results, the UDI could be increased by 25.286 percent when compared to the worst-case scenario. As a result, the EUI may be reduced by 38.718 kwh/m2 while occupant comfort may be increased by 41.78 percent. Table 2 depicts the most and least feasible configurations of the predictor variables and outcome objectives. Based on daylighting, energy consumption, and occupant comfort, a window-to-wall ratio of 50% on the south walls is a very feasible option. Increasing the ratio, on the other hand, will reduce the objectives' preferences. The most feasible design option is a west WWR of 30%, an east WWR of 70%, a sill height of 0.75m. Changing the length of the building or the length of the courtyard has no significant impact on the UDI, PPD, or EUI.
Table 2
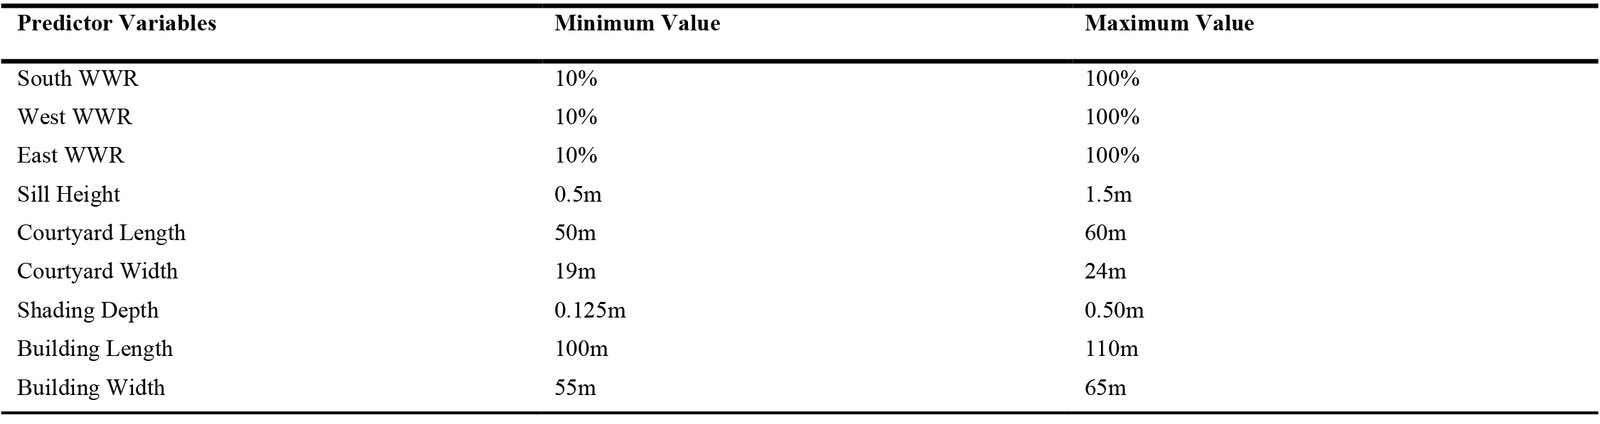
Table 2. The configurations of the most and least feasible predictor variables and outcome objectives.
5.2. Impact of individual input parameters
A multi-linear regression was conducted to measure the significance of each independent variable on the daylighting results as a proof-of-concept, and to conduct a sensitivity analysis to quantify the impact of individual input parameters on the overall results. First, a correlation matrix was developed to show the positive or negative impact of the parameters on UDI, PPD and EUI. Table 3 and Fig. 7 show the results of the correlation analysis.
Table 3
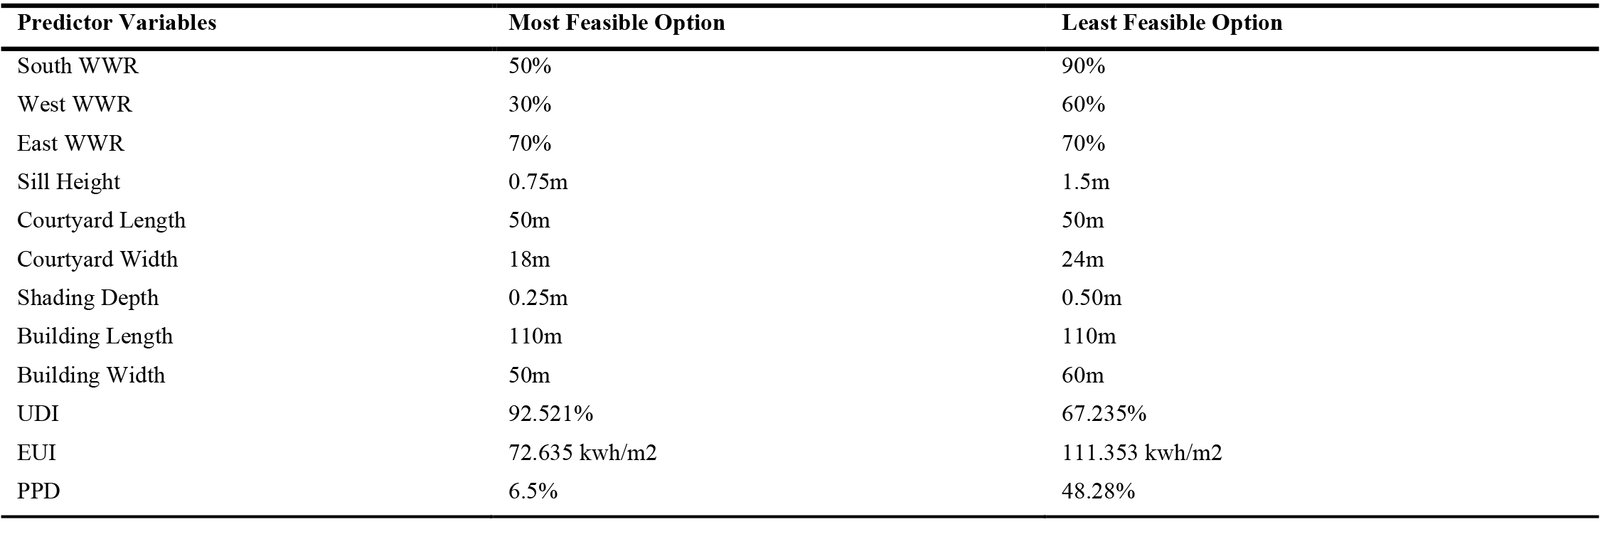
Table 3. Correlation results of the independent variables and the dependent objectives.
Figure 7
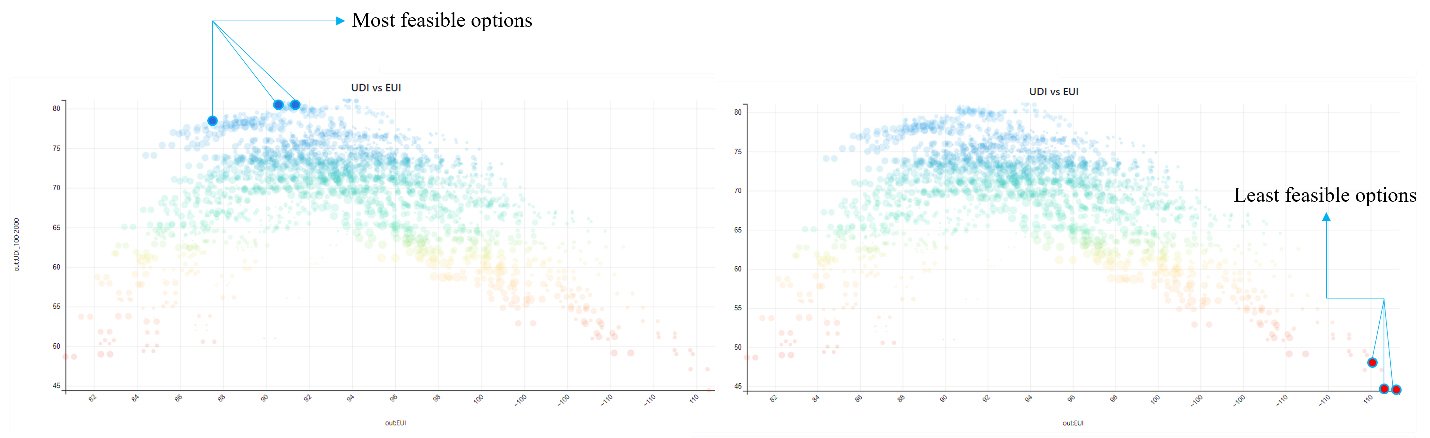
Fig. 7. Correlation matrix of the independent variables and objectives.
The overall window to wall ratio has the highest correlation with the dependent objectives, UDI, PPD, and EUI, according to the correlation study. On the south walls of the industry building, the window to wall ratio displays a negative moderate connection with daylighting. That is, if the designers increase the size of the windows on the south wall, the percentage of useful daylight in the structure will decrease. Controlling windowsill height and shading depth can help to ameliorate the issue. Despite the fact that windowsill height has little link with the UDI, it has a bigger impact on the percentage of persons dissatisfied with the interior and energy consumption intensity.
A hierarchical regression analysis (Table 4) was used to determine that the more complex model with all the variables accounted for significantly more variance (ΔR2 = 0.1348, p < .001) than the simple linear model with only south WWR. That means that, adding more geometrical attributes influence on daylighting. Even though, measuring the impact of these variables on other objectives was out of scope, it can be assumed that, adding the variables, such as WWR of all sides, Sill height, Courtyard length-width, shading depth, building length and width will impact significantly on the dependent objectives. The formula for the hierarchical regression is as follows:
Table 4
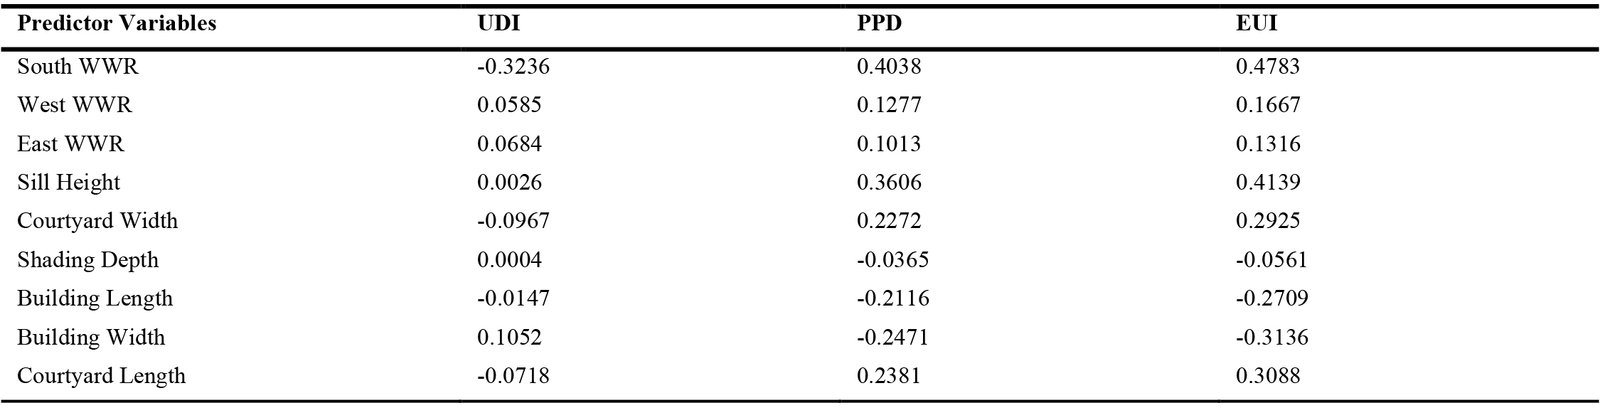
Table 4. Results table for the hierarchical regression analysis and the model.
Here, the model can predict an entity's outcome and that there is some error associated with that prediction (εi). The results are being predicted based on an outcome variable (yi), in this case, UDI, based on multiple predictor variables (𝑋1i……ni) and parameters (𝑏1….n), associated with the predictor variable that quantifies the predictor variable's relationship with the outcome variable. Another parameter, 𝑏0, that tells that the value of the outcome when the predictor is zero. A data diagnostic for this more complex regression model was performed, and no issues with influential cases were discovered. That is, there were no outliers in the dataset, and regression analysis to determine individual impact will yield precise findings. Furthermore, assumption testing revealed no issues with multicollinearity, normality, homoskedasticity, or error independence. Figure 8 depicts the diagnostic results of multicollinearity, normality, homoskedasticity, and error measure independence.
The linear relationship assumptions were tested in the first plot (upper-left panel) of Fig. 8. A horizontal line with no discernible patterns indicates a linear relationship. In this case, the red line is not very straight, but rather convex rather than flat. The red line-up ought to ideally be roughly parallel at 0. The manifestation of this shape may suggest that something is wrong with the linear model. It can be assumed that data entries 639 and 158 had some influence on the line's tilt. The residuals were checked to see if they were normally distributed in the second plot (upper-right panel). It is preferable if the residuals scores try to emulate the straight diagonal stripe. Though there are some variants, the majority of the points here fall roughly along this line segment, so normality could be assumed.
Figure 8
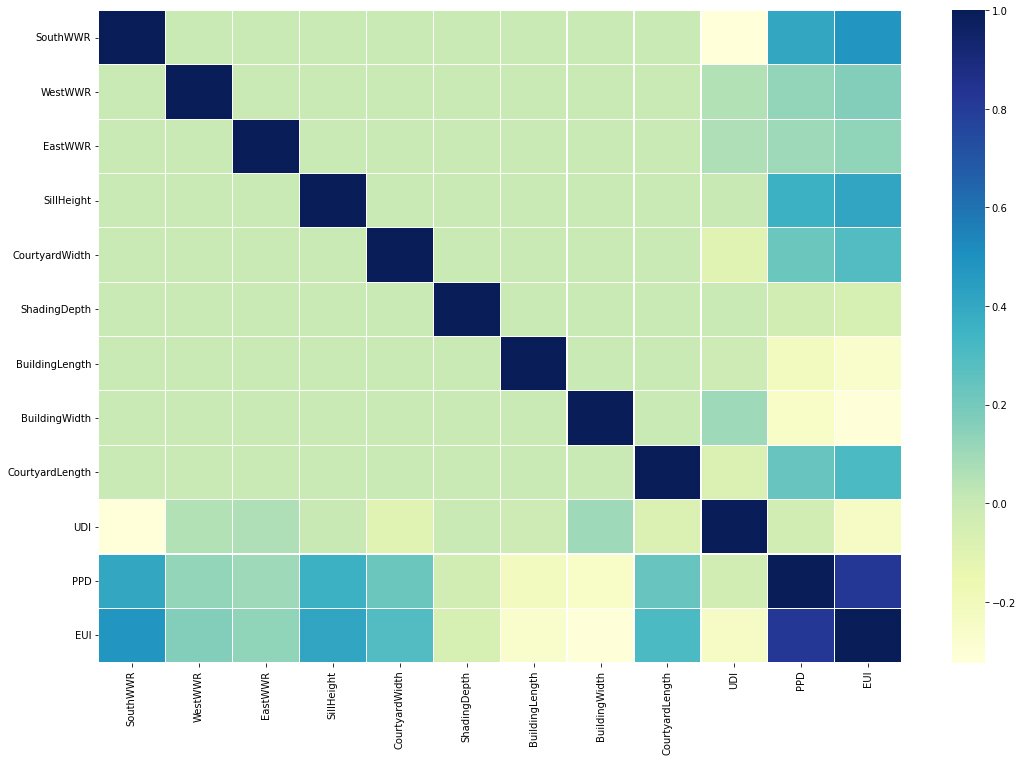
Fig. 8. Data diagnostics for regression analysis.
The third plot (lower-left panel) was utilized for testing the variance uniformity of residues (homoscedasticity). Homoscedasticity is indicated by a horizontal line with evenly spaced points. The variances of the residual points in this case vary along with the amount of the fixed result variable, indicating non-continual variances in the remaining inaccuracies or heteroscedasticity. The final plot (lower-right panel) was used to distinguish influential issues or extreme principles that could influence the regression results when they were included or excluded on or after the study. In this case, no data appears to be a tentative influential value, which means that any data that can change the results of the regression analysis must be included or excluded. Cook's distance found no data outside of a dashed line. They have a high Cook's distance score while the points are beyond the Cook's distance. In this case, no data influences the regression results.
Finally, the more complex regression model (see Table 4) was conducted and found as significant, F(9, 2038) = 36.43, p < .001 and represented a large effect (R2adj = 0.1348) as it accounted for 13.48% of the variance in daylighting. South WWR significantly predicted daylighting while controlling for other predictor variables, t(2038) = -15.739, p < .001; West WWR significantly predicted daylighting while controlling for other predictor variables, t(2038) = 2.844, p < .001. Similarly, East WWR significantly predicted daylighting while controlling for other predictor variables, t(2038) = 3.327, p < .001 and Courtyard length and width significantly predicted daylighting while controlling for other predictor variables, t(2038) = -3.493, p < .001 and t(2038) = -4.704, p < .001 respectively.
On the contrary, Window sill height has no impact on predicting daylighting while controlling for other predictor variables, t(2038) = 0.127, p < .001 and shading depth has no impact on predicting daylighting while controlling for other predictor variables, t(2038) = 0.019, p < .001. Even though, building width has significant impact on predicting daylighting, t(2038) = 5.116, p < .001, building length has no impact on predicting daylighting while controlling for other predictor variables, t(2038) = -0.716.
Finally, a beta test was conducted to measure the comparative impact of the predictor variables on dependent objectives. In regression, the beta values are the approximate coefficients of the independent variable that indicate a transformation in the dependent variables induced by an unit increase in the corresponding explanatory variable while preserving all other multiple regression continual. Here, South WWR (β = -0.32) had the strongest and near equal effects on daylighting, with an expected 0.32 standard deviation decrease in lighting for every standard deviation increase in the respective variable, while controlling for the other variables in the model. Sill height and courtyard width (β = 0.00) had a smaller effect or no effect with a 0.00 standard deviation increase in sales for every standard deviation increase while controlling for other variables.
Overall, the results shown in this section demonstrate that different independent variables have dissimilar effects on design outputs, which supports the second hypothesis of the study. In the climatic context of Bangladesh, changing the window-to-wall ratio has the biggest effect on the energy consumption of industrial buildings.
6. Conclusion and Future Scope
The study investigated a multi-objective optimization method for measuring the most feasible geometric configurations for design explorations early in the design development process. Another objective of the research was to determine the effect of individual variables on the outcome objective. According to the analysis, the geometric configuration of South WWR of 50%, west WWR of 30%, an east WWR of 70%, a sill height of 0.75m is the most feasible option that can be used when designing the industry building in Bangladesh's climatic context. Furthermore, the multivariate analysis showed that the window-to-wall ratio on south wall has the greatest influence on UDI, EUI, and PPD.
Multi-objective optimization is a powerful tool for determining the best option. However, there are several confounding variables that can influence the results. As a result, future research can conduct a greater number of iterations. One issue that arises along the way is the computation time and resources. Several research projects have suggested that the problem can be mitigated by combining machine learning (ML) modules with physics-based modeling [1]. Adding ML to the traditional simulation process can speed up iteration, allowing the user to perform a greater number of iterations during the optimization process.
Despite the fact that the research framework successfully measured the individual predictor variable, in this case, South WWR, which has the greatest influence on energy consumption and indoor occupant comfortability, more specific window configurations must be investigated in the future to determine the appropriate window and shading design. This process has the potential to significantly reduce energy consumption while also increasing useful daylight [9] outlined the specific measurements and design of the south window configurations in the Bangladeshi climatic context that can be considered during the parametric formation of the geometry phase in this research.
Industry buildings in Bangladesh consume a significant amount of energy, posing a significant barrier to achieving Sustainable Development Goal 11. (SDG 11). The goal is to reduce carbon in the urban environment in order to make cities and societies more sustainable. Designers and regulatory personnel must continue to investigate more effective geometry configurations that can reduce carbon by minimizing energy consumption while maximizing useful daylight and comfort. To summarize, the framework proposed in the study has the possibility to aid in the achievement of SDG 11 for future city and society development by guiding designers with specific design configurations for industrial buildings.
In conclusion, this study underscores the critical need for a tailored guideline for industrial building design in Bangladesh and neighboring regions, emphasizing the prioritization of sustainability alongside the prevalent focus on green buildings. Given the significant impact of industrial structures on both energy consumption and the well-being of laborers, the development of such a guideline emerges as a paramount necessity. By employing an analytical framework to mitigate energy consumption, designers and architects can effectively navigate the complexities of industrial construction while minimizing environmental impact. This guideline not only serves as a practical tool for optimizing resource utilization and enhancing indoor environmental quality but also empowers stakeholders to uphold their social and environmental responsibilities. Moving forward, concerted efforts to integrate sustainable principles into industrial building design are essential for fostering a workable environment for laborers and mitigating adverse impacts on the environment, thereby contributing to the overarching goal of sustainable development in the region.
Acknowledgment
The authors are thankful to the Military Institute of Science & Technology for logistic support and Nusrat Tabassum Smita, Graduate Research Assistant, Penn State Stockman School for sharing her knowledge in computer-aided optimization analysis.
Contributions
S. M. Islam: Conceptualization, Comprehensive literature review, Writing- Original draft preparation. F. Chowdhury: Methodology, Software, Data curation, Visualization, Writing- Reviewing and Editing. F. Bhuiyan: Investigation, comprehensive literature review. M. Ur Rashid: Validation, Supervision.
Declaration of competing interest
The authors declare no conflict of interest.
References
- M. O. Haque, J. Aman, and F. Mohammad, Construction Sustainability of Container-Modular-Housing in Coastal Regions Towards Resilient Community, Built Environment Project and Asset Management, 12 (2022) 467-485. https://doi.org/10.1108/BEPAM-01-2021-0011
- D. Tuhus,Genetic-algorithm based approach to optimize building envelope design for residential buildings, Building and Environment, 45 (2010) 1574-1581. https://doi.org/10.1016/j.buildenv.2010.01.005
- B. Lartigue, et al., Multi-Objective Optimization of Building Envelope for Energy Consumption and Daylight, Indoor and Built Environment, 23 (2013) 70-80. https://doi.org/10.1177/1420326X13480224
- J. Conti, P. Holtberg, J. Diefenderfer, A. LaRose, J. T. Turnure, and L. Westfall, "International Energy Outlook 2016 With Projections to 2040," USDOE Energy Information Administration (EIA), Washington, DC, DOE/EIA-0484, 2016. https://doi.org/10.2172/1296780
- G. Clark, Global Cities: A Short History, Brookings Institution Press, 2016. https://www.brookings.edu/books/global-cities-a-short-history/.
- M. A. Ortiz, S. R. Kurvers, and P. M. Bluyssen, A review of comfort, health, and energy use: Understanding daily energy use and wellbeing for the development of a new approach to study comfort, Energy and Buildings, 152 (2017) 323-335. https://doi.org/10.1016/j.enbuild.2017.07.060
- L. Edwards and P. Torcellini, Literature Review of the Effects of Natural Light on Building Occupants, National Renewable Energy Lab., Golden, CO, USA, NREL/TP-550-30769, 2002. https://doi.org/10.2172/15000841
- A. Chel and G. Kaushik, Renewable energy technologies for sustainable development of energy efficient building, Alexandria Engineering Journal, 57 (2018) 655-669. https://doi.org/10.1016/j.aej.2017.02.027
- J. C. Miles, G. M. Sisk, and C. J. Moore, The conceptual design of commercial buildings using a genetic algorithm, Computers & Structures, 79 (2001) 1583-1592. https://doi.org/10.1016/S0045-7949(01)00040-2
- V. Costanzo, G. Evola, L. Marletta, and F. Pistone Nascone, Application of Climate Based Daylight Modelling to the Refurbishment of a School Building in Sicily, Sustainability, 10 (2018) 2653. https://doi.org/10.3390/su10082653
- C. F. Reinhart and O. Walkenhorst, Validation of dynamic RADIANCE-based daylight simulations for a test office with external blinds, Energy and Buildings, 33 (2001) 683-697. https://doi.org/10.1016/S0378-7788(01)00058-5
- Gov. of Bangladesh, Bangladesh National Building Code (BNBC), 2021.
- A. Nabil and J. Mardaljevic, Useful daylight illuminances: A replacement for daylight factors, Energy and Buildings, 38 (2006) 905-913. https://doi.org/10.1016/j.enbuild.2006.03.013
- A. Shahjahan, An Investigation of indoor Thermal Comfort Range for Rural Houses of Dhaka Region, M.S. thesis, Bangladesh University of Engineering and Technology, (2012) Dhaka, Bangladesh. https://doi.org/10.3390/su12104051
- K. E. Charles, "Fanger's Thermal Comfort and Draught Models," Institute for Research in Construction, Ottawa, Canada, IRC-RR-162, (2003), https://scirp.org/reference/referencespapers?referenceid=1120082.
- T. Ahmed, M. Rahman, Performance Investigation of Building Ventilation System by Calculating Comfort Criteria through HVAC Simulation, IOSR Journal of Mechanical and Civil Engineering, 3 (2012) 07-12. https://doi.org/10.9790/1684-0360712
- S. Davidson, Grasshopper, 2020, https://www.grasshopper3d.com/.
- EnergyPlus, Weather Data By Location | Energyplus, (2020) https://energyplus.net/weatherlocation/asia_wmo_region_2/BGD//BGD_Dhaka.419230_ SWERA.
- J. Aman, Impact of windows for daylighting on thermal comfort in architecture design studios in Dhaka, M.S. thesis, Bangladesh University of Engineering and Technology, Dhaka, Bangladesh, (2017) http://lib.buet.ac.bd:8080/xmlui/handle/123456789/4835.
- J. Aman, N. Tabassum, J. Hopfenblatt, J. B. Kim, and M. O. Haque, Optimizing Container Housing Units for Informal Settlements- A parametric simulation & visualization workflow for architectural resilience, in 26th International Conference of the Association for Computer-Aided Architectural Design Research in Asia (CAADRIA), 2021. https://doi.org/10.52842/conf.caadria.2021.1.051
- ConstruPM, EDGE Green Buildings: What's Window to Wall Ratio? Construpm, (2020) http://mundobim.com/construpm/edge-green-buildings-whats-window-to-wall-ratio/.
- J. H. Holland, Genetic Algorithms, Scientific American, 267 (1992) 66-72. https://doi.org/10.1038/scientificamerican0792-66
Copyright © 2024 The Author(s). Published by solarlits.com.

2416
Total views
Citations
SHARE ON


