Volume 11 Issue 1 pp. 131-148 • doi: 10.15627/jd.2024.8
Performance of Shading Against West Glass Facades to Optimise Daylight, Thermal Comfort and Energy Efficiency of Office Buildings
Asaduzzaman Rubel,∗ Md Ashikur Rahman Joarder
Author affiliations
Department of Architecture, Bangladesh University of Engineering and Technology (BUET), Dhaka, Bangladesh
*Corresponding author.
rubel.arch@yahoo.com (A. Rubel)
ashikjoarder@arch.buet.ac.bd (M. A. R. Joarder)
History: Received 6 March 2024 | Revised 20 April 2024 | Accepted 27 April 2024 | Published online 29 June 2024
Copyright: © 2024 The Author(s). Published by solarlits.com. This is an open access article under the CC BY license (http://creativecommons.org/licenses/by/4.0/).
Citation: Asaduzzaman Rubel, Md Ashikur Rahman Joarder, Performance of Shading Against West Glass Facades to Optimise Daylight, Thermal Comfort and Energy Efficiency of Office Buildings, Journal of Daylighting 11 (2024) 131-148. https://dx.doi.org/10.15627/jd.2024.8
Figures and tables
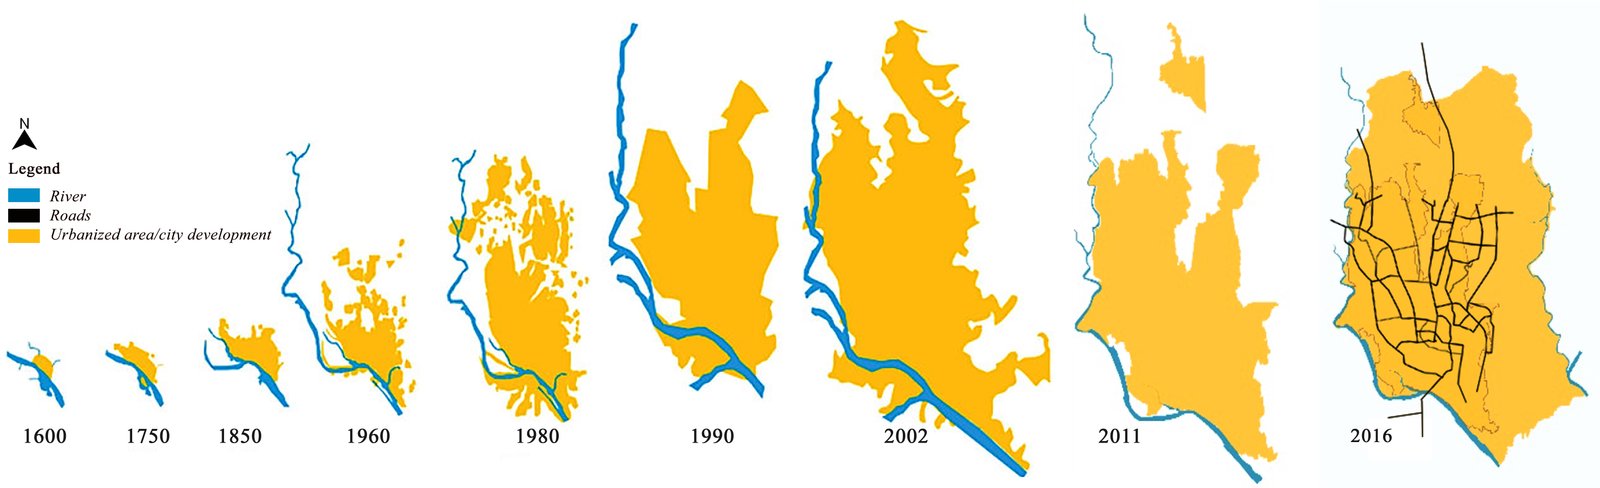 Figure 1
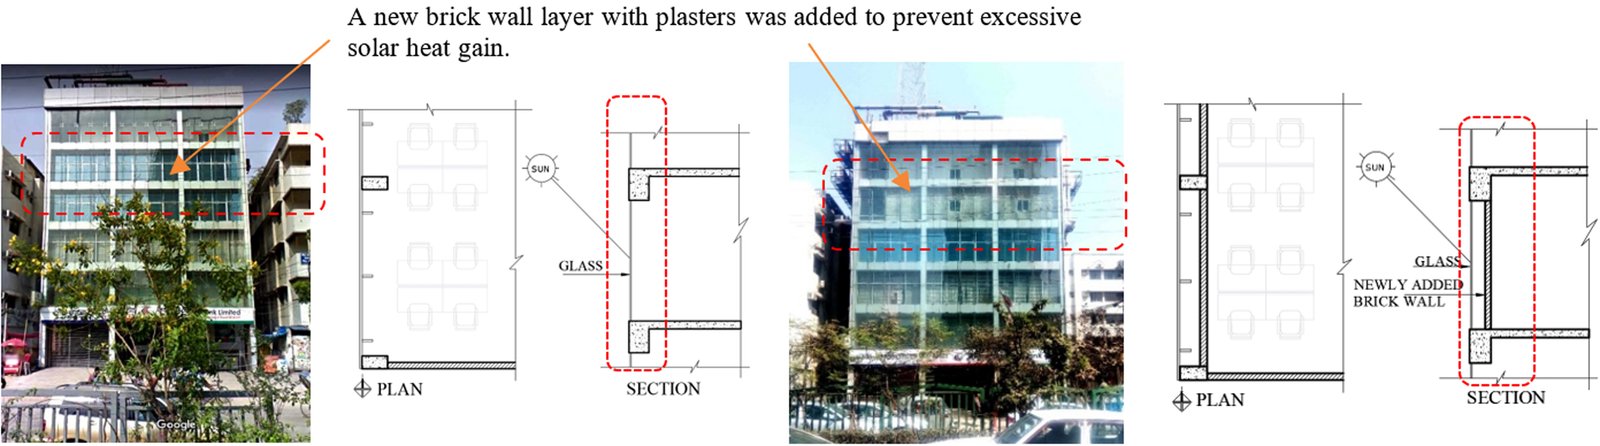 Figure 2
 Figure 3
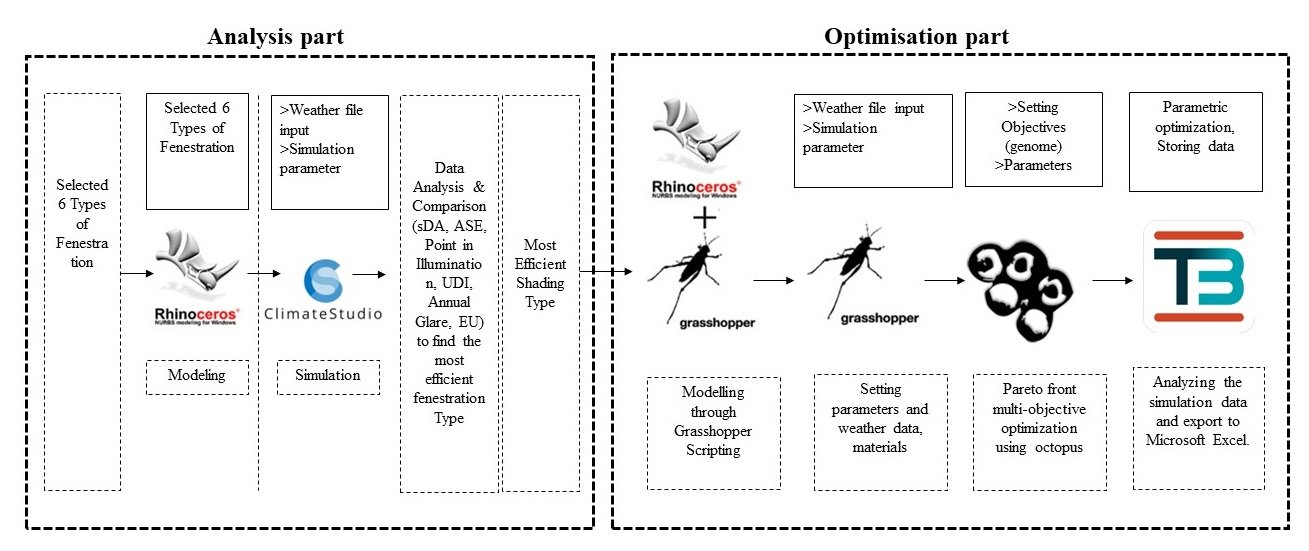 Figure 4
 Figure 5
 Figure 6
 Figure 7
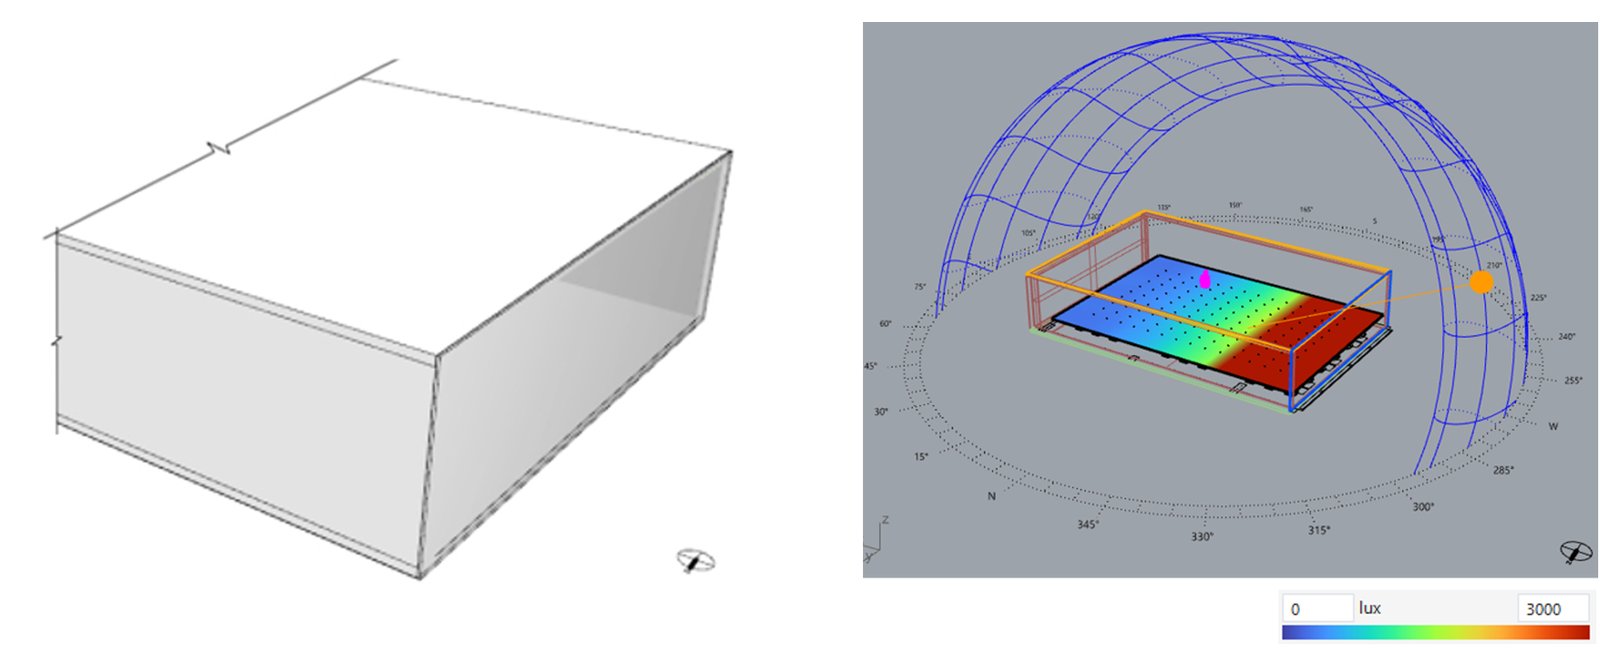 Figure 8
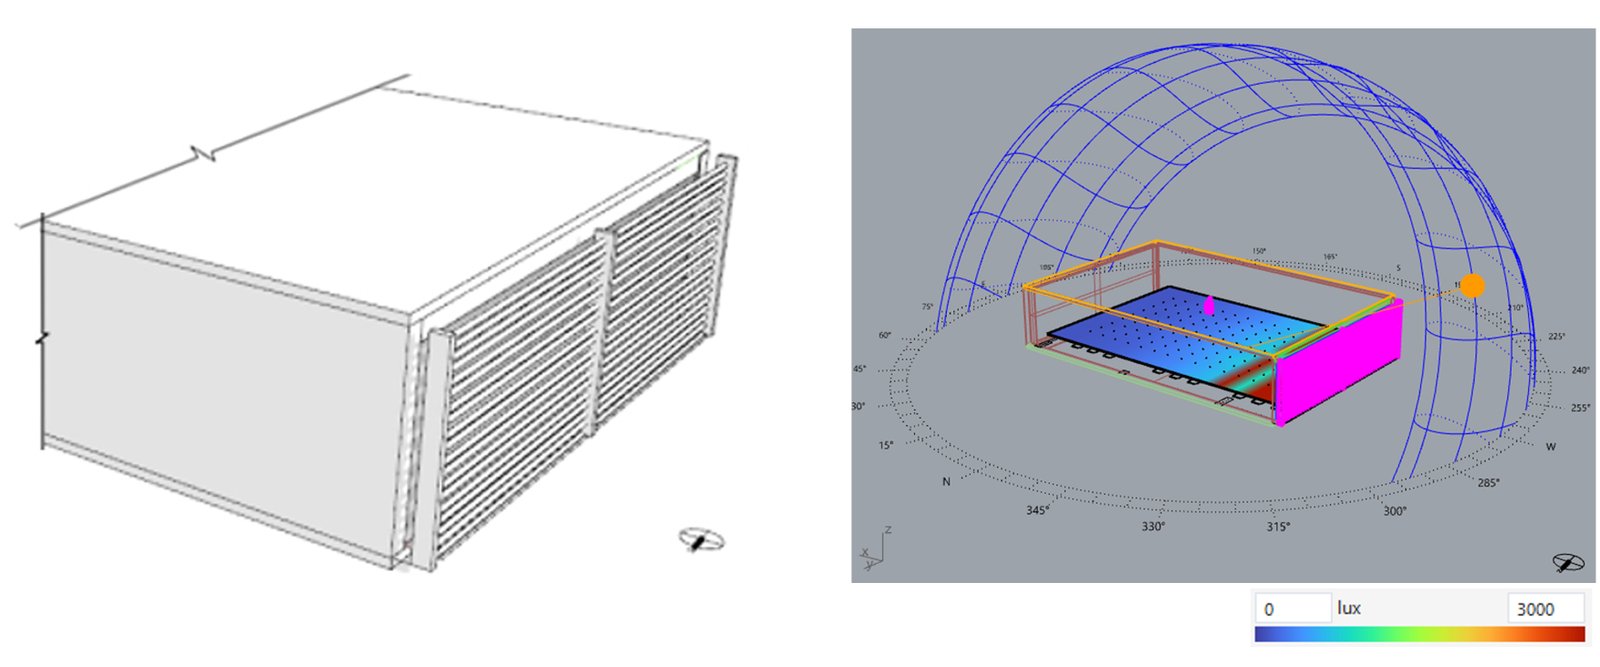 Figure 9
 Figure 10
 Figure 11
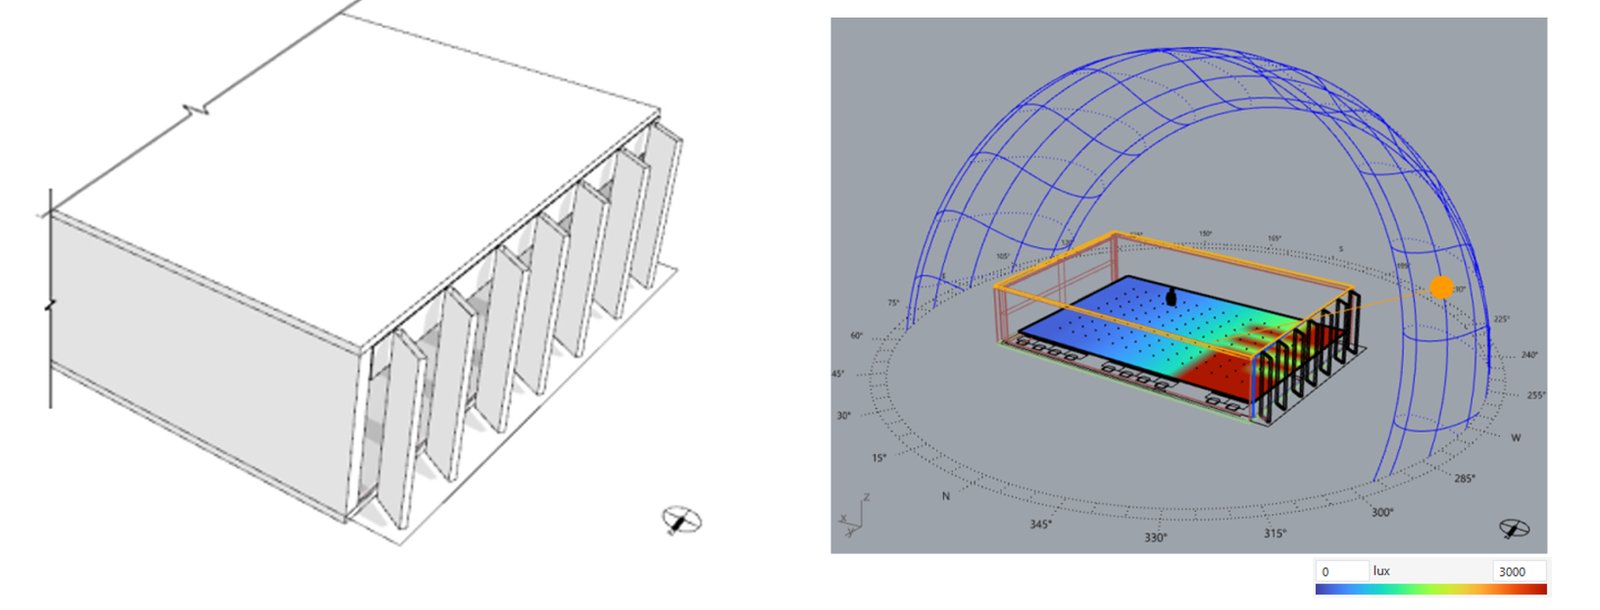 Figure 12
 Figure 13
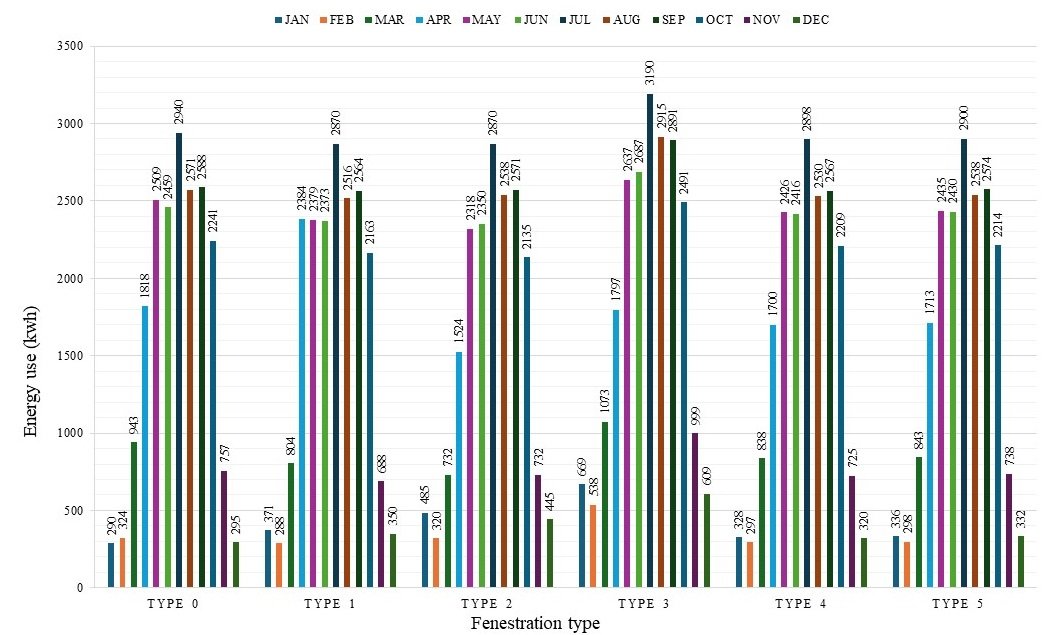 Figure 14
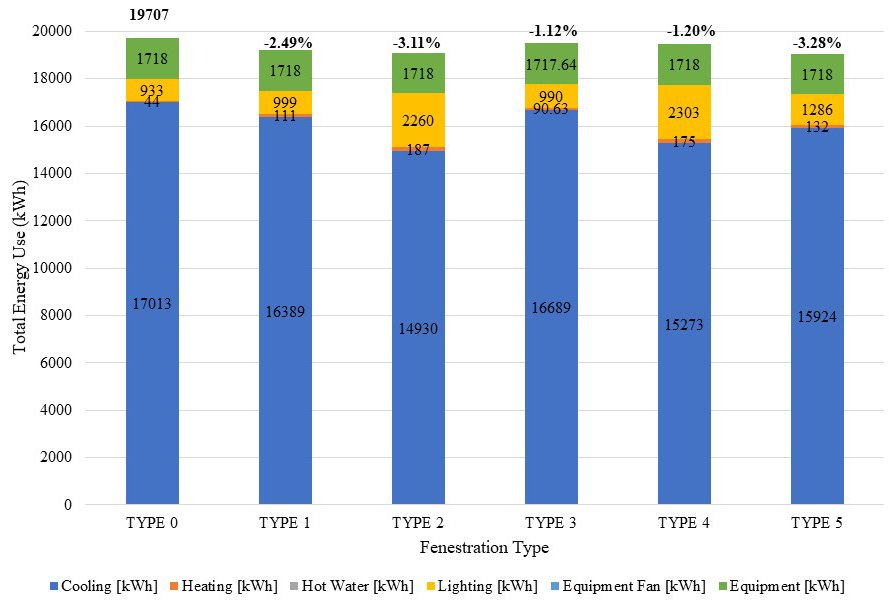 Figure 15
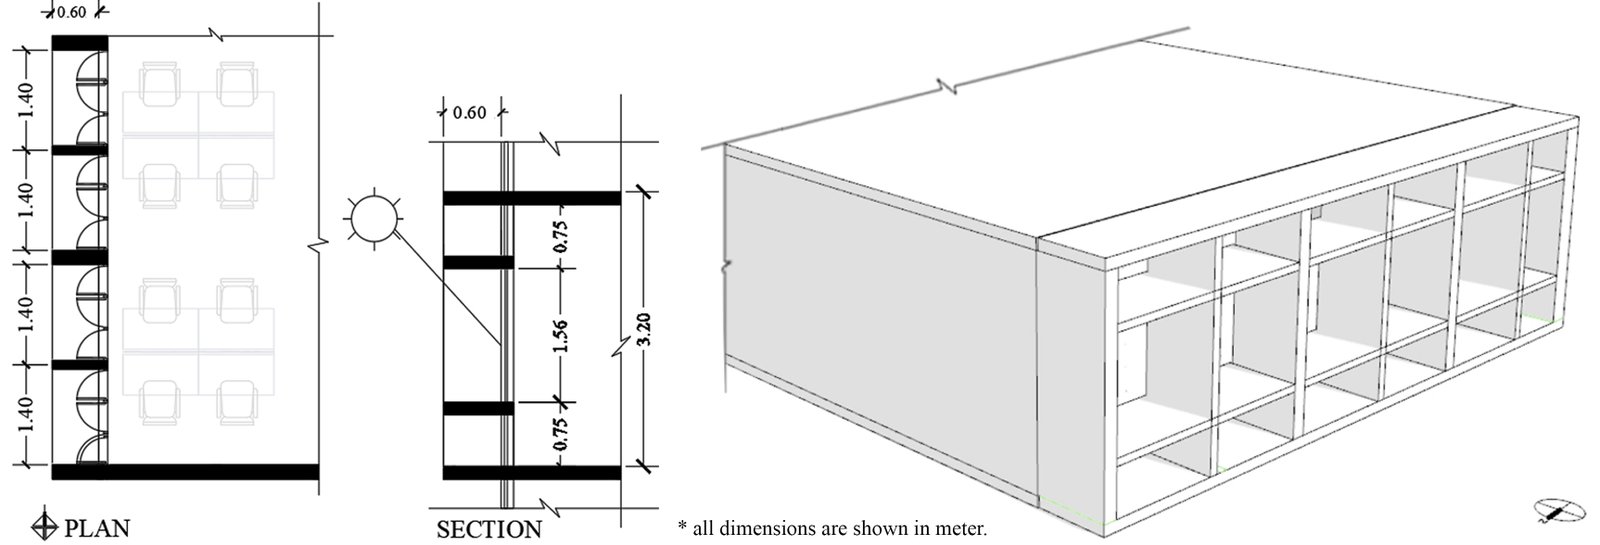 Figure 16
 Figure 17
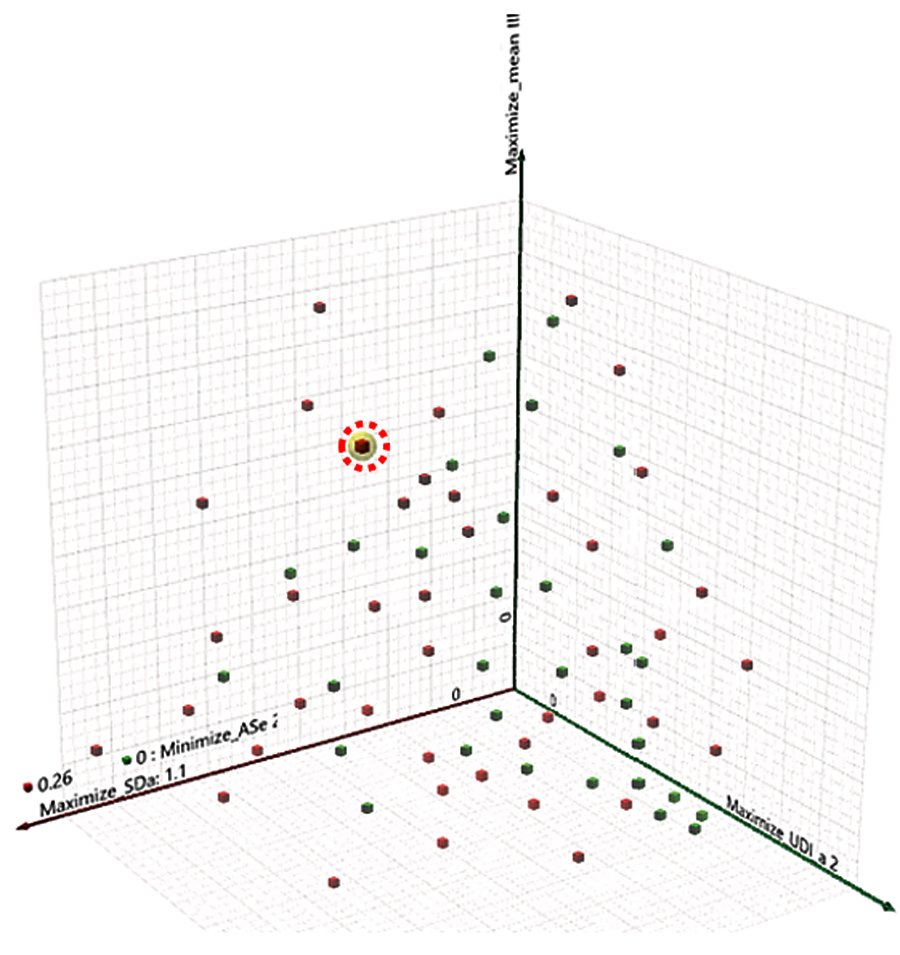 Figure 18
 Figure 19
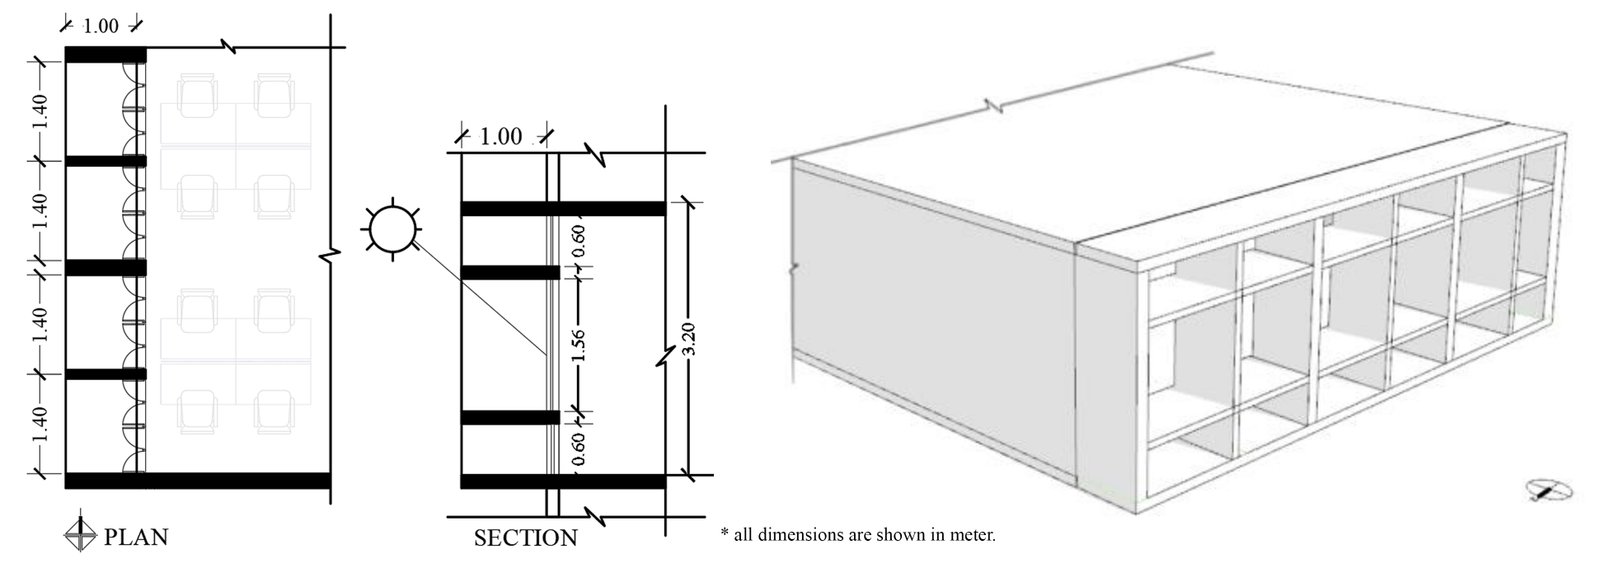 Figure 20
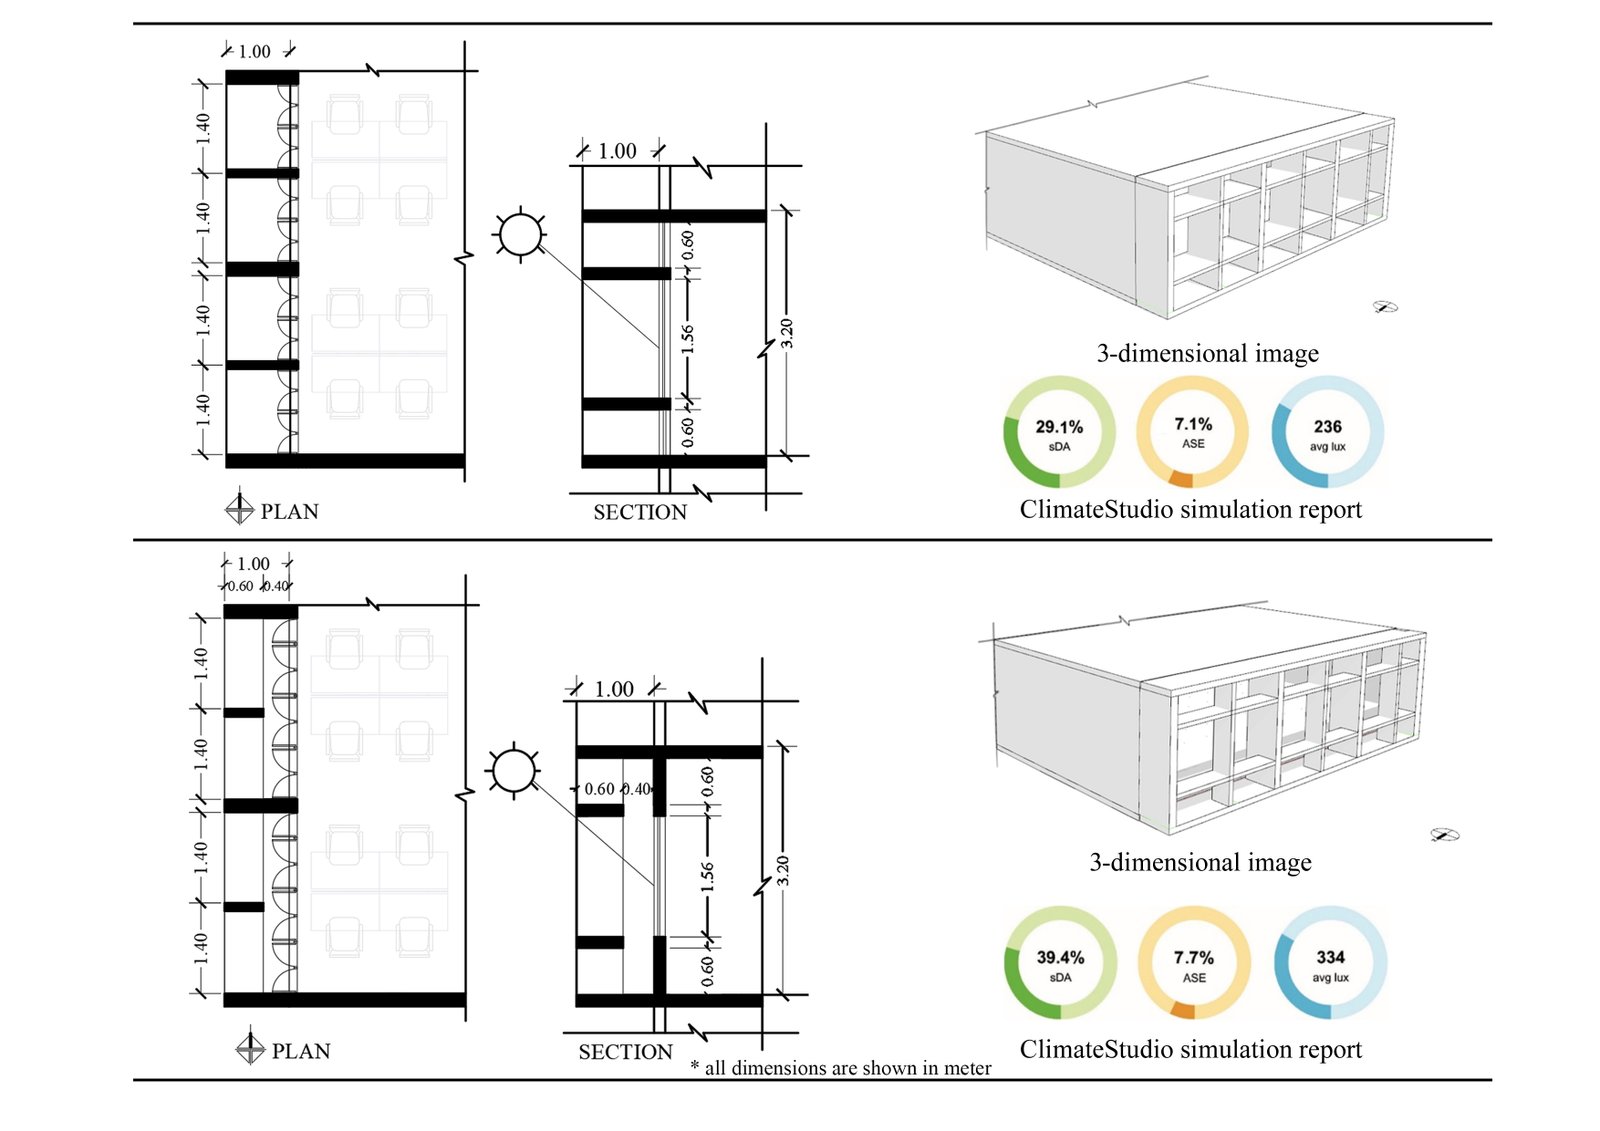 Figure 21
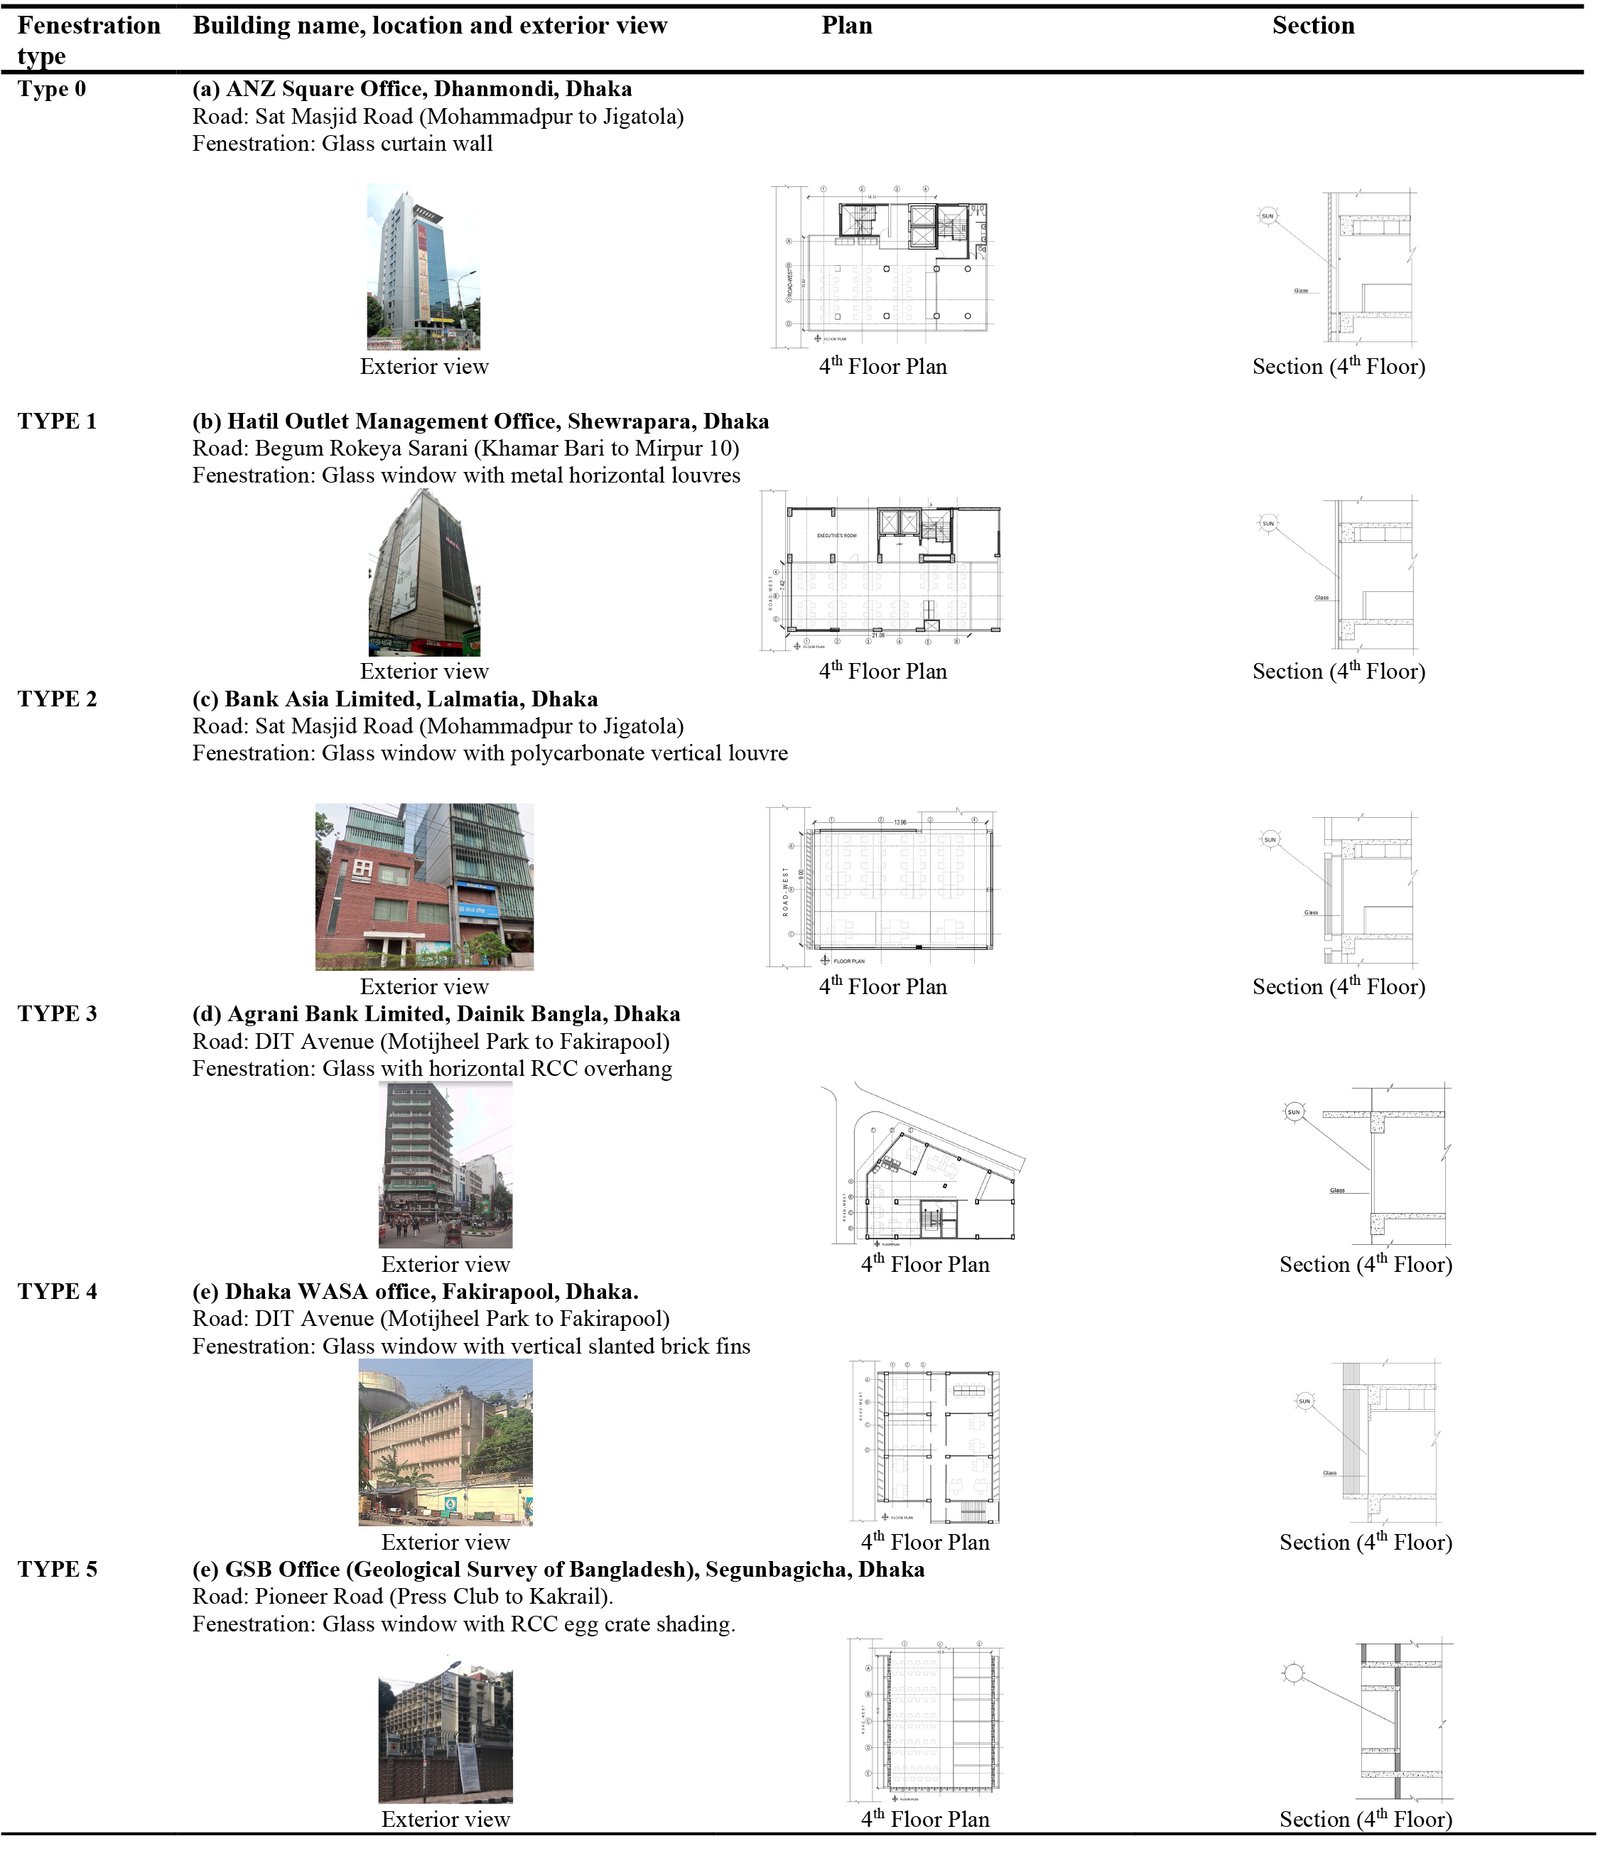 Table 1
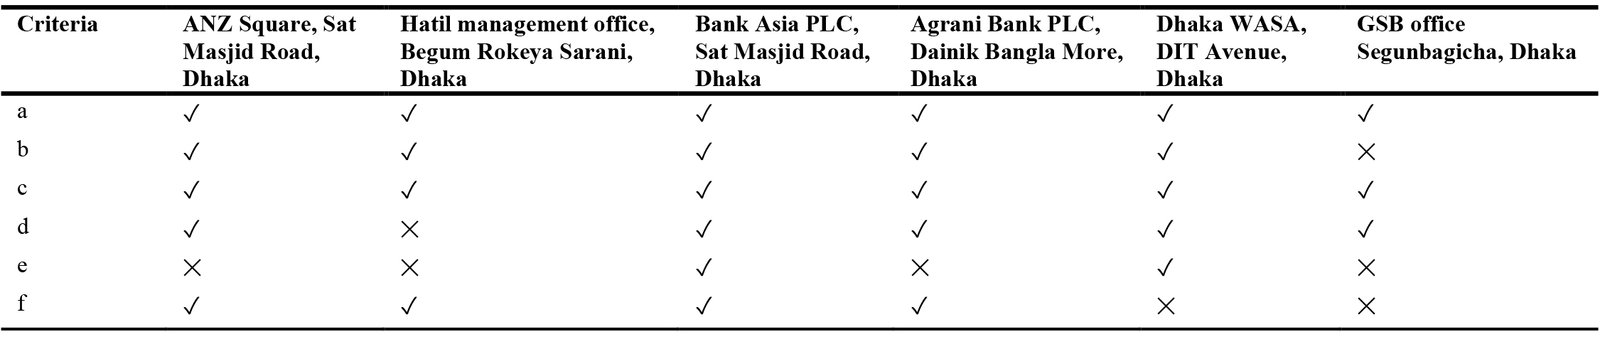 Table 2
 Table 3
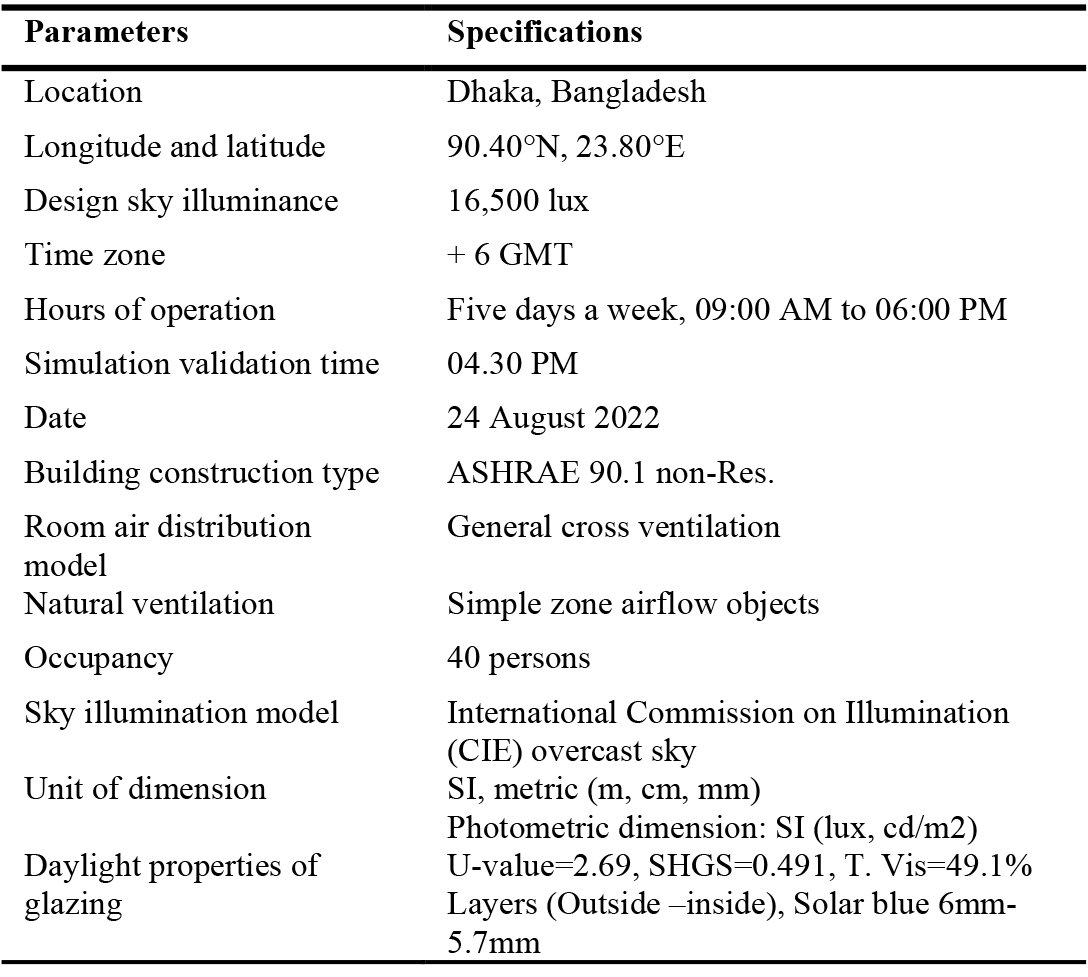 Table 4
 Table 5
 Table 6
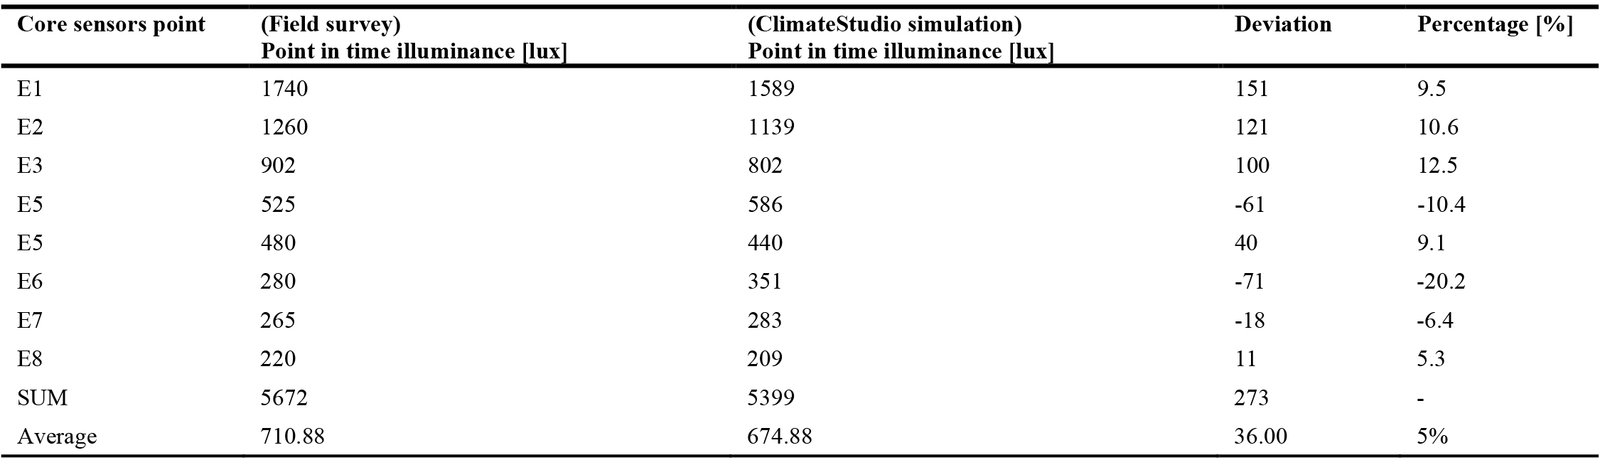 Table 7
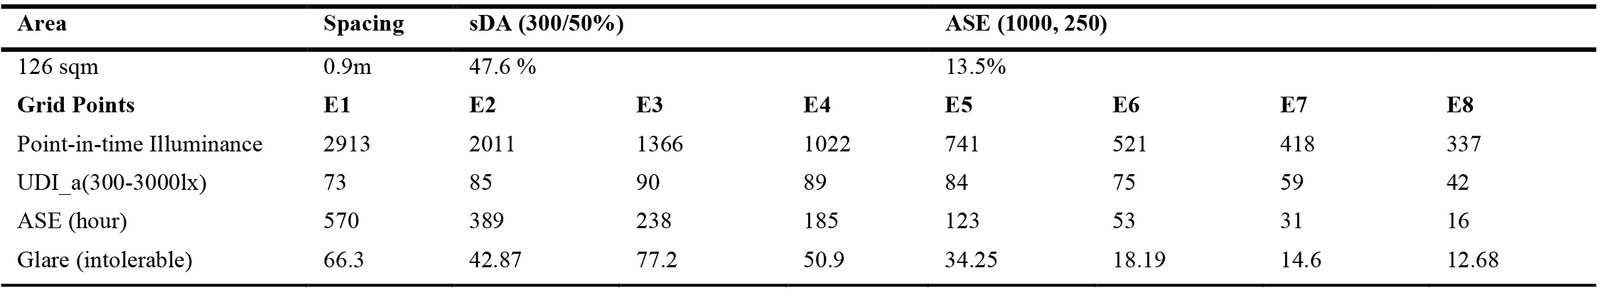 Table 8
 Table 9
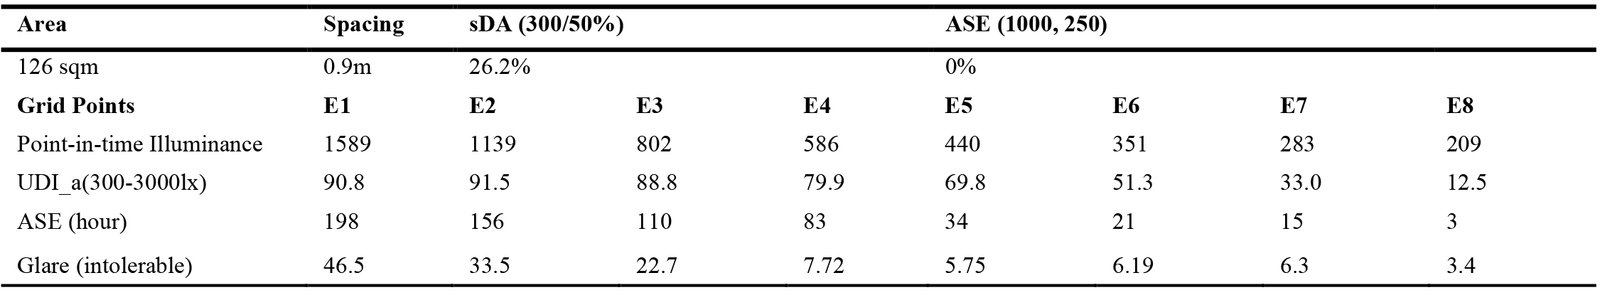 Table 10
 Table 11
 Table 12
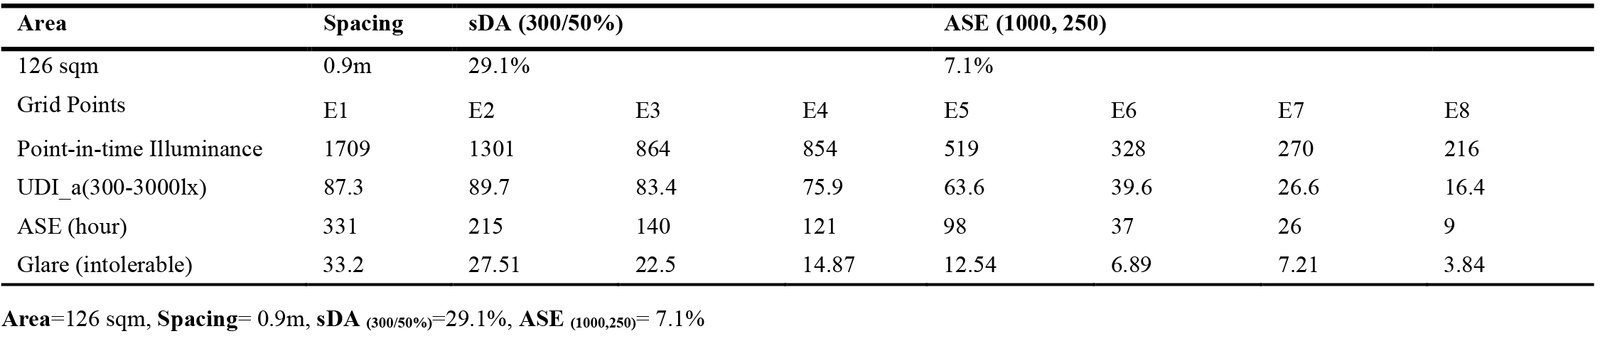 Table 13
 Table 14
 Table 15
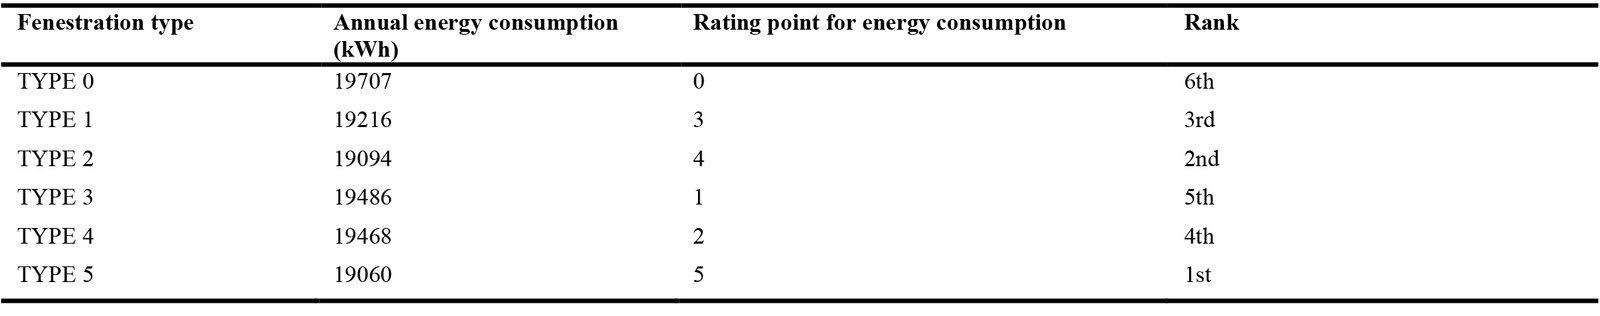 Table 16
 Table 17
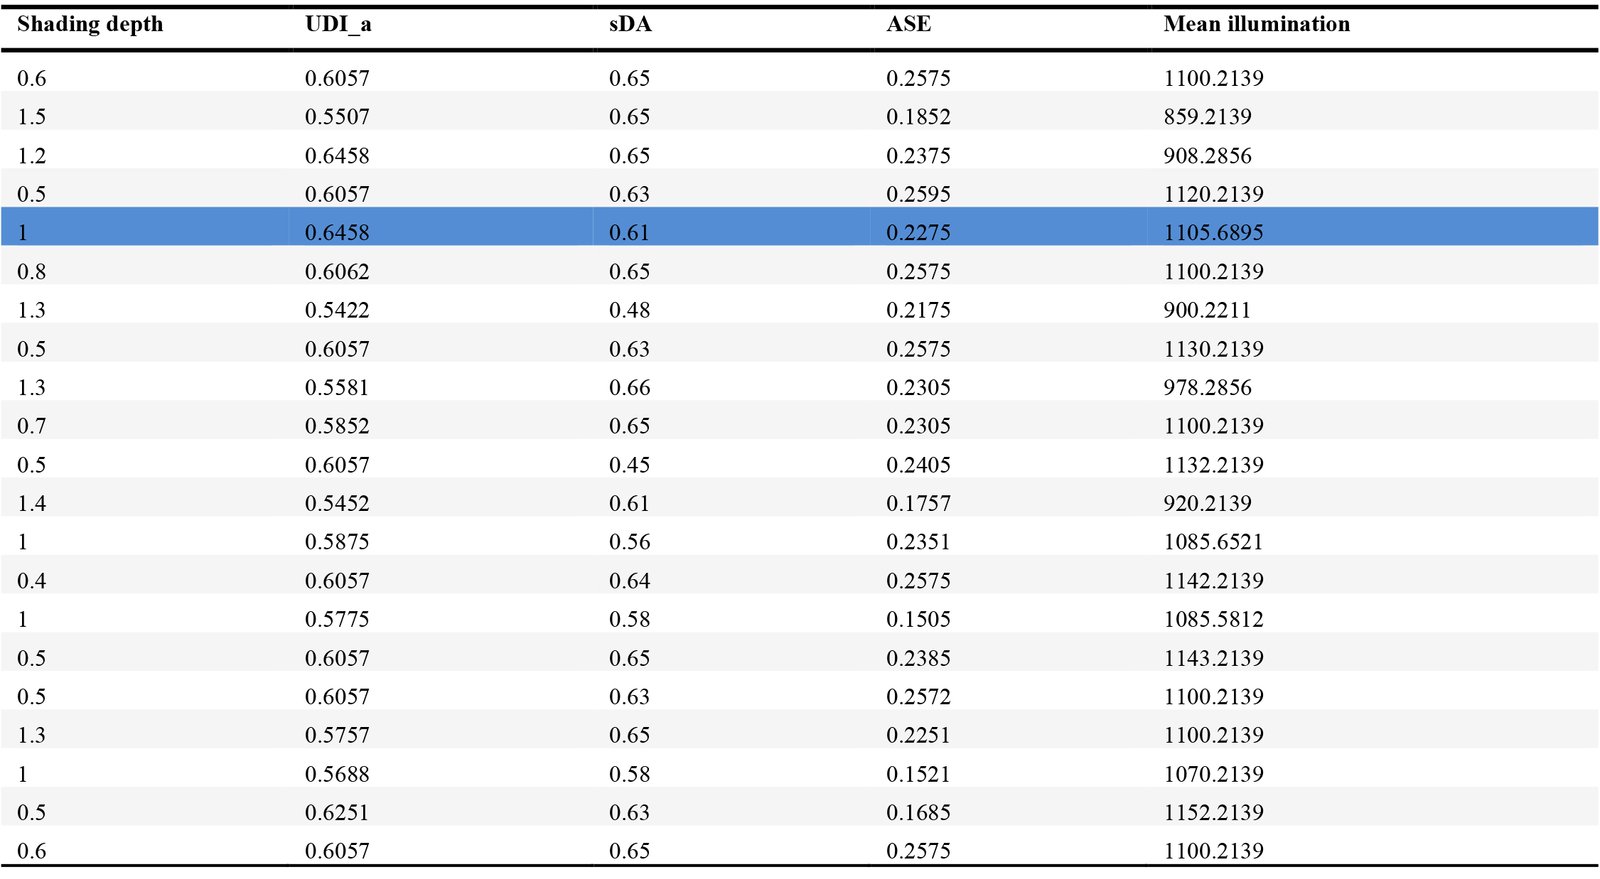 Table 18
Abstract
In tropical urban areas, the vertical facades of buildings often play a crucial role in capturing solar radiation and heat, especially for office buildings facing west during the afternoon. In Dhaka, a tropical city, the construction of major arterial roads connecting the northern and southern regions of the city has led to the emergence of numerous commercial buildings along these roads, predominantly facing in east or west directions. This research investigated the efficiency of different existing fenestration types (glass curtain walls, glass windows with horizontal and vertical louvres, overhangs, vertical fins, and egg crate shading) of west-facing office buildings in Dhaka in terms of daylight, thermal comfort and energy efficiency, and explore strategies to enhance existing performance. From the field survey, a 'case office building' was selected, and simulations were carried out with the six different fenestrations, as mentioned above, while keeping other aspects constant as found during the survey, e.g., floor plan, equipment and number of occupants. In this research, the simulation process encompasses daylighting simulation, energy simulation, and multi-objective optimisation. The study utilised a case model created with Rhinoceros and ClimateStudio, while performance metric optimisation was achieved using Grasshopper and Octopus. Multi-objective optimisation techniques were employed to improve the shading configurations. The TT toolbox facilitated data exportation and Design Explorer assisted in data visualisation. The window with egg crate shading was found to be the most effective fenestration type among the studied shading configurations. Further parametric simulation was conducted to develop an optimised egg crate shading design configuration. It was found that egg crate shading with a 1.0 m depth provided optimum daylight and solar heat gain inside the office building among the studied configurations in the context of Dhaka. A comparison was also made between the optimised egg crate option and a customised egg crate with some detailing (popularly known as brise soleil). Brise soleil showed better performance with 12.2% higher sDA and 98 lux additional average illuminance compared to the previous optimum one. The findings underscore the significance of employing optimisation methodology to devise shading configurations while also revealing substantial opportunities to enhance performance further by tailoring details on the optimised design recommended from simulation analysis.
Keywords
Daylighting, Thermal comfort, Energy efficiency, Optimisation
1. Introduction
Dhaka city was developed along the east bank of the river Buriganga, which blows from north to south. The city expanded and flourished to the north during the Mughal and British periods, as the city is bounded to the south, west, and east by the rivers Buriganga, Turag, and Balu, respectively. As a result, a couple of major arterial roads (e.g., Airport Road, Mirpur Road, Pragati Sarani, DIT Road, and Rokaya Sarani) were constructed parallel to the river Buriganga to connect the north and south parts of Dhaka [1]. A good number of the road-facing commercial buildings developed along these north-to-south roads mostly faced to the east or west directions. Figure 1 shows the historical growth of Dhaka City and the major road layouts [2,3].
Figure 1
Fig. 1. The historical growth of Dhaka City and major road layouts [3].
The climate of this study area, Dhaka, is categorised as warm and humid [4], and overheating is one of the key problems for the climate [5]. The west-facing commercial buildings with glass façades receive solar heat gains in the afternoon. West-facing office buildings having large openings with massive glass facades let solar radiation into the interior, which increases indoor heat gain, glare, and visual discomfort. Conversely, buildings with smaller openings may reduce heat gain but often suffer from inadequate daylighting, resulting in higher artificial lighting usage and additional internal heat. In Dhaka, office spaces with glazed surfaces at the west experience excessive heat in the afternoon and adopt various shading strategies, e.g. internal blinds, curtains or solid walls, to reduce direct solar heat gain and glare. Figure 2 shows an example of a west-facing glazed facade building where an additional brick wall needed to be added after a couple of years to prevent excessive solar heat gain.
Figure 2
Fig. 2. Photos, plans and sections of the same west-facing office building with glass facades located at Sat Masjid Road, Dhaka, showing the approaches to solar protection. (a) West-facing office space with glazing (2013) and (b) West-facing office space with glazing and wall (2023).
Glazed enclosures promote outdoor views and brighten interior office spaces. However, solar radiation on glazed facades increases air temperature in the area around it. Excess or unguided daylight can produce glare and discomfort [6]. Daylight inclusion in building design is associated with comfort and energy benefits. Recent studies show that artificial lighting accounts for over half of total energy use in buildings in tropical climates, which can easily replace much of this energy used by daylight if designed appropriately [7]. In the tropical climate, fenestration can contribute up to one-fourth of energy consumption in buildings [8]. To control the consequence of solar energy in the indoor environment of an office building, it is conventional to focus on the design of the buildings' skin and fenestration. Shading devices are used as diffuse lighting strategies for minimising solar gains and glare, and can also be designed to increase illumination inside an office space. Various shading strategies: internal or external and fixed or operable, are effective in reducing solar heat gain and glare while improving thermal comfort. External shading devices, often fixed, are particularly useful for blocking solar radiation before it enters the building, thus reducing cooling costs and increasing energy efficiency. Different types of common fixed external shading devices are shown in Fig. 3.
Figure 3
Fig. 3. Types of fixed external shading devices [9].
Daylighting, which involves utilising natural light in buildings, offers various benefits, such as enhancing individual performance, psychology, health, energy savings and productivity. Studies suggest a preference for daylight over artificial lighting. The effectiveness of daylight penetration is influenced by building orientation, window types, glass types, and sun position [10]. For optimal daylighting, large windows facing north or south are preferred over east or west windows in tropical climates to minimise energy usage. If the large windows face east or west, the energy usage increases by 20% [11]. This research aims to investigate the performance of various types of fenestrations in west-facing office buildings, particularly focusing on daylighting, thermal efficiency, and energy consumption. Additionally, the study seeks to explore strategies to improve the existing performance of these fenestrations.
2. Methodology
Fieldwork was carried out to understand the existing illumination level and thermal conditions of existing office buildings. For the study, six buildings with different commonly used fenestration types (glass curtain walls, glass windows with horizontal and vertical louvres, overhangs, vertical fins, and egg crate shading) were chosen using criteria derived from the literature review. Measurements of illuminance at offices, thermal conditions, window details, materials, shading strategies, work plane heights, aisle widths, exterior-interior photographs, detail observations, and associated information were collected through a physical survey of these office buildings. A suitable one was selected from these studied buildings as a 'case office building' for simulation analysis. Rhinoceros, Grasshopper, and ClimateStudio were used to execute the simulation study of the office space in a local climatic context. Spatial daylight autonomy (sDA), point-in-time illuminance, annual sunlight exposure (ASE), useful daylight illuminance (UDI), glare, predicted mean vote (PMV), predicted percentage of dissatisfied (PPD), and energy use (EU) data were found through ClimateStudio and Grasshopper simulation programme. Finally, the simulation result was used to analyse and compare the metrics of different parameters of daylight and thermal comfort. Based on the result, the best possible existing fenestration of the west faced building was identified in the context of Dhaka. An optimised option was developed from the identified efficient fenestration type. After identifying the optimised parameters, the optimised fenestration was further customised based on the existing design practice by local architects to enhance its performance. The simulation analysis of this research is divided into two major parts: an analysis part and an optimisation part. Figure 4 presents the simulation and analysis workflow of the research.
Figure 4
Fig. 4. Rhinoceros, Grasshopper, Octopus and TT Toolbox plugins workflow diagram for the simulation.
2.1. Selection of office space
The study areas were selected from a variety of localities within the Dhaka metropolitan area through a field survey. Six north-south oriented roads were primarily selected from the popularly developed parts of Dhaka through convenience sampling: Sat Masjid Road (Mohammadpur to Jigatola); Mirpur Road (Shyamoli to Nilkhet); Begum Rokeya Sarani (Khamar Bari to Mirpur 10); Kazi Nazrul Islam Avenue (Shahbag to Bijoy Sarani); Segunbagicha road (Press Club to Kakrail), and DIT Avenue (Motijheel Park to Fakirapool). A few buildings were identified from the selected roads through a pilot survey. Spontaneously grown and occupancy-changed buildings were excluded. The criteria that served as the basis for the selection process are buildings must contain an office floor, and the west road facades must be designed with one of the fixed external types of shading strategy shown in Fig. 5. The exterior views, floor plans and fenestration configurations of the selected surveyed office spaces are shown in Table 1.
Figure 5
Fig. 5. The case office model with the sun-path diagram.
Table 1
Table 1. Surveyed building images, floor plans, and sections of office spaces with different fenestration configurations.
Most of the building fenestrations are designed with an additional shading strategy [12]. From the field survey, it was found that the west facade is designed with overhangs, horizontal and vertical louvres, horizontal and vertical fins, and egg crate shading. Additionally, the vertical fins or louvres of the east or west façade are rotated toward the north and horizontal louvres are designed outwards inclined to cut the direct sunlight in the afternoon [13].
The criteria for selecting the case office building are as follows.
- The selected building would be in the urban context of Dhaka.
- The office space would feature an open office plan.
- The main entrance and front facade of the building must face the west side road.
- The buildings must be built according to the local bylaws (Dhaka Imarat Nirman Bidhimala-2008).
- There should be no building higher than the case building, just on the opposite side of the road of the case building.
- The building should be built within the last ten years.
The performance of surveyed offices against the selection criteria is presented in evaluation metrics in Table 2.
Table 2
Table 2. Evaluation metrics showing the performance of surveyed offices against the selection criteria.
Considering the above criteria, among the primary surveyed buildings, Bank Asia Limited, Lalmatia Branch, Dhaka was selected as case office spaces (Table 3), which have a fenestration with vertical fins. It was a six-storey office building located at Sat Masjid Road, Dhanmondi, Dhaka with a glass facade with vertical fins on the west side. The front road width is 18m. The office runs from 09:00 AM to 06:00 PM from Sunday to Thursday. The management and training section was located on the 4th floor of the building, which was selected as the case space. The floor-to-ceiling height of the selected case space was 3.05m. The floor plan and interior image of the case office space are shown in Table 3.
Table 3
Table 3. Plan, measurements and the interior image of the case office spaces.
2.2. Metrics for simulation evaluation
To determine daylighting and thermal conditions of the space, a few factors were identified at the sensor points at a particular time, and later, the findings were compared with standards to identify whether those values were 'adequate' or not. In this research, daylight simulation and energy metrics were considered with the following particulars.
Mean Illuminance [lux] was calculated as the average light levels on grid points (Fig. 6) during working hours on August 24, 2022 over the regularly utilised floor space [14].
Figure 6
Fig. 6. Grid layout of sensor points in the case office space.
Spatial Daylight Autonomy (sDA) [%] was calculated as the percentage of floor space that received at least 300 lux for at least 50% of its occupied hours [14].
Annual Sunlight Exposure (ASE) [%] was calculated as the percentage of floor space that received at least 1000 lux of direct sunlight for at least 250 occupied hours. This is an indicator of how much of a floor area is "overlit." In this sense, "overlit" locales are those that have more than 250 occupied hours of direct sunshine (>1000 lux straight from the solar disc) in a year [14].
Useful Daylight Illuminance (UDI) [%] was calculated as the preferable range from 300-3000 lux. ASE regulates the highest limit of UDI and issues a negative warning record if 1000 lux is exceeded; thus, it balances. This measure shows how daylight levels are divided into each of the four categories: (i) Failing (UDI_f)- less than 100 lux; (ii) Supplemental (UDI_s) - between 100 and 300 lux; (iii) Autonomous (UDI_a) - between 300 and 3000 lux; and (iv) Excessive (UDI_e)- more than 3000 lux [14].
Glare [%] was estimated based on Wienold and Christofferen's Daylight Glare Probability (DGP) measure. The metric is often derived using a fisheye depiction with a 180-degree opening angle. DGP has four bands with values ranging from 0% to 100%. These are: (i) Imperceptible glare- DGP ≤ 34%; (ii) Perceptible glare- 34% ≤ DGP ≤ 38%; (iii) Disturbing glare- 38% <DGP ≤ 45%; and (iv) Intolerable glare- 45% <DGP [15,16].
Energy Use (EU) [kWh] was calculated as the total energy used by the facility for heating, cooling, lighting, and equipment for a month. Energy use was measured in kWh [17].
Predicted Mean Vote (PMV) and Predicted Percentage of Dissatisfied (PPD) are calculated through a spreadsheet or software application, e.g., the Centre for the Built Environment (CBE) thermal comfort tool, by entering the required data set of metabolic activity (met), clothing insulation (clo), air temperature (Ta), mean radiant temperature (Tr), air movement (Va), and humidity. The standard thermal comfort sensation, or PMV, is depicted on a seven-point scale from cold (-3) to hot (+3). ASHRAE 55 and ISO standard 7730 recommend that PMV be within the range of ±1 and the PPD be lower than 20 % to be considered comfortable. The maximum number of individuals who are not comfortable is 100%, and satisfying at least 80% of occupants is considered sufficient; therefore, a PPD of less than 20% is acceptable [18].
2.3. Time basis for daylight and energy simulation
Hourly illumination was calculated for the whole year at 126 grid points (Fig. 6) for dynamic daylight simulation. Each grid point provides illumination data, sDA (overall area), ASE (overall area and grid points E1-E8), UDI (grid points E1-E8), and glare value (grid points E1-E8). For energy analysis, the whole space was considered as a solid sealed box where each point gives results for the hottest and humid day (24 August 2022). Table 4 presents the factors that are considered for dynamic daylight simulation and energy analysis [19].
Table 4
Table 4. Modelling parameter for the simulation.
In ClimateStudio and Grasshopper hourly weather data from the US Department of Energy for Dhaka, "BGD_DH_Dhaka-Shahjalal.Intl.AP.419220_TMYx.2004-2018" was used as the climate database for the simulation.
2.4. Generation of 3D models and simulation parameters
The 3D model was developed through an intensive field survey. Fenestration typology, position, size, and material properties were collected from the field survey. The detailed process is discussed in the following sections.
2.4.1. 3D Modelling of the selected case space
The case office area was modelled in Rhinoceros V7.20 for daylight simulation using physical properties found from the field survey (described in Table 5 and Section 2.4.2). The office space was a rectangular area of 126 square meters (13.96m x 9.0 m) occupied by 40 people, with one opening on the west façade (without existing external vertical fins of polycarbonate sheet) and the entrance from the north side. The other sides of the room had a brick wall, and both sides were plastered with a light grey paint finish. The sill and lintel levels of the window are 0.1 m and 2.6 m from the finished floor, respectively. Window size, sill height, work plane height and the reflectance of various materials found during the field survey remained constant for the simulation; only the fenestration type was changed for the test models. The modelling parameters for the simulation study are shown in Table 5.
Table 5
Table 5. The case office model with the sun-path diagram.
The six different fenestration types (Table 1) were installed alternately during simulation analysis in place of existing external vertical fins of the polycarbonate sheet of the case building to find out the best one among the studied models. The 3D case office model with the sun-path diagram is shown in Fig. 5.
2.4.2. Material properties for daylight simulation and energy analysis
The material properties used in the model for daylight simulation and energy analysis are determined according to the conditions observed from the field survey, as shown in Table 6.
Table 6
Table 6. Material attributes of the simulated test office spaces (from ClimateStudio materials library).
2.4.3. Test sensor points in the case office space
Considering the layout of interior furniture, 126 sensor points were equally distributed in the case office space for simulation purposes (Fig. 6). The sensor points were spaced 0.9 meters apart and were positioned 0.75 meters above floor level on the work plane height. Figure 6 shows the case office floor plan with 126 sensor points, and Fig. 7 shows the section of the case office space with the height of the sensor points.
Figure 7
Fig. 7. Section of grid E of the case office space showing the height of the sensor points.
Eight points (E1 to E8) were chosen as the key sensor points for analysis, as under the International Commission on Illumination (CIE) overcast sky conditions [20] and the prominent daylight enter a room with double the window height [21]. The case office space window lintel height was 2.6 m, and the length of the analysis grids was 7.2m from the window side, which is more than twice the window lintel height.
3. Data validation
The research employed data validation methods to ensure the accuracy and completeness of the simulation dataset. Two common types of data validation were utilised: comparative studies and analytical validation [22]. These methods were applied to verify the quality and correctness of the collected data before processing and interpreting it.
3.1. Comparative studies
The illumination level on the work plane height (Figs. 6-7, E1–E8) of the case office space (TYPE 02) with its fenestration was measured physically to validate the daylight simulation results of the case office space. Illumination readings were taken under overcast sky conditions by the Brannan Mini Thermo light Meter (Model No.: 13/472/0) in the eight-sensor point position on August 24, 2022, between 04:00 PM and 05:00 PM. Utilising US Energy Plus climate data, the ClimateStudio dynamic metric simulation tool produced illumination values at 04:30 PM for the same day (August 24, 2022). These simulated outcomes were subsequently juxtaposed with physical measurements of daylight levels in the office space under consideration. Table 7 displays a comparison, including the deviation, between the existing and simulated illuminance levels in the selected office space (TYPE 02).
Table 7
Table 7. Comparison of the existing and simulated illumination levels in the case office space (TYPE 02).
h3>3.2. Analytical validation
To confirm the accuracy of the simulation outcomes, a one-way Analysis of Variance (ANOVA) was conducted to assess the relevancy between field survey data and simulation results. Performing an ANOVA test entails several steps, including organising data in columns, calculating group means, calculating overall mean, calculating the sum of squares (SS), calculating degrees of freedom (df), calculating mean squares (MS), calculating F-statistic, determining F-critical value (Fcrit), and comparing the F-statistic and critical value. Microsoft Excel has features that can automate these actions through built-in formulas. In this research, the ANOVA test was conducted using Microsoft Excel, and the ANOVA calculation outcomes are F=0.017548415, P-value= 0.896497, F crit =4.600.
It is evident from the ANOVA analysis that Fcal < F critical and P-value>0.05, i.e. the F value is less than the F critical value; thereby, the null hypothesis is accepted [23], which means there is no significant difference between the means of the two groups. On the other hand, the P-value is greater than 0.05 in the above case, which also endorses the results with no significant difference between them [23]. The results of ANOVA analysis conclude that the simulation results of different fenestrations are valid, and the recommendation is considerable for further research.
4. Results and discussion
This section presents the results of daylighting simulations using the core work plane sensor method, which was introduced by Reinhart [24].
4.1. Daylight simulation results
Daylight simulation results of TYPE 0 (glass curtain wall) are shown in Fig. 8, and the simulation output data is presented in Table 8. This fenestration received the highest sDA of 47.6%, along with a maximum ASE of 13.5%.
Figure 8
Fig. 8. 3D model of the case space with TYPE 0 (left) and impact of TYPE 0 on illumination distribution in the space (right).
Table 8
Table 8. Daylight simulation result of office space with TYPE 0 on the west facade.
Daylight simulation results of TYPE 1 (glass window with metal horizontal louvres) are shown in Fig. 9, and the output data is presented in Table 9. This fenestration received a good amount of sDA of 28.6% with the least ASE of 0%.
Figure 9
Fig. 9. 3D model of the case space with TYPE 1 (left) and impact of TYPE 1 on illumination distribution in the space (right).
Table 9
Table 9. Daylight simulation result of the case office space with TYPE 1 on the west facade.
Daylight simulation results of TYPE 2 (glass window with polycarbonate vertical louvre on the west façade) are shown in Fig. 10, and the output data is presented in Table 10. This fenestration received a sDA of 26.2% with the least ASE of 0%.
Figure 10
Fig. 10. 3D model of the case space with TYPE 2 (left) and impact of TYPE 2 on illumination distribution in the space (right).
Table 10
Table 10. Daylight simulation result of the case office space with TYPE 2 on the west facade.
Daylight simulation results of TYPE 3 (glass window with horizontal overhangs) are shown in Fig. 11, and the output data is presented in Table 11. This fenestration received the same ASE of 13.5% as TYPE 0 and the second highest sDA of 34.3%.
Figure 11
Fig. 11. Daylight simulation result of the case office space with TYPE 3 on the west facade.
Table 12
Table 12. Daylight simulation results of the case office space with TYPE 4 on the west facade.
Daylight simulation results of TYPE 4 (glass window with vertical slanted brick fins) are shown in Fig. 12, and the data is presented in Table 12. This fenestration received a good amount of sDA of 25.4% with the least ASE of 0%.
Figure 12
Fig. 12. 3D model of the case space with TYPE 4 (left) and impact of TYPE 4 on illumination distribution in the space (right).
Daylight simulation results of TYPE 5 (glass window with egg crate shading) are shown in Fig. 13, and the output data is presented in Table 13. This fenestration received a good amount of sDA of 29.4% with the least ASE of 7.14%.
Figure 13
Fig. 13. 3D model of the case space with TYPE 5 (left) and impact of TYPE 5 on illumination distribution in the space (right).
Table 13
Table 13. Daylight simulation results of the case office space with TYPE 5 on the west facade.
4.2. Comparison and rating of dynamic daylight simulation results (TYPE 0-TYPE 5)
Round-robin ranking (RRR) is a creative thinking method that assists in ranking and selecting from a variety of choices. This approach ranks a collection of items or entities based on their performance or evaluations [25]. The RRR tool helps in comparing possible pair combinations by ranking and defining "winner" options based on the selected options. Examples include task ranking and selecting the top options from a variety. In this research, the comparison and rating process was completed through the RRR ranking system. Rating between the six selected fenestration configurations is accomplished using dynamic metrics mean value of core sensor points (E1-E8). Rating values ranged from 5 to 0 from first to sixth place. Table 14 summarises the daylighting simulation findings for the office spaces with six distinct window arrangements.
Table 14
Table 14. Rating point and ranking of daylight simulation results with respect to daylighting and glare (TYPE 0-TYPE 5).
According to the sDA and UDI_a value, TYPE 0 (glass curtain wall) is preferable to the other fenestration types but significantly has lower ratings for ASE and glare. When most of the dynamic daylight metrics and sub-metrics were included, TYPE 5 (windows with egg crate shading) ranked highest among other studied fenestration types (Table 14). TYPE 0 (glass curtain wall) performed poorly because it provided excessive daylight and created glare in the interior of the case office area. Thus, the dynamic lighting simulation suggested that TYPE 5 was the best feasible window configuration among the studied options for west-facing office spaces in Dhaka in terms of daylighting, solar gain, and glare.
4.3. Thermal comfort analysis results
The PMV and PPD, created by Fanger [26], were used in this study to quantify the occupants' reactions to thermal conditions inside office space provided by various window configurations. An extensive field survey was conducted to measure the existing daylighting and thermal conditions of the six selected office spaces on 24 August 2022 from 04:00 pm to 05:00 pm. Then, the field survey data (air temperature, mean radiant temperature, relative humidity, and wind speed) were input into the CBE thermal comfort tool to compute PMV-PPD [27]. In this section, a ranking of thermal analysis results of six types of fenestrations is prepared. From first to sixth place, rating points were assigned as 5 to 0 accordingly. The ratings of PPD-PMV against six fenestrations are presented in Table 15 with their rating points.
Table 15
Table 15. Rating and ranking of thermal simulation outputs against different fenestration types.
After calculating the rating points for selected window configurations, egg crate shading scored 10 out of 10. Since thermal comfort requires a PPD range of less than 20%, the studied window configurations were unable to achieve the requirements [28]. PPD of windows with egg crate shading was 90%, which was inadequate because large west openings in buildings admitted excessive solar radiation, causing thermal discomfort to most occupants. The thermal analysis showed that TYPE 5 was the most feasible and TYPE 4 the second most efficient fenestration type.
4.4. Energy uses analysis results
Sealed box or shoebox modelling of the case office space was prepared in Rhinoceros and Grasshopper to run the energy use analysis [29]. Energy use is the energy needed to maintain a standard 27°C indoor temperature and operate other types of equipment for an office [30]. From the survey, the number of lights, computers, cooling/heating equipment, kitchen appliances and other electronic devices were listed. By inserting the equipment list into ClimateStudio, the energy consumption of the case office was calculated against six possible fenestration types. Each building's monthly energy usage is shown in Fig. 14.
Figure 14
Fig. 14. Comparison of monthly energy consumption of case office spaces with different fenestrations.
The energy use was calculated based on the case office space and the equipment listed with six different fenestrations. The energy consumption from cooling, heating, hot water, lighting, fans and other equipment for case office spaces with six selected fenestrations is shown in Fig. 15. The rating between the simulated energy consumption of six different cases is presented in Table 16. From first to sixth place, rating points were assigned as 5 to 0 accordingly.
Figure 15
Fig. 15. Comparison of annual energy consumption for different purposes of the case office space with different fenestration.
Table 16
Table 16. Energy consumption rating for office spaces with different types of fenestrations.
4.5. Comparative analysis to find the most feasible fenestration type
The ranking of dynamic daylight and thermal simulation was varied for six studied window configurations on the west facade. Table 17 presents the combined ranking with the individual rank of dynamic daylight (Table 14), thermal comfort (Table 15) and energy consumption (Table 16) to determine the most feasible fenestration configuration among six office spaces in Dhaka.
Table 17
Table 17. Combined ranking of daylight simulation, PMV-PPD rating and energy consumption of the case office space against six studied fenestration types.
Performance metrics determined that TYPE 5 was the most feasible fenestration configuration for the west facade office space in Dhaka. Vertical and horizontal shading elements resist the maximum direct solar gain to the interior while the sun is at a very low altitude angle, and the horizontal fin reflects the sunlight on its surface, thus providing diffuse daylight to the internal office space. Figure 16 shows the most effective shading type identified for the west facade.
Figure 16
Fig. 16. Plan, section, and three-dimensional view of the most feasible fenestration (egg crate shading).
4.6. Optimisation of the efficient fenestration type
Achieving a balance between the three primary design elements of the daylighting system- window size, glazing type, and shading approach- allows for the promotion of daylight performance, which enables visual comfort and minimises artificial lighting energy consumption [31]. The identified case model was simulated to determine an improvement by altering an existing parameter, i.e., depth. The parametric model for optimisation prepared through grasshopper scripts is shown in Fig. 17.
Figure 17
Fig. 17. Grasshopper script of data exportation and data optimisation.
The simulation data was then analysed using the Octopus-Pareto Front equation to uncover various data for different shading depths [32,33]. Data optimisation through Octopus is presented in Fig. 18. These data were exported using the TT Toolbox and displayed through Design Explorer [34]. The visual representation of the parametric optimisation is shown in Fig. 19. Table 18 presents the Design Explorer dataset showing optimised shading depth.
Figure 18
Fig. 18. Pareto Font analysis for daylighting optimization.
Figure 19
Fig. 19. Data analysis and visual presentation in Design Explorer.
Table 18
Table 18. Design Explorer dataset showing optimised shading depth.
From six distinct categories concerning occupants' thermal satisfaction, the west window with egg crate shading system (TYPE 5) was found to be the most feasible regarding daylighting and energy performance. The identified efficient fenestration type, windows with egg crate shading of 1.0 m depth, provided optimum daylight and less solar gain inside office buildings. This fenestration provided the highest optimum UDI_a, sDA, mean illumination and lower ASE in the west-facing office space. Figure 20 shows the optimised window configuration for the west facade and its parameters.
Figure 20
Fig. 20. Optimised window configuration for the west facade.
5. Approach for further performance enhancement
based on existing design practices by local architects, commonly referred to as brise soleil, to assess if the performance of the optimised shading could be further enhanced.
Better performance was observed while comparing the brise soleil configuration (Fig. 21 (bottom)) with the typical optimum egg crate configuration (Fig. 21 (top)). The egg crate shading device tailored with a 0.4 m gap between the wall and the horizontal shading elements showed a significant difference with higher sDA and average illumination than the egg crate option with optimised parameters identified from Section 4.5. In this tailored egg crate shading strategy, light enters the interior space through the gap after reflecting from the horizontal shading elements. Figure 21 shows the comparison of the simulation outputs of optimum egg crate shading and brise soleil (tailored optimum egg crate shading).
Figure 21
Fig. 21. Performance comparison between optimised GSB office egg crate shading (top) and customised brise soleil shading (bottom).
6. Conclusion
Commercial buildings with glazed facades without shading at the west result in glare problems and excessive PMV (almost +3, on a seven scale) rates near the perimeter zones in the afternoon. Direct solar penetration can be resisted through different internal and external shading devices, which decrease glare and internal heat gain up to 2.8oC and consequently result in 3% less energy consumption. An appropriately designed fenestration system can positively influence energy consumption in office buildings, thereby contributing to the national energy demand.
By analysing the simulation and field survey data, it is perceptible that fenestrations with egg crate shading devices are efficient in establishing a productive working environment in Dhaka, where a significant number of office buildings are oriented to the west to face the main access roads. The identified efficient fenestration type-egg crate shading with 1.0m depth provides optimum daylight and solar heat gain inside the office building. A 0.4m gap between the wall and the horizontal shading elements in the optimised egg crate shading showed a significant difference, with 12.2% higher sDA and an average 98 lux additional illuminance than the identified optimised shading type. The findings of this research emphasised the importance of utilising optimisation methodology to develop shading configurations while also highlighting significant opportunities to further enhance performance by customising details based on the optimised design recommended from simulation analysis.
In this research, optimisation focused solely on one variable: the depth of the egg crate. Future research could explore other aspects such as materials, positioning of horizontal and vertical shading elements, and distances. Additionally, investigating various study areas, building types, and orientations could provide further insights. It is anticipated that this research will enhance professionals' comprehension of daylighting and thermal comfort by offering insights into additional factors essential for achieving optimal light and heat distribution in office environments.
Acknowledgment
This research was carried out in the Department of Architecture, Bangladesh University of Engineering and Technology (BUET), Dhaka, Bangladesh. The authors gratefully acknowledge the support and facilities provided by BUET.
Contributions
A. Rubel designed the study, carried out the literature synthesis and computer simulations, and wrote the manuscript after interpreting the findings. M. A. R. Joarder contributed to conceptualisation, methodology, review and editing, and supervision from the inception to completion of the work.
Declaration of competing interest
The authors declare no conflict of interest.
References
- U. Barua, R. Tay, M. Houque and M. Mamun, Analysis of pedestrian safety on five major arterial roads in Dhaka, Bangladesh. In Proceedings of the 42nd Canadian Transportation Research Forum , Winnipeg, MB, Canada, 3-6 June. (2007).
- B. Ahmed, R. Hasan and K. M. Maniruzzaman, Urban Morphological Change, Analysis of Dhaka City, Bangladesh, Using Space Syntax; ISPRS International Journal of Geo-Information 3, (2014) 1412-1444. https://doi.org/10.3390/ijgi3041412
- S. Roy, T. Sowgat, M. U. Ahmed and N. Anjum, Bangladesh: National Urban Policies and City Profiles for Dhaka and Khulna. Research Report. Khulna University, Khulna, Bangladesh (2018).
- K. S. Ahmed and M. M. Hossain, Illumination Conditions and Visual Comfort in Production Spaces of ReadyMade Garments Factories in Dhaka. IACSIT International Journal of Engineering and Technology, 5 (5) (2014) 587-592. https://doi.org/10.7763/IJET.2013.V5.623
- M.A.R. Joarder, M.M. Hossain, A.J.E. Bach, J.P. Palutikof and F. Tonmoy, Optimisation of Daylighting and Energy Performance in Bangladesh Ready-Made Garment Factories: Use of Parametric Design, Simulation Modelling, and Genetic Algorithms. Fifth Conference of International Building Performance Simulation Association (IBPSA)-Italy. (2022), 1-8.
- D. D'Agostino, P. D'Agostino, F. Minelli, and F. Minichiello, Proposal of a new automated workflow for the computational performance-driven design optimization of building energy need and construction cost, Energy and Buildings, 239 (2021). https://doi.org/10.1016/j.enbuild.2021.110857
- B. I. Gwaivangmin, The impact of daylighting in the development of sustainable electric power and building infrastructures in Nigeria." Continental J. Engineering Sciences, 11 (2017) 42-52.
- W. J . Hee, M. Alghoul, B. Bakh, O. Elayeb, M. A. Shameri, M. S. Alrubaih, and K. B. Sopian, The role of window glazing on daylighting and energy saving in buildings. Renewable and Sustainable Energy Reviews. (42) (2015). https://doi.org/10.1016/j.rser.2014.09.020
- A. Heidari, M. Taghipour, and Y. Zahra, The Effect of Fixed External Shading Devices on Daylighting and Thermal Comfort in Residential Buildings, Journal of Daylighting. 8 (2021) 165-180. https://doi.org/10.15627/jd.2021.15
- O.H. Koenigsberger, T.G. Ingersoll, A. Mayhew, and S.V. Szokolay, Manual of tropical housing and building design. Part 1. Hyderabad: Orient Longman Private Limited. (1973).
- M. Rasheed, The Efficacy of Shading Design in Commercial Buildings in The Semi-arid Climate of Lahore; Focusing on The Geometry of Horizontal Shade. Technical Journal, University of Engineering and Technology (UET) Taxila, Pakistan, 24 (2019).
- I. Shah, B. Soh, C. Lim, S. Lau, and A. Ghahramani, Thermal transfer and temperature reductions from shading systems on opaque facades: Quantifying the impacts of influential factors, Energy and Buildings, (278) (2023). https://doi.org/10.1016/j.enbuild.2022.112604
- M.A. Muktadir, Designing building in the tropics with environmental technologies in architecture. Dhaka: Ahsanullah University of Science and Technology Press, Bangladesh (2010).
- S. LLC, Learning ClimateStudio, -Solemma-ClimateStudio latest documentation. Available at: https://climatestudiodocs.com/docs/learningClimateStudio.html. (2024) (Accessed: 25 February 2024).
- J. Wienold, and J. Christoffersen, Towards a new daylight glare rating. Lux Europa: Berlin, Germany, (2005) 157-161.
- J. Wienold and J. Christoffersen, Evaluation methods and development of a new glare prediction model for daylight environments with the use of CCD cameras. Energy and Buildings, 38 (2006) 743-757. https://doi.org/10.1016/j.enbuild.2006.03.017
- S. B. M.Ali, M. Hasanuzzaman, N.A. Rahim, M.A.A. Mamun, and U.H. Obaidellah, Analysis of energy consumption and potential energy savings of an institutional building in Malaysia, Alexandria Engineering Journal, 60 (2021). 805-820. https://doi.org/10.1016/j.aej.2020.10.010
- P. Fanger, Thermal comfort, Copenhagen: Danish Technical Press, (1970).
- A, Jayedi and M.A.R. Joarder, Thermal Comfort in Architecture Jury Rooms in the Presence of Vertical and Horizontal Apertures for Daylighting Display Walls. Global Science and Technology Journal. (5) (2017) 23-43.
- A. A. Akhie and I. A. Dipta, Study on contemporary shifting pattern of the weather parameters in Dhaka city. World Journal of Science and Engineering (WJSE), 2 (1) (2017) 47-60.
- A. Maleki, and N. Dehghan, Optimisation of energy consumption and daylight performance in residential buildings regarding window design in the hot and dry climate of Isfahan. Science and Technology for the Built Environment. 27. (2020) 1-16. https://doi.org/10.1080/23744731.2020.1812294
- S. Shrestha and G. Maxwell, Empirical validation of building energy simulation software: EnergyPlus, Proceedings of the 12th Conference of International Building Performance Simulation Association. Sydney, Australia, (2006) 2935-2942.
- C.R. Kothari, Research Methodology: Methods and Techniques. 2nd Edition, New Age International Publishers, New Delhi (2004).
- C.F. Reinhart, Tutorial on the use of daysim simulations for sustainable design. Institute for Research in Construction National Research Council Canada, Ottawa, Ont., K1A 0R6, Canada. (2006).
- L. Corain, R. Arboretti, R. Ceccato, F. Ronchi, and L. Salmaso, Testing and ranking on round-robin design for data sport analytics with application to basketball. Statistical Modelling. (2018). 19. 1471082X1880863. https://doi.org/10.1177/1471082X18808630
- P.O. Fanger, Thermal comfort, analysis, and applications in environmental engineering. New York: McGraw-Hill, (1972).
- F. Tartarini, S. Schiavon, T. Cheung and T. Hoyt, CBE Thermal Comfort Tool: Online tool for thermal comfort calculations and visualizations, SoftwareX, (12) (2020). https://doi.org/10.1016/j.softx.2020.100563
- A. A. Freewan, Improving thermal performance of offices in using fixed shading devices. World Renewable Energy Congress - Sweden; Vol. 8: (2017). 1860-1866.
- K. Toussakoe, E. Ouedraogo, B. K. Imbga and N. G. Gilbert, Prediction of Thermal Comfort from Operating Temperature and the Predicted Mean Vote / Predicted Percentage Dissatisfied (PMV/PPD) Indices in a Nubian Vault. Advances in Materials, (2023). https://doi.org/10.11648/j.am.20231201.12
- Z.A. Kilic and A.Y. Köknel, Determining Proper Daylighting Design Solution for Visual Comfort and Lighting Energy Efficiency: A Case Study for High-Rise Residential Building. Journal of Physics: Conference Series, 8th International Building Physics Conference (IBPC 2021), Copenhagen, Denmark 2069 (2021). https://doi.org/10.1088/1742-6596/2069/1/012156
- H. Yan, Y. Zhang, S. Liu, K.M. Cheung and G. JI. Optimisation of Daylight and Thermal Performance of Building Facade: A Case Study of Office Buildings in Nanjing CDRF 2021, Proceedings of the 2021 Digital FUTURES (2022) pp. 168-178. https://doi.org/10.1007/978-981-16-5983-6_16
- P. Ngatchou, A. Zarei and A. El-Sharkawi, Pareto Multi-Objective Optimization. Proceedings of the 13th International Conference on Intelligent Systems Application to Power Systems, ISAP'05. (2005) 84-91.
- J. Zhao, Y. Du, Multi-objective optimization design for windows and shading configuration considering energy consumption and thermal comfort: A case study for office building in different climatic regions of China, Solar Energy, 206 (2020) 997-1017. https://doi.org/10.1016/j.solener.2020.05.090
- O. Kaheneko, Research on Application of Natural Light in Modern Architecture Design. The International Journal of Science & Technology, 9 (2021). https://doi.org/10.24940/theijst/2021/v9/i2/ST2102-013
Copyright © 2024 The Author(s). Published by solarlits.com.

3934
Total views
Citations
SHARE ON


