Volume 11 Issue 1 pp. 165-180 • doi: 10.15627/jd.2024.10
Design Adjustments For Daylighting and Visual Comfort in a Classroom with Conventional Shadings
Doris A. Chi∗
Author affiliations
Department of Architecture, Universidad de las Americas Puebla, ExHacienda Santa Catarina Martir S/N, San Andres Cholula, 72810, Mexico
*Corresponding author. doris.chi@udlap.mx (D. A. Chi)
History: Received 8 May 2024 | Revised 15 June 2024 | Accepted 17 June 2024 | Published online 30 June 2024
Copyright: © 2024 The Author(s). Published by solarlits.com. This is an open access article under the CC BY license (http://creativecommons.org/licenses/by/4.0/).
Citation: Doris A. Chi, Design Adjustments For Daylighting and Visual Comfort in a Classroom with Conventional Shadings, Journal of Daylighting 11 (2024) 165-180. https://dx.doi.org/10.15627/jd.2024.10
Figures and tables
Abstract
This paper evaluates how design adjustments applied to roller shades and louvres (namely the height of the shadings head and the angles of the louvre slats) can improve their annual and spatial effectiveness to provide autonomous daylight levels, reduce daylight glare problems, and offer views outside. The strategies were analogous to the rule of thumb that relates the window head height with the depth of daylight penetration. Climate-based daylight simulations were performed to calculate the Useful Daylight Illuminance, spatial Disturbing Glare, and View Factors in a classroom located at a 19° latitude. Temporal maps were included to assess the shadings’ performance not only over space but also over time. Results showed that roller shades performed better when they were applied letting the top of the window clear. On the contrary, louvres performed better when they covered the entire glazing. It is concluded that simple design adjustments can greatly improve the daylight and visual performance in buildings.
Keywords
Useful daylight illuminance, Uniformity, Spatial disturbing glare, Shading design
1. Introduction
European policies have suggested the use of shading systems as one of the key interventions for energy conservation in buildings that would limit greenhouse gas emissions [1]. It has been seen that selecting the most appropriate window configuration and shading strategy would improve not only the energy efficiency but also the daylighting performance of buildings. During the building design phase, it is crucial to consider shading systems to control the transmitted solar radiation, ensure proper levels of daylight, provide thermal and visual comfort, and reduce energy consumption [2-5]. In addition to these benefits, well-designed shading systems can improve the architectural quality of buildings [2]. The occupants’ preferences, visual relief, and pleasing effect of sunlight must be simultaneously considered for design purposes [5].
Therefore, the design of shading systems should be thought to satisfy the functional and aesthetic requirements. Many studies have investigated the effect of shadings on the performance of buildings. In [6], various studies carried out between 2001 and 2016 regarding solar control devices for buildings were critically reviewed. The authors identified the study domains explored in the literature to evaluate the shading performance, namely passive solar gain control, thermal comfort, daylighting, visual comfort, total energy use, peak electric demand, and energy cost savings. The paper also reported an overview of several design parameters that have been studied in the reviewed articles, i.e. slat colour, slat width, slat design, the fraction of holes of fabric for a roller shade, shadings position (internal, integrated, or external), and control systems. Regarding the criteria for daylighting, the authors recognized in the state of the art the following main factors that determine the transmission through the façade: the climatic conditions/location, the size, the position and orientation of the glazed areas, the light transmittance and the operation/control of the façade system. As regards the criteria for visual comfort, the authors identified the following key aspects: visual contact with the exterior, glare protection, contrast between visual task and background, sufficient illuminance, colour rendering of objects in the room.
In [7], a review of simulation modelling for shading devices in buildings carried out between the years 1996 and 2015 was presented. The authors identified that shadings are crucial, especially in climates with hot summers, and to avoid overheating problems from façades with large, glazed proportions. The authors classified the shading systems into fixed and mobile categories. The first category included overhangs, external horizontal and vertical louvres, and egg crates. The second category comprised Venetian blinds, vertical blinds, and roller shades. This last category included different types of mobile control systems, such as manual, central up-down, fully automated, etc. Besides, the authors identified several programs used to perform daylight evaluations of shading systems, such as Radiance and Diva-for-Rhino. They also enlisted several programs used to perform thermal evaluations, i.e. EnergyPlus, Design Builder, DoE-2, Ecotect. The study demonstrated that simulation modelling has been very effective in estimating the performance of buildings in the last few decades. The paper gathered the significant studies in literature based on year, author (s), studied location, simulation type, climate type, building type, and study type. Among the studies, many were reported for locations such as USA, Canada, Korea, China, UK, Belgium, Malaysia, Egypt, Italy, and other European countries; however, no study was reported for Latin America. The authors also reported that the most studied case building type is office building with 52% whereas residential and educational buildings rated 14% and 9%, respectively.
As can be observed, the investigation related to shading systems is extensive, covering different categories [8-10]. In [11], it was investigated the role of shading and daylighting strategies in visual comfort and energy saving in existing schools. A Primary school in the C climatic zone (latitude 31°) was used as a case study. An insolation-shading analysis was run with Ecotec tool on specific days of the year that is December 21st, September 21st, and March 21st. Daylight Autonomy (DA, with a threshold of 300 lux) and Useful Daylight Illuminance (UDI, with a range of 300-3000 lux) were the indices used for daylight evaluations. Furthermore, the cooling loads were examined for May, half of June, September, and October. The application of external shading devices, consisting of louvres, resulted in a 2.6% reduction in cooling loads, but it also increased heating loads by 2.7%. The effect on visual comfort was satisfactory since the UDI over 2000 lux was largely reduced, so the glare was eliminated to the minimum.
In [12], seven different façade shading types were evaluated and applied to eight azimuth orientations of a typical high school classroom located in South Korea (latitude 37°). The seven shadings analysed were vertical louver, horizontal louver, eggcrate louver, overhang, vertical slat, horizontal slat, and light shelf. UDI (with a range of 100-2000 lux) and DA (with a threshold of 300 lux) were the indices used for evaluations. Results showed that the light shelf, horizontal slats, horizontal louvers, and eggcrate louvers produced a dramatic decrease in DA values, which means an indoor daylight level below 300 lux. On the contrary, light shelves, horizontal slats, horizontal louvers, and eggcrate louvers produced a dramatic increase in UDI values when installed in the South orientation, but the value decreased in the East, North, and West orientations. The overhang type had the lowest performance in improving UDI value compared to the other façade shading systems, except for the vertical louver. The authors concluded that the UDI metric explains well the daylight performance of a shading device.
In [13], the effect of using shading devices on air temperature and illuminance level in offices facing the southwest façade at Jordan University of Science and Technology (latitude 30.5°) was investigated. Three fixed shading devices (vertical fins, diagonal fins, and egg crates) were tested in terms of their performance in the air temperature, illuminance level, and thermal environment. Particularly, summer months like July and August were examined. Results showed that shading devices reduced the illuminance levels from around 150, 200, and 350 lux for diagonal fins, egg crate, and vertical fins respectively. In addition, the uniformity improved when using shading devices, for example, a 0.80 ratio was achieved when using diagonal fins. Furthermore, diagonal fins, vertical fins, and egg crates reduced the air temperature by up to 19%, 6%, and 10%, respectively, compared to the base case with no shading. The authors concluded that diagonal fins and eggcrate devices performed better compared to vertical fins.
In [14], an integrated thermal and daylight evaluation was conducted by using a survey and onsite measurements to evaluate subdivided shading strategies covering an office window: semi-open (left or right side), semi-open blind (90°), closed blind, and a window without shading. The aim was to maintain visual comfort and minimise annual energy demand for a south-oriented daylit office located in the semi-arid region of Iran (latitude 32.5°). The metrics used for evaluation were UDI (with a range of 200-3000lux), spatial Daylight Autonomy (sDA, with a threshold of 300 lux, during 50% occupied hours), and Daylight Glare Probability (DGP in the ranges <0.45 and 0.2-0.28). Results showed that the semi-opened strategy was satisfactory from 12 pm to 18 pm in the front position since a sDA of 100% was reached. The left or right side opened strategies achieved an sDA of 35% and 40%, respectively. The authors concluded that subdivided shadings are recommended, particularly in 90% WWR (window-to-wall-ratio) considering both energy efficiency (40% savings) and satisfaction of occupants. Results also demonstrated that in all blind types, except the entirely opened type (window without shading), all three open positions were tolerable but not entirely acceptable for laptop working activity when considering occupants’ satisfaction rates. It should be mentioned that the quality of view was not tested in this study.
In [15], the heating and cooling energy demand for different window and louvre areas, under different climates and latitudes, were quantified. Horizontal and vertical louvres were applied to the East, West, and South façades, showing that they may lead to significant energy savings. The use of louvres became more important to cities like Cairo, Lisbon, and Madrid, with high solar radiation and ambient temperatures in summer; but it also reduced cooling needs in London to Zero. Results also showed that louvres also increase heating needs, especially in cities like London, where solar radiation and ambient temperatures are lower in winter. However, the increment in heating needs could be avoided by using mechanical/automatic devices. The total energy savings were up to 60% in Cairo, up to 50% in Lisbon, and up to 9% in Madrid.
In [16], vertical and horizontal shadings, as well as egg crates for a high-rise office building in the hot-humid climate of Malaysia (latitude 3.13°), were evaluated. Different façade orientations with high and low performance glazings were also tested. Results showed that applying shading devices on the West and East façades resulted in higher annual cooling energy savings compared to the North and South façades. Thus, shading devices on the East and West façades must be prioritized to optimize annual cooling energy savings. It was then estimated an annual cooling energy saving between 5% and 9.9% when the shading devices are applied to all orientations of Low-E double glazed façades. Results also showed that egg-crate shadings were able to produce the highest annual cooling energy savings compared to vertical shadings and horizontal shadings.
Regarding the control systems, it was demonstrated in [17] that automated systems are better than manual or motorized blinds to reduce energy consumption and provide internal comfort. This issue was attributed to the operation of the blinds by the occupants. It has been seen that occupants infrequently operate shadings in shared spaces; thus, energy efficiency and visual comfort can be affected [14]. Besides, field studies have concluded that maintaining acceptable visual comfort conditions for the majority of occupants is challenging since the perception of glare/proper light levels varies significantly amongst individuals [18,19]. However, it has also been observed a lack of dynamic control that is attributable to the fact that is not easy to combine the room dynamics with any possible optimization algorithm [20].
A field study of human interactions with motorized roller shades and dimmable electric lights was presented in [21]. The research included comparisons of environmental controls ranging from fully automated to fully manual and interfaces with low or high levels of accessibility. The findings revealed a strong preference for customized indoor climate, along with a relationship between occupant perception of control and acceptability of a wider range of visual conditions. Other studies with shading/lighting automation systems have found that occupants frequently override these systems, either indicating discomfort or implying their desire for customized indoor climate [22-24].
The numerous studies done on shading devices reinforce the importance of their usage in buildings. Among the different study domains, the quality of view for the occupants’ positions has been the least explored area whereas the energy domain is the topic more investigated. Besides, the daylight availability, daylight glare, and views outside have been sparsely but not simultaneously explored. It was also observed that school buildings are one of the least analysed cases. In addition, the literature review showed that researchers concurred on applying the shading devices over the entire windows or glazing façades. Moreover, the related studies have tested different design parameters that modify the entire shading devices. Here, it is important to highlight the applicability of combining both daylighting and shading strategies to further optimize the overall building performance.
In architecture, it is well known the daylighting rule of thumb that relates the window head height to the depth of the daylit area adjacent to a façade [25]. In short, this rule points out that the higher the window head, the deeper the penetration of daylight. Despite this apparent and frequently used design rule, the author did not find any shading research/design that has considered letting the upper part of a window/façade clear (with no shading) to take advantage of the daylight penetration into space. Hence, it is worthy of investigation to consider this type of design adjustment (and its implications in daylight sufficiency and visual comfort) when planning appropriate shading strategies in the initial design process of buildings. In addition, it is pertinent to quantify the daylighting and visual performance variations resulting from the application of fixed shadings on the bottom part of windows and glazing façades (but not in their upper part).
1.1. Objectives
This paper analyses different shading solutions commonly used in offices and classrooms to prevent solar radiation and the associated glare problems. As stated in the literature review, the use of these devices also reduces daylight levels and views outside. Commonly, these last factors are still not a priority in the building assessment although they can negatively affect the occupants’ comfort and wellness. This work tests several configurations of typical shadings, namely roller shades, and louvres, in terms of their annual and spatial effectiveness in providing proper levels of daylight, reducing glare problems, and offering views outside.
Then, it is common practice to implement shading devices covering the entire glazing systems on windows and façades. However, inferences based on a widely cited and frequently used design rule of thumb that predicts more daylight penetration as a result of a higher window head are taken into consideration to propose elementary design adjustments to the shading design. That is to say, include a clear upper part in windows (with no shadings) to contribute to increasing the depth of daylight penetration and to improve daylight availability over the working plane. Therefore, this work tests if changes applied to roller shades and louvres, namely the height of the shadings head and the angles of louvres slats, can improve the performance of buildings in the three domains studied.
2. Methodology
The following sections describe the characteristics of the case study, the simulation setup, and the metrics selected for evaluation.
2.1. Case study
A university classroom was considered as the case study to evaluate the daylight availability, spatial daylight glare, and views outside when using different configurations of roller shades and louvres and to understand how these devices compare to each other. The classroom is located on the first level of the library of Universidad de las Americas Puebla, Mexico. The city is located at a latitude of 19° and has a temperate climate (cwb) according to the Köppen classification. The classroom measures 7.80 m in length, 6.85 m in width, and 3.20 m in height. It was selected as the case study due to the excessive solar radiation reaching the West-Northwest oriented glazing façade (300 degrees). A total of 2132 direct sun horas and a total solar exposure of 602 kWh/m2-yr were estimated to reach that façade, as Fig. 1 summarizes.
Figure 1

Fig. 1. Analysis of sun radiation reaching the West-Northwest façade of the case study.
To evaluate the average daylight and visual conditions, a working plane of 41.71m2 was placed 0.80 m from floor and 0.50 m from walls and glazing. The working plane consisted of 700 sensors with a 0.25 m spacing distance. Furthermore, 12 sensors, grouped in four lines, were selected to evaluate the specific daylighting and visual conditions near the glazing, in the middle of the room, and far from the glazing. Figure 2 specifies the location of the working plane and the sensors analysed.
Figure 2

Fig. 2. Case study: Plan view, perspective view, and overview plan (showing the most important context elements that were included in the 3D model in Rhinoceros). The continuous red lines depict the working plane used for daylight calculations. The dots indicate specific sensors to evaluate daylighting conditions near the glazing, in the middle of the room, and far from the glazing.
To avoid glare and radiation problems, a roller shade has been installed in front of the glazing. It has been observed that roller shades and curtains are very common shading systems used to avoid glare problems in public spaces as schools, regardless of the orientation of the windows. Besides, exterior vertical and horizontal blades are regularly used in west and east façades, but these shadings tend to present maintenance problems due to extreme weather conditions. Thus, institutions have opted to use interior louvres to reduce costs and to facilitate maintenance and cleaning. In the case study, it was observed that users never roll the shades up during the entire day/year, even though the problem is during afternoons. This behaviour is very common in shared spaces because occupants infrequently operate shadings [14]. Due to the lack of operation of the roller shades, the daylight indoors is low throughout the entire year, so the classroom has always the electrical light on.
2.2. Shading configurations
Daylight conditions inside the classroom are poor as a result of the widespread use of shadings: they are placed covering the entire glazing. Thus, it is necessary to implement some modifications to the existing shading device that will allow more daylight penetration. This work tests the roller shade covering the entire glazing façade in comparison with the roller shade being adjusted by reducing the shade-head height by 80 cm (which leads to the top of the glazing façade being clear). Similarly, horizontal and 60°-rotated louvres are compared when they are placed covering the entire glazing façade and when they are placed 80 cm below the window-head height. Figure 3 highlights in yellow the area of the glazing façade that will be covered by the roller shades or the louvres. Figure 4 shows a close-up of the two louvre slats’ position that will be used for evaluations.
Figure 3
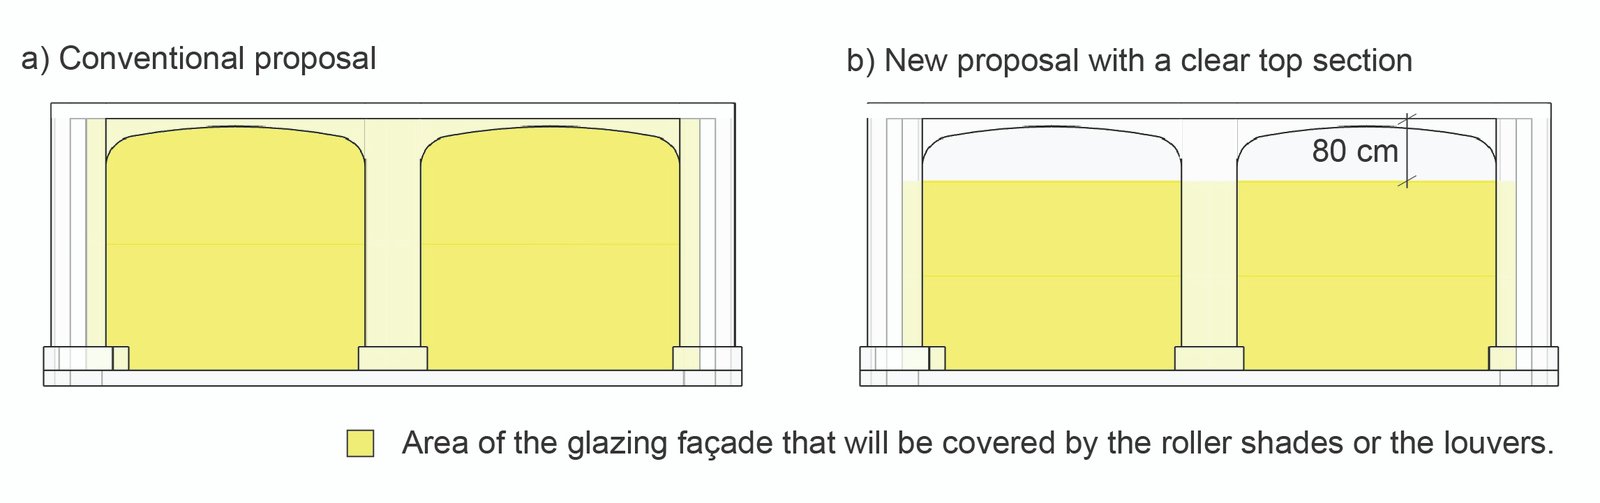
Fig. 3. Case study: Plan view, perspective view, and overview plan (showing the most important context elements that were included in the 3D model in Rhinoceros). The continuous red lines depict the working plane used for daylight calculations. The dots indicate specific sensors to evaluate daylighting conditions near the glazing, in the middle of the room, and far from the glazing.
Figure 4

Fig. 4. Position of louvres included for evaluation of the daylight and views outside.
To sum up, the following shading configurations are tested against the current state of the case study:
- RollerShades_Closed (RS_C): Current state, classroom with the roller shade always down.
- RollerShades_Bottom (RS_B): Classroom with the top of the window clear and the bottom part covered by the roller shade.
- Louvre90_Top&Bottom (L90_T&B): Classroom with 90° rotated louvres covering the entire façade.
- Louvre90_Bottom (L90_B): Classroom with the top of the window clear and the bottom part covered by louvres with a 90° slat angle.
- Louvre60_Top&Bottom (L60_T&B): Classroom with 60° rotated louvres covering the entire façade.
- Louvre60_Bottom (L60_B): Classroom with the top of the window clear and the bottom part covered by louvres with a 60° slat angle.
These shading devices were characterized using Bidirectional Scattering Distribution Functions (BSDF) to express the “emerging light distribution for a given incident direction” [26]. With BSDF, the amount of transmitted or reflected light is therefore a function of the incident light altitude and azimuth, as well as the altitude and azimuth of the emerging light itself. LBNL Window (version 7.8) software was used to export the BSDF materials to the Radiance-based ClimateStudio software.
2.3. Simulation setup
ClimateStudio was used to simulate the daylight, glare probability, and views outside derived from the shading configurations. ClimateStudio is an advanced simulation software developed by Solemma LLC that supports a series of environmental analysis workflows for buildings and neighborhoods including annual illuminance simulations, glare, and thermal comfort calculations. ClimateStudio is a plugin for Rhinoceros 3D modelling software developed by Robert McNeel & Associates. The EnergyPlus Weather (EPW) file of Puebla, Mexico, was used. Table 1 shows the standard reflectances and the visible transmittances applied on the daylight model surfaces and context. It also specifies the VisionGlass and other layers considered for the view analysis. Three types of simulations were performed to account for the following daylight metrics: Useful Daylight Illuminance (UDI), Uniformity (U), spatial Disturbing Glare (sDG), and View Factors (VF).
Table 1

Table 1. Characteristics of model components.
2.3.1. Useful Daylight Illuminance (UDI) and Uniformity (U)
Various standards use a combination of different daylighting metrics and illuminance targets, as Table 2 summarizes.
Table 2
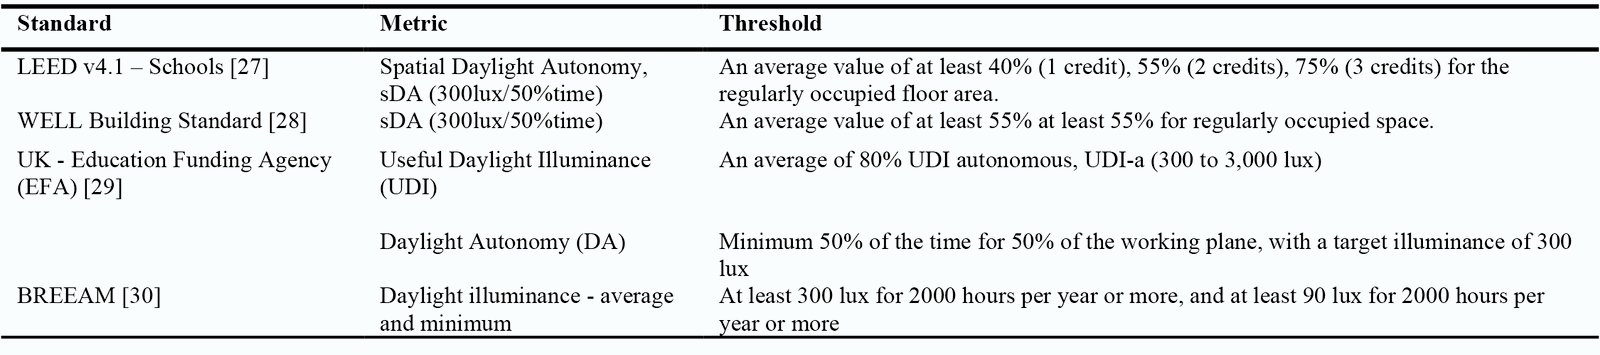
Table 2. Green Building Standards and Daylight for Schools.
As observed from Table 2, several standards use a threshold of 300 lux to evaluate the daylighting conditions in schools. Therefore, this work evaluates the sufficiency of daylight through the UDI metric, which has the advantage of considering both a lower and upper limits for proper daylight illuminance levels. Then, UDI reports how often daylight levels fall into four specific bins that are reported as a percentage of occupied hours [31]:
- Failing (UDI_f): Less than 100 lux – this bin indicates too little daylight.
- Supplemental (UDI_s): Between 100 and 300 lux – this bin indicates daylight levels sufficient to supplement but not replace electric lighting (e.g. via dimming).
- Autonomous (UDI_a): Between 300 and 3000 lux – this bin demarcates the zone with adequate daylight for work tasks; then, additional lighting will most likely not be needed.
- Excessive (UDI_e): More than 3000 lux – this bin is associated with excessively bright conditions that may cause visual and thermal discomfort.
The previous four UDI bins are visualized by using four color-coded bands around each sensor, where the width of the band is proportional to the bin’s timeshare (Fig. 5). In this work, particular attention is given to the autonomous bin. Then, the average UDI-a is reported as the mean UDI-a value for all 700 sensors in the working plane, which is placed at 80 cm above the floor, with 25 cm sensor spacing (Refer to Fig. 1 – the continuous red line showing the evaluation area). Besides, the average UDI-a is calculated for three lines (with four sensors each) to evaluate daylighting conditions near the glazing, in the middle of the room, and far from the glazing façade (Refer to Fig. 1 – the red points grouped in the three dotted lines).
Figure 5
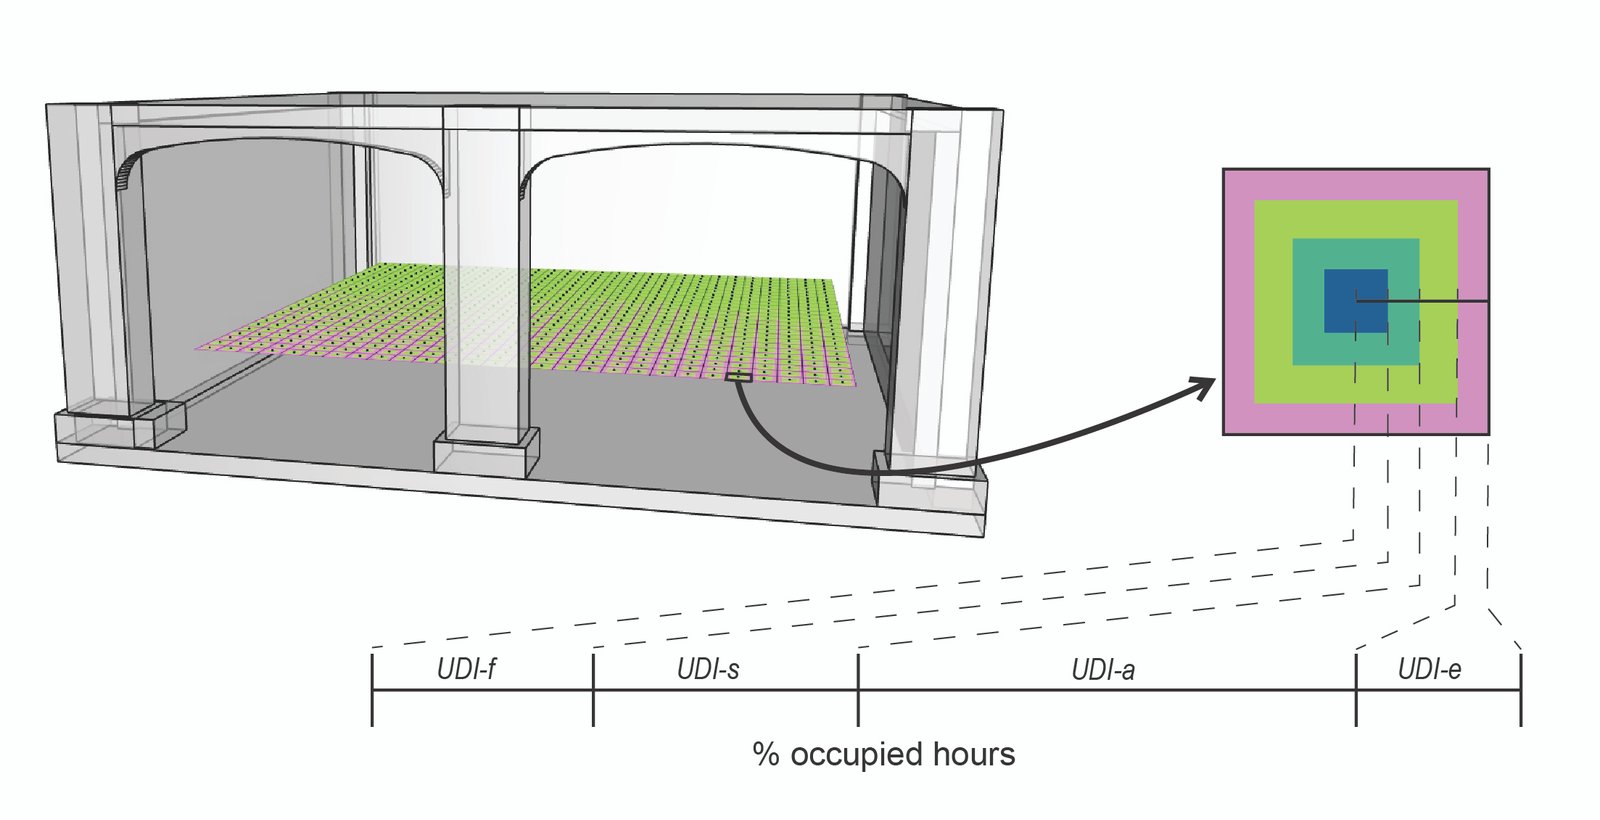
Fig. 5. Visualization of the UDI results using four color-coded bands around each sensor.
The daylight evaluation here presented considers all daylit hours during the year to understand the full daylight potential derived from architectural design. An analysis of all daylit hours during the year has the advantage of representing the architectural daylighting potential, something that will never change unless the surrounding urban environment changes [32]. Annual daylit hours can contemplate any working day, occupancy pattern or change in the building’s usage; then the results of daylighting evaluation are valid over a long-term period [33]. Figure 6 shows the daylit hours studied, that is to say, all hours throughout the year that account for a different value from zero kWh/m2 of global horizontal radiation. This schedule was preferred due to the variability of occupancy patterns linked to different courses during the academic years, which are very changeable (i.e. classes are typically held between 7 to 20h, lasting 1 or 2 h each).
Figure 6
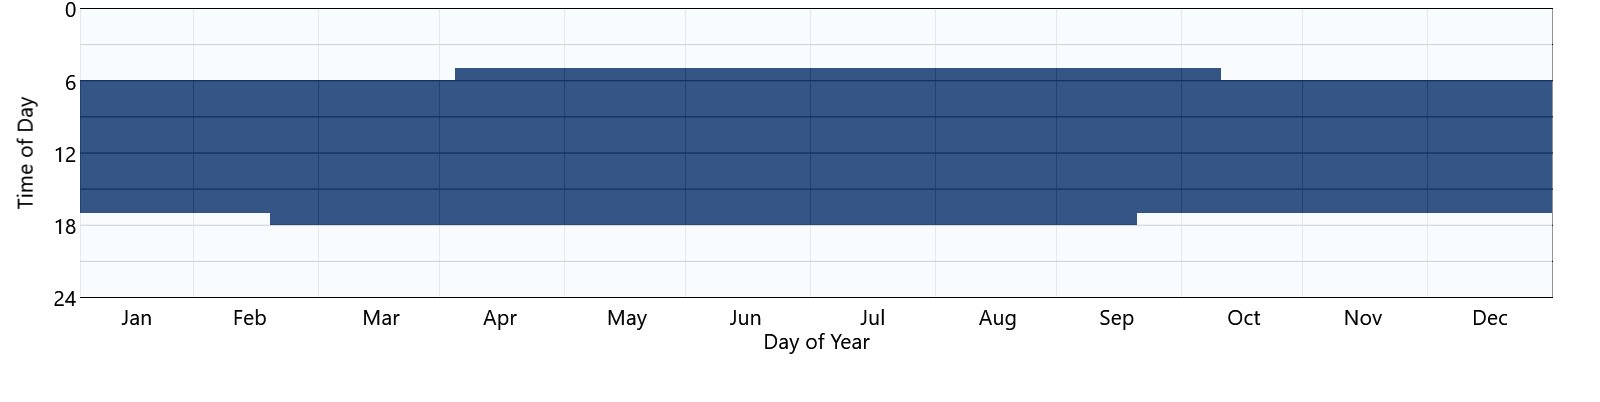
Fig. 6. Schedule used for daylight and glare evaluations showing all daylit hours during the year for a latitude of 19°, according to the EPW file of Puebla.
To better understand the homogeneity in daylighting distribution, the uniformity (U) of UDI-a was calculated. U is here defined by the singular minimum UDI-a value divided into the average UDI-a of the entire working plane, as Equation 1 indicates.
2.3.2. Spatial Disturbing Glare (sDG)
The Daylight Glare Probability (DGP) was the base metric used for the evaluation of the annual glare distribution across the working plane. DGP predicts the likelihood that an observer at a given view position and orientation will experience discomfort glare [34]. DGP can have values between 0% and 100%, which are divided into four bands:
- Imperceptible glare: DGP ≤ 34%
- Perceptible glare: 34% < DGP ≤ 38%
- Disturbing glare: 38% < DGP ≤45%
- Intolerable glare: 45% < DGP
DGP is usually calculated using a fisheye rendering with an opening angle of 180°, thus fixed view positions can be evaluated. Nevertheless, in this work, annual DGP simulations were also considered across the working plane taking advantage of ClimateStudio which relies on the vertical illuminance portion of the DGP formula, plus a contrast measurement from the solar disc [35]. The reference surface used for glare evaluations was placed 40 cm above the working plane depicted in Fig. 1. Then, the view height was 1.20 m. Likewise the previous evaluation, the reference surface was also set with 0.25 m sensor spacing and a schedule based on all daylit hours in the latitude studied.
Based on the above, sDG was calculated as the percentage of views across the regularly occupied floor area that experiences Disturbing or Intolerable Glare (DGP > 38%) for at least 5% of occupied hours. The sDG calculation is based on hourly DGP values for eight different views at each position/sensor in the building. The results are visualized with one full pie centered at each sensor, where each pie is divided into eight directional slices, with the colour indicating the frequency of disturbing glare from 0% to 5% (Fig. 7). In this work, the SDG is evaluated in two steps. First, the average sDG is reported as the mean sDG value for all 700 sensors/pies distributed across the working plane. Then, the annual sDG is evaluated for the specific observer’s view position (one directional pie slice pointing at the observer view) among the 12 pies previously organized in the three evaluation lines (Fig. 1). This was done to assess the disturbing plus the intolerable glare conditions near the glazing, in the middle of the room, and far from the glazing façade.
Figure 7
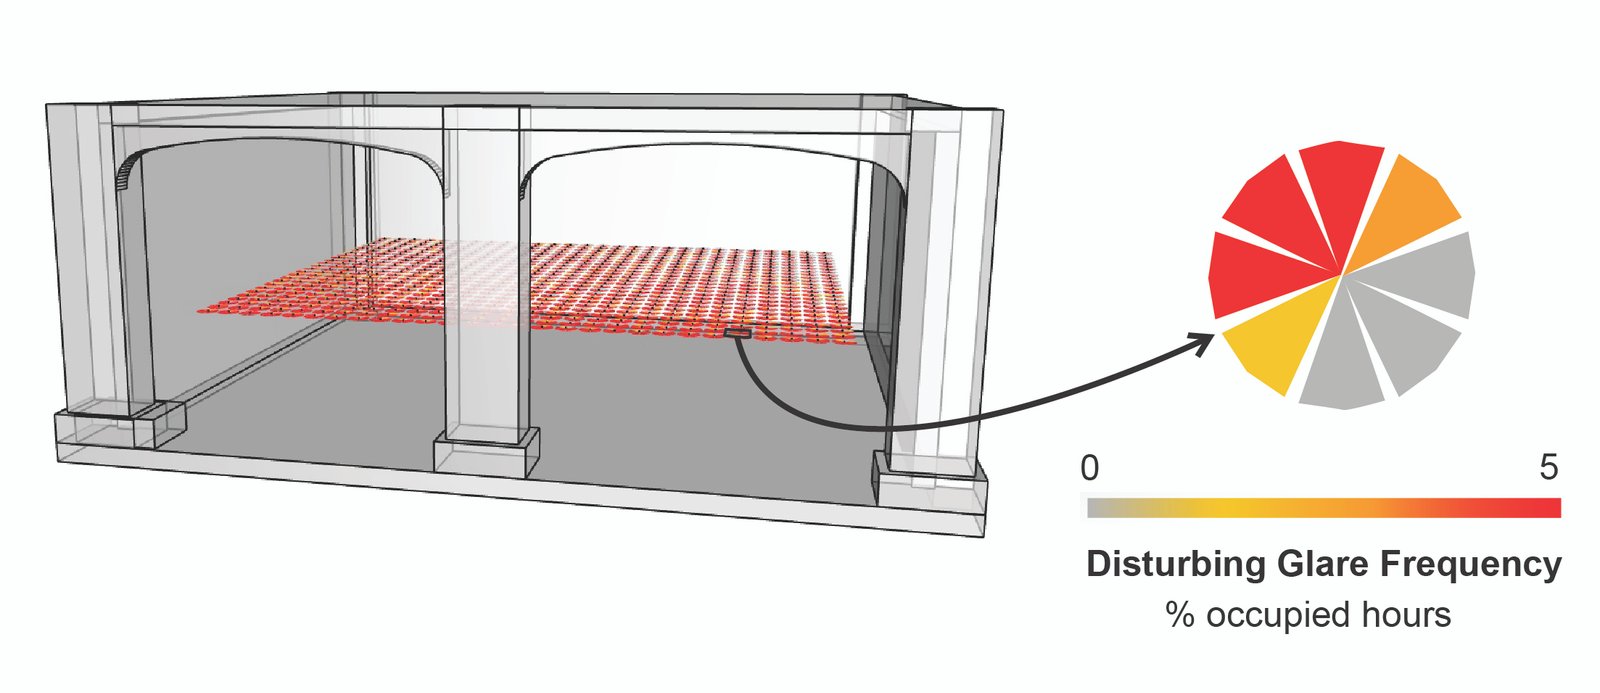
Fig. 7. Visualization of the frequency of disturbing glare using eight directional pie slices, with the colour indicating frequency from 0% to 5%.
2.3.3. View factors (VF)
VF measures the percentage of view (by solid angle) occupied by specific features or objects of interest. ClimateStudio automatically calculates VF and view distances for specific layers and tags in the model (Refer to Table 1 – view tags). VF are computed by using a field of view of 360° horizontally, and 60° vertically, centered on the horizon. The workflow tests view rays passing through vision glass until they strike the first object of any kind. This work reports the average VF and the average distances, considering all view tag layers encountered after view rays passed the glazing façade.
Similarly to the previous evaluations, the reference surface was set with 700 sensors distributed with a 0.25 m sensor spacing. The results are summarized with a viewport settings bar, which contains a legend that depicts the percentage of the average VF and the average view distance throughout the working plane (Fig. 8). Furthermore, this work also reports the annual mean VF for the specific observer’s view positions organized in the three evaluation lines. This last was done to assess the VF near the glazing, in the middle of the room, and far from the glazing façade.
Figure 8
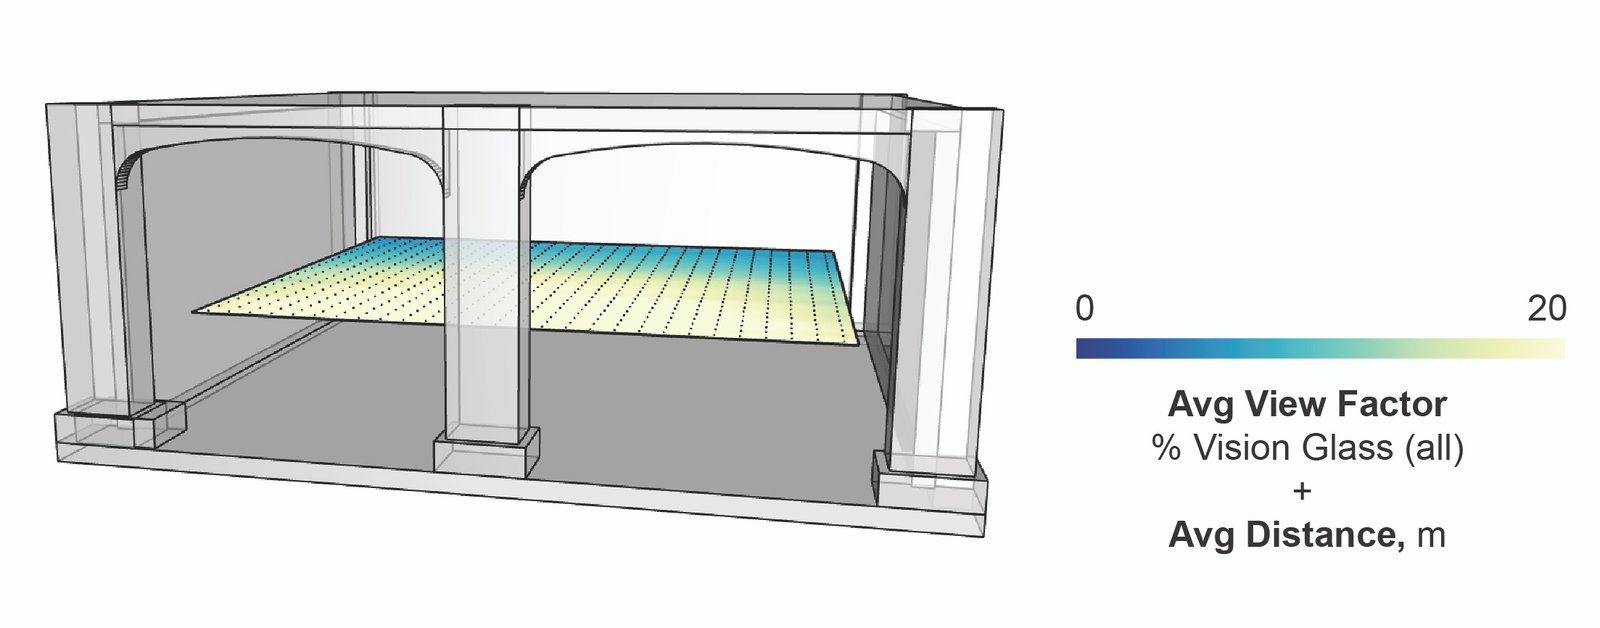
Fig. 8. Visualization of the VF for all tags and layers in the model (Refer to Table 1 for view tags).
3. Results
The three domains (UDI, sDG, and VF) were used to compare the performance of the different shading configurations. The results are presented and discussed in the sections below.
3.1. UDI-a and U
Table 3 presents the results for the specific sensors studied – they were organized in three line positions: far from the glazing, in the middle of the room, and near the glazing (Refer to Fig. 1). Figure 9 compares the average UDI-a value for all sensors distributed in the working plane and the mean UDI-a for the sensors grouped in the three line positions. Figure 9 also includes the Uniformity (U) value for the entire working plane.
Figure 9

Fig. 9. Average (Avg) of the UDI-a results accounted for the entire working plane and for the three line positions (primary vertical axis); U value for the entire working plane (secondary vertical axis). RS: roller shade; L: louvres (followed by the angle of the slat rotation); C: shading always closed; B: shading covering only the bottom section of the façade; T&B: shading covering the top and bottom sections of the façade.
Table 3

Table 3. Annual results for the specific sensors evaluated.
As shown in Fig. 9, the shading configurations achieved significant improvements compared to the case study (RS_C). For example, the annual average UDI-a increased up to 68% in the line far from the glazing, up to 58% in the middle of the room, and up to 14% near the window.
Findings also revealed that the daylight distribution with the roller shades always down was not uniform (0.44). In the zone far from the glazing the mean UDI-a achieved 16% whereas in the zone near the window the mean UDI-a reached 66%, with an average of 34% over the working plane. Nevertheless, the roller shade applied only in the bottom part of the façade reached 77% far from glazing and 80% near the window, with an average of 78%, obtaining a U of 0.98. Hence, it is observed that letting a clear section (with no roller shades) at the top of the window/glazing façade is advantageous for daylighting distribution.
Contrary to the roller shades, the use of louvres with the 90° rotated slats at the top section of the glazing suggested that they can contribute to increasing the UDI-a levels in the profound zone. From Fig. 9, it is observed that these louvres obtained 84% far from glazing and 71% near glazing, with an average of 78% over the working plane. However, the louvres with the clear section reached 82% and 56%, respectively, and an average of 73% on the working plane. The U results confirmed this trend: a U of 0.87 was reached by the louvres covering the entire façade whereas a U of 0.69 was obtained by the louvres with the clear top section. From these findings, it is inferred that the use of louvres covering the entire glazing is better than letting a clear top section of the façade.
Regarding the louvres with the 60° rotated slats, they were the best suited to contribute to increasing the average UDI-a over the working plane (80%) in comparison to the roller shades and the louvres with 90° rotated slats. Contrasting their use or their absence in the top section of the façade, interesting findings were also depicted. First, their use got very similar results in the three lines studied (79% near, 81% middle, and 80% far). Then, their absence contributed to increasing the UDI-a far from the glazing reaching 83% compared to the 72% obtained near the glazing. Regarding the uniformity distribution, their use of covering the entire façade contributed to reaching a U of 0.95 vs a U of 0.86 attributed to the louvres with the clear top section. It is then confirmed that the use of louvres covering the entire glazing is better than letting a clear top section of the façade.
Figure 10 includes the average UDI results over the working plane and throughout the year. It is then observed that the roller shade always closed is the least recommendable option since the temporal maps depict the useful illuminances below 45% throughout the year and only in the zone near the window. When letting the top section with no roller shade, the daylight is greatly improved over the entire working plane, providing the profound zone with autonomous levels of daylight. From the temporal maps in Fig. 10, it is also depicted that the design adjustment got important improvements, particularly during winter when the UDI-a increased from 20% up to 80%. Moreover, the UDI-a was maintained at around 80% during the year with the clear top section.
Figure 10
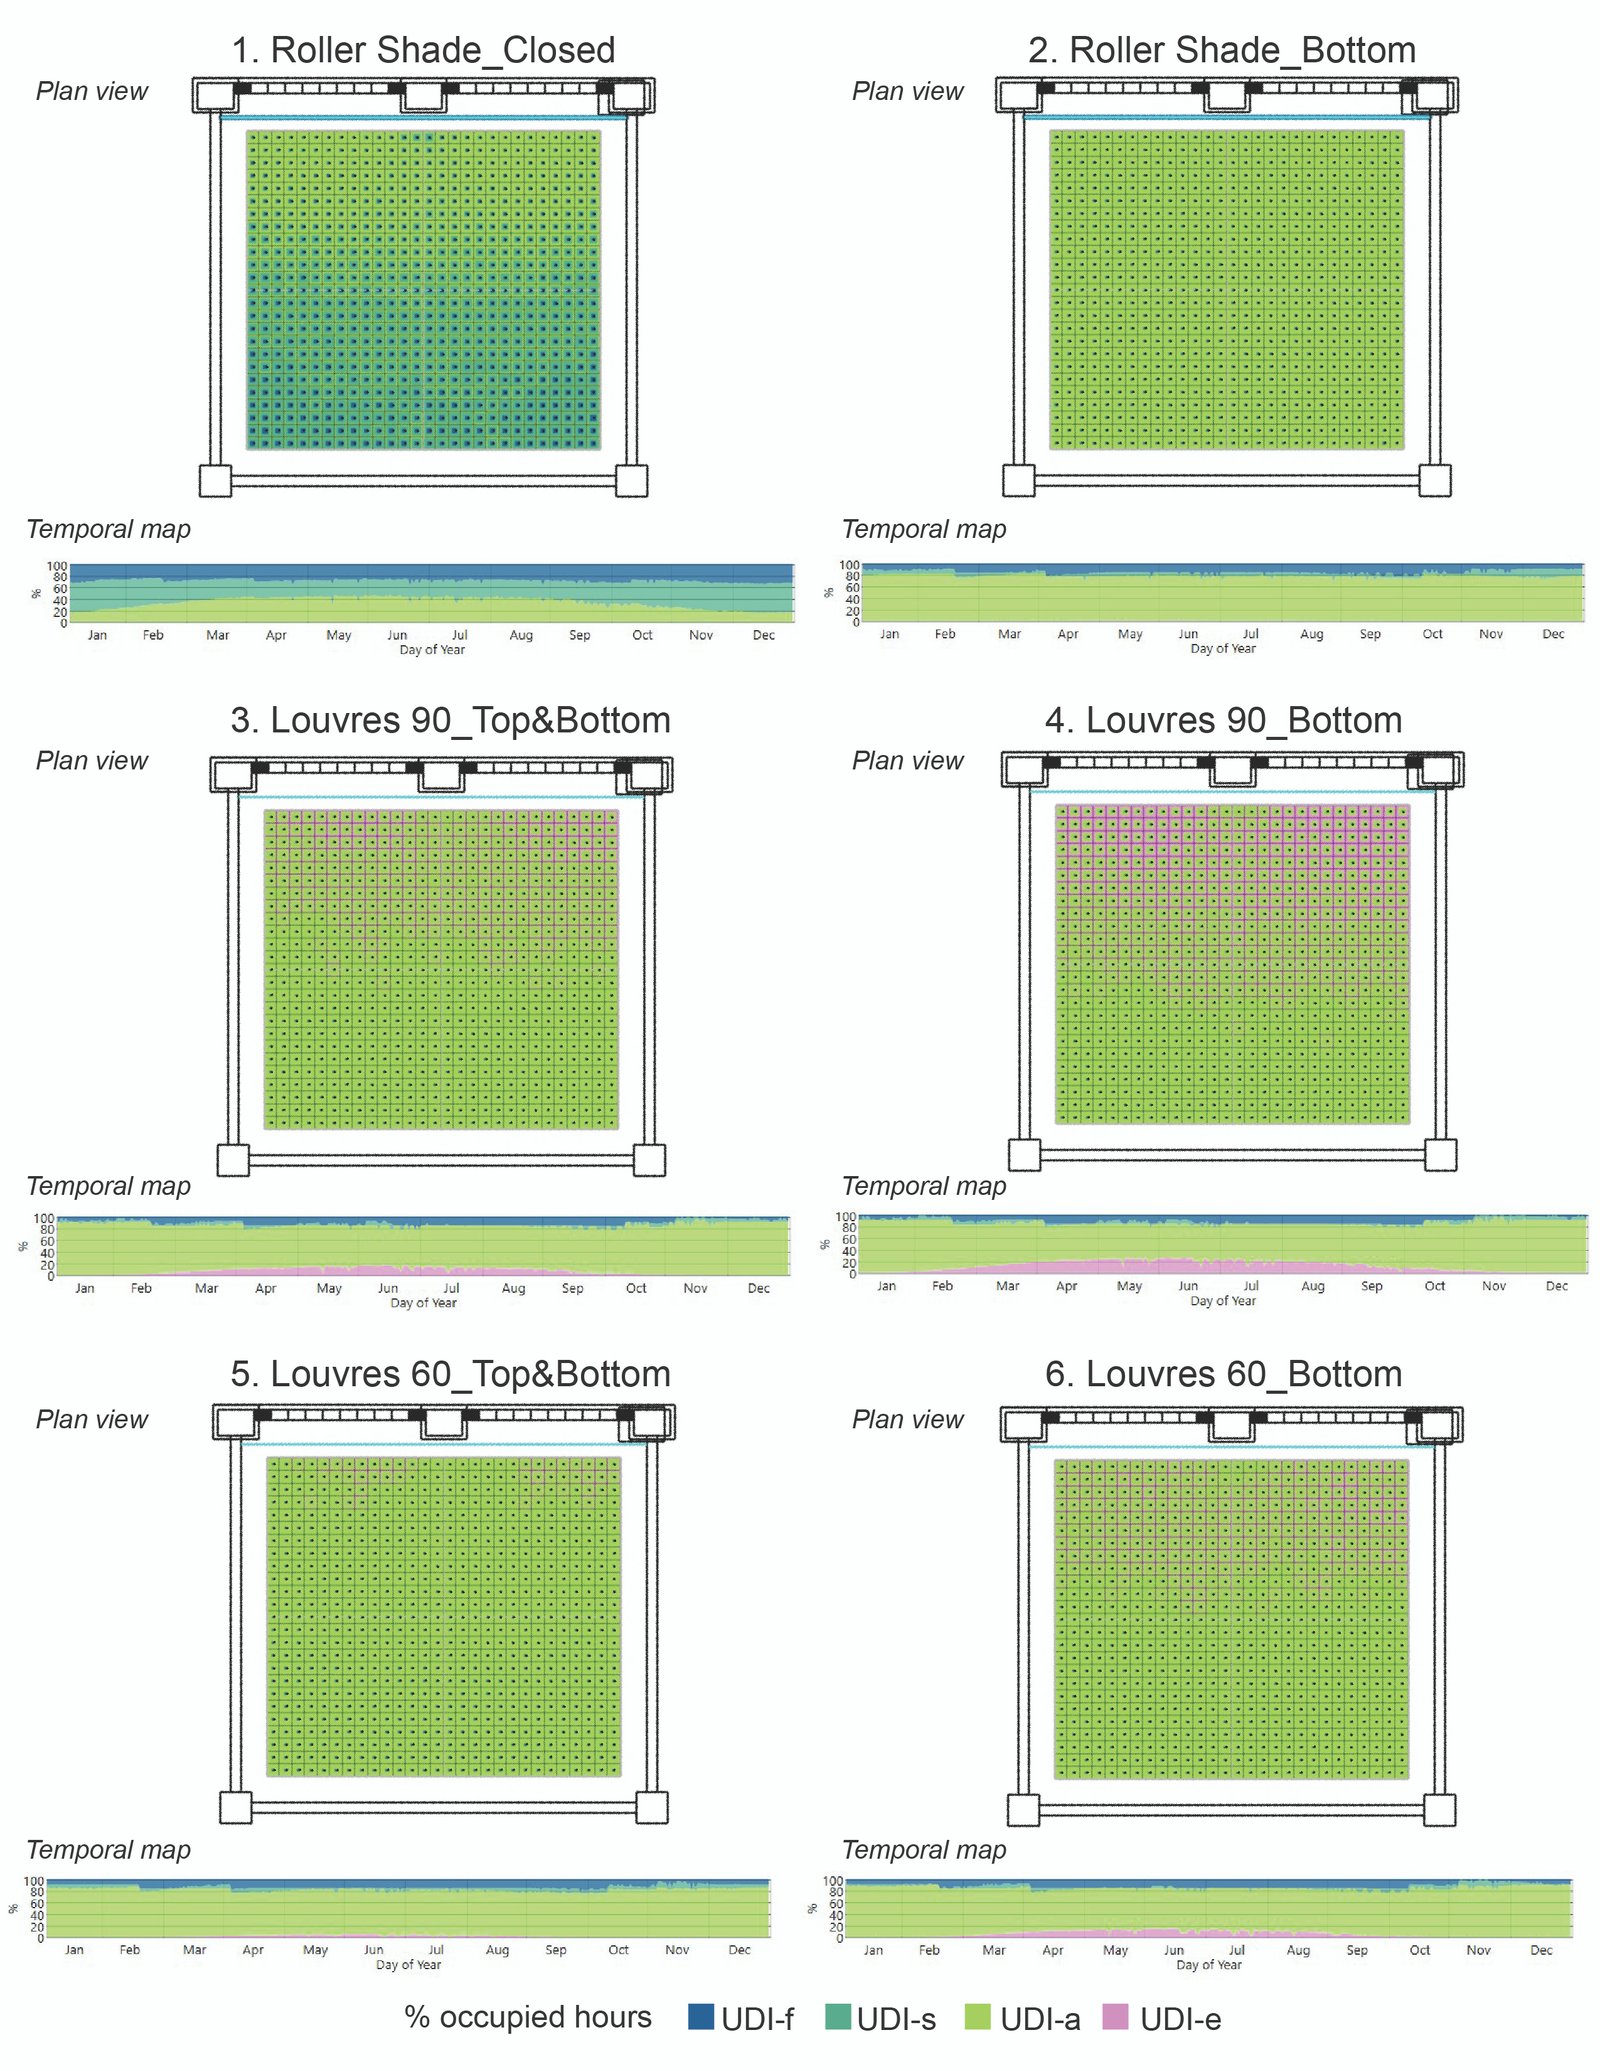
Fig. 10. UDI results over the working plane (plan view) and throughout the year (temporal map).
Regarding the louvres with the 90° rotated slats, the two shading options contribute to reaching a UDI-a of around 80% during all year. However, the best choice resulted in the option covering the entire façade since it contributed to reducing the UDI-e, particularly from March to September. Similarly, the louvres with the 60° rotated angles achieved a UDI-a of around 80% throughout the year and contributed to reducing the UDI-e during summer.
3.2. sDG
Table 4 shows the results for the specific observer views among the 12 pies organized in the three evaluation lines: near the glazing, in the middle of the room, and far from the glazing façade (Refer to Fig. 1). Figure 11 compares the average sDG value for all sensors distributed in the working plane and the mean sDG for the sensors grouped in the three line positions.
Figure 11
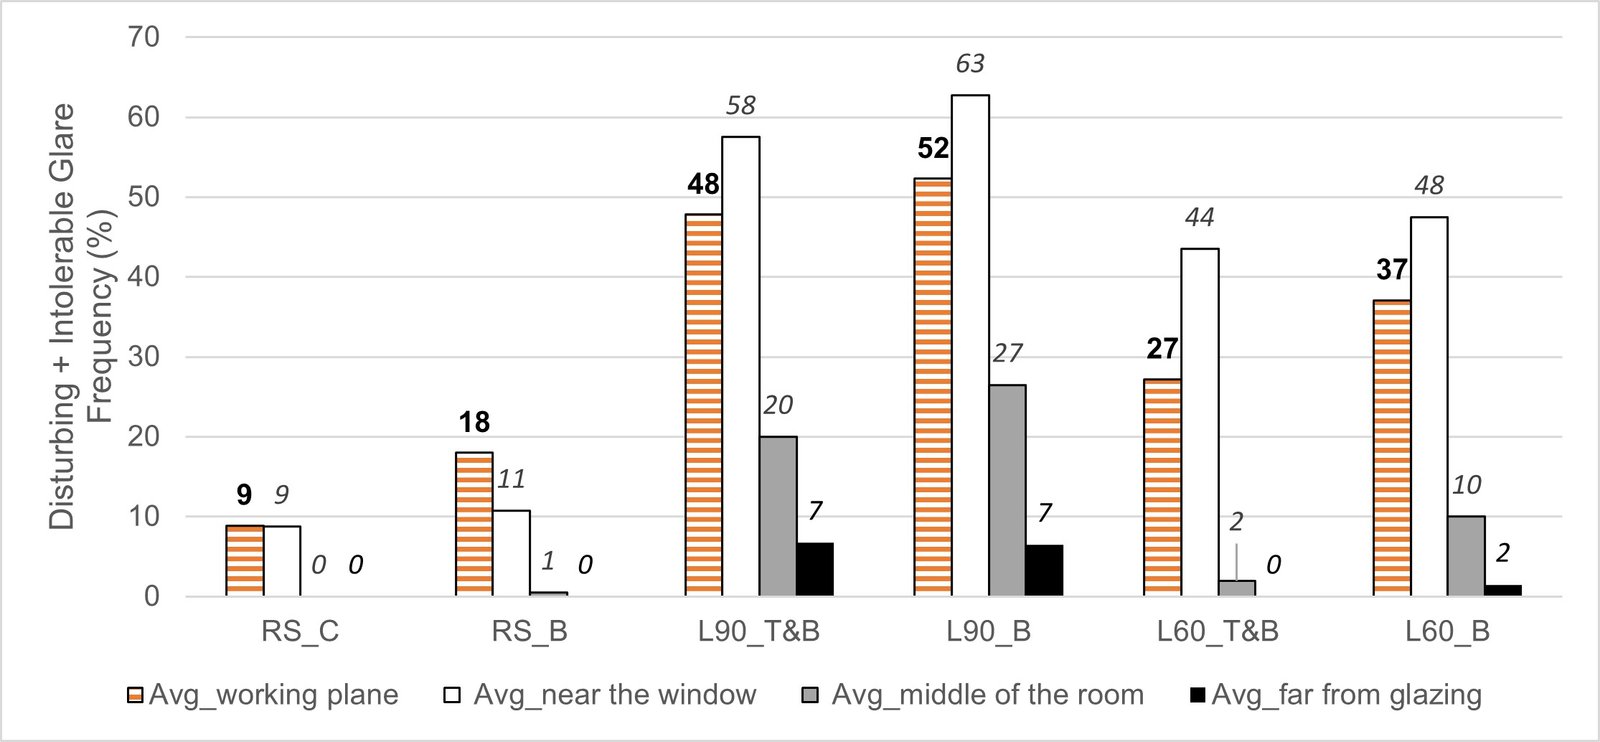
Fig. 11. Average (Avg) of the occupied hours with disturbing + intolerable glare for all views in the working plane and for the specific views grouped in the three line positions. RS: roller shade; L: louvres (followed by the angle of the slat rotation); C: shading always closed; B: shading covering only the bottom section of the façade; T&B: shading covering the top and bottom sections of the façade.
Table 4
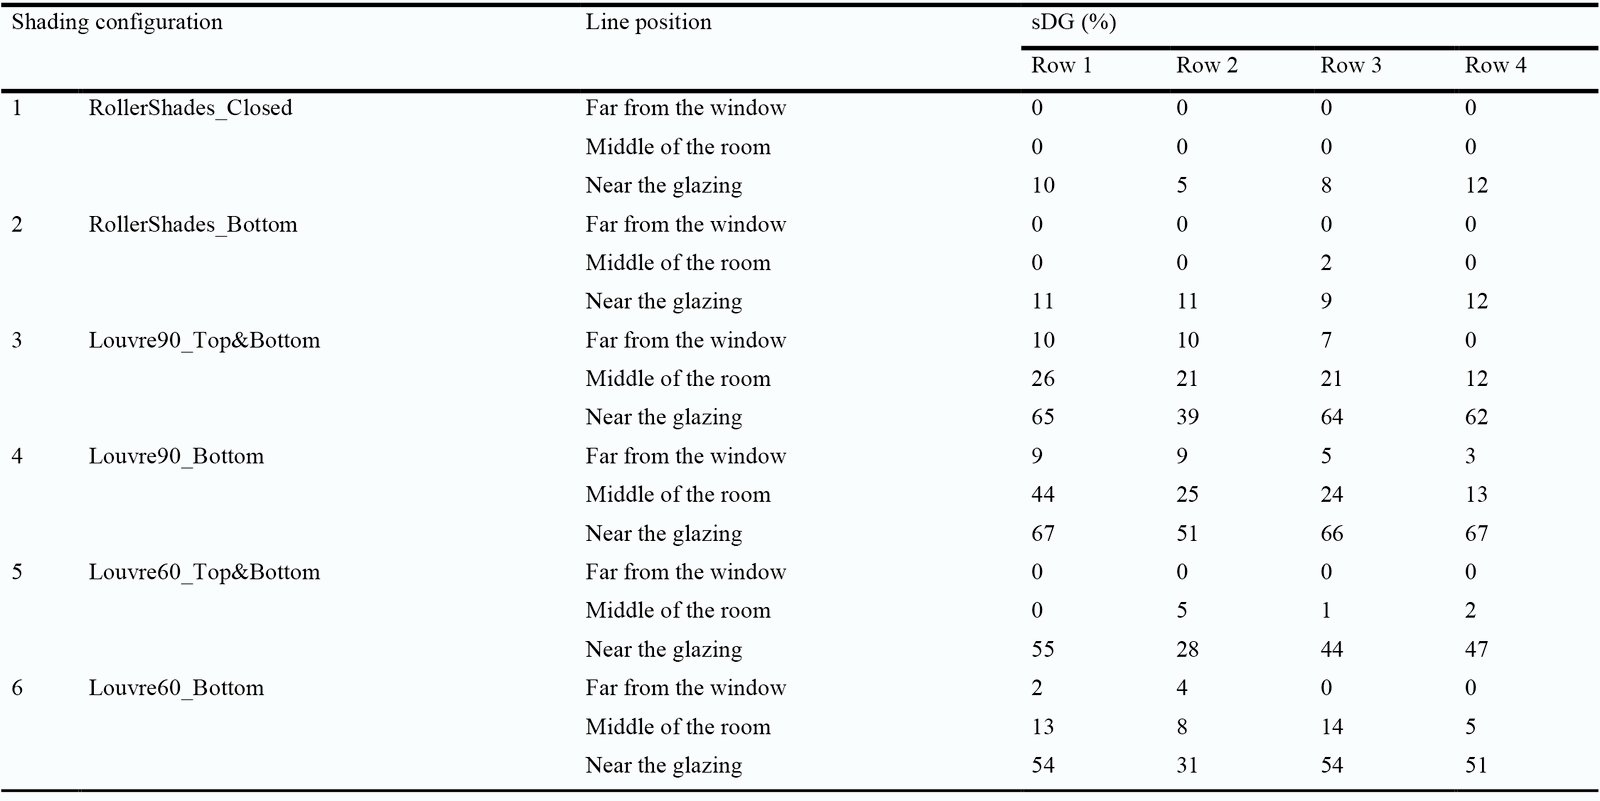
Table 4. Annual results for the specific observer views evaluated.
Figure 11 indicates that the different shadings contributed to increasing the daylight glare conditions, in comparison with the case study (RollerShades_closed, RS_C). The roller shade applied only in the bottom part of the façade increased the sDG up to 18%, followed by the louvres with a 60° rotated angle that got 27%. The highest sDG (52%) was attributed to the louvres with a 90° rotated angle applied only in the bottom part of the glazing. A similar trend was observed among the rows for which the % of disturbing + intolerable glare was also increased. The roller shade applied only in the bottom part of the façade was the shading system that reached the minimum increments of glare. Compared to the RS_C, the RS_B obtained 11% vs 9% in the line near the glazing, 1% vs 0% in the middle of the room, and 0% in the line far from the glazing. The other shading configurations significantly increased the DGP, particularly in the zone near the glazing.
Figure 12 depicts the DGP distribution over the working plane (plan views) and throughout the days of the year (temporal maps). Special attention is given to the percentages of disturbing plus intolerable glare. Hence, it is observed that the most affected observer views (slice pies) were those pointing toward the glazing façade whereas the rest of them are marked with imperceptible or perceptible glare (See the Zoom Detail in Fig. 12). Among the different shadings, the two options of the roller shades contributed to achieving the smallest areas of glare (disturbing plus intolerable), not only over the working plane but also throughout the year. The third best option was the louvre with 60° rotated slats covering the entire glazing façade.
Figure 12
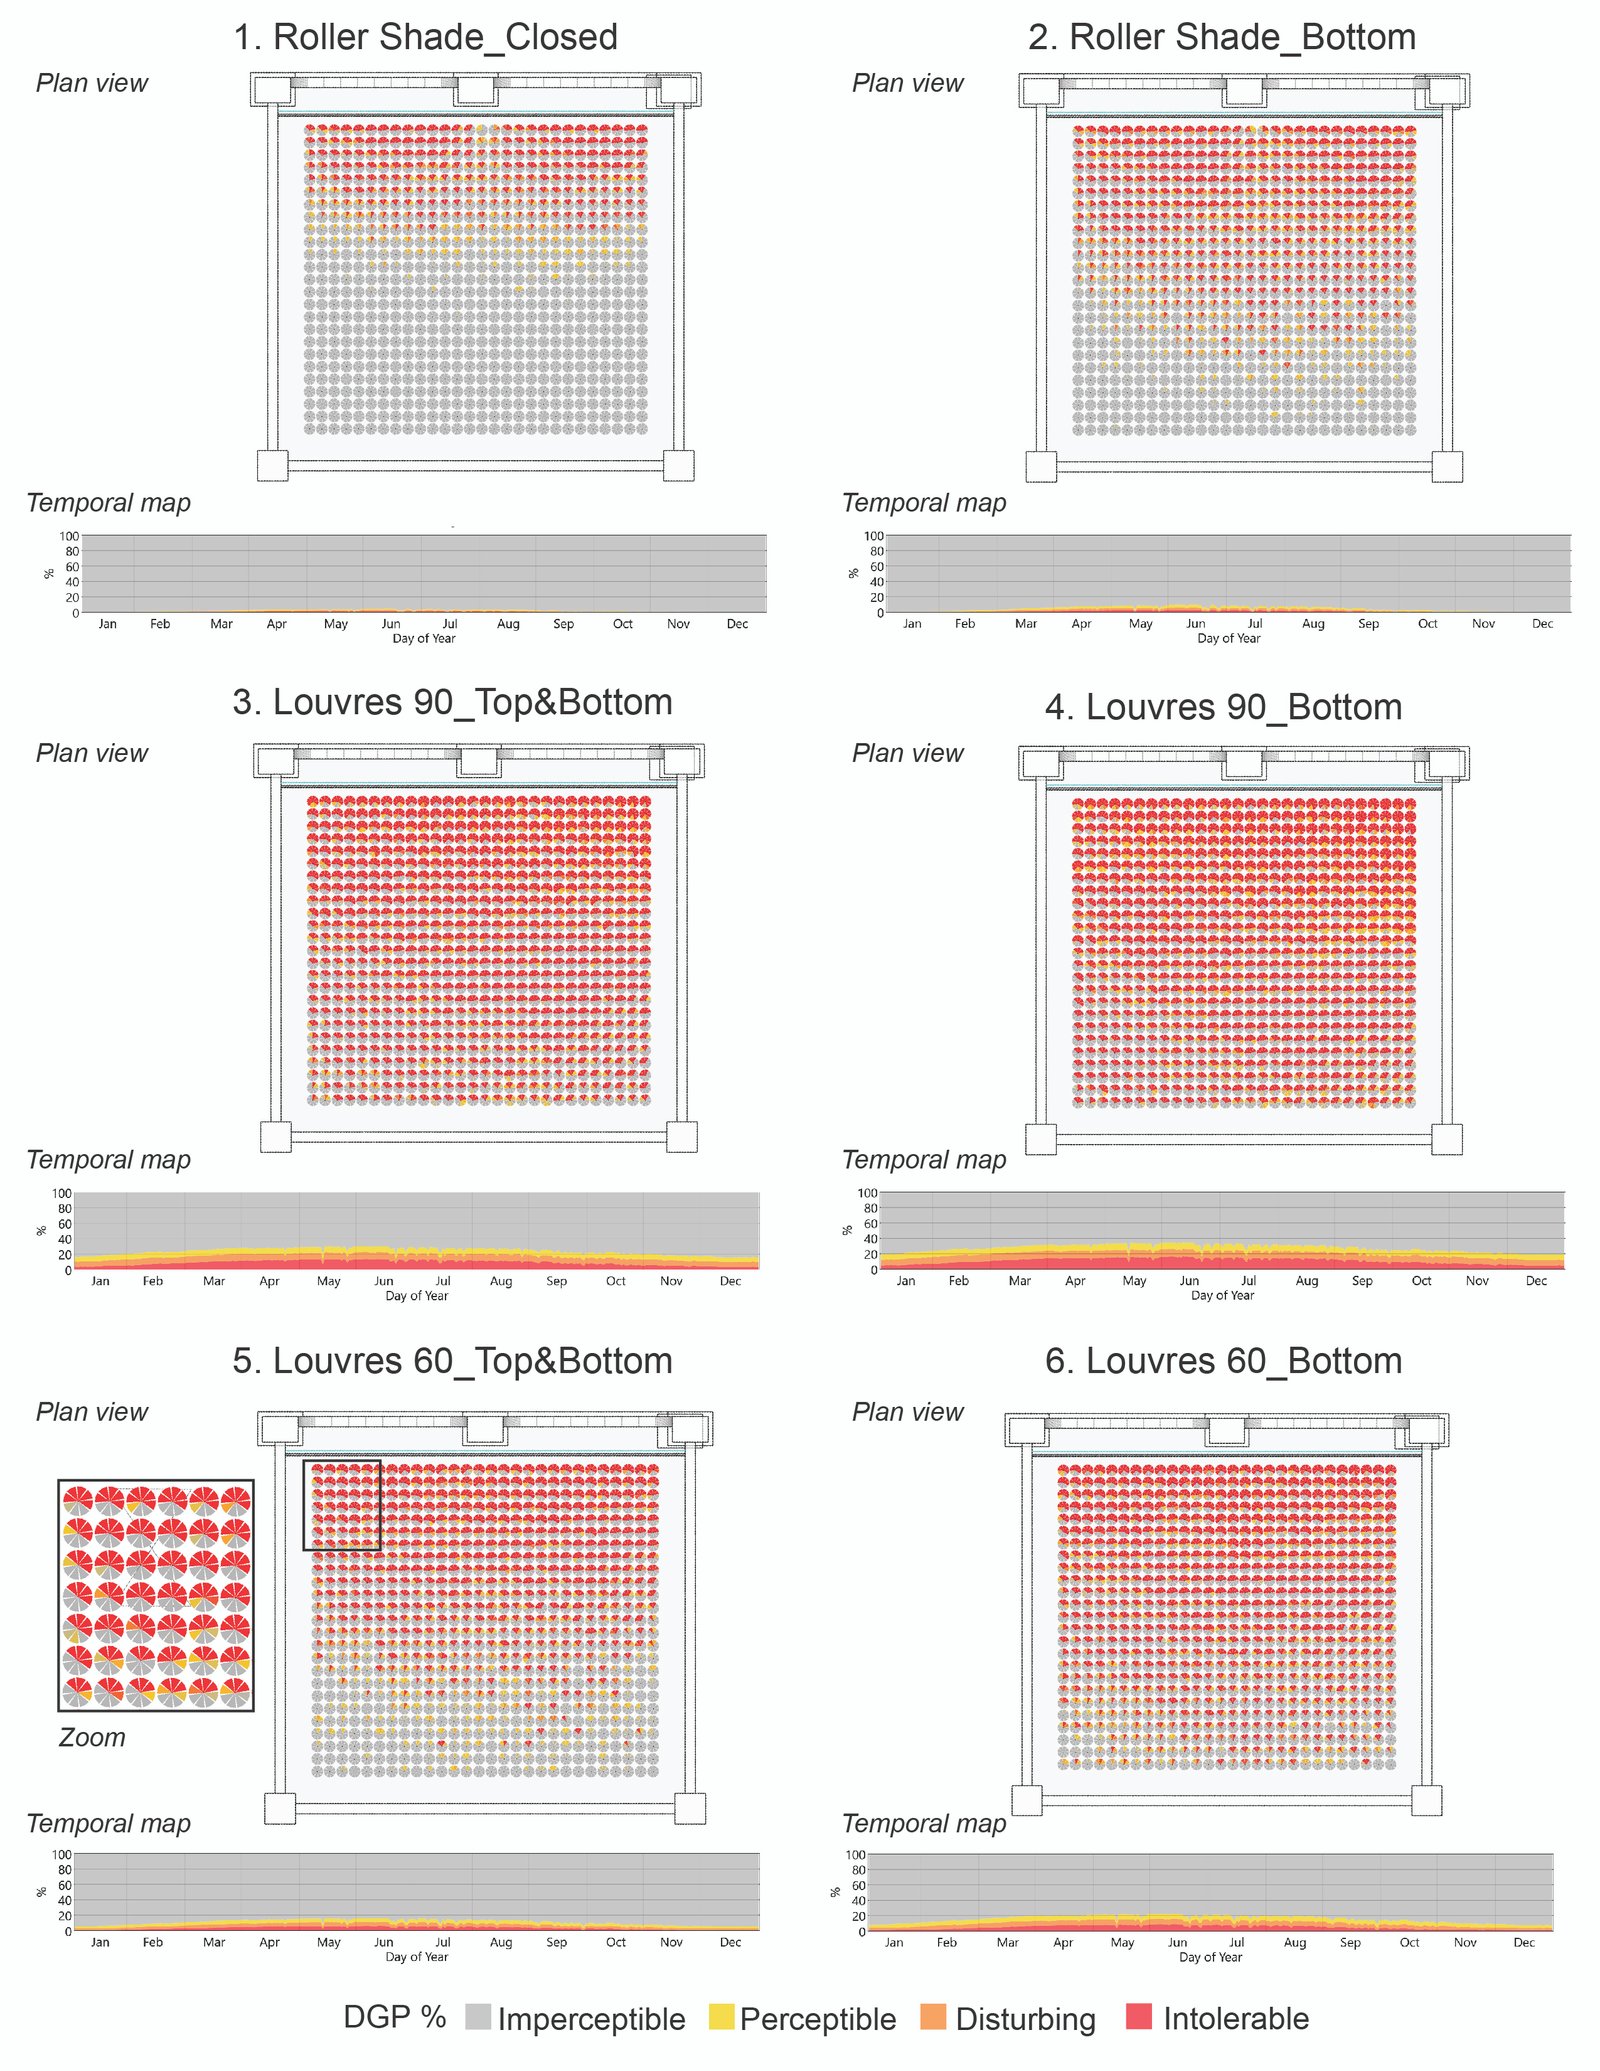
Fig. 12. DGP results over the working plane (plan view) and throughout the year (temporal map).
3.3. VF
Table 5 summarizes the average VF and the average distances, considering all view tag layers encountered after view rays passed the glazing façade. In this case, the VF with no shading device was also included as a reference point for further comparison. In addition to this, Table 6 includes the results for the specific sensors evaluated in the three lines studied: far from the glazing, in the middle of the room, and near the glazing (Refer to Fig. 1). It is then observed that the roller shade always closed did not account for views, similar to the roller shade with the clear top section that only achieved a VF of 2.29%. The louvre with the 90° rotated slats and the clear top section was the best suited to allow views outside (VF of 14.5%).
Table 5
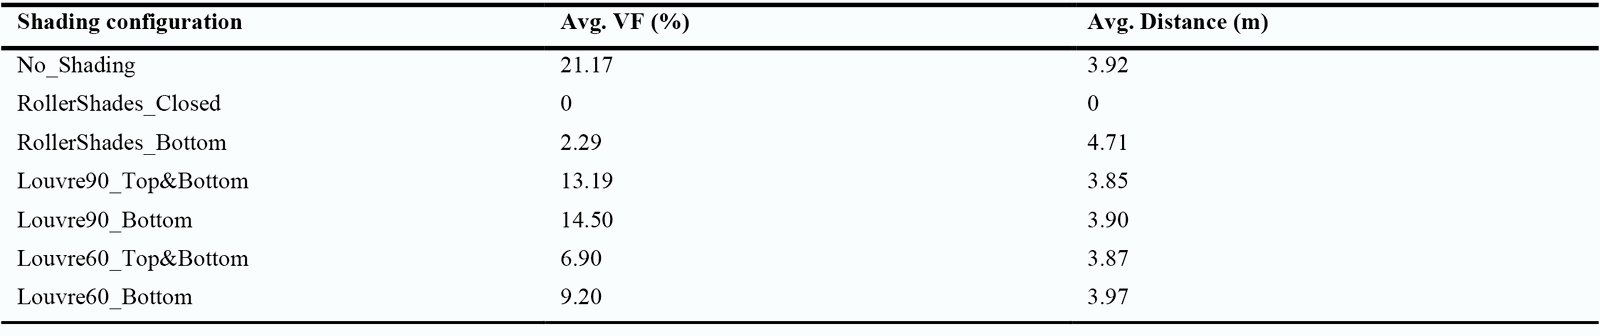
Table 5. View factors for all tags and layers in the model.
Table 6
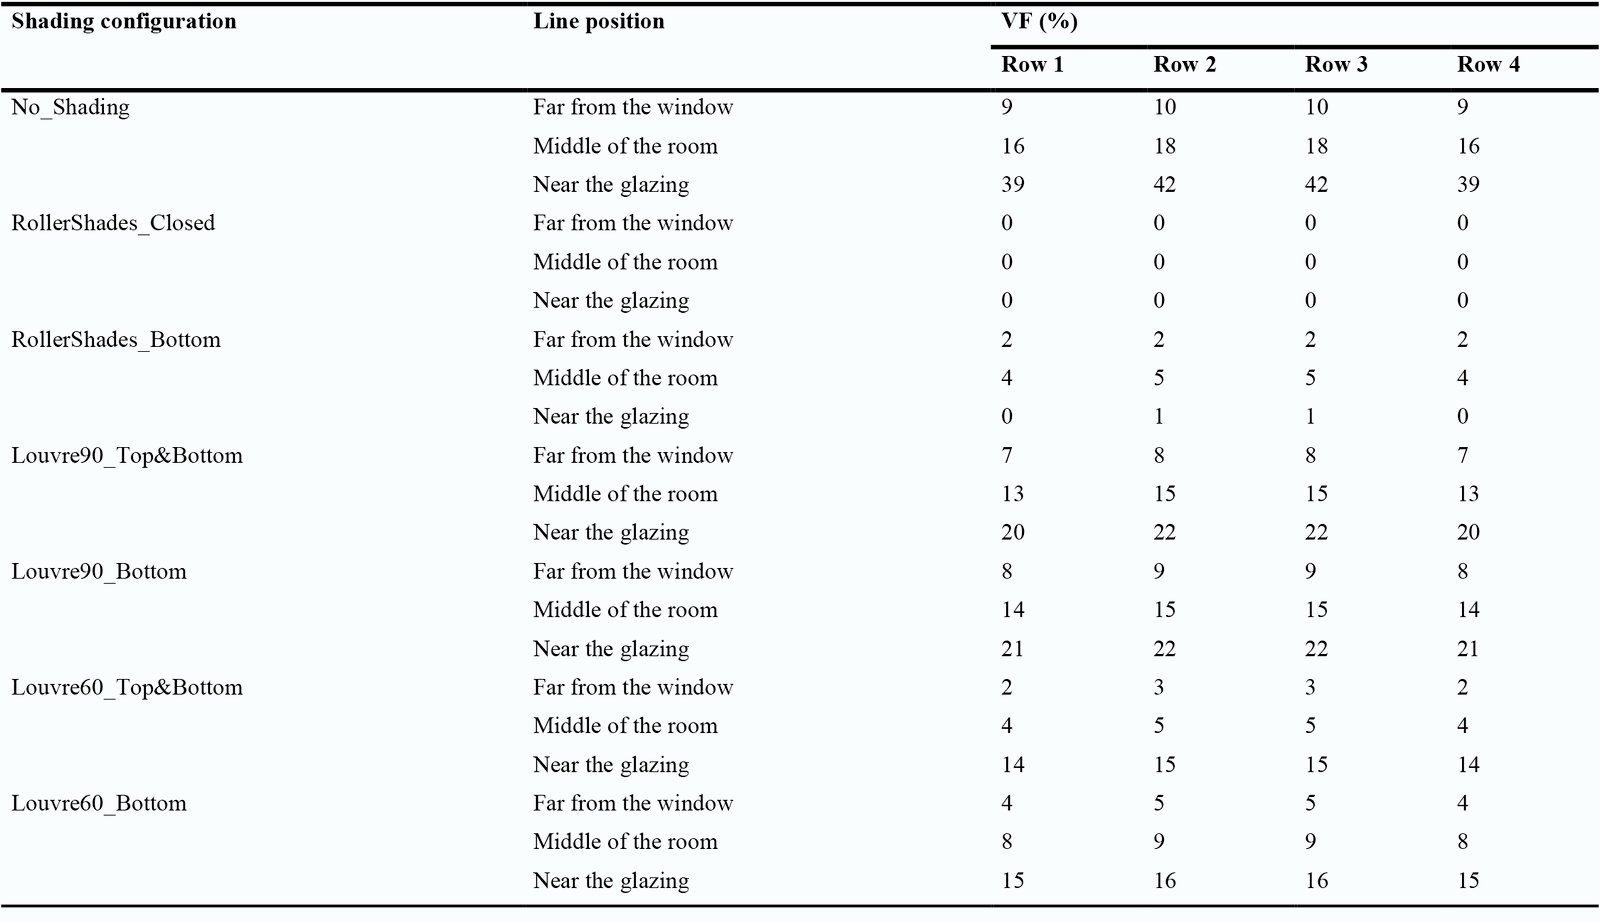
Table 6. Annual results for the specific sensors evaluated.
Figure 13 depicts that the sensor points in the line near the glazing achieved the highest VF whereas the occupancy positions far from the glazing obtained the lowest VF. Figure 14 depicts the VF over the working plane. Hence, it is confirmed that the louvres with the 90° rotated slats are the best options to allow occupant views. On the contrary, the roller shades are the least recommendable option.
Figure 13
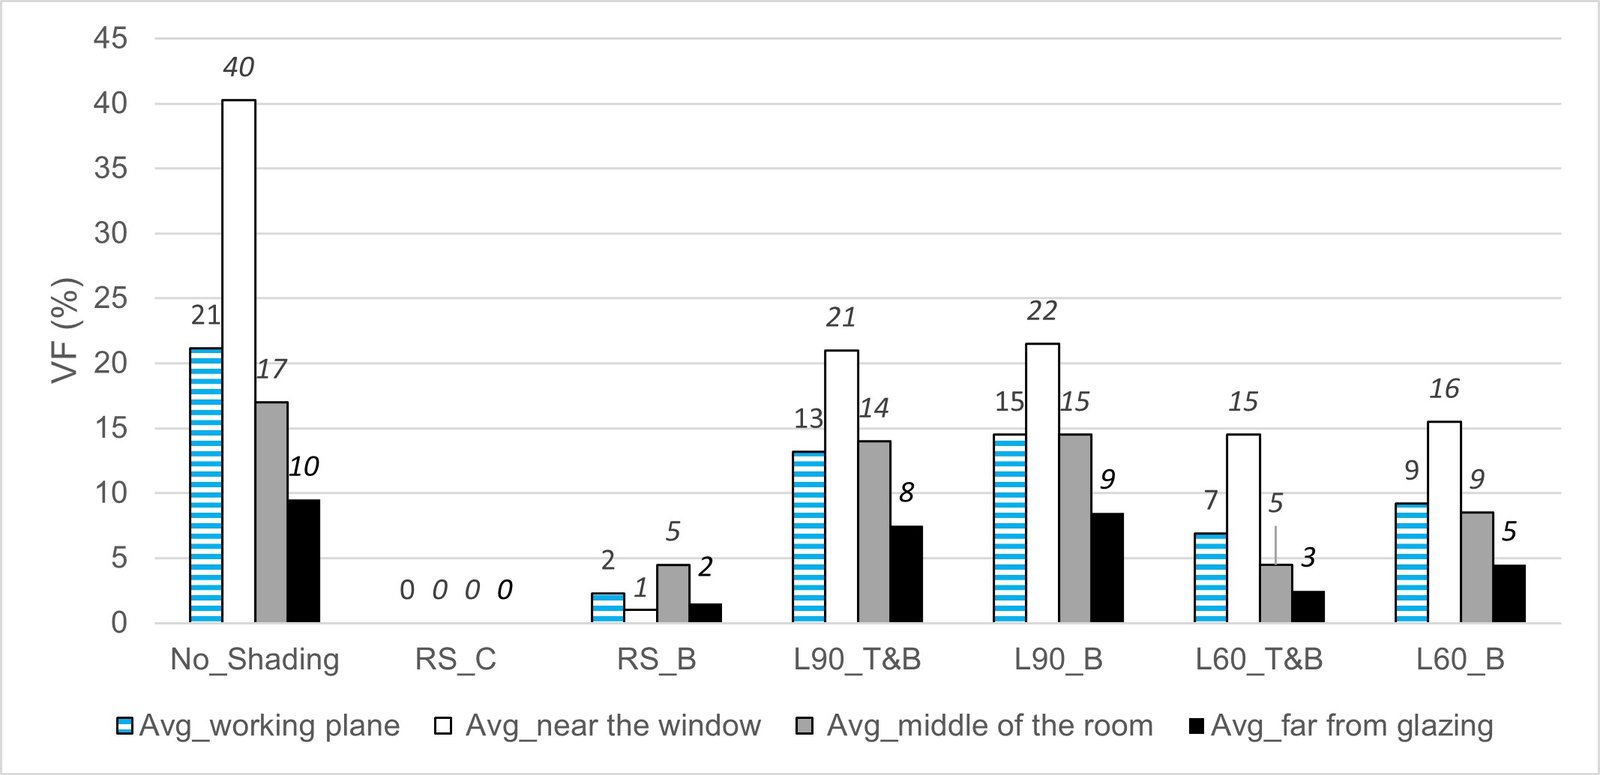
Fig. 13. Average (Avg) of the VF accounted for all positions in the working plane and for the specific positions grouped in the three lines. RS: roller shade; L: louvres (followed by the angle of the slat rotation); C: shading always closed; B: shading covering only the bottom section of the façade; T&B: shading covering the top and bottom sections of the façade.
Figure 14

Fig. 14. Plan view of the VF for every layer and tag in the model.
4. Discussion
This study analysed the results in two main ways: 1) the average over the working plane which is the metric most widely used and reported in the literature review, and 2) the mean of specific sensors distributed in three main lines to better analyse the daylight and visual performance near the glazing, in the middle of the room, and far from the glazing. The first way is useful because it is a simple statistical tool that summarizes the results in a single metric. However, the average value is usually affected by the highest and the lowest values. As we observed from the analysis here reported, the mean of the three lines presented significant differences, particularly when comparing the line near the glazing vs the line far from the glazing. It is then recommendable to use metrics that are less sensitive to extreme values. Therefore, this study complemented the average with other statistical metrics (such as the U metric and the temporal maps) to better understand the daylight distribution over the working plane and throughout the year.
Due to daylight variability, a shading device cannot be thoroughly assessed using single-moment simulations. It is then necessary to evaluate the annual daylight performance – condensed in this work with the metrics UDI and DGP. However, these metrics tend to sacrifice an understanding of the time-based performance variability in favour of retaining spatial performance variability [36]. To take the temporal variability of the shadings performance, this paper used temporal maps which are graphical formats that display data on a surface map whose axes represent the hours of the day and the days of the year [37]. Therefore, the results presented in this work can summarize the shadings' performance over space and over time.
The literature review showed that shadings are helpful to enhance the overall performance of buildings. Among the different devices, roller shades and louvres are two of the most widely used nowadays. However, it was observed that these types of shadings are usually applied to covering the entire windows and façades. Nevertheless, the rule of thumb that relates the window head height with the depth of daylight penetration was taken in this work as an analogous reference to play with the shade head height. Significant improvements in daylight provision and distribution were observed from the design modifications.
To sum up, roller shades performed better when they were applied covering only the bottom part of the glazing façade. It is then recommendable to let a clear top section at the top of the glazing system – 80 cm were left with no roller shade in this work. Since it is a design adjustment that will not require significant investments in existing buildings, building managers are encouraged to do so and architects are encouraged to specify these shadings by implementing the shade head height adjustment. Roller shades applied only in the bottom part of the glazing façade will significantly improve the daylighting conditions indoors by increasing the autonomous illuminances over the working plane and throughout the year. Besides, this shading was the option with the minimum increments of daylight glare conditions. In terms of VF, the simulations indicated that views were not allowed through roller shades. However, it is thought that they could allow views through the fabric (shapes, movement, perception of day-night differences) but not the sort of details. Future research on this topic and the acceptance/preference of views through roller shades by occupants will be interesting to study.
Louvres performed better when they were used to covering the entire glazing façade. This result is attributed to the top louvres’ capability of redirecting incoming light by reflection toward the ceiling and from there to the back of the room. As a consequence, louvres can increase daylighting levels at the back of the room while getting higher levels of uniformity. Furthermore, the glare conditions had no substantial differences when applying or not the louvres at the top section of the glazing. Of the two louvres options, the one with the 60° rotated angles got the lower levels of disturbing plus intolerable glare. However, the louvres with the 90° rotated slats were the best suited to allow views outside.
4. Conclusions
This paper presented a comparative study of several shading configurations in terms of their annual and spatial effectiveness in providing autonomous daylight levels, reducing daylight glare problems, and offering views outside. Simple design adjustments were applied to typical roller shades and louvres to evaluate if they could improve the buildings’ performance. The shade-head height was reduced by 80 cm, leading to the top of the window being clear. This strategy was analogous to the rule of thumb that relates the window head height with the depth of daylight penetration.
Interesting findings were derived. Regarding the UDI-a metric, the roller shades performed better when they were applied letting the top of the window being clear. On the contrary, louvres performed better when they covered the entire glazing façade. This last performance is attributed to the louvres capability of redirecting incoming light to the back of the room. In addition to the highest UDI-a performance over the working plane and throughout the year, the roller shades got the highest levels of U, so they can be considered the best choice in terms of daylight distribution.
Regarding the DGP results, the roller shades were the best choice to reduce glare problems, particularly near the glazing. However, the roller shades were the worst option to allow views outside. Although the simulation did not account for views through the fabric, it is thought that roller shades can actually allow views but not the sort of details. Future research can explore this interesting issue – the acceptance/preference of occupants’ views through fabrics.
It is concluded that a simple design adjustment can make a significant difference in the daylight and visual performance of spaces. Building managers and architects are encouraged to design/specify the use of roller shades leaving the top section of the glazing with no shading. As regards the louvres, it is recommendable to continue specifying them by covering the entire glazing façades. Here, it is important to consider that louvres with the 60° rotated slats performed better in terms of UDI-a and DGP metrics. However, they got VF values slightly lower than the louvres with the 90° rotated slats.
This design solution can be replicated in the other seven classrooms at the first level (classrooms with the same orientation, function, and area) and in other similar spaces in the second and third levels of the studied library. That solution can also be implemented to retrofit other educational buildings, not only in the university studied but in other institutions structured in similar conditions and latitudes. Since the use of roller shades and louvres is a common practice in educational buildings, the design adjustment here explored can be considered a viable and potentially effective solution to improve the daylighting conditions indoors.
Future research should further explore other shadings and redirecting systems and their effect on daylight provision, glare prevention, and views outside. Other rules of thumb can be studied to test if they can improve buildings' performance when planning appropriate shading strategies in the initial design process of buildings. Furthermore, other study domains such as energy efficiency, thermal comfort, and energy cost savings in a building can be affected by this type of design adjustment. Research currently ongoing is exploring these shading implications.
Acknowledgment
The authors acknowledge the support of Universidad de las Americas Puebla and CONACYT.
Declaration of competing interest
The authors declare no conflict of interest.
References
- EC (European Commission), Directive 2010/31/EU on Energy Performance of Buildings. Brussels: EC, 2010.
- F. Nicoletti, C. Carpino, M.A. Cucumo, N. Arcuri, The control of venetian blinds: A solution for reduction of energy consumption preserving visual comfort, Energies 13 (7), (2020) 1731. https://doi.org/10.3390/en13071731
- D. Uribe, S. Vera, W. Bustamante, A. McNeil, G. Flamant, Impact of different control strategies of perforated curved louvers on the visual comfort and energy consumption of office buildings in different climates, Solar Energy 190, (2019) 495-510. https://doi.org/10.1016/j.solener.2019.07.027
- L. Giovannini, F. Favoino, V.R.M. Lo Verso, A. Pellegrino, V. Serra, A simplified approach for the annual and spatial evaluation of the comfort classes of daylight glare using vertical illuminances, Buildings 8 (12), (2018) 171. https://doi.org/10.3390/buildings8120171
- G. Kim, H.S. Lim, Predicted performance of shading devices for healthy visual environment, Indoor and Built Environment 19, (2010) 486-496. https://doi.org/10.1177/1420326X10376440
- T.E. Kuhn, State of the art of advanced solar control devices for buildings, Solar Energy 154, (2017) 112-133. https://doi.org/10.1016/j.solener.2016.12.044
- A. Kirimtat, B. Koyunbaba, I. Chatzikonstantinou, S. Sariyildiz, Review of simulation modeling for shading devices in buildings, Renewable and Sustainable Energy Reviews 53, (2016) 23-49. https://doi.org/10.1016/j.rser.2015.08.020
- H. Simmler, B. Binder, Experimental and numerical determination of the total solar energy transmittance of glazing with venetian blind shading, Building and Environment 43 (2), (2008) 197-204. https://doi.org/10.1016/j.buildenv.2006.10.011
- A. Tzempelikos, A.K. Athienitis, The impact of shading design and control on building cooling and lighting demand, Solar Energy 81 (3), (2007) 369-382. https://doi.org/10.1016/j.solener.2006.06.015
- E.S. Lee, A. Tavil, Energy and visual comfort performance of electrochromic windows with overhangs, Building and Environment 42 (6), (2005) 2439-2449. https://doi.org/10.1016/j.buildenv.2006.04.016
- P. Tsikra, E. Andreou, Investigation of the Energy Saving Potential in Existing School Buildings in Greece. The role of Shading and Daylight Strategies in Visual Comfort and Energy Saving, Procedia Environment Sciences 38, (2017) 204-211. https://doi.org/10.1016/j.proenv.2017.03.107
- K.S. Lee, K.J. Han, J.W. Lee, The impact of shading type and azimuth orientation on the daylighting in a classroom-focusing on effectiveness of façade shading, comparing the results of DA and UDI, Energies 10 (5), (2017) 635. https://doi.org/10.3390/en10050635
- A.Y. Freewan, Impact of external shading devices on thermal and daylighting performance of offices in hot climate regions., Solar Energy 102, (2014) 14-30. https://doi.org/10.1016/j.solener.2014.01.009
- A. Montaser Koohsari, S. Heidari, Subdivided venetian blind control strategies considering visual satisfaction of occupants, daylight metrics, and energy analyses, Energy and Buildings 257, (2022) 111767. https://doi.org/10.1016/j.enbuild.2021.111767
- A.I. Palmero-Marrero, A.C. Oliveira, Effect of louver shading devices on building energy requirements, Applied Energy 87 (6), (2010) 2040-2049. https://doi.org/10.1016/j.apenergy.2009.11.020
- A.K.K. Lau, E. Salleh, C.H. Lim, M.Y. Sulaiman, Potential of shading devices and glazing configurations on cooling energy savings for high-rise office buildings in hot-humid climates: The case of Malaysia, International Journal of Sustainable Built Environment 5(2), (2016) 387-399. https://doi.org/10.1016/j.ijsbe.2016.04.004
- J.H. Kim, Y.J. Park, M.S. Yero, K.W. Kim, An experimental study on the environmental performance of the automated blind in summer, Building and Environment 44 (7), (2009) 1517-1527. https://doi.org/10.1016/j.buildenv.2008.08.006
- F. Haldi, D. Robinson, Adaptive actions on shading devices in response to local visual stimuli, Journal of Building Performance Simulation 3 (2), (2010) 135-153. https://doi.org/10.1080/19401490903580759
- T. Moore, D. J. Carter, A. I. Slater, Long-term patterns of use of occupant controlled office lighting, Lighting Research and Technology 35 (1), pp. 43-57, 2003. https://doi.org/10.1191/1477153503li061oa
- D.W. Kim, C.S. Park, Comparative control strategies of exterior and interior blind systems, Lighting Research and Technology 44 (3), (2012) 291-308. https://doi.org/10.1177/1477153511433996
- S.A. Sadeghi, P. Karava, I. Konstantzos, A. Tzempelikos, Occupant interactions with shading and lighting systems using di erent control interfaces: A pilot field study, Building and Environment 97, (2016) 177-195. https://doi.org/10.1016/j.buildenv.2015.12.008
- C. Reinhart, K. Voss, Monitoring manual control of electric lighting and blinds, Lighting Research and Technology 35 (3), (2003) 243-258. https://doi.org/10.1191/1365782803li064oa
- A. Guillemin, S. Molteni, An energy-efficient controller for shading devices self-adapting to the user wishes, Building and Environment 37, (2002) 1091-1097. https://doi.org/10.1016/S0360-1323(01)00113-5
- L.G. Bakker, E.C.M. Hoes-van, R.C.G.M. Loonen, J.L.M. Hensen, User satisfaction and interaction with automated dynamic facades: a pilot study, Building and Environment 78, (2014) 44-52. https://doi.org/10.1016/j.buildenv.2014.04.007
- C. F. Reinhart, A simulation-based review of the ubiquitous window-head-height to daylit zone depth rule-of-thumb, in: International Building Performance Simulation Association (IBPSA), 2005, pp. 1011-1018, Montreal, Canada.
- M. Andersen, J. de Boer, Goniophotometry and assessment of bidirectional photometric properties of complex fenestration systems, Energy and Buildings 38 (7), (2006) 836-848. https://doi.org/10.1016/j.enbuild.2006.03.009
- USGBC (United States Green Building Council), Daylight - Indoor Environmental Quality., LEED Reference guide for building design and construction. Version 4. Accessed: Jun. 10, 2024. [Online]. Available: https://www.usgbc.org/credits/new-construction-schools-new-construction-retail-new-construction-data-centers-new-9
- International WELL Building Institute, Daylight Modelling, Explore the Standard - Feature 62. Accessed: Jun. 10, 2024, Online Available: https://standard.wellcertified.com/light/daylight-modeling.
- Education Funding Agency (EFA), EFA daylight design guide Departmental advice, London, Jan. 2014. Accessed: Jun. 10, 2024. [Online]. Available: https://assets.publishing.service.gov.uk/media/5a7dc925e5274a5eaea66529/EFA_Daylight_design_guide.pdf
- Building Research Establishment Environmental Assessment Method (BREEAM), Hea 01 Visual comfort (all buildings), London, 2016. Accessed: Jun. 10, 2024. [Online]. Available: chrome-extension://efaidnbmnnnibpcajpcglclefindmkaj/https://www.sgbc.se/app/uploads/2021/12/Bilaga-Hea-01-remissversion.pdf
- A. Nabil, J. Mardaljevic, Useful daylight illuminances: A replacement for daylight factors, Energy and Buildings 38 (7), (2006) 905-913, 2006. https://doi.org/10.1016/j.enbuild.2006.03.013
- C. Reinhart, J. Mardaljevic, Z. Rogers, Dynamic daylight performance metrics for sustainable building design, Leukos 3, (1), (2006) 7-31. https://doi.org/10.1582/LEUKOS.2006.03.01.001
- P.M. Esquivias, D. Moreno, J. Navarro, Solar radiation entering through openings: Coupled assessment of luminous and thermal aspects, Energy and Buildings 175, (2018) 208-218. https://doi.org/10.1016/j.enbuild.2018.07.021
- J. Wienold, J. Christoffersen, Evaluation methods and development of a new glare predicton model for daylight environments with the use of ccd cameras, Energy and Building 38 (7), (2006) 743-757. https://doi.org/10.1016/j.enbuild.2006.03.017
- Solemma LLC, ClimateStudio User Guide, Accessed: Oct. 13, 2021. [Online]. Available: https://climatestudiodocs.com/index.html
- S. Kleindienst, M. Bodart, M. Andersen, Graphical display for annual climate-based daylight simulation, in: Proceedings of eSim 2008-5th National Conference of IBPSA, 2008, pp. 1-8, Quebec, Canada. https://doi.org/10.1080/15502724.2008.10747628
- J. Mardaljevic, Precision modeling of parametrically defining solar shading systems: Pseudo-Changi, in: 8th IBPSA Conference Proceedings, 2003, pp. 823-830, Eindhoven, Netherlands.
Copyright © 2024 The Author(s). Published by solarlits.com.

3372
Total views
Citations
SHARE ON


