Volume 11 Issue 2 pp. 203-215 • doi: 10.15627/jd.2024.15
Energy efficiency in smart schools using renewable energy strategy
Mohammad Tahir Zamani,a Ali Ahmad Amiri∗,b
Author affiliations
a Department of Architecture and City Design, King Fahd University of Petroleum & Minerals, Dhahran 31261, Saudi Arabia
b Department of Mechanical Engineering, King Fahd University of Petroleum & Minerals, Dhahran 31261, Saudi Arabia
*Corresponding author.
tahir1zamani@gmail.com (M. T. Zamani)
amiri163@yahoo.com (A. A. Amiri)
History: Received 15 April 2024 | Revised 25 June 2024 | Accepted 9 June 2024 | Published online 3 August 2024
Copyright: © 2024 The Author(s). Published by solarlits.com. This is an open access article under the CC BY license (http://creativecommons.org/licenses/by/4.0/).
Citation: Mohammad Tahir Zamani, Ali Ahmad Amiri, Energy efficiency in smart schools using renewable energy strategy, Journal of Daylighting 11 (2024) 203-215. https://dx.doi.org/10.15627/jd.2024.15
Figures and tables
Abstract
As smart schools increasingly rely on technology, achieving energy efficiency becomes crucial for cost reduction and sustainability. This study investigates energy efficiency strategies in smart schools, focusing on the integration of renewable energy technologies. A quantitative approach using numerical simulations and literature reviews establishes benchmarks for energy-efficient smart schools. The Design Builder software is employed to evaluate system performance, with validation achieved through analysis in the System Advisor Model software. The modeled smart school building in Design Builder consumes 75,385.63 kWh annually, based on the weather conditions of specific location. Further studies indicate that integrating photovoltaics and hot water collectors can generate approximately 86,635 kWh annually. This not only offsets the energy consumption of building but also produces an excess of 11,249 kWh, which can be transferred back to the grid for additional revenue. Validation using SAM software demonstrated a minimal difference (3.2%) in annual energy outputs, confirming the accuracy of the model. The findings suggest that photovoltaics and hot water collectors can significantly contribute to achieving net-zero energy consumption in smart school buildings. Additionally, a focus on rooftop installations promotes sustainability by minimizing land use.
Keywords
Energy efficiency, Renewable energy sources, Photovoltaic, Hot water collectors
Nomenclature
| Kingdom of Saudi Arabia | KSA |
| Direct normal irradiance | DNI |
| Air conditioning | AC |
| Smart school | SS |
| Heating, ventilation, and air conditioning | HVAC |
| Renewable energy sources | RES |
| Photovoltaic | PV |
| Hot water collectors | HWC |
| Typical meteorological year | TMY |
| Light emitting diode | LED |
| System Advisor Model | SAM |
| Design Builder | DB |
| Alternating current | AC |
| Direct current | DC |
| Solar hour angle | ωs |
| Sunset hour angle | ϕ |
| Declination of the earth | δ |
| Extraterrestrial radiation | E0 |
| Solar constant | Gsc |
| Global solar radiation | Hg |
| Diffuse solar radiation | Hd |
| Effective solar radiation | Rb |
| Beam radiation on the surface of the PV | HT |
| Ground reflectance factor | ρ |
| Output power of the PV | PPV |
| Rated power capacity of the PV | CpPV |
| Solar irradiance under standard test conditions | Ir STC |
| Actual solar irradiance | Ir |
| Derate factor | DPV |
| Temperature coefficient of power | αp |
| Actual cell temperature | TC |
| Cell temperature under standard test conditions | T(c,STC) |
| Standard test conditions | STC |
| Maximum power point | MPP |
| Module temperature | Tm |
| Surface area of the PV | APV |
| Surrounding air temperature | Ta |
| Solar radiation on the PV | E |
| Wind speed | Ws |
| Thermal resistance of the PV | α |
| Amount of solar radiation reflected back from the PV | IRC |
| Albedo coefficient | αa |
| Global horizontal irradiance | IGH |
1. Introduction
According to the Saudi Arabia Energy Report, the Kingdom of Saudi Arabia (KSA) ranks among the leading countries in per capita energy consumption and carbon dioxide emissions [1]. Due to its hot and arid desert climate, the KSA experiences high direct normal irradiance (DNI) ranging from 4 to 8 kWh/m² per day [2]. Air conditioning (AC) alone accounts for 70% of the total energy consumption in buildings [3]. Overall, buildings in the KSA consume a substantial amount of energy for lighting, heating, cooling, and air conditioning [4]. Furthermore, in recent years, there has been a surge in the adoption of smart institutions, with a significant emphasis on energy efficiency as a cornerstone of their design and operation [5,6]. The concept of a smart school (SS) revolves around the seamless integration of technology into every facet of the educational experience. Unlike conventional schools, SSs incorporate advanced technologies and tools within classrooms, providing students with enhanced and more impactful educational experiences [7]. David Perkins, in his book "Smart Schools: From Training Memories to Educating Minds," characterizes SSs as institutions that recognize and seize opportunities for improving teaching and learning [8].
The growing reliance on technology in SSs necessitates prioritizing energy efficiency to minimize operational costs and environmental impact [9]. Prior research has explored diverse strategies for achieving this goal [10-12]. The studies energy-efficient SS offer a significant leap forward, not only in environmental sustainability but also in educational innovation. Compared to traditional schools, these campuses boast nearly 20% lower electricity consumption, reducing dependence on fossil fuels like oil and coal [13,14]. This translates to lower emissions and less waste in landfills [13]. Consequently, many countries are making significant strides toward establishing and developing renewable energy sources to foster a transition to economies with lower CO2 emissions, thereby mitigating climate risks, protecting the environment, and promoting the efficient use of available resources [15]. For instance, although Saudi Arabia is one of the leading oil exporters in the world, the country has made notable investments in renewable energy to diversify its economy [16]. By instituting energy efficiency initiatives, organizations can significantly reduce energy consumption, resulting in substantial cost savings and a diminished carbon footprint. Moreover, the integration of renewable energy technologies facilitates localized electricity generation, ensuring a reliable and sustainable energy source [17].
SSs leverage various technologies to automate building systems like heating, ventilation, and air conditioning (HVAC), lighting, and security. These technologies are included sensors, controllers, and microchips that are collecting and managing data, empowering management to optimize energy consumption, space utilization, and environmental impact [18,19]. Advanced controls adjust heating, lighting, and cooling based on occupancy and weather, leading to significant reductions in energy use documented in research [20-23]. Their integrated heating, ventilation, and air conditioning systems, along with control systems, are often simpler to maintain, requiring less specialized skills [24]. Furthermore, by consuming less energy and using resources responsibly throughout their lifespan, net-zero schools demonstrate long-term fiscal responsibility [25,26]. This shift towards energy-efficient schools holds promise for global educational challenges. However, an increasing number of schools recognize that smart energy decisions benefit students, communities, and the environment.
Furthermore, beyond initiatives such as water conservation and leveraging renewable energy sources (RES) for backup power generation, energy-efficient schools embrace passive cooling and heating strategies. For instance, daylighting is a strategy used to infuse classrooms with natural illumination, thereby reducing electricity consumption. Studies suggest a potential correlation between daylighting in classrooms and improvements in student attendance and academic performance [27]. By offering healthier learning environments, energy-efficient schools serve as living laboratories, educating school staff, students, and the broader community about the imperative of energy conservation. Energy efficiency is a pivotal element in the design and operation of SSs. Leveraging intelligent building systems, RESs, and energy-efficient equipment and appliances can substantially reduce energy consumption, operating costs, and environmental impact [22,28]. Various strategies can be employed to enhance energy efficiency in SSs and curtail energy consumption. Upgrading lighting systems is a prime example; many institutions, like McGillis’, have already initiated the transition to light emitting diode (LED) lighting [20]. LEDs not only have a lifespan up to fifty times longer than traditional lighting but also consume 90% less power, resulting in over 25% savings on electricity costs [22]. Furthermore, McGillis’ sustainability efforts extend to stringent recycling practices and a focus on local draft beers over bottled or imported options. The timing of the summer upgrade could not be better, as LEDs emit significantly less heat, aiding in reducing peak electrical consumption during the warmer months when air conditioning is in high demand [29].
Optimizing HVAC systems is crucial for smart schools as they are a major source of energy consumption [18]. Programmable thermostats with occupancy sensors and energy management systems significantly reduce wasted energy by enabling precise temperature control and informed decision-making [30-33]. Furthermore, RES like rooftop solar and windmills offer a dual benefit of balancing power consumption and reducing energy costs. Solar energy is particularly significant, applicable for both water heating and electricity generation in regions with abundant sunlight. Photovoltaic (PV) solar panels can be strategically installed on rooftops, skylights, or building facades, integrating seamlessly into the building design [34-36]. In particular, Saudi Arabia has made strides in reducing its reliance on oil for electricity production by incorporating natural gas and renewable energy sources. The potential for solar energy production in the KSA is high and evenly distributed, ranking sixth globally [37]. As the largest country in the Middle East, Saudi Arabia boasts substantial solar energy resources [38].
The growing population of Saudi Arabia fuels demand for new schools, straining energy resources, particularly in the capital of the country (Riyadh). This surge in educational infrastructure exacerbates the energy consumption challenges of nation, with significant ecological and social impacts. Recognizing economic and ecological viability of solar power, Saudi Arabia is incorporating renewable energy sources into school infrastructure. These efforts include integrating renewable energy alongside comprehensive energy reduction initiatives. This case study, conducted in the hot climate of Saudi Arabia, highlights the importance of RES for both energy savings and occupant satisfaction. It underscores to designers and architects the importance of prioritizing user comfort and minimizing energy consumption as fundamental sustainability principles. A design process grounded in sustainability principles not only reduces costs over the lifespan of buildings but also fosters the broader green and sustainable development of cities and buildings.
2. Methodology
This study presents a model of a simulated school building located in Riyadh, Saudi Arabia. A city with exceptionally high solar energy potential, Riyadh offers a prime location to explore the benefits of integrating RES in SSs. This study uniquely analyzes the feasibility and performance of a combined PV and HWC system for a school building in this specific climate. By promoting clean energy access and potentially reducing reliance on conventional energy sources, this approach can contribute to a more sustainable future for schools in Saudi Arabia. The simulated model is designed to evaluate energy efficiency and performance by integrating renewable energy sources, specifically PV panels and hot water collectors (HWC). The simulation aims to analyze energy usage patterns, assess the feasibility of installing solar panels, and examine the financial implications of energy generation from RES. Using a parametric simulation approach conducted in Design Builder software (DB) and System Advisor Model (SAM), the study analyzes key aspects of energy efficiency and performance in SSs. The focus is on clean energy access, occupant satisfaction, and power consumption. Design factors include PV and HWC sizing and electricity production calculations to optimize the use of naturally available energy. The study is structured into three distinct phases as described in Fig. 1.
Figure 1
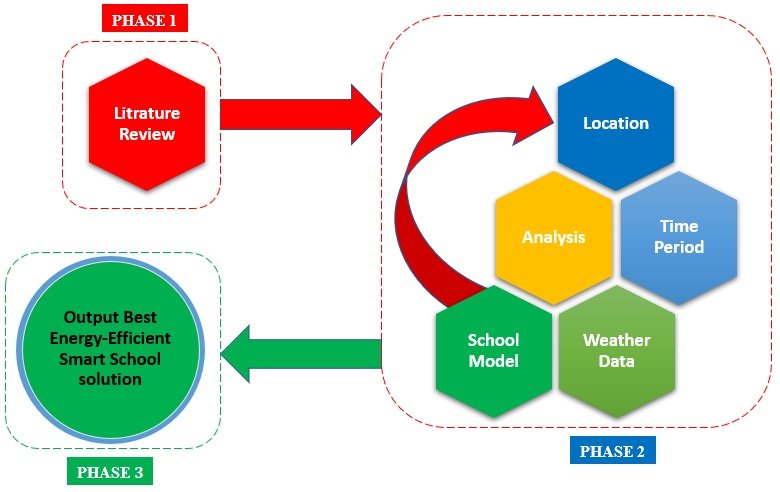
Fig. 1. Methodological framework of the study.
The designed SS accommodate 100 students, this model incorporates PV integration, utilizing a designated roof area totaling 232.5 m² (see Fig. 2(a)), strategically positioned to face the sun for optimal solar exposure as depicted in Fig. 2(b). The solar hour angle (ωs), which refers to the deviation between solar noon and local solar time, is given by the following equation [39]:
where ωs denotes the sunset hour angle, is the latitude of Riyadh, and is the declination of the earth, which represents the tilt of the earth axis relative to its orbit around the sun and varies between −23.45° and 23.45° throughout the year and can be calculated using the following equation [40]
Figure 2
![Parametric geometry and climatic conditions of the studied building: A) 3D model in DB, B) Sun path orientation on march 21, C) School building sectional perspective, D) Geological location of the school, E) hourly DNI in Riyadh, and F) hourly temperature in Riyadh [44].](figures/11-203-2.jpg)
Fig. 2. Parametric geometry and climatic conditions of the studied building: A) 3D model in DB, B) Sun path orientation on march 21, C) School building sectional perspective, D) Geological location of the school, E) hourly DNI in Riyadh, and F) hourly temperature in Riyadh [44].
In the declination angle equation, n represents the day of the year, which shifts between 1 (January 1) and 365 (December 31). In this work, the PV panels are elevated 10 cm above the roof surface to promote airflow and accommodate hot water piping for the HWC system, see Fig. 2(c). The building's dimensions are carefully considered, with a ground floor height of 3.5 meters and a pitched roof elevated to 4.5 meters. This elevation achieves an optimal tilt angle of 24.7 degrees, enhancing the efficiency of PV orientation. Situated at 24.7136° N, 46.6753° E in Riyadh (Fig. 2(d)) [41], the location reflects a desert-like climate [42], characterized by abundant solar radiation (Fig. 2(e)) and consistently high temperatures throughout the year (Fig. 2(f)), reinforcing the significance of renewable energy integration in such environments. Methodological data, including time period, location, and school features, are gathered and applied to a 3D model of the school in both DB and SAM. The precise location of the school, determined using the European Commission's "Photovoltaic Geographical Information System" website, with an elevation of 634 meters above sea level. The study period spans from January, 2023, to December, 2023, with weather data sourced from the European Commission's typical meteorological year (TMY) file in (epw) format and integrated into the simulation software [43]. A re-simulation process loop is assumed to achieve an optimal net-zero-energy solution.
3. Simulated smart school building electricity: pre and post PV installation
To mitigate both environmental impact and service costs, harnessing free energy sources year-round becomes imperative. One such abundant and eco-friendly source is natural sunlight, which can be converted into electricity through the installation of PV solar panels [45,46]. This transformation ensures the generation of clean energy without harming the environment. Consequently, the school opted to incorporate solar panels as an alternative energy solution. Before adopting solar energy, careful consideration must be given to optimizing space utilization. Maximizing land usage while preserving valuable urban areas is paramount. Hence, the rooftop of the school emerged as the prime location for solar panel installation (see Fig. 3), offering ample exposure to sunlight year-round.
Figure 3
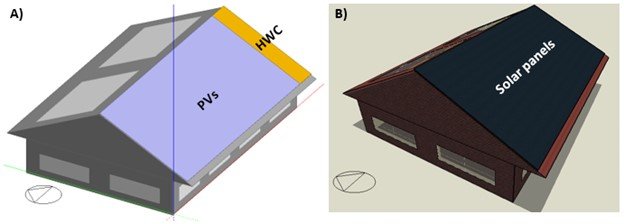
Fig. 3. Roof with integrated PV and HWC: A) Modeling stage, B) Realistic model after rendering.
The amount of incoming solar energy over the analyzed PV panels is the primary measure of solar energy production, determined by the volume of solar gain received. The solar radiation received on a plane normal to the sun radiation at the top of the earth atmosphere, known as extraterrestrial radiation (E0), is determined by the following equation [39].
where GSC is the solar constant (approximately 1367 W/m²) and n is the day of the year. However, to determine the beam radiation on the surface of the PV panels, the following equation is used [47]:
where Hg represents global solar radiation on a horizontal surface, Hddenotes diffuse solar radiation, Rb is effective solar radiation on the tilted surface [10], and ρ is the ground reflectance factor. For locations in the Northern Hemisphere sloped towards the Equator, Rb is calculated as [48]:
Various factors influence the energy production of a panel, including weather conditions, exterior orientation, PV panel direction, and tilt angle [49]. Additionally, the location of the PV panels, situated on the sloping side of the roof, ensures continuous sunlight exposure throughout the year. As depicted in Fig. 3, the area of the sloping roof exposed to daytime solar radiation is 232.5 m², with 200 m² designated for PV installation and 20 m² for HWC. The PV module generates DC electricity from sunlight, and the output power of the PV module can be measured using the following equation [50]:
where PPV is the output power of the PV module, CpPV is the rated power capacity of the PV module, DPV is the derate factor accounting for system inefficiencies, Ir is the actual solar irradiance received by the module, IrSTC is the solar irradiance under standard test conditions (1 kW/m²), \alpha_p is the temperature coefficient of power, TC is the actual cell temperature, and Tc,STC is the cell temperature under standard test conditions (25 °C). Standard test conditions (STC) for calculating PV yield are 1 kW/m² of irradiation and a 25 °C cell temperature with no wind. However, actual conditions often exceed 25 °C, affecting PV performance. PV efficiency (ղSTC), which refers to the ability of PV arrays to convert sunlight into DC electric power, can be calculated at maximum power point (MPP) under STC using the following equation [48]:
where APV stands for the surface area of the PV module (m²). To quantify the effect of higher temperature on the PV, the module temperature (Tm) can be modeled using the following equation [51]:
The PV module temperature Tm represents the temperature of the PV module in degrees Celsius, while ambient temperature (Ta) denotes the surrounding air temperature in degrees Celsius. stands for solar radiation on the PV module measured in watts per square meter (W/m²). Coefficients e_a and binfluence Tm: ea relates to the impact of solar radiation on temperature, and b affects temperature changes relative to wind speed Ws in meters per second (m/s). α defines the thermal resistance of the PV module. These factors collectively determine how temperature variations, influenced by ambient conditions and solar exposure, affect the operational efficiency of PV panels throughout different seasons and environmental conditions. Furthermore, solar irradiance reflected from the surface of PV modules is a significant factor contributing to energy losses in photovoltaic systems. The equation to quantify this is [52].
Here, represents the amount of solar radiation reflected back from the PV module surface, measured in watts per square meter (W/m²). The albedo coefficient (αa) determines the fraction of incident solar radiation that is reflected. The tilt angle of the PV collector (\(\sum C\)) influences the angular dependence of reflected irradiance. IGH, or the measured global horizontal irradiance, serves as the input parameter for estimating the total incident solar radiation on a horizontal surface. Together, these factors provide a comprehensive understanding of how reflected irradiance impacts the overall efficiency and energy yield of PV systems. These equations and parameters are crucial for accurately determining the energy output and efficiency of the PV system. Factors such as the derate factor and temperature variations must be considered to ensure realistic performance assessments of PV installations. A simulation was conducted to assess the feasibility of this endeavor, and the specifications of the simulated model are outlined in Table 1.
Table 1
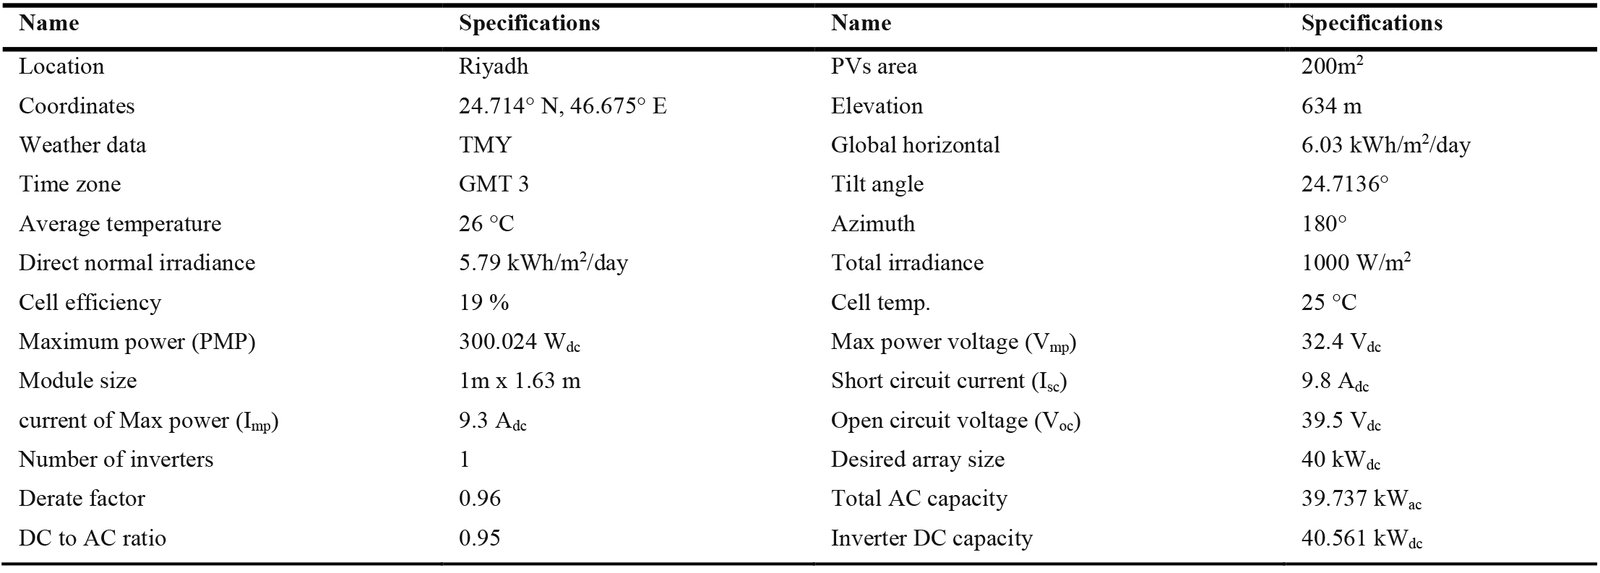
Table 1. Specifications for simulated photovoltaic system.
Initially, an assessment was made to determine the proportion of electricity sourced from fossil fuels for the school. The initial evaluation, based on the simulation in DB, revealed that the annual electricity demand for the school is 75,386 kWh (as shown in Fig. 4). This figure indeed represents the electricity consumption for the whole year, the figure depicts the simulation results for electricity demand prior to the installation of PVs in blue, and hourly electricity generated by PVs in orange. After simulating the installation of a 40 kWdC PV system, it was found that the PV panels could generate 74,294 kWh of electricity per year. The results indicate that the electricity demand reaches its peak (38 kWh or approximately 440 kWh/day) in the months of May, June, July, August, and September during the middle hours of the day. This peak is primarily due to the extensive usage of HVAC systems for space cooling. However, during the early and late hours of the day, electricity demand decreased significantly, reflecting reduced usage of HVAC systems and other operational and service-related electricity consumption.
Figure 4
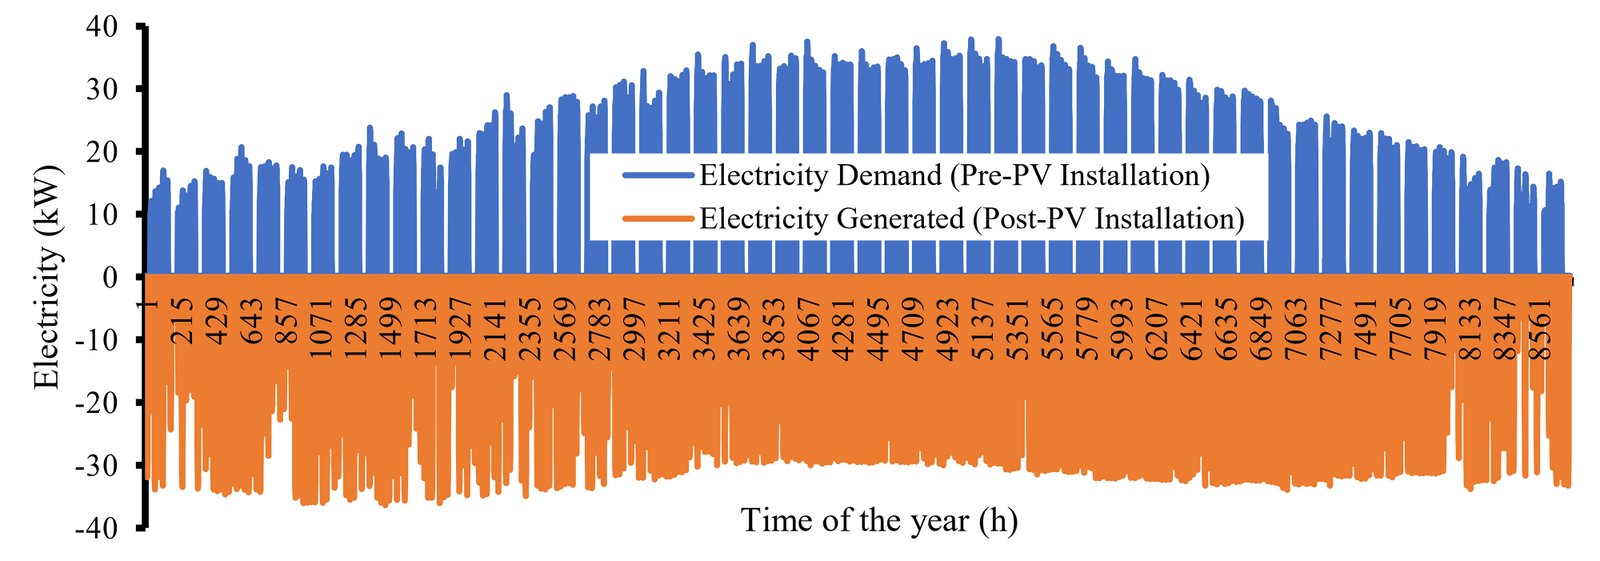
Fig. 3. Hourly energy demand and electricity generated by PVs throughout the year.
Additionally, in Fig. 5, the electricity demand of the building is depicted by the red columns and red graph line, while electricity generated from RES is represented in green. The graph highlights that during the months of May, June, July, August, and September, the energy demand overlaps with the power generated by RES or PVs. Given the very hot weather in KSA, air conditioning systems, which consume a high amount of electricity, are necessary [53]. The designed PV systems cannot fully satisfy this increased demand, requiring more power to be drawn from the utility grid during these months. Conversely, during the months of January, February, March, April, October, November, and December, the lower electricity demand for building operations and services results in a surplus of generated energy. This suggests that the surplus electricity generated during these months can be transferred to the utility grid, effectively compensating for the high electricity demand during the summer season.
Figure 5
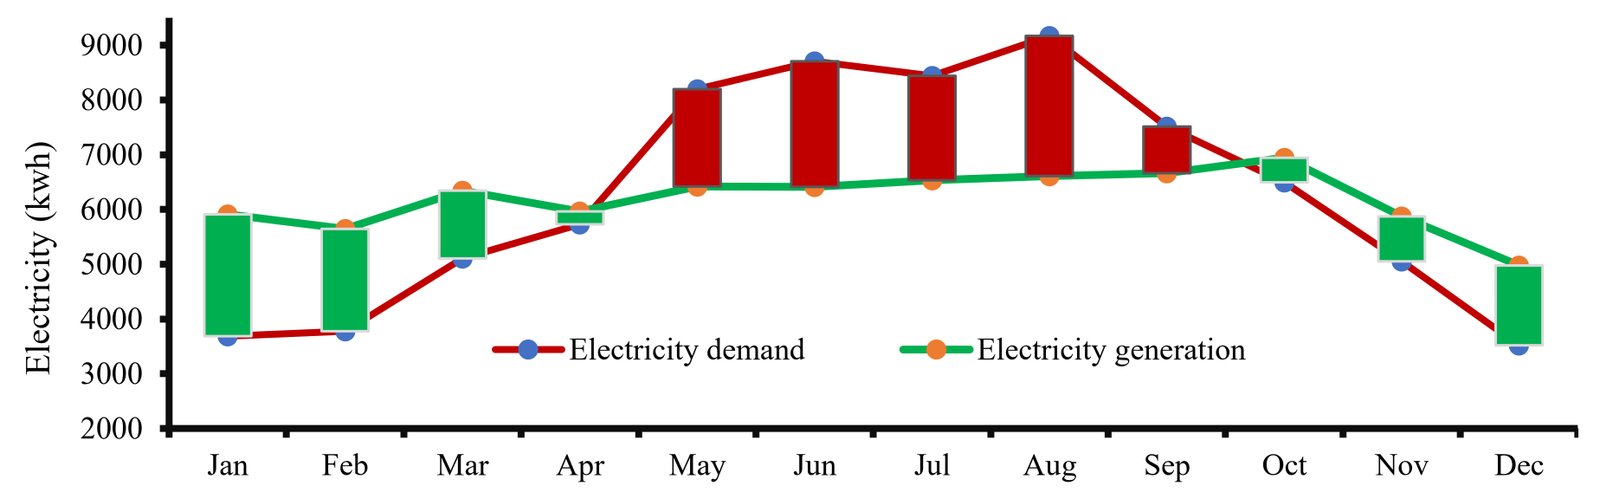
Fig. 5. Monthly electricity demand of the building and electricity generated from RES.
Figure 6 illustrates the annual PV energy generation in kW throughout the year, represented as a heat map. The x-axis represents the days of the year, from 1 to 365, while the y-axis represents the hours of the day, from 0 to 24. The color gradient indicates the amount of energy generated, with darker colors (blue to light blue) representing lower energy generation and brighter colors (yellow to red, and white) representing higher energy generation. The figure shows that PV energy generation is generally higher during the middle hours of the day (10 AM to 4 PM), indicated by the yellow to red areas. This pattern is consistent throughout the year, reflecting the availability of sunlight during daytime hours. However, during the summer months, the efficiency of PV panels decreases due to higher temperatures, which can reduce output efficiency by 10-25%, as indicated by the relatively lower energy generation even during peak sunlight hours [54]. Conversely, during cooler months, PVs operate more efficiently, resulting in higher energy generation.
Figure 6
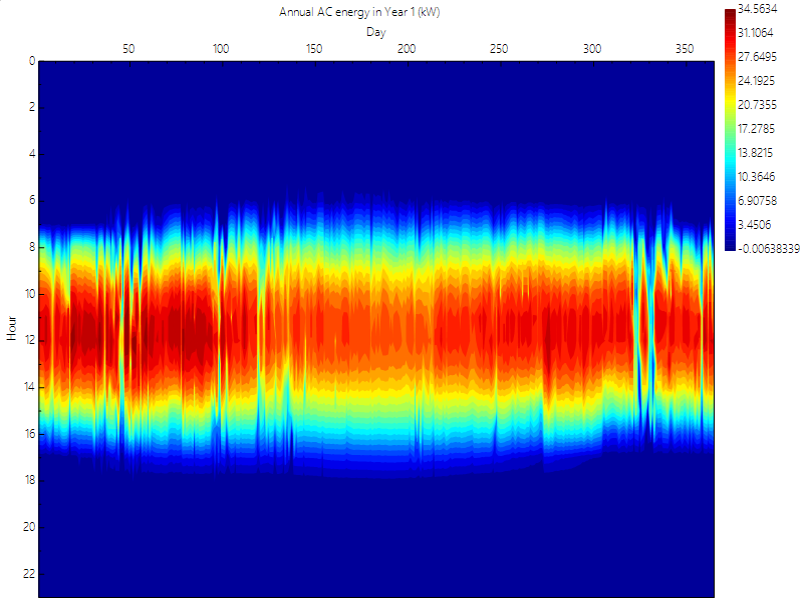
Fig. 6. Heat map illustrating annual power production of PVs.
4. Improving smart school building energy with hot water collectors
Improving the energy efficiency of SS buildings can also be achieved through the use of HWC. These collectors, which can be powered by electricity, gas, or solar energy, are typically installed on the rooftops of SS buildings, where the tank reservoir is situated (see Fig. 7). Solar-powered water heaters are particularly efficient as they harness the abundant, cost-free energy of the sun, while emitting zero greenhouse gases. To optimize efficiency, central water heating systems should be strategically located near high-water usage areas such as showers and changing rooms, minimizing heat loss from water traveling long distances through pipes. The implementation of a heater timer allows school management to regulate hot water usage effectively.
Figure 7
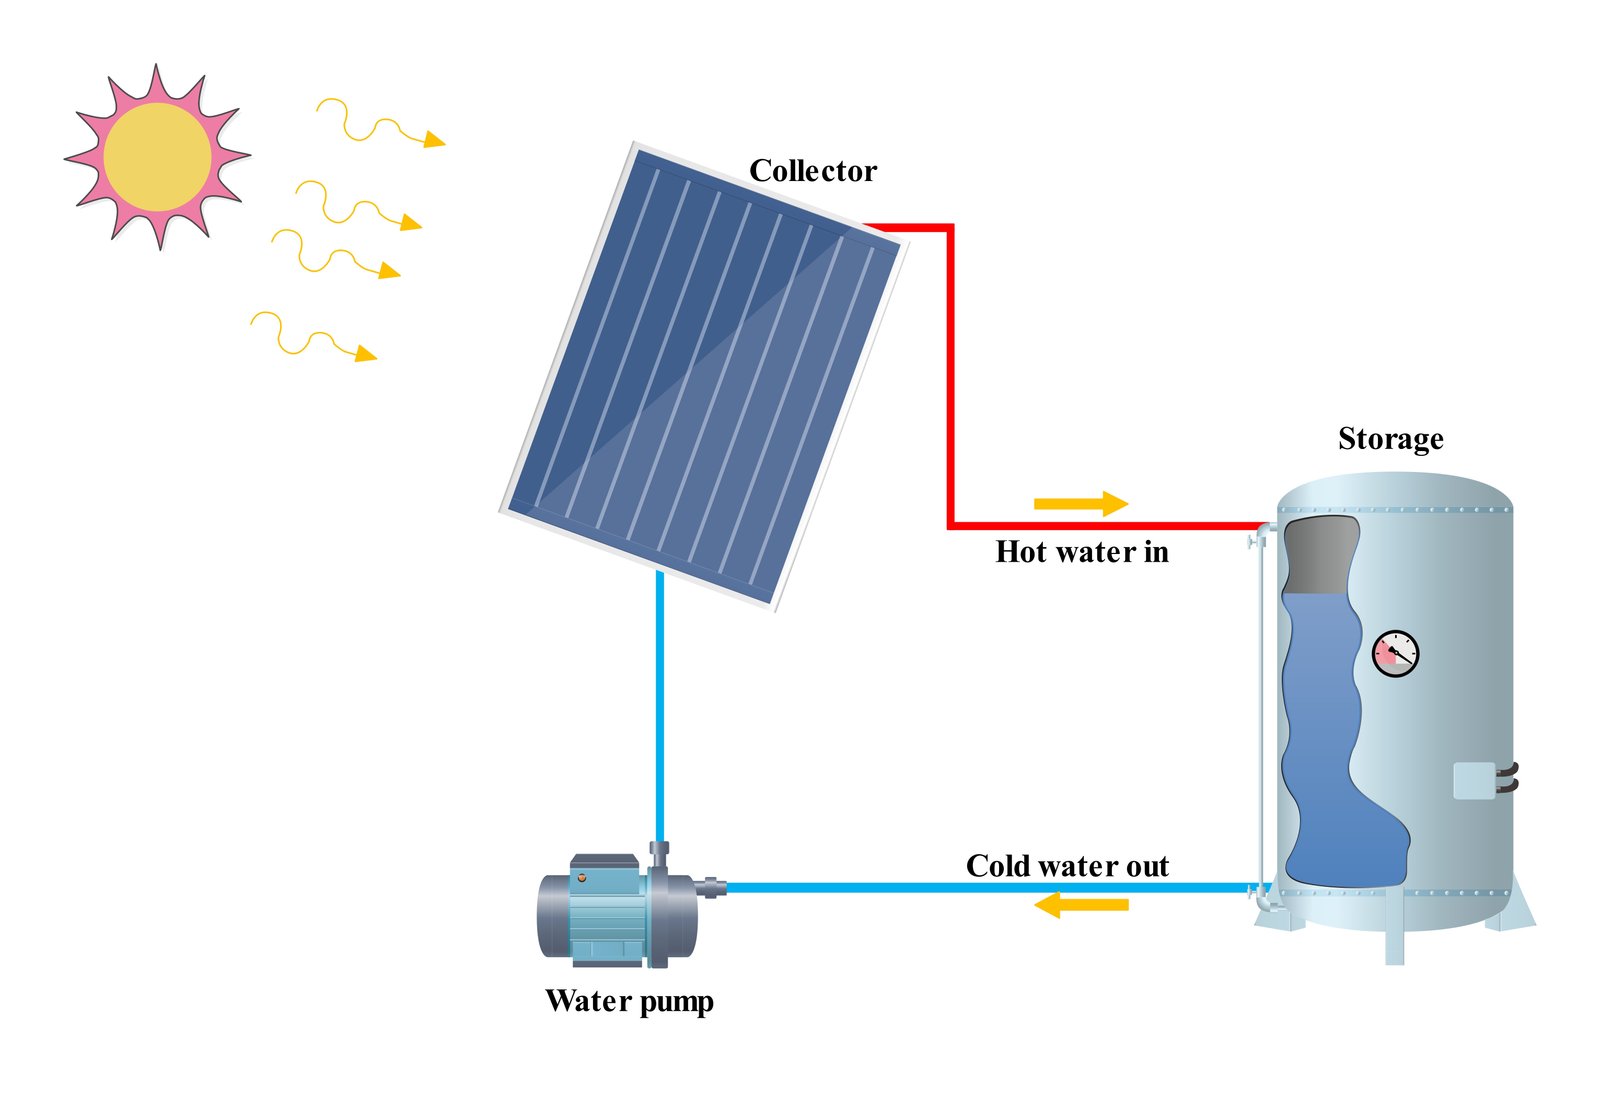
Fig. 7. Schematic of solar hot water collector system.
For the primary school discussed earlier, designed for 100 students, calculating the hot water requirements is crucial. The daily consumption of hot water per student, typically averaging around 15 liters, is essential for various purposes including ablution and kitchen use [55,56]. Despite a recommendation of 18 liters per primary school student per day [57], it is important to consider the actual daily needs of the students. Accordingly, the total hot water requirement for 100 students is calculated to be 1800 liters per day. This water, heated by the HWC, is stored in a 2 m³ hot water tank. The properties of the HWC model are listed in Table 2.
Table 2
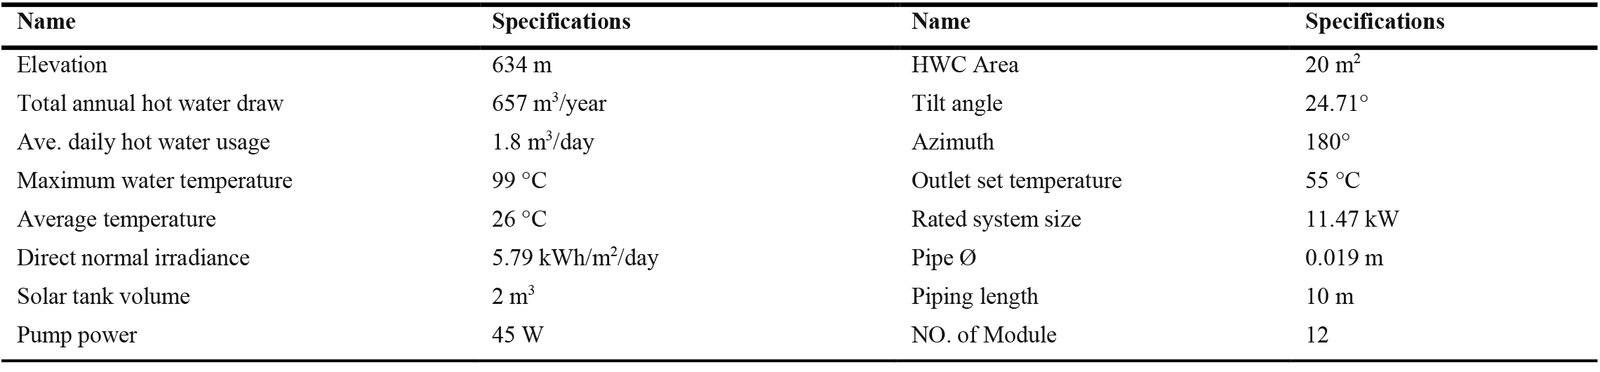
Table 2. Specification of simulated hot water collector system.
Figure 8 showcases the annual hot water production capacity of the HWC system. In this analysis, the HWC directly heats water to fulfill the entire demand of school, eliminating the need for electricity-powered water heating systems. The results clearly demonstrate that the 20 m² HWC is sufficient to meet the hot water needs of a 100-student SS in an energy-efficient manner.
Figure 8
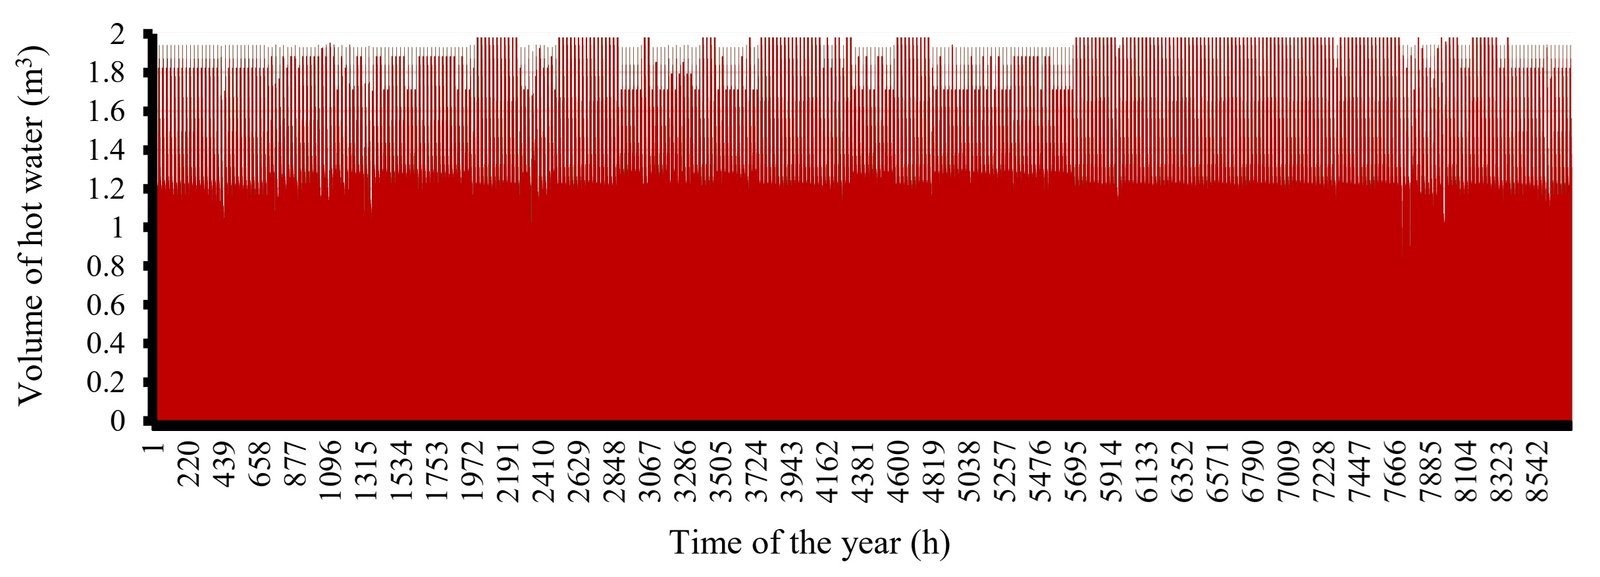
Fig. 8. Annual volume of hot water production in HWC.
As illustrated in Fig. 9, the red dashed line represents the minimum temperature required to eliminate bacteria in water (typically around 65°C) [58]. Any water heated above this temperature can be used for showering and other purposes. The graph indicates that the HWC system effectively maintains a hot water supply throughout the year, with a minimum temperature of 26°C, exceeding the minimum sanitation requirement. However, it is important to note that the maximum water temperature can reach over 100°C, which may require a mixing valve to regulate the water temperature for safety and comfort.
Figure 9
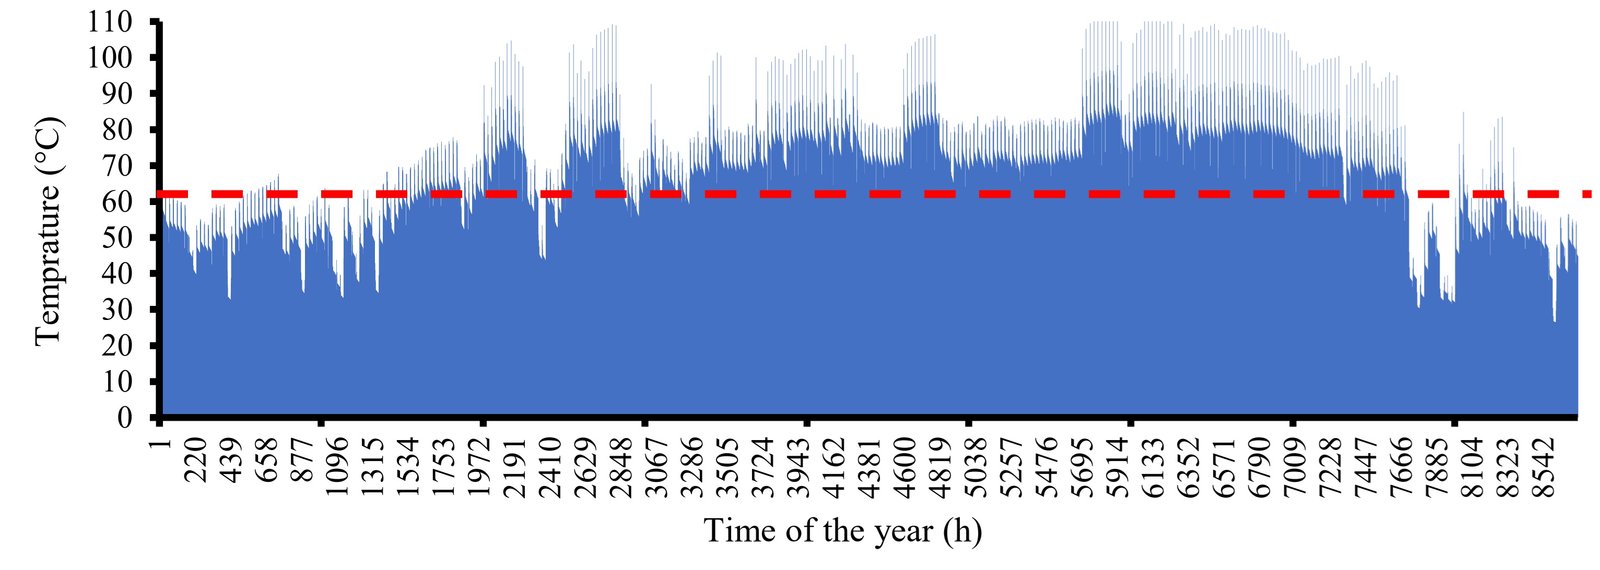
Fig. 9. Annual water heating temperature of HWC for each hour of the year.
Additionally, Fig. 10 illustrates the variation in hot water production by the HWC system throughout the year. This directly translates to the amount of electricity that would have been needed for conventional water heating. As expected, the performance of HWC is influenced by seasonal variations in sunlight availability. On the shortest day of the year (December 21st), hot water production reaches its minimum at 13.65 kWh. However, the HWC panels can still operate for approximately eight hours (from 9 am to 5 pm), providing sufficient hot water during this period.
Figure 10
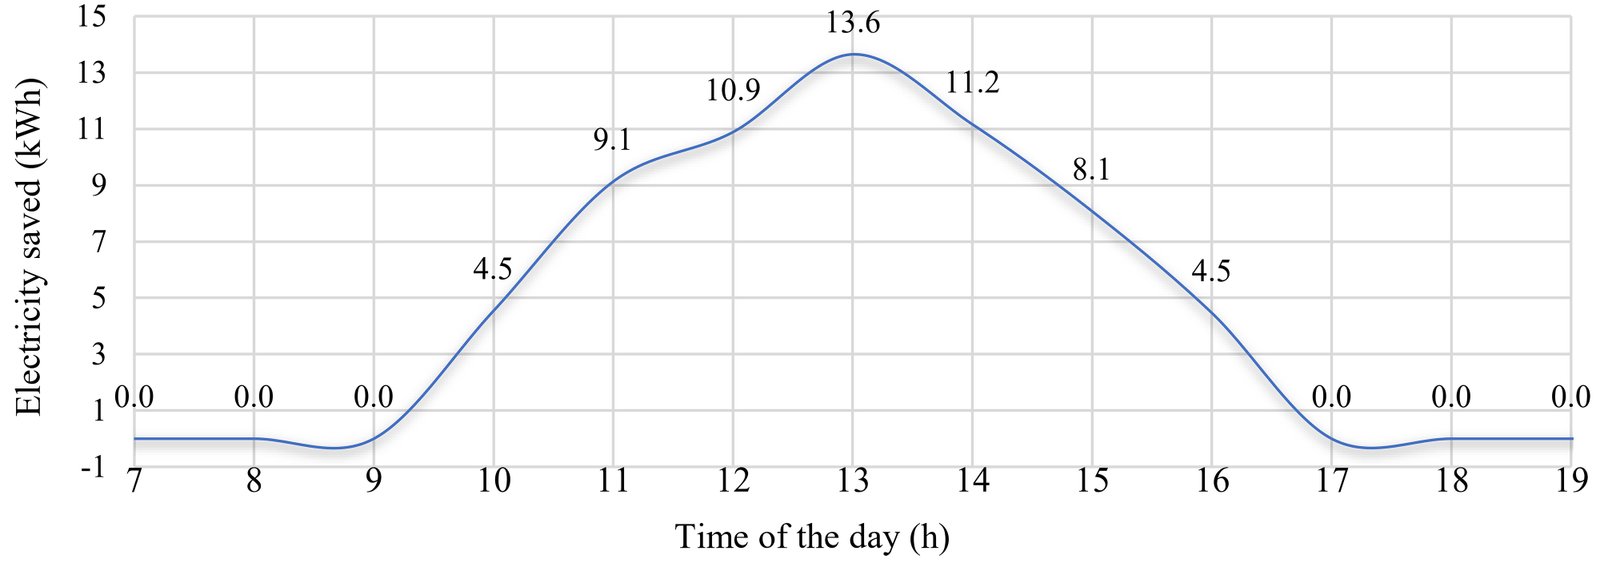
Fig. 10. Daily electricity saved by HWC, (day of 21st of December).
In contrast to PVs that experience reduced efficiency in high temperatures, the HWC system actually performs better during the hot summer months (June). As shown in Fig. 11, hot water production reaches a peak of 35.19 kWh, effectively offsetting the need for 35.19 kWh of electricity that would have been used for conventional heating.
Figure 11
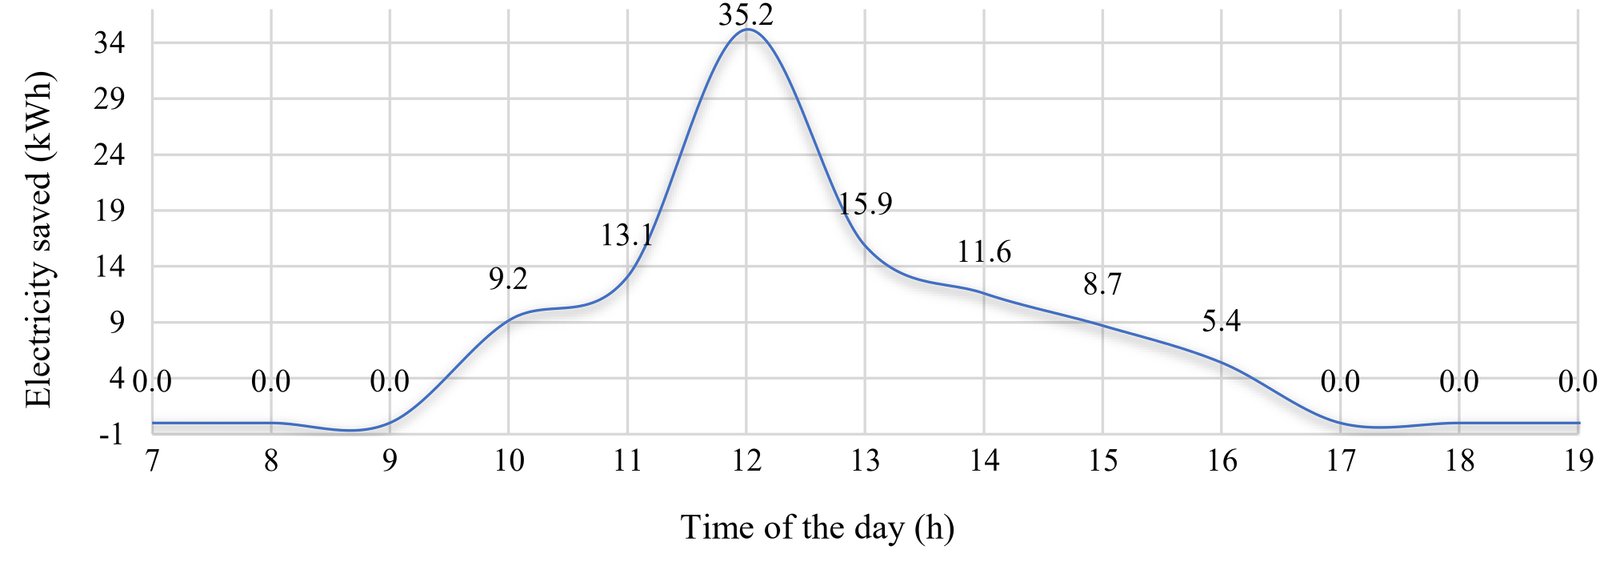
Fig. 11. Daily electricity saved by HWC, (day of 21st of June).
Moreover, Fig. 12 visualizes annual hot water production by the HWC using a heat map format, where the x-axis represents days (1-365) and the Y-axis represents hours (0-24). This allows for a quick visual assessment of hot water production patterns throughout the year.
Figure 12
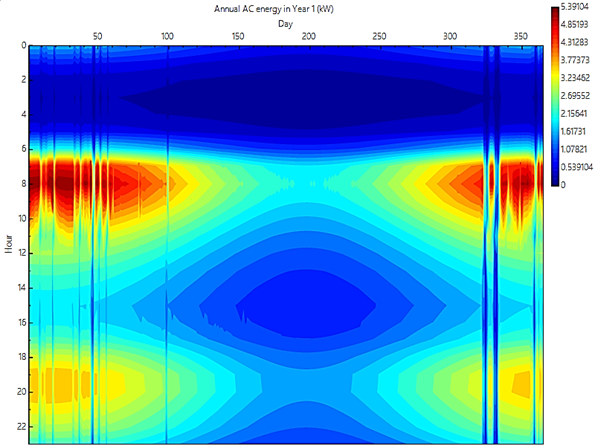
Fig. 12. Annual hot water production pattern of the HWC system.
5. Result and discussion
Schools that embrace RES unlock a powerful combination of environmental and economic benefits [59]. Implementing RES strategies demonstrably reduces operating costs for utilities like electricity and water heating. This translates to financial sustainability for schools, allowing them to allocate resources more effectively towards educational priorities. Beyond cost savings, RES fosters a healthier learning environment [60]. By minimizing CO2 emissions, schools contribute to cleaner air and a more sustainable future. Additionally, studies suggest a positive correlation between improved air quality and student learning outcomes. Furthermore, RES solutions like HWC provide students with access to clean, heated water for essential hygiene and sanitation needs. Figure 13 showcases the significant impact of HWC installation.
Figure 13
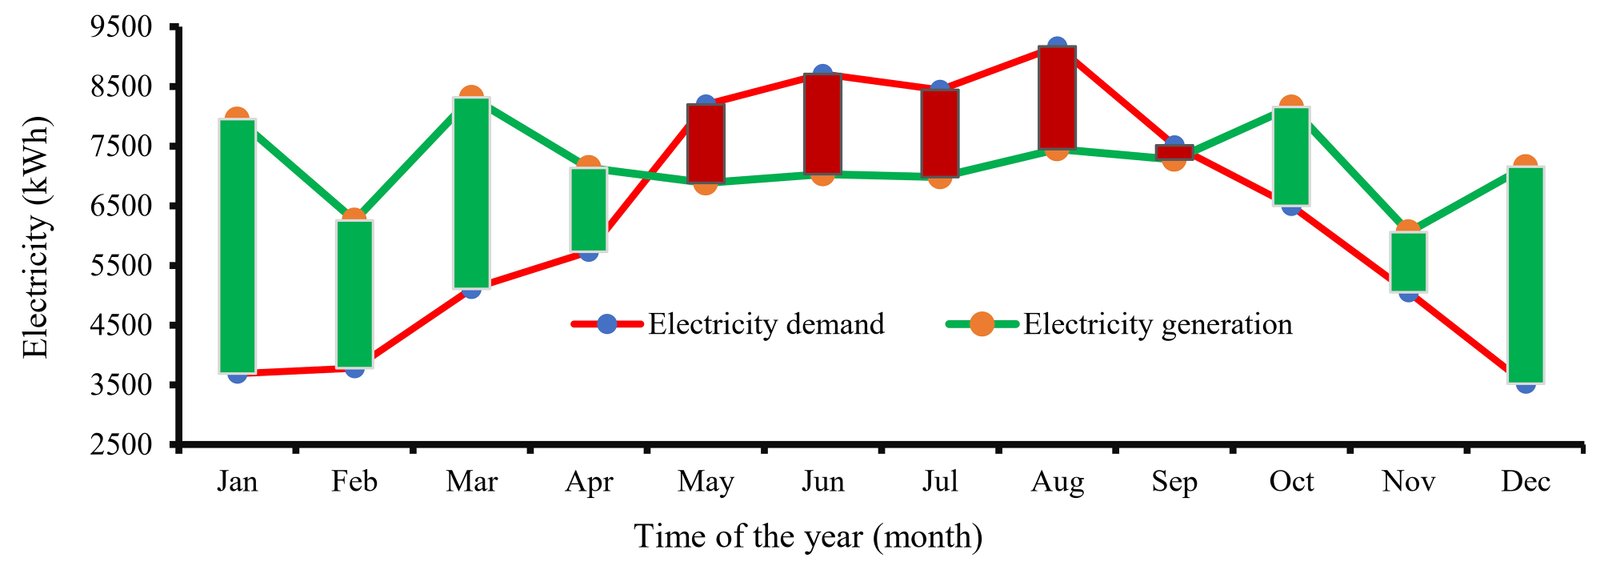
Fig. 13. Monthly electricity demand of the building and electricity generated from RES.
The HWC system substantially reduces annual electricity consumption for water heating, alleviating strain on the overall energy demand of the school. When combined with PVs, there is a net increase in energy production during off-peak months (October to April). However, it is important to consider that during these months, electricity demand might still exceed the capacity for battery storage, grid injection, or direct sales. Future advancements in storage technologies could potentially bridge this gap and maximize the benefits of on-site renewable energy production. Integrating HWC and PVs creates a robust renewable energy solution for schools. This combined approach, as depicted in Fig. 14, can generate a substantial amount of 86,635 kWh of clean energy annually. This not only reduces the dependence of school on the grid but also fosters energy independence by exceeding the school's total energy consumption of 75,386 kWh per year. The resulting surplus of 11,249 kWh can be strategically sold back to the utility grid or directly to consumers, generating a potential revenue stream to support the sustainability initiatives.
Figure 14
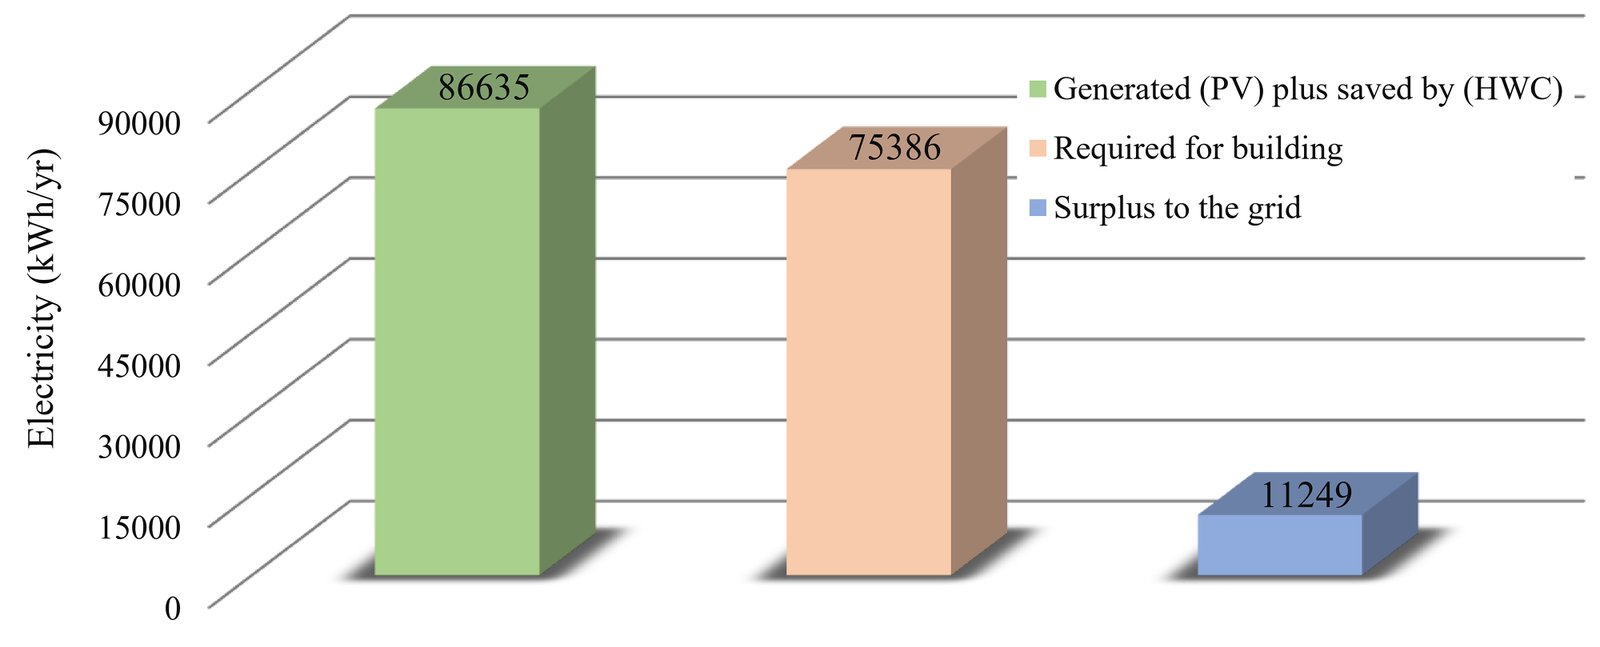
Fig. 14. Electricity generated by PV, saved by HWC, and surplus to the grid.
Furthermore, during the conversion of DC to AC power by the inverter, some energy is inevitably lost as heat. High-quality solar energy inverters are more efficient in this process, converting more energy with minimal losses. While the efficiency of conversion varies among manufacturers, most quality inverters operate at efficiency levels between 97% and 99%, resulting in minimal power loss [61]. However, factors such as shading can impact the efficiency of the energy system, highlighting the importance of selecting a reliable solar inverter to minimize these losses [62]. It is crucial to choose the appropriate inverter for the PVs to efficiently convert DC energy to AC (refer to Fig. 15).
Figure 15
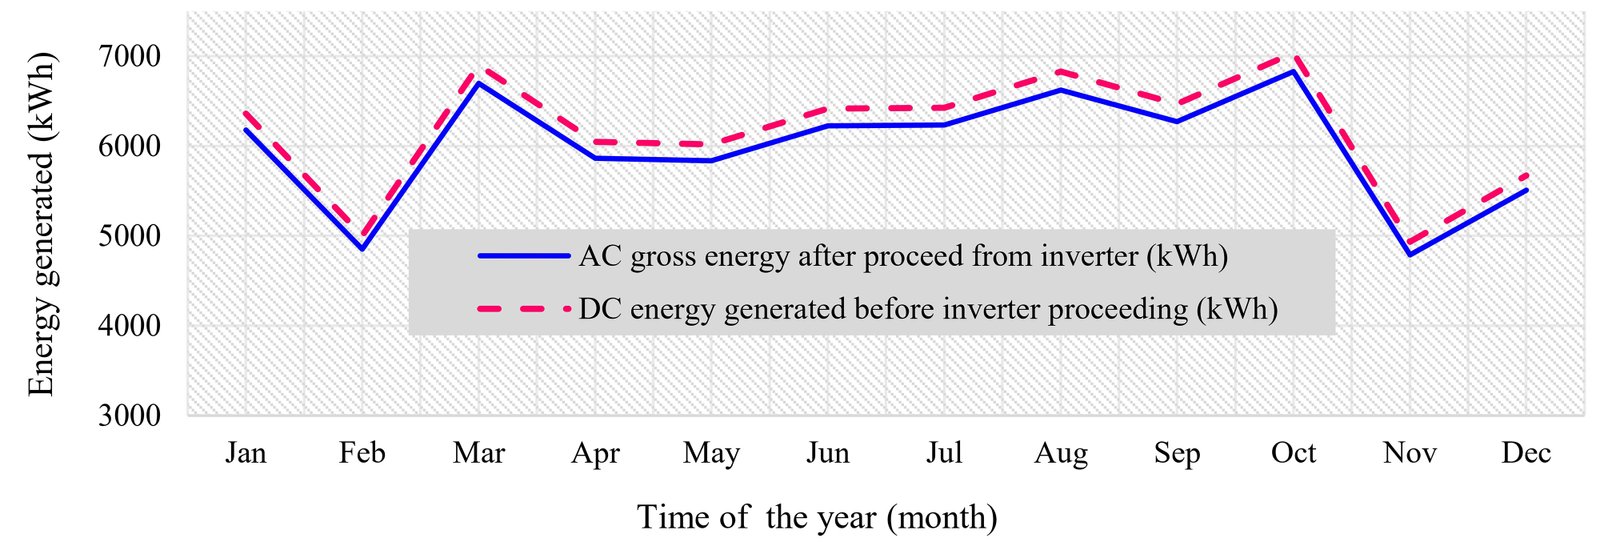
Fig. 15. Demonstration of inverter efficiency in converting electricity from DC to AC.
Figure 16 illustrates a comparison between the DC energy generated by the solar panels before and after undergoing the inverter conversion process to AC. The total DC energy produced amounts to 74,104.2 kilowatt-hours, whereas it decreases to 71,899 kWh after the inverter conversion to AC. The difference between the two energy values over the examined year totals 2,394.76 kWh. This transformation depends on the efficiency of the inverter, which is measured at 98.145%, indicating a very high level of efficiency. As depicted in this figure, the variations remain consistent throughout the entire year.
Figure 16
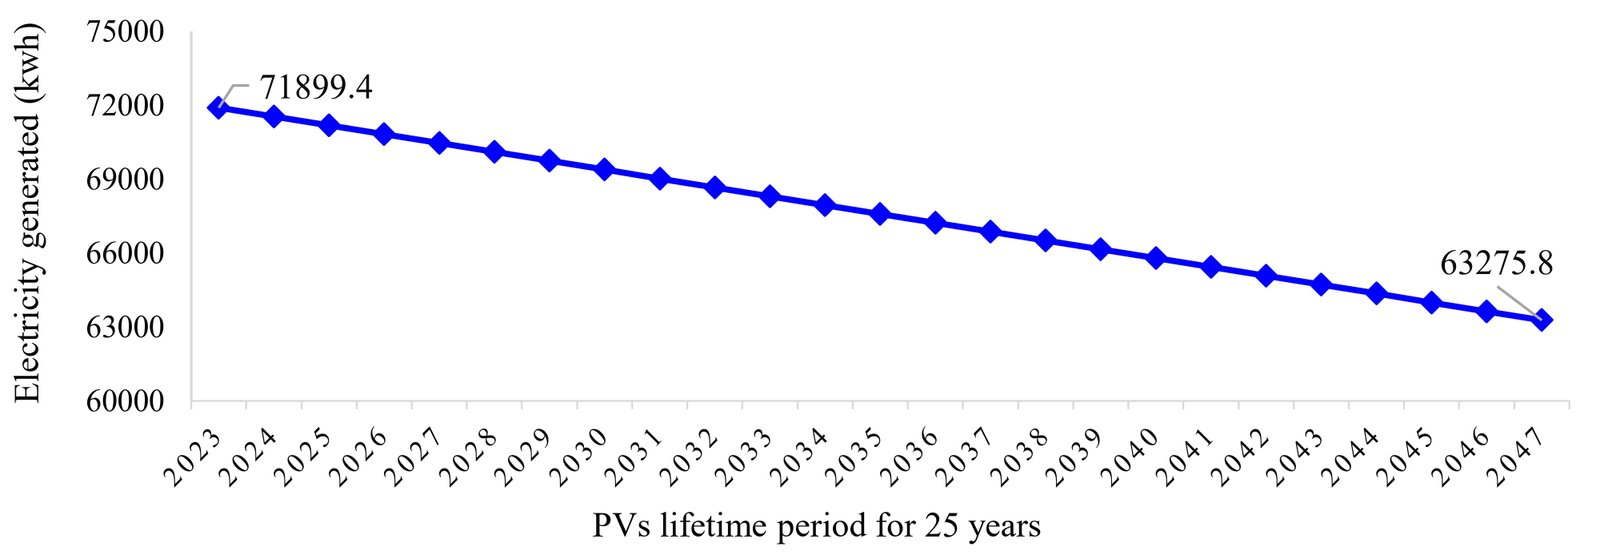
Fig. 16. Illustration of the 25-year service life and electricity generation limits of PVs.
Furthermore, Fig. 16 illustrates the entire 25-year service life of the designed PV system, spanning from 2023 to 2047. Initially, the PVs produced 71,899.4 kWh of electricity in their first year of operation, gradually decreasing over the 25-year period to 63,275.8 kWh. This decline indicates that energy losses are influenced by factors such as maintenance and working conditions. By incorporating the energy generated by the HWC to the PV after 25 years of service, the total energy production of the combined system amounts to 78,011.8 kWh. Nevertheless, the combination of these PVs and HWC is projected to approximately meet the annual energy demand of the school, which is 75,385.63 kWh, even after 25 years of service.
A model validation done in SAM software to check the accuracy of the designed model in the DB software. In the context of comparison between SAM and DB, the results indicate an approximate 3.22% difference in annual electricity generation, which is an acceptable distinction between these programs, as depicted in Fig. 17, the outcomes of these two software are largely comparable for all months, with the exception of the months of November and February. In November, the variation between the graphs of these lines reaches a maximum of approximately 17%, whereas in February, the variation is approximately 13%. For the remaining months, the variances are less than 5%. These variations may have been caused by the simulation's automatic selection specifications or the meteorological data and standards that the simulation software utilizes.
Figure 17
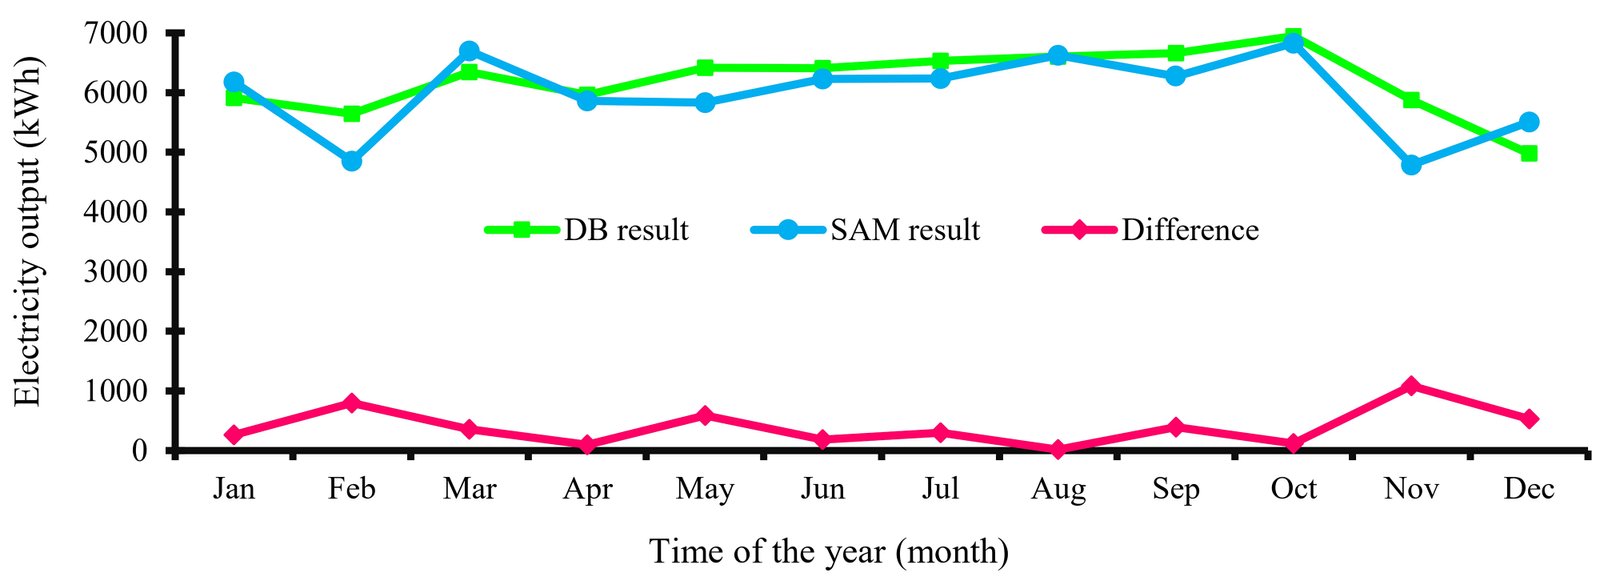
Fig. 17. Comparison of the final electricity output of PV between SAM and DB.
6. Conclusion
The rise of smart schools reflects a growing trend in integrating technology to enhance learning experiences. However, balancing increased energy demands with sustainability remains a key challenge. This study explores energy efficiency strategies for smart schools, identifying areas like energy-efficient lighting and high-efficiency heating, ventilation and air conditioning systems for energy savings. Power management tools and renewable energy sources further enhance efficiency and sustainability. Education and awareness are crucial in promoting energy-efficient habits among students and faculty.
- Results from the simulations show that the annual electricity needed for the school is 75,385.6 kWh.
- Photovoltaics generate 74,294 kWh annually. By installing hot water collectors, the need to use electricity for heating water is eliminated, resulting in a total energy production of 86,635 kWh.
- This surplus allows for 11,249 kWh to be sent to the grid or stored, demonstrating the efficiency of hybrid systems.
- Comparing System Advisor Model and Design-Builder software results shows a 3.223% discrepancy in photovoltaics electricity generation, which is considered acceptable.
- The integration of photovoltaics and hot water collectors contributes to a net-zero energy consumption reduction, optimizing land use and reducing carbon emissions.
Future research should explore real-world conditions for hybrid solar panels to maximize energy generation and land efficiency. Additionally, the impact of integrating battery storage systems on overall energy savings and grid independence should be investigated. Further studies could also assess the long-term performance and maintenance requirements of these systems in different climatic conditions to ensure their sustainability and effectiveness.
Contributions
M. Taher Zamani: Software, Validation, Writing - original draft, Ali Ahmad Amiri: Supervision, Writing - review & editing, Conceptualization, Proofreading.
Declaration of competing interest
The authors declare no conflict of interest.
References
- A. Al Ghamdi, Saudi Arabia Energy Report, 2020. [Online]. Available: https://www.kapsarc.org/wp-content/uploads/2020/12/KS-2020-DP25-Saudi-Arabia-Energy-Report.pdf (accessed: Jun. 20 2024).
- Solargis, Solar resource maps of Saudi Arabia, [Online]. Available: https://solargis.com/maps-and-gis-data/download/saudi-arabia (accessed: Jun. 28 2024).
- A. Demirbas, A. A. Hashem, and A. A. Bakhsh, The cost analysis of electric power generation in Saudi Arabia, Energy Sources, Part B: Economics, Planning and Policy, 12 (2017) 591-596. https://doi.org/10.1080/15567249.2016.1248874
- K. Irshad, K. Habib, S. Algarni, B. B. Saha, and B. Jamil, Sizing and life-cycle assessment of building integrated thermoelectric air cooling and photovoltaic wall system, Appl Therm Eng, 154 (2019) 302-314. https://doi.org/10.1016/j.applthermaleng.2019.03.027
- European Commission, In focus: Energy efficiency in buildings, Feb. 2020. [Online]. Available: https://commission.europa.eu/news/focus-energy-efficiency-buildings-2020-02-17_en (accessed: Apr. 12 2023).
- A. Haleem, M. Javaid, M. A. Qadri, and R. Suman, Understanding the role of digital technologies in education: A review, Sustainable Operations and Computers, 3 (2022) 275-285. https://doi.org/10.1016/j.susoc.2022.05.004
- I. Nesterenko, Major benefits of using smart technologies in education, Scientific Bulletin of Mukachevo State University Series Pedagogy and Psychology, 9 (2023) 31-38.
- D. N. Perkins, Smart schools: From training memories to educating minds., Smart schools: From training memories to educating minds, 262 (1992) ix.
- C. V. Kifor, A. Olteanu, and M. Zerbes, Key Performance Indicators for Smart Energy Systems in Sustainable Universities, Energies (Basel), 16 (2023) 1246. https://doi.org/10.3390/en16031246
- J. Mogas, R. Palau, M. Fuentes, and G. Cebrián, Smart schools on the way: How school principals from Catalonia approach the future of education within the fourth industrial revolution, Learn Environ Res, 25 (2022) 875-893. https://doi.org/10.1007/s10984-021-09398-3
- J. Gee, Social linguistics and literacies: Ideology in discourses. Routledge, 2015. [Online]. Available: https://books.google.com.sa/books?hl=en&lr=&id=CWnABgAAQBAJ&oi=fnd&pg=PP1&ots=a9JKGrBhoA&sig=7tmvMz1jCqMf7Ukh_IkBH-kS8GU&redir_esc=y#v=onepage&q&f=false (accessed: Apr. 12, 2024).
- E. Dimitriadou and A. Lanitis, A critical evaluation, challenges, and future perspectives of using artificial intelligence and emerging technologies in smart classrooms, Smart Learning Environments, 10 (2023) 12.
- Z. Taleb and F. Hassanzadeh, Toward Smart School: A Comparison between Smart School and Traditional School for Mathematics Learning, Procedia Soc Behav Sci, 171 (2015) 90-95.
- University of California, Energy Efficiency in Campus Buildings, 2024. [Online]. Available: https://publicinterestnetwork.org/wp-content/uploads/2022/08/Campus-Energy-Efficiency_Environment-America_October-2018-4.pdf (accessed: May 24, 2024).
- A. S. Al Shammre, The Impact of Using Renewable Energy Resources on Sustainable Development in the Kingdom of Saudi Arabia, Sustainability (Switzerland), 16 (2024) 1324. https://doi.org/10.3390/su16031324
- R. Hajimineh and A. M. Moghani, The important factors of Saudi Arabian policymaking in renewable energy resources, Future Energy, 2 (2023) 29-38. https://doi.org/10.55670/fpll.fuen.2.2.4
- R. A. Almasri, N. H. Abu-Hamdeh, and N. Al-Tamimi, A state-of-the-art review of energy-efficient and renewable energy systems in higher education facilities, Front Energy Res, 11 (2023) 1344216. https://doi.org/10.3389/fenrg.2023.1344216
- N. Samancioglu, Smart Building and Campus Framework: A Determination of Smart Campus Parameters to Predict Potential Smartness of University Campuses, (2022), [Online]. Available: https://oa.upm.es/id/eprint/70353
- J. Sinopoli, Advanced technology for smart buildings, Artech House power engineering library, (2016).
- HDL automation, How Smart Building Technology Can Improve Tenant Comfort and Satisfaction, Feb. 2023. [Online]. Available: https://www.hdlautomation.com/Articles_100000156918328.html (accessed: Apr. 15, 2024).
- C. K. Metallidou, K. E. Psannis, and E. A. Egyptiadou, Energy Efficiency in Smart Buildings: IoT Approaches, IEEE Access, 8 (2020) 63679-63699. https://doi.org/10.1109/ACCESS.2020.2984461
- R. Eini, L. Linkous, N. Zohrabi, and S. Abdelwahed, Smart building management system: Performance specifications and design requirements, Journal of Building Engineering, 39 (2021) 102222. https://doi.org/10.1016/j.jobe.2021.102222
- B. Dong, V. Prakash, F. Feng, and Z. O'Neill, A review of smart building sensing system for better indoor environment control, Energy Build, 199 (2019) 29-46. https://doi.org/10.1016/j.enbuild.2019.06.025
- R. P. Khidmat, H. Fukuda, B. Paramita, M. D. Koerniawan, and Kustiani, The optimization of louvers shading devices and room orientation under three different sky conditions, Journal of Daylighting, 9 (2022) 137-149. https://doi.org/10.15627/jd.2022.11
- ASHRAE (Firm), Advanced energy design guide for K-12 school buildings : achieving zero energy. 2018. [Online]. Available: https://www.ashrae.org/about/news/2018/new-advanced-energy-design-guide-available-to-help-k-12-schools-achieve-zero-energy (accessed: Feb. 18, 2024).
- S. Rothgeb, Advanced Energy Design Guide for K-12 School Buildings (AEDG) Training: Cooperative Research and Development Final Report, CRADA Number CRD-18-00761, Golden, CO (United States), (2021). [Online]. Available: https://www.osti.gov/biblio/1809037 (accessed: (Jun. 18, 2024). https://doi.org/10.2172/1809037
- D. Li and W. C. Sullivan, Impact of views to school landscapes on recovery from stress and mental fatigue, Landsc Urban Plan, 148 (2016) 149-158. https://doi.org/10.1016/j.landurbplan.2015.12.015
- H. Farzaneh, L. Malehmirchegini, A. Bejan, T. Afolabi, A. Mulumba, and P. P. Daka, Artificial Intelligence Evolution in Smart Buildings for Energy Efficiency, Applied Sciences, 11 (2021) 763. https://doi.org/10.3390/app11020763
- EPA, How the Energy Independence and Security Act of 2007 Affects Light Bulbs, Inefficient Light Bulbs are Being Phased Out. [Online]. Available: https://www.epa.gov/mercury/how-energy-independence-and-security-act-2007-affects-light-bulbs (accessed: Apr. 13, 2023).
- H. Wang, B. W. Olesen, and O. B. Kazanci, Using thermostats for indoor climate control in offices: The effect on thermal comfort and heating/cooling energy use, Energy Build, 188 (2019) 71-83.
- H. Stopps and M. F. Touchie, Residential smart thermostat use: An exploration of thermostat programming, environmental attitudes, and the influence of smart controls on energy savings, Energy Build, 238 (2021) 110834.
- G. D. Kontes, G. I. Giannakis, P. Horn, S. Steiger, and D. V. Rovas, Using thermostats for indoor climate control in office buildings: The effect on thermal comfort, Energies (Basel), 10 (2017) 1368.
- T. Peffer, M. Pritoni, A. Meier, C. Aragon, and D. Perry, How people use thermostats in homes: A review, Build Environ, 46 (2011) 2529-2541.
- A. Kumar Behura, A. Kumar, D. Kumar Rajak, C. I. Pruncu, and L. Lamberti, Towards better performances for a novel rooftop solar PV system, Solar Energy, 216 (2021) 518-529.
- T. Todorova, A future based on renewable energy, European environment agency (EEA), Dec. 2022. [Online]. Available: https://www.eea.europa.eu/signals/signals-2022/articles/a-future-based-on-renewable-energy (accessed: Apr. 13, 2023).
- iea, Renewable electricity growth is accelerating faster than ever worldwide, supporting the emergence of the new global energy economy, Dec. 2021. [Online]. Available: https://www.iea.org/news/renewable-electricity-growth-is-accelerating-faster-than-ever-worldwide-supporting-the-emergence-of-the-new-global-energy-economy (accessed: Apr. 13, 2023).
- F. E. M. Suliman, Solar- and Wind-Energy Utilization in the Kingdom of Saudi Arabia: A Comprehensive Review, Energies (Basel), 17 (2024) 1894. https://doi.org/10.3390/en17081894
- M. Zubair, PV energy penetration in Saudi Arabia: current status, residential, and commercial users, local investment, use in modern agriculture, International Journal of Sustainable Engineering, 17 (2024) 1-13. https://doi.org/10.1080/19397038.2023.2297262
- A. K. Yadav and H. Malik, Optimization of Tilt Angle for Intercepting Maximum Solar Radiation for Power Generation, Studies in Systems, Decision and Control, 262 (2020) 195-213. https://doi.org/10.1007/978-3-030-34050-6_9
- J. A. Duffie, W. A. Beckman, and J. McGowan, Solar Engineering of Thermal Processes, 53 (1985) 382. https://doi.org/10.1119/1.14178
- Climate-Data, RIYADH CLIMATE (SAUDI ARABIA): DATA AND GRAPHS FOR WEATHER & CLIMATE IN RIYADH. [Online]. Available: https://en.climate-data.org/asia/saudi-arabia/riyadh-region/riyadh-3883/ (accessed: Apr. 21, 2023).
- R. Geiger, Klassifikation der Klimate nach W. Köppen' [Classification of climates after W. Köppen]. Landolt-Börnstein - Zahlenwerte und Funktionen aus Physik, Chemie, Astronomie, Geophysik und Technik, alte Serie., Berlin: Springer., 3 (1954) 603-607.
- EC, Photovoltaic Geographical Information System, European Commission. [Online]. Available: https://re.jrc.ec.europa.eu/pvg_tools/en/tools.html (accessed: Apr. 21, 2023).
- M. Abdillah, F. M. Satria, N. I. Pertiwi, and H. Setiadi, Design of photovoltaic system for public school building, Indonesian Journal of Electrical Engineering and Computer Science, 29 (2023) 56-65. https://doi.org/10.11591/ijeecs.v29.i1.pp56-65
- A. Luna-Navarro, R. Loonen, M. Juaristi, A. Monge-Barrio, S. Attia, M. Overend, Occupant-Facade interaction: a review and classification scheme, Build Environ 177 (2020) 106880. https://doi.org/10.1016/j.buildenv.2020.106880
- A. A. Amiri, Comparative analysis of economic aspects of concentrated solar power versus photovoltaic in afghanistan-case study: Kang district, nimruz, International Journal of Innovative Research and Scientific Studies, 4 (2021) 111-119. https://doi.org/10.53894/ijirss.v4i2.64
- M. Benghanem, Optimization of tilt angle for solar panel: Case study for Madinah, Saudi Arabia, Appl Energy, 88 (2011) 1427-1433. https://doi.org/10.1016/j.apenergy.2010.10.001
- H. Masrur et al., Determining optimal tilt angle to maximize the PV yield, PECon 2020 - 2020 IEEE International Conference on Power and Energy, (2020) 219-223. https://doi.org/10.1109/PECon48942.2020.9314455
- Y. Prunier, D. Chuet, S. Nicolay, G. Hamon, and M. Darnon, Optimization of photovoltaic panel tilt angle for short periods of time or multiple reorientations, Energy Conversion and Management: X, 20 (2023) 100417. https://doi.org/10.1016/j.ecmx.2023.100417
- H. Masrur, K. V. Konneh, M. Ahmadi, K. R. Khan, M. L. Othman, and T. Senjyu, Assessing the techno-economic impact of derating factors on optimally tilted grid-tied photovoltaic systems, Energies (Basel), 14 (2021) 1044.
- M. Kim, H. Kim, and J. H. Jung, A study of developing a prediction equation of electricity energy output via photovoltaic modules, Energies (Basel), 14 (2021) 1503. https://doi.org/10.3390/en14051503
- F. Umer, M. S. Aslam, M. S. Rabbani, M. J. Hanif, N. Naeem, and M. T. Abbas, Design and optimization of solar carport canopies for maximum power generation and efficiency at Bahawalpur, International Journal of Photoenergy, 2019 (2019) 6372503. https://doi.org/10.1155/2019/6372503
- A. Al-Abduljabbar, M. Al-Mogbel, S. N. Danish, and A. El-Leathy, Insulation Performance of Building Components and Effect on the Cooling Load of Homes in Saudi Arabia, Sustainability (Switzerland), 15 (2023) 5685. https://doi.org/10.3390/su15075685
- A. Al–bashir, M. Al-Dweri, A. Al–ghandoor, B. Hammad, and W. Al–kouz, Analysis of effects of solar irradiance, cell temperature and wind speed on photovoltaic systems performance, International Journal of Energy Economics and Policy, 10 (2020) 353-359.
- P. Wichowski, G. Rutkowska, N. Kamiński, and Y. Trach, Analysis of water consumption in the campus of Warsaw University of life sciences in years 2012-2016, Journal of Ecological Engineering, 20 (2019) 193-202. https://doi.org/10.12911/22998993/105473
- L. G. C. F. Nunes, A. E. P. Soares, W. de A. Soares, and S. R. da Silva, Water consumption in public schools: A case study, Journal of Water Sanitation and Hygiene for Development, 9 (2019) 119-128. https://doi.org/10.2166/washdev.2019.074
- M. Farina, M. Maglionico, M. Pollastri, and I. Stojkov, Water consumptions in public schools, Procedia Eng, 21 (2011) 929-938. https://doi.org/10.1016/j.proeng.2011.11.2096
- J. T. Marois-Fise, A. Carabin, A. Lavoie, and C. C. Dorea, Effects of temperature and pH on reduction of bacteria in a pointof- use drinking water treatment product for emergency relief, Appl Environ Microbiol, 79 (2013) 2107-2109.
- G. Batra, Renewable Energy Economics: Achieving Harmony between Environmental Protection and Economic Goals, Social Science Chronicle, 2 (2023) 1-32. https://doi.org/10.56106/ssc.2023.009
- W. Fang, A. Hassan, and B. A. Lepage, The Living Environmental Education: Sound Science Toward a Cleaner, Safer, and Healthier Future, (2022) 1-279. https://doi.org/10.1007/978-981-19-4234-1
- A. Kawamura, Y. Miguchi, H. Setiadi, and H. Obara, Survey of 99.9% Class Efficiency DC-AC Power Conversion and Technical Issues, IEEJ Transactions on Electrical and Electronic Engineering, 18 (2023) 6-14. https://doi.org/10.1002/tee.23728
- Palmetto, Solar Inverter Guide: Types, Benefits, Costs, and How Solar Inverters Work, 2023. [Online]. Available: https://palmetto.com/learning-center/blog/solar-inverter-guide-types-benefits-cost-how-solar-inverters-work (accessed: Apr. 24, 2024). https://doi.org/10.15627/jd.2024.4
Copyright © 2024 The Author(s). Published by solarlits.com.

5223
Total views
Citations
SHARE ON


