Volume 11 Issue 2 pp. 216-233 • doi: 10.15627/jd.2024.16
Investigation of daylight availability in university dining halls: A case study at the University of Jordan
Eman Mayah∗
Author affiliations
Department of Design and Visual Communication, College of Art and Design, University of Jordan, Amman, Jordan
*Corresponding author.
eman1maayah@yahoo.com (E. Mayah)
History: Received 4 April 2024 | Revised 28 June 2024 | Accepted 9 July 2024 | Published online 3 August 2024
Copyright: © 2024 The Author(s). Published by solarlits.com. This is an open access article under the CC BY license (http://creativecommons.org/licenses/by/4.0/).
Citation: Eman Mayah, Investigation of daylight availability in university dining halls: A case study at the University of Jordan, Journal of Daylighting 11 (2024) 216-233. https://dx.doi.org/10.15627/jd.2024.16
Figures and tables
Abstract
This study evaluates the availability of daylight inside a university’s dining halls over two days (one sunny and one cloudy) using light meters in real-life sittings. Quantitative monitoring was conducted for horizontal and vertical illuminance levels (HILs and VILs) derived from daylight inside of the dining halls and outside under an unobstructed sky, along with monitoring of the illuminance levels of the artificial light inside. The results are discussed in relation to the minimum recommended HIL value in dining halls of educational buildings (150 lux) set by the Jordanian National Construction Constitution’s lighting code. Further, a questionnaire was conducted with 239 students and employees to evaluate daylight and artificial light from the user’s perspective of the dining halls. HIL, as a dependent variable, was found to vary between the two examined halls, which had different façade fenestrations and hall characteristics. The analysis found that, within the halls, only the area within a 2-metre distance from the north- and west-oriented windows complied with the recommended value, except at breakfast time on a cloudy day. The middle and deepest areas of both halls were significantly lacking in daylight on both cloudy and sunny days. The subjective mean evaluation corresponds with the daylight VILs but contradicts the artificial illuminance levels. As such, subjective needs and preferences may not correspond with objective measurements. This study opens a new path of daylighting research for a largely neglected space: foodservice halls in educational buildings.
Keywords
Daylighting, Illuminance levels, University dining hall, Foodservice halls
1. Introduction
The design of physical environments, including their decoration, layout, lighting, and service innovations, is critical for enhancing the performance of restaurants [1]. Foodservice is becoming a growing and fast-evolving sector, driven by continuous changes in customer needs and expectations. The design approach taken by restaurants depends on the scope of the project, i.e., the size and complexity of a foodservice facility design project. In addition, the process of creating a new foodservice facility or renovating an existing one depends on the sector (e.g. healthcare, education, etc.) and whether it is for commercial or non-commercial ends. Institutional foodservice often adopts a not-for-profit philosophy, with the aim of providing a constant supply of food for consumption [2]. In restaurant design, the two main sources of lighting (natural and artificial) are crucial for both customers and employees. The hygiene standards of illumination for the different zones of a restaurant are based on the functional and psychological need to provide a spacious and comfortable dining area [3]. As lighting is considered an essential ambient element of the physical environment in service sittings [4], restaurant designers usually pay it great attention as they seek to create a warm and inviting experience, or even a dramatic one. However, simple take-away food establishments might not place such emphasis on lighting design, and instead use low-cost ceiling-mounted fluorescent fixtures [5].
Lighting has a significant impact on the overall dining experience, in terms of atmosphere, food, service, and sociality [6], and thus also on customer behaviour [7]. Nevertheless, there are only a limited number of empirical studies on lighting in educational dining halls or cafeterias, despite its effect on students’ success and comfort, as it can create a suitable social space in which to eat, meet, and engage in discussions [8]. One study conducted at the Norwegian School of Business Administration and Economics (NHH) found no significant relationship between customer satisfaction and environmental factors in the school’s cafeteria, concluding that students viewed the cafeteria as a place for satisfying nutritional rather than aesthetic needs [9]. However, for research validity, there is an evident need for further studies that incorporate a large representative sample for a target place and population, as well as controlled variables.
The vital role played by cafeterias in the overall offering of educational colleges is now being recognized and appreciated by administrators, especially in terms of the effect on student satisfaction and loyalty [10]. In Hassanain et al.'s (2016) study [8], a post-occupancy evaluation was conducted to obtain users’ perceptions and satisfaction levels regarding the main student cafeteria on the campus of King Fahd University of Petroleum and Minerals (KFUPM), Dhahran, Saudi Arabia. The survey was designed to evaluate technical and functional performance elements, such as space arrangement, interior and exterior finishing, human factors, and proximity to other facilities on campus. Based on findings regarding various elements of technical performance (e.g. thermal comfort and indoor air quality) and of visual comfort (e.g. amount of natural light in the dining hall, amount of artificial light in the dining hall, amount of artificial light in the service area, and overall perception of visual comfort), it appeared that the users were highly satisfied. However, objective assessments are required to validate such subjective evaluations, especially since no data was reported regarding the amount of natural light in the cafeteria, the window locations, or the types and levels of artificial lighting.
Daylight has proved to be the ultimate variable for illuminating the interior of buildings. Daylight benefits humans both in terms of visual and non-visual aspects [11,12], saving energy [13], significantly impacting the overall experience [14], as well as customer expectation and satisfaction [4]. However, the availability of daylight is constantly dynamic and changeable due to seasonal variations (e.g. solar altitude), geographical coordinates (e.g. latitude), and weather conditions (e.g. cloud coverage). Many scholars have examined the daylighting performance of educational building, particularly classrooms and studios [11,15-28]. However, it is also essential to ensure adequate lighting for the foodservice facilities of educational buildings, such as canteens and dining halls. It is important to be able to observe food quality and monitor work area cleanliness. Moreover, it is also vital to evaluate consumption of solar energy, electricity, and thermal energy [29]. Deep interior areas of a dining hall require specific daylighting design, such as skylights to let natural light spread uniformly over the floor plan [30]
Internal illuminance levels at a surface point (E) are investigated in this study. This means that the quotient of the luminous flux dφ incident on an element of the surface containing the point is obtained by dividing by the area dA of that element (unit: lx = lm·m–2) [31]. The internal illuminance level depends on external daylight availability (sky luminance distributions and external illuminance levels), obstruction, building geometry and orientation, as well as window size and internal reflectance [32]. The internal reflected component is determined by the average reflectance of the internal surfaces and by glazing area [33]. Conventional windows are one method employed to convey daylight to interior spaces. Nevertheless, the amount of light transmitted inside depends on several factors: window glazing proprieties, the supporting frame, dirt, outside factors such as building obstructions and vegetation, and inside factors such as blinds and other decorative elements that might block the transmitted light [34]. For casual dining, it is recommended to maintain lighting levels above the working surface between 107 to 215 lux (1 foot-candle = 10.764 lux). Table 1 shows the lighting levels required for each area in terms of foot-candles [2]. Based on the Jordanian National Construction Constitution, which stipulates the lighting codes in Jordan, dining halls in educational buildings must have a minimum 150 lux of illuminance on table surfaces [35].
The quantity of daylight on interior surfaces is expressed in illuminance levels (lux) [34]. Daylight evaluation, particularly measuring illuminance levels in indoor spaces, can be conducted using various methods, such as surveys [25,36], light meters [11,18,37] computerized software programs [19,38-40], and high dynamic range (HDR) imaging technologies and techniques [41-43]. Other static and dynamic metrics are available as well, such as the daylight factor (DF), as widely used parameters in assessing daylight in indoor spaces [44]. However, daylight factor excludes building orientation and direct sunlight, which are important factors in hot climates (Jordan in the current study). In addition, it has been argued that the DF does not represent a rigorous representation of the illuminance levels in indoor spaces, as it assumes that overcast skies have a uniform brightness with a constant luminance. Instead, overcast skies have a relative graduation of luminance [45]. Daylight autonomy, continuous daylight autonomy, and the useful daylight index are other valid metrics for any given condition of daylight evaluation. However, these do not provide holistic predictions of daylight performance, and a limitation in the absolute benchmark levels was noted, namely that the brightness from the sun and sky vary continuously, and the actual reflectance of external and internal surfaces of buildings needs to be monitored realistically [34].
Within all the metrics, calculations, techniques, and simulation programs that are available for daylight evaluations, their results need reliable validation, accuracy, and consistency, checked mainly through measurements from the investigated buildings. Despite the fact that real-field measurement is considered a challenging and expensive measurement method [46], it still incorporates a holistic approach that is a reliable, rigorous, and accurate representation of daylight performance inside buildings [44]. This study aims to investigate the availability of daylight in educational dining halls, using objective and subjective measurements in a real-life setting.
2. Materials and methods
2.1. Description of restaurant building
This study was conducted in the main restaurant of the University of Jordan, located in Amman city, Jordan (latitude 31.9539° N, longitude 35.9106° E). It is the first university restaurant built in the Hashemite Kingdom of Jordan that was designed for student, employee, and visitor dining purposes. The restaurant building was built in two stages (in 1966 and in 1979) by the architects Eng. Atallah Doany and Eng. Ziad Ahram. The second stage of the building work was mainly aimed at increasing the restaurant’s built-up area to cater to the increasing number of students enrolling at the university, and followed the construction of female student accommodation in 1977 and employee accommodation in 1978. The restaurant’s location is key, situated close to the main central yard of the university campus as well as the main library, which was built in 1979 (Fig. 1).
The restaurant is spread out over four dining halls: a student hall, an employee hall, and a ceremonial hall, all located on the ground floor, as well as an underground hall. This study was mainly conducted in the student and employee dining halls, which will be referred to as dining hall (A) (student hall), and dining hall (B) (employee hall). Dining hall (A) was built in stage 2, while dining hall (B) was built in stage 1. The physical features of the investigated dining halls, including their interiors, have not changed since they were built, but the mechanics and electrics of the kitchen and service area were renovated in 2016-2017.
Based on a conversation with the restaurant’s manager, breakfast is served between 8:30 and 10:30, lunch is served between 11:30 and 14:30, and no dinner is served; no coffee or tea is available during the day in the dining halls. Students, employees, and university visitors tend to use the dining halls as places in which to have a quick meal, with an average eating time of 30 minutes. However, students can stay there for over an hour, particularly between 14:00-15:00. The restaurant capacity is as follows: 400 occupants in the student dining hall, 200 occupants in the employee dining hall, and 90 occupants in the ceremonial dining hall. All of these halls can be occupied at the same time. Breakfast and lunch meals are served to an average of 800-1000 people daily.
The descriptive details relating to the interior of the dining halls are presented in Table 2 below, while those relating to the examined dining halls are summarised in Table 3. In dining hall (A), natural daylight is permitted through the north-oriented facade, which has four separate windows, and through the west-oriented façade, which has six separate windows. In dining hall (B), natural daylight is permitted only through the north-oriented façade, which is covered with continuous panoramic windows.
Table 2
Table 2. Description of the interior features for the investigated dining halls (A) and (B).
Regarding the walls and ceilings of the dining halls, both were painted with beige-coloured paint, which can be considered to have a high reflectance effect. As the floor received most of its daylight from the outside, it would be preferable for it to be highly reflective. However, given the nature of university dining halls and the high likelihood of dirt and dust often collecting on the ground, high-reflectance floor tiles would require more cleaning. In dining hall (A), the floor was covered with classical light-grey tiles, while dining hall (B) was covered in classical mid-brown floor tiles. The eating tables in hall (A) were round and brown in colour while the chairs had steel frames and were covered with black leather. The tables were not covered with any surface fabric. The eating tables in hall (B) were square or rectangular and covered with white cloths during special events and with dark red and blue cloth during normal days.
In terms of obstructions, there are three-metre tall trees at a distance of three metres from the northern side of dining hall (A), which cover only a small part of the windows, as well as nine-metre tall trees at a distance of seventeen metres from the western side. Obstructing dining hall (B), there are nine-metre tall trees at a distance of three metres from the northern side and a row of 70 cm tall plants (Fig. 2).
2.2. Meteorological daylight data
Daylight availability is greatly impacted by meteorological variables (Table 4). The day length was measured as approximately 10 hours on a cloudy day, and 14 hours on a sunny day, with two hours difference in sunrise and sunset time throughout the study time. Yet, this variable has no effect on the daylight availability in the investigated halls, as breakfast is served between 8:30 and 10:30. As for sun altitude, this also has no effect, as the building’s windows are oriented towards the north and west, with natural light coming mainly from the sky. However, it is the cloud coverage variable that most impacts the availability of daylight. Table 5 shows the percentage of cloud coverage during the study investigations. On a cloudy day, cloud coverage exceeded 60% most of the day, while on a sunny day, cloud coverage did not surpass 13%, except after sunset. While the cleanliness, glazing properties, frame, and colours of the windows all impacted daylight availability, these variables were not included in this study.
Table 4
Table 4. Meteorological data for Amman city, where the dining halls are located, including sunrise, sunset, daylight hours and altitude for both cloudy and sunny days. Source: https://www.timeanddate.com/sun/jordan/amman?month=7&year=2023 [47].
Table 5
Table 5. Cloud coverage percentage for both cloudy and sunny days in Amman city. Source: https://www.meteoblue.com/en/user/order/historyplus [48].
3. Research design
In order to investigate daylight availability in a real-life sitting, the study adopted a quantitative experimental research design, for which the fieldwork involved instrumentation and a questionnaire designed for a meaningful implementation of numeric descriptions of reality. The instrumentation procedure, conducted using light meters in the real-life sitting of the investigated dining halls, included the following: one light meter placed on the restaurant building’s roof to measure daylight under an unobstructed sky; two light meters placed on the window stools to measure horizontal illuminance levels (HILs) just after the light passes through the windows, (window sill height in hall (A)=0.5 m; there is no window sill height for the vertical windows in hall (B)); a total of 22 light meters, 13 of which were placed in hall (A), with the remaining 9 meters placed in hall (B). The light meters were placed on the dining tables at a height of 0.7 m above the floor and at a 3–4 m distance grid inside the dining halls (see Fig. 3); four light meters placed on the vertical walls (two in each hall) at 1.60 m from the ground to measure the vertical illuminance levels (VILs) on the walls. All light meters were recording at the same time on a cloudy (23/12/2022) and a sunny (7/7/2023) day. The light meters used were Ubibot Wireless Smart Sensors WS1 [18]. The ambient light sensor has ±2% precision and a range of 0.01 to 83 K lux. The light measurements were recorded at 5-minute intervals all day during the weekend, when the artificial lights were off, and there were no students, lecturers, or visitors using the dining halls. The dining tables were not covered with any cloths during the light measurements for either dining hall. Figure 4 shows fisheye views of the investigated dining halls, and Fig. 5 shows the locations of the light meters in halls (A) and (B).
Figure 4
Fig. 4. Fish-eye pictures of the investigated dining halls; Hall (A) on the right, Hall (B) on the left.
For the questionnaire procedure, the purpose was to involve the users of these places (students and employees) to define the strengths and weakness linked to daylight availability inside the investigated dining halls, hence evaluating the light from subjective perspectives. The questionnaire’s questions were adopted from Mayah’s thesis (2021) [18], and some of the artificial light terms used in the questionnaire originated from Flynn et al. (1973) [49]. The data collection procedure was conducted through an online form for greater convenience, where participants could scan a code and fill out the questionnaire easily. The questionnaire consisted of three parts: demographic information, daylight evaluation on a sunny day (the quantitative and qualitative aspects were evaluated on a 7-point Likert scale as very low...just right [neutral]...very high), and an artificial light evaluation (the quantitative and qualitative aspects were evaluated on a 7-point Likert scale: very low...just right [neutral]...very high).
A reliability test check (Cronbach’s alpha) was conducted using SPSS software program to measure the internal consistency of a set of items in the questionnaire [50]. The final evaluations were set as follows: the daylight evaluation on a sunny day consisted of 6 items, namely, brightness, illumination, uniformity, distribution of daylight, glare from daylight, and visual comfort; the artificial light evaluation consisted of 12 items, namely, adequate illumination, uniformity, glare, flickering, good colour appearance, high visual comfort, creates shadows, dim, special, functional, pleasant, and satisfying. Cronbach’s alpha values reached 0.77 and 0.69, respectively, for the daylight and artificial light evaluations, which are considered reliable and acceptable scores [51].
4. Results
4.1. Analysis of daylight
4.1.1. Hall (A)
This section presents the descriptive data relating to the daylight levels inside the investigated halls. Along with light measurements taken inside the dining hall, on a cloudy day, the meter measuring point located on the roof under an unobstructed sky registered average horizontal illuminance levels (HILsavg) of about 4,824.5 lux and 19,370 lux during breakfast (8:30–10:30) and lunch (11:30–14:30), respectively. For the light meters that were placed on the window stools, the HILavg during breakfast registered as 349 lux and 511 lux for the northern and western window stools, respectively. The HILavg during lunch registered as 992 lux and 4,047 lux for the northern and western window stools, respectively. Comparing the HILavg on the roof with the ones from the window stools, it was found that the HILavg values on the northern window stool were reduced by 93% and 95% during breakfast and lunch, respectively. Similarly, the HILavg values on the western window stool were reduced by 90% and 80% for breakfast and lunch, respectively.
For the illuminance levels inside hall (A), according to the lighting codes laid out by the Jordanian National Construction Constitution [35], the HILs registered on the table surfaces of a dining area in an educational building must be a minimum of 150 lux. Based on this stipulation, the indoor HILs recorded in hall (A) on a cloudy day did not met the recommended values during breakfast at any point. However, the recommended HILs were met only at a distance of 2 m from the northern and western windows during lunch, and the maximum value (968.02 lux) was recorded at a 2 m distance from the western window wall at lunch as well. The remaining area of the hall did not meet the recommended value at any time. Figure 6 shows the registered HILs on a cloudy day in hall (A).
On a sunny day, the roof meter registered HILavg values of about 37,391 lux and 83,866 lux during breakfast and lunch, respectively. The meters on the window stools registered HILavg values during breakfast of about 687 lux and 737 lux for the northern and western window stools, respectively. For lunch, the HILavg registered 917 lux and 5,061 lux for the northern and western window stools, respectively. This indicates a reduction of the registered HILavg of about 98% on the northern window stool during breakfast and lunch and a reduction of about 99% and 94% on the western window stool during breakfast and lunch, respectively.
The registered HILavg values at a distance of 2 m from the northern and western windows were found to be higher than the recommended value during both breakfast and lunch. The maximum HIL was also found close to the western window wall, where it registered 1,619 lux at lunchtime. The remaining area of hall (A) did not meet the recommended value at any time during the sunny day, similar to the cloudy day. Figure 7 shows the registered HILs on a sunny day in hall (A). Figure 8 presents the illuminance level measurements in relation to the recommended value (150 lux), based on the Jordanian lighting code and the time (breakfast vs. lunch) on both a cloudy and sunny day in hall (A). Table 6 presents the HILavg values for breakfast and lunch in relation to the meter measuring points (see Fig. 8) on both a cloudy and sunny day in hall (A).
Figure 8
Fig. 8. The registered HILs in relation to the recommended value (150 lux) presented with colour codes for a cloudy and sunny day in dining hall (A).
Table 6
Table 6. The average illuminance levels for breakfast and lunch time in relation to the meter measuring point on both a cloudy and sunny day in dining hall (A).
4.1.2. Hall (B)
In dining hall (B), there are only north-orientated windows. On a cloudy day, the HILavg measurements taken in the area at a 2 m distance from the north-facing windows corresponded with the recommended illuminance level (150 lux) during lunch, when the maximum recorded level was 665.28 lux at 12:47. However, the remaining area inside dining hall (B) did not reach the recommended illuminance level at any time during the cloudy day. Figure 9 shows the HILs recorded on a cloudy day in dining hall (B).
On a sunny day, the maximum HIL recorded was 1,009.28 lux at a 2 m distance from the northern windows at 16:27. This area received the recommended illuminance level during breakfast and lunch. The registered HILavg for the remaining area did not reach the recommended illuminance level. Figure 10 shows the HILs recorded on a sunny day in dining hall (B). Figure 11 presents the recorded illuminance levels in relation to the recommended value (150 lux), based on the Jordanian lighting code and time (breakfast vs. lunch) for both a cloudy and sunny day in dining hall (B). Table 7 presents the registered HILavg values for breakfast and lunch in relation to the meter measuring point (Fig. 11) on both a cloudy and sunny day in dining hall (B).
Figure 11
Fig. 11. The registered HILs in relation to the recommended value (150 lux) presented with colour codes for a cloudy and sunny day in dining hall (B).
Table 7
Table 7. The average illuminance levels for breakfast and lunch time in relation to the meter measuring point on both a cloudy and sunny day in dining hall (B).
4.1.3. Analysis of subjective measurements: daylight
The total number of responses was 239, of which 189 (79.1%) were responses from students from hall (A), and 50 (20.9%) were responses from employees from hall (B). Most of the respondents were within the 18–21 age group (53.8%), followed by the 26 and above age group (24.6%), then the 22–25 age group (20.4%), and finally, 18 or below (0.8%). There were 142 females (59.2%) and 97 males (40.4%), and most of the responses were from Jordanian citizens (93.3%). The questionnaire results were analysed using SPSS. The responses’ mean evaluation for items (factors) related to the daylight evaluation in the dining halls on a sunny day are described as follows: brightness and illumination were rated as “neutral” for both dining halls; uniformity and distribution of daylight were rated as “neutral” for hall (A) but “slightly low” for hall (B); glare was rated as “very low” for both dining halls; finally, visual comfort was rated as “neutral” for hall (A) and “slightly high” for hall (B).
Along with questionnaire results, objective light measurements were also recorded to measure the vertical illuminance levels (VILs) reached on walls (Table 6). In hall (A) on a cloudy day, the vertical measuring point (VMP) on the northern wall registered 15 lux and 71 lux at breakfast and lunch, respectively. On the western wall, the VMP registered 24 lux and 192 lux at breakfast and lunch, respectively. On a sunny day, the VMP on the northern wall registered 153 lux and 174 lux at breakfast and lunch, respectively. On the western wall, the VMP registered 241 lux and 348 lux at breakfast and lunch, respectively.
In hall (B) on a cloudy day, the VMP on the northern wall registered 19 lux and 81 lux at breakfast and lunch, respectively, while on the western wall, it registered 15 lux and 68 lux at breakfast and lunch, respectively. On a sunny day, the VMP on the northern wall registered 265 lux and 333 lux at breakfast and lunch, respectively while on the western wall, it registered 113 lux and 176 lux at breakfast and lunch, respectively. As such, the objective measurements of VILs on a sunny day corresponded with the subjective ratings on the daylight evaluation for both dining halls. Figure 12 shows a boxplot presentation of the variations in the subjective responses evaluating daylight factors in both halls (A) and (B).
Figure 12
Fig. 12. Boxplot representing the variations in the subjective responses between the investigated dining halls in evaluating daylight factors in a sunny day; rating scale from 1 (very low) to 7(very high).
4.2. Analysis of artificial lighting
The uniform distribution of light inside interior spaces results from arranging windows to provide direct daylight complemented by artificial lighting. Artificial lights can enhance the general ambiance, and help to meet functional and aesthetical requirements, particularly in areas that daylight cannot reach. The only type of artificial lighting used in hall (A) were ambient fluorescent tube lights that provided general luminance to the entire space, while hall (B) was fitted with both ambient fluorescent tube lights that cover the entire space as well as decorative spot lights around the central dome. Figure 13 shows fish-eye pictures of the artificial lighting installed in both dining halls (A) and (B). Figure 14 shows the ceiling plans of the installed artificial lighting in halls (A) and (B).
Figure 13
Fig. 13. Fish-eye pictures of the artificial lighting installed in both dining halls A (right) and B (left).
In this study, artificial lighting was detected at night (without the presence of daylight) in both halls (A) and (B). The Ubibot wireless light meters were placed on a grid on the dining tables (0.70 m above the floor). Figure 15 presents the location of the light meters in relation to the artificial lighting fixtures. Based on the descriptive analysis, it was found that in hall (A), the horizontal illuminance levels (HILs) produced by most of the artificial lights met the recommended value set out by the Jordanian lighting code (150 lux). In contrast, in hall (B), the HILs recorded from artificial lights were below 150 lux and so did not meet the recommended value. Table 8 shows the registered HILs for the artificial lighting in both dining halls.
Figure 15
Fig. 15. The location of light meters (meter measuring points) that were placed on dining tables in relation to the overhead artificial lighting above for dining halls (A) and (B).
Table 8
Table 8. Horizontal illuminance levels (lux) registered for the installed artificial lightings in dining halls (A) and (B).
4.2.1. Analysis of subjective measurement: artificial light
The subjective responses’ mean evaluation for factors related to the artificial light are as follows: adequate illumination and high visual comfort were rated as “slightly low” for hall (A) and “neutral” for hall (B); uniformity and good colour appearance were rated as “slightly low” for both dining halls; glare, flickering, and creates shadows were rated as “very low” in terms of having an effect on both dining halls. Similarly, the factors of special and pleasant for the artificial lighting were rated as “very low” for both dining halls. Although the factor of dim was rated as “high” for both dining halls, the functional factor was rated as “neutral” for both. Finally, the satisfying factor was rated as “slightly low” for hall (A) and “neutral” for hall (B). Figure 16 shows a boxplot presentation of the variations in the subjective responses evaluating artificial lighting factors for both dining halls.
Figure 16
Fig. 16. Boxplot representing the variation in subjective responses between the investigated dining halls; (A) and (B) in evaluating factors related to the artificial lightings. Rating scale from 1 (very low) to 7(very high).
Comparing the subjective mean evaluation for the artificial lighting with the objective evaluation presented in section 4.2 it can be noted that the factor of functional was rated as “neutral”, which corresponded with the registered HILs that were higher than 150 lux for most of the installed artificial lights in hall (A). However, the respondents rated the factors of adequate illumination and uniformity as “slightly low” and the dim factor as “high”. This means that the respondents’ subjective needs and preferences may not correspond with the objective measurements that are set in lighting codes. Similarly, in hall (B), the respondents rated the factor of dim as “high”, which corresponded with the registered HILs that were found to be less than 150 lux. Additionally, the factors of functional and adequate illumination were rated as “neutral”, which contradicts the objective measurements.
5. Discussion
The following discussion will delve into the descriptive analysis of the daylight levels recorded in the case study, and consider them mainly in terms of the recommendations set out by Hopkinson and Kay (1969) [33]. It is recommended to place windows in more than one wall, where possible, and preferably in adjacent walls for more adequate daylight penetration. Windows in adjacent walls can reduce glare by minimising the contrast between the brightness of the sky outside and the interior. This recommendation was complied with in hall (A), where windows were placed in adjacent walls. As a result, the daylight levels registered in hall (A) were higher than those recorded in hall (B), where windows were located in just one wall. This recommendation is applicable only where there are no obstructions that prevent opening windows on a wall. However, hall (B) does indeed have such obstructions.
Another key recommendation by Hopkinson and Kay (1969) [33] is that it is convenient to provide a building with natural light during daylight hours and to use artificial lighting for “emphasis”. Therefore, a combination of natural and artificial lighting should be employed (the former for general lighting, with the latter used as a supplement with directional characteristics). In hall (A), the average horizontal illuminance levels (HILsavg) were above the recommended value (150 lux) only at a distance of 2 m from the northern and western windows, on both a cloudy (lunchtime) and sunny day, as the horizontal illuminance levels (HILs) dropped by more than 80% of its value outside. However, the vertical illuminance levels (VILs) registered higher than 150 lux on a sunny day, so most of the subjective mean evaluations for the daylight factors, such as brightness, illumination, uniformity, and visual comfort were rated as “neutral”. For the artificial lighting, general ambient tube lights were used, without any special or decorative artificial lights. This was confirmed in the subjective mean evaluation for artificial lighting, in which the factors of special and pleasant were rated as “very low”, the dim factor was rated as “high”, and the satisfying factor was rated as “slightly low” in hall (A). Although the illuminance levels of the artificial lights were higher than the recommended value (150 lux), it was rated as “slightly low”, and the functional factor was rated as “neutral”.
Similarly, in hall (B), the HILavg values were above the recommended value (150 lux) only at a distance of 2 m from the northern windows on both a cloudy (lunch time) and sunny day. The VILs mostly registered higher than 150 lux, so the subjective mean evaluation of the daylight factors, such as brightness, illumination, and visual comfort were rated as “neutral”. For the artificial lighting in hall (B), both general and directional lighting systems were installed. Nevertheless, the illuminance levels in both systems were lower than the recommended value and can therefore be classed as inefficient [36]. The subjective mean evaluation for the artificial lighting factors, such as special and pleasant were rated as “very low”, and the dim factor was rated as “high”. Nevertheless, the respondents rated the adequate illuminance, functional, and satisfying factors as “neutral”, which contradicts the objective measurements. It is important to mention that the subjective responses in hall (B) were mostly based on employees’ perspectives while in hall (A), they were mostly based on students’ perspectives, which might have an effect in rating some factors, such as satisfying.
The daylight that penetrates inside an interior environment comes from multiple sources: the sky component (SC) received directly from the outside sky through the windows; the external reflected component (ERC), which is light reflected from external surfaces and highly impacted by the surrounding built up-areas; and the internal reflected component (IRC,) received after being reflected and interrelated from the entire surfaces of the interior [33]. With this in mind, it is evident that internal decorations, including furniture inside dining halls, have a crucial impact on the total daylight measured inside an interior, particularly for areas that are far from a window. As a result, the internal reflected component (i.e. internal decorations) in dining hall (A) was greater than in dining hall (B). The sky component (SC) and/or external reflected component (ERC), both of which come from the outside, were found to vary according to the distance from the windows. This was the case in both dining halls and on both a cloudy and sunny day, with daylight levels reaching the recommended value (150 lux) only at a two-metre distance from the northern windows in both halls, and at a two-metre distance from the western windows in just hall (A). This means that only 21% and 10% of the total dining floor area was daylit in hall (A) and hall (B), respectively.
Although the window-to-wall area ratio (WWR) was around 85% in both dining halls, the employment of side-lighting alone was insufficient to guarantee the required quantities of daylight [33]. As a result, the window-to-floor area ratio (WFR) had a greater impact on daylight availability, particularly with such large floor areas. Dining halls (A) and (B) had a WFR of around 15% and 24%, respectively. VELUX (2020) [53] state that in order to ensure adequate levels of daylight, it is recommended to ensure a ratio of no less than 20% of the glazed area of all windows to the floor area of an interior. Using the VELUX Daylight Calculator [52], dining hall (A) has a current glazed area of 12.2% (67.2 m2). Therefore, to meet the 20% daylight recommendation, 7.8% (43.20 m2) more glazing is needed. In dining hall (B), even though the current glazed area is 23.5% (80 m2), the hall requires further solutions to ensure adequate daylight levels, particularly in the deepest interior areas.
The area of glazing is crucial for providing the required daylight levels inside a room. Daylight penetration depends upon the shape of windows, their positioning, and their transmission properties. The design and arrangement of a glazed area should take into consideration the use of an environment and the tasks carried out within it [33]. As window orientation and position play a major role, natural light coming from the outside sky through the roof (Skylighting) would be considered more convenient and efficient for daylighting design than vertical side-windows. In hall (A), there was no skylight, but hall (B) had a grand dome. However, this dome was totally covered at the top in concrete, leaving windows on just the sides (clerestory windows). The penetration of daylight from the side clerestory windows was much lower than would be obtained from a typical roof skylight, and distribution was not uniform, which explains their minimal contribution to daylight on the overall floor area in dining hall (B).
Furthermore, room dimensions also have an impact upon the daylight distribution within an interior environment. There is an inverse relationship between the levels of daylight and the distance from the windows [18]. Deeper penetration of daylight may be guaranteed by placing a tall vertical window at a higher position than the working plan (i.e., dining tables, in this study). This will allow direct light from the sky to penetrate to the horizontal surfaces [33]. Optimum daylight penetration and distribution can be approached by employing a ratio of 1:2 for window height to interior depth [54]. Another rule-of-thumb proposed by Robinson and Selkowitz (2013) [55] is that the practical depth of a daylit zone is 1.5 times window head height; where the window has a reflective light shelf, the depth becomes 1.5-2 times the window head height. Nevertheless, applying this rule did not in fact guarantee a practical depth of daylight in this study. In the investigated dining halls (A) and (B), 1.5 times the window head height would be equal to 5m and 4m, respectively. But measurements of the illuminance levels over the dining tables showed that it was only the zone two metres from the northern and western windows that offered adequate practical daylight levels.
The lower direct daylight found in this study can be accounted for by the obstructions, the dirt on windows, and the light-metal window frames, all of which made it difficult to ensure sufficient daylight levels at all times. Therefore, the integration of natural and artificial lighting was necessary to provide uniform distribution and adequate lighting inside the interior environments. In hall (A), the artificial lighting levels reached the recommended value (150 lux), but there was no intelligent integration with the natural light. The colour temperature was over 5000 K, with the light appearing white. The installation was designed to provide ambient light, but with no attention to practical considerations or aesthetics. Similar lighting characteristics were observed in hall (B). However, the levels of light did not reach the recommended value, and the decorative spot lights installed beneath the dome were not sufficiently functional.
This study recommends further research involve comparing current conditions with those following proposed improvements. For example, the current window size could be expanded and the configuration altered. Moreover, the furniture and inner surfaces could be redesigned to change reflectance levels, and top lighting (skylight windows) could be installed to provide greater penetration of daylight to the dining tables than side-lighting (vertical windows). Such windows could also open up views that make a connection between interior environments and the outdoors to create a more pleasant atmosphere. Further research could consider this variable and its relation to interior daylight in the context university foodservice. The findings of this study are based on studying the restaurants at a single university. For a more generalizable evaluation of daylight in university foodservice, it would be recommended to conduct the study in other locations to validate the fundamental findings in foodservice research.
6. Conclusion
University foodservice has the potential to become a large enough market to compete with other restaurant and fast food businesses. The designing of lighting for university foodservice should focus on cost-effective measures and energy efficiency without affecting food quality or speed of service. This study presents an empirical evaluation of the availability of daylight in a real-world setting: the dining halls at the University of Jordan. Although daylight is considered an intangible variable that is difficult to predict, measuring horizontal illuminance levels above a working plan (dining tables in this study) can provide a clear estimation of the quantity of daylight penetrating inside an interior environment to assess whether it is sufficient for the tasks taking place therein. In the investigated dining halls (A) and (B), there was found to be limited penetration of daylight due to the relationship between the glazed areas and the halls’ dimensions, as well as the characteristics of the windows and the reflectance of the inner surfaces. Therefore, it can be concluded that there is the need to conduct an appraisal of the lighting within the interior of the dining halls, and to plan an intelligent integration of daylight with artificial light.
Acknowledgement
The author wishes to thank the administrative unit of the dining halls at the University of Jordan for their help and support while conducting this study. Special thanks also go to the university’s engineering department and Eng. Sa’ed Ayasrah for providing so much helpful information about the restaurant.
Declaration of competing interest
The authors declare no conflict of interest.
References
- J. S. Horng, S. F. Chou, C. H. Liu, and C. Y. Tsai, Creativity, aesthetics and eco-friendliness: A physical dining environment design synthetic assessment model of innovative restaurants, Tour. Manag 36, (2013) 15-25. https://doi.org/10.1016/j.tourman.2012.11.002
- J. C. Birchfield and R. T. Sparrowe, Design and Layout of Foodservice Facilities, 2nd editio. Hoboken, New Jersey: John Wiley and Sons, 2003.
- R. Mannapova N, ORGANIZATION AND BASIC REQUIREMENTS FOR RESTAURANT DESIGN INTERIOR, Novat. Publ. Int. J. Innov. Eng. Res. Technol 7, (2020) 2394-3696.
- H. Han and K. Ryu, The roles of the physical environment, price perception, and customer satisfaction in determining customer loyalty in the restaurant industry, J. Hosp. Tour. Res 33, (2009), 487-510. https://doi.org/10.1177/1096348009344212
- S. K. A. Robson and S. E. Kimes, Examining the Effects of Full-Spectrum Lighting in a Restaurant, 2007. https://doi.org/10.7591/9781501736520-011
- D. S Y Y Alsharhan, DineLight: Lighting and The Dining Experience, Arizona State University, 2017.
- H. F. Ariffin, M. F. Bibon, and R. P. S. R. Abdullah, Restaurant's Atmospheric Elements: What the Customer Wants, Procedia - Soc. Behav. Sci 38, (2012) 380-387. https://doi.org/10.1016/j.sbspro.2012.03.360
- M. A. Hassanain, H. Mathar, and A. Aker, Post-occupancy evaluation of a university student cafeteria, Archit. Eng. Des. Manag 12, (2016) 67-77. https://doi.org/10.1080/17452007.2015.1092941
- X. Liang and S. Zhang, Investigation of customer satisfaction in student food service: An example of student cafeteria in NHH, Int. J. Qual. Serv. Sci 1, (2009) 113-124. https://doi.org/10.1108/17566690910945903
- S. S. Andaleeb and A. Caskey, Satisfaction with food services: Insights from a college cafeteria, J. Foodserv. Bus. Res 10, (2007) 51-65. https://doi.org/10.1300/J369v10n02_04
- L. Bellia, A. Pedace, and G. Barbato, Lighting in educational environments: An example of a complete analysis of the effects of daylight and electric light on occupants, Build. Environ., 2013. https://doi.org/10.1016/j.buildenv.2013.04.005
- S. M. Zazarin, Z. Abdul Aziz, and C. Heng Yii Sern, A Study on Daylight Conditions of Dementia Care Facilities in Malaysia, J. Kejuruter 6, (2023) 89-102. https://doi.org/10.17576/jkukm-2023-si6(1)-09
- I. Acosta, C. Munoz, M. A. Campano, and J. Navarro, Analysis of daylight factors and energy saving allowed by windows under overcast sky conditions, Renew. Energy 77, (2015) 194-207. https://doi.org/10.1016/j.renene.2014.12.017
- M. G. M. Stokkermans, Y. Chen, M. J. Murdoch, and I. M. C. L. Vogels, Effect of daylight on atmosphere perception: comparison of a real space and visualizations, 2015. https://doi.org/10.1117/12.2077078
- N. Drosou, E. Brembilla, J. Mardaljevic, and V. Haines, Reality Bites: Measuring Actual Daylighting Performance in Classrooms, in 36th International Conference on Passive and Low Energy Architecture, 2016, pp. 953-959.
- E. Brembilla, N. C. Drosou, and J. Mardaljevic, Assessing daylight performance in use: A comparison between long-term daylight measurements and simulations, Energy Build 262, (2022). https://doi.org/10.1016/j.enbuild.2022.111989
- R. Viula, R. Bokel, and M. Tenpierik, Prediction of discomfort from glare from daylight in classrooms, Light. Res. Technol 55, (2023) 712-729. https://doi.org/10.1177/14771535231173291
- E. Mayah, The Investigation of façade Fenestration for Daylighting Levels and Experienced Atmosphere in Design Studios Under Overcast Sky - ProQuest Dissertations & Theses Global - ProQuest, Mackintosh School of Architecture- Glasgow School of Art, 2021.
- E. Mayah and R. Hanna, Analyzing Façade Scenarios and Daylight Levels, Int. J. Archit. Environ. Eng. 13, (2019) 313-324.
- R. N. S. Raja Mohd Yazit, E. Mohd Husini, M. K. Khamis, M. F. Zolkefli, and Y. A. Dodo, Illuminance Level Measurement at Lower Working Plane Height in Islamic Religious School, Asian J. Univ. Educ 16, (2020) 125. https://doi.org/10.24191/ajue.v16i3.11076
- P. Singh, M. P. Singh, and R. Arora, Classroom Illuminance: Its impact on Students' Health Exposure & Concentration Performance, 2014, [Online]. Available: https://www.researchgate.net/publication/311301869.
- A. Alah, Ahadi, M. Khanmohammadi, M. Masoudinejad, and B. Alirezaie, Improving student performance by proper utilization of daylight in educational environments (Case study: IUST 1 School of Architecture), Acta Tech. Napocensis Civ. Eng. Archit 59, (2016).
- Z. S. Zomorodian, S. S. Korsavi, and M. Tahsildoost, The effect of window configuration on daylight performance in classrooms: A field and simulation study, Int. J. Archit. Eng. Urban Plan 26, (2016) 15-24.
- S. S. Korsavi, Z. S. Zomorodian, and M. Tahsildoost, Visual comfort assessment of daylit and sunlit areas: A longitudinal field survey in classrooms in Kashan, Iran, Energy Build 128, (2016) 305-318. https://doi.org/10.1016/j.enbuild.2016.06.091
- T. woo Kim, W. hwa Hong, and H. tae Kim, Daylight evaluation for educational facilities established in high-rise housing complexes in Daegu, South Korea, Build. Environ., (2014). https://doi.org/10.1016/j.buildenv.2014.04.026
- P. Bakmohammadi and E. Noorzai, Optimization of the design of the primary school classrooms in terms of energy and daylight performance considering occupants' thermal and visual comfort, Energy Reports 6, (2020) 1590-1607. https://doi.org/10.1016/j.egyr.2020.06.008
- A. A. Y. Freewan and J. A. Al Dalala, Assessment of daylight performance of Advanced Daylighting Strategies in Large University Classrooms; Case Study Classrooms at JUST, Alexandria Eng. J 59, (2020) 791-802. https://doi.org/10.1016/j.aej.2019.12.049
- Z. S. Zomorodian and M. Tahsildoost, Assessing the effectiveness of dynamic metrics in predicting daylight availability and visual comfort in classrooms, Renew. Energy, (2019) 669-680. https://doi.org/10.1016/j.renene.2018.11.072
- N. Barzanooni and H. R. Haghgou, Designing and Application of Solar Active Systems for Hakim Sabzevari University: A Case Study of the Dining Hall, J. Renew. Energy Environ. JJREE 6, (2019) 1-7.
- K. Barmore-Mccollum, S. Post-Holmberg, and C. T. Griffin, Analyzing Daylight Autonomy: New Dining Hall at George Fox University, Portland State, 2014. [Online]. Available: https://pdxscholar.library.pdx.edu/research_based_design.
- P. Raynham, P. R. Boyce, J. Fitzpatrick, and Society of Light and Lighting., The SLL code for lighting. London: CIBSE, 2012.
- S. M. Secker and P. J. L. Ma, Daylight availability and lighting use : Geographical, Light. Res. Technol 19, (1987) 25-34. https://doi.org/10.1177/096032718701900201
- R. G. Hopkinson and J. D. Kay, The Lighting of Buildings. London: The Trinity Press, 1969.
- P. Tregenza and M. Wilson, Daylighting: architecture and lighting design. London: Routledge, 2011.
- R. S. Society and F. Aldawood, Jordanian National Construction Constitution: Interior Lighting Code. Amman: Ministry of Public Works & Housing, 1988.
- P. Xue, C. M. Mak, and H. D. Cheung, The effects of daylighting and human behavior on luminous comfort in residential buildings: A questionnaire survey, Build. Environ 81, (2014) 51-59. https://doi.org/10.1016/j.buildenv.2014.06.011
- R. Hanna, Environmental appraisal of historic buildings in Scotland: The case study of the Glasgow School of Art, Build. Environ 37, (2002) 1-10. https://doi.org/10.1016/S0360-1323(00)00099-8
- E. Brembilla and J. Mardaljevic, Climate-Based Daylight Modelling for compliance verification: Benchmarking multiple state-of-the-art methods, Build. Environ 158, (2019) 151-164. https://doi.org/10.1016/j.buildenv.2019.04.051
- E. Brembilla, D. A. Chi, C. J. Hopfe, and J. Mardaljevic, Evaluation of climate-based daylighting techniques for complex fenestration and shading systems, Energy Build 203, (2019). https://doi.org/10.1016/j.enbuild.2019.109454
- D. A. Chi, D. Moreno, and J. Navarro, Correlating daylight availability metric with lighting, heating and cooling energy consumptions, Build. Environ 132, (2018) 170-180. https://doi.org/10.1016/j.buildenv.2018.01.048
- L. Bellia, F. Fragliasso, and E. Stefanizzi, Daylit offices: A comparison between measured parameters assessing light quality and users' opinions, Build. Environ 113, (2017) 92-106. https://doi.org/10.1016/j.buildenv.2016.08.014
- K. Chamilothori, G. Chinazzo, J. Rodrigues, E. S. Dan-Glauser, J. Wienold, and M. Andersen, Subjective and physiological responses to façade and sunlight pattern geometry in virtual reality, Build. Environ 150, (2019) 144-155. https://doi.org/10.1016/j.buildenv.2019.01.009
- J. Mardaljevic, S. Cannon-Brookes, N. Blades, and K. Lithgow, Reconstruction of cumulative daylight illumination fields from high dynamic range imaging: Theory, deployment and in-situ validation, Light. Res. Technol 53, (2021) 311-331. https://doi.org/10.1177/1477153520945755
- I. L. Wong, A review of daylighting design and implementation in buildings, Renewable and Sustainable Energy Reviews 74, (2017) 959-968. https://doi.org/10.1016/j.rser.2017.03.061
- J. Mardaljevic, Rethinking daylighting and compliance, SDAR* J. Sustain. Des. Appl. Res. Res 1, (2013). https://doi.org/10.1007/978-3-642-27851-8_258-1
- P. Tregenza and J. Mardaljevic, Daylighting buildings: Standards and the needs of the designer, Light. Res. Technol 50, (2018) 63-79. https://doi.org/10.1177/1477153517740611
- Timeanddate, Time and Date AS, 2024. https://www.timeanddate.com/sun/jordan/amman?month=7&year=2023 (accessed Feb. 20, 2024).
- Meteoblue, Meteoblue, 2024. https://www.meteoblue.com/en/historyplus (accessed Feb. 20, 2024).
- J. E. Flynn, T. J. Spencer, O. Martyniuk, and C. Hendrick, interim study of procedures for investigating the effect of light on impression and behavior, J. Illum. Eng. Soc 3, (1973) 87-94. https://doi.org/10.1080/00994480.1973.10732231
- L. J. Cronbach, COEFFICIENT ALPHA AND THE INTERNAL STRUCTURE OF TESTS*, Psychometrika 16, (1951) 297-334. https://doi.org/10.1007/BF02310555
- J. M. Cortina, What Is Coefficient Alpha? An Examination of Theory and Applications, J. Appl. Psychol 78, (1993) 98-104. https://doi.org/10.1037/0021-9010.78.1.98
- VELUX, Daylight calculator, 2024. https://resources.velux.co.uk/daylightcalculator (accessed Feb. 20, 2024).
- VELUX, Parameters influencing daylighting performance, 2020. https://www.velux.com/deic/daylight/parameters-influencing-daylighting-performance (accessed Feb. 20, 2024).
- R. G. Hopkinson, P. Petherbridge, and J. Longmore, Daylighting. London : Heinemann, 1966.
- A. Robinson and S. Selkowitz, Tips for Daylighting with Windows, United States, 2013. https://doi.org/10.2172/1167562
Copyright © 2024 The Author(s). Published by solarlits.com.
 HOME
HOME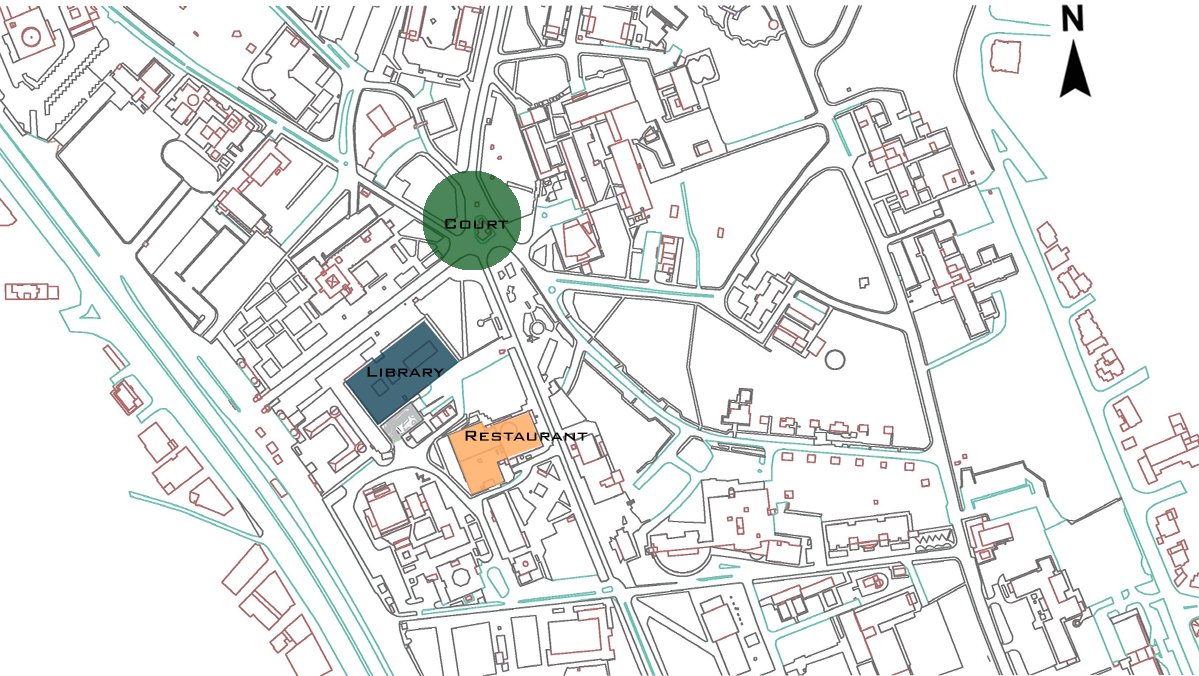 Figure 1
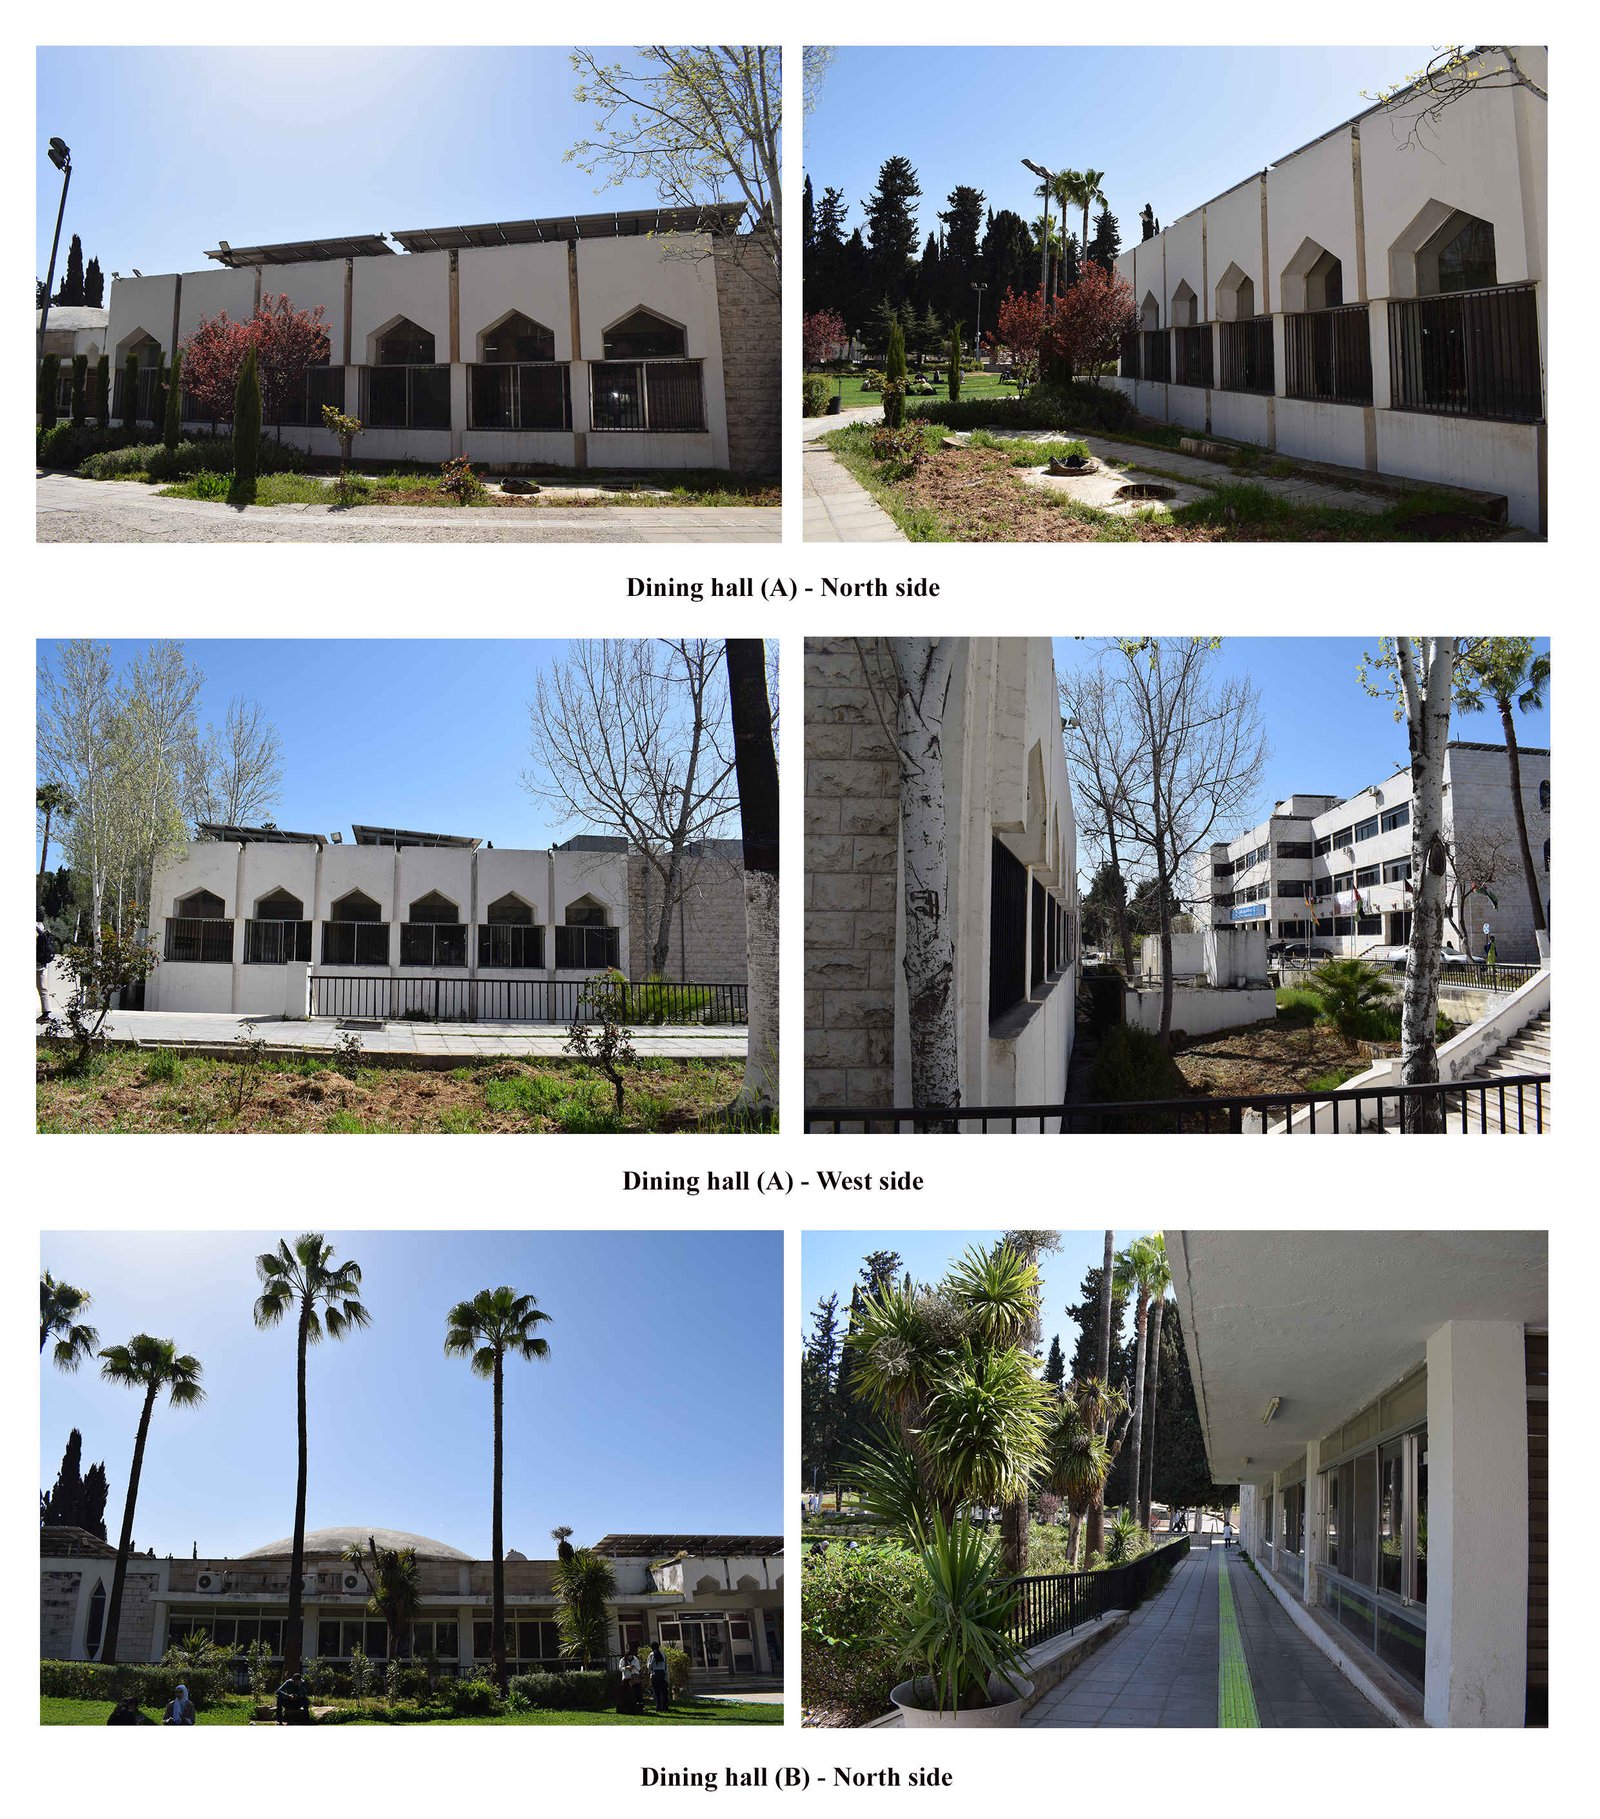 Figure 2
 Figure 3
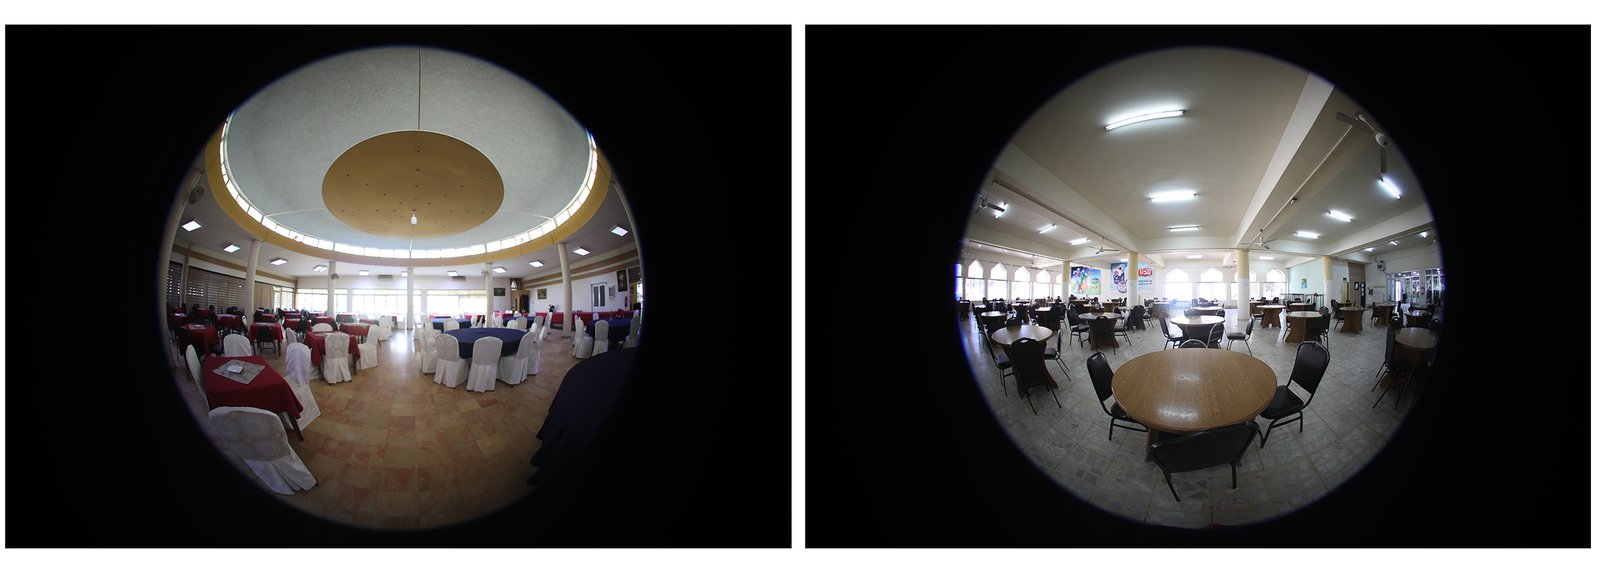 Figure 4
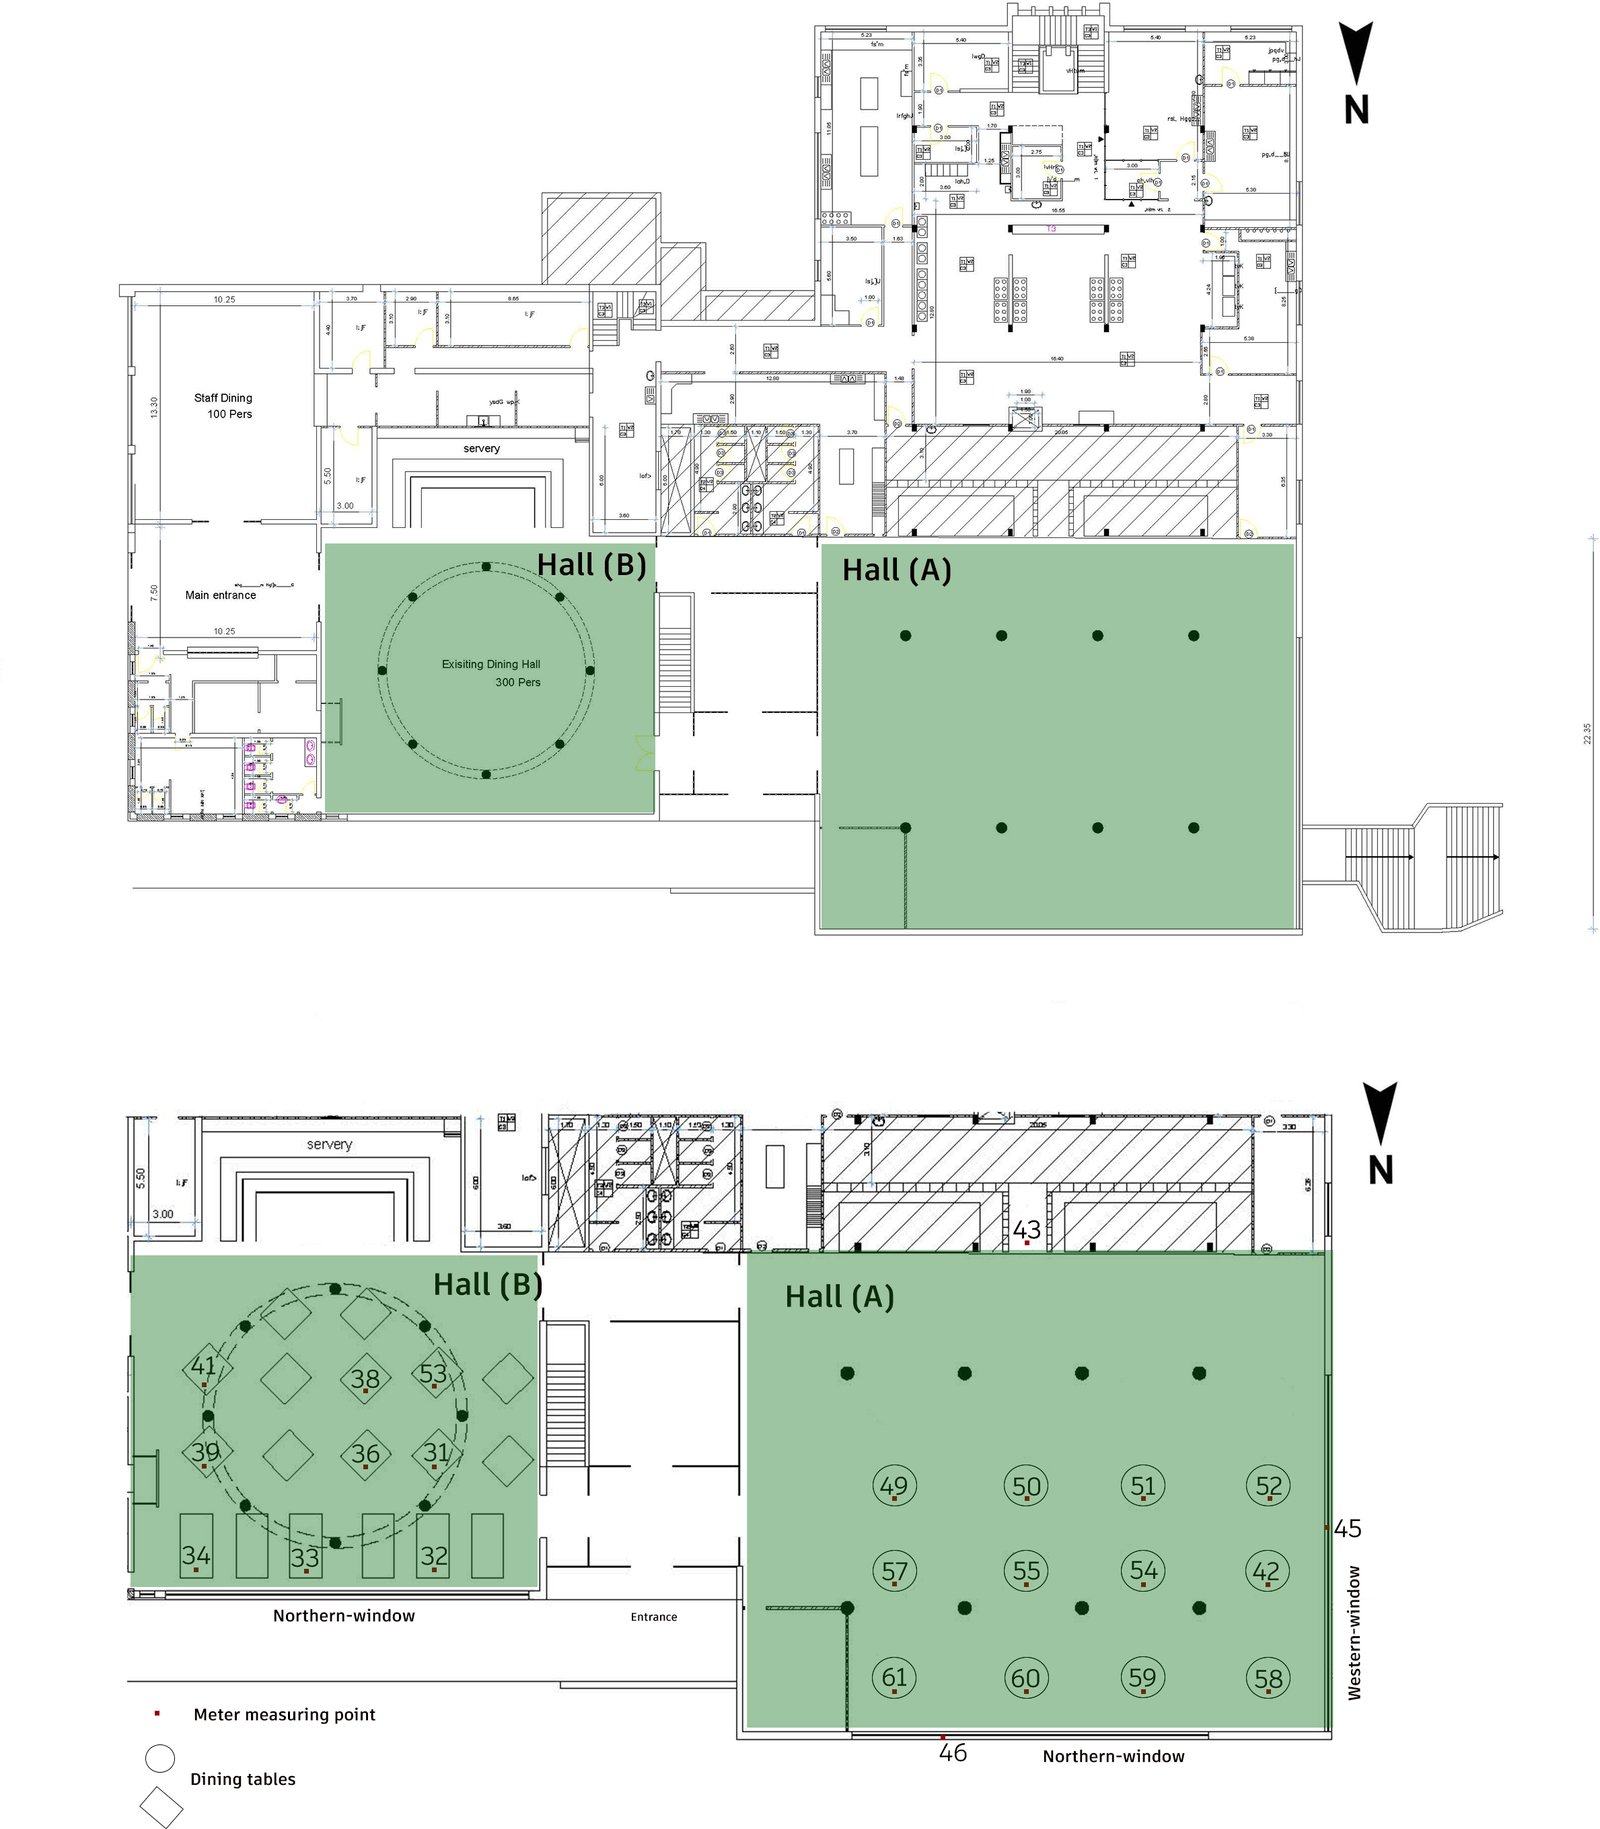 Figure 5
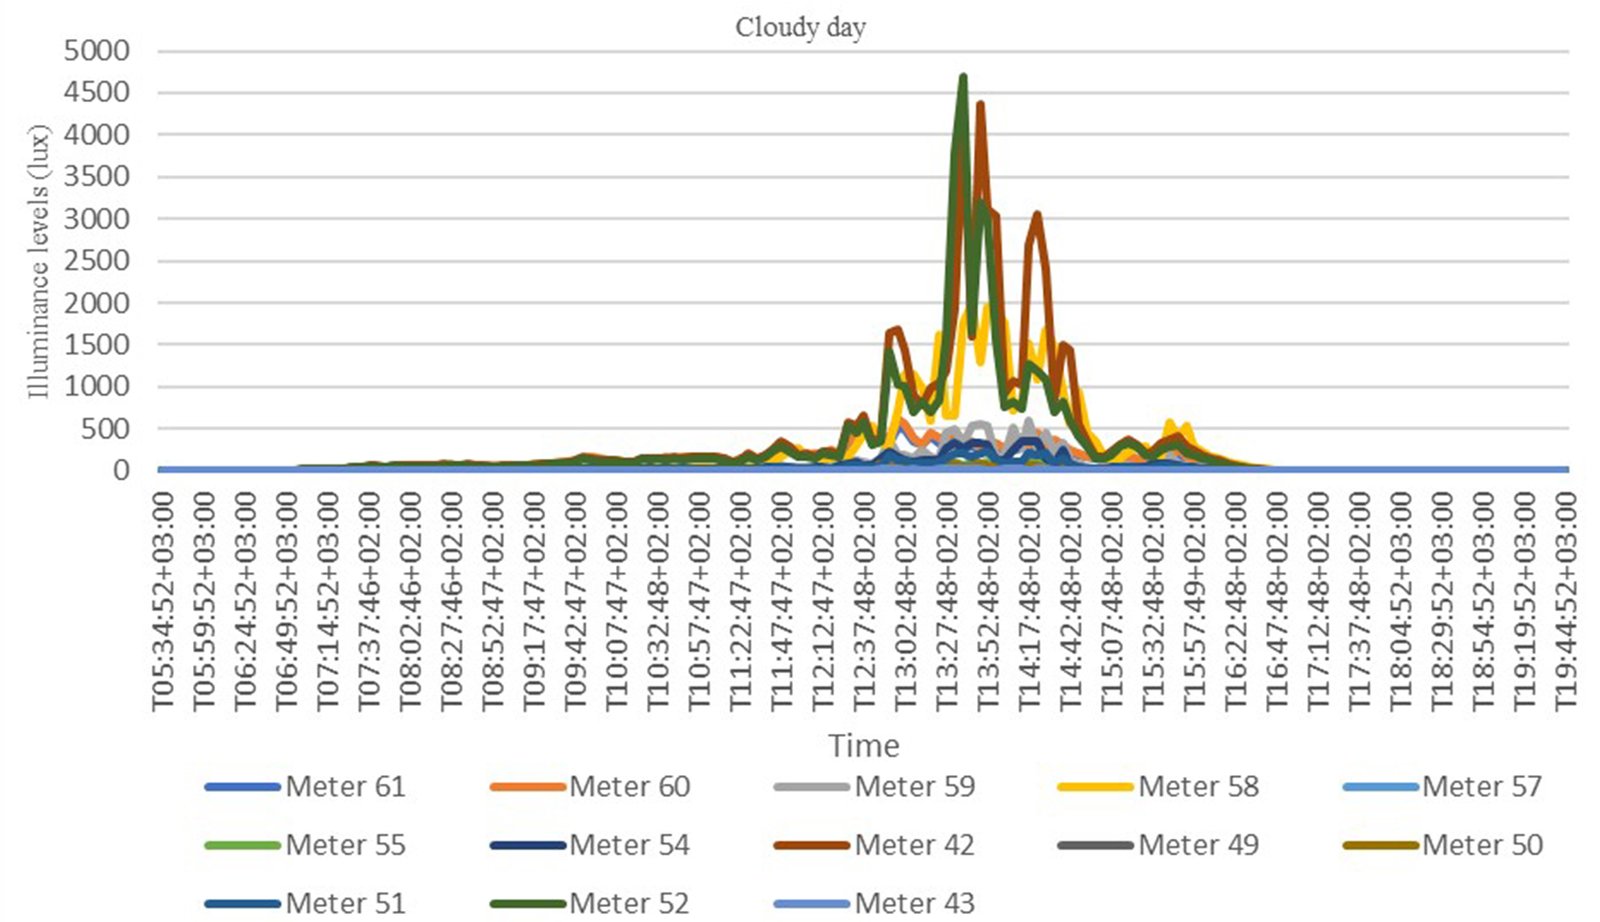 Figure 6
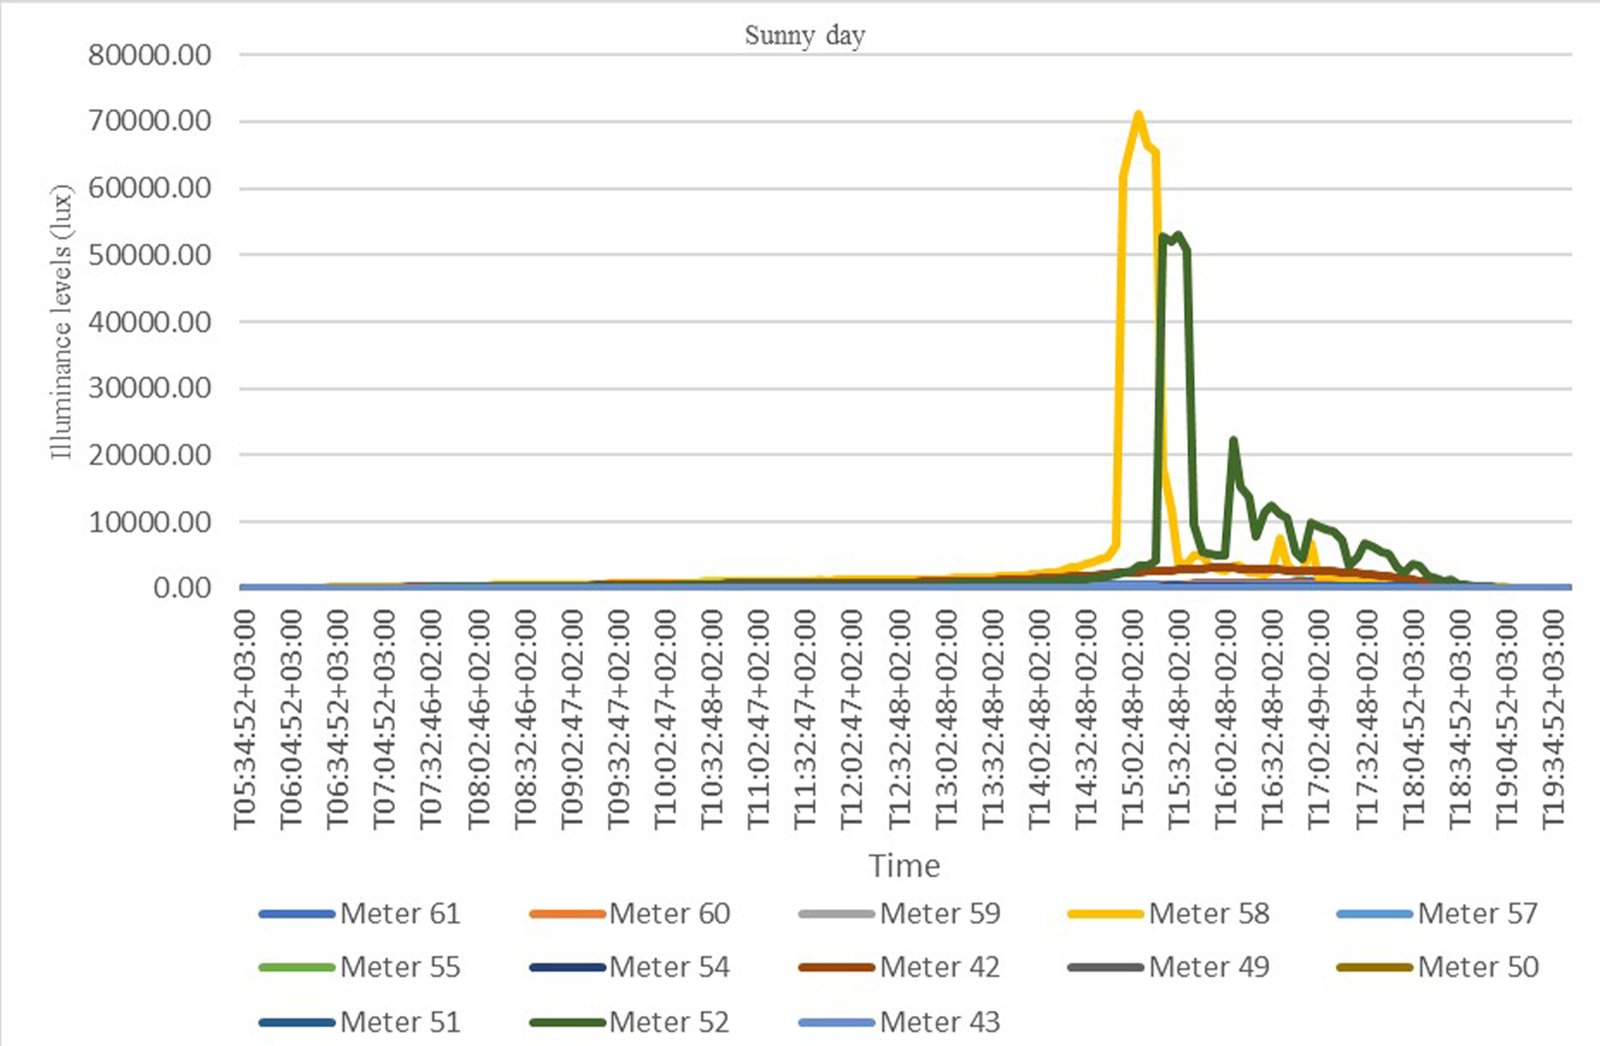 Figure 7
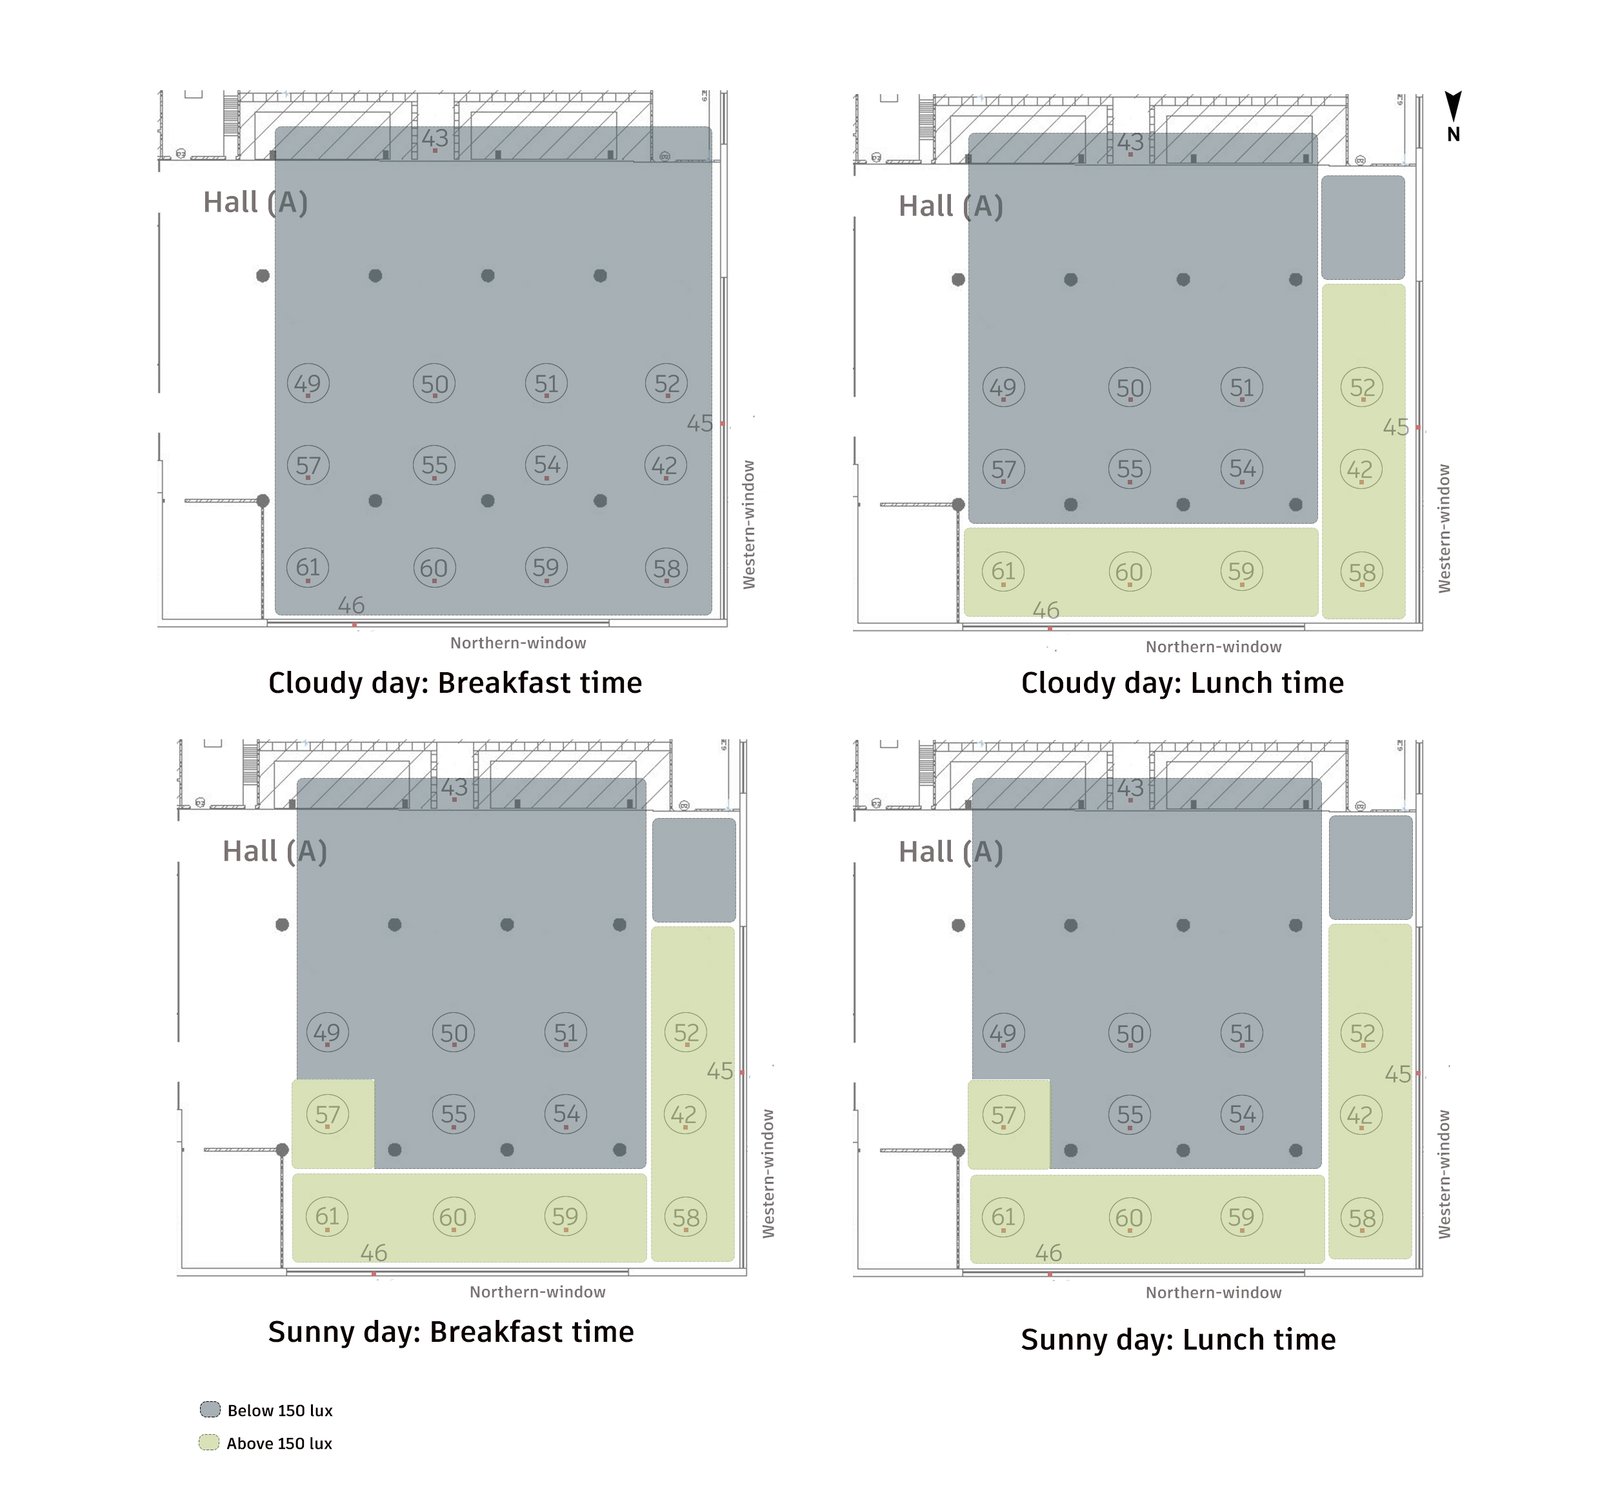 Figure 8
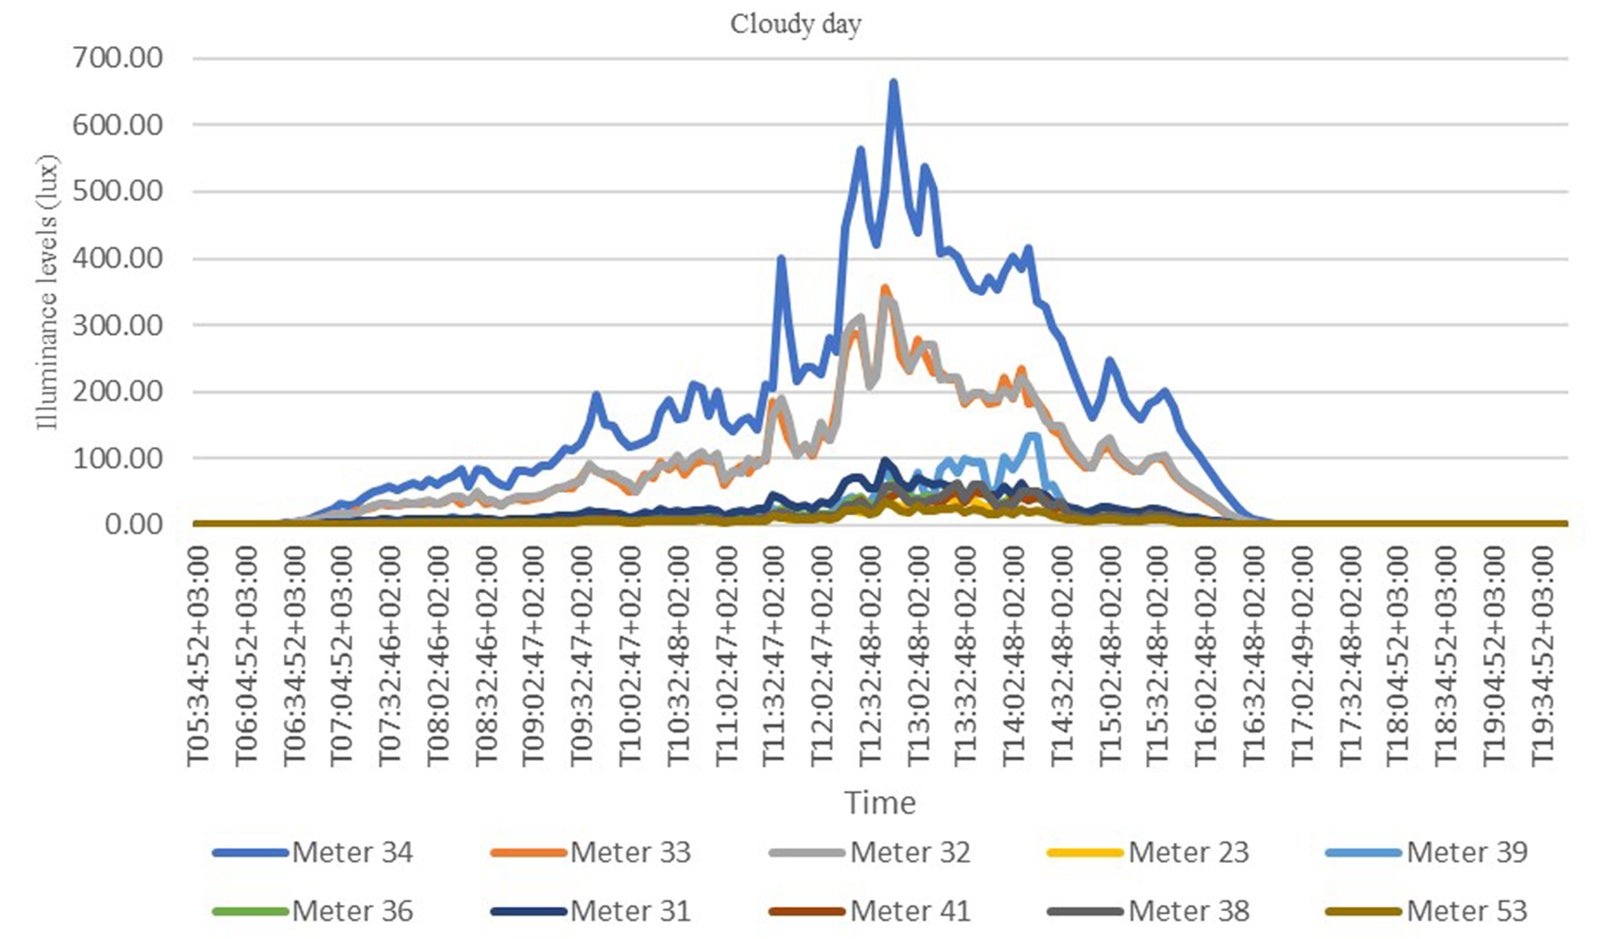 Figure 9
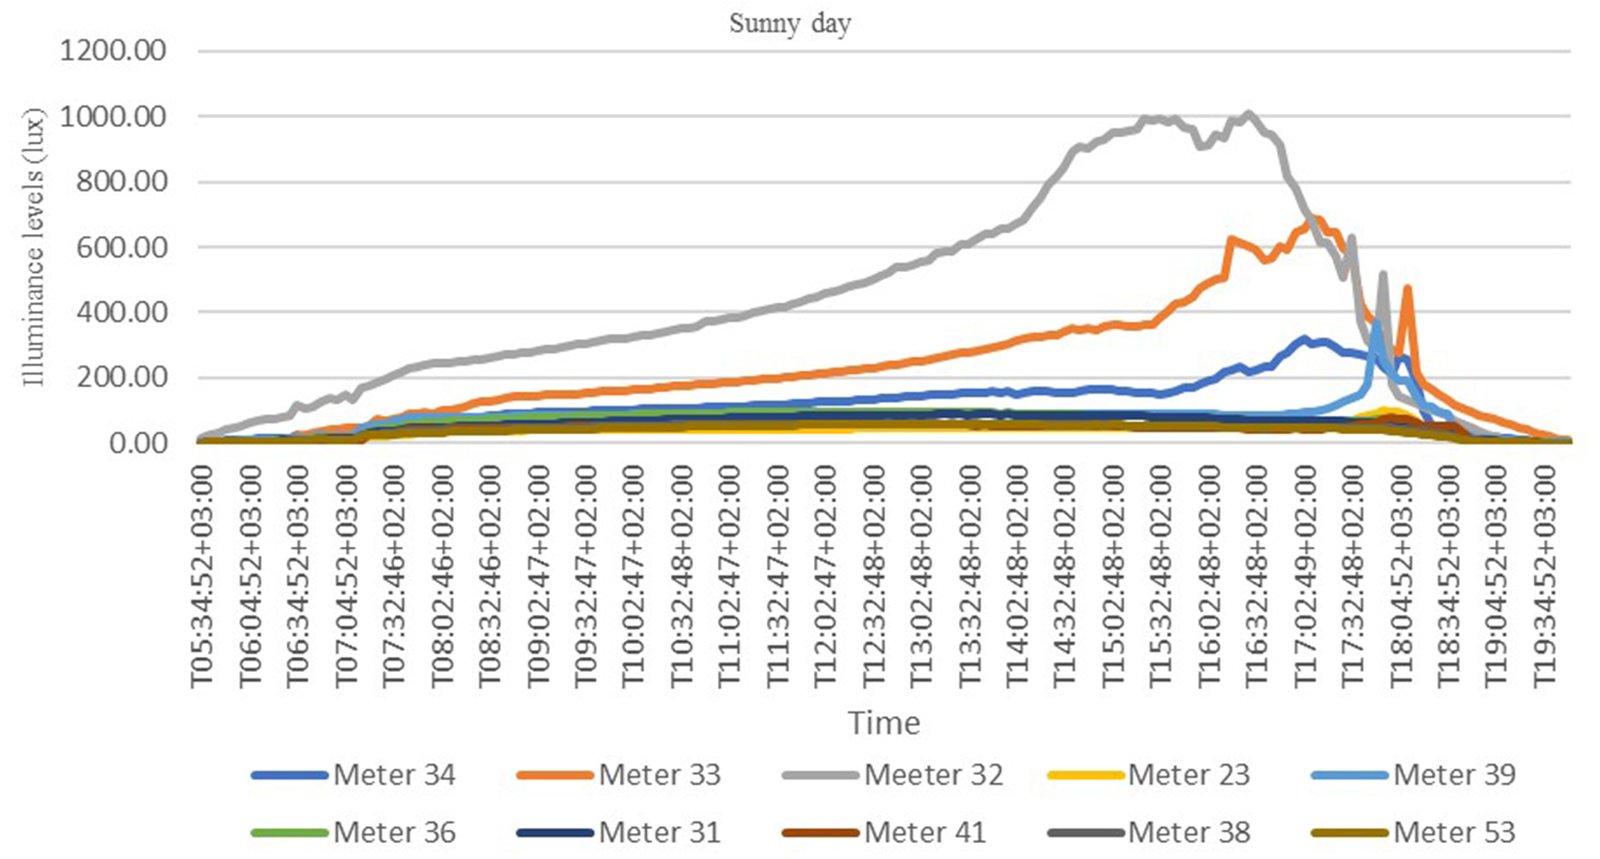 Figure 10
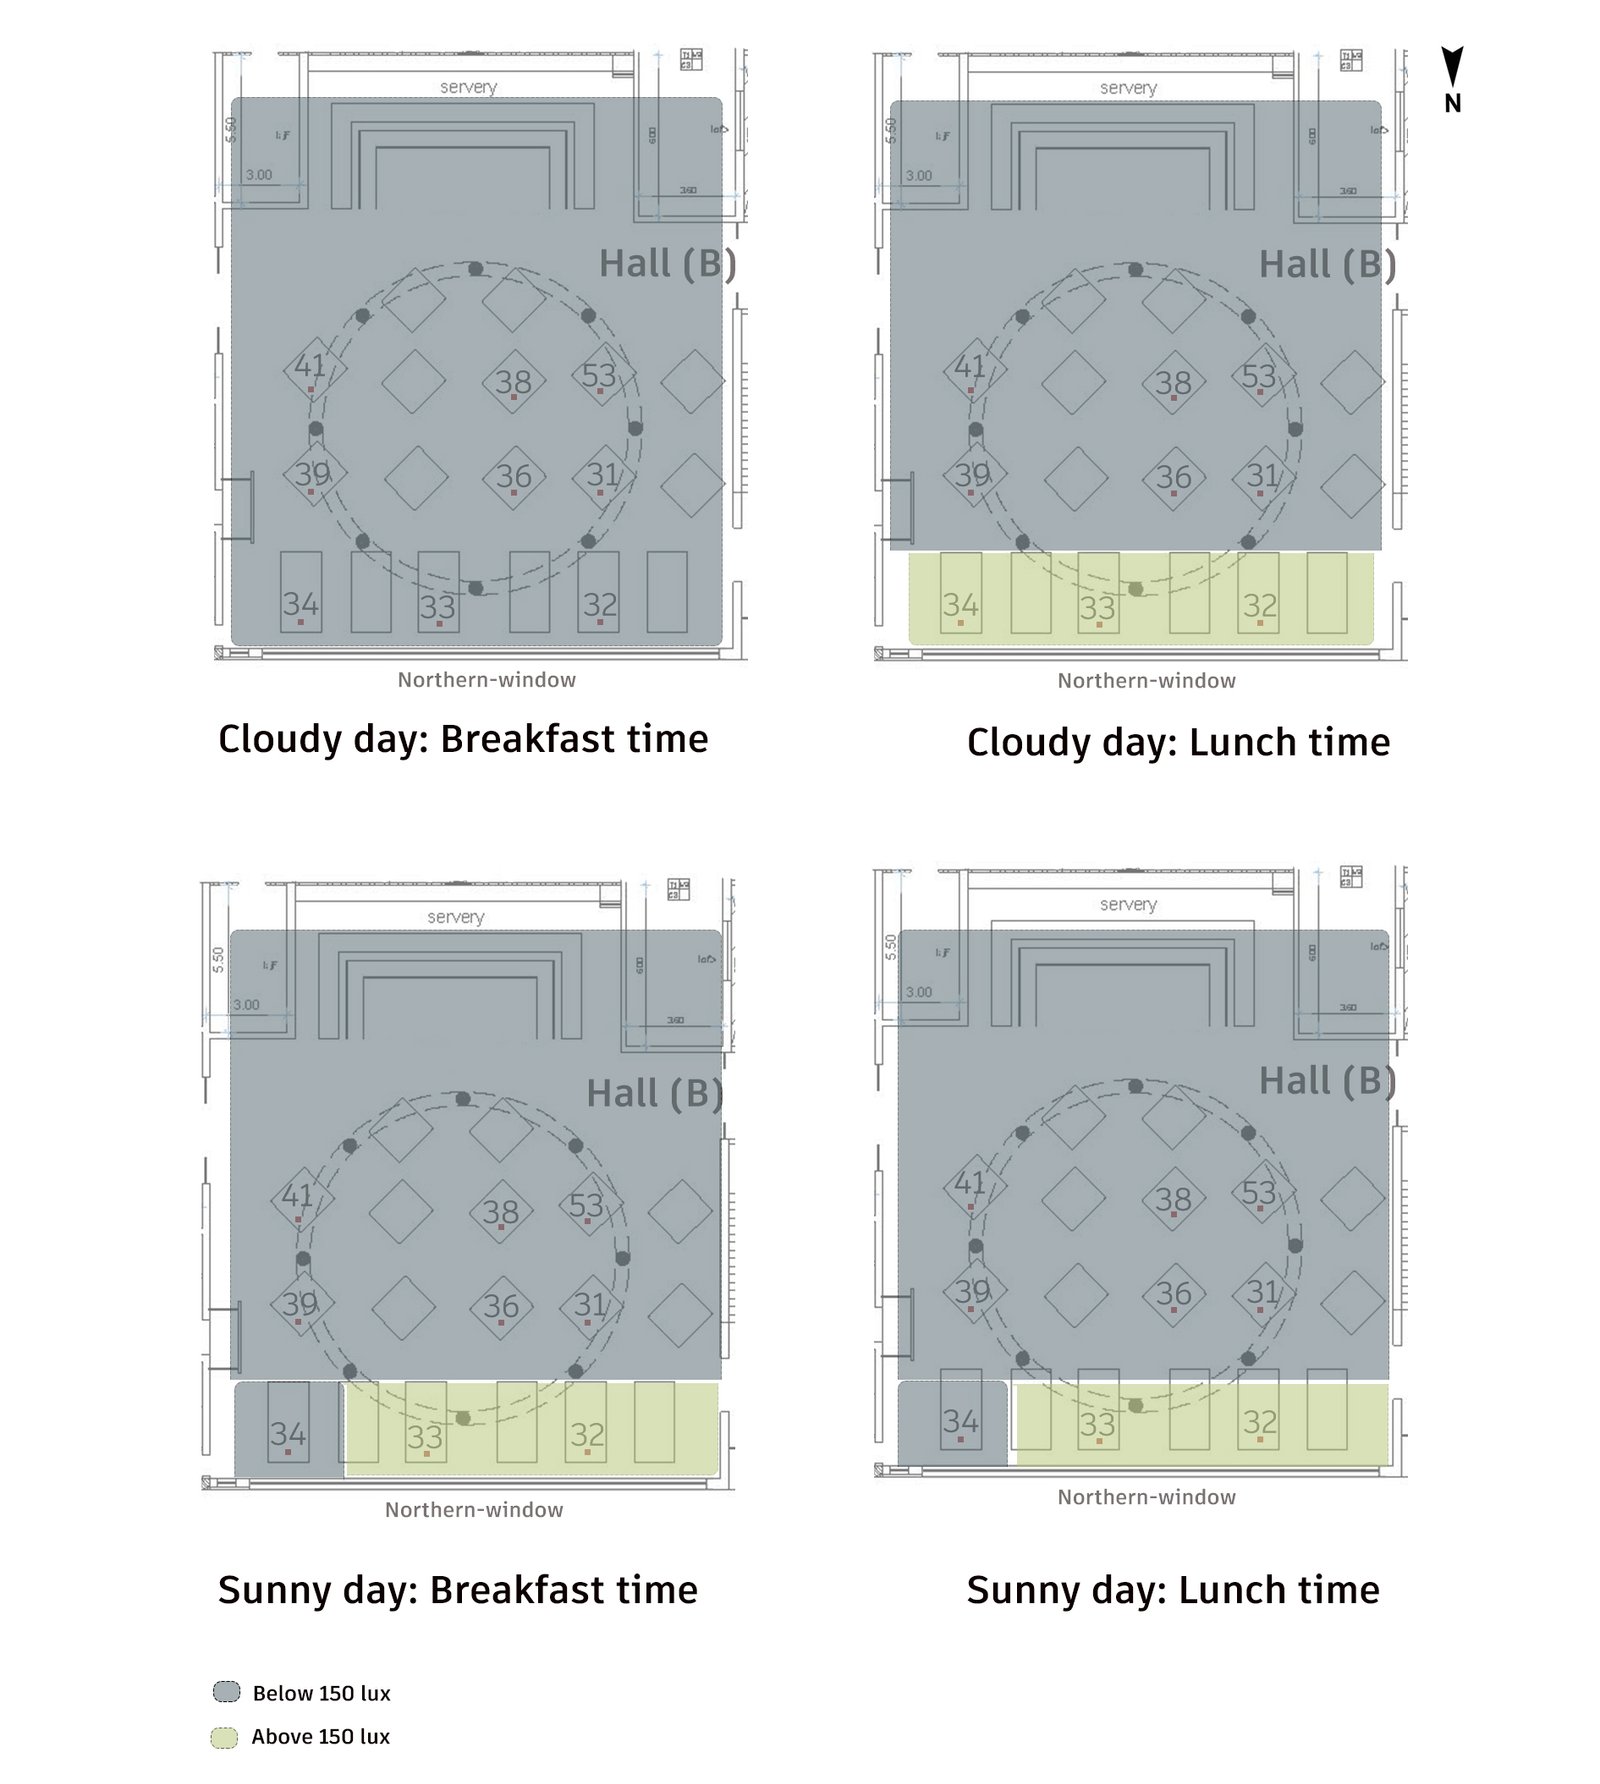 Figure 11
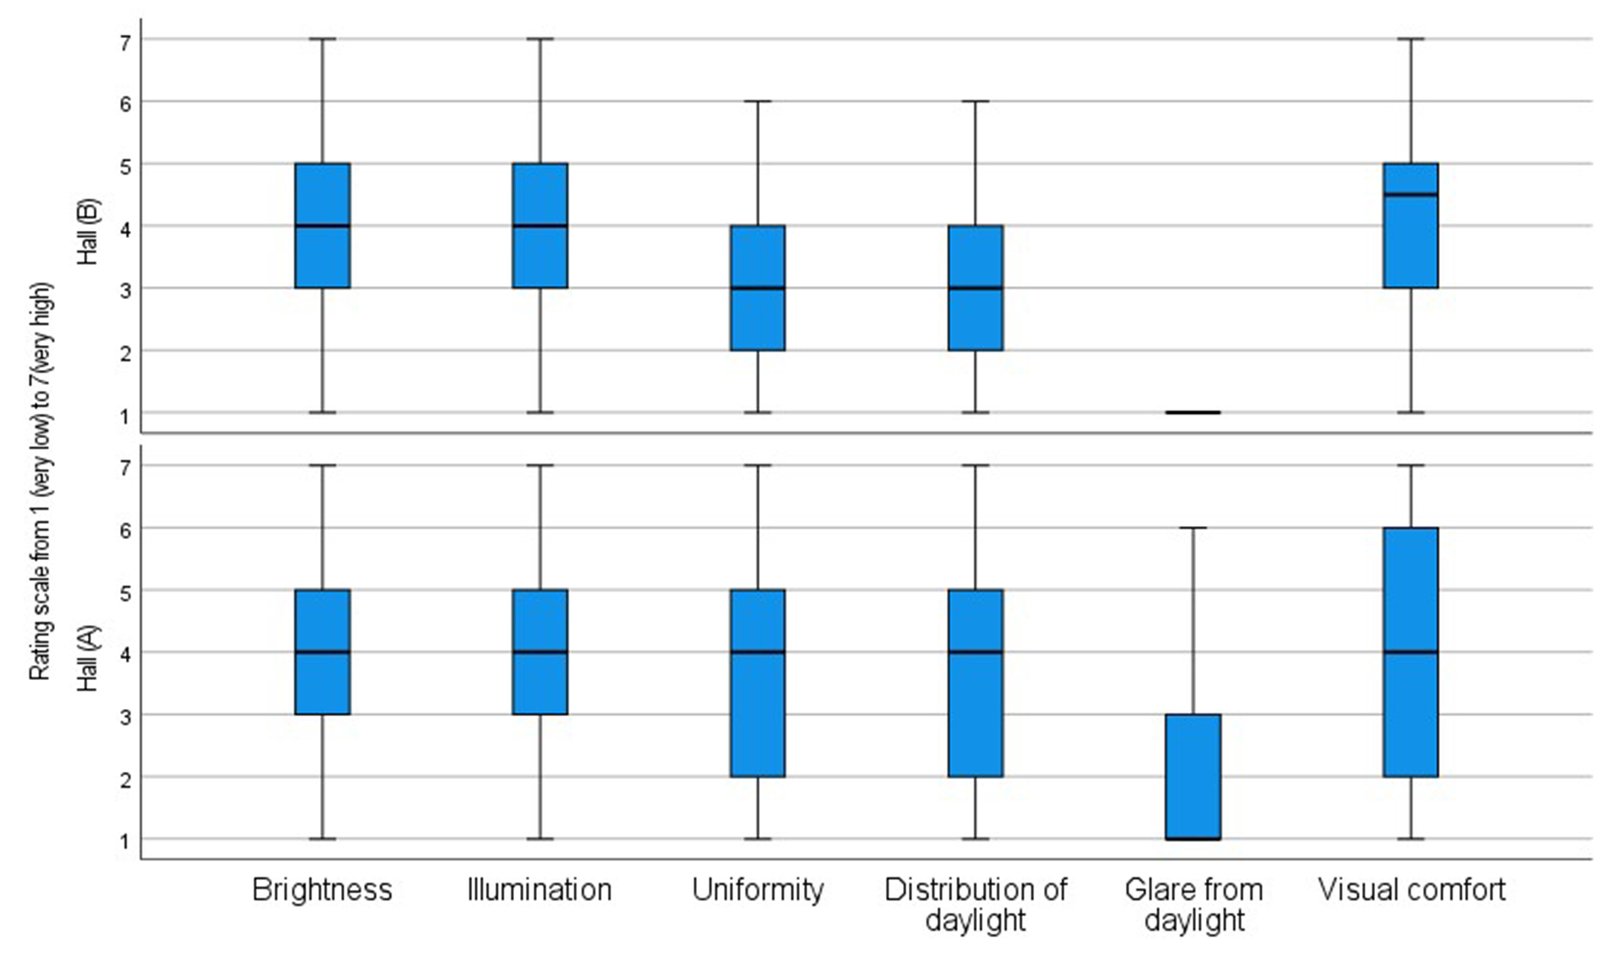 Figure 12
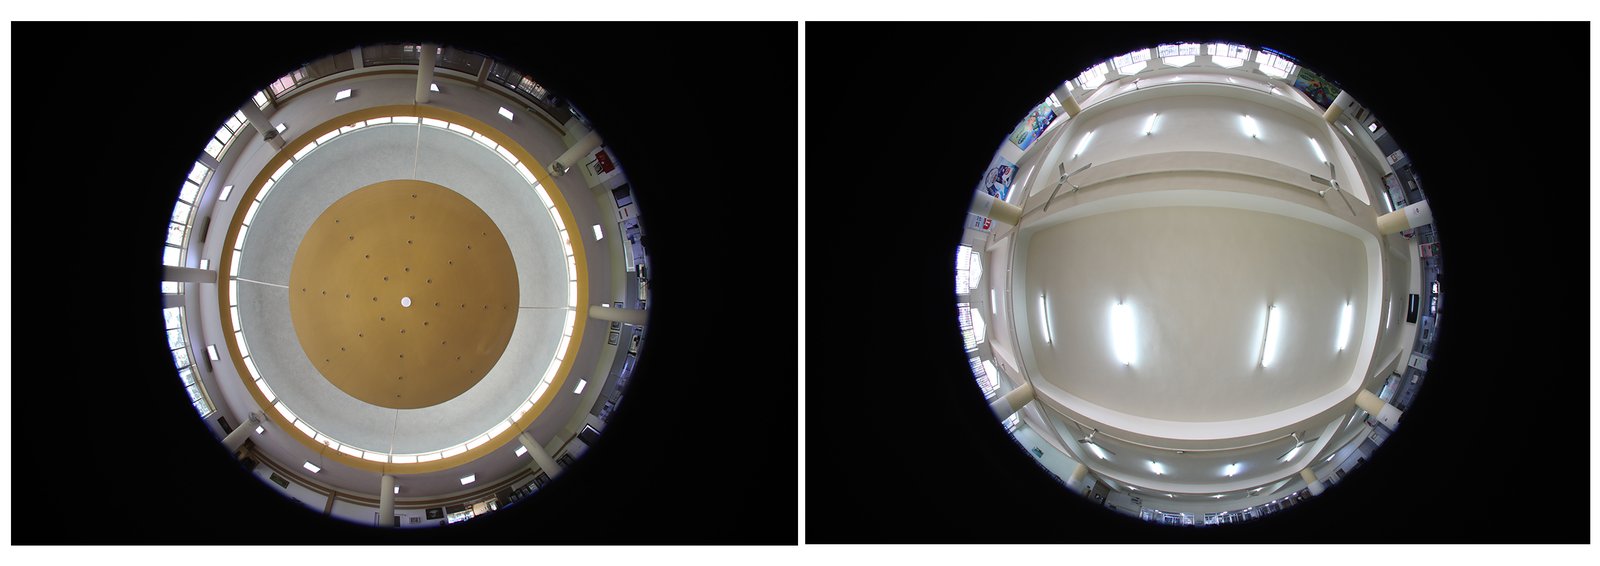 Figure 13
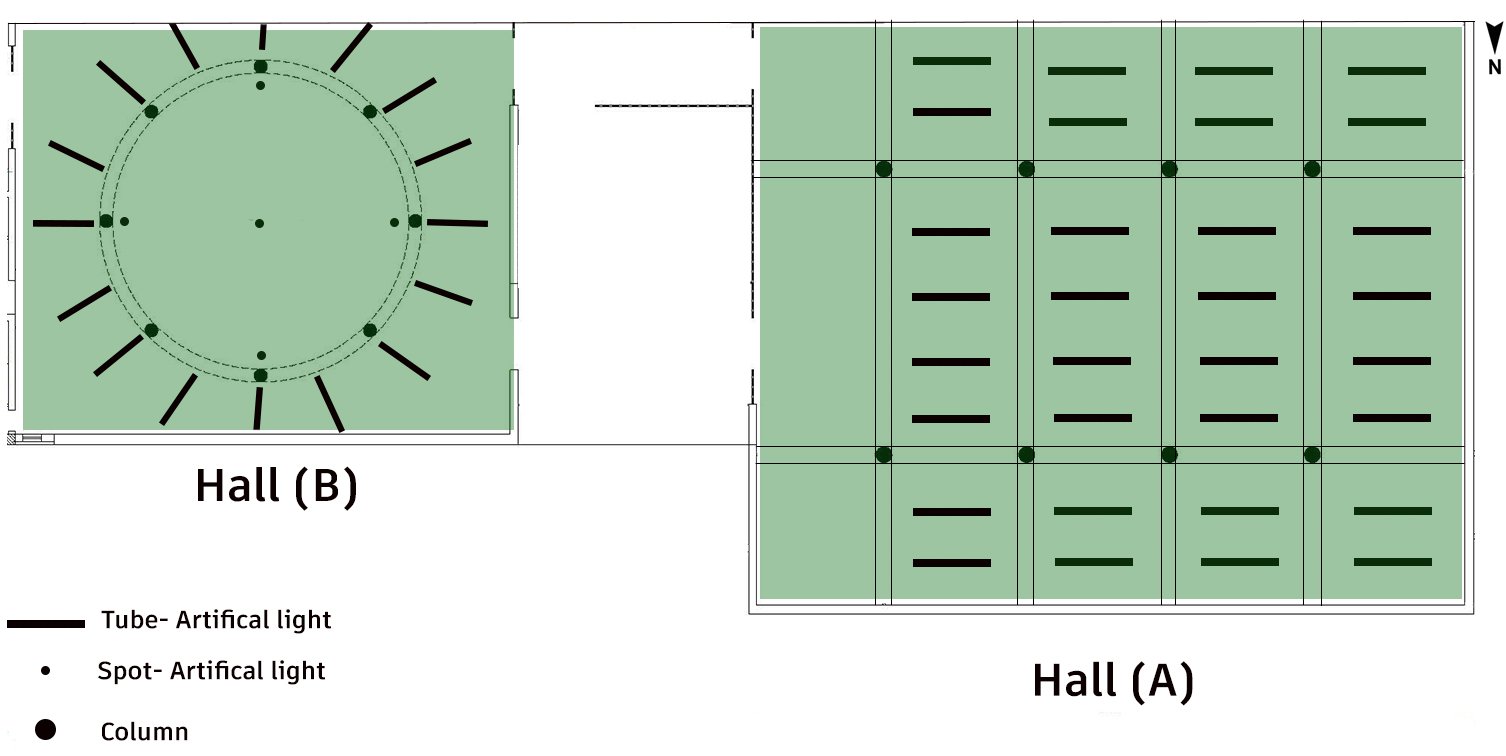 Figure 14
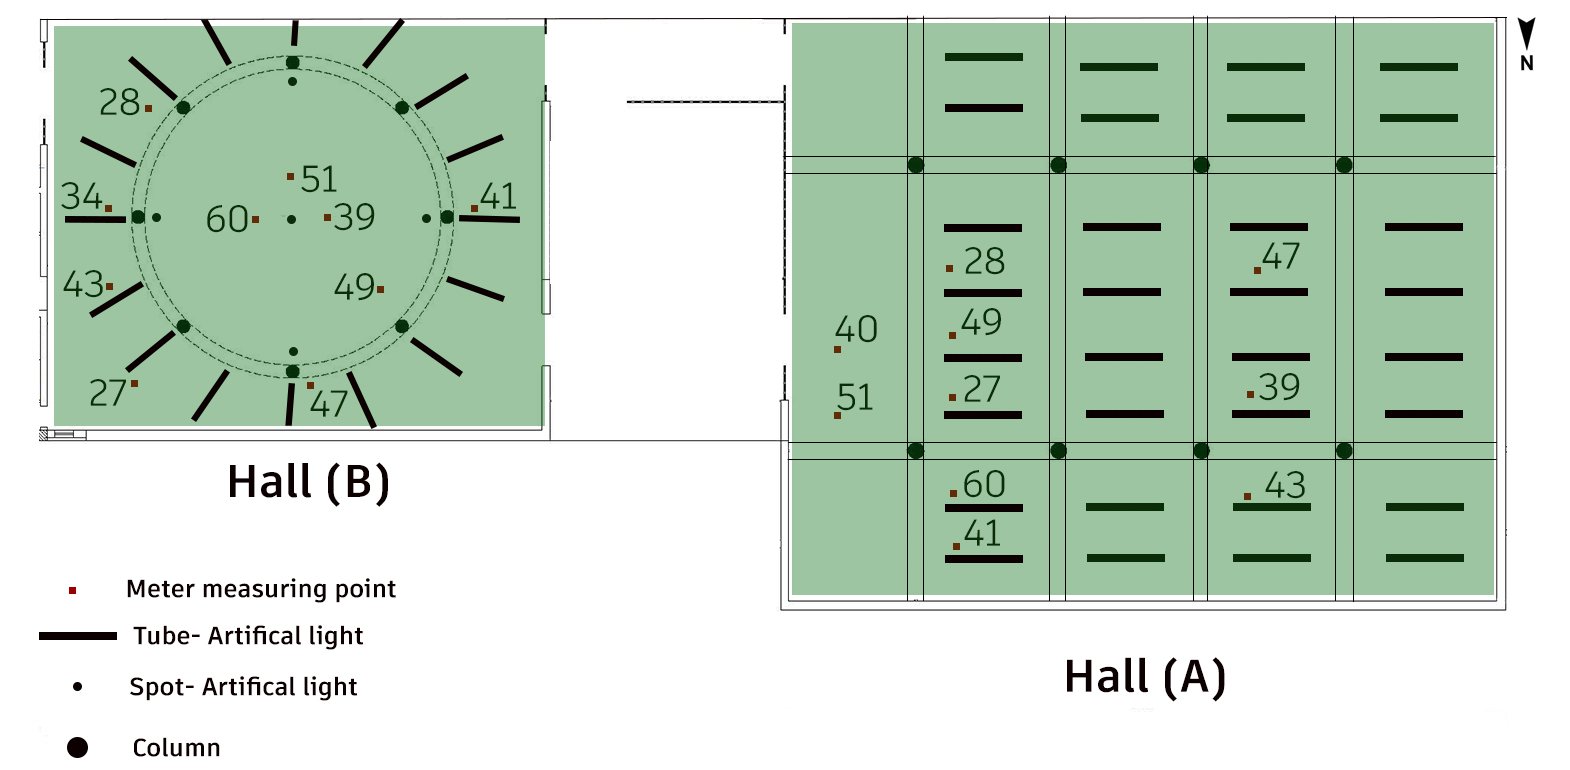 Figure 15
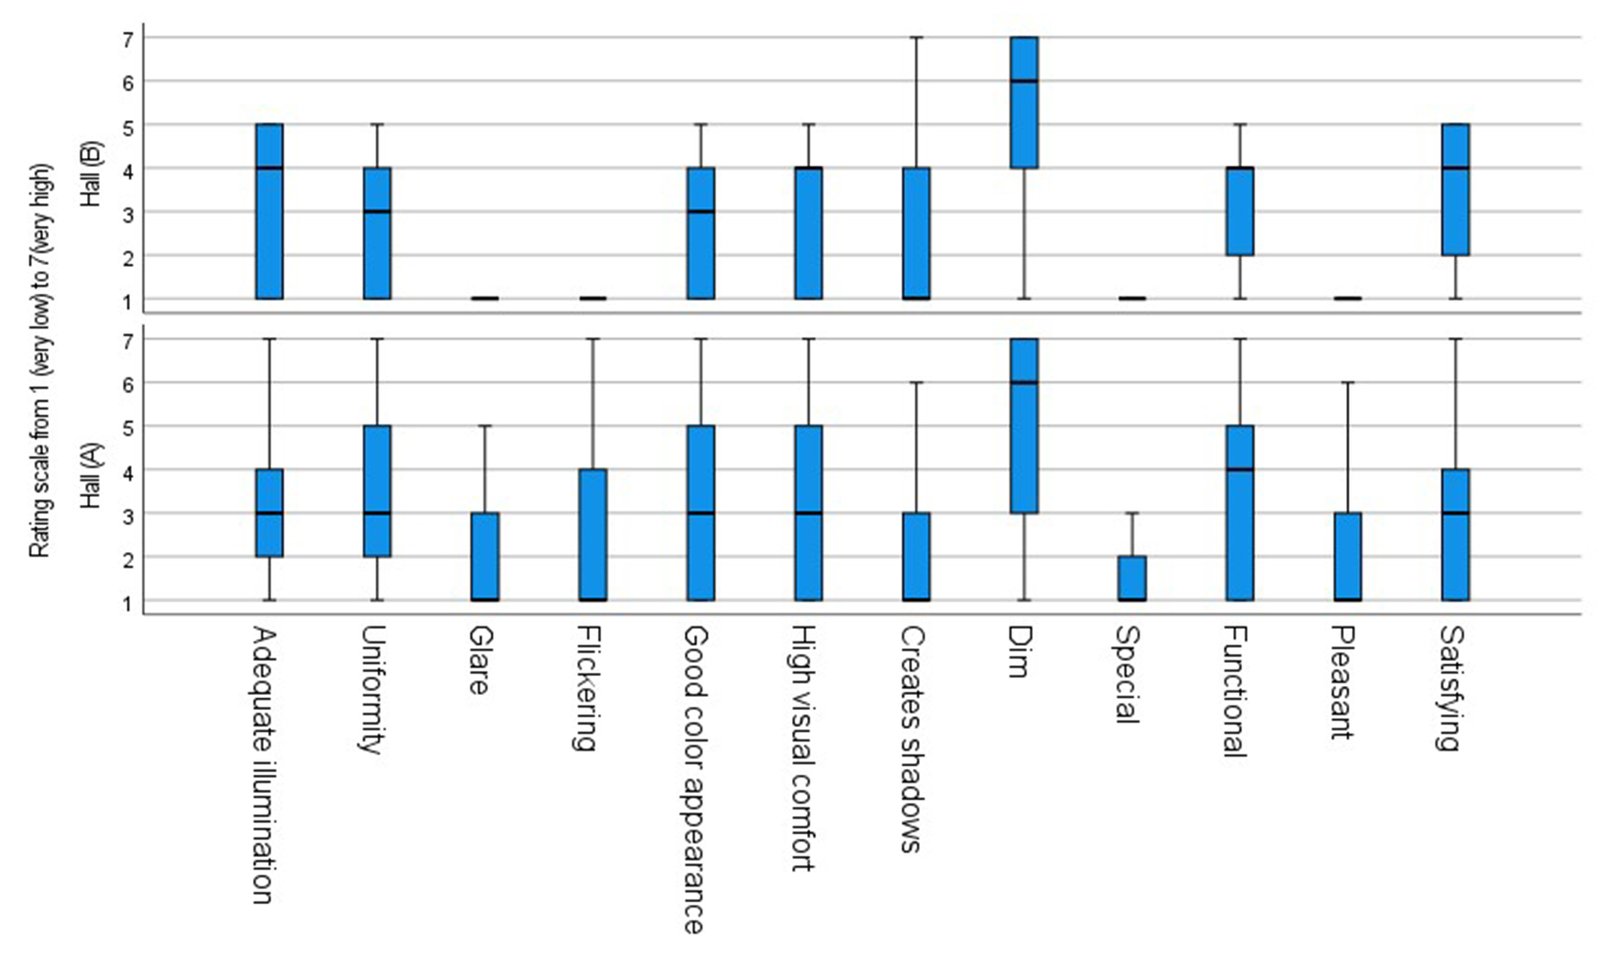 Figure 16
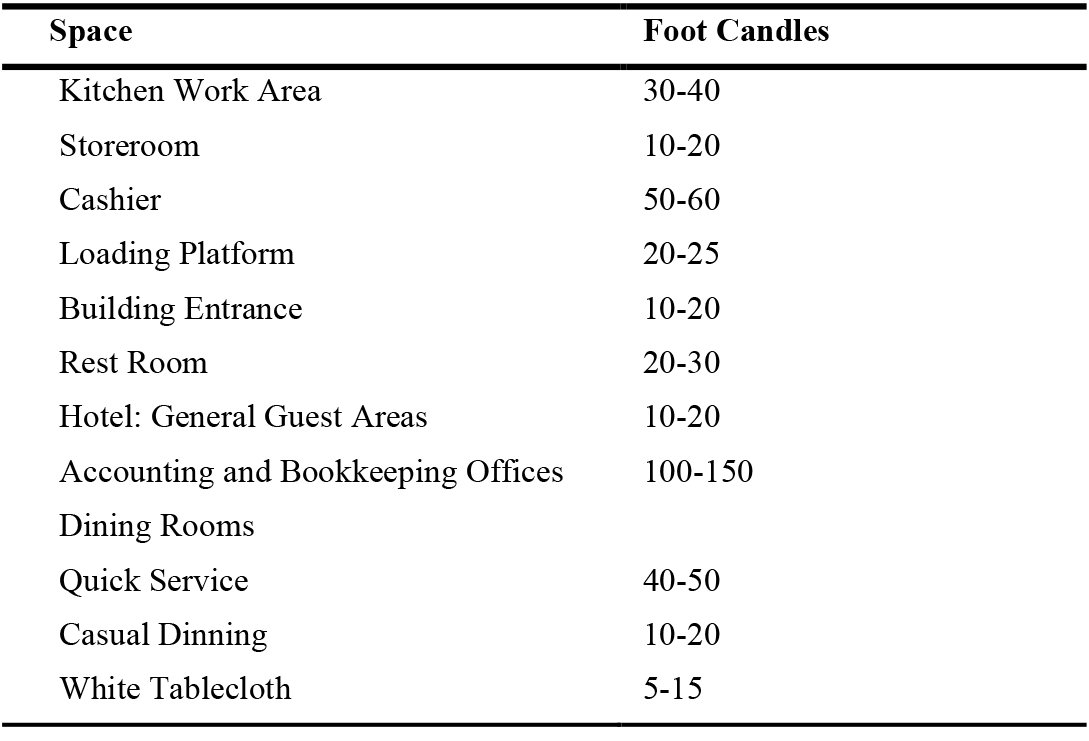 Table 1
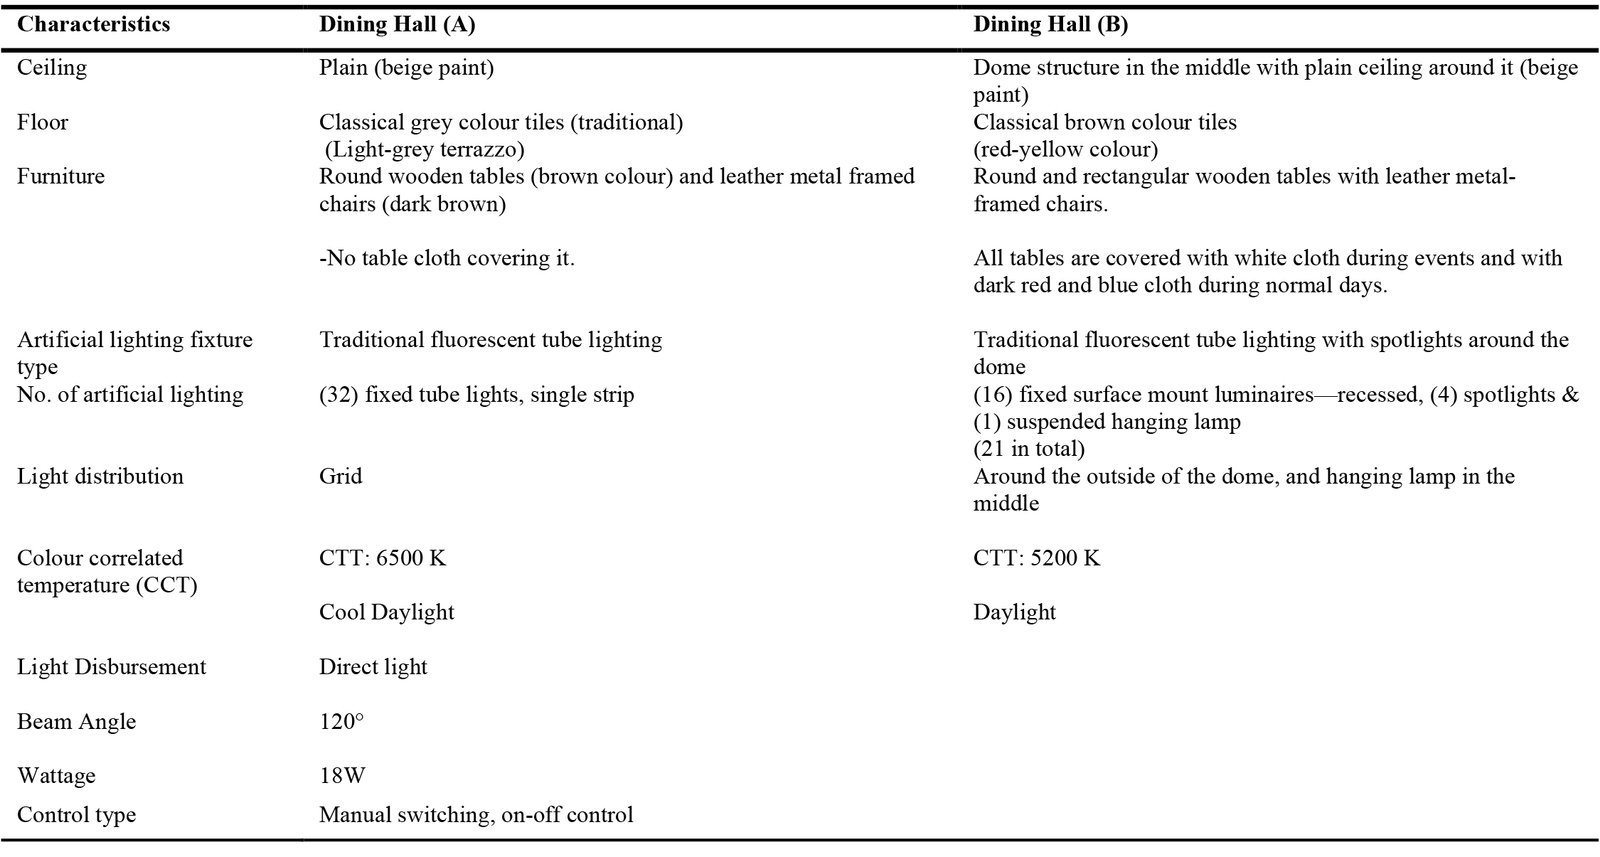 Table 2
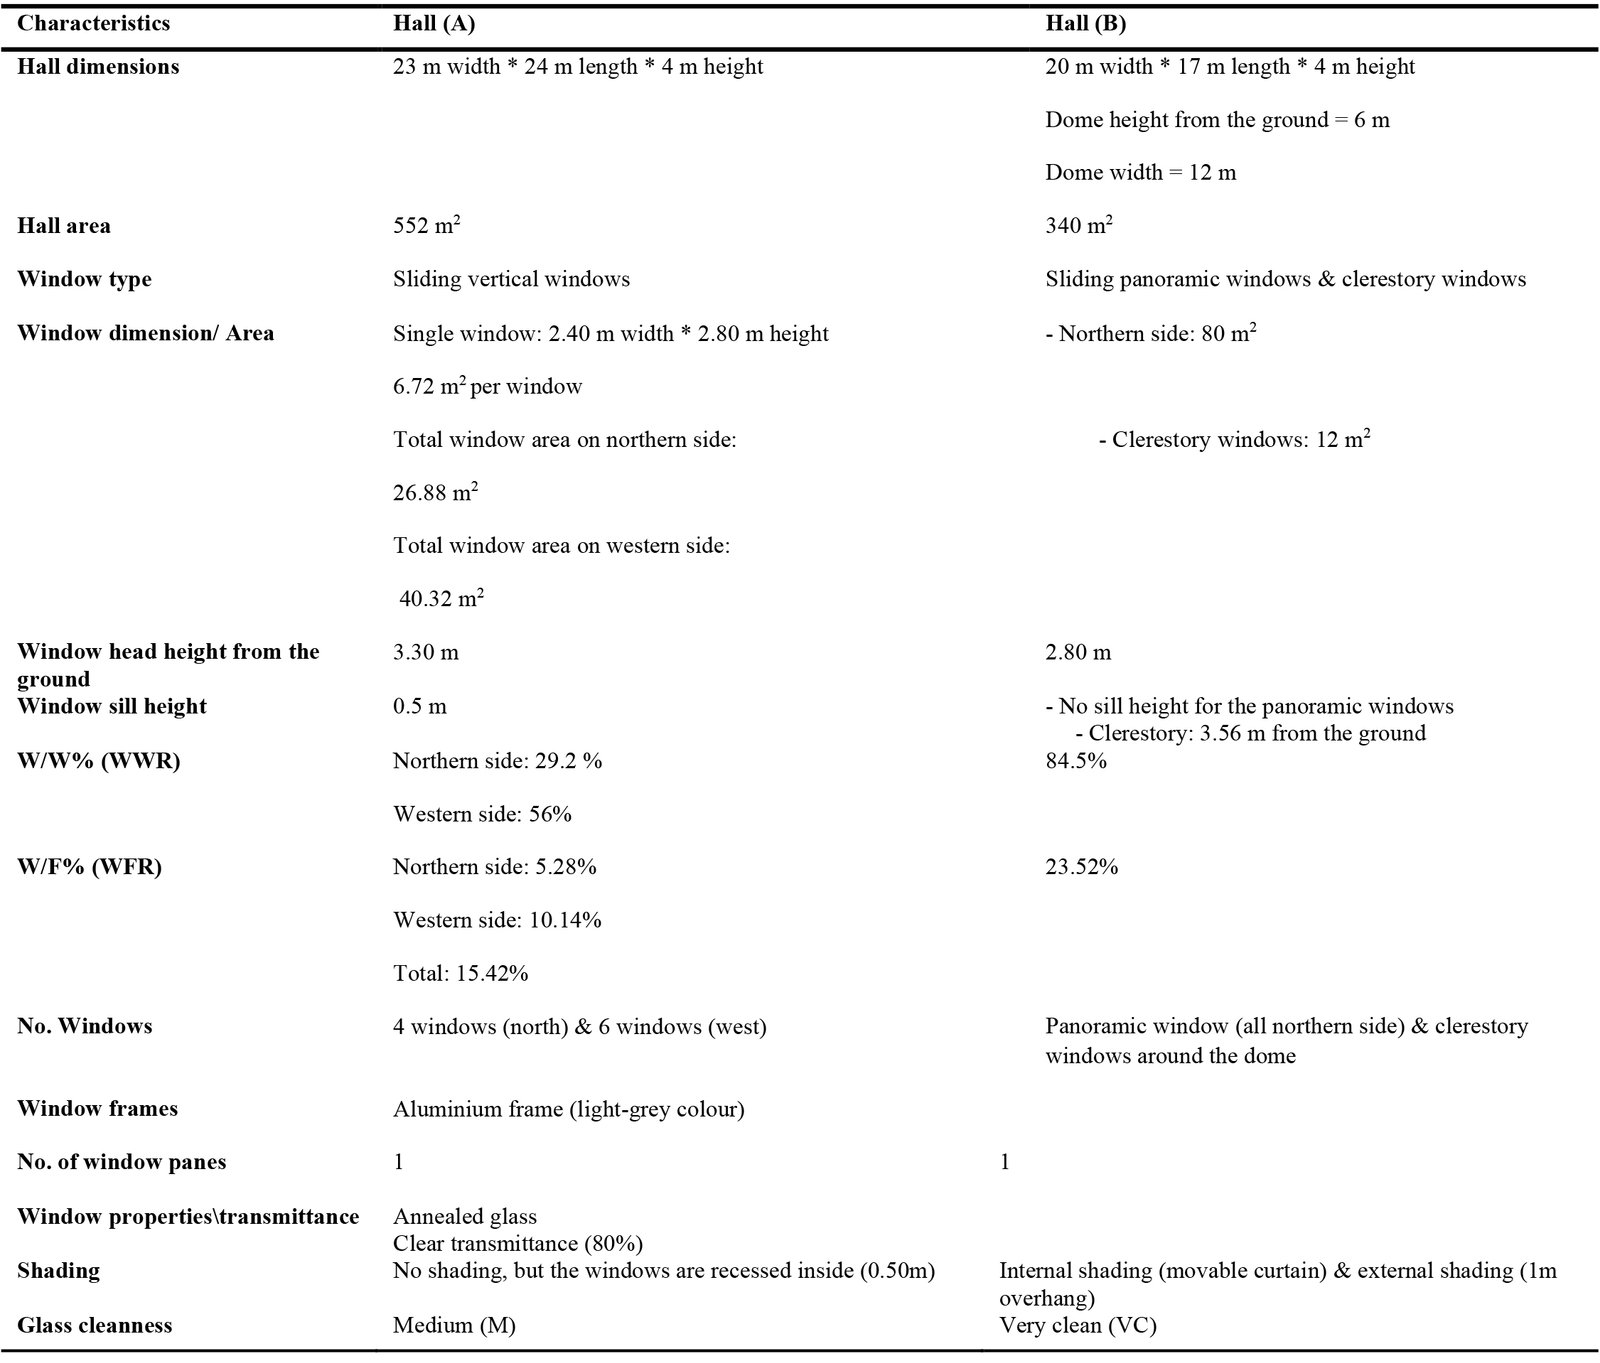 Table 3
 Table 4
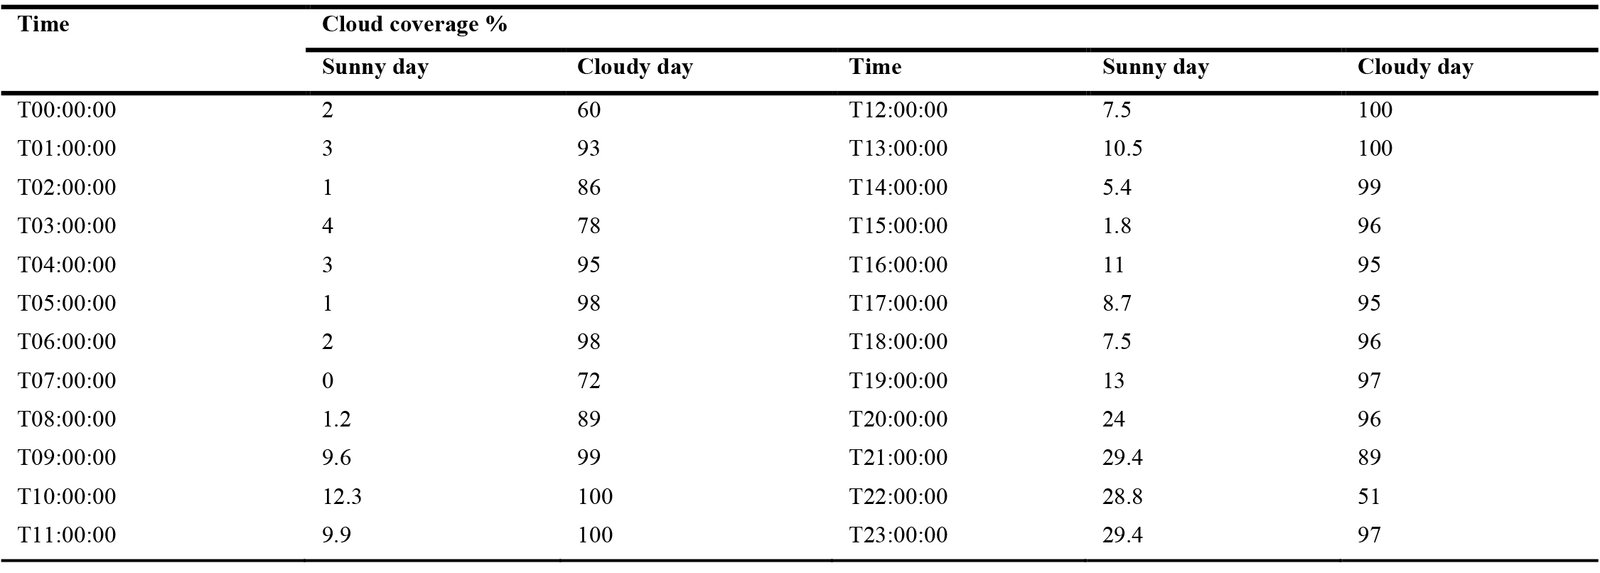 Table 5
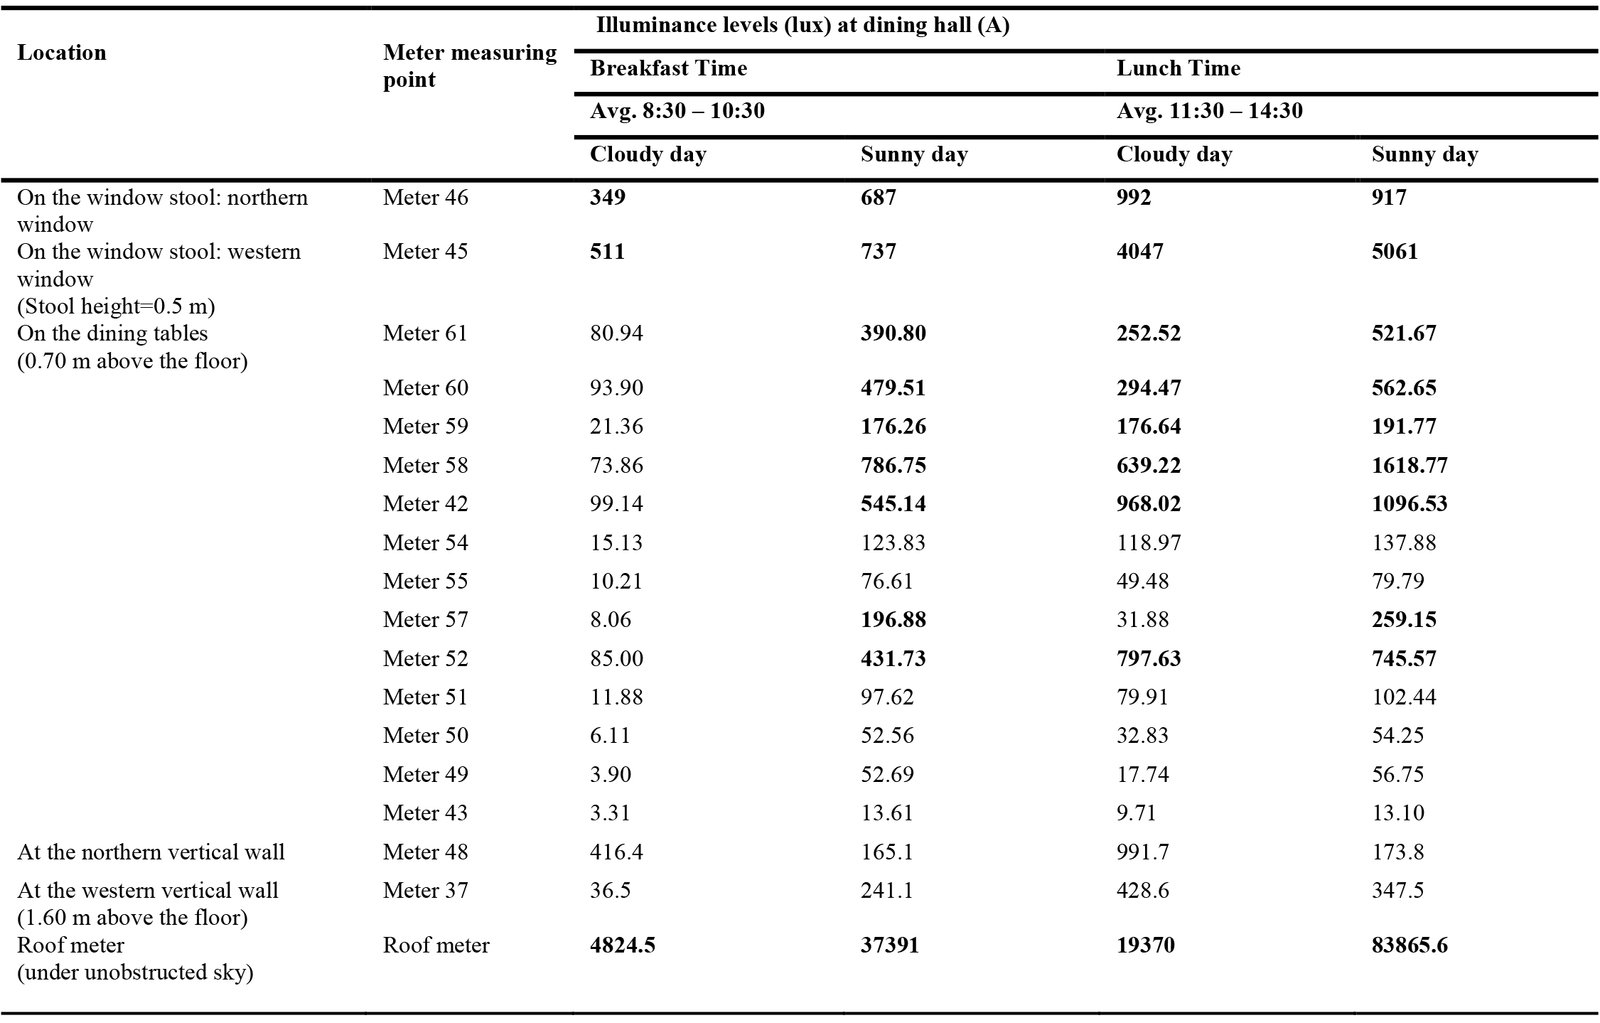 Table 6
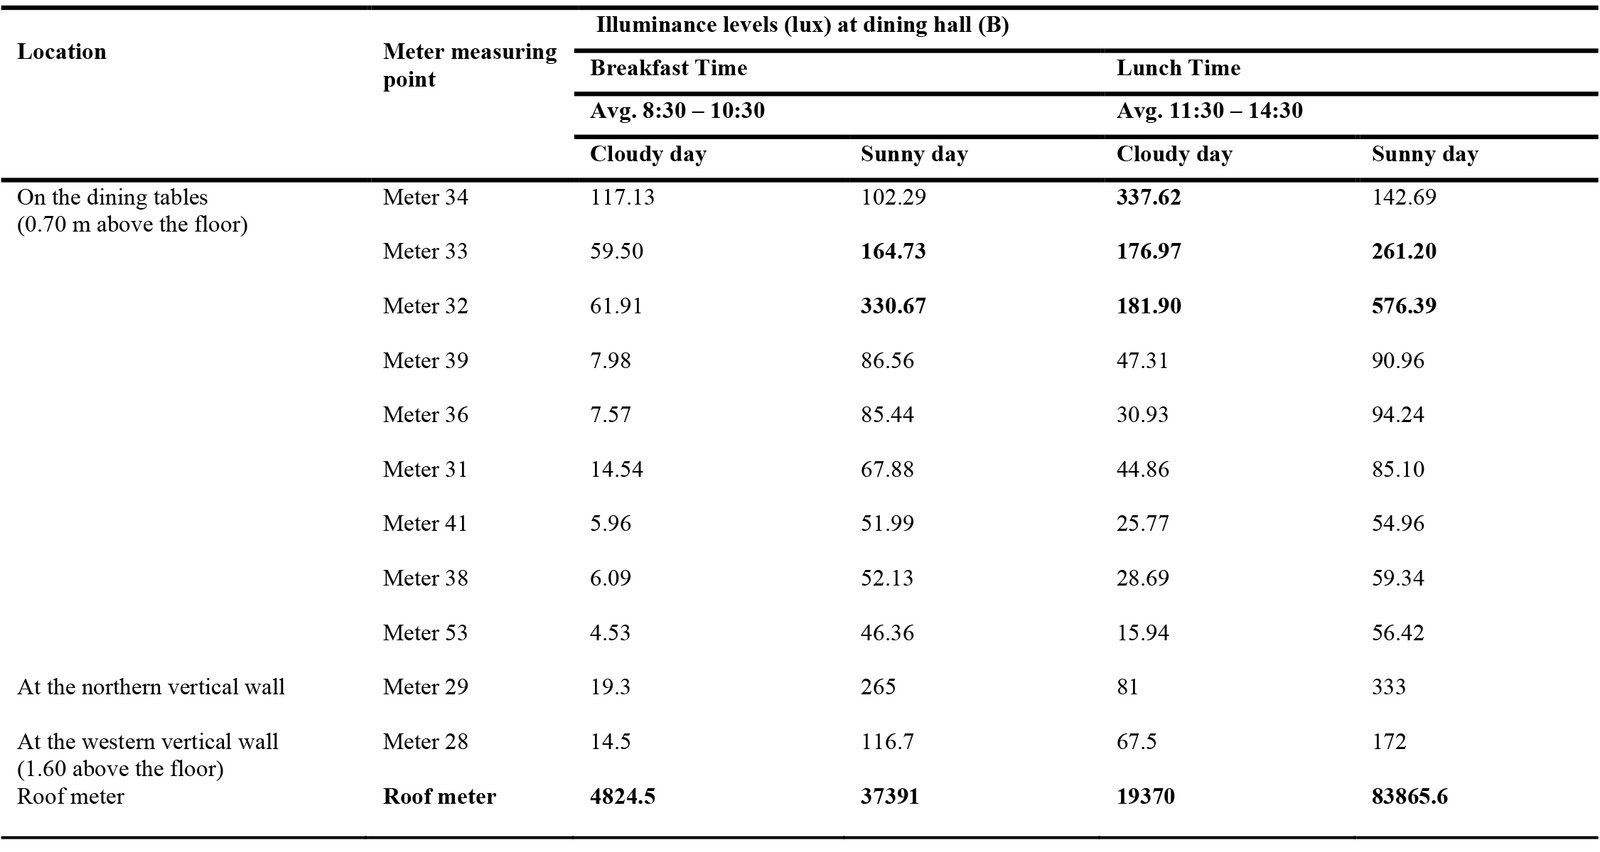 Table 7
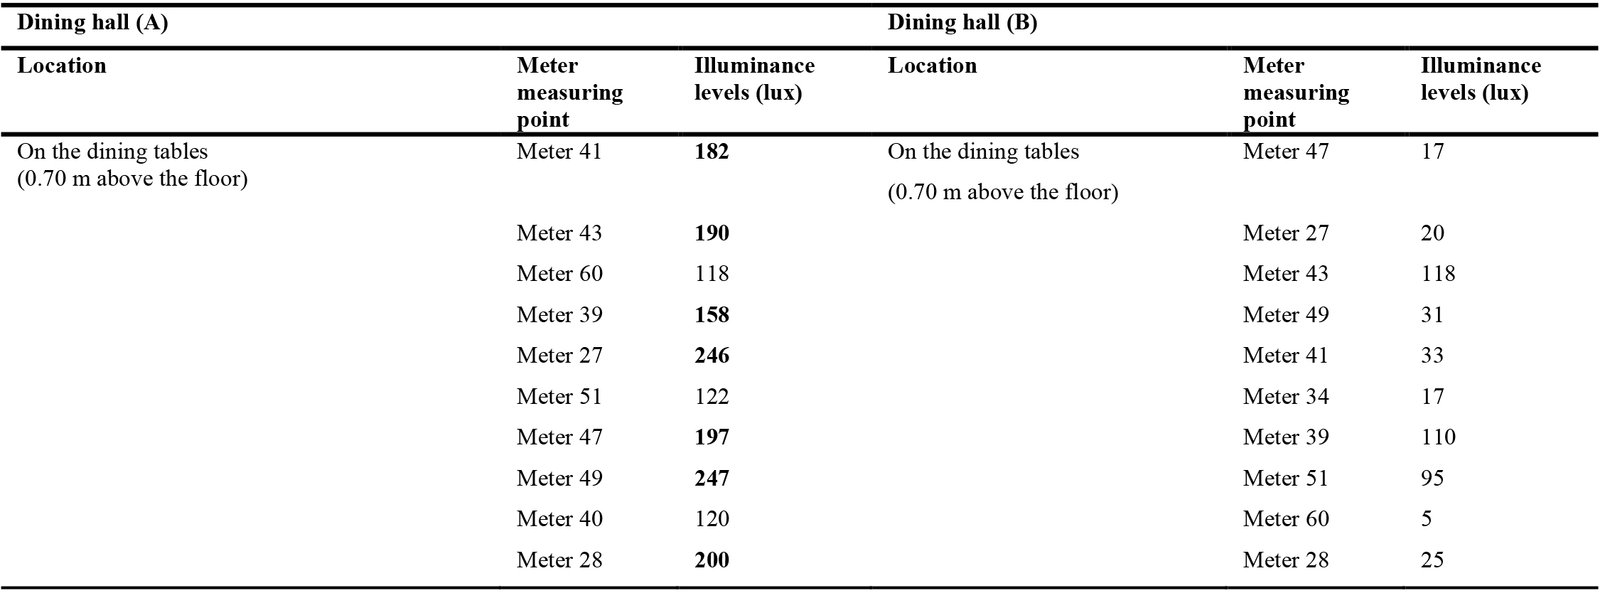 Table 8


