Volume 11 Issue 2 pp. 247-267 • doi: 10.15627/jd.2024.18
Optimising Daylighting Performance Through Side light with Passive Devise Design in Buildings
Brilianty Wijaya, Nurul Jamala,∗ Baharuddin Hamzah
Author affiliations
Department of Architecture, Faculty of Engineering, Hasanuddin University, Indonesia
*Corresponding author.
briliantywijaya@gmail.com (B. Wijaya)
nuruljamala@unhas.ac.id (N. Jamala)
baharsyah@unhas.ac.id (B. Hamzah)
History: Received 20 May 2024 | Revised 6 July 2024 | Accepted 14 July 2024 | Published online 31 August 2024
Copyright: © 2024 The Author(s). Published by solarlits.com. This is an open access article under the CC BY license (http://creativecommons.org/licenses/by/4.0/).
Citation: Brilianty Wijaya, Nurul Jamala, Baharuddin Hamzah, Optimising Daylighting Performance Through Side light with Passive Devise Design in Buildings, Journal of Daylighting 11 (2024) 247-267. https://dx.doi.org/10.15627/jd.2024.18
Figures and tables
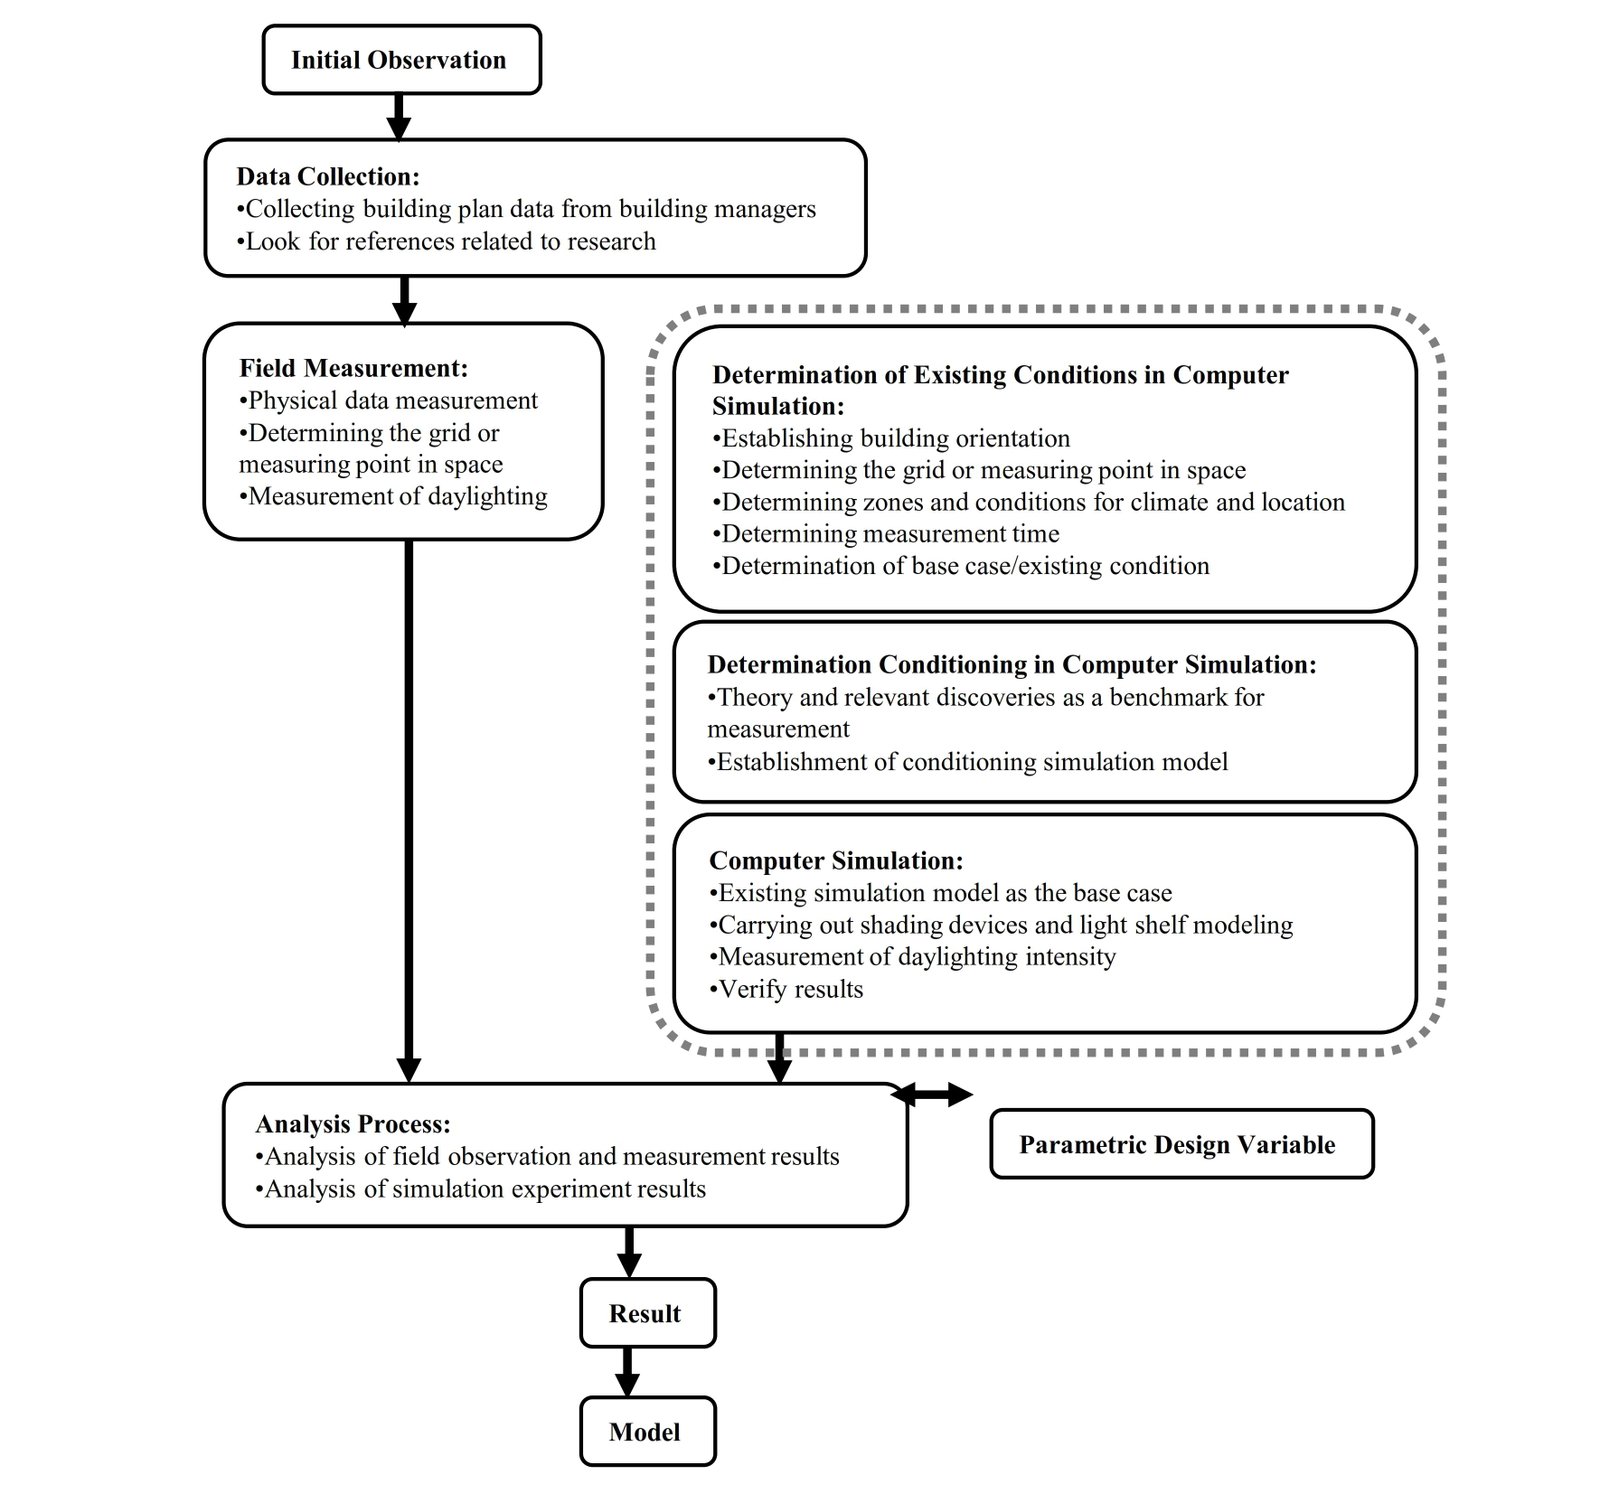 Figure 1
 Figure 2
 Figure 3
 Figure 4
 Figure 5
 Figure 6
 Figure 7
 Figure 8
 Figure 9
 Figure 10
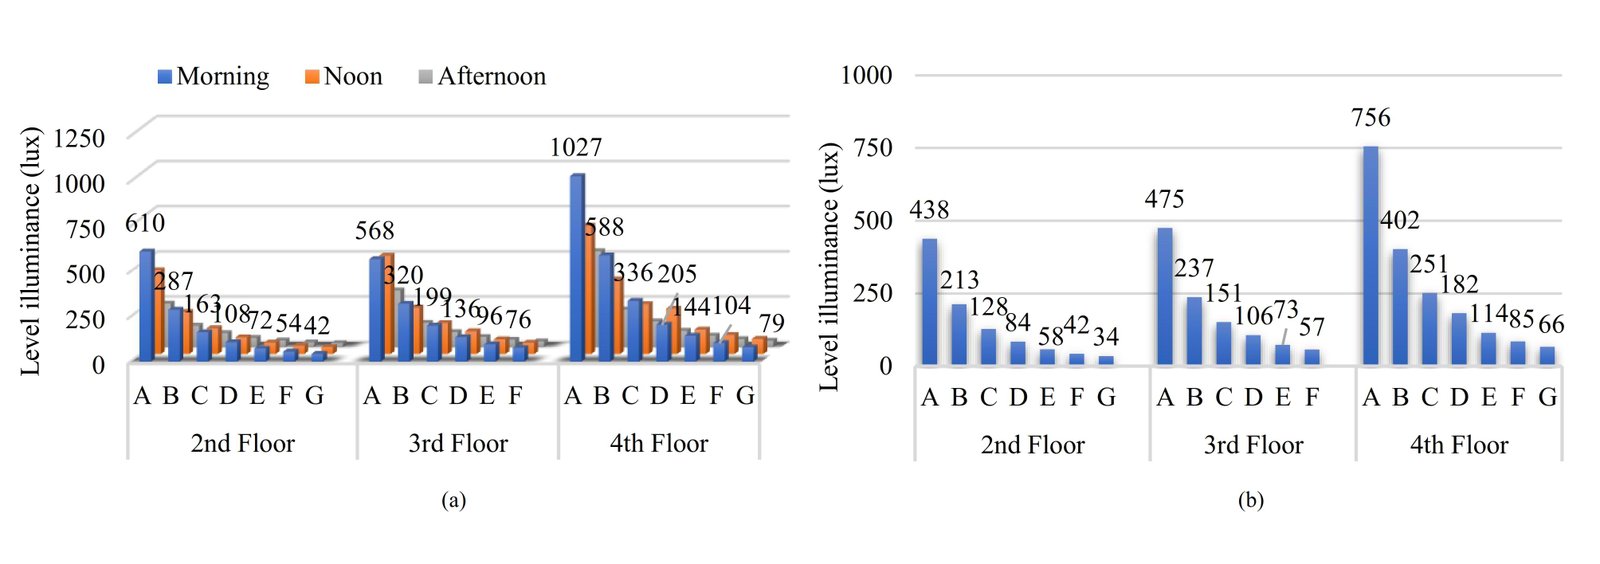 Figure 11
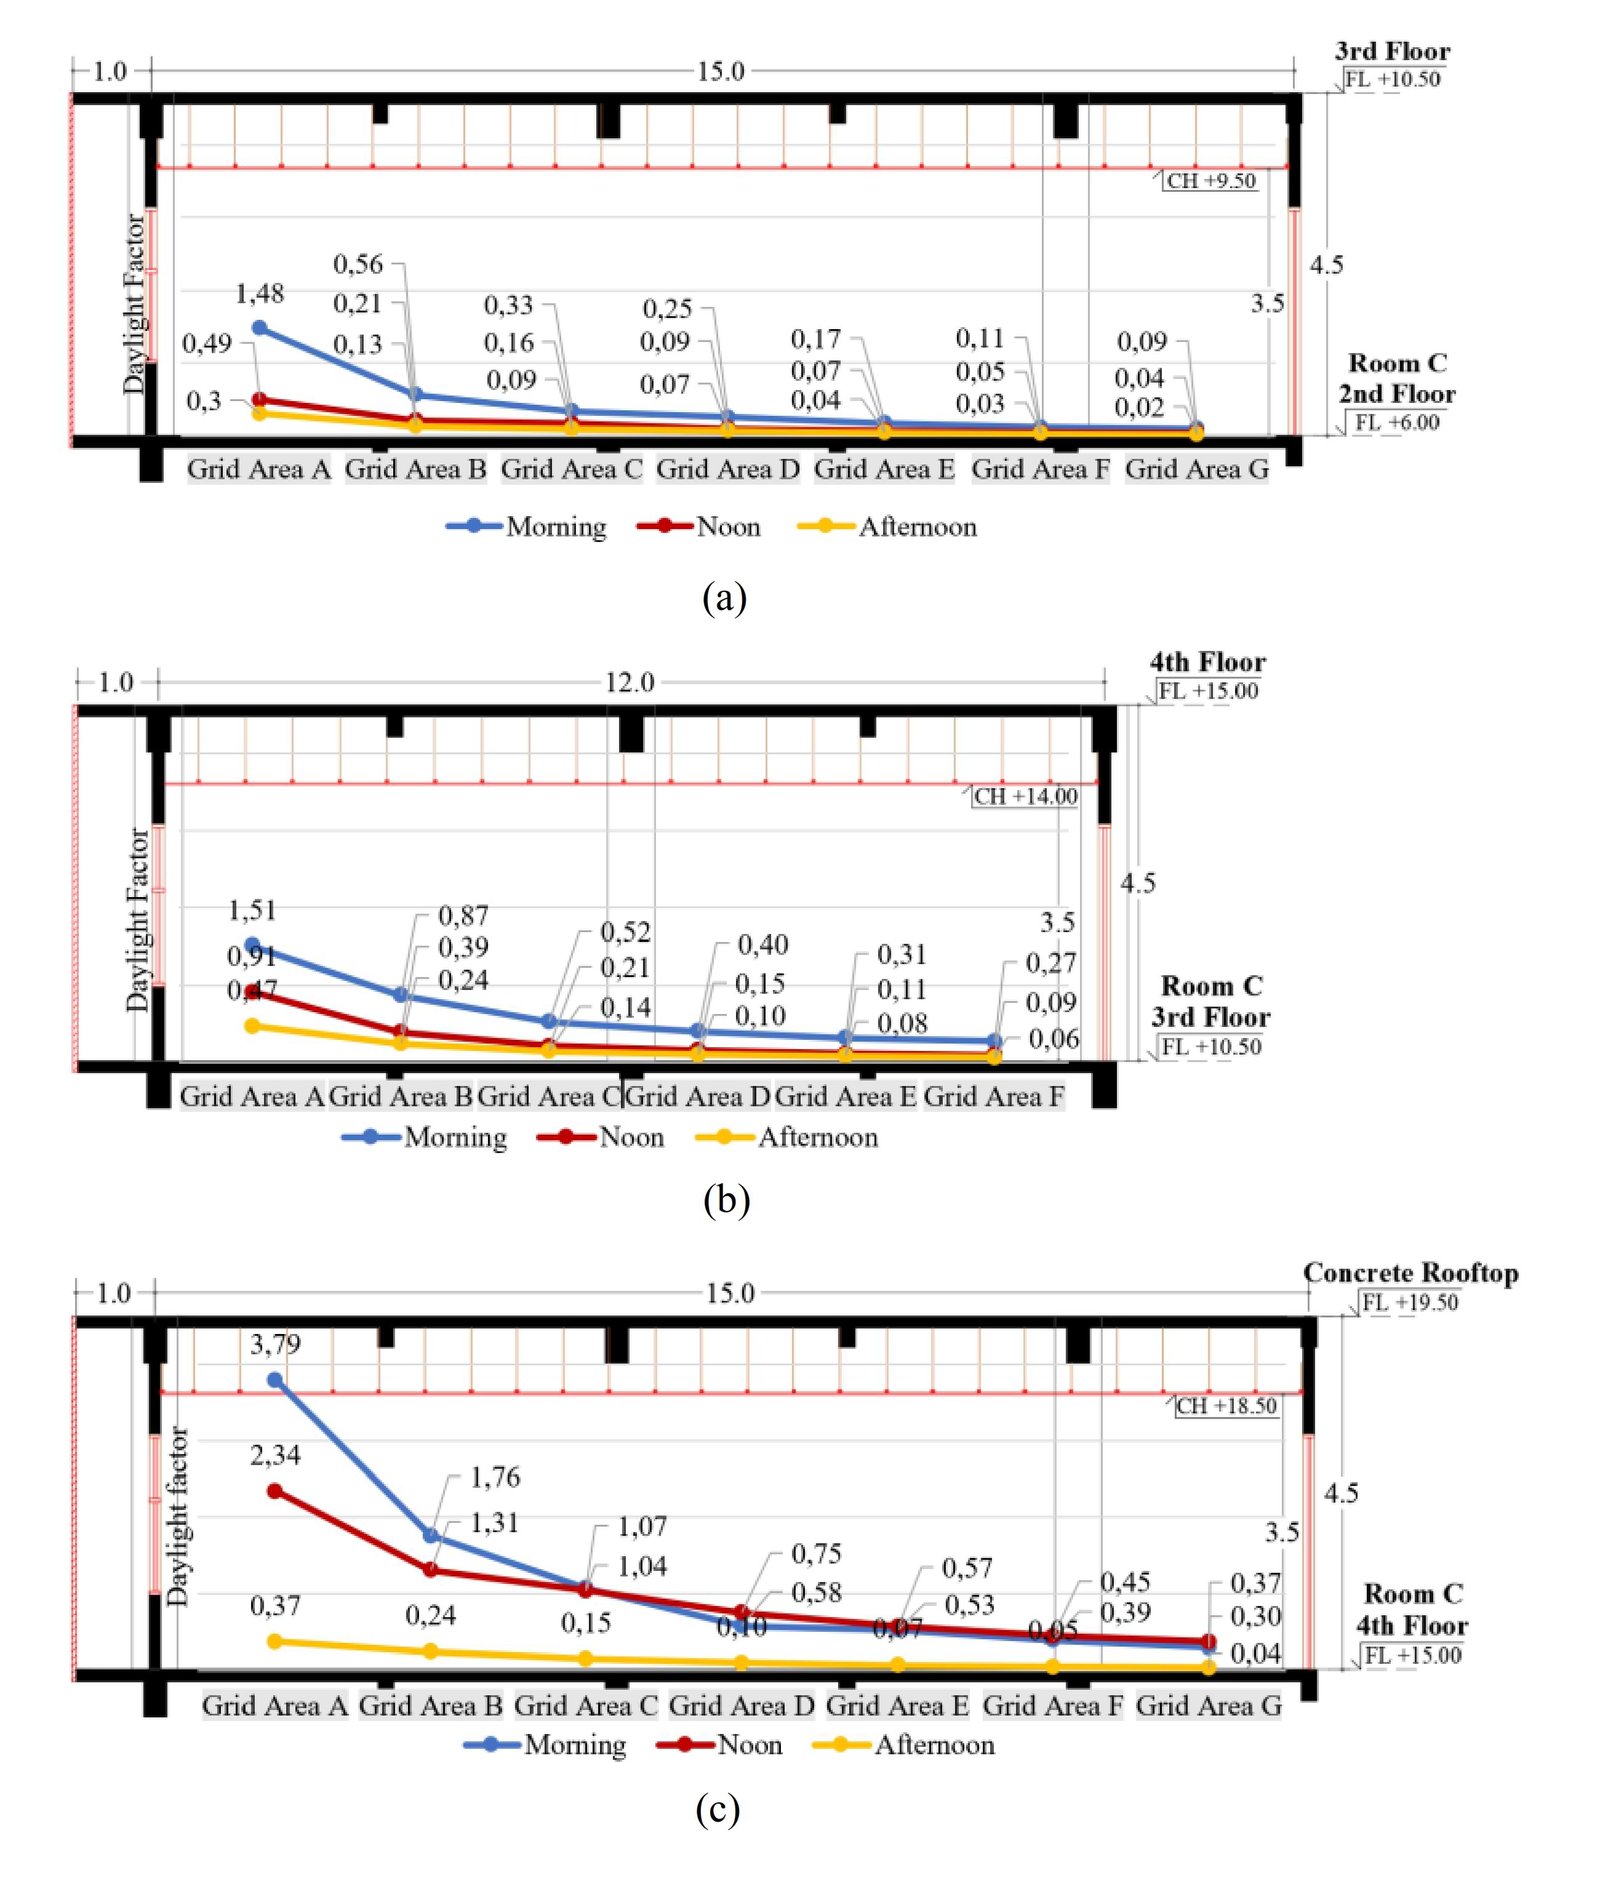 Figure 12
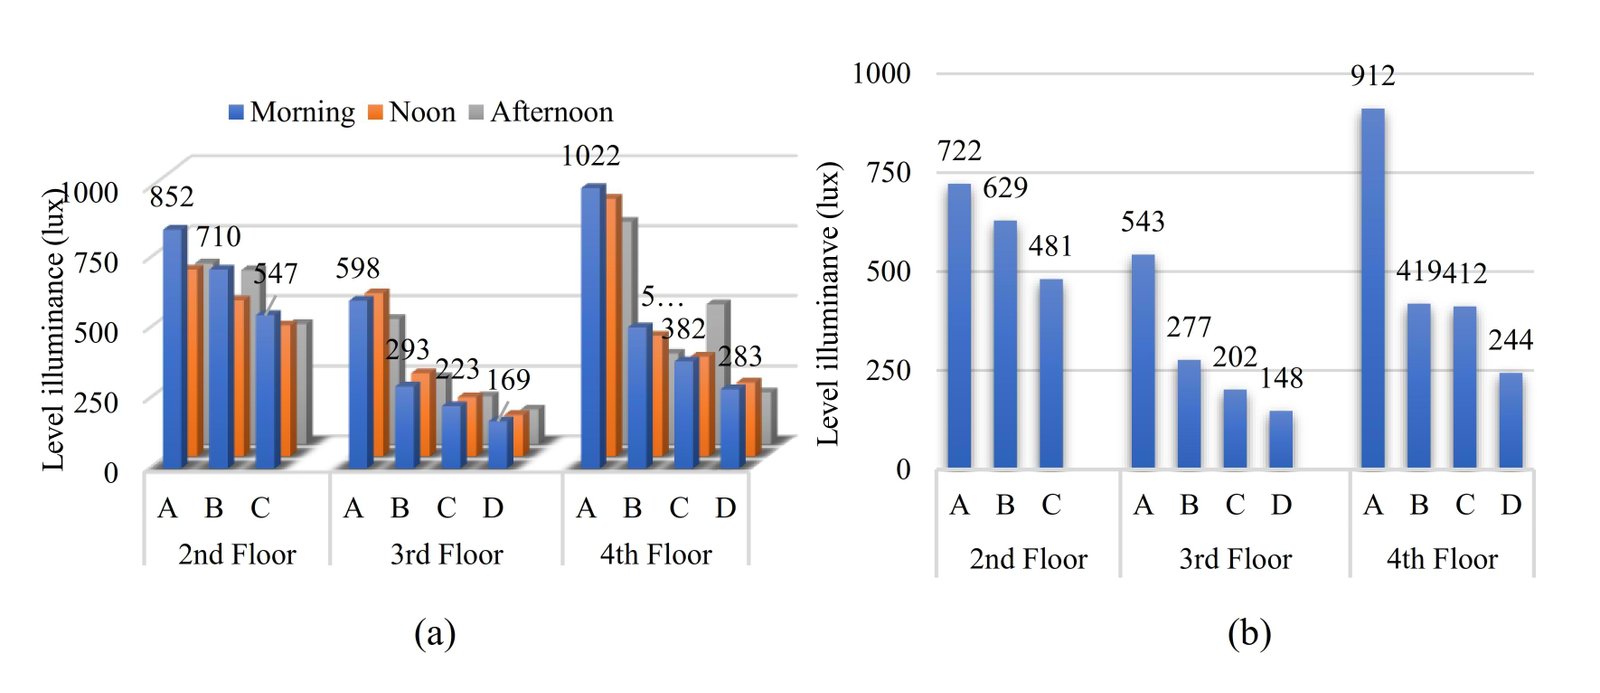 Figure 13
 Figure 14
 Figure 15
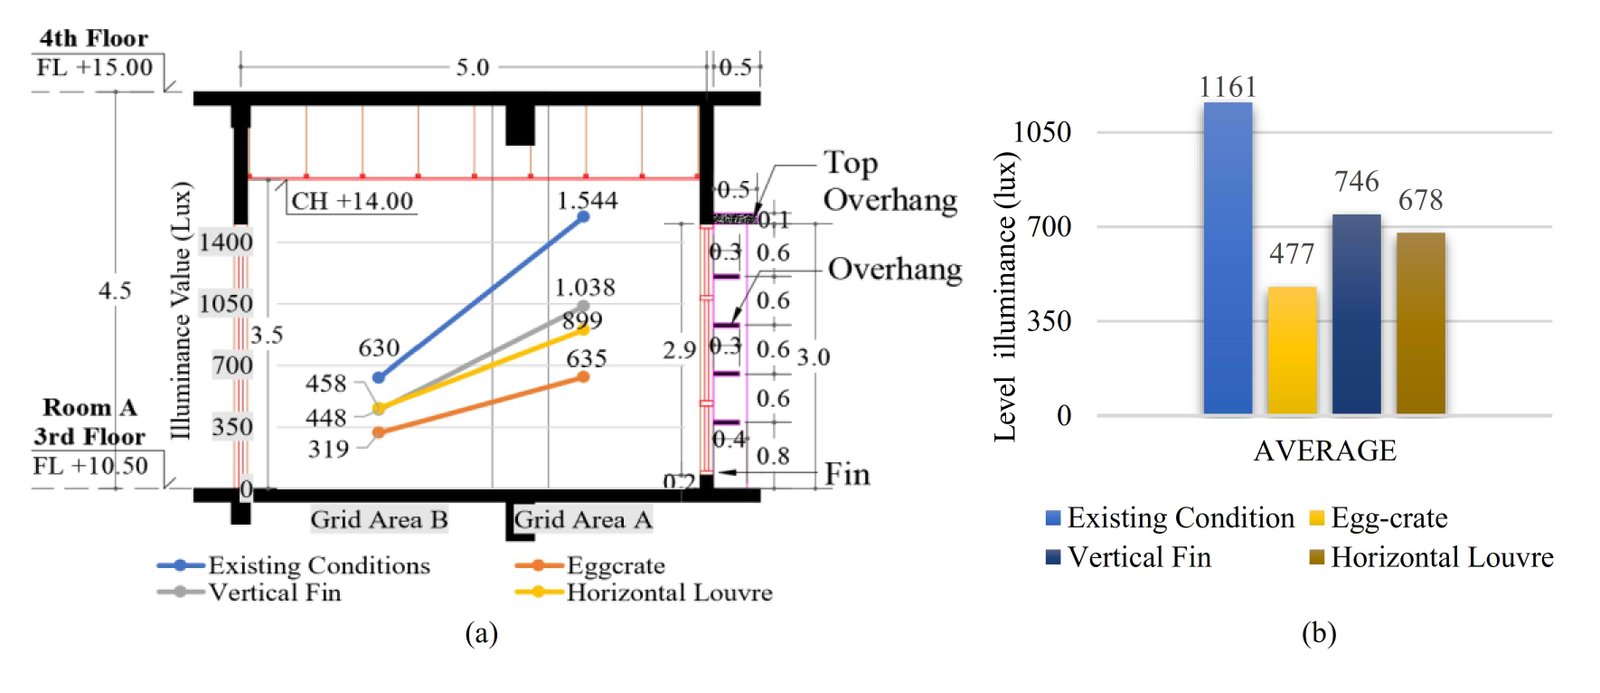 Figure 16
 Figure 17
 Figure 18
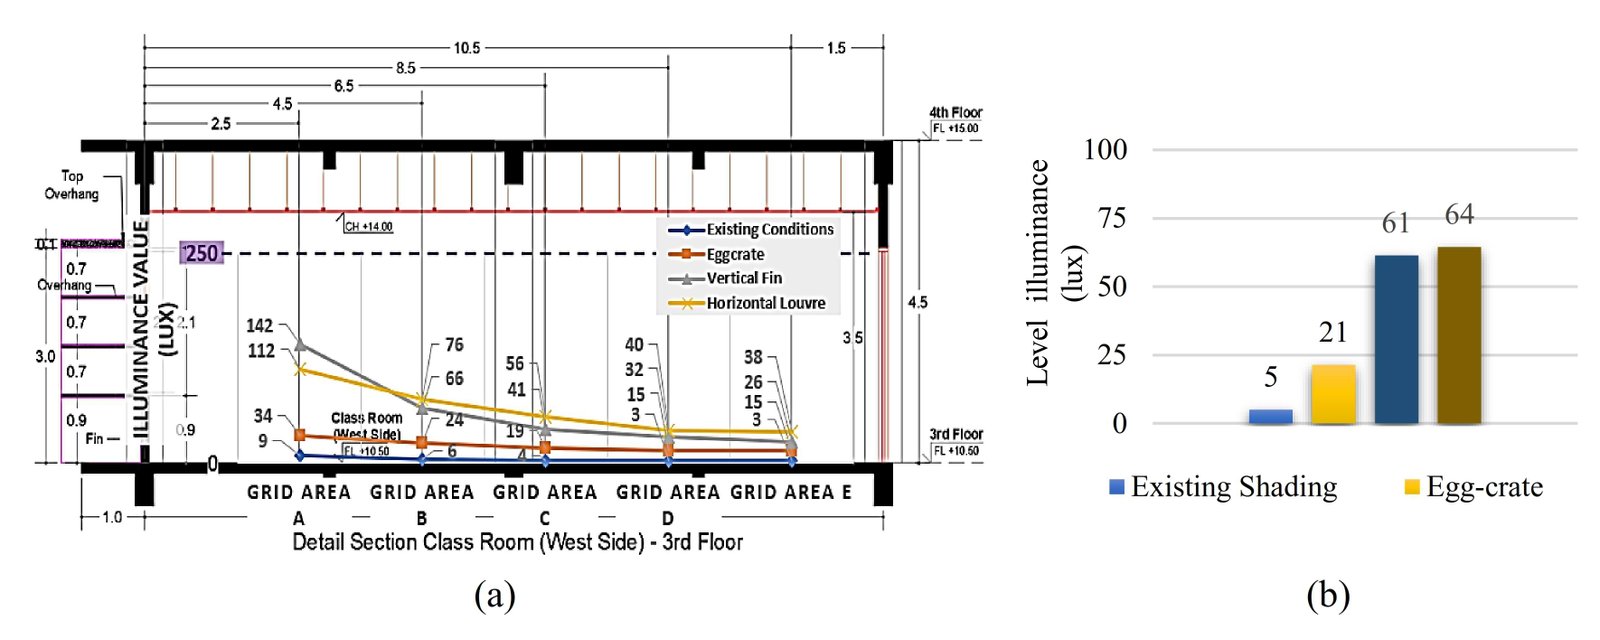 Figure 19
 Figure 20
 Figure 21
 Figure 22
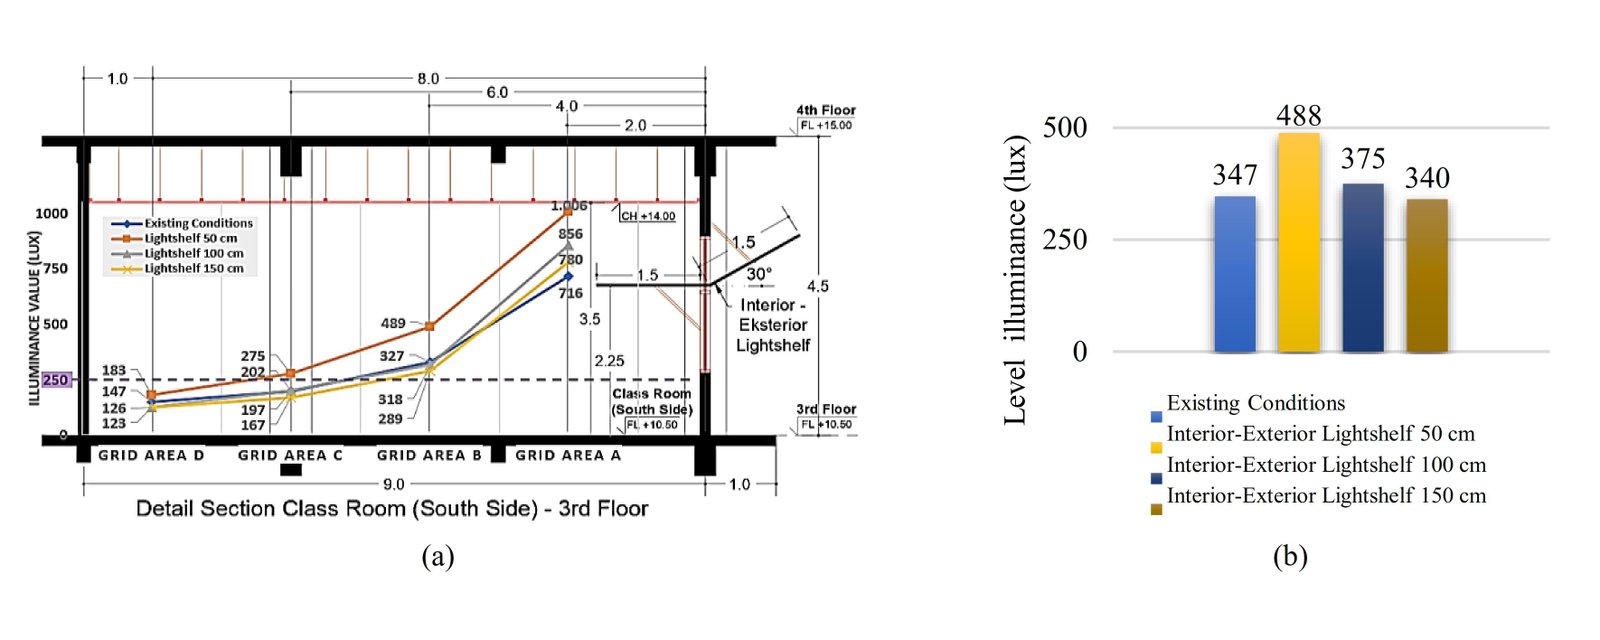 Figure 23
 Table 1
 Table 2
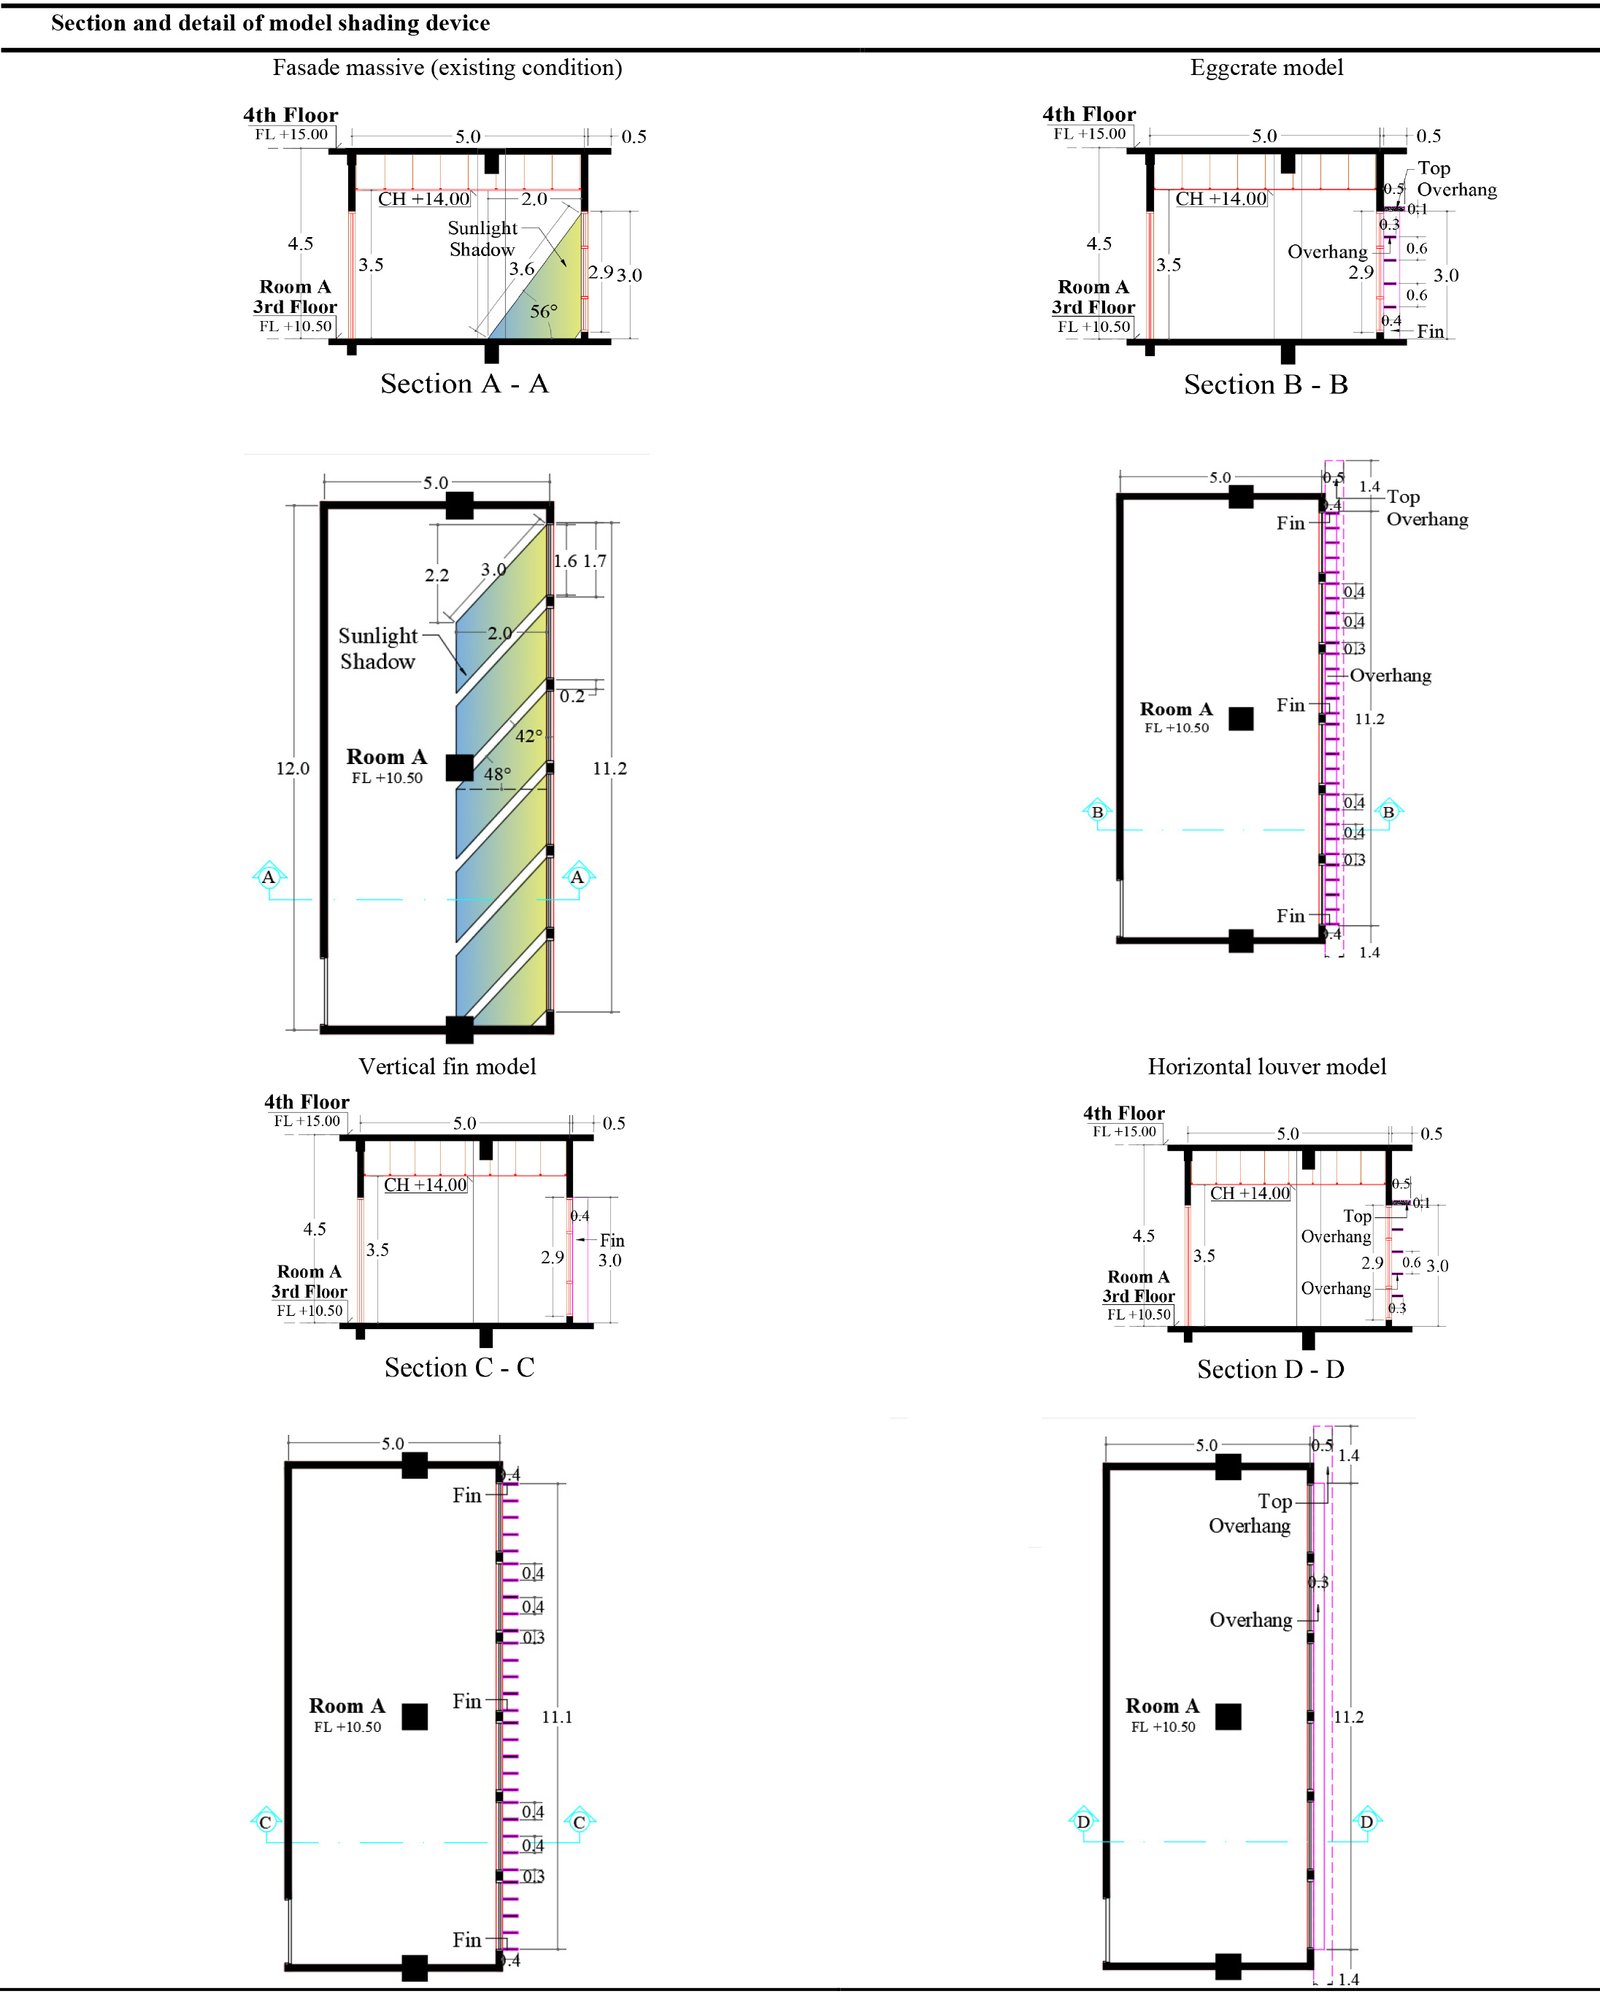 Table 3
 Table 4
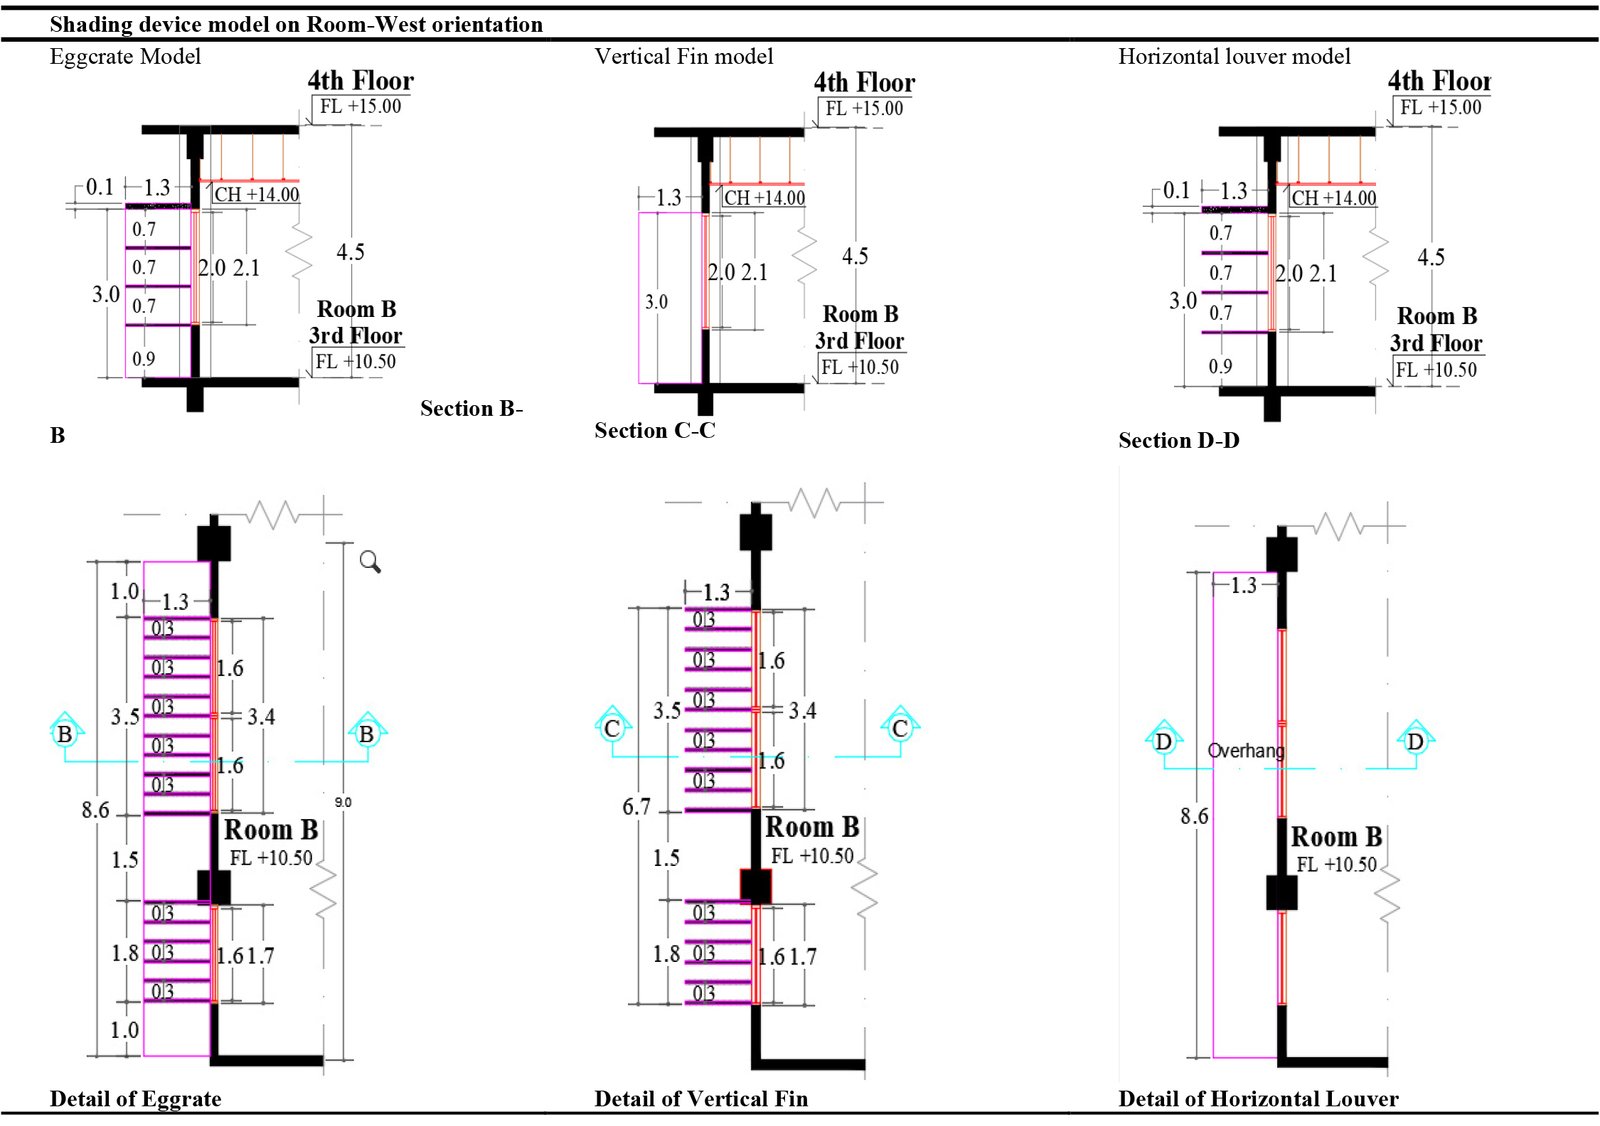 Table 5
 Table 6
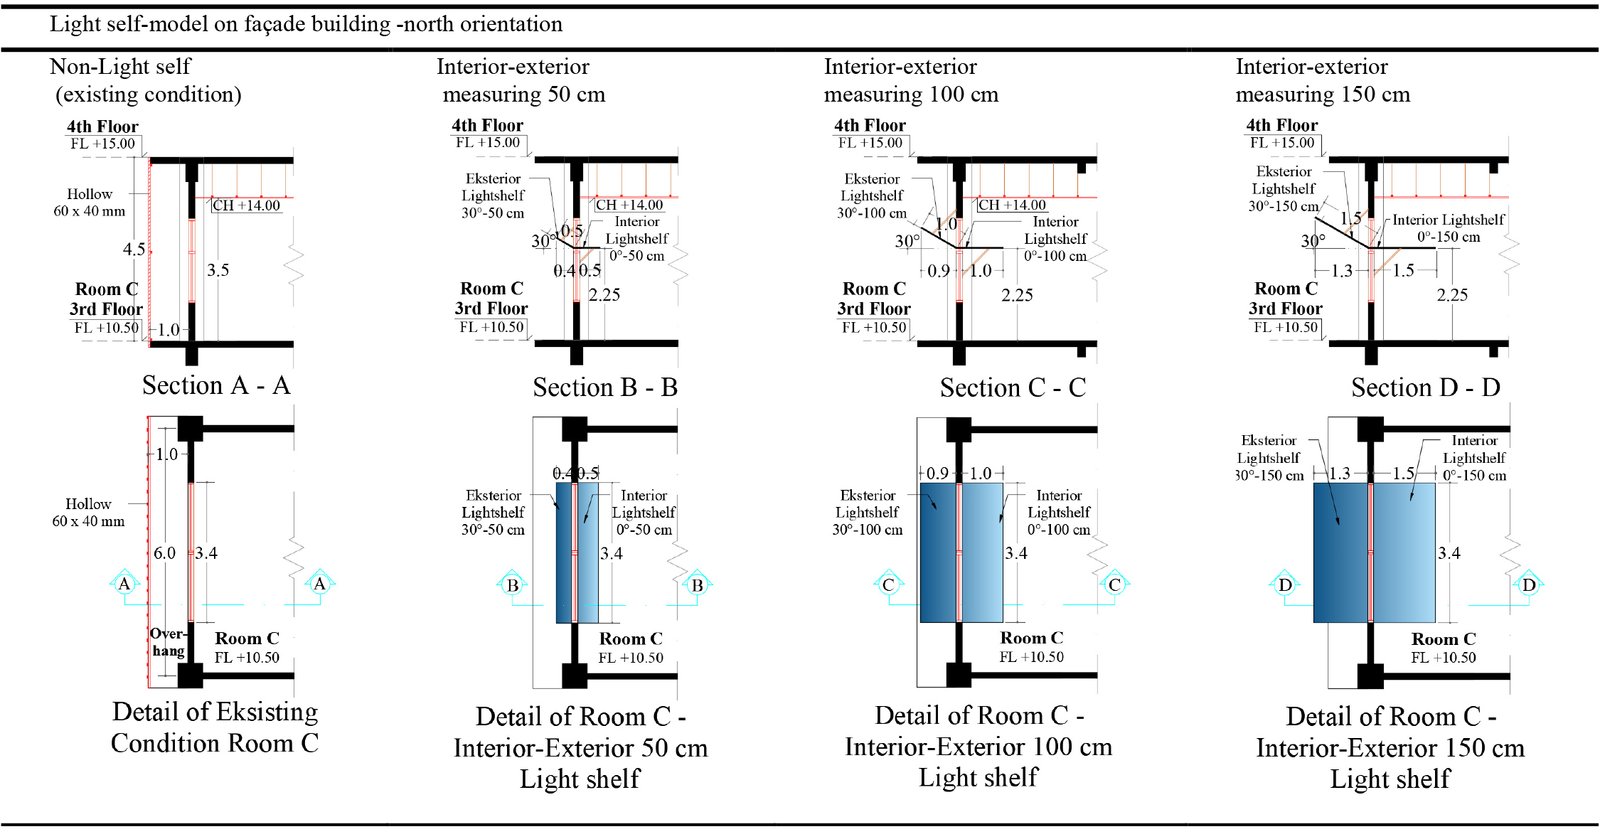 Table 7
 Table 8
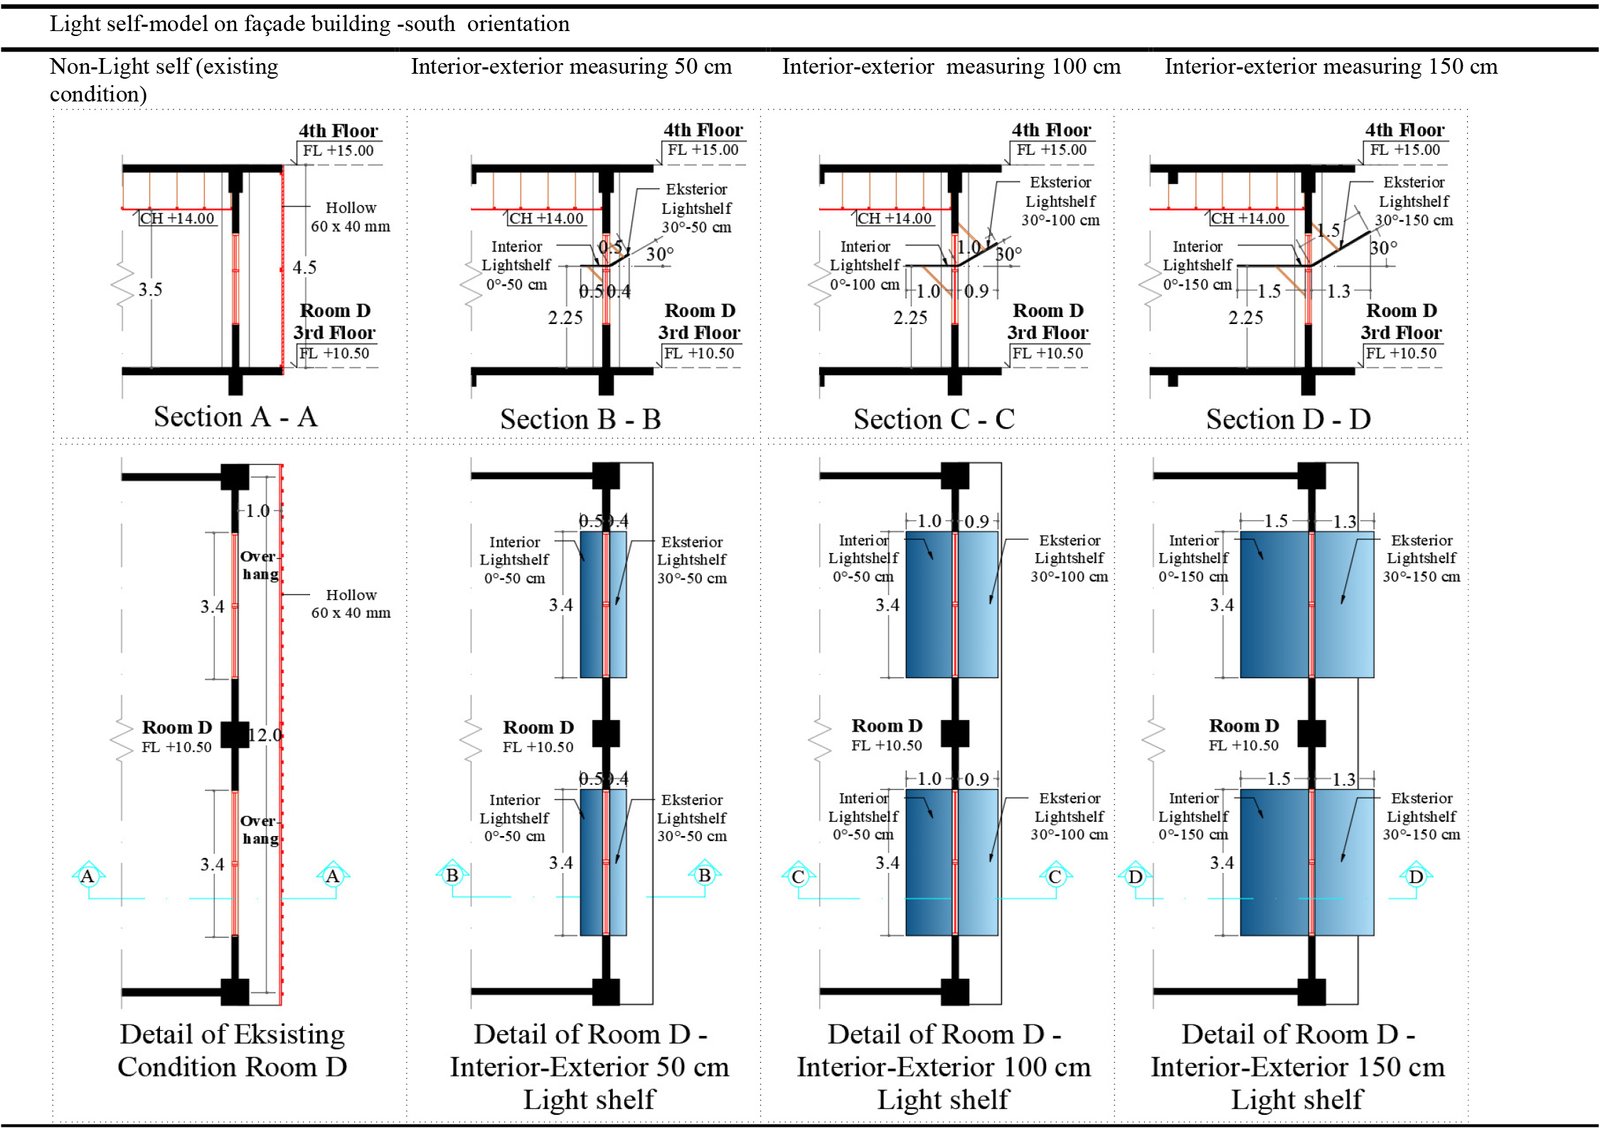 Table 9
 Table 10
Abstract
Passive lighting design plays an important role in providing natural lighting to save electricity consumption in buildings. This study aims to investigate the performance of natural lighting and the potential of alternative designs through sidelights with 3 shading device models and light shelves with different sizes in north, west, east, and south orientations. This research method is quantitative, which describes the measurement results in existing conditions and radiance illuminance software simulations. The results showed that at the beginning of field measurements, it was known that there were rooms with lighting intensity too high, too low, and uneven distribution. The simulation results use Radiance Illuminance software to determine the illuminance value of light distribution into space in the morning, afternoon, and evening. Improvised designs are applied with shading device models on the building envelope, namely horizontal, vertical, and egg-crate models in spaces oriented toward the East and West. This study also applied an interior-exterior light self-model measuring 50 cm, 100 cm, and 150 cm of space with the orientation of window openings towards the North and South. The simulation results in this study, show that without a shading device and using a horizontal model, there will be a decrease of 0.4% at a distance of 2 m from window openings oriented to the East, while to the West will be able to increase the illuminance value by 11.5% at a distance of 10.5 m from the window opening. Buildings without using light self and using interior-exterior light shelves measuring 50 cm can increase the illuminance value by 0.5% at a distance of 10.5 m from window openings in a space oriented towards the North, while the orientation towards the south, which can be increased the illuminance value by 0.4% at a distance of 6 m from the window opening. Based on this research analysis, it concluded that the best-improvised design in rooms oriented toward North and South is a 50 cm interior-exterior light shelf and horizontal shading device models are the best for spaces oriented to the East and West. This study, also concluded that the orientation of the building, the passive device model, and the distance of the measuring point in the building envelope, affect the intensity and distribution of daylight entering the building.
Keywords
Natural lighting, Side lighting, Light shelf, Shading device
1. Introduction
Natural lighting is a technology that plays an active role in reflecting heat load, error, light variation and availability, and the penetration of sunlight into buildings [1]. Buildings designed with natural lighting must meet minimum lighting requirements, usually on overcast skies, to achieve acceptable visual conditions [2]. Daylight is used as luminous efficacy, which is visible light about the total energy of radiation and its unlimited availability [3]. This luminous efficacy that will be received by the building, needs to be designed to be utilized properly. Good natural lighting conditions i.e. with controlled glare, appropriate contrast and color, proper lighting and distribution in the working field [4]. Efforts in achieving good natural lighting conditions are by applying the right natural lighting system as needed. Natural lighting systems can change the conditions of the sky and transmit or reflect sunlight from the angle of occurrence. The system is used for solar shading, protection from glare, and daylight diversion [5]. Natural lighting in buildings is useful for reducing the use of artificial lighting, so it is expected to save electricity consumption to energy consumption. Electricity consumption in Indonesia increases from 1,173 kWh/capita in 2022 to 1,285 kWh/capita in 2023 [6]. Natural lighting also affects a person's social skills. The social behavior of students in classes with natural lighting is higher than the social behavior of students in classes that are not illuminated by natural lighting in pre-school students [7].
The Pangkep State Agricultural Polytechnic Integrated Lecture Building is a building intended for lecture activities that are integrated with four floors. Initial observations made by researchers during the day when the clear sky conditions on the 3rd floor showed, that one of the measuring points contained in the east side room reached 2,324 lux, the north side room 450 lux, and the south side room 567 lux. While in the room on the west side, one of the measuring points is only 9 lux, this is because there is a façade that closes the windows in the room on the west side to block the entry of sunlight. In the case of this lecture building, the façade that functions as a filter and aesthetic element becomes a barrier to the entry of sunlight and views, which causes problems in the room, which is dark in the room on the west side. On the other hand, some of the incoming sunlight causes glare in the afternoon. Natural lighting in lecture buildings can be optimized in the morning to evening period, according to the time of lecture activities that refer to recommended lighting standards [8]. This study will analyze lighting in buildings based on quantitative lighting objectives. In general, natural light is distributed into the room through side lighting, top lighting, or a combination of both [9].
The distribution of natural light in buildings with high visual requirements such as lecture buildings can be obtained by applying an advanced daylighting system design. Advanced daylighting systems can be useful if: performance tasks are difficult to perform and a high level of visual control; complex building geometry, such as blocked facades or deep rooms; need for thermal load control (adjustable solar shading can be an effective way in this strategy) [5]. Passive design strategies should be implemented to reduce energy consumption, to provide alternative sources of natural ventilation and thermal comfort. Such design strategies may include but are not limited to design issues that affect the height, shape, and orientation of buildings [10].
Natural lighting serves both qualitative and quantitative purposes. Qualitatively that is minimizing errors, minimizing hidden reflections, and avoiding excessive brilliance ratios. Quantitatively it is to collect light for visual performance and minimize artificial lighting according to the needs of a particular activity. This is reviewed through the illuminance value, daylight factor value, and its distribution or uniformity [11]. Minimum recommended lighting level (illuminance value) for 250 lux classrooms and 350 lux department/director rooms [8]. Natural lighting guideline requirements are based on the World Organization for Standardization (ISO) General Sky Standards and the Commission International de l'Eclairage (CIE), a set of celestial standards that can mathematically represent the distribution of brightness in a sky [12]. Initial considerations were standards and regulations, further focusing on the scope of climate-based daylight lighting modeling [13]. In addition, daylight factors can be categorized if less than 2% means inadequate lighting (artificial lighting is needed all the time) and if more than 5% means sufficient lighting (artificial lighting is generally not necessary, except at dawn and dusk but glare and sunlight can cause problems) [14]. Similarly, the uniformity ratio is at least 0.4, which is 0.4 parts or 40% of the floor area. The recommended value is at least 0.4, which is 0.4 parts or 40% of the room has an illuminance value or has a value expressed in df according to the standard and a maximum of 1, which is the entire area of the room or 100% of the room area has an illuminance value or a value expressed in df according to the standard. In designing natural lighting, it is very important to know the availability of natural light received at the location [15]. The distribution of light is influenced by the depth of field, the position of the building, the height of the building floor, and the condition of the sky [16-18].
The first improvised design assignment is the shading device. A shading device is a device that controls heat due to sunlight blocking sunlight that enters the building and providing shadowing that can reduce heat [19-22] Types of sun shading are divided into external, interface, and internal. Among the three, external sun shading is the most effective for summer [23]. Indonesia, which has a tropical climate with high average temperatures, it is very appropriate to use sun shading placed outside buildings, including horizontal louver screening, egg-crate, and vertical louver devices [24]. Shading horizontal louver screening effectively reduces the effects of glare at low sun angles and is effective in East-West building planes. Shading egg-crate and vertical louver serve as windbreaks, important for areas with a lot of wind, and effective for East-West fields. Furthermore, the size of the shading device and parapet can be determined by the angle of altitude and azimuth of the sun's position using a solar chart. The angle of fall of the sun is determined by the relative position of the sun and the place of observation on Earth and depends on the geographical latitude of the place of observation, the season, and the length of daily irradiation, which is determined by the geographical longitude of the place of observation [25]. The position of the sun towards the building will form vertical and horizontal angles. Shading geometry will be formed through two shadow angles, namely the vertical shadow angle (VSA) which is the angle between the orientation of the wall with the vertical line taken perpendicular to the tangent, altitude, and the horizontal shadow angle (HSA) which is the horizontal angle of the sun to the orientation of the wall [26].
The use of three types of shading devices, namely shading that is different orientation with Low-E glass, shading all facades + Low-E glass, and shading all facades + clear glass respectively produces cooling energy of 1.0% - 3.4%, 5.0% - 9.9%, and 5.6% - 10.4%. The use of egg-crate shading devices saves energy higher than vertical and horizontal. Its application to the West-East orientation saves energy more than South-North [27]. The use of shading device louvers can optimize the performance of natural lighting and reduce energy consumption, by repeating design variables to perform the process of finding shapes, rather than creating shapes. There were UDI increases for Birmingham, Jakarta, and Sydney by 80%, 146.26%, and 79.48%, and cooling energy consumption by 28%, 3.26%, and 2.99% respectively [28]. The model of the façade on the building envelope affects the distribution of sunlight. The combined vertical-diagonal façade model in addition to producing high illuminance values is also capable of directing distant sunlight into the building simultaneously in the morning, afternoon, and night [24,29,30].
The next improvised design assignment was the light shelf. The use of light shelves in windows can reduce the overall daylight factor in the working area throughout the interior space compared to windows without light shelves of the same size [31-33]. Light shelf interiors, both full-scale and scale models, have been shown to reduce the factor of sunlight in the work field throughout the room compared to conventional windows [33]. In some cases, the use of exterior light shelves increases the total amount of daylight compared to conventional windows [5]. One effort to improve the quality of daylight is to use light shelves as an advanced daylighting system. Properly designed and placed light shelves can be an effective element to improve the quality of daylight in tropical buildings. Light shelves placed at a height of 2 m above the floor with a ceiling of 3 m perform better than alternative locations, including locations without lights [34]. Furthermore, the best distance from the wall to the light shelf is at a distance of 0 cm with an angle of 30° upwards, judging from the spread of the illuminance value [35]. The use of an exterior light shelf effectively shades the window plane area, this can reduce brightness and eliminate discomfort due to glare. The use of an interior light shelf works well to reflect the natural lighting obtained into the inner room. Then, the use of interior-exterior light shelves can provide the best lighting distribution [36]. The South Staffordshire Water Company office building has horizontal internal light shelves and external shelves sloping upwards. Both highly reflective and specular surfaces enhance the penetration of natural lighting, and high ceilings help light shelf work effectively [14].
Based on this, this study examines the performance of natural lighting illuminance and efforts to optimize natural lighting through alternative side light simulation designs, to find out how natural lighting performs and the potential of alternative shading devices and light self-model designs in buildings.
2. Method
The research method used is quantitative, which describes data from measurements of existing conditions and data from computer simulations. Computer simulation using Radiance Illuminance software. This building is shaped like a rectangular area, which has a lighting well (atrium) in the center of the area. The lighting is from the side (four window orientation areas) and from above (dome roof). In this article we only focus on side lighting from four orientations. Sunlight obtained from the side produces different lighting effects from each side of the building. The shading effect that appears in the room becomes a benchmark for determining the size of alternative shading device designs. The angles are measured from the imaging results, then the design alternatives are calculated, then applied to simulations using building modeling in Ecotect and the rendering process in Radiance.
The simulation process uses shading devices and light shelves in four different settings. The simulation stage begins with building modeling using Ecotect software, then the lighting rendering stage uses Radiance software. Ecotect is an environmental analysis tool for simulating building performance from the earliest design stages, while Radiance is a lighting simulation and rendering system that is widely recognized and validated by lighting professionals [37]. Radiance addresses specular diffusion and directional diffusion of reflection and transmission using a backward ray tracing method of light with transmission extension in any combination to any level in any environment [38].
The research process consists of field measurements and computer simulations. Data were analyzed using Microsoft Excel software to look for graphs of increases or decreases in illumination values from measurements for each room in the lecture building. The data obtained is primary and secondary. Primary data consists of the results of existing measurements in the form of: lighting measurements (illumination values and size of imaging angles) and spatial geometry measurements; computer simulation results that are similar to existing conditions (illumination values and isometric 3D rendering images); and computer simulation results for improvised design (illumination values and isometric 3D rendering images). Meanwhile, the secondary data is in the form of theoretical studies. Research flow diagram is shown in Fig. 1.
We have selected Polytechnic Lecture Building, Pangkep, Indonesia for the current research (Fig. 2), which is a building located in the coastal area of Pangkep Regency in Indonesia. This building has three floors and functions as a lecture hall, department room, director's room, auditorium, and others. This building is the object of research, which is the basis for designing buildings using shading devices and lighting. Various models will be applied in simulating the building of this building, as a basis for designing other buildings, to determine the potential of the best model for the distribution of natural light into space.
Figure 2
Fig. 2. Polytechnic Pangkep Lecture Hall, Indonesia (a) front view; (b) floor plan; and (c) back view.
Measurement of illuminance values in several spaces oriented towards the West, East, South, and North located on the 2nd, 3rd, and 4th floors. The spread of natural light in this building depends on the position of the room, in Western-oriented classrooms, the existing condition of the windows is closed by the façade of the building which results in the obstruction of natural lighting from entering the room, resulting in the space becoming dark. The East orientation room with existing conditions without shading devices gets very high sunlight, especially in the morning. The North and South orientation rooms have a mesh on the exterior, they have a space that extends and widens so that the distribution of light is not evenly distributed to the inner space.
Measurements were carried out in the room selected as the object of research from July 17, 2022, to July 31, 2022, every morning (09:00-10:00 WITA), during the day (12:00-13:00 WITA), and afternoon (15:00-16:00 WITA). The geographical position of this building is at a latitude of -4.6° and a longitude of 119.6° (+8.0). The orientation of the front of the building facing West (279° West) and the rear of the building facing East is shown in Fig. 2.
The tool used to measure lighting intensity inside or outside a building uses a digital lux meter (Fig. 3). The illumination value is recorded every 5 seconds then the mode button (hold) on the lux meter measuring instrument holds the visible illumination value. Before use, a calibration process is carried out with several lux meters to maintain conditions according to specifications. The location of the measuring point outside the building is in the middle of a field that is not blocked by buildings, the height of the measuring instrument is 75 cm from the ground (Fig. 4). The position of the measuring point in the room is at a height of 75 cm from the floor surface. The maximum distance between the grilles in each room is 2 m, with a distance of 0.5 m from the edge of the wall, and a distance of 1/3 d from the effective light hole (d = room width) [37]. The measurement points in the building correspond to the points and grids specified in the measurement plan drawing for each room.
Figure 3
Fig. 3. (a) Digital lux meter calibration process; (b) measurement process in the field; and (c) indoor measurement process.
Figure 4
Fig. 4. (a) Position of Measuring Point (left & middle); (b) Explanation of Distance d (right).
This study analyzed the distribution of sunlight into space using light shelves for North and South rooms, and shading devices for West and East rooms (Tables 1 and 2). Improvised design on the light shelf with four models, namely the massive glass model (without light self), the interior-exterior light shelf size 50 cm, 100 cm, and 150 cm. The improvised shading device design applies four models, namely the massive glass model (without the shading device), horizontal, vertical, and egg-crate shading devices. Materials and simulation parameters are as follows.
In this research, measurements were taken in the field and then simulated using Radiance Illuminance to determine the illumination values on various shading device models. Before carrying out the simulation, validation is first carried out between the field measurement results and the building simulation results according to existing conditions. The simulation results show suitability with a difference below 20%, namely: (1) the East side room, which is between -3.4% to 0.5%; (2) classrooms on the south side, namely between -2.7% to 0.08%; (3) classrooms on the north side, namely between -7.3% to 0.07%; and (4) classrooms on the West side, namely between -1.2% to0.8%. Based on the results of these validation calculations, the data from this simulation is worthy of research.
Natural lighting (daylighting) uses light from the sun and sky. Natural lighting can also be influenced by weather, temperature, and air pollution. The Daylight Natural Lighting Factor concept has been established as a metric that describes the limits of natural light in buildings. Daylight Factor at a point indoors is the ratio of the horizontal illuminance in the indoor work plane (Ei [lx]) to the horizontal illuminance in the open field outdoors (Eo [lx]) at the same time, assuming standard cloudy sky conditions that have been established. The International Commission determines the lighting model (CIE).
Excessive sunlight in a building can cause undesirable glare and visual contrast for residents. Therefore, the availability of natural light in buildings must be considered, not only in the daily time domain but also throughout the year. For this reason, natural lighting metrics based on climate-based daylight modeling (CBDM) can be used to determine the availability of natural light throughout the year in a space.
Spatial Daylight Autonomy (sDA) is to measure the annual level of adequate illuminance in a room.
Annual Sun Exposure (ASE) is a quantity that indicates the presence of glare and additional heat due to excessive direct light
Useful Daylight Illuminance (UDI) is the percentage of time spent when the lighting target at a point in space is filled with daylight
3. Results of research
3.1. Sky conditions and building shadows
This study was carried out in July, where the moon is the closest distance between the sun and the earth (aphelion), where the position of the sun is on the northern equinox of the equator. Measurements were made in clear, intermediate, and cloudy sky conditions, namely between 19,430 lux - 20,150 lux (morning), 24,280 lux - 159,100 lux (afternoon), and 43,360 lux - 53,550 (afternoon). Figure 2 shows the shadow of the building where shadowing occurs on different mornings, afternoons, and evenings. The shadow of the building is related to the distribution of sunlight because at certain times it covers direct sunlight so it is necessary to analyze the illuminance value in the room in the morning, afternoon, and evening.
The building model is shown in the Fig. 5 and the space chosen as the object of this research is a space directly connected to the outside space, so it is necessary to consider the distribution of natural light entering the space. Next, it is essential to analyze the shading device model so that natural light does not cause glare and brightness, and lighting should be used light-self to evenly distribute natural light in the space.
Figure 6 shows that in the morning the position of the sun is in the East at a low angle, where illuminating the back of the building (East) and shadowing at the front of the building (West) is seen in Fig. 5(b). As a result, sunlight enters and there is a shadow in the Department room as shown in Fig. 6(a). Then at noon, the position of the sun is on top of the building at a high angle, slightly inclined to the North so that there is a collision in the South part of the building, Fig. 5(b). Because during the day the sun is above the building, the shadowing only occurs near the window of the North side room while in the South side classroom sunlight does not enter, Fig. 6(b) and (c). In the afternoon the position of the sun is in the West at a low angle, illuminating the front of the building (West) and shadowing the back of the building (East), Fig. 5(c). So that the afternoon sunlight enters the classroom as shown in Fig. 6(d). Based on the projection that occurs at three different times, it can be assumed that time and orientation affect the illuminance value in space.
Figure 5
Fig. 5. Shadow of the building: (a) in the morning; (b) during the day, and (c) in the afternoon.
Figure 6
Fig. 6. Daylight condition in the building: (a) The existing conditions of the East side department room in the morning; (b) the North side classroom during the day; (c) The Southside classroom during the day; and (d) The West side classroom in the afternoon.
This building already has shading in the form of hats/cantilevers on the 2nd and 3rd floors, and canopies on the 4th floor measuring 0.5 m – 2.5 m. The cantilever can block sunlight from hitting the opening directly. Especially when the sun is at a high angle during the day. When the sun is at a low angle such as in the morning and evening, this cantilever has not been able to block direct sunlight. So other shading alternatives are needed to overcome glare and excess intensity.
3.2. Analysis of the results of measuring existing conditions and simulation
The research objects in this building are the classrooms (rooms A, B, and C), and the Department work space (room D) which are located on floors 2, 3, and 4. Room A with window openings is oriented towards the South, room B towards the West, room C towards the North, and Room D towards the East. Before carrying out the simulation, measurements were carried out in the field in the morning, afternoon, and evening, and validation was carried out between the field measurements and the initial conditions of the simulation. Radiance Illuminance software is used to determine the illumination value of light distribution in the room in the morning, afternoon, and evening. The simulation was carried out by designing shading devices on the building envelope, namely horizontal, vertical, and egg-crate models in spaces oriented towards East and West. Next, apply an interior-exterior light self-model measuring 50 cm, 100 cm, and 150 cm in space with window openings oriented towards North and South.
3.2.1. Orientation of window towards the East (Room A)
This space measures 5 × 12 m and has the same size for all three floors 2, 3, and 4. The illuminance value of this space is at the position of the orientation of the window opening towards the East. Placing measuring points A1-B6 on all three floors for three days of measurement ranged from 294 – 6,653 lux. Based on the measurement results in Fig. 4, the 2nd floor of grid A shows the highest average illuminance value in the morning (3,654 lux) then the afternoon (1,516 lux), and the lowest in the afternoon (1,275 lux). This room obtains a very high lighting intensity on average above the standard of 350 lux (for department rooms), this is influenced by wide window openings and openings facing the rising sun in the East orientation.
It can be seen in Fig. 7 that the illuminance value on grid A is higher than grid B for floors 2, 3, and 4. On the 2nd floor, there was a decrease of 0.4% from 2,149 lux in grid A to 1,329 lux in grid B. Similarly on the 3rd floor there was a decrease of 0.3%, and on the 4th floor a decrease of 0.1%. This indicates that the area near the opening has a higher illuminance value than the area far from the opening. Judging from the acquisition of the intensity of the three floors of the same size, it can be concluded that the intensity of the 2nd floor is the highest, then the 3rd floor, and the lowest 4th floor. The higher the floor level, the lower the lighting intensity.
Figure 7
Fig. 7. (a) Graph of the average measurement results of 3 days in the East side lecture hall and (b) Graph of the average result of 3 days measurement 3x in the East side lecture hall.
Figure 8 shows the spread of light with cloudy sky conditions, this is done to see the spread of light at the worst conditions (morning outdoor illuminance 19,430 lux, afternoon 24,280 lux, afternoon 53,550 lux). Based on Fig. 8, almost all measurement times show grid A is higher than grid B, except for the morning and evening times on the 4th floor the results are evenly distributed. The average daylight factor value of the 2nd floor ranges from 1.3% - 6.2%, the 3rd floor is between 1.56% - 5.27%, and the 4th floor ranges from 0.63% - 4.2%. The measurement time that falls within the scope of the daylight factor standard is the daylight factor measurement time, while the morning time is above the standard and the afternoon is below the standard, where the office building daylight factor standard is 2% - 4%. The uniformity ratio value of this room has met the standards on the 2nd floor (44.6% - 80.5%), 3rd floor (50.9 - 86.2%), 4th floor (56.9% - 89.2%) where the uniformity ratio standard is at least 40% of the room area.
Figure 8
Fig. 8. Daylight factor profile of East orientation: (a) 2nd floor (left); (b) 3rd floor (center); and (c) 4th floor (right).
3.2.2. Orientation of window towards the West (Room B)
This room has different sizes on each floor, 2nd floor (9 × 6 m), 3rd floor (18 × 12 m), and 4th floor (12 × 6 m). The illuminance value of the East side Department room per-measuring points on all three floors for three days of measurement ranged from 2 – 1,264 lux. All three rooms showed that the average illuminance value was below standard (minimum 250 lux for classrooms) (Fig. 9). The substandard intensity is because the window openings of the West side rooms on the 2nd and 3rd floors are covered by the façade of the building and only part of the opening plane can introduce natural light into the room. In addition, lighting that can enter in the afternoon causes excessive glare. This is because the opening field of this room faces the West side where it is exposed to the afternoon sun. On the 4th floor only the area near the opening, grid A, meets the 250 lux standard and the decrease occurs in the area further away from the opening. The high graph in grid area B on the 2nd floor is caused by some sunlight entering part of the window causing high intensity and excessive glare. Neither the daylight factor values of the 2nd, 3rd, and 4th floors on day 3 nor the uniformity ratio values (3-day measurements) met the standards (Fig. 10).
Figure 9
Fig. 9. (a) Graph of 3-day average measurement results in West side class (b) Graph of the 3-day average measurement result in 3x in West class.
Figure 10
Fig. 10. Daylight factor profile of West classroom: (a) 2nd floor (left); (b) 3rd floor (center); and (c) 4th floor (right).
3.2.3. Orientation of window towards the south (Room C)
The illuminance value of this space is oriented towards the North with an illuminance value between 9 – 1,873 lux. The graph shows the decrease in illuminance value from grid A to F as well as from grid A to G. Only grid area A or B is above standard (minimum 250 lux for classrooms) (Fig. 11). This indicates that the closer the opening, the higher the illuminance value (grid A near the opening). In addition, the more the number of grids indicates the size of the depth of room is deep, the graph shows the lower the intensity of lighting away from the openings. The three floors have the same width of space and the same opening area so that they can be compared with the average illuminance value per grid, the 3rd floor is 6 × 12 m and the 2nd and 4th floors are 6 × 15 m. On the 2nd floor of the AB grid, it drops by 0.5%, the further away from the opening the intensity decreases. Decreases in the BC grid were 0.4%, CD 0.3%, DE 0.3%, EF 0.3%, and FG 0.2%. Similarly, floors 3 and 4 experience a decrease in intensity the further away from the opening. On the 2nd floor of grid A when compared with the morning, afternoon, and evening measurement results from the three days of measurement, the morning measurement results are the highest (610 lux), then the afternoon (465 lux) and evening (239 lux). The graph of the average measurement of three days with morning, noon, and evening shows an increase in intensity in grid A from the 2nd floor (438 lux), then the 3rd floor (475 lux), and the 4th floor (756 lux). The higher the floor level, the higher the of level illuminance.
Figure 11
Fig. 11. (a) Graph of 3-day average measurement results in a Northside class (b) Graph of the 3-day average measurement result in 3x on North side class.
Figure 12 shows that the daylight factor graph is no different from its illuminance value. The graph shows the height near the opening then drops significantly and descends gently to the end of the chamber, indicating the room is elongated. The elongated space results in the closer the measuring point to the opening, the higher the illuminance value, and the farther the area of the opening, the lower the intensity. The average daylight factor values that met the standard were grid A in the morning (3.79%) and afternoon (2.34%) measurements measured in the cloudy sky on day 3. While the uniformity ratio value (for 3 days) none of them met the standard.
Figure 12
Fig. 12. Daylight factor profiles in Northside classrooms: (a) 2nd floor (right); (b) left, 3rd floor (right); and (c) 4th (lower) floor.
3.2.4. Orientasi of the window toward the south (Room D)
This room is located on the 2nd floor with a size of 6 x 12 m and the 3rd and 4th floors measuring 9 × 12 m. The illuminance value of the measurement results for three days on three floors ranged from 71 – 1,780 lux. Figure 13 shows a graph of decreasing illuminance values from grid A to C as well as from grid A to D. This shows that the closer to the opening, the higher the lighting intensity. The 2nd floor area is above standard (minimum 250 lux for classrooms), while the 3rd floor and 4th floor have some grid areas that are below standard.
Figure 13
Fig. 13. (a) Graph of 3-day average measurement results in Southside class and (b) Graph of 3-day average measurement result 3x on South side class.
The 3-day measurement graph shows that the morning and afternoon measurement results tend to experience a constant decrease, while the afternoon measurement results fluctuate from grid A to C or grid A to D. Based on the average 3-day and 3x measurement graphs, it shows a higher level of illuminance on the 4th floor than the 3rd floor (except for the 2nd floor, because the size of the room is smaller with 2 window openings). So, the higher the floor level, the higher the illuminance level. Both floors 2, 3, and 4 experienced graphs of decreasing lighting intensity from high near openings to decreasing as they got farther away from openings. On the 3rd floor Grid AB fell 0.5%, BC Grid 0.3%, and CD Grid 0.3%, as did the decline on the 2nd and 4th floors. It can be concluded that the farther from the opening, the lower the illuminance level.
Figure 14 shows that average daylight factor measurement results (cloudy sky) that meet the standard are the 2nd floor (morning measurement time), the 3rd floor in grid A (2.89%), the 4th floor in grid B (2.5%), and C (2%), where the standard daylight factor of office buildings is 2% - 4%. The light distribution of the 2nd floor tends to be evenly distributed while the 3rd and 4th floors are high in intensity near the openings. Furthermore, within 3 days of measurement, several uniformity ratio values meet the standards on the 2nd floor (ranging from 42.5% - 78%) to the 4th floor (ranging from 41.9% - 47.2%), where the uniformity ratio standard is at least 40% of the room area.
Figure 14
Fig. 14. Daylight factor profile of Southside classrooms: (a) 2nd floor/ left; (b) 3rd floor/ center; and (c) 4th floor/ right.
3.3. Analysis of simulation measurement results resembles existing conditions
In this study, using the Radiance Illuminance application and the beginning of the simulation, the suitability of measurement results in the field and then building simulation using several shading devices and light shelf models. The simulation results show measurement results that resemble existing conditions with a relative difference in error below 20%. If the relative error rate is less than 20%, then the simulation data is suitable for research. The relative value of error for 3x within 3 days of measuring the 2nd, 3rd, and 4th floors, that is, the East side department room ranged from -3.4% to 0.5%; Southside classrooms ranged from -2.7% to 0.08%; Northside classrooms range from -7.3% to 0.07%; and West side classrooms ranged from -1.2% to 0.8%. Based on the results of these calculations, the data from this simulation is worthy of research.
3.4. Improvised analysis of shading device and light self-design models
3.4.1. Shading device model (Eastern and Western orientation)
Table 3 shows the cut and details of the East side department room. Seen in Fig. 15(a) is the description of natural lighting in existing conditions in the morning on the 3rd floor as well as details of improvised design sizes (b) egg-crate, (c) vertical fin, and (d) horizontal louver. The condition of the East side room has a narrowed room with wide openings, to obtain high lighting intensity throughout the day. In the morning the position of the sun is on the east side, where directly facing the department room resulting in the entry of direct sunlight with high intensity, glare, and excessive heat. So, a passive lighting system is needed that blocks direct sunlight but indirect sunlight can still enter, so a shading device is applied to the East side room. The sunlight looming on the window is measured and calculated with horizontal shadow angle and vertical shadow angle to determine the size of the fins and overhangs. Furthermore, the measurement results then produce egg-crate models (a combination of vertical fins and horizontal overhangs), vertical fins (vertical fins), and horizontal louver (horizontal overhangs) which are applied to Radiance illuminance simulations.
Table 3
Table 3. Details of shading device cut east side classroom – 3rd floor (a) existing condition, (b) egg-crate, (c) vertical fin, and (d) horizontal louver shading device.
Figure 15
Fig. 15. The 3D image shows the shading device orientation East model: (a) vertical fin; (b) horizontal louvers; and (c) egg-crate.
Table 4 shows the isometric 3D East side Department space displaying the morning rendering of Radiance Illuminance. It can be seen that when the room in the setting resembles the existing condition, the level of illuminance is high with red markings almost all over the floor. After the room is installed shading device, part of the floor is green and part of the wall is blue, this shows that the intensity of light received in the room has decreased.
After applying the improvised design with the simulation of four models, the measurement results obtained are as follows (Fig. 16). At a distance of 2 m from the opening, the lighting intensity can be lowered to 889 lux using horizontal shading of the louver and 1,038 lux if using vertical fin shading at the same distance, which was originally 1,544 lux. The best shading consideration is that it can reduce the sensitivity of lighting that is too high but still above the minimum illuminance standard of 350 lux for Department rooms. The percentage decrease that occurred from the three models included the existing – crate at 0.6%, the existing – vertical fin at 0.4%, and the horizontal louver at 0.4%. Furthermore, if the whole is averaged, the highest to lowest order is the existing vertical fin, horizontal louver, and egg crate. The results of the uniformity ratio can be taken into consideration by measurement results, which initially in existing conditions is 9% and can increase to 43% (egg-crate), 45% (vertical fin), and 45% (horizontal louver) above the standard. This shows an increase in the evenness of lighting in the room and an increase in light quality.
Figure 16
Fig. 16. (a) Improvised design profile average illuminance value per grid, East side department room and (b) Graph of the average illuminance value of the East side department room improvisation design.
Based on the results of these measurements, it can be analyzed that there is an improvement in light quality by decreasing the intensity of lighting in the room after the three types of shading are applied. But it is worth considering the order of the best results. The use of egg-crate shading gets the lowest illuminance value and uniformity ratio but one of the grid's average illuminance values is below standard. While between horizontal or vertical shading, seen from the lowest intensity near the opening is horizontal shading. Then the best order of results is horizontal louver, vertical fin, eggcrate, and existing without shading.
Figure 17(a) shows a picture of natural lighting in existing conditions in the afternoon on the 3rd floor as well as details of improvised design sizes (b) egg-crate, (c) vertical fin, and (d) horizontal louver. The condition that occurs in this lecture hall is that part of the window is covered by a massive façade with aluminum composite panels and some transparent glass on the exterior front window of the West side room resulting in a dark room throughout the day. In the afternoon the position of the sun is on the West side, where it directly faces the lecture hall. Afternoon sunlight entering part of the window causes high intensity, glare, and overheating. So, a passive lighting system is needed that dispels direct sunlight but indirect sunlight can still enter, so a shading device is applied to the West side room. The application of shading devices on the three models was accompanied by the removal of the exterior façade in front of the West room opening. Next, shadow angle measurements are carried out to determine the size of fins and overhangs to be applied in the simulation.
Figure 17
Fig. 17. The 3D image shows the shading device orientation West model: (a) vertical fin; (b) horizontal louvers; and (c) egg-crate.
Figure 18 shows a floor plan and section of the West orientation room. The massive facade in this room almost covers all the windows and causes very little sunlight to enter. The simulation experiment for this space is to eliminate existing shading conditions and add shading device designs with egg-crate shading models, vertical fin shading, and horizontal louver shading.
Figure 18
Fig. 18. (a) Detail floor plan of the West orientation room and (b) Detail of Existing condition - West orientation.
Table 5 shows a space section in the west orientation using an egg crate, vertical fin, and horizontal louver model design. In this research, a simulation was carried out in a room oriented towards the west. Next, a Radiance illumination simulation is carried out to determine the value of natural lighting illumination in the space using 3 shading device models, as in Table 3 below.
Table 5
Table 5. Detail floor plan of West orientation room – 3rd floor (a) existing conditions, (b) egg-crate, vertical fin, and horizontal louver shading device.
Table 6 shows the isometric 3D of the West side Department room displaying the results of the afternoon Radiance Illuminance render. It can be seen that when the room in the setting resembles the existing conditions, the illuminance level is very low with blue markings throughout the room. After the façade is removed and the room is installed with shading devices, some rooms are green and some are blue, this shows that the intensity of light received in the room has increased.
The results of the existing simulation at a distance of 10.5 m from the opening were originally 3 lux with (existing conditions of the façade closed opening) increased to 15 lux (egg-crate), 26 lux (vertical fin), and 37.6 lux (horizontal louver) (Fig. 19). These three shading devices are also higher than the existing conditions. The percentage increase that occurred in the three models included existing – crate at 3.2%, existing – vertical fin at 11.2%, and horizontal louver at 11.8%. Furthermore, the uniformity ratio values in these four types of shading include existing shading at 46%, egg-crate at 17%, vertical fin at 12%, and horizontal louver at 23%. It should be understood that the uniformity ratio of existing conditions is very high due to almost even dark conditions, in this case, it does not meet uniformity standards because the illuminance value does not meet the minimum standard of 250 lux. So the best result order is horizontal louver, vertical fin, egg-crate, and existing without shading.
Figure 19
Fig. 19. (a) Improvised design profile average illuminance value per grid, West side classrooms and (b) Graph of the average illuminance value of the improvised design of the West side.
3.4.2. Light shelf model (North-South orientation)
Table 7 shows the details of the light shelf pieces with four simulation models (Fig. 20). The condition of the North side classroom is elongated. The lighting obtained by this space is high near the opening and low in the space far from the opening. So, it is necessary to apply a passive lighting system that forwards light into the room, namely the application of a light shelf. Model applications include the light shelf-to-wall distance of 0 cm, interior light shelf angle of 0° and exterior light shelf angle of 30 ° and above, shelf height position 2.25 m from the floor surface, and ceiling height 3.5 m from the floor surface. Light shelf size variations include an interior-exterior light shelf of 50 cm, an interior-exterior light shelf of 100 cm, and an interior-exterior light shelf of 150 cm.
Figure 20
Fig. 20. 3D view of the North orientation light shelf model: (a) interior-exterior light shelf 50 cm; (b) interior-exterior light shelf 100 cm; and (c) interior-exterior light shelf 150 cm.
Table 8 shows the isometric 3D of the North orientation displaying daylight renderings of Radiance Illuminance. It can be seen that when the room in the setting resembles the existing conditions, the level of illuminance is high near the opening. After the mesh is removed and the room is installed light shelf, the illuminance value increases more into the space, marked by a green color that is getting to the center of the space.
The percentage increase in lighting intensity that occurred in the three models included the existing – light shelf of 50 cm at 0.5%, the existing – light shelf of 100 cm at 0.3%, and the existing – light shelf at 150 cm at 0.1%. The simulation results in Fig. 21 shows an increase after using an interior-exterior light shelf of 50 cm at a distance of 10.5 m from the opening which was previously 43 lux to 66 lux. With an average of 183 lux to meet the minimum standard of 250 lux to 266 lux. As its pdf value increased from 2.7% to 3.1%. Judging from the uniformity ratio value of the four models, including the existing 31%, light shelf 50 cm 19%, light shelf 100 cm 22%, and light shelf 150 cm 29%, there is a decrease in uniformity in the room. This is a drawback that also occurs when there is an increase in illuminance value simultaneously, namely an increase in high light intensity near the opening. Although uniformity decreased, the illuminance value and daylight factor increased so that the best order of results was obtained from light shelf sizes 50 cm, 100 cm, 150 cm, and massive glass (without light).
Figure 21
Fig. 21. (a) Profile of the average illuminance value per grid of improvised designs in the North orientation space and (b) Graph of the average illuminance value of the improvised design in the North orientation.
Table 9 shows the details of the light shelf cut with four simulation models. Applications of this light shelf model include a light shelf shelf-to-wall distance of 0 cm, interior light shelf angle of 0° and exterior light shelf angle of 30 ° and above, shelf height position 2.25 m from the floor surface, and ceiling height of 3.5 m from the floor surface. Light shelf size variations include interior-exterior lightshelf 50 cm, interior-exterior lightshelf 100 cm, and interior-exterior lightshelf 150 cm (Fig. 22).
Figure 22
Fig. 22. 3D view of the South orientation light shelf model: (a) interior-exterior light shelf 50 cm; (b) interior-exterior light shelf 100 cm; and (c) interior-exterior light shelf 150 cm.
Table 10 shows the isometric 3D of the south orientation displaying daylight rendering results of Radiance Illuminance. It can be seen that when the room in the setting resembles the existing conditions, the level of illuminance is high in the window area. After the mesh is removed and the room is installed light shelf, the increase in illuminance value gets deeper into the space, characterized by the green color that is getting to the center of the room, and the intensity of lighting in the window area decreases.
The simulation results showed a room without a light shelf that was previously 202 lux at a distance of 6 m from the opening, an increase reaching the standard occurred after using an interior-exterior light shelf of 50 cm to 275 lux. With a total average from 347 lux (existing) to 488 lux (interior-exterior 50 cm). The increase also occurred in the daylight factor value from 3.7% to 4%. The percentage increase in lighting intensity that occurred in the three models included an existing – light shelf of 50 cm of 0.4%, an existing – light shelf of 100 cm of 0.1%, and a decrease in existing – light shelf of 150 cm of 0.02%.
The uniformity ratio values obtained include without light self of 16%, light shelf size 50 cm: 12%, 100 cm: 9%, and 150 cm: 13%. Although uniformity decreases, the illuminance value of the inside of the chamber increases and the daylight factor increases so that the best order of results is obtained. The order of the best results of the four light shelf sizes is 50 cm, 100 cm, without light shelf, and 150 cm lights.
Figure 23
Fig. 23. (a) Improvised design profile of average illuminance value per grid, Southside classrooms, and (b) Southside classroom improvised design average illuminance value graph.
4. Discussion
Research on natural lighting through side lighting has been carried out by previous researchers [19,21,24,28,34,36]. However, this research has yet to analyze model the entire namely, horizontal, vertical, and egg-crate models and light self-model measuring 50 cm, 100 cm, and 150 cm, as was done in this study. Previous research has also concluded that the distribution of natural light influences the timing, but orientation of building openings and the simulation was carried out only according to the existing shape of the building [16,17]. It did not evaluate how if the building used shading devices or light-self. In this research, we analyze the influence of shading devices and light-self models, and the orientation of buildings. The models to find out what model and orientation is best in designing buildings to optimize and evenly distribute sunlight entering the building.
Previous research also analyzed shading device and light-self models in buildings but did not combine them with the orientation of building openings. In contrast, in this research, shading devices and light-self models analyzes the orientation of building openings. The uniqueness of this research is that it analyzes shading device models with various sizes and exterior and interior light-self models with different sizes. In contrast, previous research focused only on building facade models.
The space oriented towards the east has a very high illuminance value and glare occurs, so this research simulates the building by adding shading devices to the building envelope with massive glass, horizontal, vertical, and egg-crate models [24]. Especially in the object of this research, the west-oriented room has a low light distribution at a certain time so the room tends to be rather dark because it uses a facade on the building envelope that covers the window openings as a whole, so it is generally known that in planning buildings not only think in terms of building aesthetics but need attention to how much natural light distribution value can enter the building [16,17].
The shading device model is the motivation to avoid the negative effects of glare and brightness from natural light sources and the light self of the model is to even out the distribution of natural light into the space [20]. This study analyzed the shading device model based on the orientation of the window opening and the simulation results of the improvised shading device design showed that among the Horizontal, vertical, egg-crate, and no shading device models, the best result was the horizontal louver model in the space oriented towards the East and West. The use of horizontal shading devices in the East orientation was able to reduce the intensity of overlighting by 0.4% at a distance of 2 m from the opening and prevent glare. The evenness of the lighting also increased, with a uniformity ratio value of 45%. Although still below the standard illuminance value, there is a significant increase in the illuminance value. Using a horizontal shading device in the west-orientated room was able to increase the illuminance value by 11.5% at a distance of 10.5 m from the opening and prevent glare and excessive light intensity.
In spaces that have a considerable depth from the window opening [18], it is necessary to use a light self to distribute light evenly. In this study, the simulation results of the improvised light shelf design were shown, which concluded that among the interior-exterior light shelf sizes of 50 cm, 100 cm, 150 cm, and without light self, the best result was the interior-exterior light shelf of 50 cm for spaces oriented towards the North and South. The disadvantage of the improvised design results of using light shelves in the North and South orientation spaces is the decrease in the uniformity ratio value, meaning that the uniformity of light decreases. This is due to the increase in light intensity that occurs simultaneously, if the higher the intensity inside the room, the higher the intensity near the building envelope. The advantage is that both in the North and South side classrooms, one point of the average grid area has increased the illuminance value, which was previously below the illuminance standard to be above the minimum illuminance standard. The North orientation room was able to increase the illuminance value at a distance of 10.5 m by 0.5%. While the South orientation can increase the illuminance value at a distance of 6 m from the opening by 0.4%.
The results of this study can be a guideline for designing buildings by using shading devices to optimize the distribution of natural lighting into the space and using the Light self-model to flatten the distribution of natural light in the space. In general, the results of this study can be a guide in planning buildings by minimizing the use of electricity consumption in buildings to create energy-efficient buildings.
4. Conclusion
The improvised design model on the building envelope is to use a shading device, there will be an increase in the illuminance value of natural light distribution into the room, and the best model is a horizontal louver shading device, especially in the east and west building orientations. The simulation results show that the rooms oriented towards the North and South have an uneven distribution, which is high intensity near the opening and low in the part far from the opening. Improving the design using the light shelf, will increase the illuminance value, and from the four simulation models concluded that the best model is the interior-exterior light shelf size of 50 cm.
The orientation and model of passive devices (advanced daylighting system: light shelf of model, and shading device model), as well as the distance of the measuring point to the opening affect the intensity and distribution of sunlight entering the building. The results of this study can be used as a reference for designing buildings in terms of providing optimal daylighting through passive devices. This research is expected to reduce the use of electricity and energy reduction in buildings and become a guide in designing energy-efficient buildings.
Contributions
All authors contributed to the preparation of this manuscript. B. Wijaya, as the first author, conducted field measurements, simulations, and research analysis and wrote the manuscript draft. As supervisors, N. Jamala and B. Hamzah guided the research results' analysis, discussion, and conclusions. All authors responded to reviewer comments and revised the manuscript. All authors read and approved the final manuscript.
Declaration of competing interest
The authors declare no conflict of interest.
References
- G. D. Ander, Daylighting performance and design, John Wiley & Sons Publisher, 2003, 1-256.
- S. Darula, J. Christoffersen, and M. Malikova, Sunlight and insolation of building interiors., Energy Procedia, 78 (2015) 1245-1250. https://doi.org/10.1016/j.egypro.2015.11.266
- A. Krishan, Climate Responsive Architecture: A Design Handbook for Energy Efficient Buildings, Tata McGraw-Hill Publishing Company, 2001, 1-409
- H. K. Abdullah and F. D. Miran, Evaluation of the Optimal Solar Shading Devices for Enhancing Daylight Performance of School Building. (A case study of semi-arid climate-Erbil city), ZANCO Journal of Pure and Applied Sciences, 28 (2016) 580-598.
- N. Ruck et al., Daylight in Buildings - a sourcebook on daylighting systems and components, IEA SHC Task 21 - ECBCS Anexo 29, California, 2000, 262.
- A. C. Adi, Public Electricity Consumption Increases, 2023 Achieved 1.285 kWh/Capita, Ministry of Energy and Mineral Resources Republic of Indonesia, Indonesia, 2003.
- S. Yacan, Impacts of Daylighting on Preschool Students' Social and Cognitive Skills, Interior Design Program: Theses, University of Nebraska, Lincoln, 2014, pp. 63.
- B. S. N. Indonesian National Standard SNI 03-6575-200, Procedures for Designing Artificial Lighting Systems in Buildings (Book), Indonesia, 2001, pp. 1-32.
- J. Thojib and M. S. Adhitama, Visual comfort through natural lighting in the office, Journal RUAS, (2013) 10-15.
- K. E. Chukwujindu, G. Kasiraman, and N. Bansal, Thermal Comfort in Tropical High-Rise Buildings: A review of published research, ISVS e-journal, 9 (2022) 102-122.
- N. Lechner, Heating, cooling, lighting: Sustainable design methods for architects, John Wiley & sons, Canada, 2014, pp. 427.
- K. Alshaibani and D. Li, Sky type classification for the ISO/CIE Standard General Skies: A proposal for a new approach, International Journal of Low-Carbon Technologies, 16 (2021) 921-926. https://doi.org/10.1093/ijlct/ctab020
- P. Tregenza and J. Mardaljevic, Daylighting buildings: Standards and the needs of the designer, Lighting Research and Technology, 50 (2018) 63-79. https://doi.org/10.1177/1477153517740611
- C. I. of B. S. E. [CIBSE], Lighting Guide LG10: Daylighting and window design, Building, The Chartered Institution of Building Services Engineers, London, 1999, pp. 1-99.
- R. Rahim, Baharuddin, and R. Mulyadi, Classification of daylight and radiation data into three sky conditions by cloud ratio and sunshine duration, Energy Building, 36 (2004) 660-666 https://doi.org/10.1016/j.enbuild.2004.01.012
- N. Jamala, R. Rahim, S. Latief, and H. Ramli, Light Distribution Analysis on Buildings Located on the Coastal, in: IOP Conference Seies Materials Science Engineering, Indonesia, Gowa, South Sulawesi, Indonesia, 8 Nov 2018, 676 012024. https://doi.org/10.1088/1757-899X/676/1/012036
- N. Jamala, R. Rahim, and R. Mulyadi, Analysis of Natural Light Distribution in the Building, in: IOP Conference Seies Materials Science Engineering, Gowa, South Sulawesi, Indonesia, 8 Nov 2018, 619 012024. https://doi.org/10.1088/1757-899X/619/1/012024
- N. Jamala, A. N. Wika, and A. Kusno, Analysis of Daylight Distribution on Building Height and Space Depth., in: IOP Conference Seies Materials Science Engineering: Gowa, South Sulawesi, Indonesia, 8 Nov 2018, 619 012044. https://doi.org/10.1088/1757-899X/619/1/012044
- D. de Loyola Ramos Garcia and F. O. Ruttkay Pereira, Method application and analyses of visual and thermal-energy performance prediction in offices buildings with internal shading devices, Building and Environment, 198 (2021) 1-48. https://doi.org/10.1016/j.buildenv.2021.107912
- A. Heidari, M. Taghipour, and Z. Yarmahmoodi, The effect of fixed external shading devices on daylighting and thermal comfort in residential building, Journal of Daylighting, 8 (2021) 165-180. https://doi.org/10.15627/jd.2021.15
- Athaillah, R. A. Mangkuto, M. D. Koerniawan, J. L.M. Hensen, B. Yuliarto, Optimization of Daylighting Design Using Self-Shading Mechanism in Tropical School Classrooms with Bilateral Openings, Journal of Daylighting 9 (2022) 117-136. https://dx.doi.org/10.15627/jd.2022.10
- R. Singh, I. J. Lazarus, and V. V. N. Kishore, Uncertainty and sensitivity analyses of energy and visual performances of an office building with external Venetian blind shading in hot-dry climate, Applied Energy, vol. 184 (2016) 155-170. https://doi.org/10.1016/j.apenergy.2016.10.007
- M. Wall and H. Bülow-Hübe, Solar Protection in Buildings, Lund Institute of Technology Department of Construction and Architecture, Sweden, 2001, pp. 15-19.
- N. Jamala, B. Hamzah, R. Mulyadi, and I. Cahyani, The Architectural Design of Building Façade Models Related to Optimizing Daylight Distribution, Journal of Daylighting, 10 (2023) 60-71. https://doi.org/10.15627/jd.2023.5
- G. Lippsmeier, Tropical Buildings, Erlangga publisher, Indonesia, 1997.
- S. V. Szokolay, Introduction to Architectural Science: The Basis of Sustainable Design, 254 (2004).
- B. Hamzah and S. s. Y. Lau, The development of visible sky area as an alternative daylight assessment method for high-rise buildings in high-density urban environments, Architectural Science Review, 59 (2014) 1-12. https://doi.org/10.1080/00038628.2014.963021
- R. P. Khidmat, H. Fukuda, B. Paramita, M. D. Koerniawan, and Kustiani, The optimization of louvers shading devices and room orientation under three different sky conditions, Journal of Daylighting, 9 (2022) 137-149. https://doi.org/10.15627/jd.2022.11
- M. Haase and S. Grynning, Optimized facade design - Energy efficiency, comfort, and daylight in the early design phase, in: Energy Procedia, 132 (2017) 484-489. https://doi.org/10.1016/j.egypro.2017.09.666
- A. Handina, N. Mukarromah, R. A. Mangkuto, and R. T. Atmodipoero, Prediction of Daylight Availability in a Large Hall with Multiple Facades Using Computer Simulation and Subjective Perception, in: Procedia Engineering, 170 (2017) 313-319. https://doi.org/10.1016/j.proeng.2017.03.037
- M. E. Aiziewood, Innovative daylighting systems: An experimental evaluation, International Journal of Lighting Research and Technology, 25 (1993) 141-152. https://doi.org/10.1177/096032719302500401
- J. Christoffersen, Daylight utilization in office buildings: Ph. D. thesis, Aalborg University SBI Forlag Publisher, 1995.
- P. J. Littlefair, Designing with Innovative Daylighting (Building Research Establishment Report), HIS BREPublisher, 1996, pp. 1-72.
- M. A. R. Joarder, Z. N. Ahmed, A. Price, and M. Mourshed, A simulation assessment of the height of light shelves to enhance daylighting quality in tropical office buildings under overcast sky conditions in Dhaka, Bangladesh, Eleventh International IBPSA Conference, Bangladesh, 2009, pp. 1706-1713.
- S. Kwon, H. Lee, and Y. Kim, A study on the performance evaluation of mobile light shelf system according to the distance between the light shelf and the window, Contemporary Engineering Sciences, 7 (2014) 1021-1028. https://doi.org/10.12988/ces.2014.49128
- S. Zakhour, The Influence of Selected Design Parameters on the Performance of Light Shelves under Overcast Conditions, Architecture Research, 5 (2015) 113-120.
- C. Reinhart and S. Selkowitz, Daylighting-Light, form, and people, Energy Buildings, 38 (2006) 715-717. https://doi.org/10.1016/j.enbuild.2006.03.005
- G. J. Ward, The Radiance lighting simulation and rendering system, International Conference on Computer Graphics and Interactive Techniques, Orlando Florida, 24 Juli 1994, pp. 459-472. https://doi.org/10.1145/192161.192286
Copyright © 2024 The Author(s). Published by solarlits.com.
 HOME
HOME


