Volume 11 Issue 2 pp. 312-333 • doi: 10.15627/jd.2024.22
Investigation of the Effect of Parametric Patterned Façade and Resulting Daylight Illuminance on Students’ Mood and Task Performance in Architecture Studio-Based Tutoring
Yasmine Mahmoud Saad Abdelhamid,∗,a Sherine M. Wahba,b Mennat-Allah ElHusseinyb
Author affiliations
a Faculty of Engineering, Cairo University, Egypt
b Department of Architecture, Faculty of Engineering, Cairo University, Egypt
*Corresponding author.
yasmeen346@eng.cu.edu.eg (Y. M. S. Abdelhamid)
sherine_wahba@yahoo.com (S. M. Wahba)
mennatallahelhusseiny@gmail.com (M.-A. ElHusseiny)
History: Received 14 June 2024 | Revised 11 August 2024 | Accepted 14 August 2024 | Published online 11 October 2024
Copyright: © 2024 The Author(s). Published by solarlits.com. This is an open access article under the CC BY license (http://creativecommons.org/licenses/by/4.0/).
Citation: Yasmine Mahmoud Saad Abdelhamid, Sherine M. Wahba, Mennat-Allah ElHusseiny, Investigation of the Effect of Parametric Patterned Façade and Resulting Daylight Illuminance on Students’ Mood and Task Performance in Architecture Studio-Based Tutoring, Journal of Daylighting 11 (2024) 312-333. https://dx.doi.org/10.15627/jd.2024.22
Figures and tables
Abstract
Parametric design is one of the thriving contemporary architectural treatments that not only has an influence on the design of building envelopes but is capable of affecting the users physically and psychologically. The efficiency of the daylight resulting from the facade is greatly affected by the envelope’s perforation shapes, sizes, and distribution. This research builds upon a prior study which investigated the effect of Parametric Patterned Façade on daylight performance, quality, and visual comfort concluding with the choice of the highest-performing pattern for daylight metrics. The chosen pattern is the “Triangles Pattern” which was put in situ where the field experiment took place. The current study analyzed the effect of illuminance, and illuminance distribution resulting from the parametric patterned facade on architecture students’ mood and task performance in the setting of an architecture studio-based tutoring. Both quantitative and qualitative research methods were adopted; quantitative through the utilization of a Spatial Ability Test to assess students’ task performance, and qualitative through a self-reporting mood assessment, and subjective daylight perception questionnaire. The analysis was conducted through three types of tests to investigate the research hypothesis; statistical analysis of hypothesis (t-test), PANAS schedule for mood assessment, and comparative analysis of the subjective questionnaire between the base case condition and the parametric patterned façade condition. The results of paired sample study indicated that the students’ performance was enhanced after the exposure to the second condition (PPF condition) over the first (BC condition). Also, for the NA assessment, both PANAS assessment and t-test analysis results showed a difference in means between the two conditions indicating that there was an enhancement of the NA. Finally, a framework is proposed for the utilization of a Parametric Patterned façade in an educational setting. The implications of this experiment inform architects of the importance of daylighting techniques to enrich the educational environment, and how to establish a research methodology for the enhancement of daylight design using both technical and psychological approaches.
Keywords
Daylight, Parametric pattern, Parametric design, Task performance
Nomenclature
| PANAS | Positive and negative affect schedule |
| PA | Positive affect |
| NA | Negative affect |
| BC | Base case |
| PPF | Parametric patterned facade |
1. Introduction
Daylighting is one of the most important physical aspects of schools which is essential for creating an effective learning environment [1]. In classrooms, daylight is capable of connecting both teachers and students to nature which directly boosts their mood and performance. It also aids the improvement of the circadian rhythm by enhancing alertness and overall health. Consideration of daylight design is significant in educational spaces because of the high level of visual activities. As a result, it is essential to introduce daylighting in a way that enhances students’ comfort, mood, and performance [2-4]. The architectural design of schools should promote learning while optimizing both physical and psychological health [5]. It is claimed by the researcher L. Gelfand [3] that natural lighting in classrooms is capable of connecting both teachers and students to nature which directly boosts their performance and mood.
The key consideration for daylight design is providing sufficient level of illuminance, uniform distribution of daylighting while eliminating glare. The available illuminance should be at a level which is sufficient for the student’s activities. It is critical for the daylight design to be aware of the different activities taking place in the classroom, as each task requires specific illuminance conditions [6].
A study by Heschong [5] examined a number of 8000 students in 450 different classroom settings and the study showed that natural light can directly affect students’ performance. The study showed a high correlation between the reported improvement in students’ test scores as the daylight provided increased. Classrooms with daylight showed a promotion of 20% in comparison to the ones without daylight [3,7].
The researcher also investigated schools in California where clear sky and adequate daylighting is provided in comparison to schools in Seattle where daylighting is limited as a result of the cloudy sky. The investigation was done by means of reading and math tests with a sample of 21,000 students and the results showed that students in California had an increase in academic performance by a percentage of 20 to 26%, while in Seattle showed about 7% to 18% development. When a comparison is done between classrooms with maximum and minimum daylighting, students’ scores in classrooms with maximum daylighting improved by 20% in math and by 26% in reading [3,7].
A study by Buhari [8] has compared the effect of electric light and daylight, it showed that the levels of light provided by electrical light are inadequate hence this lighting system is incapable of supplying enough information to the circadian system [8]. Researcher Heschong [3,7,9] also showed evidence that classrooms with higher window design quality (a large number of windows, large window size, window placement, and light to transparent glazing material) are associated with 15 to 23% faster learning levels with classrooms with lower window design quality (small windows size, dark glazing material, and single-sided classrooms).
An important study by Maesano and Maesano [10] showed quantitative evidence of the positive influence of daylight on students’ learning performance. It was conducted in 23 countries across Europe and analyzed 148 different classrooms in 54 schools. It assessed the learning performance of 2837 students in total. The study displayed that the main building envelope design element that influences students’ performance is the Window Floor Ratio (WFR). WFR value is obtained by dividing the glazed area by the floor area. WFR with a minimum of 20% has a significant impact on student’s performance [10]. It is the lighting conditions that create positive effects and influence cognitive task performance and social behaviors [11].
Another study examined the evidence linked to student performance and development, focusing on four case studies of US schools that have successfully and economically included daylighting to their structures. The findings showed that there was no considerable cost increase associated with building these schools compared to those with traditional designs. Additionally, test scores showed that students who attended these schools performed better, and their general health and well-being also improved as a result of daylighting [12].
Also, the study highlights that classrooms with south-oriented facades and internal shading are accompanied by improved students’ performance compared to classrooms with external shading or the absence of shading devices. This is evidence that the control and increase of daylight uniformity through shading devices improve interior comfort and accordingly students’ performance [9]. Additionally, a higher daylight quality (adequate illuminance levels, sufficient daylight provided, uniform distribution of illuminance, and glare protection) is associated with 20 to 26% of higher students’ performance and fast learning levels compared to educational spaces with lower daylight quality (illuminance levels below threshold, insufficient daylighting, non-uniform distribution of illuminance, contrast brightness ratio, and presence of glare) [9]. Moreover, a research conducted in Sweden was able to find a significant relationship between daylight patterns and stress hormone levels as well as students’ behavior. The researchers examined 90 students’ health, behavior, and hormonal levels in four different classrooms [12].
The integration of parametric patterned façade as a shading system plays an important part in not only providing an adequate amount of daylighting but also reducing glare and discomfort that results from direct solar radiation. It also acts as a thermal barrier [13,14]. The term parametric façade is an approach to design or architectural design where it is created by mathematical algorithms [15]. Such parameters include shapes, sizes, and relations between the spatial components of the building. A set of guidelines and algorithms drive the design process allowing a high level of control as well as flexibility in the design. One of the main aspects of a parametric façade is its ability to act according to a variety of factors such as location aspects, climate, and lighting [13,16].
Accordingly, the creation of a parametric building façade works not only aesthetically appealing but also works on the function and the sustainability of the design. These features enable architects a wide range of possibilities and innovative architectural design solutions [13,16]. One of the software that enables the creation of parametric design is Grasshopper which was utilized to create the parametric patterned façade developed in the current research [17].
The effect of lighting on human performance has been the focus of multiple studies for decades, and it has been proven that it can positively affect human performance. However, the correlation between daylight metrics -that support daylight performance, quality, and visual comfort- and human performance/task performance in the context of architecture studio-based tutoring has not yet been studied. The research hypothesis is, if daylight illuminance distribution through a parametric patterned façade that fulfills daylight performance, quality, and visual comfort is utilized in an architecture studio, then mood and task performance can be positively affected. This experiment aims to identify the range of lighting conditions that can affect mood and task performance.
To test human performance, there are three main routes; the visual system, the circadian photobiological system, and the perceptual system [18]. Due to the time and experimental setting limitations, this research will focus on two of the three routes; the visual system, and the perceptual system. For the measurement of the visual performance, there are three aspects to be considered; the amount of light (illuminance), the spectrum of light (light color), and the luminance distribution. This study will focus on two of the three aspects which are the amount of light (illuminance), and the luminance distribution. Illuminance is measured using a calibrated illuminance meter [19]. For working environments, horizontal illuminance is the most adequate criterion. The working plan illuminance is the most commonly used indicator of lighting quality as a result of the easiness of measurement and has been used and recommended in multiple studies [20]. While luminance distribution is measured through luminance uniformity which is the ratio between the minimum and average illuminance on a surface. Uniformity is an indicator that has been frequently used as a result of the ease of determination based on illuminance measurement [21,22].
For the measurement of the perceptual system, the simplest output is discomfort which affects the observer’s mood and motivation [18]. The participants will have to conduct two visual architectural tasks to assess visual performance, a self-reporting mood assessment (PANAS), and a subjective daylight perception questionnaire.
This study focuses on architecture studio-based tutoring which is the essential space for the lecture process in architecture education [23]. Task lighting is one of the most important aspects of the architecture studio as it should provide high levels of illumination for the tasks at hand such as drawing and detailing. Providing sufficient daylighting eliminates physical and psychological discomfort such as fatigue and decreased task performance [24].
This research builds upon the findings of an earlier study titled “The Effect of Parametric Patterned Façade Variations on Daylight Quality, Visual Comfort, and Daylight Performance in Architecture Studio-Based Tutoring”. Through the utilization of climate-based daylight modeling software (Climate Studio) to assess different parametric patterned facades on daylight performance, quality, and visual comfort, the research concluded that the most efficient/best performing parametric design is the Triangles parametric pattern [25]. The following Fig. 1 presents the successful pattern installed in the field experiment, and Table 1 illustrates the parameters of the successful pattern, Table 2 illustrate the findings of the previous study for daylight metrics.
The research aims to establish the correlation between the research constructs (daylight performance, quality, and visual comfort addressed in the previous publication [25]), and students’ mood and task performance in an architecture studio-based tutoring setting. Accordingly, it will provide substantial evidence on how the daylight pattern variations through parametric patterned façade and the resulting daylight illuminance can jointly affect the mood response and task performance of students in a studio-based tutoring setting broadening our knowledge of the joint impact of space and light on occupants. Henceforth, bridging the gap between the psychological effect of daylighting on users and the amount provided through design.
2. Literature review
The literature will tackle the study’s two main dependent variables which are the effect of daylight on task performance, and its effect on mood and behavior.
2.1. The effect of daylight on students’ task performance
It is the primary aim of educational facilities to achieve the highest performance of students, which is not accomplished by the curriculum and teaching techniques alone, but also by the physical environment in which the students learn. Naturally, daylighting has a great influence on the learning environments in comparison to other elements. The understanding of the relationship between daylight and academic performance allows architects to enhance the learning environment and consequently improve students’ performance [26].
In order to understand the effect of lighting conditions on students’ performance there are three main routes to discover. These routes are the visual system, the circadian photobiological system, and the perceptual system. First, the Visual System which is a component of students’ task performance that is affected directly by the alteration of the lighting conditions. It is in charge of detecting alterations in the visual environment which can occur in both the lighting brightness and color, and the variation over time and space. There is also the interaction between the seen object, the object background, and the lighting on both object and background. This interaction determines the stimuli for the visual system. Certain aspects can affect the visual performance; the amount of light, the spectrum of light, and the lighting distribution around the object [5,18,26].
It is important to know that task performance and visual performance are not always the same. Task completion is referred to as task performance. The accomplishment of the task's visual component is referred to as visual performance. Task performance is necessary to calculate cost-benefit ratios and gauge productivity, which in turn determines how effective it is to install lights [5,18].
There are three components of the visual task; Visual, Cognitive, and Motor. First, the visual component which is the process of obtaining information which is related to task performance with the use of sight sense. The second is the cognitive component which refers to the process of sensory stimuli interpreted into action. The third component is motor which is the process where the stimuli are controlled to obtain information and appropriate action. These three components work alongside to create a complex pattern between response and stimuli. For each task at hand, the three components differ in magnitude that is corresponding to the effect of lighting conditions on task performance [5,18].
The structure of the task, and in particular the weight given to the visual component in relation to the motor and cognitive components, determines how lighting affects performance on a given task. Larger visual components in tasks will make them more susceptible to changes in lighting than smaller visual components [18]. For the context of this research, an architectural task will be employed to assess the effect of lighting conditions on students’ task performance.
Two photometric quantities are relevant to the definition of uniformity of task illuminance; the first one is the minimum-to-maximum illuminance ratio across the work plane (desk), and the second is the ratio of task luminance to surrounding luminance. It is important to know that all photometric measures are interrelated. When the illuminance ratio is extremely low (low uniform lighting), then the ratio between task luminance and surrounding luminance will also change from 1:1. Nevertheless, the ratio between task luminance and surrounding luminance relies on the desk and task reflectance together with the illuminance [27].
The second route is the circadian photobiological which is affected by the lighting conditions [18]. The circadian system is in charge of regulating a wide range of physiological and behavioral processes, including digestion, hormone release, core body temperature regulation, and alertness/drowsiness within the 24 hours of the day [28]. By stimulating the retina, affecting the hypothalamus gland, and regulating melatonin output, daylight regulates the body's circadian cycle. The hormone known as melatonin, which is secreted in the dark, has lower amounts under light. According to one study, students’ blood melatonin levels are much higher in educational settings with inadequate daylight than in schools with adequate lighting. This element makes students drowsy and impairs their performance [12].
Additionally, the primary synchronizer of the circadian system's master clock with an individual's local position on Earth is the light-dark patterns on the retina. The master clock has a somewhat longer than 24-hour period of free run if left in the dark. The multitude of physiological and behavioral systems that support survival and well-being, thus become asynchronous with one another and with the light-dark cycle of the surroundings [28].
The suprachiasmatic nucleus (SCN) is the organ in humans that regulates these cycles. The retina and SCN are directly connected. There is no attempt to maintain the original retinal position of signals when they are transported from the retina to the SCN. Instead, the retinal segments that feed the SCN function similarly to a basic photocell. Accordingly, the light spectrum and illumination that reaches the retina are the aspects of lighting that affect the state of the SCN. These factors also depend on the light spectrum of the light source that is being used, the light distribution, the spectral reflectance of the surfaces in the space, the spectral transmittance of the optic media, and the observer's point of view. The circadian system's interaction with light can influence human performance by altering the "platform" that the body operates on. This implies that light has an impact on human performance in both cognitive and visual domains [18,29,30].
The third route is the perceptual system which starts taking over when the visual system processes the retinal image [18]. The process of perception is an active one that involves the processing of meaning through the selection and interpretation of objects, activities, or events [31]. Both the quantity and quality of daylight affects a person’s perception [32]. The perceptual system's most basic output is a feeling of visual discomfort, which can alter an observer's motivation and attitude, especially if the task is laborious. A typical reaction to visual discomfort is photophobia, which is simply a dislike of light. Interior spaces rarely provoke such a reaction. When it does happen, it's typically linked to either an intense lighting condition or a medical condition that the observer is experiencing, like a migraine attack. Uncomfortable lighting conditions occur when a high level of visual performance is required and is difficult to achieve which will lead to distraction from the task at hand. Discomfort could also arise when glare exists [18].
There is more depth to the perceptual system than mere visual discomfort. The lighting conditions is capable of sending a “message” about the architect’s design decisions. The message is interpreted by the observer according to context in which it occurs and the observer’s background. In some cases, the “message” can alter the user’s visual discomfort. The intended “message” can also affect the observer’s mood and behavior [18].
2.2. The effect of daylight on students’ mood and behavior
Daylight exposure has been proven to have a positive impact on users’ mood and behavior [33]. One of the main goals of lighting design is the creation of space conditions that satisfy users and make them comfortable [27]. Also, daylighting is capable of connecting both students and teachers to nature which consequently affects students’ mood and behavior [3]. The effect of daylight exposure on mood has been found in a number of research studies. It was found that exposure to daylight of 3000 lux for 30 minutes can positively improve mood in comparison to electric light that is lower than 100 lux at desk level. Sunlight that falls on the skin promotes the synthesis of vitamin D, which is linked to the production of serotonin hormone. One of the functions that are accompanied by Serotonin is it is a neurotransmitter related to mood which means that it can enhance mood levels [34].
In addition to directly influencing the availability of neurotransmitters like serotonin, which is involved in mood regulation, light can also have an impact on mood by entraining and stabilizing circadian rhythms, which can address sleep disorders and circadian desynchronization, both of which are fairly common in individuals with mental health disorders. As a result, light therapy, or light intervention, has become more and more popular in recent decades as a means of treating mood disorders and other mental conditions [35].
There is a range of mood checklists that have been undertaken in research studies in order to assess the affective response to illuminance conditions and the one consistent result reached is that higher illuminance levels are preferred over lower ones [27]. Preliminary studies studying lighting and human behavior focused on users’ preferences in lighting conditions. The findings suggested that light affects mood which influences users’ problem-solving process. In other words, when the users are feeling upbeat and in a good mood, they are capable of performing better and vice versa [11,24].
Environmental psychologists who study lighting define mood as the short-term meaning of mood. This means that it is not the obvious reaction that is aroused due to the direct stimulus, it is the internal experience that takes place as a result of the stimulus; in this case, light. It traces the senses and accordingly, a behavioral response arises. Boubekri and colleagues investigated the mean by which designers and architects can evaluate the impact of daylight on office workers and how to measure its impact on their mood and affective response. The issue of daylight penetration was addressed in terms of the ratio between the size of daylight patches in a room to the total floor area. This was the independent variable to evaluate the influence of daylight on the users’ affective response. The findings of the study suggested that a moderate amount of daylight penetration between 25 and 40% is ideal for the creation of feelings of excitement. Daylight penetration that exceeds 40% had a negative impact on occupants [11].
The measurement of mood is usually conducted through self-reporting tests. Environmental stimuli are not always strong that users can clearly recognize the complex interactions between them and their environment. Self-reporting mood assessment can indicate the level of influence that the user experience. Human beings are not always sensitive to their visual environment except when it is bad. The ones that are least satisfied with an aspect of the interior they’re in considering this important aspect and vice versa [36].
Henceforth, effective mood measurement is capable of catching the subtle change that arises in relation to their surroundings. In order to measure mood Positive and Negative Affect Schedules (PANAS) can be utilized. This test contains mood scales that consist of two sets of 10 items measuring Positive Affect (PA), and Negative Affect (NA) [37,38]. PANAS measures the different characteristics of emotional fluctuations. Positive Affect (PA) indicates the degree to which the occupant feels alert, active, and enthusiastic. Higher levels of PA indicate a state of elevated energy, concentration, and satisfying engagement, while low levels indicate sadness and tiredness. On the other hand, Negative Affect (NA) indicates subjective distress and unsatisfaction engagement that considers various aversive mood states. Low levels of NA indicate occupants’ state of calmness and serenity. Henceforth, effective mood measurement is capable of catching the subtle change that arises in relation to their surroundings. This is when the occupants are incapable of specifying their degree of satisfaction [36]. In order to measure mood, Positive and Negative Affect Schedules (PANAS) can be utilized. This test contains mood scales that consist of two sets of 10 items measuring Positive Affect (PA), and Negative Affect (NA) [37]. PANAS measures the different characteristics of emotional fluctuations. Positive Affect (PA) indicates the degree to which the occupant feels alert, active, and enthusiastic. Higher levels of PA indicate a state of elevated energy, concentration, and satisfying engagement, while low levels indicate sadness and tiredness. On the other hand, Negative Affect (NA) indicates subjective distress and unsatisfaction engagement that considers various aversive mood states. Low levels of NA indicate occupants’ state of calmness and serenity. The measurements ought to be taken twice before and after cognitive tasks. In order to measure mood change, the measurements should subtract the second mood score from the first one [36].
The following Fig. 2 illustrates the research workflow linking the first paper which addressed the effect of parametric patterned façade on the three research constructs (daylight quality, visual comfort, and daylight performance), and the current one which addresses the impact of the successful parametric patterned façade on the research variables (task performance, and mood and behavior).
3. Research methodology
The experiment is a field experiment to determine if a parametric patterned façade that offers the best daylight metric values for Daylight Performance, Daylight Quality, and Visual Comfort can affect students’ mood and task performance. It will allow us to identify the magnitude of human responses to the varying facades and the resulting spatial illuminance distribution as well as the relationship between façade characteristics and human response. The study will adopt quantitative and qualitative research methods; Quantitative will measure the students’ performance through an architectural task, qualitative through self-reporting mood assessment, and subjective daylight perception assessment. The methodology of the Daylight Field Experiment is divided into five phases; Research Procedure, Analysis, Results, Optimization, and Framework.
The first phase “Research Procedure” consists of three steps. In the first step, students are asked to perform a spatial ability task to measure performance (refer to Section 5.2.1 Performance Task). In the second step, the students are asked to complete a self-reporting mood assessment (refer to Section 5.2.2 PANAS Mood Assessment). In the third step, the students are asked to complete a questionnaire to collect their subjective perception of daylight (refer to Section 5.2.3 Subjective Daylight Perception Assessment). These three steps are repeated for the two experimental designs; Within-Subjects and Between-Subjects.
The second phase of the research methodology is “Analysis” which consists of three steps. In the first step, an analysis of the performance Task was conducted through the utilization of the t-test to assess the research hypothesis statistically. In the second step, an analysis of mood response was conducted using PANAS assessment and t-test to assess the research hypothesis statistically. In the third step, a comparative analysis of the subjective assessment was conducted (refer to Section 4.5 Data Analysis).
The third phase is “Results” where data analyzed in the previous phase is interpreted for task performance, mood assessment, and subjective daylight perception questionnaire. The fourth phase is “Optimization” where the parameters and characteristics of the parametric patterned façade are optimized based on the comparison between the simulation data and field measurements. The façade parameters (perforation size and perforation percentage) are modified using the Grasshopper plugin for Rhino software, and then the model is run again on Climate Studio (climate-based daylight modeling software) to reach the desired illuminance and illuminance distribution (refer to previous paper [25]). The final phase is where a “Framework” for the design of a parametric patterned façade that fulfills the three research constructs (daylight performance, quality, and visual comfort) and is capable of enhancing students’ mood and task performance in the setting of an architectural studio-based tutoring is proposed (refer to previous paper [25]). The following Fig. 3 summarizes the research methodology.
4. Experimental procedure
This section will discuss the whole experimental procedure including the choice of experimental design, participants’ selection, the experimental setting, the task, and finally the procedure that will be carried out.
4.1. Experimental design
This experiment is a single-factor two conditions within-subjects and between-subjects experimental design where we will be studying the effect of daylight illuminance and luminance distribution (Independent Variable) on students’ mood and task performance (Dependent Variable). Within-subjects experimental design means that one group of subjects/Participants perform the tasks for the two presets (Base Case Condition, and Parametric Patterned Façade Condition). Between-subjects experimental design means that all subjects/participants undergo One Preset only, One group with the Base Case Condition, and a second group with the Parametric Patterned Façade Condition. This methodology avoids having a carryover effect where the subjects are influenced by their experience in earlier tests. It also eliminates subjective variation linked to individual differences and the likelihood of beta errors. Accordingly, this experimental design boosts the statistical power. The participants will be randomly assigned to two groups; Group 1 Condition will be the original setting, while Group 2 Condition will be the parametric patterned façade setting.
4.2. Participants
To not disrupt the students’ sessions, this experiment was conducted with volunteered students and teaching assistants. The number of participants was calculated using the sample size calculator where the confidence level is 90-95%, the margin of error is 5%, the Population Proportions 50%, and the Population Size is 120. The result was 80 to 90 participants. The total number of participants in the experiment is 85 students (Group One 45 Students, and Group Two 40 Students). The characteristics of the participants will be as follows;
- Minimum age of 18 years old
- Normal or corrected vision, no color blindness
- No general health problems
- Experienced with basic architectural skills
4.3. Experimental setting
The experiment was performed in a controlled room on the sixth floor of the architecture building in the Faculty of Engineering at Cairo University. The room has the same opening design and has the same south orientation as the Architecture Studio. The following Fig. 4 illustrates the TA’s Office plan and sections, Fig. 5 illustrates the Base Case condition, and Fig. 6 illustrates the Parametric Patterned façade condition of the TA’s Office.
4.4. Performance evaluation
This research will adopt two assessment methods, objective assessment and subjective assessment. The objective assessment will be conducted through the two visual tasks to assess the effect of the Parametric Patterned Façade and the resulting illuminance and luminance distribution on students’ task performance. The subjective assessment will be conducted through the PANAS schedule and the subjective daylight perception questionnaire. The third performance evaluation will be through a post-occupancy questionnaire.
4.5. Data analysis
The data analysis consists of three methodologies; the first is a t-test statistical analysis used to determine if there is a significant difference between the means of two samples. A t-test is a tool that is used in hypothesis testing to assess the means of two samples. It can be used to determine if two groups/samples are different from one another (An Independent Two-Sample t-test), or whether paired measurements show a significant difference (a Paired or Dependent Sample t-test). A p-value calculates the likelihood of getting the observed outcomes under the assumption that the null hypothesis is correct. The observed difference has a higher statistical significance when the p-value is smaller. Statistical significance is commonly defined as a p-value of 0.05 or less [39,40].
The first t-test will be a Paired Sample to cover the first hypothesis; the null hypothesis (Ho) states that there is no difference between the two means of the within-subjects group (Group One). While the alternative hypothesis (H1) states that there is a difference between the two means of the within-subjects group. The second T-Test will be conducted twice for the Positive Affect (PA), and Negative Affect (NA). The null hypothesis (Ho) states that there is no difference between the two means of the within-subjects group for both the PA and NA. The alternative hypothesis (H1) states that there is a difference between the two means of the within-subjects group; PA and NA.
The third T-Test will be a Two-Sample Assuming Equal Variances to cover the third hypothesis; the null hypothesis (Ho) states that there is no difference between the two means of the between-subject groups (Group One and Group Two). While the alternative hypothesis (H1) states that there is a difference between the two means of the between-subject groups. The fourth T-Test will be conducted twice for the PA, and NA. The null hypothesis (Ho) states that there is no difference between the two means of the between-subjects Group One and Two for both the PA and NA. The alternative hypothesis (H1) states that there is a difference between the two means of the between-subjects groups; PA and NA.
The second methodology will be the analysis of the PANAS Positive and Negative Affect Schedule, presenting the number of students having PA greater than NA, and the change that occurs between the groups (within-subjects, and between-subjects). Also, to test the reliability of the PANAS results, Cronbach’s Alpha will be measured for PANAS-P and PANAS-N separately. Cronbach’s alpha measures the internal consistency of a scale of questions, therefore, the extent of reliability of a group of questions provides an estimate of how good or poor the measurement accuracy is. The scale of Cronbach’s alpha values is; >0.90: Excellent, >0.80: Good, >0.70 is Acceptable, >0.60: Questionable, >0.50: Poor, and <0.50: Unacceptable [38].
The third analysis methodology is a comparative analysis of the subjective daylight perception questionnaire. First, we will compare the differences between Group One’s two conditions (Within-Subjects; Base Case, and Parametric Patterned Façade Condition). Second, we will compare Group One to Group Two (Between-Subjects; Base Case, and Parametric Patterned Façade Condition). The output will be in the form of a Data Visualization.
5. Research procedure
The research procedure is made up of four main steps that will be repeated three times according to the aforementioned experimental design (refer to Fig. 7).
5.1. Step One: assigning groups
As mentioned above, the participants will be divided into 2 groups; Group 1 will first undertake the base case condition, and then the parametric patterned façade condition (Within-Subjects). The period between the first and second conditions is one month to eliminate the carryover effect. Group 2 will only undertake the parametric patterned façade condition and compare it to Group 1 (Between-Groups).
5.2. Step two: instructions
The first part of the experimental procedure starts with instructing the students how to carry out the performance task, and how to fill out the PANAS schedule, and the daylight subjective assessment survey. Both Task and PANAS are presented on Paper, while the Questionnaire is presented to the students on a screen. The rationale behind having part of the tasks on paper and part on screen is to examine the effect of daylighting on the different experimental settings. Also, in both conditions, illuminance and answer time will be measured after the participants take the tasks.
5.2.1. Performance task
A research done by Andri Gerber Zurich and Michal Berkowitz et.al [41,42] tested architecture students’ spatial ability through a set of questions. The rationale behind the test is to engage the architecture students in manipulating spatial arrangements in a multi-step, iterative process, alternating between perspectives, scales, or forms of representation, and taking into account both functional and aesthetic considerations. The task is comprised of two types of questions; the first is an Urban Layout Test (ULT) where the students were presented with an array of objects in a 2D form with view directions and were required to select the view from 4 different choices. The second test is an Indoor Perspective Test (IPT) where they are given the external shape 3D objects that have four letters and are asked to imagine themselves standing inside the object at one of those points and to look toward one of the other points. The ULT is comprised of 4 questions with 8 grades, and the IPT is 4 questions with 4 grades, making the total number of grades 12 (Fig. 8).
5.2.2. PANAS mood assessment
PANAS is a 20-item self-reporting measure called the Positive and Negative Affect Schedule. It was created by Watson et al. in 1988 and is still utilized to this date. It is used to measure positive affect (PA) and negative affect (NA). While NA represents a dimension of general unhappiness summarizing a range of negative sensations like distress, guilt, or worry, PA is linked to pleasurable interactions with the environment. The sum of the ten positive items and the ten negative ones are added up separately to determine the final score. The range of scores for both groups of items is 10 to 50. A higher score for the overall positive score denotes a more positive influence. A lower score for the overall negative score denotes less of an adverse effect.
5.2.3. Subjective daylight perception assessment
Comprehending the complexity of daylight perception is vital, as an individual's level of satisfaction with daylight conditions can significantly influence their mood, behavior, and performance. Henceforth, the questionnaire is designed to cover the various aspects of daylight perception. The questionnaire consists of seven parts. The first part of the questionnaire is Demographic, and Health Data Gathering presented in the following table. The second part of the survey covers students’ Environmental Impressions, the third part of the questionnaire covers the available shading systems and how they control daylighting, the fourth part covers the second research construct which is the Daylight Performance, the fifth part of the questionnaire covers the third research construct which is the Visual Comfort presented in the following table, and finally, the sixth part of the questionnaire is a post-test that will be conducted to collect subjective ratings of the varying lighting and environmental conditions. Table 3 illustrates the subjective daylight perception questionnaire.
5.3. Field measurements
The experiment was conducted on days having the same sky conditions and temperature to ensure the reliability of the results. Illuminance was measured for every participant and the desk level (90cm height from the ground) using a digital lux meter. The lux meter specifications are as follows; Total Range: 0-200000 Lux, divided into four gears X1: 0-199.9 Lux X10: 200-1999.9 Lux X100: 2000-1999.9 Lux X1000: 20000-200000 Lux.
The illuminance for the Base Case condition ranged from 2130 to 5210 Lux with an average of 2940 Lux which is the same as the simulation results. As for the Parametric Patterned Façade condition the illuminance level ranged from 338 Lux to 737 Lux with an average of 450 fulfilling the intended illuminance level for Architecture Studio-Based Tutoring (300-750 Lux). As for the performance Task timing, the time ranged from 10 to 15 minutes with an average of 12.5 minutes.
6. Analysis
The results section is divided into three sections. PANAS assessment is the first section, the second section showcases the t-test results for the paired sample (within-subjects), the two independent samples (between-subjects), and the t-test for the assessment of PANAS-PA, and PANAS-NA. The third section covers the analysis of the subjective daylight perception questionnaire in the form of a comparative analysis.
6.1. PANAS analysis
The PANAS assessment for the paired sample showed that in the base case condition 27 students had PA, and 5 NA. While in the parametric patterned façade condition, 29 students had PA and 3 NA. Comparing the two results we found that 15 students had improved PA and 17 decreased PA, 17 students’ NA decreased, 6 had equal values, and 9 had increased NA.
Cronbach’s Alpha for the base case PA and NA are 0.80 indicating “Good Reliability”. For the paired sample (Within-Subjects), Cronbach’s Alpha is 0.84 for PA indicating “Good Reliability”, and for the NA the value is 0.98 indicating “Excellent Reliability”.
The PANAS assessment for the between-subjects samples showed that in the base case condition 27 students had PA and 5 NA. While for the parametric patterned façade condition 37 students had PA and 3 students had NA.
Cronbach’s Alpha for the base case PA and NA are 0.80 indicating “Good Reliability”. For the Two-sample Independent (Between-Subjects), Cronbach’s Alpha is 0.89 for PA indicating “Good Reliability”, and for the NA the value is 0.85 indicating “Good Reliability”. The following Fig. 9 shows the previously discussed results; PA is established in both cases, however in the PPF condition, the margin between PA and NA is greater indicating the enhancement of positive mood.
6.2. T-Test analysis
As discussed in the previous section, the first analysis is a Paired Sample t-test. The study’s purpose is to examine the effect of a parametric patterned façade on students’ performance. A total of 32 participants were randomly assigned to the base case (BC) condition and then the parametric patterned façade (PPF) condition. The p-value (alpha) used for reference is the standard of 0.05. The results indicated that there is a significant difference in the response of the performance task between the two conditions where the mean of the first condition is M=7, SD= 2.527, and the second condition M=7.75, SD= 2.436; t(31)= -2.57, P(T<t) one-tail= 0.0074 indicating that there is an increase in the performance rate, and P(T<t) two-tail=0.0149 indicating that there is a change occurred and the null hypothesis is rejected. As for the effect size, measured by Cohen’s d, it was d = 0.25, indicating a small effect. The following Table 4 presents the t-test results, and Fig. 10 illustrates the difference in means of the Task performance paired sample t-test.
Figure 10
Fig. 10. Data visualization of the difference in means for the paired sample t-test - task performance.
A paired sample t-test was conducted to compare the difference in means between the Base Case Condition and the parametric Patterned Façade Positive Affect (PA) and showed that there was not a significant difference between the means of the 2 samples for the PA. The mean of the first condition is M= 31.485, SD= 6.787, and the second condition M= 31.843, SD= 8.219; t(31)= -0.201, P(T<t) one-tail= 0.42, and P(T<t) two-tail=0.841 indicating that there is no change occurred therefore the null hypothesis can’t be rejected. The following Table 5 presents the t-test results, and Fig. 11 illustrates the difference in means for the Positive Affect Paired Sample.
Figure 11
Fig. 11. Data visualization of the difference in means for the paired sample t-test – positive affect.
As for the NA, the results show that there is a significant difference in the response of the mood assessment between the two conditions where the mean of the first condition is M=20, SD= 7.762, and the second condition M=16.187, SD= 5.418; t(31)=2.264, P(T<t) one-tail= 0.009 indicating that there is a decrease in the Negative Affect, and P(T<t) two-tail=0.019 indicating that there is a change occurred and the null hypothesis is rejected. As for the effect size, measured by Cohen’s d, it was d = 0.569, indicating a medium effect. The following Table 6 presents the t-test results and Fig. 12 illustrates the difference in means for the Negative Affect Paired Sample.
Figure 12
Fig. 12. Data visualization of the difference in means for the paired sample t-test – negative affect.
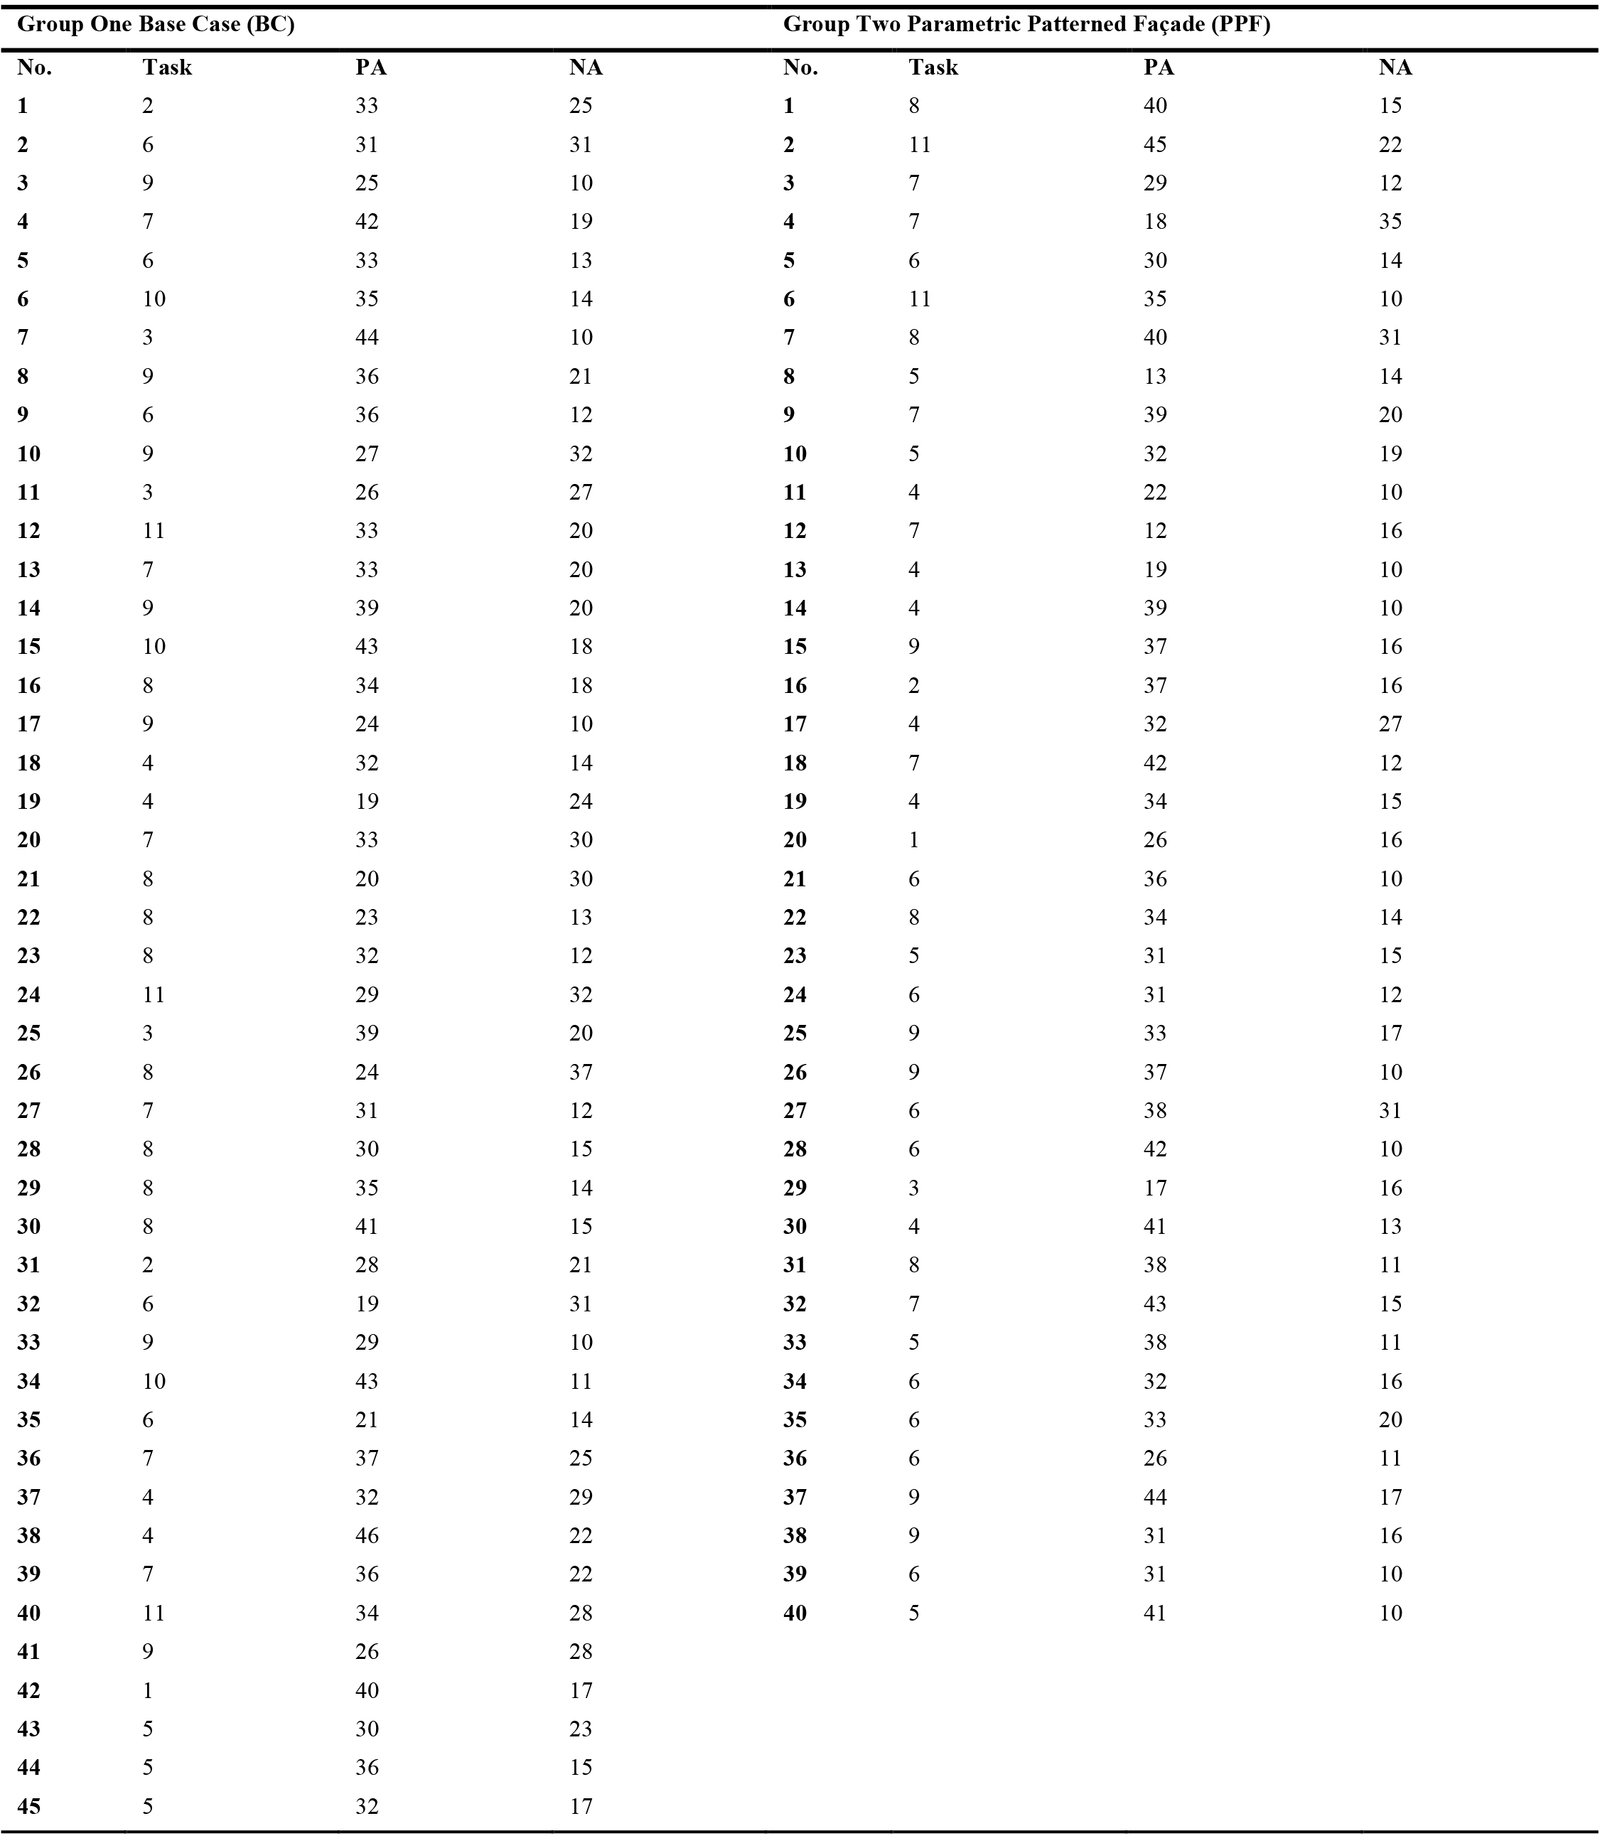
The following Table 7 illustrates the participants’ scores for the task performance and PANAS scores in both conditions; Base Case (BC), and Parametric Patterned Façade (PPF).
For the Between-Subjects analysis, a Two-Sample t-test with equal variances was conducted. The study’s purpose is to examine the effect of a parametric patterned façade on students’ task performance. A total of 85 participants are randomly assigned to one of two groups; Group One (n=45) is assigned to the base case condition and Group Two (n=40) is assigned to the parametric patterned façade condition. The results show that there was not a significant difference in means between the response of the performance task between the two samples where the mean of the first sample is M=6.82, SD= 2.596, and the second sample M=6.25, SD= 2.227; t(83)= 1.08, P(T<t) one-tail= 0.14, indicating no increase/decrease change occurred, and P(T<t) two-tail= 0.28 indicating that there is a no change occurred therefore the null hypothesis can’t be rejected. The following Table 8 presents the t-test results and Fig. 13 illustrates the difference in means for the Task performance two independent Sample.
Figure 13
Fig. 13. Data visualization of the difference in means for the independent sample t-test - task performance.
A Two-sample t-test was conducted to compare the difference in means between Group One (the Base Case Condition) and Group Two (the parametric Patterned Façade) for Positive Affect (PA). The results indicated that there was not a significant difference between the 2 Groups. The mean of the first condition is M= 32.24, SD= 6.816, and the second condition M= 32.95, SD= 8.387; t(83)= -0.427, P(T<t) one-tail= 0.33, and P(T<t) two-tail=0.67 indicating that there is no change occurred, therefore the null hypothesis can’t be rejected. The following Table 9 presents the t-test results and Fig. 14 illustrates the difference in means for the Positive Affect Two Independent Samples.
Figure 14
Fig. 14. Data visualization of the difference in means for the two independent samples t-test – positive affect.
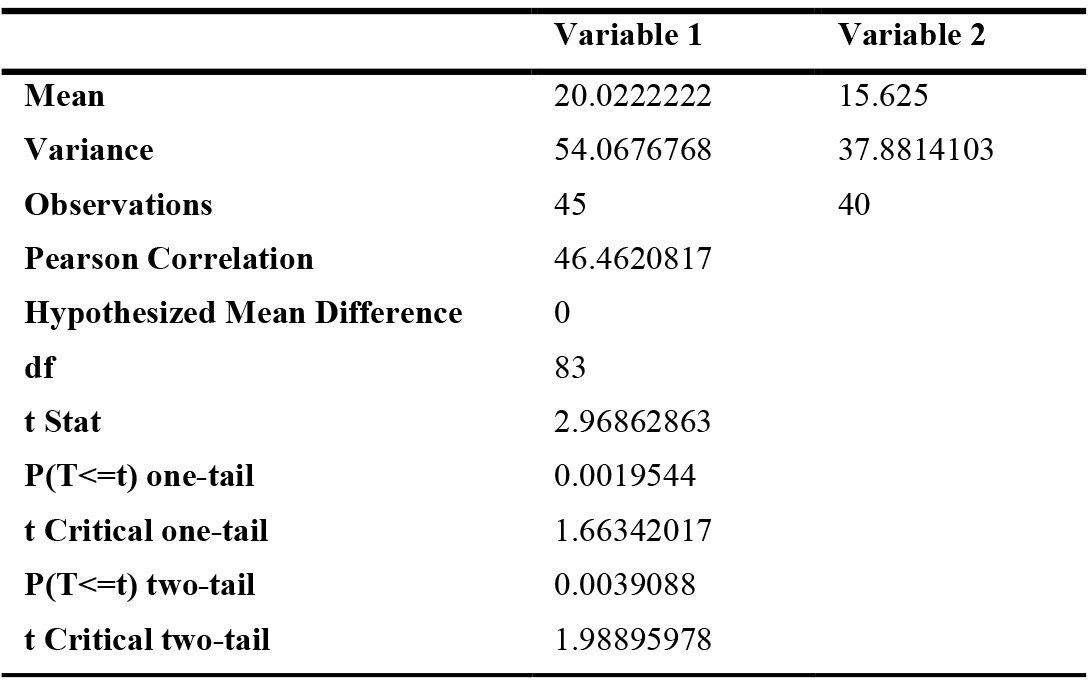
As for the Negative Affect NA, a Two-sample t-test was conducted to compare the difference in means between Group One (the Base Case Condition) and Group Two (the parametric Patterned Façade) for Negative Affect (NA). The results indicated that there was a significant difference between the 2 Groups. The mean of the first condition is M= 20.02, SD= 7.353, and the second condition M= 15.625, SD= 6.154; t(83)= 2.968, P(T<t) one-tail= 0.001 indicating there is a decrease in the NA, and P(T<t) two-tail=0.003 indicating that there is a change that occurred, therefore the null hypothesis can be rejected. The following Table 10 presents the t-test results and Fig. 15 illustrates the difference in means for the Negative Affect Two Independent Samples.
Figure 15
Fig. 15. Data visualization of the difference in means for the two independent samples t-test – negative affect.
The following Table 11 illustrates the participants’ scores for the task performance and PANAS scores in both Groups; Group One Base Case and Group Two Parametric Patterned Façade.
The first section of the subjective daylight assessment shows that the majority of participants are the 3rd and 4th-year architecture students at a percentage of 68% followed by 1st and 2nd students at a percentage of 26%, and finally, the last category is the Master’s teaching assistants at a percentage of 5%. 85% of the students didn’t have any health-related issues that affect their visual comfort, and 15% had short vision which also doesn’t affect their visual comfort (Fig. 16).
The second section of the questionnaire covers the environmental impression. The weather on most of the days when the experiment was conducted was sunny (84%), and the rest was partly cloudy. The majority of the students preferred working in daylight, followed by the combination of both artificial and daylight. Accordingly, their perception of daylight affected their judgment of comfort level. The students’ comfort level with daylight for both the base case and the PPF conditions showed that the majority ranged between Very Pleasant to Neutral and that the minority was unpleasant. However, the comparative analysis showed that the students’ comfort with daylight was enhanced with the parametric patterned façade (Fig. 17).
The third section covers the shading devices and shading control. The base case had blinds, however, the students perceived their control over daylight as poor. As for the PPF condition, the students saw that daylight control was High at a percentage of 47%, followed by Acceptable at 43%. This indicates the strength of PPF as a shading device (Fig. 18).
The fourth section of the questionnaire covers the perceived daylight performance. For the base case, the quantity of daylight in the space was mostly High, while for the PPF the majority of the students saw that it was acceptable. Accordingly, the daylight available at their desk was High for the base case and mostly acceptable for the PPF condition. As for the daylight distribution, it was mostly acceptable for both cases. Through the comparative analysis, we could conclude that the overall daylight performance was enhanced by the integration of the Parametric Patterned Façade (Fig. 19).
The fifth section covers students’ perception of visual comfort. for visual comfort, the glare level can affect both visual comfort and overall task performance. For the base case, the students have rated the glare level as mostly acceptable at a percentage of 38%, followed by high levels at a percentage of 29%. However, for the PPF condition, the glare level decreased to reach a low level at a percentage of 24%, Too Low at a percentage of 24% making the overall perception of glare at a Low level. Accordingly, their perceived visual comfort was positively affected (Fig. 20).
The final section of the questionnaire explores their students’ rating task performance and mood levels. Comparing both conditions, the majority of students saw that the lighting conditions highly affected their performance rate as well as mood levels (Fig. 21).
7. Results
The results of the first paired t-test (within-subjects) for task performance rejected the null hypothesis demonstrating that there is a significant difference in the students’ response between the two conditions which indicates that the students’ performance was enhanced. However, there is a chance of carryover effects which means that the students might have been experienced with the task and or might have experienced fatigue. Nevertheless, the period between the two tests was one month to eliminate carryover effects. As for the second independent two-sample t-test (between-subjects), the results supported the null hypothesis demonstrating that there is not a significant difference in the students’ response between Group One (Base Case condition) and Group Two (Parametric Patterned Façade condition) which indicates that the students’ performance was almost the same.
As for the mood assessment, the Paired sample, and the Independent Two-Sample, showed that the majority of the students experienced Positive Affect (PA). When comparing the assessment results for the paired sample, 15 students had improved PA, 17 decreased PA, 17 students’ NA decreased, 6 had equal values, and 9 had increased NA. Cronbach’s Alpha for the base case PA and NA are 0.80 indicating “Good Reliability”. For the paired sample (Within-Subjects), Cronbach’s Alpha is 0.84 for PA indicating “Good Reliability”, and for the NA the value is 0.98 indicating “Excellent Reliability”. As for the Two Independent Samples, when comparing the results with the base case, the results showed that 27 students had PA and 5 NA. While for the parametric patterned façade condition 37 students had PA and 3 students had NA. The Cronbach’s Alpha was 0.89 for PA indicating “Good Reliability”, and for the NA the value is 0.85 indicating “Good Reliability”. This supports the research hypothesis that mood can be enhanced using parametric patterned façade for daylight.
T-test was conducted for PA and NA for the paired and the independent two-sample. The results showed that there was no significant difference as a result of the positive affect experienced by the majority of the students for all cases. However, the NA showed a significant difference between the means of the paired sample and the two independent samples. This supports the hypothesis that using a parametric patterned facade can enhance students’ moods through the reduction of the NA.
The Environmental Impression results of the subjective daylight perception questionnaire showed that the majority of the students preferred working in daylight and that the integration of the parametric patterned façade enhanced their comfort level. For the shading device, the majority found that the parametric patterned façade had more control over daylighting than the blinds that were present in the base case. For the daylight performance, when comparing the results for quantity of daylight, daylight available at desk level, and daylight distribution between the base case and the parametric patterned façade, it was clear that the integration of the parametric patterned façade enhanced all aspects. For visual comfort, the students rated their perception of glare as low by the integration of the parametric patterned façade, accordingly, their visual comfort was improved. Lastly, for the post-test section, the results showed that the light condition affected the students’ performance and mood.
Finally, the field measurements of illuminance supported the Daylight simulation study measurement where correct reaching the mean lux of 2940 Lux which supported the research aim to minimize the daylight illuminance in fulfilling the required illuminance which ranged from 300 to 750 Lux for the Parametric Patterned Façade. Also, behavioral observations showed that students used techniques such as using their hands to shield them from direct sunlight or shifting their seating position to avoid direct glare. These responses were eliminated after putting the PPF.
8. Optimization
The optimization of design parameters and characteristics are based on the comparison between the simulation data and the field measurements. It is optional to increase the perforation size of the parametric patterned façade in case of different room use or obstructions (furniture arrangement) in the space. In the case of orientation, it is advisable to have a large window-to-wall ratio WWR in the North Façade, and a Small WWR in the South Façade. Also, the number of windows, size, and orientation affect the overall daylight performance. These basic characteristics are important design parameters to be taken into consideration.
9. Framework
This research presents a framework for the utilization of a Parametric Patterned Façade that fulfills the daylight metrics for the three research constructs (daylight performance, quality, and visual comfort) that is capable of enhancing students’ mood and task performance in an architectural studio-based tutoring setting. As mentioned, this research builds upon the outcomes of the current study and the earlier study titled “The Effect of Parametric Patterned Façade Variations on Daylight Quality, Visual Comfort, and Daylight Performance in Architecture Studio-Based Tutoring” [25]. The proposed framework consists of three stages; daylight strategy and system, research constructs, and mood and task performance.
9.1. Daylight strategy and system
The first stage tackles the daylight strategy and system which is comprised of five steps. The first step is to identify the educational building typology to be able to fulfill its daylight standards, and requirements. The second step is the defining of the daylight strategies and systems to be applied to the existing case. The choice the parametric patterned façade system was based on the extended literature and analysis of the different systems through the comparison of their components, function, and environmental conditions and the means to control them. The third step is the database creation of the building to be studied, defining the space parameters (floor level and space dimensions), windows parameters (windows orientation, dimensions, and window to wall ratio), and internal surfaces (material, color, and reflectance values). The fourth step is the base case modeling based on the database creation. The modeling is created in Rhino software. The fifth step is the definition of the parametric patterned façade parameters such as the openings geometry, perforation size, perforation area, and perforation percentage. Accordingly, the parametric façade is designed using Grasshopper plugin in Rhino software.
9.2. Research constructs
The second stage of the framework tackles the research constructs and is comprised of five steps. The first step is to define the research constructs. To assess the efficiency of daylight three constructs that need to be fulfilled, these are daylight performance, daylight quality, and visual comfort. The definition of Daylighting performance is quality measures of daylit buildings that help assess daylighting behavior inside the space and establish analytical comparative study between different measures. The daylight performance can predict the luminous quantities established on standardized meteorological files specific to the local climate for the building under evaluation. Subsequently, this approach enables a more accurate and location-specific evaluation of daylighting potential. Daylight Quality exists when the lighting system initiates good conditions for visual tasks, reinforces task performance, promotes desirable interaction and communication, creates a good mood environment, promotes health and well-being, and influences the aesthetic appreciation of the space. Visual comfort is the state of mind that articulates satisfaction with the surrounding visual environment. It is a basic human need that can affect task performance, mood, health, safety, and spatial experience [25].
The second step is the definition of the performance criteria which are assessed through quantitative and qualitative measures. The quantitative measure will be conducted through the measurements of daylighting verifying the design that fulfills the standards requirements, codes, and guidelines for daylighting. The measurement is carried out using climate-based daylight modeling (CBDM) software such as Climate Studio. This platform evaluates daylighting based on variable conditions such as building location, building orientation, solar radiation, temperature, humidity, and sky conditions. This allows us to comprehend the variations of daylighting through all periods (throughout the year, seasons, days, and hours). The measurements require Typical Meteorological Year (TMY) weather data file which comprises measured hourly data for various physical quantities that are necessary for the environmental performance analysis. As for the qualitative assessment, it is conducted through the evaluation of daylight through objective criteria such as task performance, and subjective criteria such as well-being, perception, and mood.
The third step is the identification of the daylight metrics that are used to measure the fulfillment of the research constructs. The recommended metrics are Illuminance, Useful Daylight Illuminance (UDI), Spatial Daylight Autonomy (sDA), Annual Sunlight Exposure (ASE), and Daylight Glare Probability (DGP). All metrics thresholds are presented in the previous publication [25]. The fourth step is the identification of the CBDM simulation engine. This study recommends Climate Studio. The fifth step is the simulation of the designed parametric patterned façade that was designed in the earlier stage. The simulation is run multiple times with modifications to the façade parameters till the optimized façade design is reached.
9.3. Mood and task performance
Based on the achievement of the optimized façade design, mood and task performance measurements are tackled throughout the third stage of the framework. The first step is to the identification of the experimental design. This includes the definition of the experimental setting, participants, the assessment methods, the experimental procedure, and the methods of data analysis. The second step is the identification of the performance task, mood assessment, and daylight perception assessment. All are based on the educational building typology. The third step is the measurement of task performance; Since the typology this research is studying is architecture studio-based tutoring, the performance task is the architectural spatial ability task. The fourth step is mood measurement through a self-reporting mood assessment (PANAS). The fifth step is the measurement of daylight perception through a subjective questionnaire. The sixth step is the analysis of the data collected from the previous three steps to measure the extent of the impact of the parametric patterned façade and the resulting illuminance and illuminance distribution on students’ mood and task performance reaching and optimized daylight model. Figure 22 is a flowchart diagram illustrating the stages and steps of the research framework previously discussed.
10. Discussion
Consideration of daylight design is significant in interior spaces, especially in educational spaces because of the high level of visual activities. Daylight is considered one of the most important natural forces architects can utilize to enhance daylight performance in spaces, visual comfort, and indoor visual light quality. The dynamic change and variety of daylight are a stimulus for the circadian cycle and are capable of influencing occupants’ health, mood, and performance. Although daylighting has been studied through different disciplines, the effect of daylight illuminance and distribution through parametric patterned façade on students’ mood and task performance in the setting of architecture studio-based tutoring has not yet been studied. Accordingly, this study aims to contribute to the theory and practice of daylight design in buildings.
However, the study has limitations that can be addressed in future research. One of the study’s limitations was the obstruction of the upper area of the windows in the experiment’s setting with a fixed solid panel; accordingly, daylight could not reach the back area of the room. Another limitation was the position of the PPF to the window; originally the PPF should have been placed on the exterior facade of the room, but as a result of the faculty regulations, the PPF was put in the interior. Consequently, we had to create a joint in the PPF to allow the users to open/close the windows and allow natural ventilation. To apply the joint, a percentage of the perforations was removed to have a solid area for the placement of the joints which minimized the amount of required illuminance.
Moreover, the daylight field experiment should have been implemented in the Architecture Studio, however, as a result of the feasibility and practical limitations, the study was conducted in the TA’s Office because of the control over the daylighting. Additionally, for the paired sample test, a number of the participants who participated in the base case were not able to contribute once more in the setting of the parametric patterned façade limiting the number of participants to the study. Furthermore, the results for the two independent samples did not provide adequate data to prove the effect of parametric patterned façade on students’ performance, therefore further research is required.
Finally, for the testing of human performance, one of the three routes (circadian photobiological system) that affect performance was not tested. To test the circadian system, the wake/sleep cycle should be reported which was not feasible to assess in the current study. Also, the spectrum of light was not tested in the current study. Nevertheless, future research can be conducted to cover these two points.
11. Conclusion
The study investigated the effect of a parametric pattered façade and the resulting illuminance, and illuminance distribution on students’ task performance and mood. The pattern that was used was the triangles pattern that fulfills the daylight metrics for daylight performance, quality, and visual comfort. The study took place in a controlled room (TA’s Office) at the Faculty of Engineering Cairo University, Egypt. The room has the same south orientation, window-to-wall WWR ratio, as the Architecture Studio studied in the previous publication. It also has the same common problems which are related to daylight such as excessive illuminance, non-uniformity of daylight distribution, glare issues, and lack of shading device. All of which are the result of the space parameters (orientation, number of windows, and WWR).
The study utilized three types of tests to investigate the research hypothesis. It adopted quantitative and qualitative measures. The quantitative measure was through the measurement of task performance of Architecture students using a spatial ability task that has been approved and commonly used through multiple studies. As for the qualitative methodology, a self-reporting mood assessment (PANAS), and students’ subjective perception of daylight questionnaire were adopted.
The task analysis was conducted using a t-test, a statistical analysis tool to test whether the hypothesis is null or can be rejected. The mood analysis was calculated through the Positive Affect (PA) score, the Negative Affect (NA) score, and t-test for both PA and NA. Also, Cronbach’s alpha was conducted for PANAS to test the reliability, and internal consistency of PA and NA separately. As for the analysis of the subjective Daylight Perception Questionnaire, a comparative analysis was conducted.
For the task performance analysis, the paired sample indicated that the students’ performance was enhanced after the exposure to the second condition (parametric patterned façade) over the first (base case condition). As for the two independent samples, the results remained neutral (almost same means between the two groups) indicating that further research is required to examine the relationship between the base case and parametric patterned façade.
Based on the analysis of PANAS mood assessment, the majority of the participants experienced Positive Affect (PA) in both conditions (base case condition, and parametric patterned façade condition). As for the Negative Affect (NA), both PANAS assessment and t-test analysis showed an increased difference in means between the two conditions indicating that there was an enhancement of the NA.
As for the Subjective Daylight Perception Questionnaire, all aspects were improved by the integration of the parametric patterned façade. For the environmental impression, the majority of the participants preferred working in daylight, accordingly their comfort was enhanced. The students rated the parametric patterned façade for the shading device to have more daylight control over the existing blinds. For daylight performance and visual comfort all aspects were enhanced as a result of the available daylight, distribution, and glare control. Lastly, for the post-test assessment, the students believed that their mood and task performance was affected by the lighting condition. The comparative analysis of the questionnaire indicated the positive influence of daylighting control through parametric patterned façade on students’ mood and task performance.
Based on the results of this study previously discussed, it can be concluded that the daylight illuminance and illuminance distribution through the parametric patterned façade is capable of enhancing students’ mood and task performance in in the setting of architecture studio-based tutoring. The research has practical implications; it has presented a framework for the utilization of a Parametric Patterned Façade that fulfills the daylight metrics for the three research constructs (daylight performance, quality, and visual comfort) that is capable of enhancing students’ task performance, and mood in an architectural studio-based tutoring. The framework combines the outcome of the previous study titled “The Effect of Parametric Patterned Façade Variations on Daylight Quality, Visual Comfort, and Daylight Performance in Architecture Studio-Based Tutoring” and the current one. The results and the proposed Framework developed can influence the façade design of different buildings typologies. It can be utilized to embrace the benefits of daylight and avoid problems such as excessive illuminance, and glare issues.
Acknowledgement
We would like to acknowledge the role of the Department of Architecture, Faculty of Engineering, Cairo University in providing the necessary office for the field experiment to take place, and the faculty Professors for allowing the students to participate in the experiment voluntarily.
Contributions
Yasmine M. S. Abdelhamid; conceptualization, methodology, and writing of the original draft. Sherine M. Wahba; conceptualization, methodology, review, and editing. Mennat-Allah Elhusseiny; conceptualization, methodology, review, and editing.
Declaration of competing interest
The authors declare no conflict of interest.
References
- A. A. Razon, A Study on Window Configuration to Enhance Daylight Performances on Working Space of an Architect's Office in Chittagong, International Journal of Scientific & Engineering Research, 8 (2), (2017) 1-9. https://doi.org/10.14299/ijser.2017.02.007
- S. M. M. Shemirani, G. H. Memarian, S. P. Naseri, and V. Vaziri, A Survey on Day Lighting Design Strategies in Schools, Journal of American Science, 7(5), (2011) 751-758. https://doi.org/10.5539/ass.v7n3p237
- K. R. Piparsania, P. Vaidya, and P. C. Kalita, Evaluation of Daylight Performance of Classroom Spaces in Ahmedabad, in NordDesign 2020, 2020, pp. 1-12, Denmark.
- A. Yunitsyna and A. Toska, Evaluation of the Visual Comfort and Daylight Performance of the Visual Art Classrooms, Journal of Daylighting, 10, (2023) 117-135. https://doi.org/10.15627/jd.2023.9
- N. Shishegar and M. Boubekri, Natural Light and Productivity: Analyzing the Impacts of Daylighting on Students' and Workers' Health and Alertness, Int'l Journal of Advances in Chemical Engg., & Biological Sciences, 3 (1), (2016) 1-6. https://doi.org/10.15242/IJACEBS.AE0416104
- A. S. Dahlan, P. Mahmoud, and A. Eissa, The Impact of Daylighting in Classrooms on Students' Performance, International Journal of Soft Computing and Engineering (IJSCE), 4 (6), (2015) 1-4.
- L. Heschong, Daylighting in Schools An Investigation into the Relationship Between Daylighting and Human Performance, Pacific Gas and Electric Company, 1999.
- A. A. Buhari and H. Z. Alibaba, Analysis of Daylighting Quality in Institutional Libraries, International Journal of Electrical and Electronics Research, 7 (4), (2019) 6-20.
- F. De Luca, Daylight in Schools Guidance, Final Thesis Tallinn University of Technology Department of Civil Engineering and Architecture, Estonia 2020.
- C. Maesano and I. Annesi-maesano, Impact of Lighting on School Performance in European Classrooms, in CLIMA 2016 Conference, 2016, pp. 1-14, France. https://doi.org/10.1289/isee.2016.4561
- M. Boubekri, Daylighting, Architecture and Health Building Design Strategies, First Edition, Architectural Press, 2008. https://doi.org/10.4324/9780080940717
- A. A. Ahadi and M. Masoudinejad, Improving student performance by proper utilization of daylight in educational environments ( Case study : IUST 1 School of Architecture ), Acta Technica Napocensis: Civil Engineering & Architecture, 59 (1), (2016) 1-21.
- A. Rashwan, L. El, and S. Sheta, Evaluation of the effect of integrating building envelopes with parametric patterns on daylighting performance in office spaces in hot-dry climate, Alexandria Engineering Journal, 58 (2), (2019) 551-557. https://doi.org/10.1016/j.aej.2019.05.007
- S. Y. Islami and Z. Jafari, The Significance of Aperture Proportion for the Lighting Behaviour and Transparency of Moshabak, Journal of Daylighting, 9, (2022) 242-256. https://doi.org/10.15627/jd.2022.18
- R. M. Elbatran and W. S. E. Ismaeel, Applying a parametric design approach for optimizing daylighting and visual comfort in office buildings, Ain Shams Engineering Journal, 12 (3), (2021) 3275-3284. https://doi.org/10.1016/j.asej.2021.02.014
- A. Eltaweel and Y. Su, Parametric design and daylighting: A literature review, Renewable and Sustainable Energy Reviews, 73, (2017) 1086-1103. https://doi.org/10.1016/j.rser.2017.02.011
- M. K. Fahmy and M. Elsoudany, Parametric Mashrabiya as a Shading System for Optimized Daylighting in Egypt, Engineering Research Journal, 177, (2023) 76-95. https://doi.org/10.21608/erj.2023.289551
- P. Boyce and M. Rea, Lighting and Human Performance II: Beyond Visibility Models Toward a Unified Human Factors Approach to Performance, National Electrical Manufacturers Association, VA, and U. S. Environmental Protection Agency Office of Air and Radiation, 2001.
- P. J. Aarts, V. Duijnhoven, and M. B. C. Aries, Performance of Personally Worn Dosimeters to Study Non-Image Forming Effects of Light: Assessment Methods, Building and Environment, 117, (2017) 60-72. https://doi.org/10.1016/j.buildenv.2017.03.002
- D. Bishop and J. G. Chase, A Luminance-Based Lighting Design Method: A Framework for Lighting Design and Review of Luminance Measures, Sustainability, 15, (2023) 1-16. https://doi.org/10.3390/su15054369
- T. Kruisselbrink, R. Dangol, and A. Rosemann, Photometric Measurements of Lighting Quality: An Overview, Building and Environment, 138, (2018) 42-52. https://doi.org/10.1016/j.buildenv.2018.04.028
- F. Leccese, G. Salvadori, M. Rocca, C. Buratti, and E. Belloni, A Method to Assess Lighting Quality in Educational Rooms Using Analytic Hierarchy Process, Building and Environment, 168, (2020) 1-15. https://doi.org/10.1016/j.buildenv.2019.106501
- I. Pujiyanti, A. Rahmat, and H. Riri, Architectural Studio Room Lighting Level in UNISA Yogyakarta Based on Software Dialux Evo 9 . 1, Advances in Social Science, Education and Humanities Research, 671, (2022) 201-205. https://doi.org/10.2991/assehr.k.220703.036
- F. H. Husain, Z. Husri, and F. Amani, Environmental Psychology : An Analysis on Lighting Efficiency of the Architecture Studio in UiTM Perak, in Proceedings of Postgraduate Conference on Global Green Issues (Go Green), 2015, pp. 113-118, Malaysia.
- Y. Abdelhamid, S. M. Wahba, and Menna ElHusseiny, The Effect of Parametric Patterned Façade Variations on Daylight Quality , Visual Comfort , and Daylight Performance in Architecture Studio-Based Tutoring, Journal of Daylighting, 10, (2023) 173-191. https://doi.org/10.15627/jd.2023.15
- A. Obralic and S. Jeghel, The Case Study on Significance of Daylight in Classroom Setting at Sarajevo Campus, European Scientific Journal, 17 (1), (2021) 19-45. https://doi.org/10.19044/esj.2021.v17n1p19
- J. A. Veitch, Determinations of Lighting Quality II: Research and Recommendations, in 104th Annual Convention of the American Psychological Association, 1996, pp. 1-38, Canada.
- M. Figueiro, M. Kalsher, B. Steverson, J. Heerwagen, K. Kampschroer, and M. Rea, Circadian-effective light and its impact on alertness in office workers, Lighting Research and Technology, 51, (2018) 1-13. https://doi.org/10.1177/1477153517750006
- M. S. Rea, M. Figueiro, and J. D. Bullough, Circadian photobiology : an emerging framework for lighting practice and research, Lighting Research and Technology, 34 (3), (2002) 177-190. https://doi.org/10.1191/1365782802lt057oa
- Q. Dai, W. Cai, W. Shi, L. Hao, and M. Wei, A proposed lighting-design space: circadian effect versus visual illuminance, Building and Environment, 122, (2017) 287-293. https://doi.org/10.1016/j.buildenv.2017.06.025
- H. M. Mosharraf, The Importance of Environmental Psychology in Design of Educational Spaces, Advances in Environmental Biology, 8 (22), (2014) 766-771.
- A. Bayz and H. Amin, School Design Daylighting Analysis, Sulaimani Journal for Engineering Sciences, 6 (2), (2019) 21-34. https://doi.org/10.17656/sjes.10084
- Y. Zhu, M. Yang, Y. Yao, X. Xiong, X. Li, and G. Zhou, Effects of Illuminance and Correlated Color Temperature on Daytime Cognitive Performance, Subjective Mood, and Alertness in Healthy Adults, Environment and Behavior, 51 (2), (2017) 199-230. https://doi.org/10.1177/0013916517738077
- F. Beute, Powered by Nature: the Psychological Benefits of Natural Views and Daylight, Final Thesis Doctoral of Philosophy of Industrial Engineering and Innovation Sciences Technische Universiteit, Eindhoven Netherlands, 2014.
- C. Blume, C. Garbazza, and M. Spitschan, Effects of Light on Human Circadian Rhythms, Sleep and Mood, Somnologie, 23, (2019) 147-156. https://doi.org/10.1007/s11818-019-00215-x
- N. Wang and M. Boubekri, Design recommendations based on cognitive, mood, and preference assessments in a sunlit workspace, Lighting Research and Technology, 43, (2011) 55-72. https://doi.org/10.1177/1477153510370807
- Z. Gou, S. S. Lau, and F. Qian, Comparison of mood and task performance in naturally-lit and artificially-lit environments Indoor and Built Environment, 24 (1), (2015) 27-36. https://doi.org/10.1177/1420326X13507792
- A. Díaz-garcía et al., Positive and Negative Affect Schedule ( PANAS ): psychometric properties of the online Spanish version in a clinical sample with emotional disorders, BMC Psychiatry, 20 (56), (2020) 1-14. https://doi.org/10.1186/s12888-020-2472-1
- A. Ugoni, THE t TEST An introduction, COMSIG REVIEW, 4 (2), (1995) 37-40.
- The t-Test, Statistics Knowledge Portal, 2024. [Online]. Available: https://www.jmp.com/en_ch/statistics-knowledge-portal/t-test.html. [Accessed: 12-May-2024].
- A. Gerber and M. Berkowitz, Training spatial abilities. A Workbook for students of architecture, Birkhäuser, 2020.
- M. Berkowitz, A. Gerber, C. M. Thurn, Beatrix Emo, Christoph Hoelscher, and Elsbeth Stern, Spatial Abilities for Architecture: Cross Sectional and Longitudinal Assessment With Novel and Existing Spatial Ability Tests, Frontiers in Psychology, 11, (2021) 1-16. https://doi.org/10.3389/fpsyg.2020.609363
Copyright © 2024 The Author(s). Published by solarlits.com.
 HOME
HOME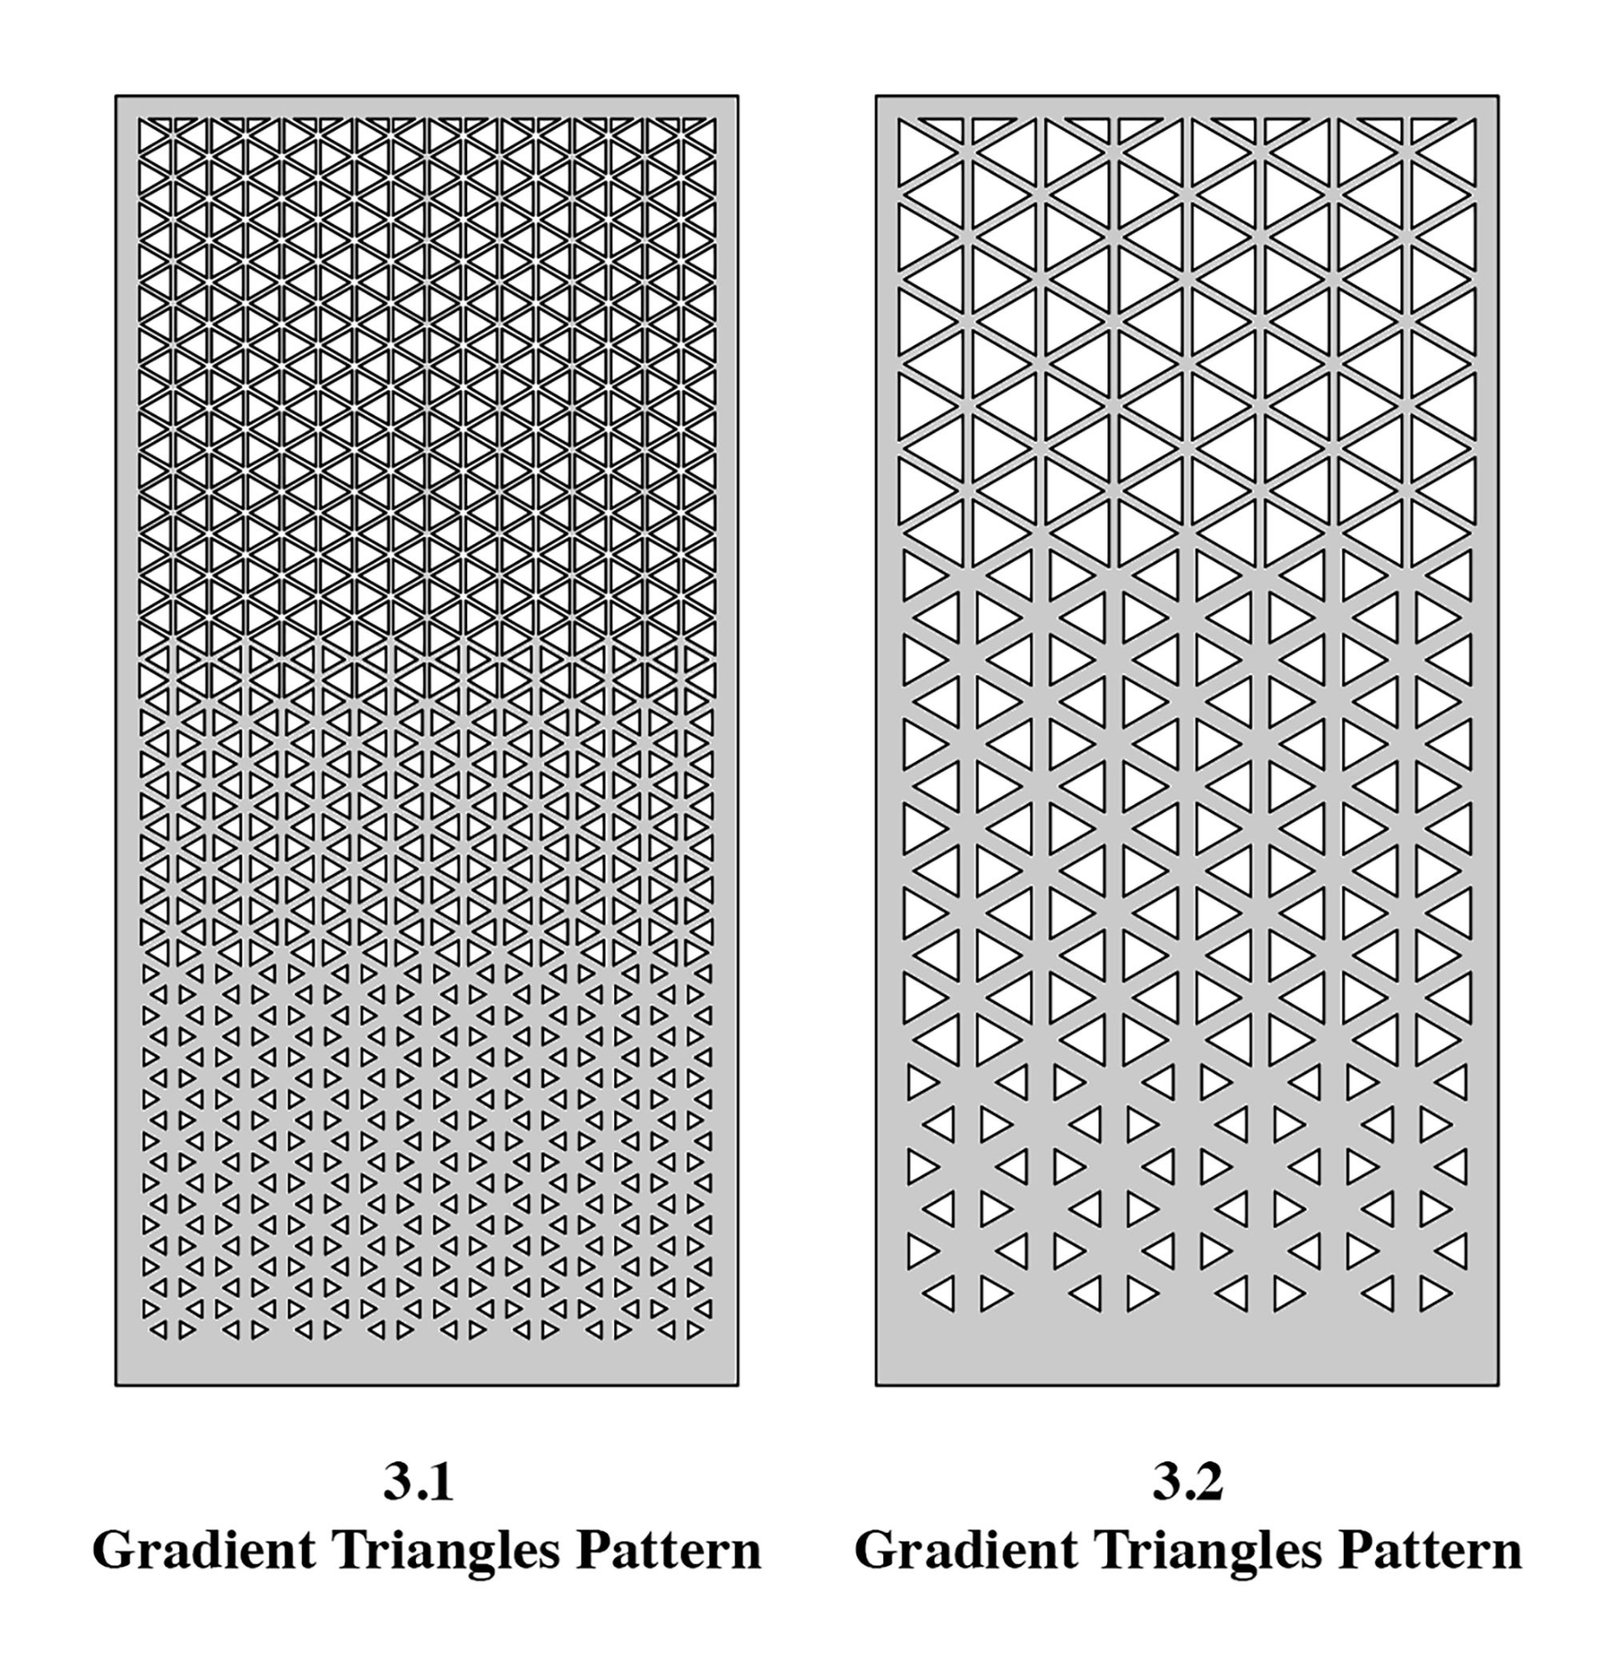 Figure 1
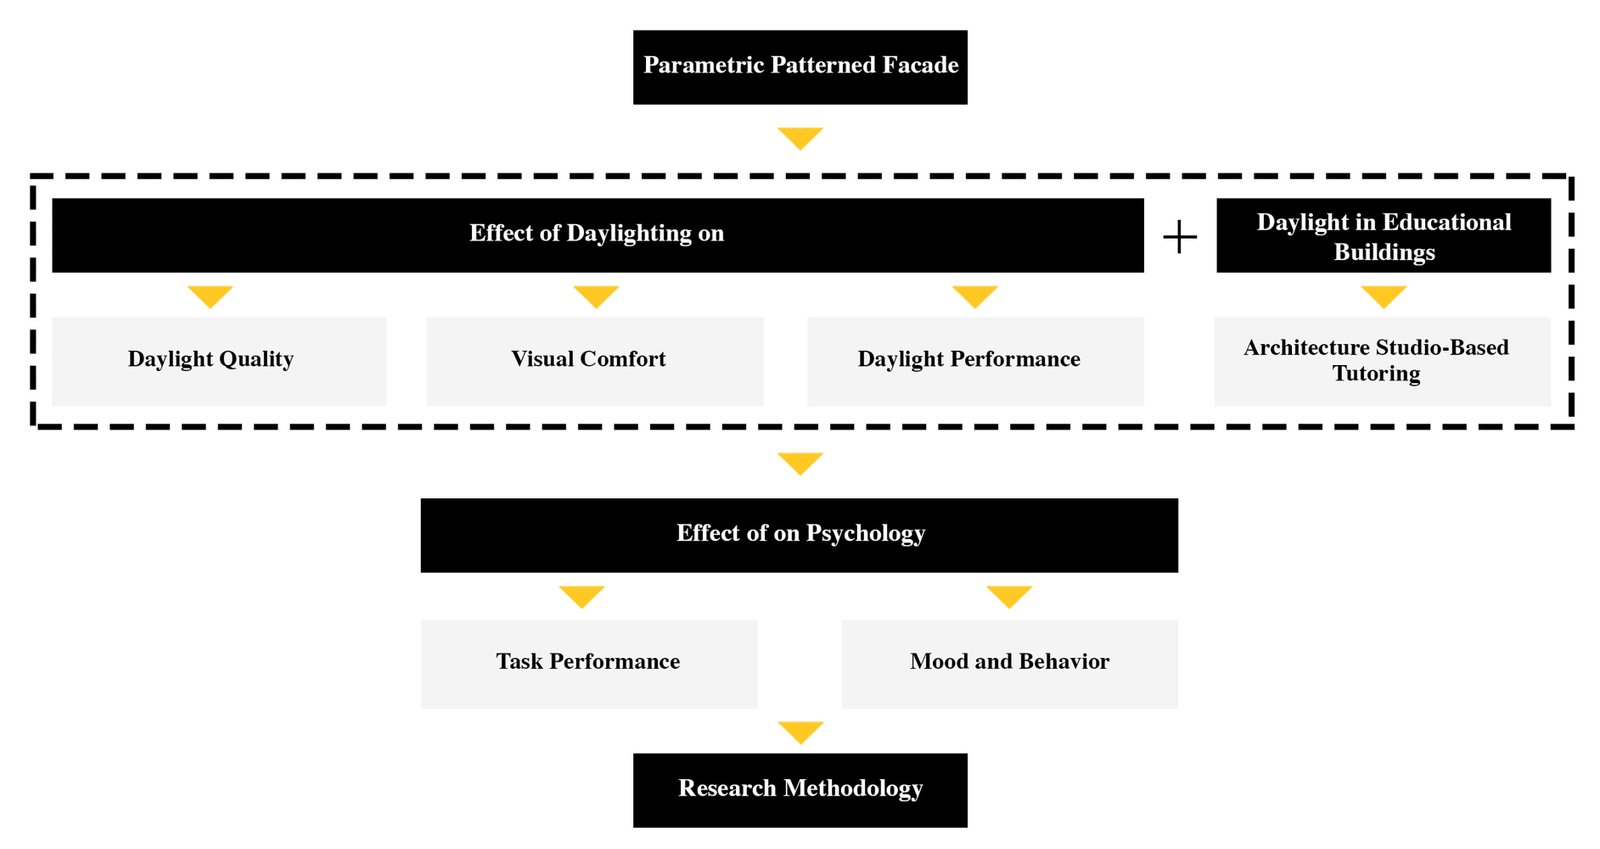 Figure 2
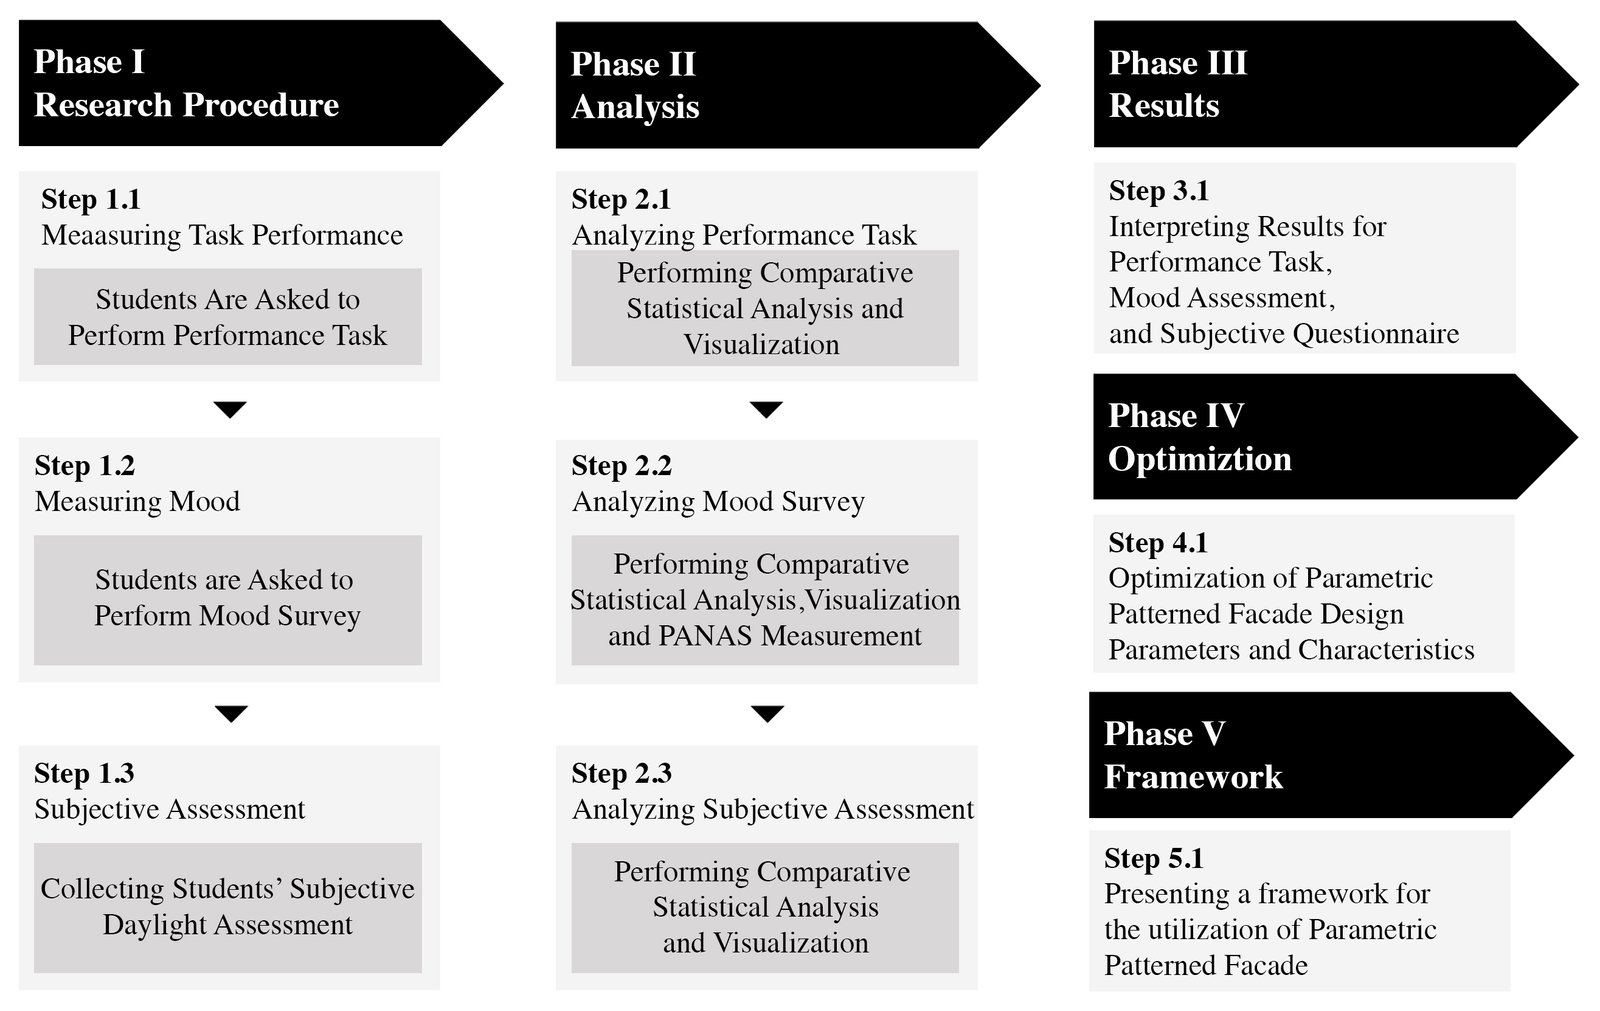 Figure 3
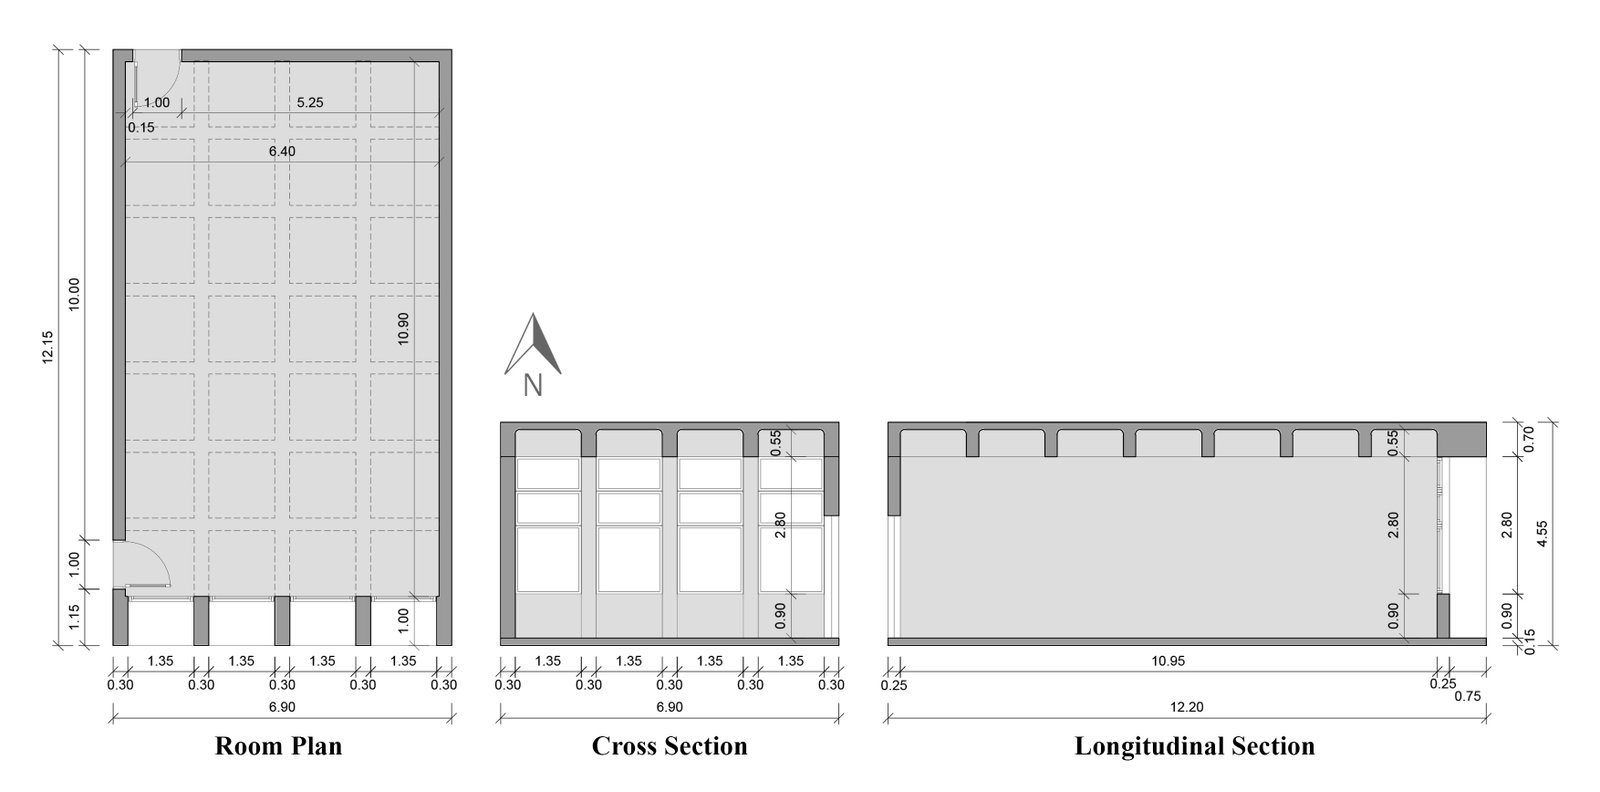 Figure 4
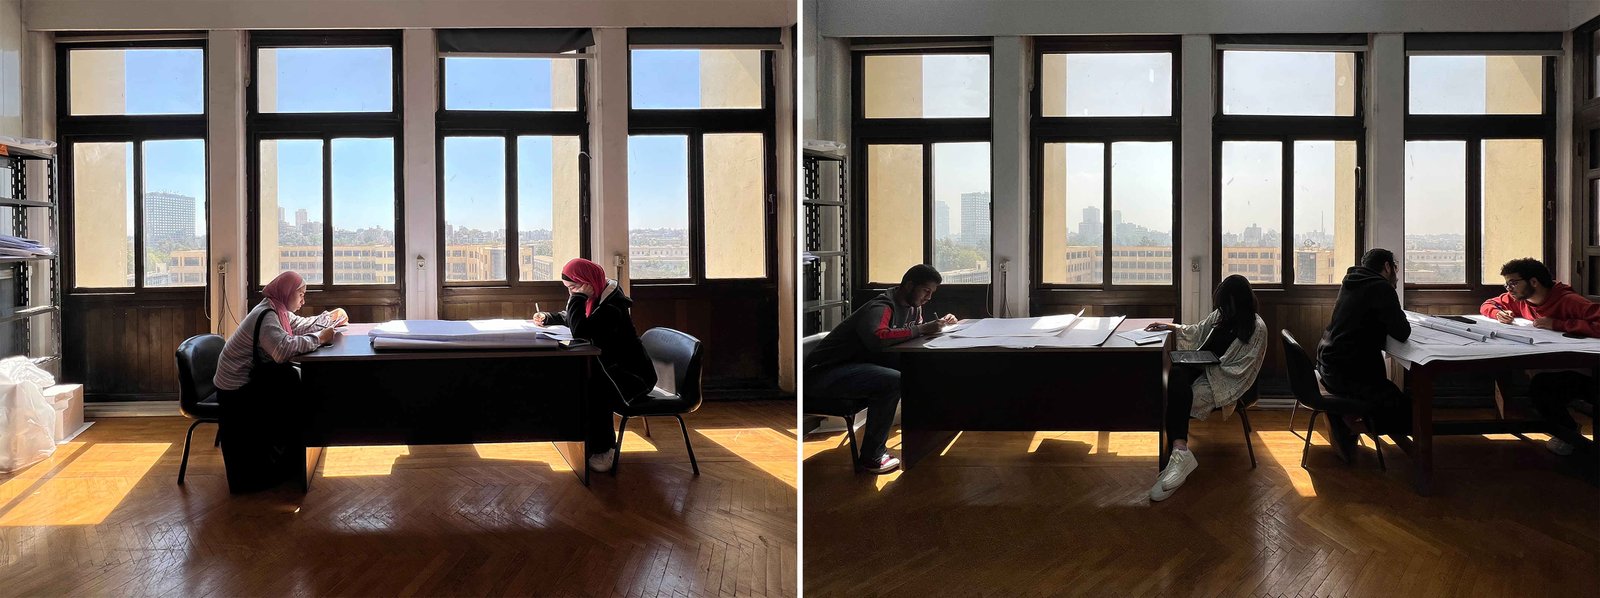 Figure 5
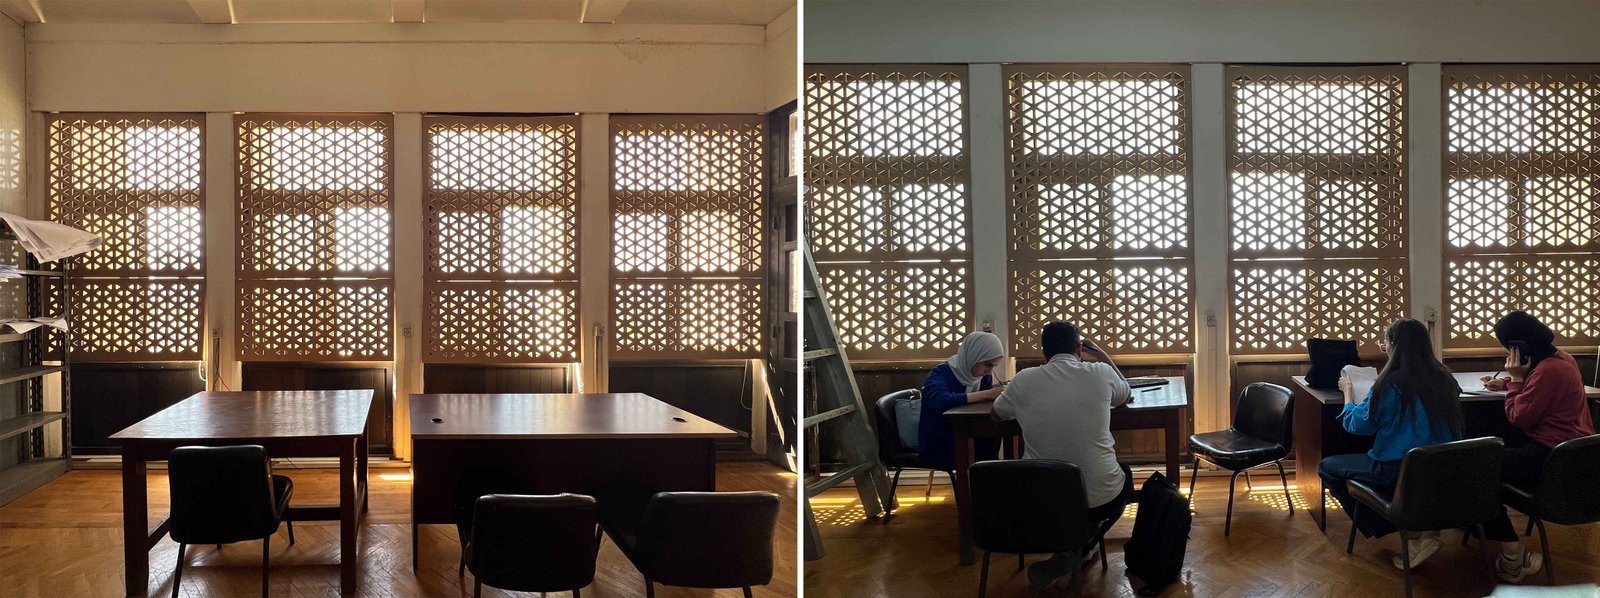 Figure 6
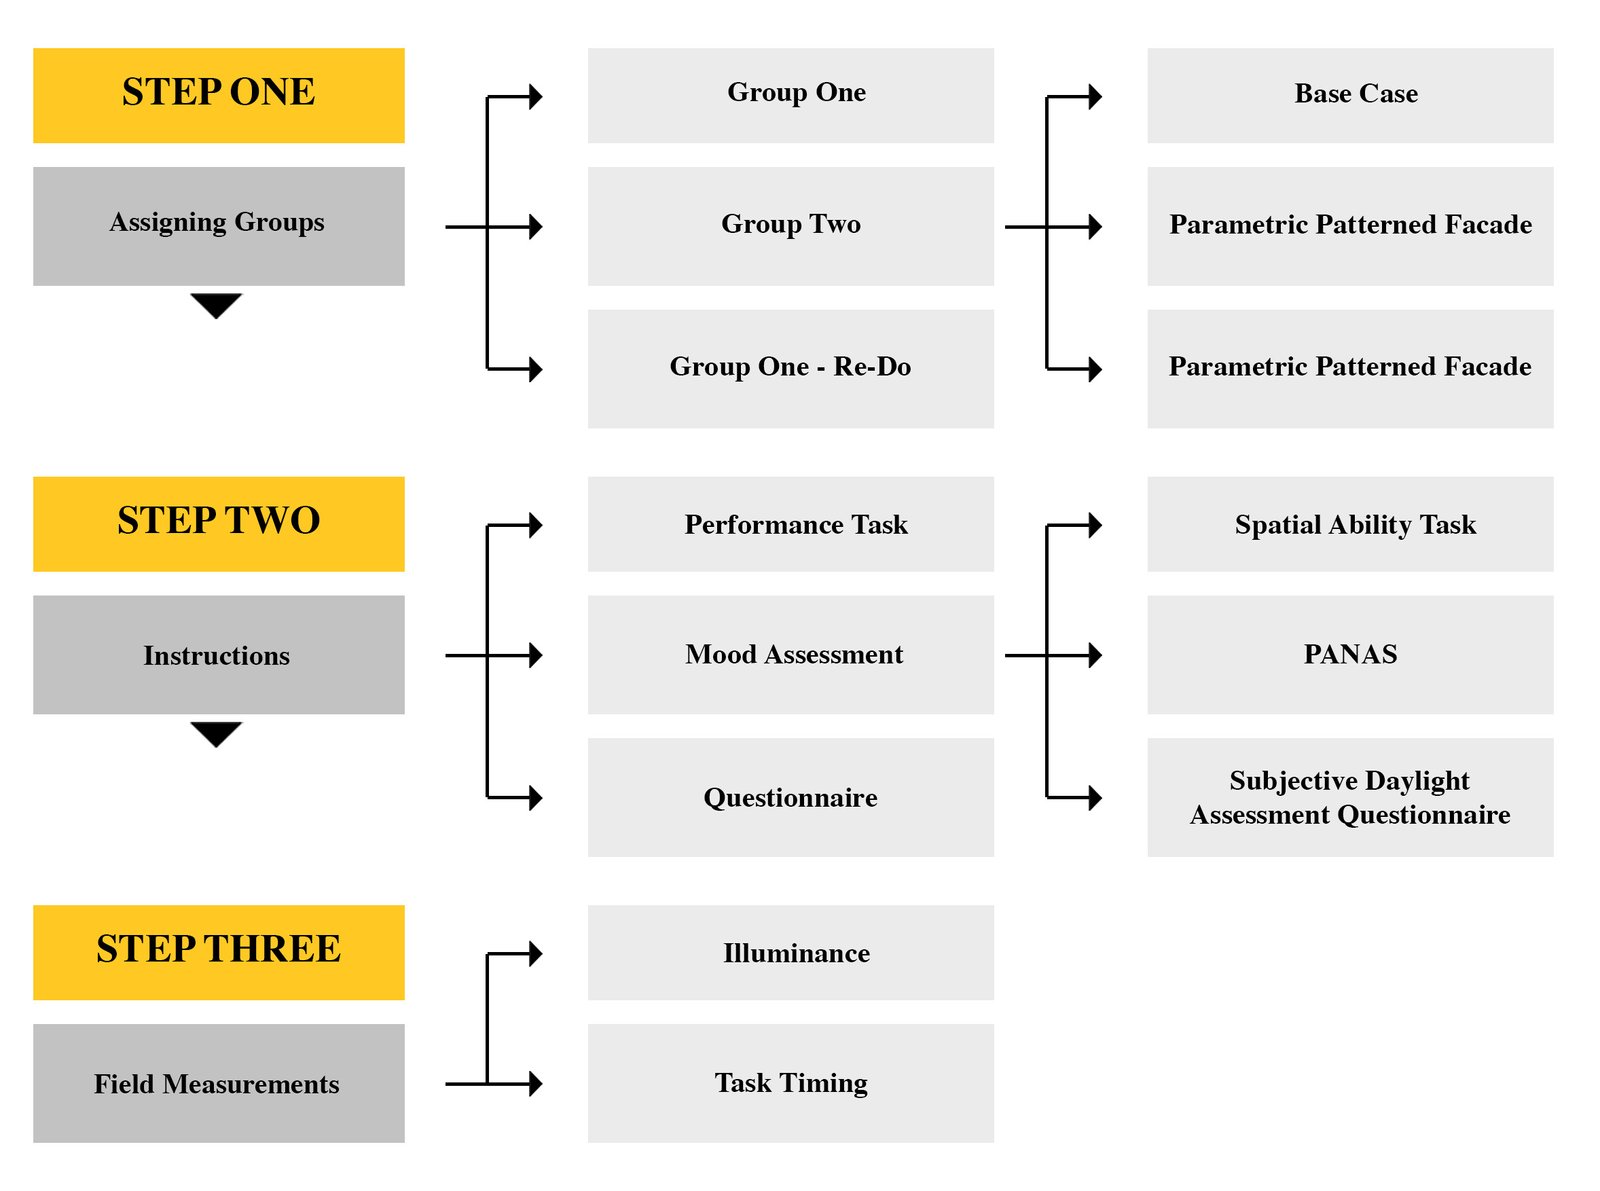 Figure 7
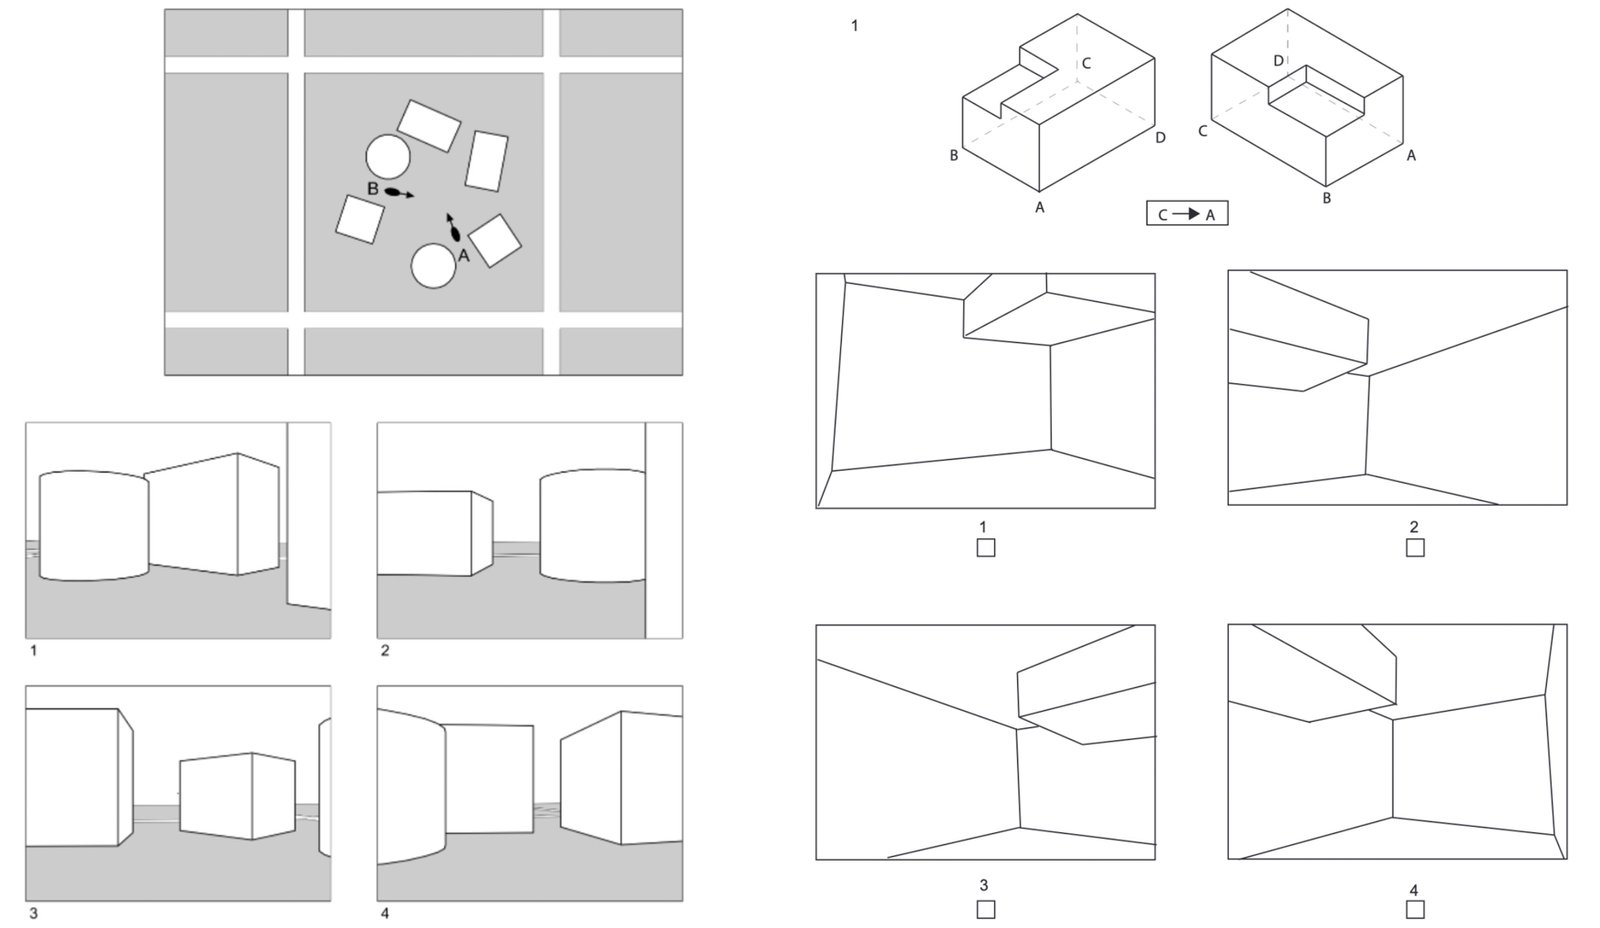 Figure 8
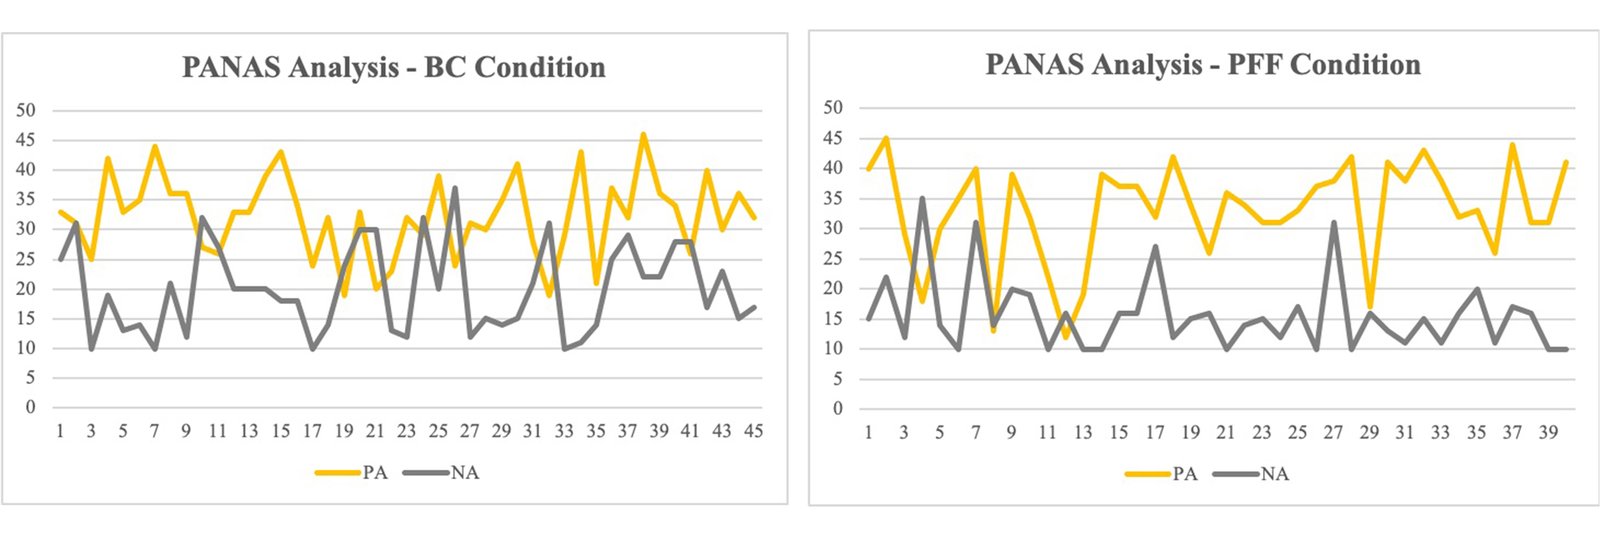 Figure 9
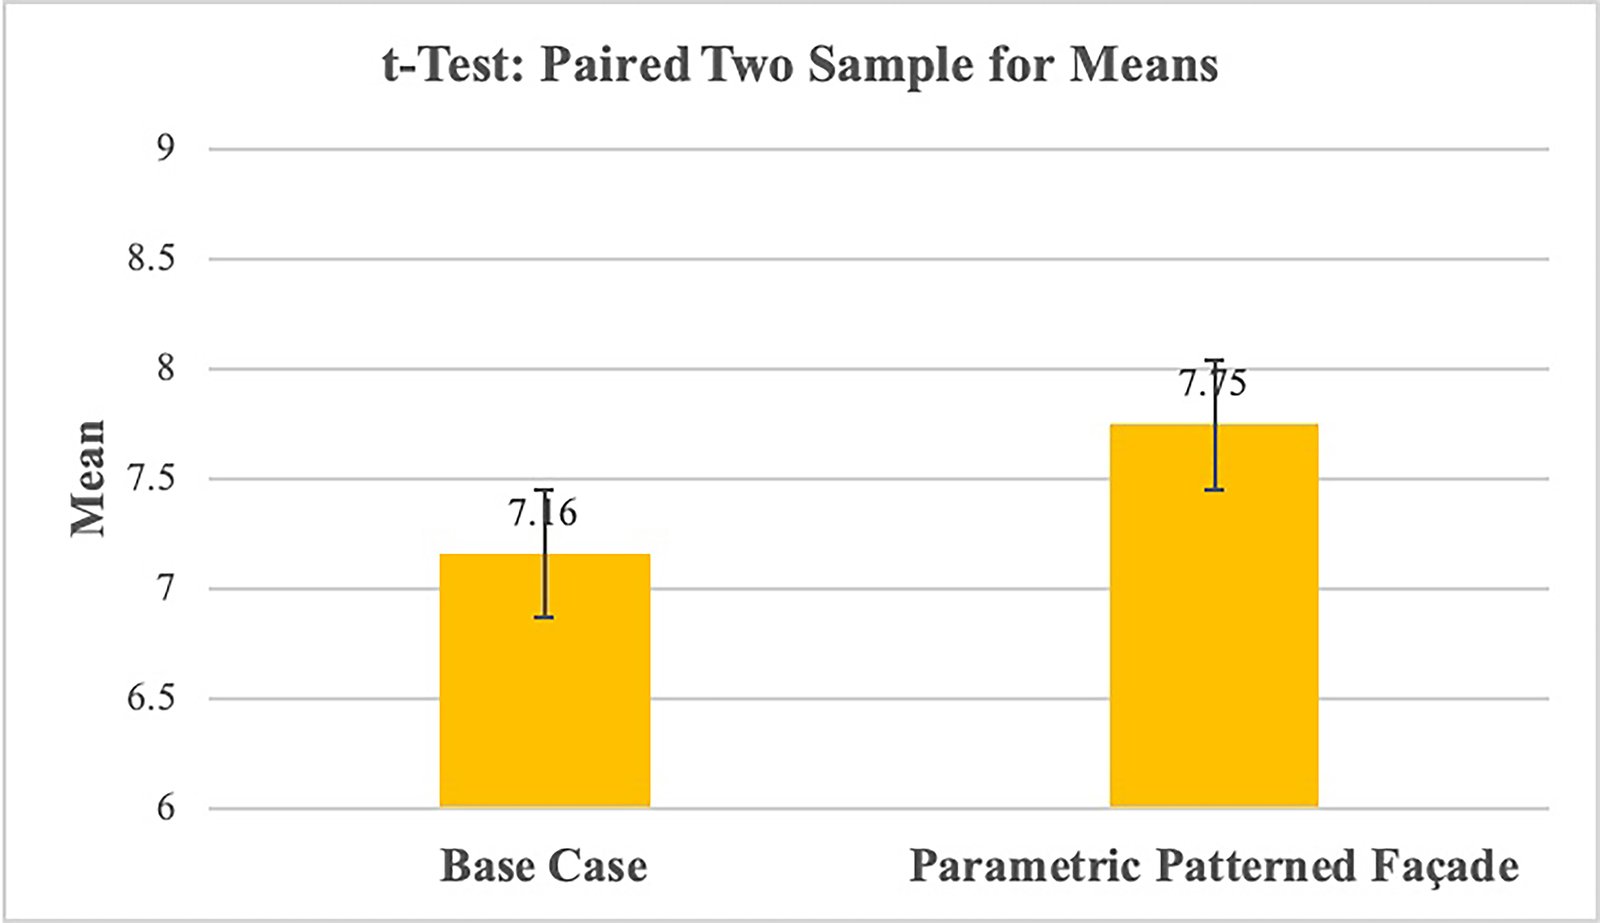 Figure 10
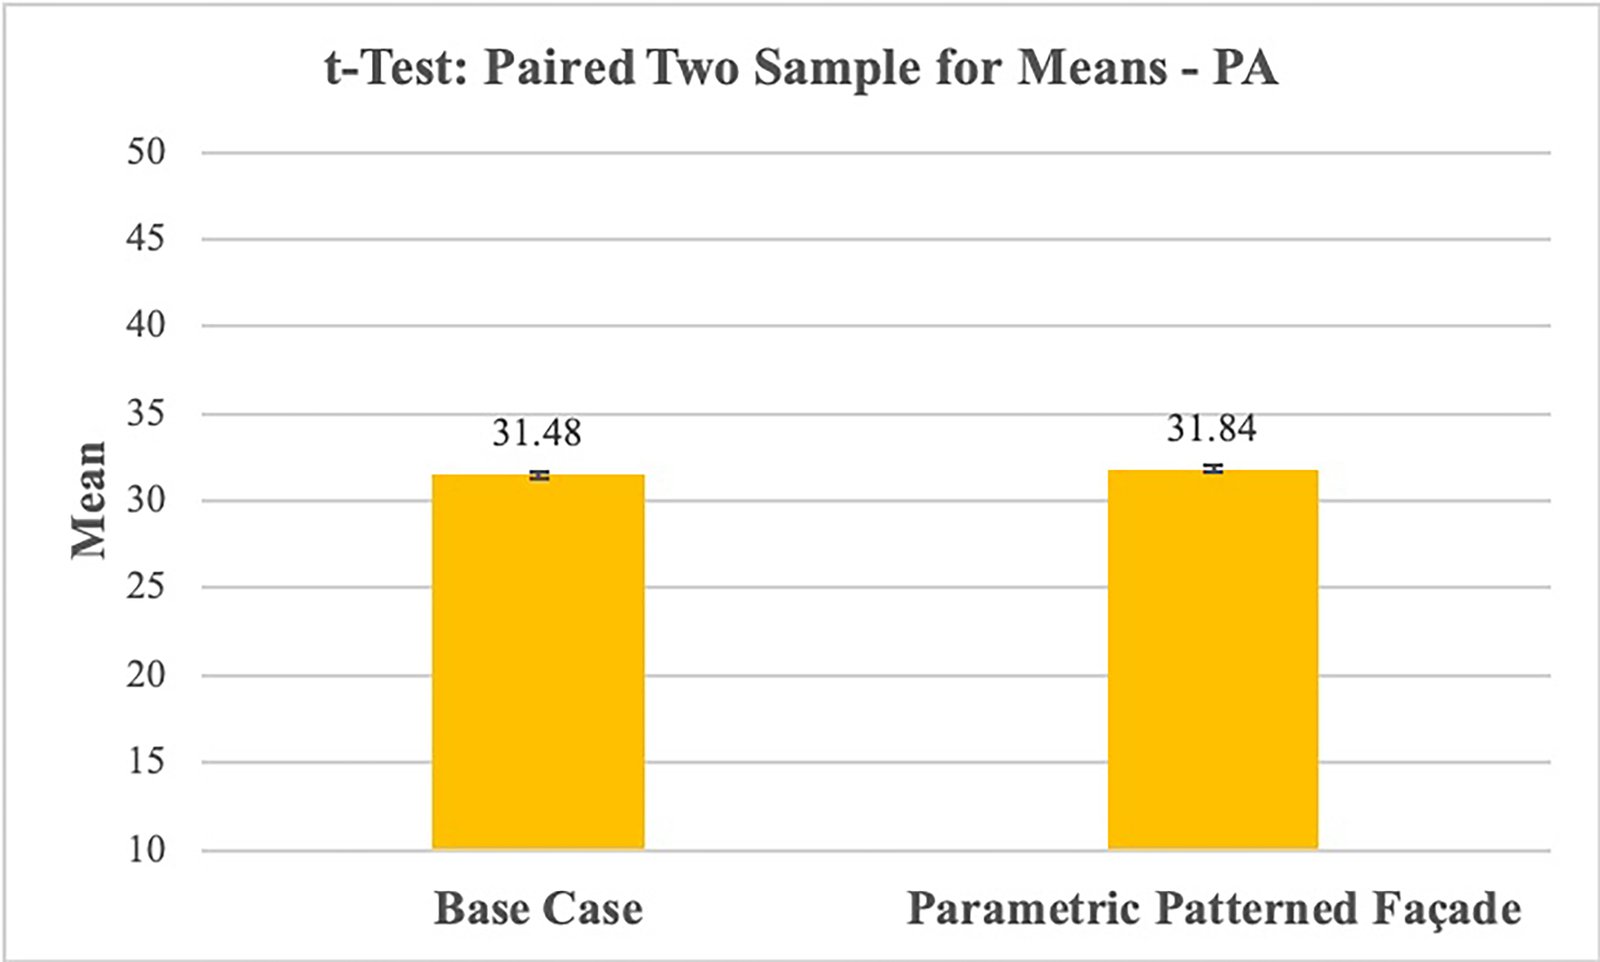 Figure 11
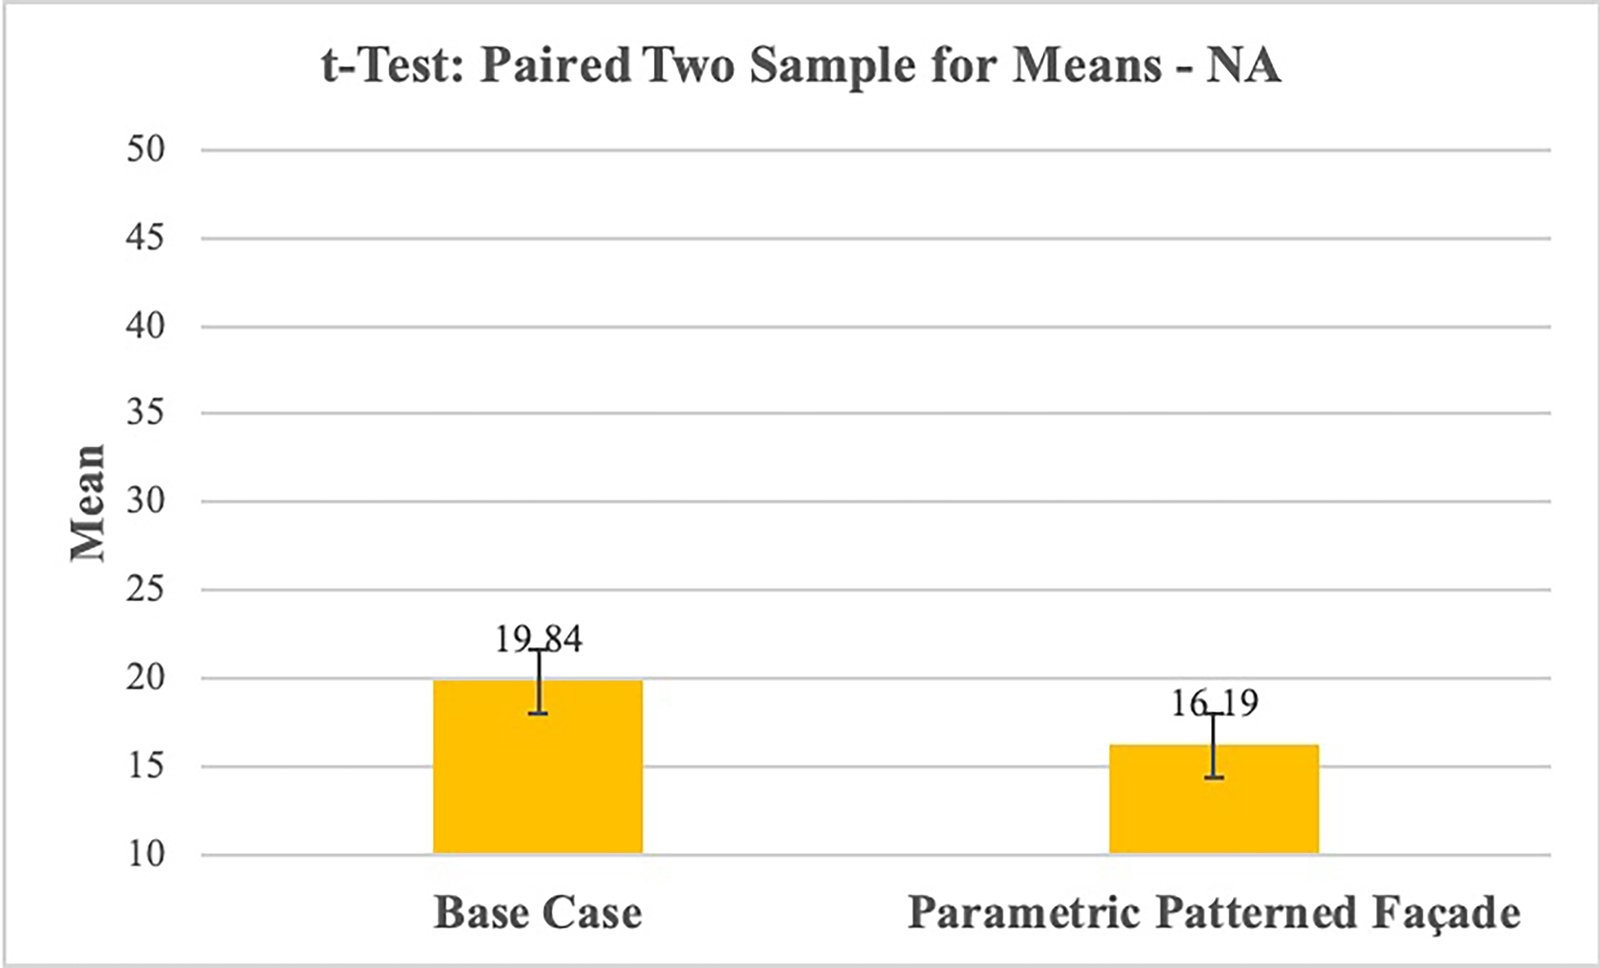 Figure 12
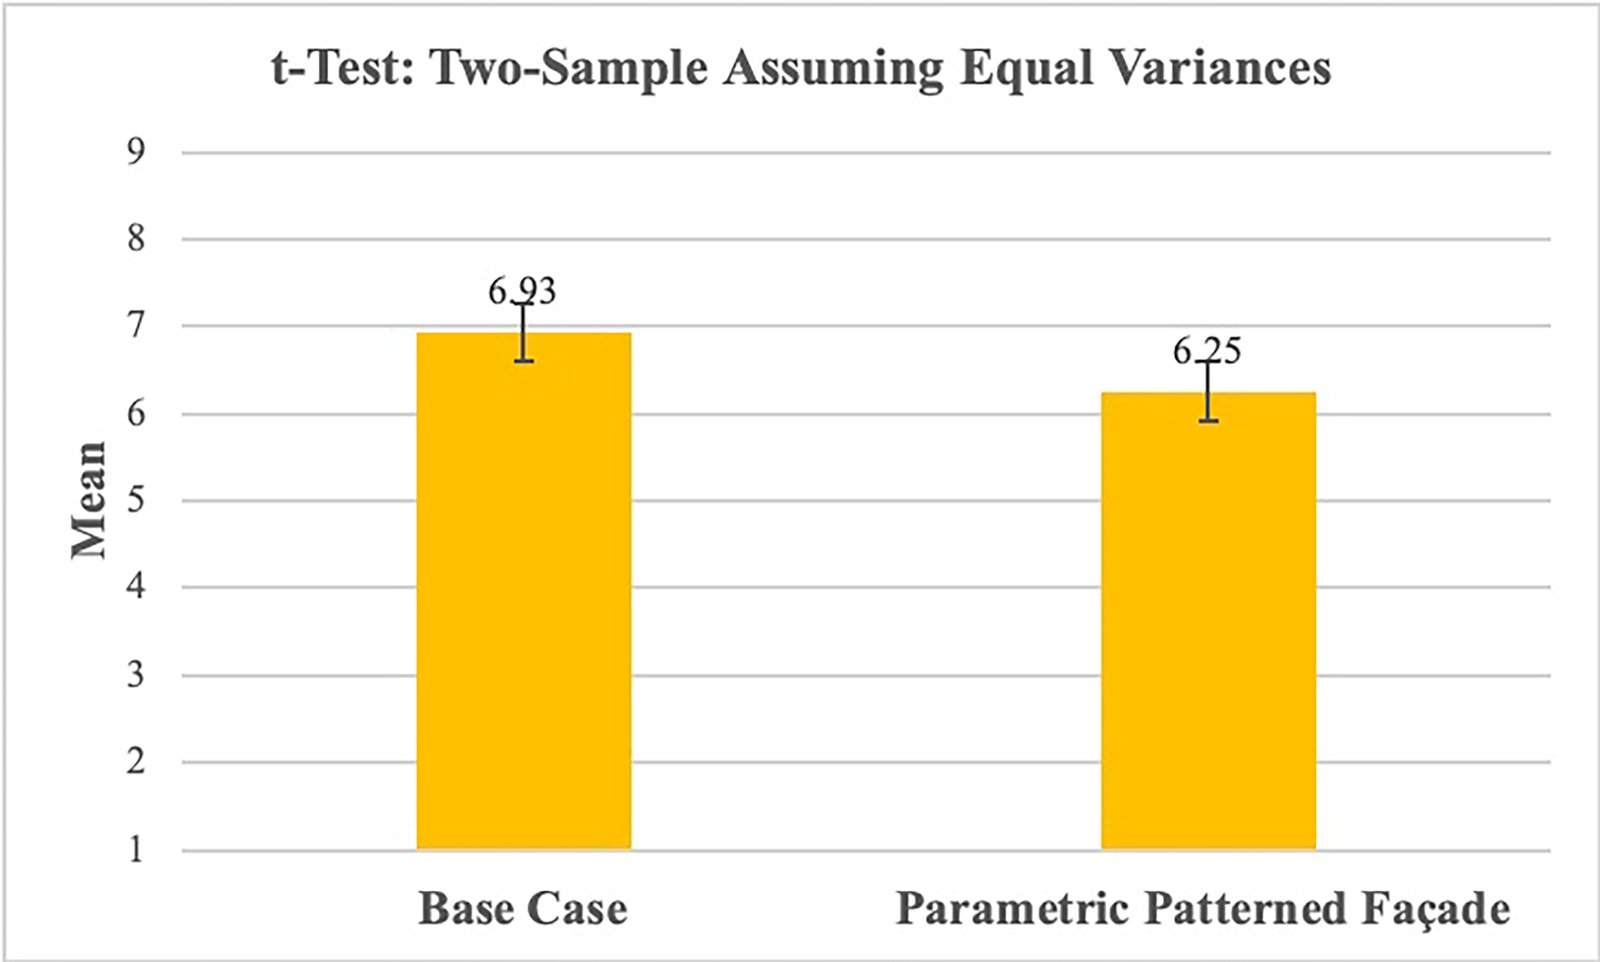 Figure 13
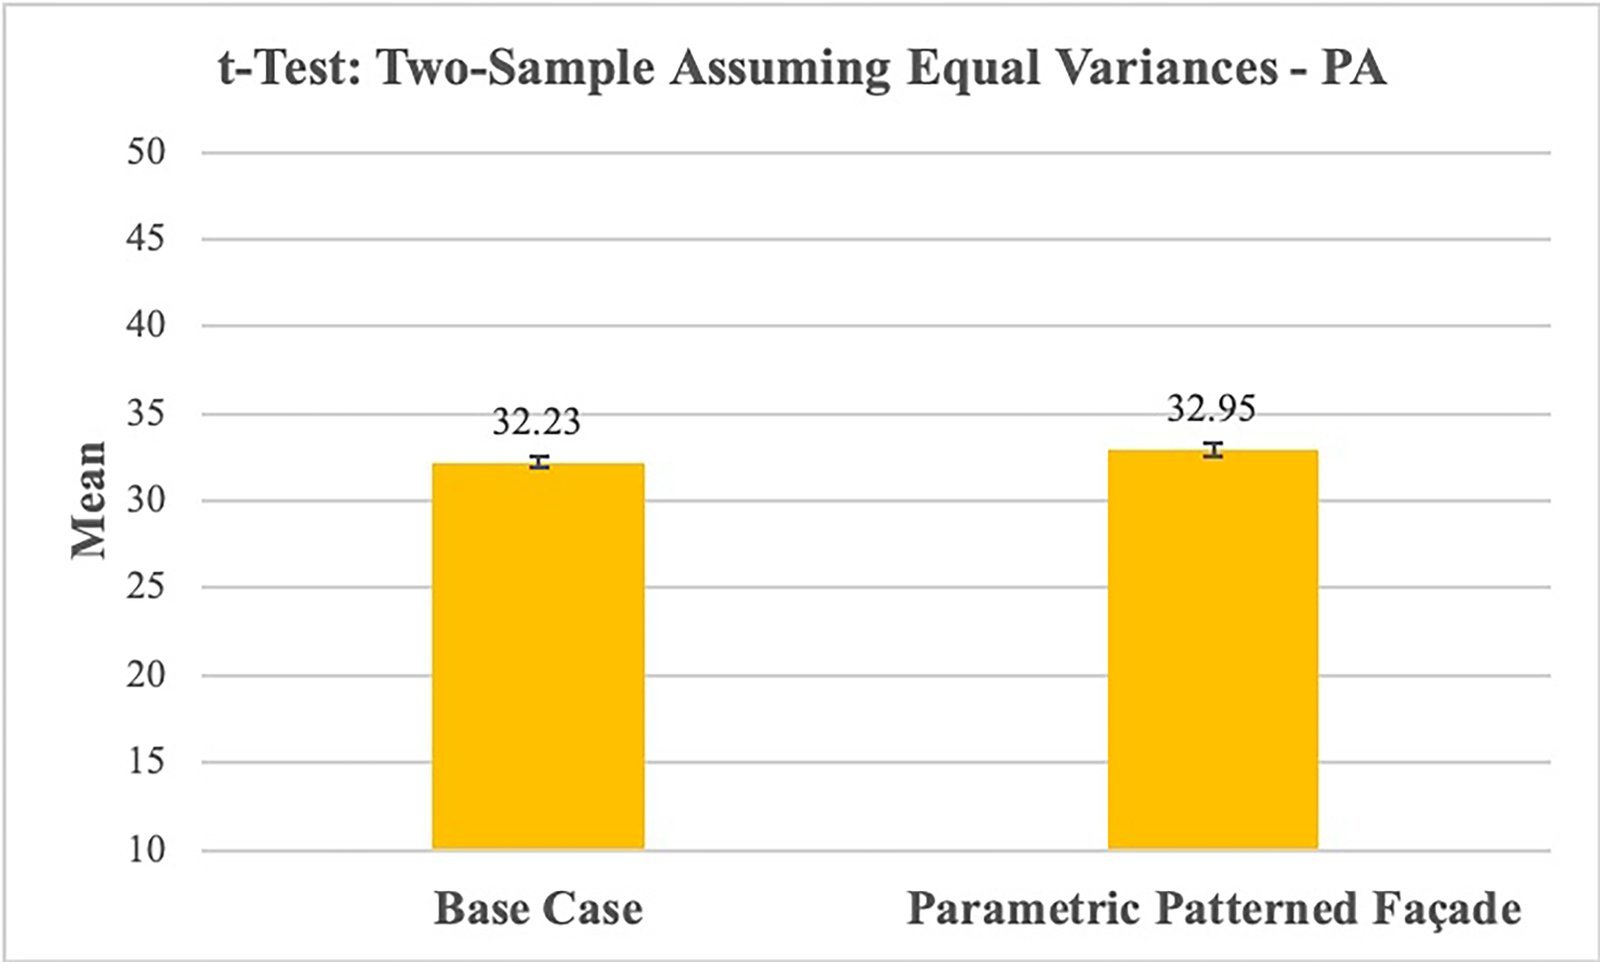 Figure 14
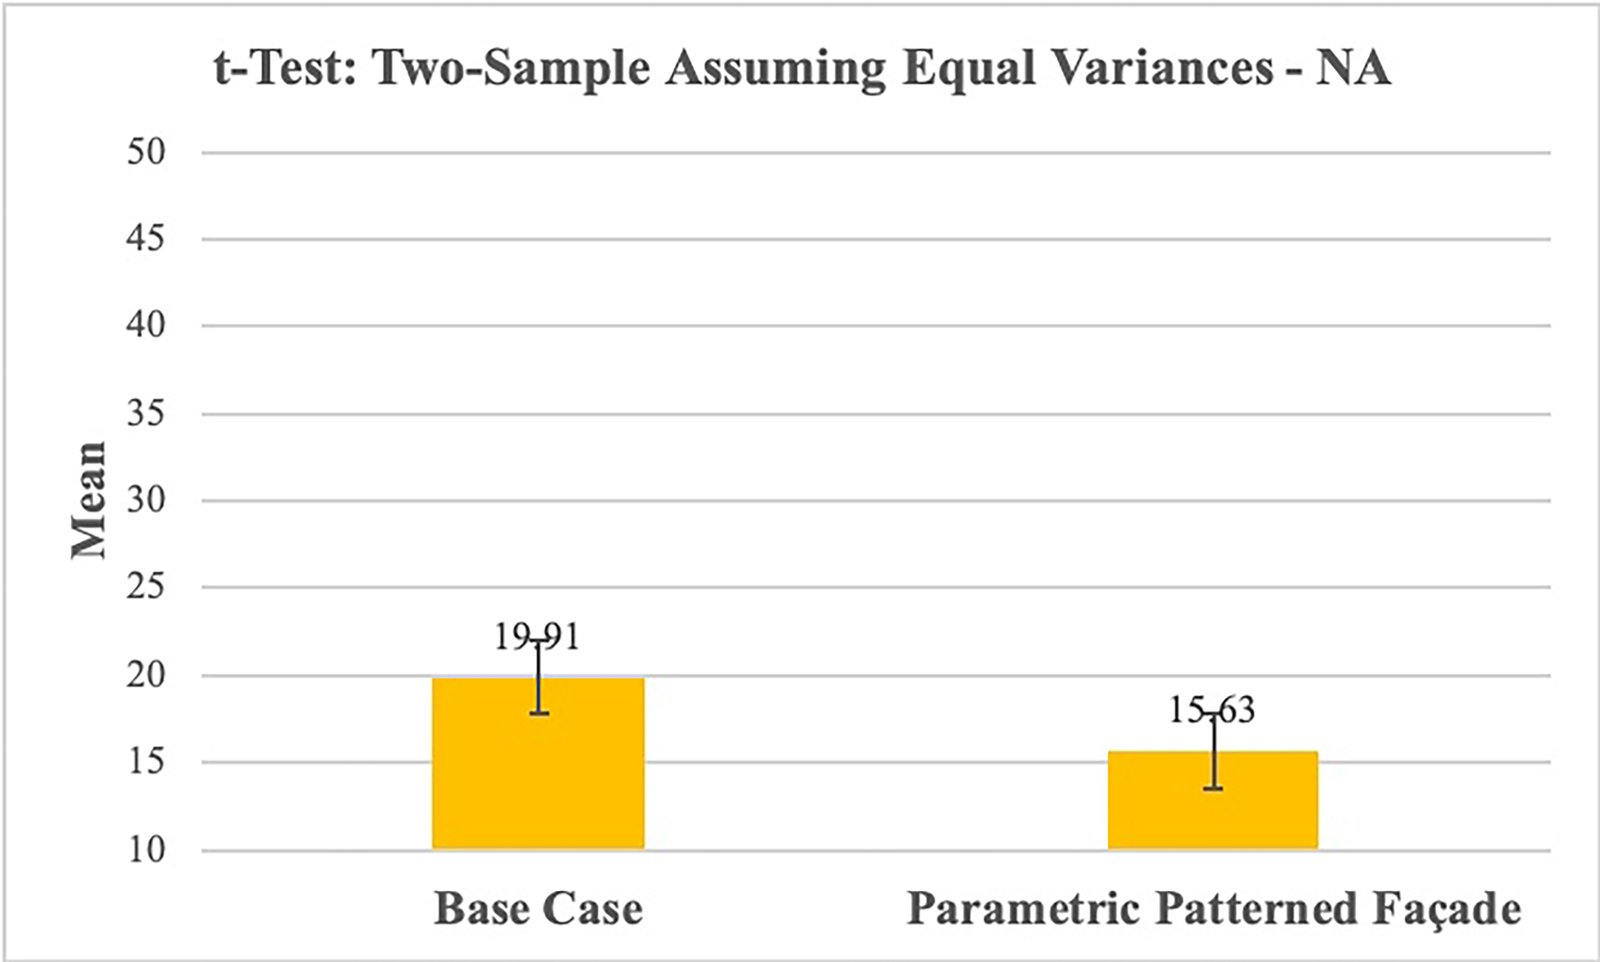 Figure 15
 Figure 16
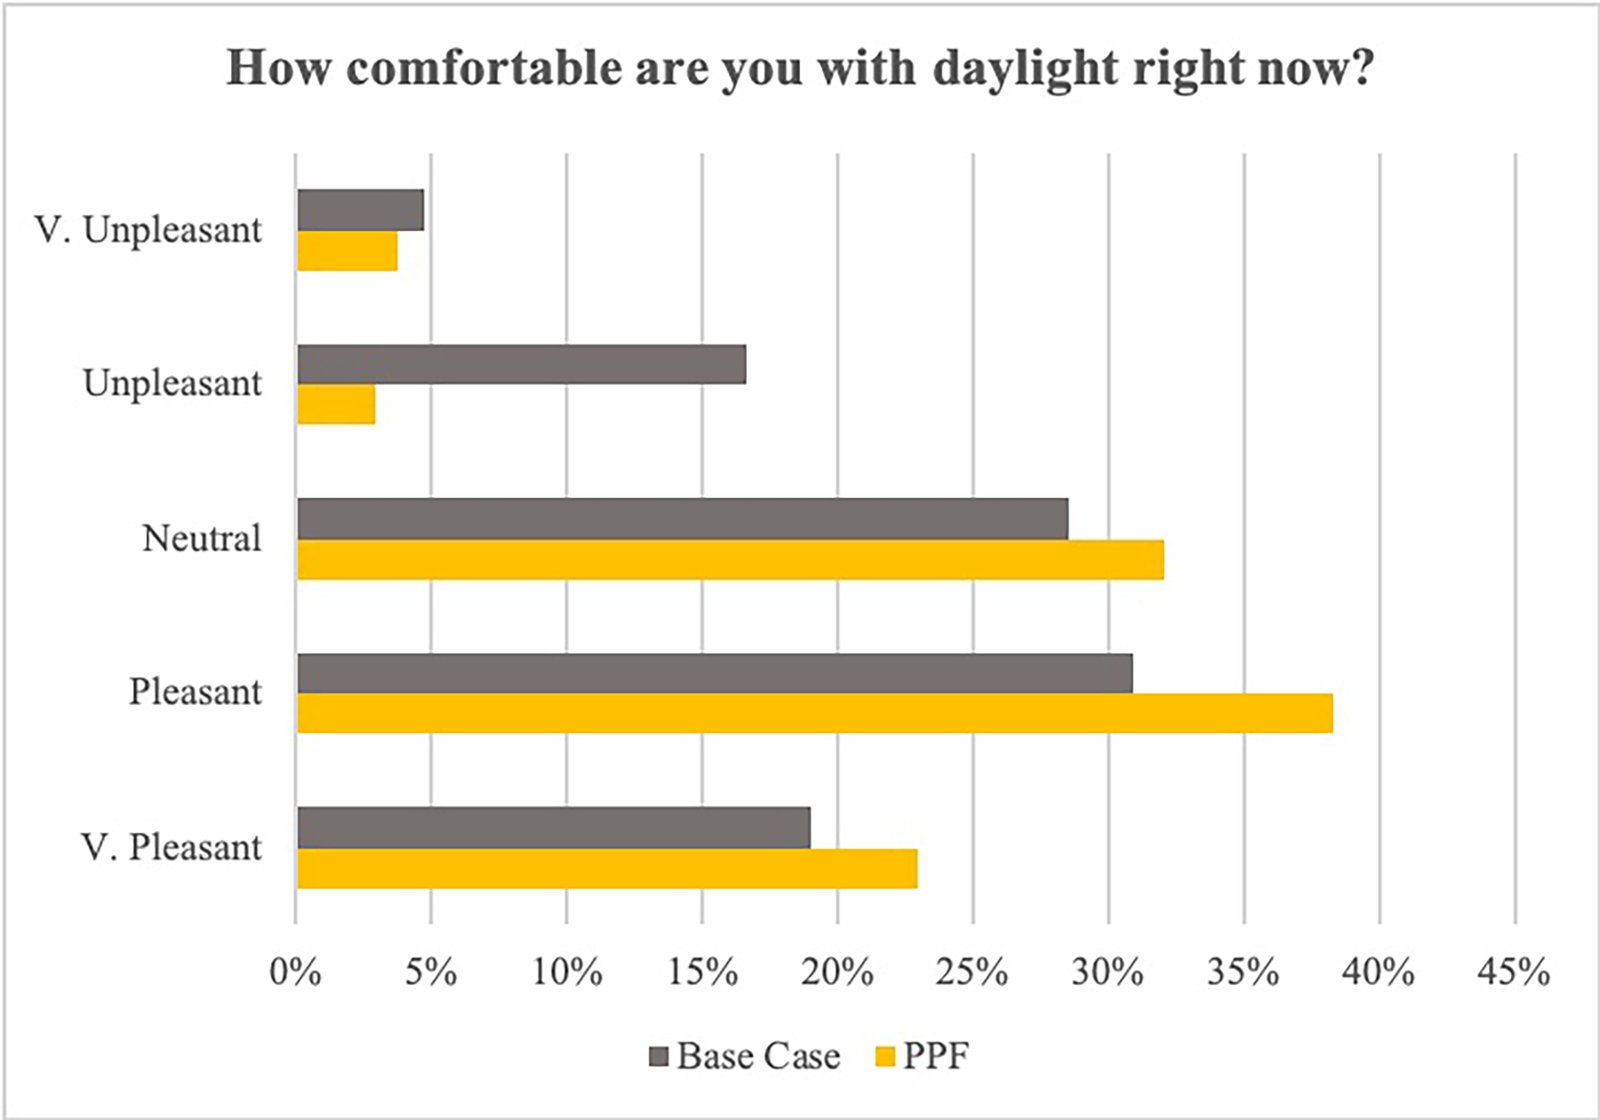 Figure 17
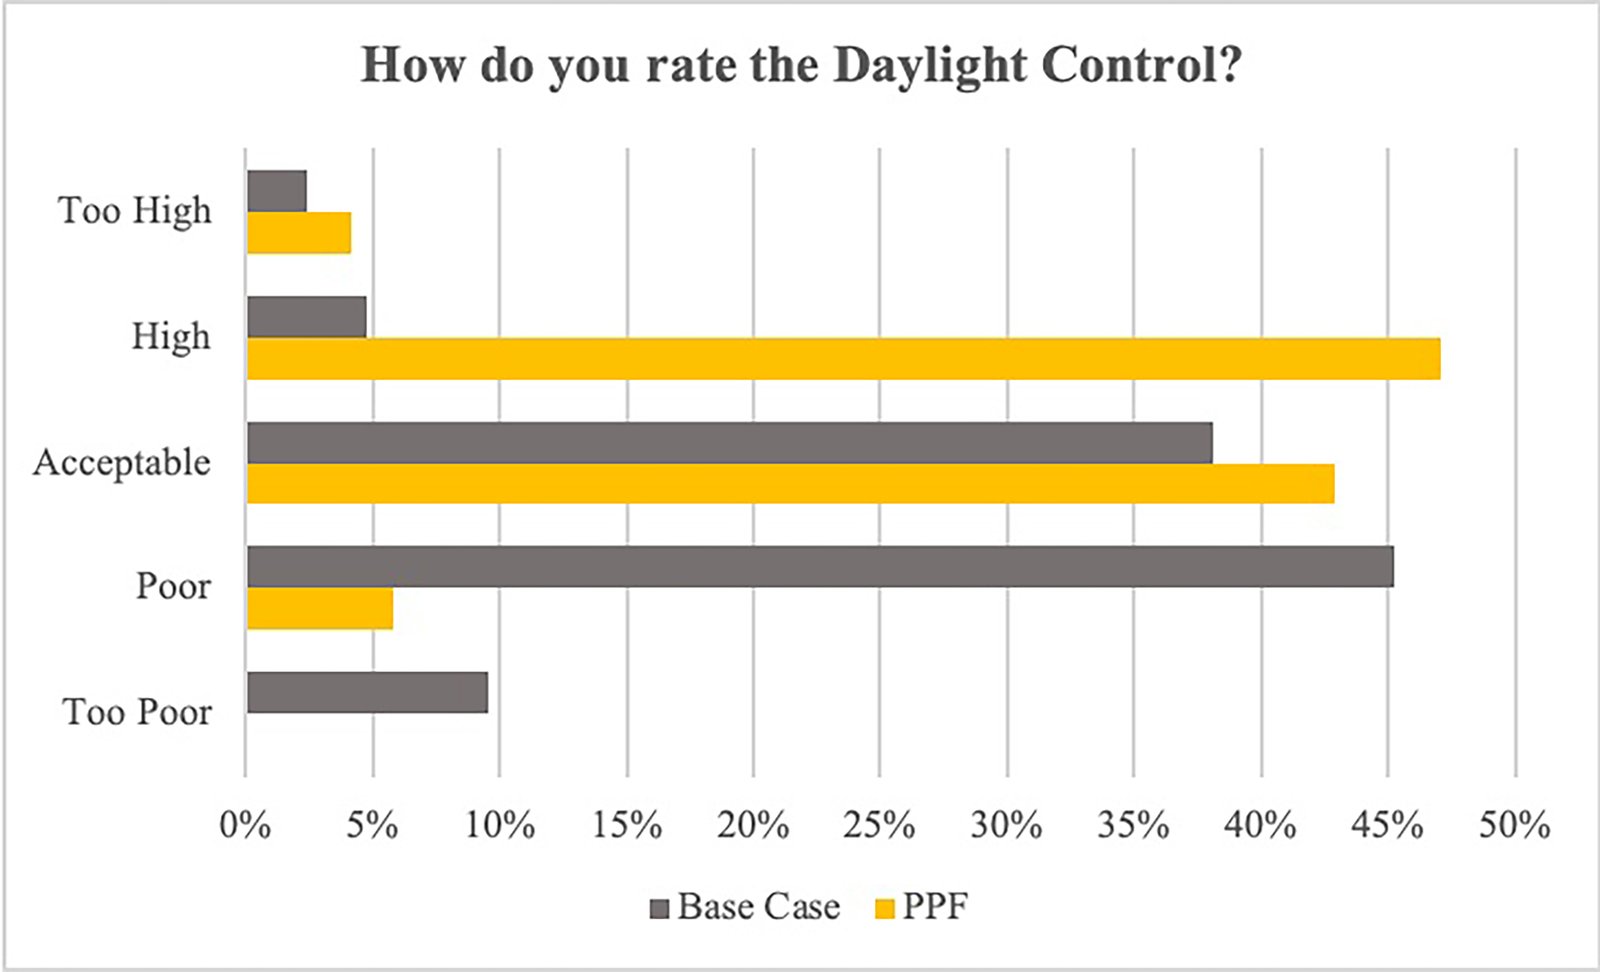 Figure 18
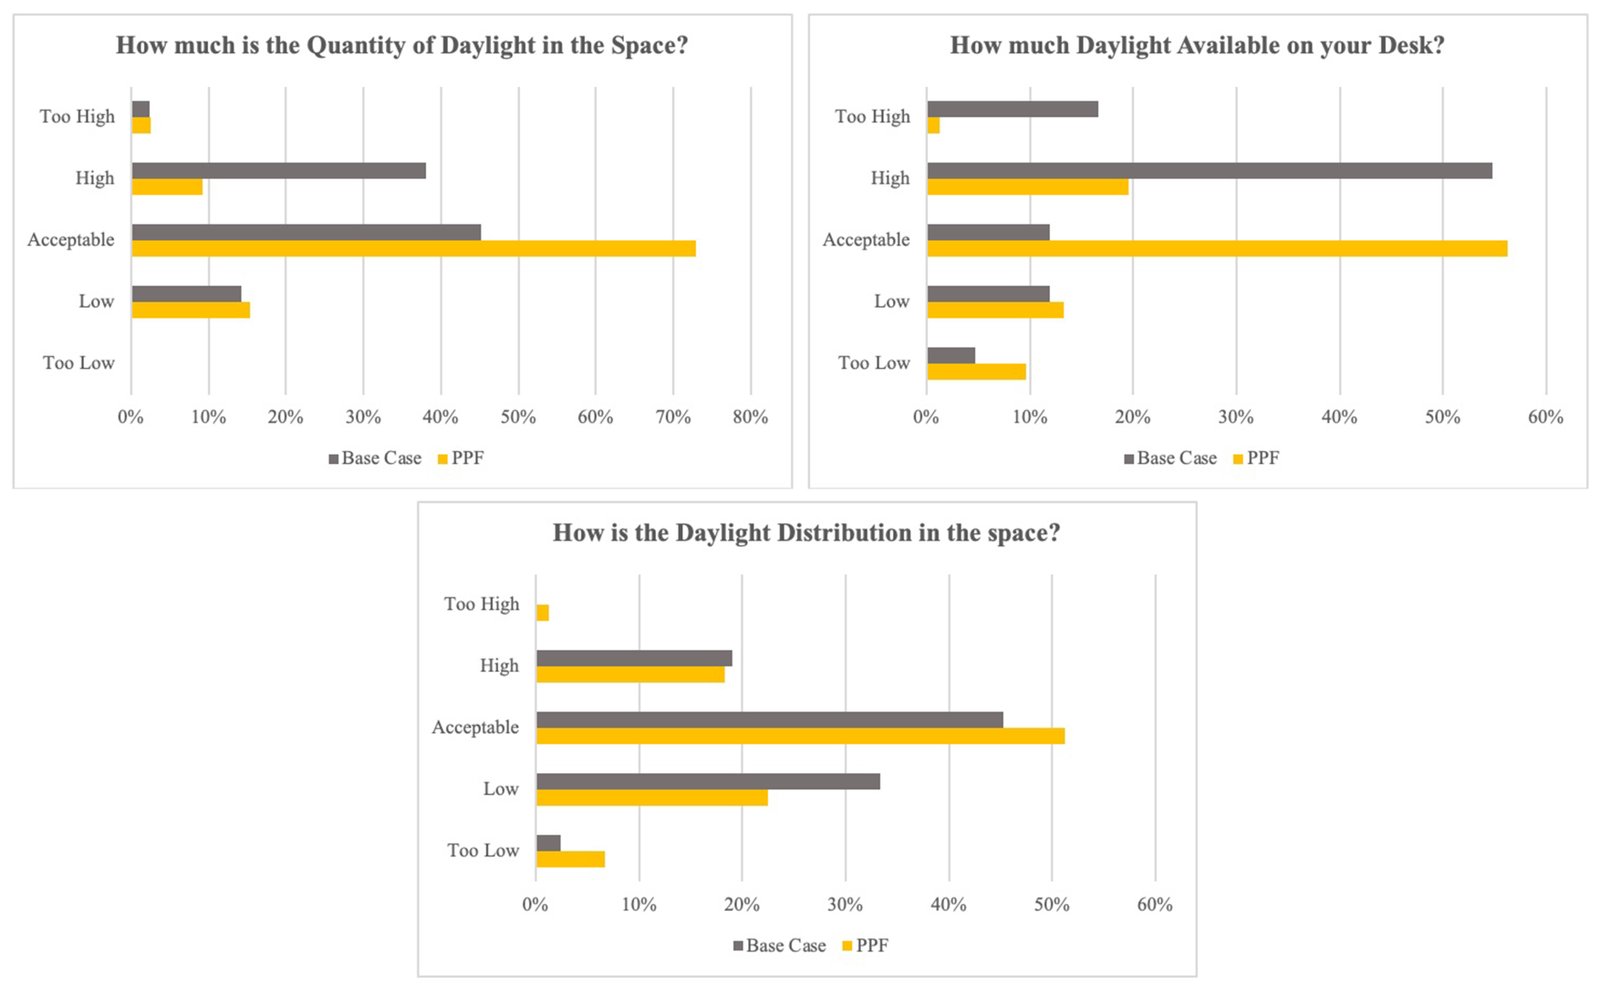 Figure 19
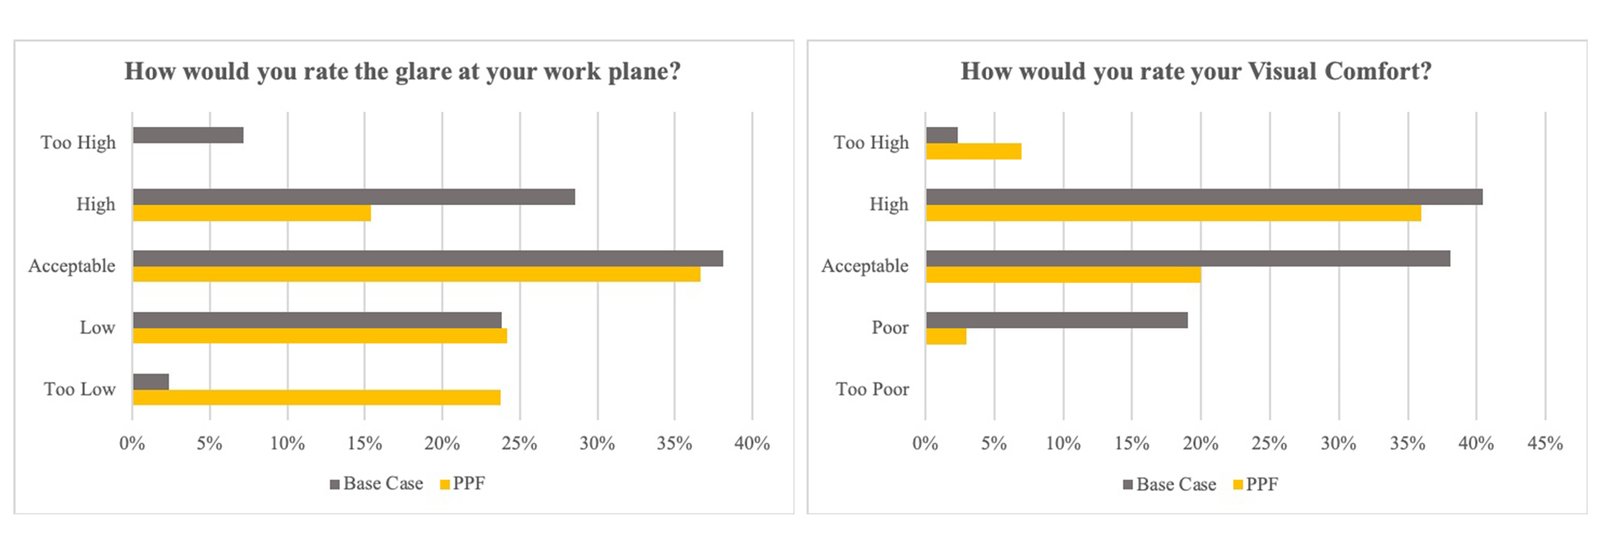 Figure 20
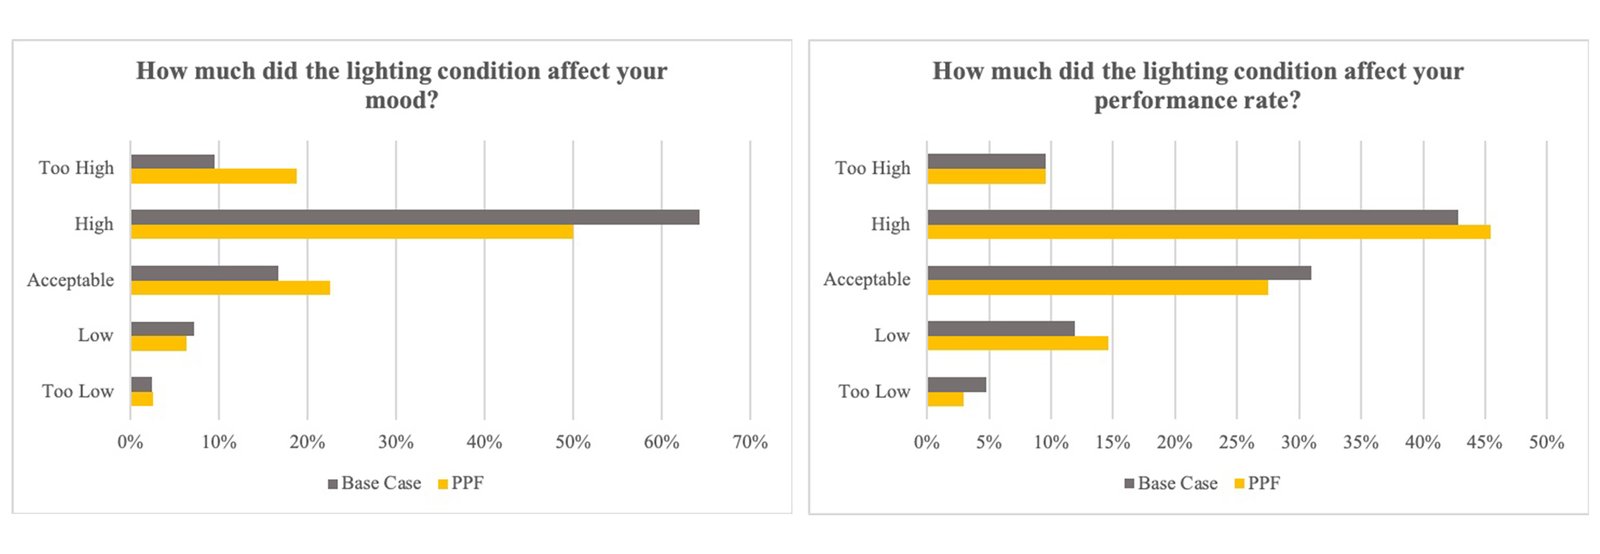 Figure 21
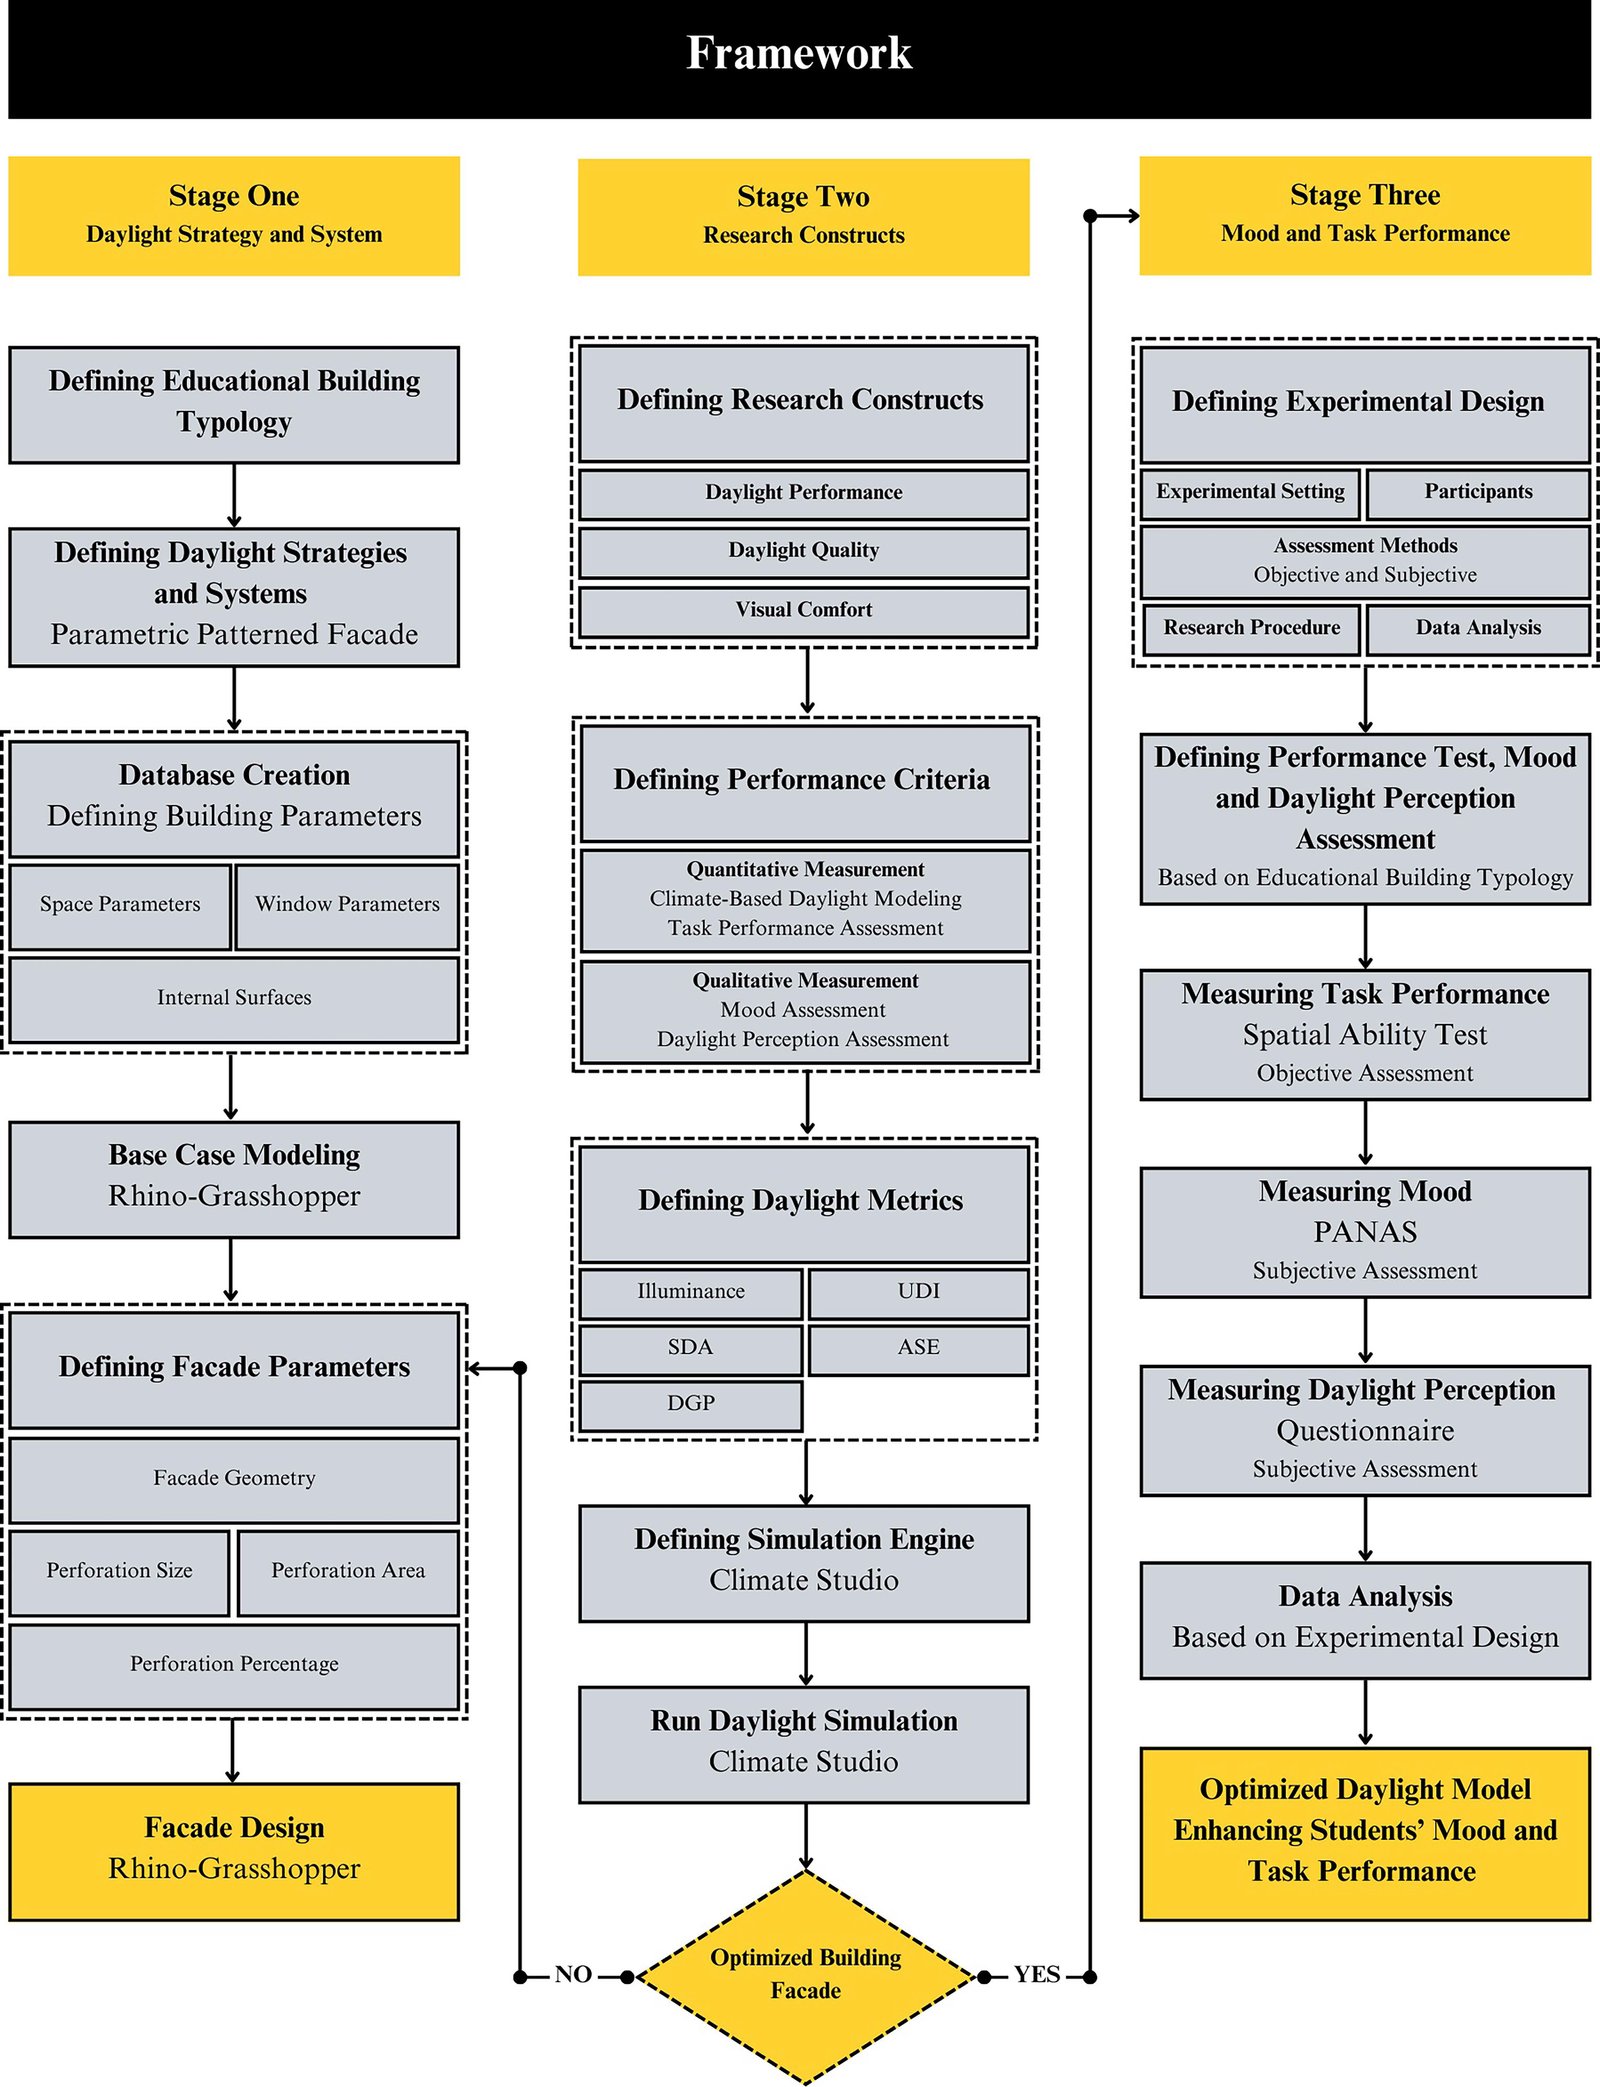 Figure 22
 Table 1
 Table 2
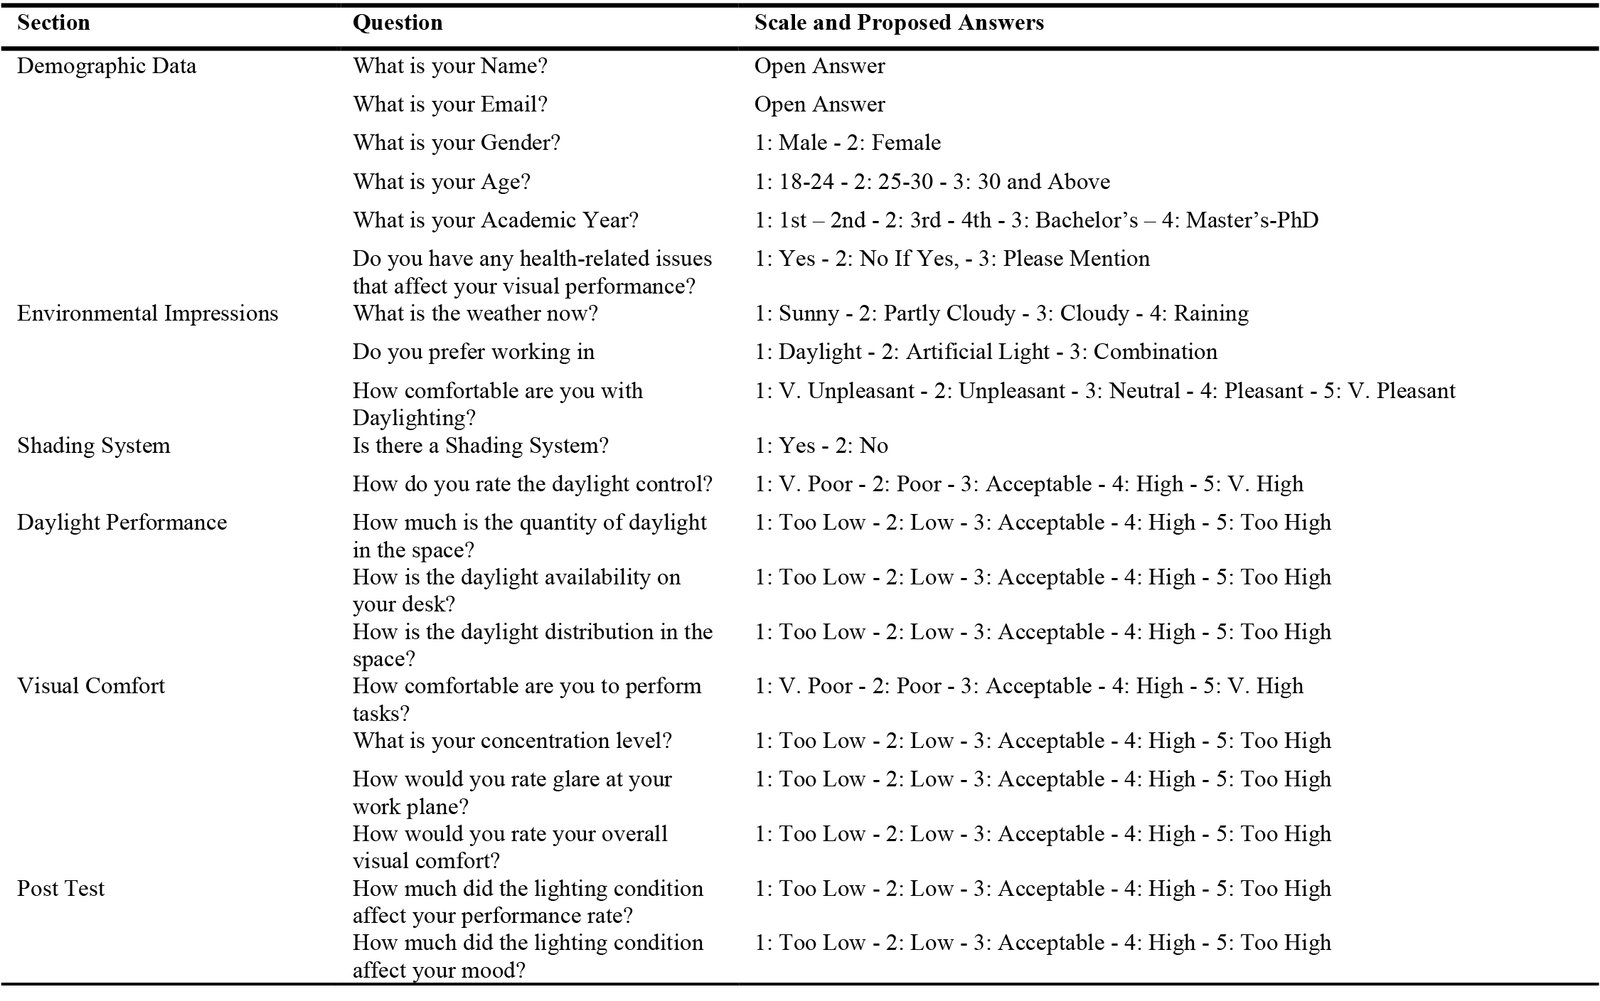 Table 3
 Table 4
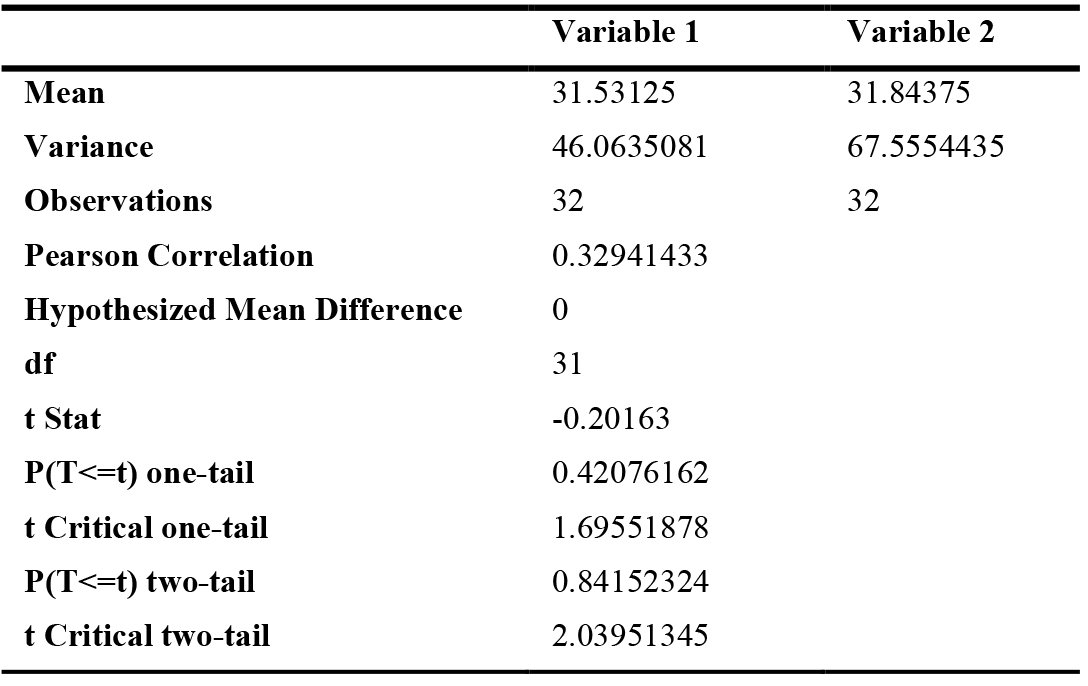 Table 5
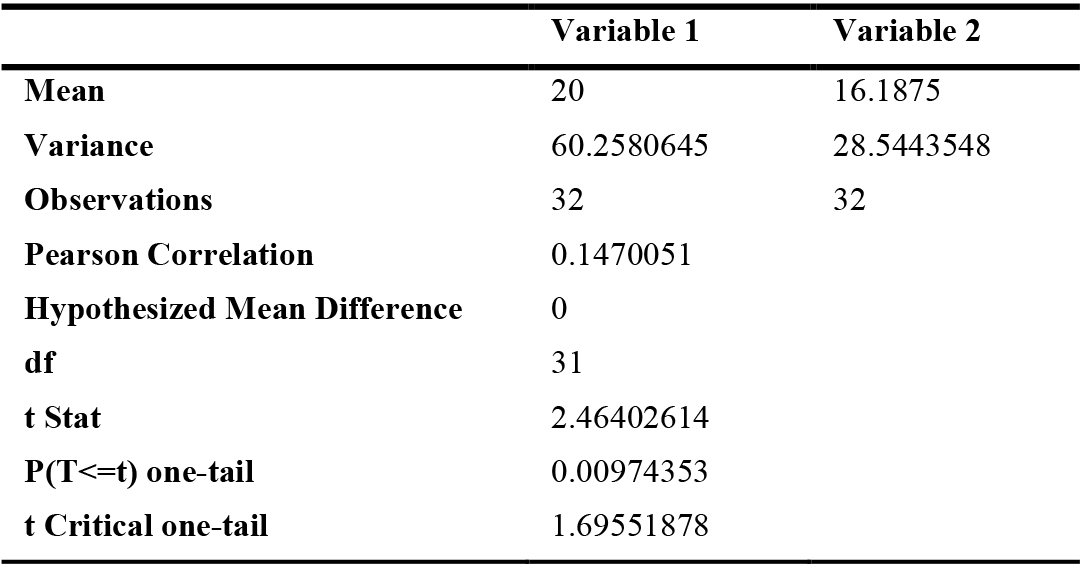 Table 6
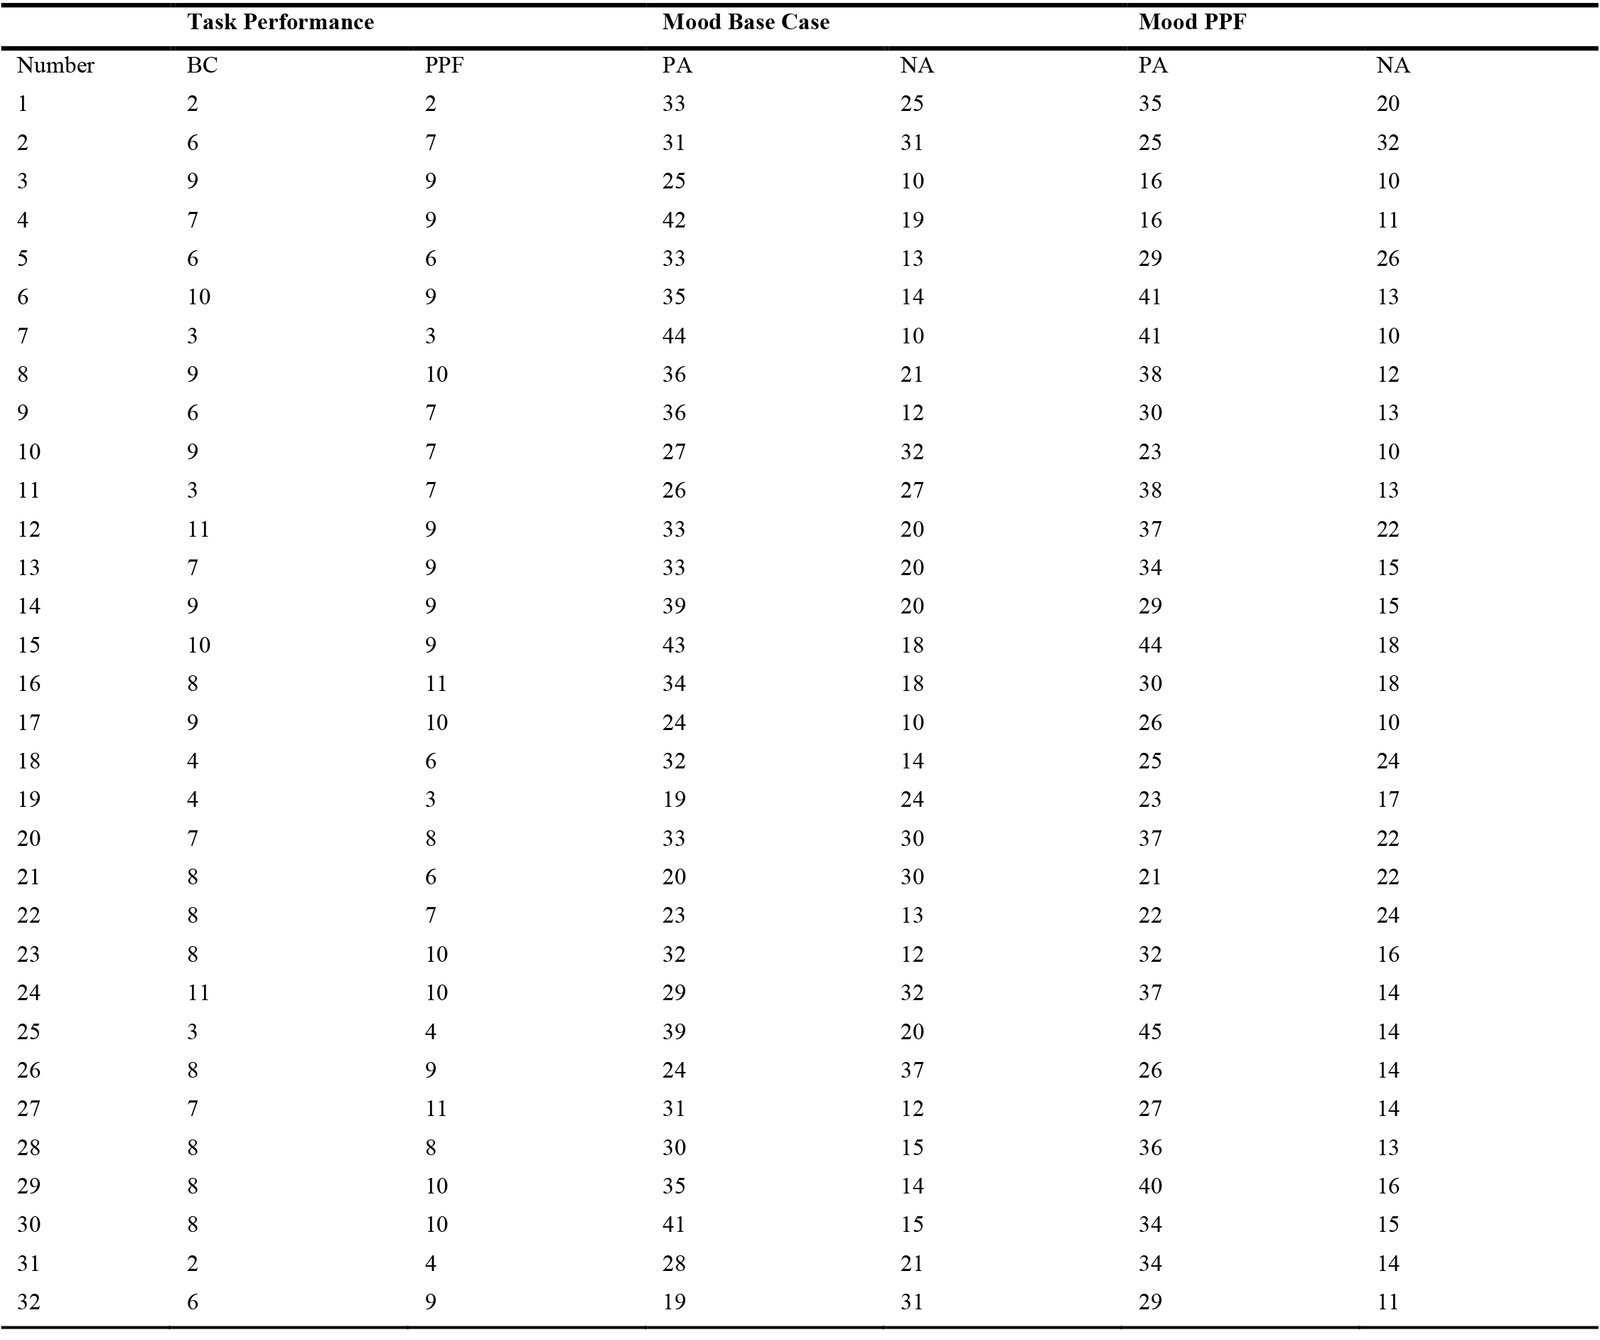 Table 7
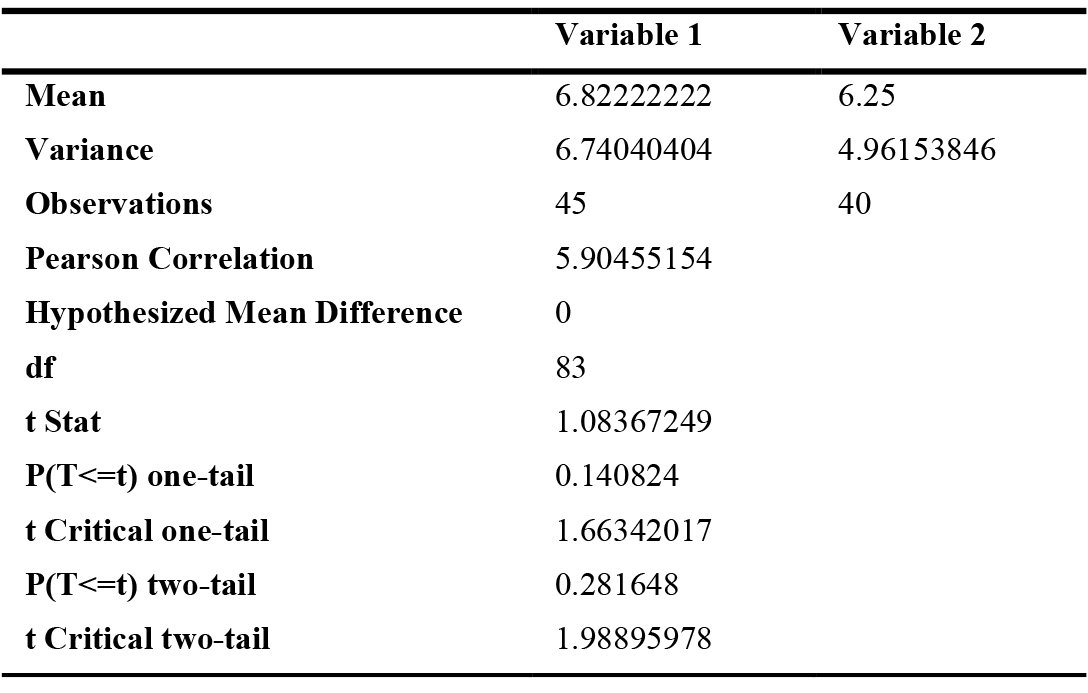 Table 8
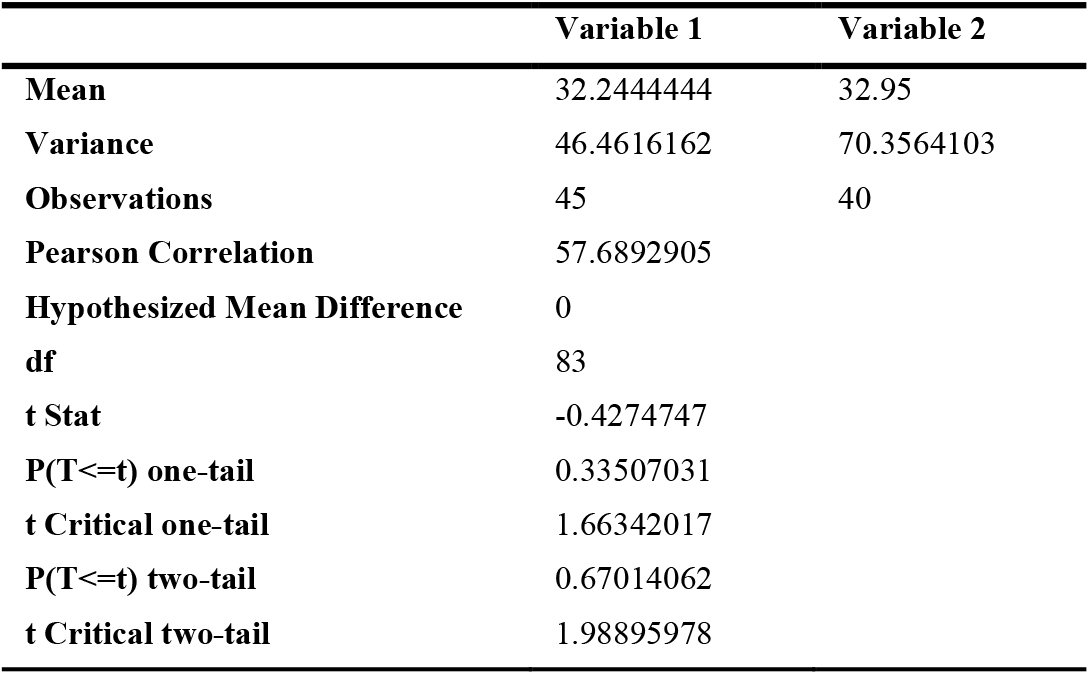 Table 9