Volume 11 Issue 1 pp. 39-54 • doi: 10.15627/jd.2024.3
Investigation of Ventilation Performance to Improve the Indoor Air Quality of Institutional Kitchens
Jesna Mathew,∗ Gnanasambandam Subbaiyan
Author affiliations
Department of Architecture, National Institute of Technology, Tiruchirappalli, Tamil Nadu 620015, India
*Corresponding author.
jmjesnamathew@gmail.com (J. Mathew)
subbaiah@nitt.edu (G. Subbaiyan)
History: Received 29 January 2024 | Revised 26 March 2024 | Accepted 30 March 2024 | Published online 27 April 2024
Copyright: © 2024 The Author(s). Published by solarlits.com. This is an open access article under the CC BY license (http://creativecommons.org/licenses/by/4.0/).
Citation: Jesna Mathew, Gnanasambandam Subbaiyan, Investigation of Ventilation Performance to Improve the Indoor Air Quality of Institutional Kitchens, Journal of Daylighting 11 (2024) 23-38. https://dx.doi.org/10.15627/jd.2024.3
Figures and tables
Abstract
Indoor Air Quality (IAQ) is a significant health determinant in the building environment. Ventilation plays a significant role in providing comfortable working conditions and securing contaminant removal from indoor spaces. The heat and effluents generated by cooking activity need to be exhausted from the kitchen space to control the IAQ and provide thermal comfort. The study investigates the ventilation performance concerning IAQ of five institutional kitchens in an educational campus. This study evaluates the influence of building parameters on ventilation performance and IAQ using experimental research and Computational Fluid Dynamics (CFD). The empirical part includes field measurement of indoor airflow and IAQ indicators (particulate matter, CO2, temperature, and RH). The Integrated Environmental Solutions Virtual Environment (IESVE) software performs the CFD analysis. The 'Local Mean Age of air' (LMA) is used as a parameter to analyze IAQ. The findings reveal that the LMA reduces with increased cross-ventilation at the operational level and the presence of local exhaust ventilation, such as chimneys. Moreover, a higher slenderness ratio, lower aspect ratio, and lower building volume reduce the age of air.
Keywords
Ventilation performance, CFD analysis, Local mean age of air, Building parameters
1. Introduction
Indoor Air Quality (IAQ) is one of the critical health and safety concerns in the built environment. IAQ's worldwide relevance and attention in building design became pronounced in the wake of airborne transmission during the pandemic. Optimal air quality and adequate air circulation are imperative requisites across all working environments. Ventilation in buildings is essential for reducing and eliminating pollutants and improving IAQ [1–3]. Further, ventilation is significant in ensuring thermal comfort, a productive working environment, and optimal IAQ in the workplace [4].
The Food Service Industry is one of the largest industries in India, employing 6.2 million people [5]. The present study focuses on the institutional kitchen environment, a classification of the commercial kitchen space that provides meals at colleges, universities, schools, hospitals, daycare, senior homes, etc. [6,7]. A commercial kitchen is a one-of-a-kind workspace where various heating, ventilating, and air-conditioning applications operate within a single area [7].
The cooking process generates a large quantity of radiant heat and pollutants that must be controlled to provide acceptable thermal comfort and optimum IAQ for workers [7]. Cooking emits hazardous pollutants (associated with high morbidity and mortality rates) such as particulate matter (PM) and gases like carbon monoxide (CO), oxides of sulphur (SOx), and oxides of nitrogen (NOx) [8–11]. Commercial kitchen environments are vulnerable to high levels of CO2, CO, air-bone mutagens, and carcinogens [4]. The primary pollutants assessed in previous studies are CO, CO2, NO2, PM2.5, and PM10 [4,12–18].
The existing studies [4,13,14] provide evidence about the potential health hazards associated with cooking environments due to prolonged exposure to pollutants. Inhalation of PM2.5 causes acute and chronic respiratory diseases and cardiovascular illnesses [18]. The study by Guo et al. [19] found that long-term exposure to PM2.5 and PM10 can increase the risk of cardiovascular and respiratory disorders.
Cooks are vulnerable to heat stress and poor IAQ due to heat and particulate matter generated from cooking, [12] especially in warm and humid climates in India. The critical workspace in the commercial kitchen is the cooking line, where chefs experience high-temperature differences and high concentrations of air pollutants [7]. Singh et al. [20] found that prolonged exposure to heat in kitchen environments could impact kidney functioning, explicitly leading to an increase in the specific gravity of urine among commercial kitchen workers.
Many research studies [17,18,21-24] evaluated the role of ventilation in controlling IAQ and pollutant concentrations in building environments. Ruth et al. [17] found that more open windows would cause a proportional decrease in household air pollution, and the kitchen with good cross-ventilation and no fans had the most significant reduction in CO and PM2.5. According to Whelan [25], integrating a cross-kitchen airflow system and a cookstove with an enhanced combustion chamber is a highly impactful measure for improving air quality. Several studies on the kitchen environment indicate that increasing ventilation dramatically reduces indoor pollutant levels [4,14,16,16-28]. The concentration of indoor pollutants has been used as an alternate measure of the ventilation rate inside the space [25,26,29].
The airflow in naturally ventilated buildings is affected by variables such as the building's aspect ratio and opening size [30]. The 'World Health Organization' (WHO) also says that improved cookstoves, better airflow in the cooking area, and building parameters such as adequate opening-to-wall ratios (OWR) and aspect ratios are essential for a healthy kitchen [31].
Generally, enhanced IAQ is assumed to be achieved only through higher energy usage. However, an integrated design approach to IAQ and energy can result in a high-performing, energy-efficient building with good IAQ [32]. Some studies [4,17,30,33] investigated the effect of different opening patterns and building features on ventilation and pollutant concentration levels in residential kitchen environments. Debnath et al. [30] investigated the building parameters of rural kitchens in India that reduced the age of air and suggested that IAQ can be regulated and enhanced by appropriately designing the built environment. Saha et al. [4] say that judicious architectural design focusing on IAQ might result in a significantly enhanced working environment without additional investment. Therefore, finding the relationship between the building parameters, ventilation performance, and IAQ will help to develop a sustainable design solution. However, previous studies on the ventilation performance of commercial kitchens are focused on mechanical ventilation systems. There is a remarkable silence on the role of natural ventilation and the impact of building parameters on ventilation performance in commercial kitchen spaces. Hence, this research focuses on assessing the influence of building parameters on ventilation performance and IAQ in institutional kitchen environments.
The majority of studies used the CFD (computational fluid mechanics) simulation to examine IAQ and ventilation performance [4,27,28,30,33,34]. The analysis of the impact of building physical parameters, such as the inlet, exhaust location, window size and position, building volume, and the airflow rate inside the space, on the distribution of airflow and pollutant concentration inside the space is made easier with the use of computer simulation. Saha et al. [4] investigated how modifications to an existing kitchen reduce CO and CO2 using CFD analysis, whereas Debnath et al. [30] explored the impact of building parameters on the ‘age of air’ inside the rural kitchen space using CFD simulation.
Hence, the study targets the following objectives. First, to experimentally study the IAQ and ventilation performance in institutional kitchens. Second, to conduct the CFD analysis of the IAQ and ventilation performance in institutional kitchens. Third, to find the relationship between building parameters, ventilation performance and IAQ. Fourth, to suggest retrofitting solutions based on the findings.
2. Methodology and data
2.1. Study site details
The study site is an educational campus with naturally ventilated kitchens. The campus is located in Tiruchirappalli, Tamil Nadu, India. The climate of Tiruchirappalli is warm and humid, as per the 'National Building Code 2016' [35]. Figure 1 summarises the weather data of Tiruchirappalli. During most months, residents of Tiruchirappalli are exposed to high temperatures and high humidity. The coldest month is January at average and minimum temperatures of 25.1 °C and 18.5 °C, respectively. The hottest month is April, with average and maximum temperatures of 31.6 °C and 40.1°C respectively. January month experiences an average Relative Humidity (RH) of 72.4%, whereas the RH in April is 63.6%. Predominantly, wind flows from west to east. January month experiences outdoor wind speeds of 1.4 m/s, whereas in April, it is 0.9 m/s.
Figure 1
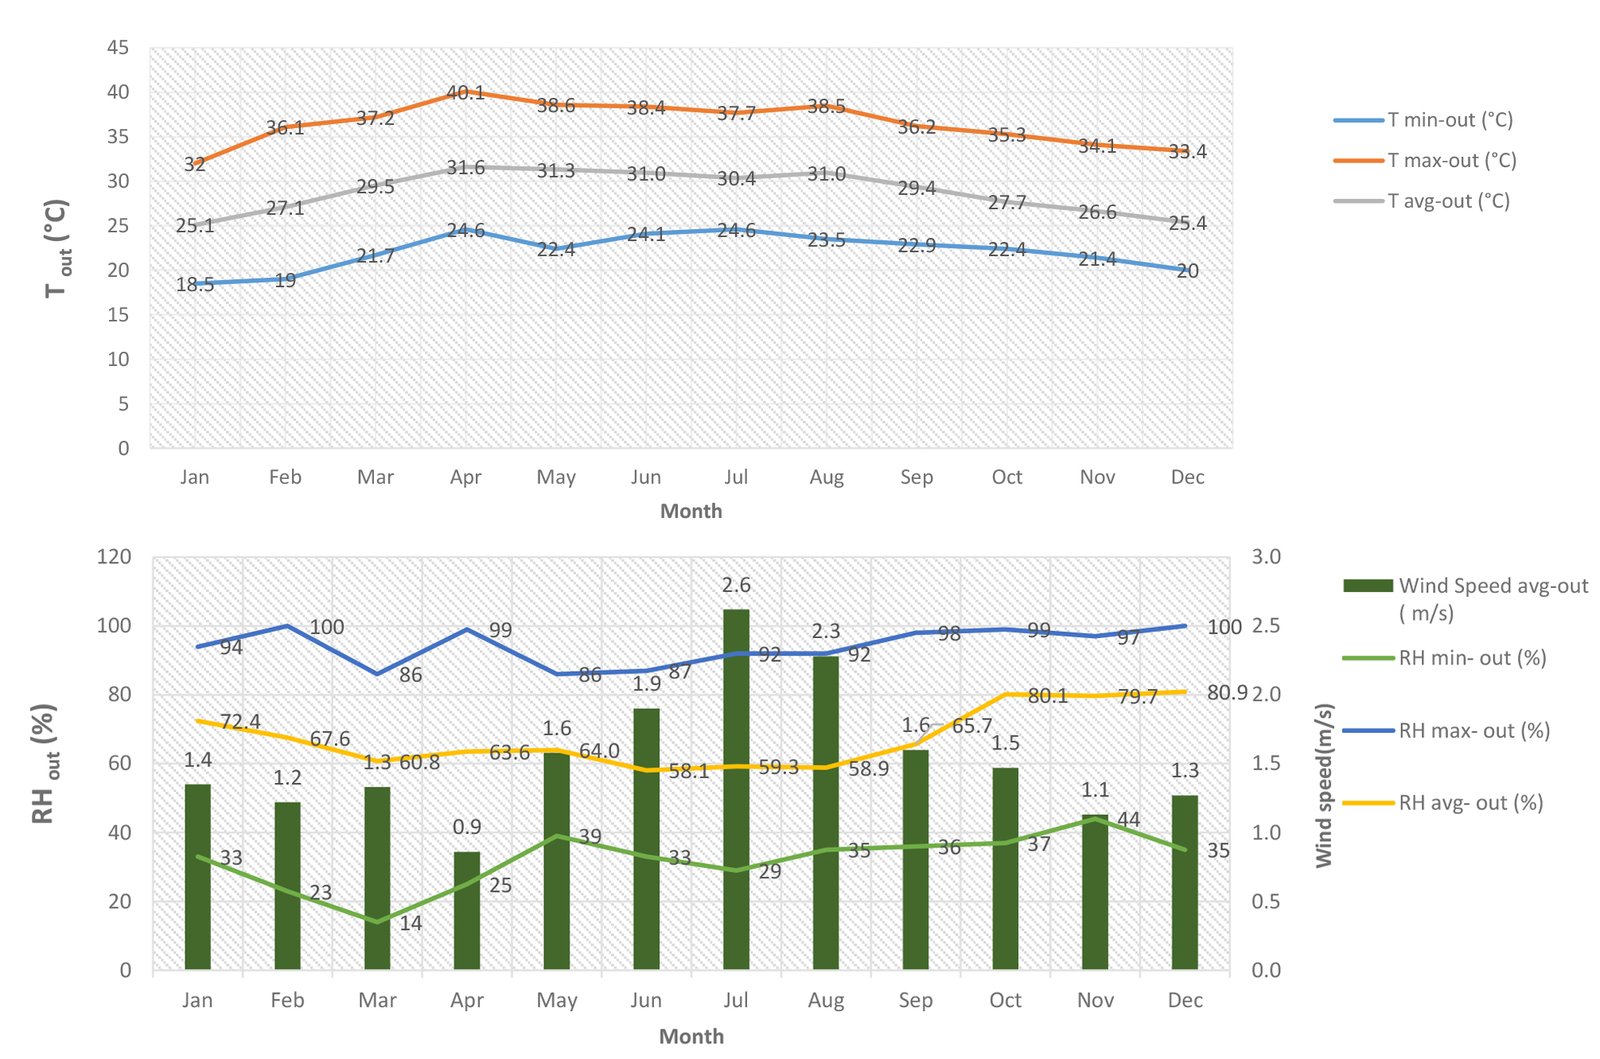
Fig. 1. Weather data of Tiruchirappalli.
The research targets kitchens belonging to hostels and canteens. The preliminary study eliminates kitchens with similar building parameters (aspect ratio, slenderness ratio, volume, and opening wall ratio). Hence, the study investigates five naturally ventilated institutional kitchens with varying building parameters. The selected kitchens have two or three exhaust fans installed to suck the air out of the workplace. Table 1 displays the architectural data and details of field measurements. The layout, 3D model, and photographs of five kitchens are illustrated in Fig. 2.
Table 1
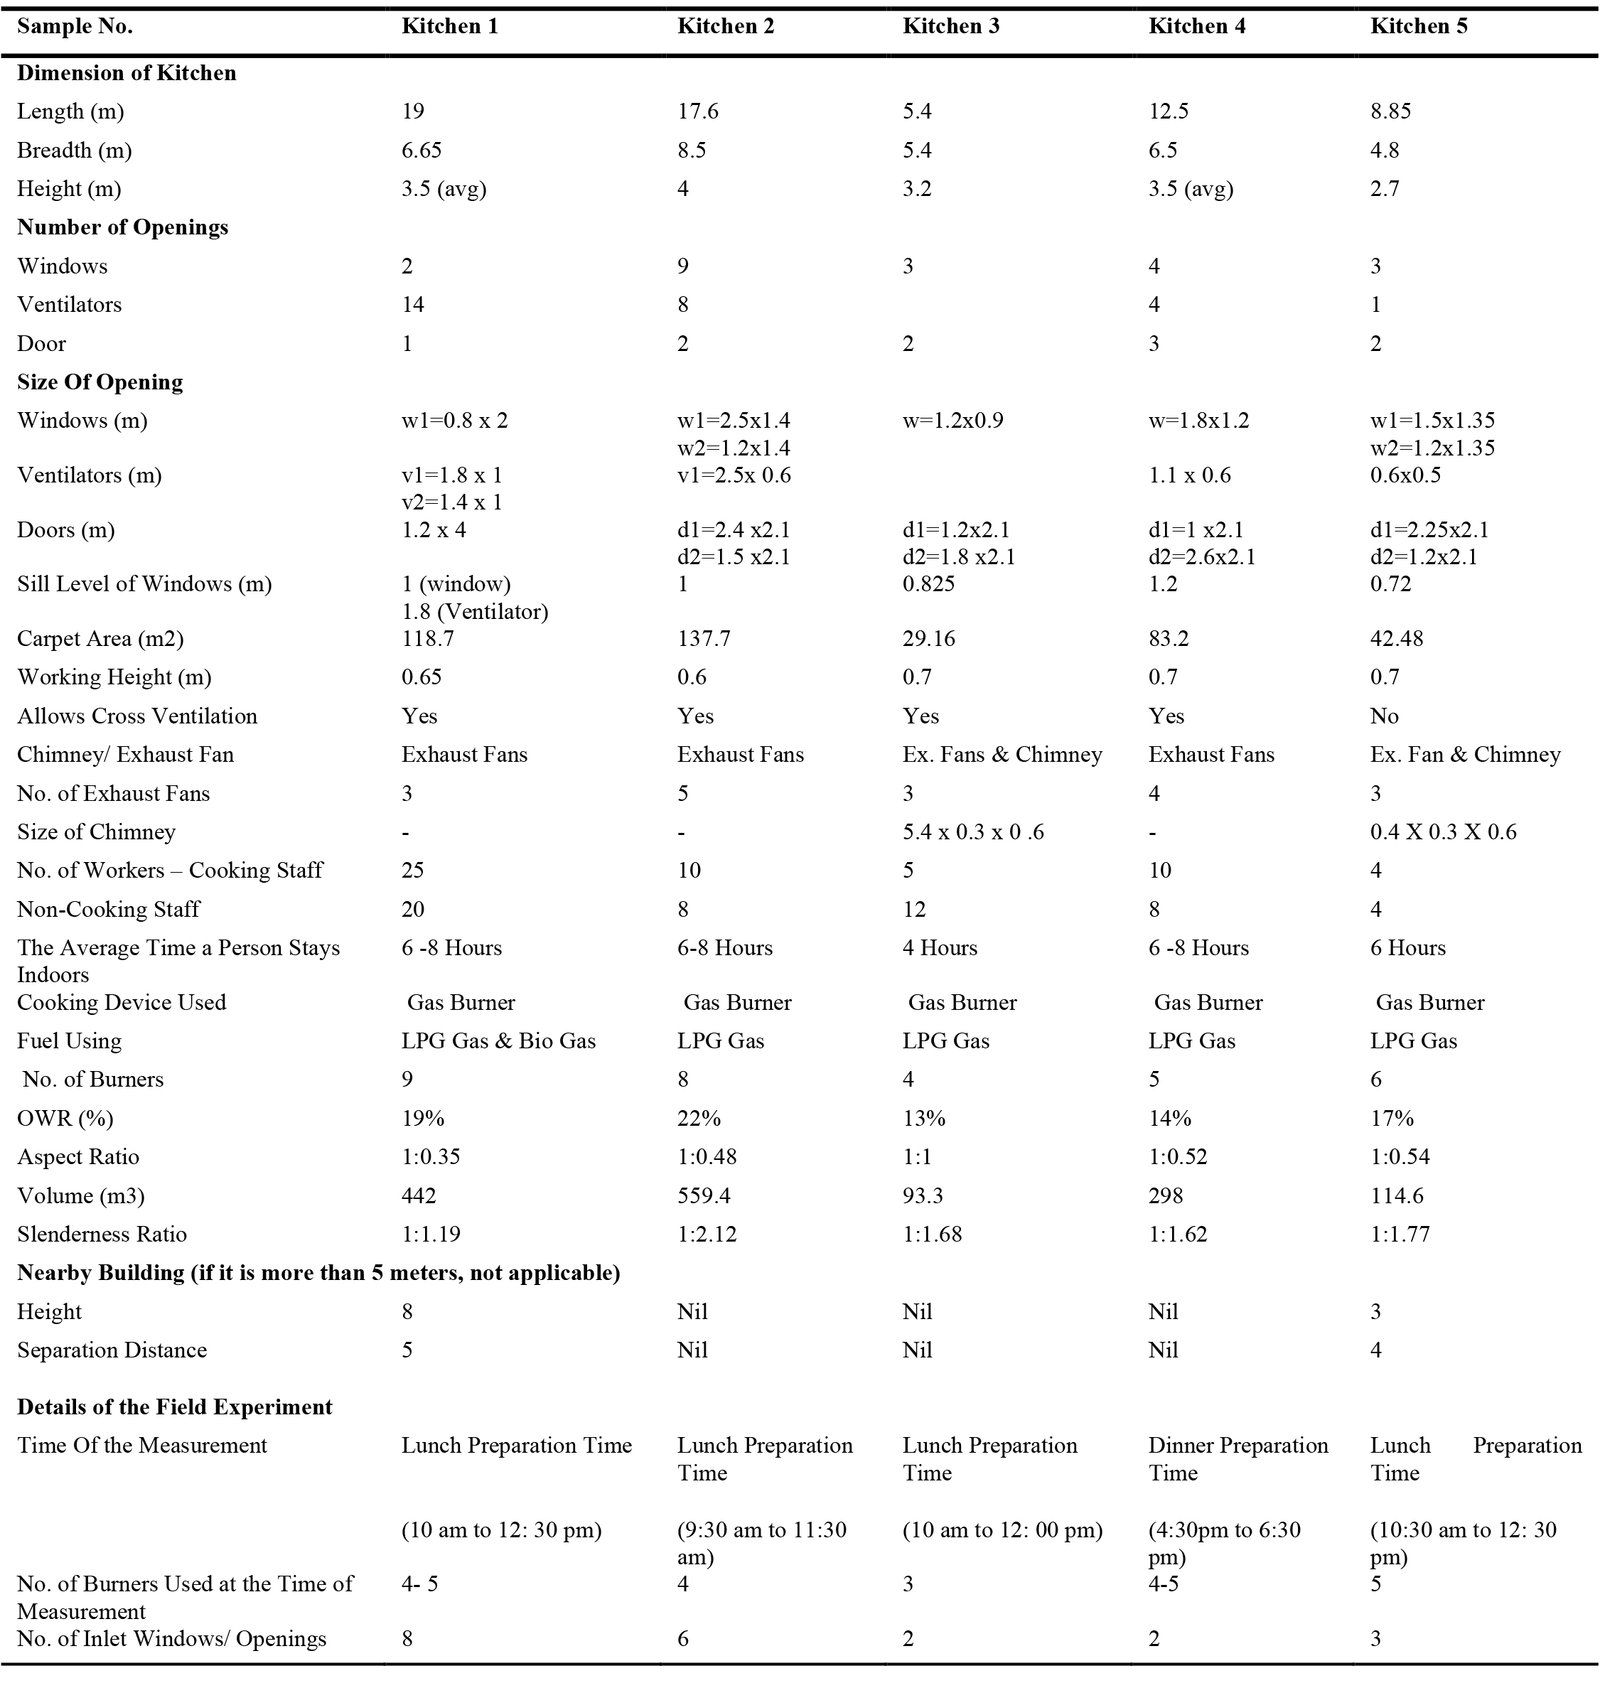
Table 1. Field data.
Figure 2
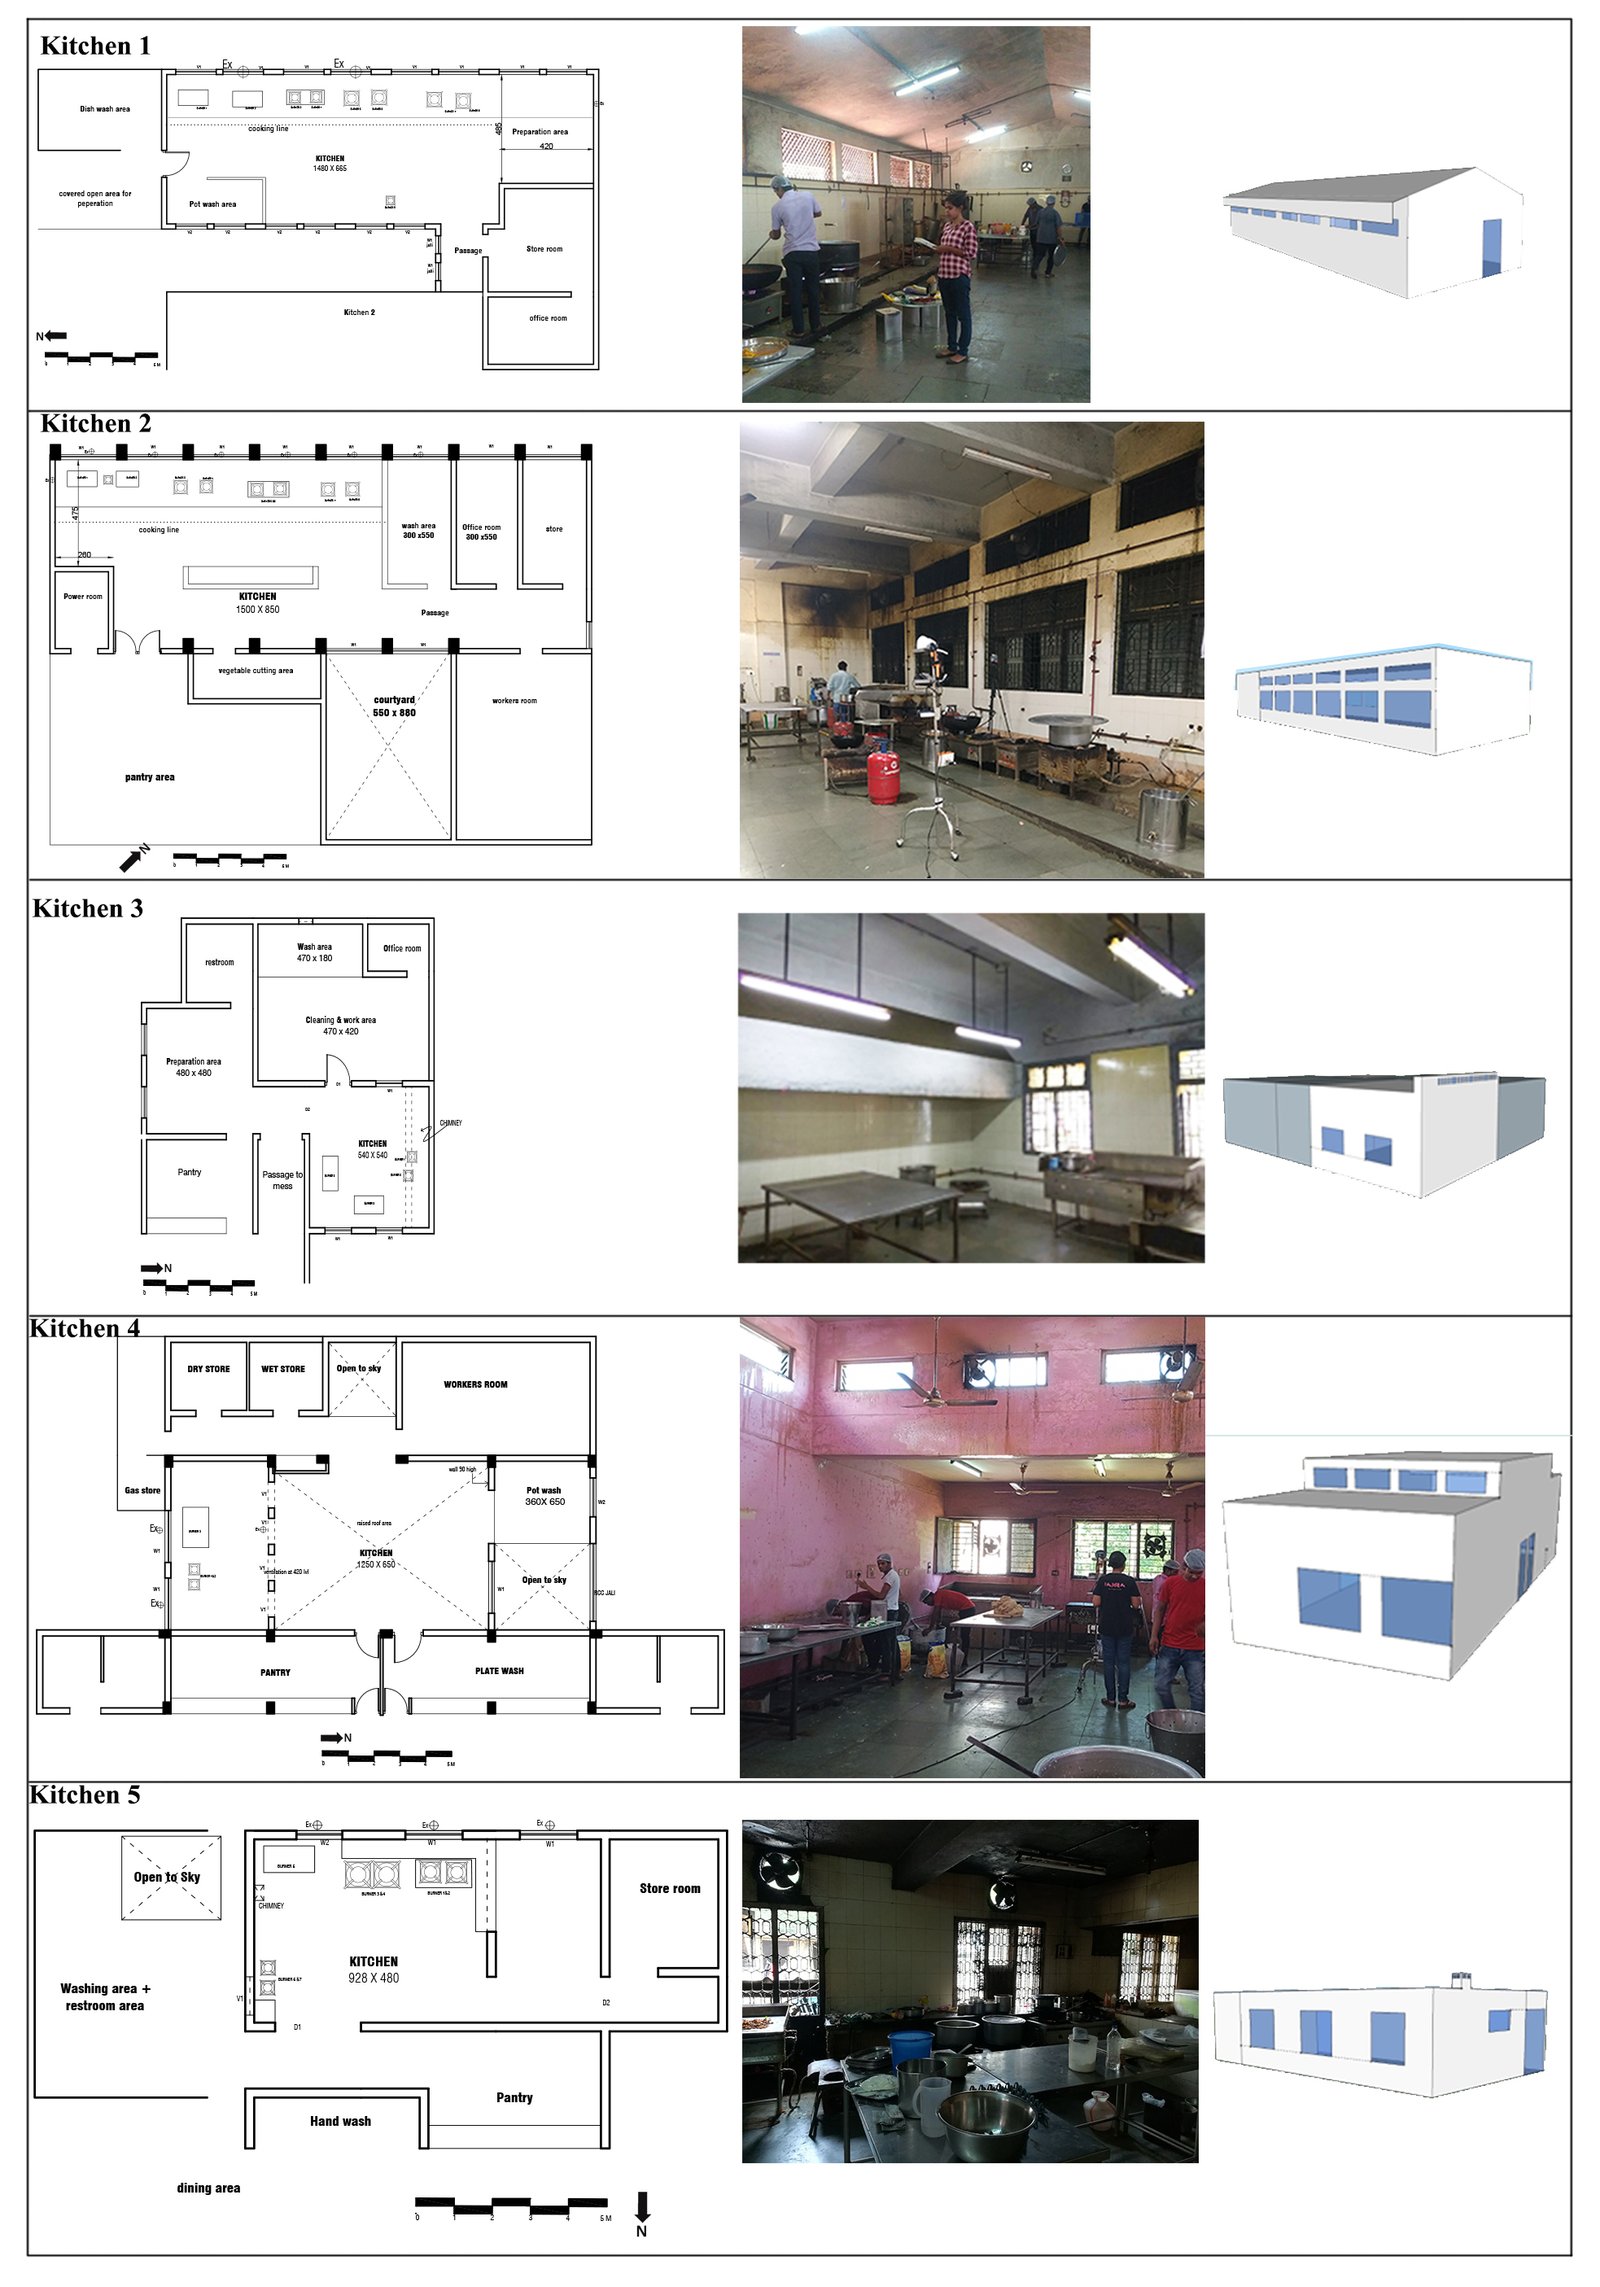
Fig. 2. Plan, photograph and 3D model of all kitchens.
2.2. Air quality indicators
Published studies have formulated various air quality indicators to assess the IAQ. The four most commonly used indicators of IAQ are the number of air changes (N), contaminant removal effectiveness (ε), ventilation effectiveness (Ev), and air exchange efficiency (εa) [36,37]. The air exchange efficiency is the most relevant indicator of IAQ for a point source of pollutants like cookstoves, and it is inversely proportional to the 'mean age of air.' [30,36]. The 'Local Mean Age of Air' is used to assess the freshness of air inside the building [30]. The average time taken by fresh air to travel from an inlet to any location of the space is defined as the 'local mean age of air' or "age of pollutant" within the space, or simply it is the average amount of time since fresh air or the pollutant entered the room [30,38-40]. Therefore, the age of air is a significant indicator of IAQ and the quality of ventilation in buildings [28,41,42]. The airflow pattern directly influences the 'Local Mean Age of air' (LMA) and the 'removal efficiency' of indoor contaminants [43]. The LMA is determined by building parameters and the indoor air pattern [44].
The research is divided into two sections: experimental and computational study.
2.3. Experimental study method
Field measurements were carried out to investigate the IAQ and ventilation performance of five kitchens. Airflow inside the kitchen and the concentration of major pollutants (PM2.5, PM10, and CO2) levels were measured to assess ventilation performance and IAQ, respectively. All field measurements were recorded during the usual working day without disrupting daily chores so that the measured values represent the IAQ and ventilation in actual working conditions. The experiment measurements were carried out in the last week of April. The experiments were performed during an extensive cooking activity period. Additionally, readings were measured 30 minutes before and after the cooking period. The values were collected either during lunch (10:00 am to 12:30 pm) or dinner (4:00 pm to 6:30 pm) cooking time.
The indoor airflow is recorded with the help of a Vane Thermo-anemometer (datalogger Model SD310) with a sampling rate of 1s and accuracy ± 2% + 0.2m/s. To measure the airflow inside the kitchen, the instrument was kept within an assumed buffer space of one cubic meter in the cooking zone, where the cooks are exposed to burner heat and effluents from the cooking activity. According to the study done by Saha et al. [4] and the author's onsite observation, the working height or the burner height is considered to be 0.6m from the floor finish. Similarly, 1.6m represents the breathing or nose level of cooks. Hence, the buffer area starts from 0.6m to 1.6m. The measurements were taken at different points in the buffer area at two horizontal planes (at a height of 0.6m and 1.6m from the floor) at an interval of 30 minutes.
The air velocity was also measured at various points on the cross-sectional plane of all windows. The average flow rate through the window was calculated by multiplying the effective inlet area and average velocity at the inlet. The effective inlet area is calculated based on the actual size of openings observed during the field measurements.
Air Changes per Hour (ACH) is the indicator for the ventilation performance of the kitchen. ACH is defined as "the number of times the indoor air is replaced by the outside air (which is assumed fresh and clean) per unit time, typically on an hourly basis," as given by Eq. (1) [45].
where Qv is the volume flow rate of air in m3/s, and Vroom is the volume of the indoor space in m3. The Qv (m3/s) is calculated using Eq.(2) [46,47].
where A [m2] is the opening area, Vinlet [m/s] is the air velocity at the center of the opening.
The IAQ is monitored with a handheld IAQ meter (Rave Indoor Air Quality Monitor-IAQ 3007R with an accuracy of ± 5%) by measuring CO2, PM2.5 & PM10, temperature, and RH. The instrument is set 1.5 meters away from the cooking stove and 1.5 meters above the floor to assess the cook's exposure, ensuring minimum interruption and reducing the probability of sensor over-saturation by allowing dilution with the surroundings [25]. The exhaust fans were switched off during the experiment to assess the effect of building parameters on natural ventilation.
2.4. Computational simulations method
CFD methods or numerical models are based on the discretized form of the Navier-Stokes equations on a grid of points coupled with turbulence modeling [4]. Compared to point data available experimentally, CFD analysis may provide detailed airflow information over the entire area [48]. CFD can analyze realistic indoor airflow and pollutant dispersion in buildings with complex geometry [34]. Combined with experimental methods, the CFD is the most widely used and can provide precise and reliable data about ventilation and IAQ performance [48]. Many studies used experimental studies combined with CFD methods to evaluate ventilation performance and IAQ [4,27,28,30,36,49,50]. CFD is preferred over field measurements for determining the LMA [51]. Therefore, the CFD technique is used in this study to analyze the air movement and LMA in each kitchen.
CFD analysis of five kitchens is carried out using IESVE (Integrated Environmental Solutions Virtual Environment). IESVE is a credible and reliable tool because it facilitates integration across various applications, delivering realistic and quick results on building performance [52-55]. It’s simple and easy input interface is another factor for the selection of this tool for the simulation study [53]. Pomponi et al. [56] verified the accuracy and reliability of IESVE by comparing the results against FLOVENT (a CFD software package). The IESVE software includes two simulation programs for evaluating indoor environment variables [57]. The first is named 'MacroFlo' and is based on the Flow Network Model (FNM) [58]. The second program, ' Microflo', is an integrated simulation program based on the 'primitive variable method' and utilizes the steady state three-dimensional convection-condition heat transfer model [59]. 'Microflo' allows importing boundary conditions from 'Apache Simulation' and to run internal simulations [57]. In this study, the CFD analysis tool 'Microflo' is used to examine the airflow field, air velocity field, and LMA of each kitchen.
2.4.1. Simulation process
The study generated a 3D format of each kitchen using the 'ModellT' application in IESVE. It is the model-building component of the Virtual Environment. 'ModelIT' is specifically developed to facilitate the integration of appropriate levels of complexity inside a model over all aspects of the design spectrum [60]. The example of 3D geometry created using ModelIT of Kitchen 1 is shown in Fig. 3.
Figure 3
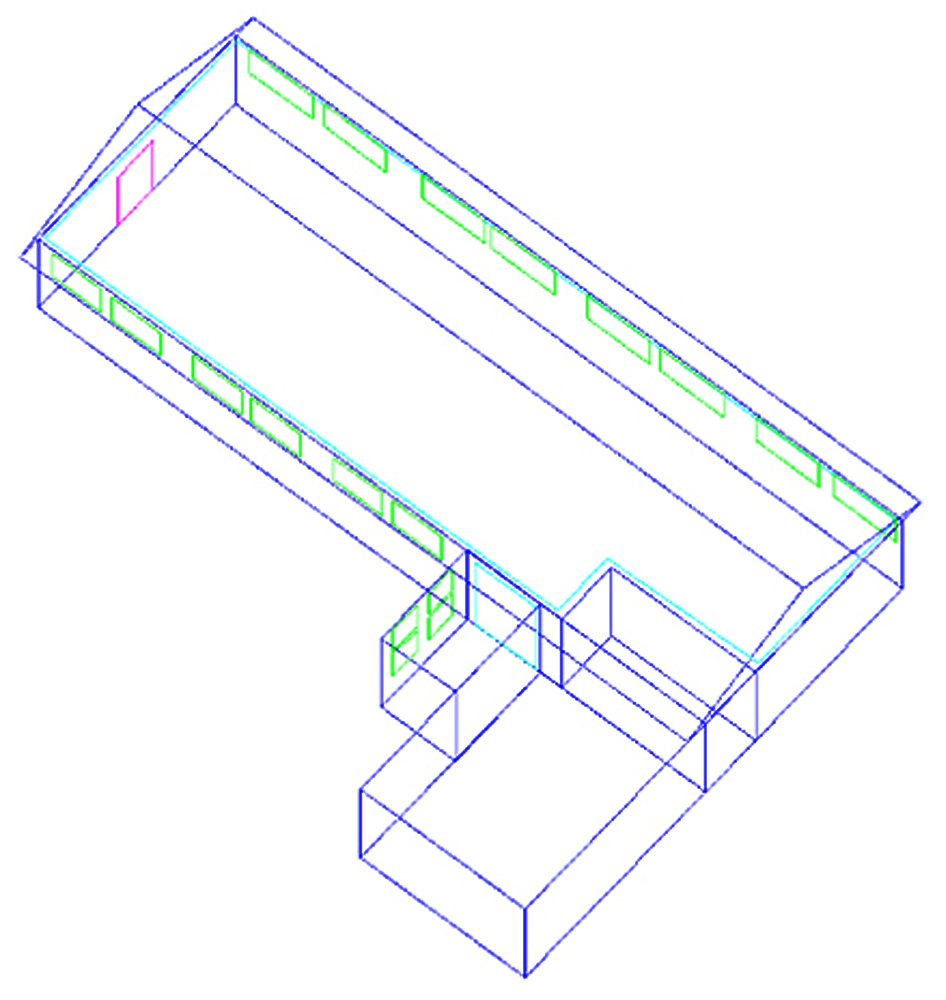
Fig. 3. 3D Geometry of kitchen created in 'ModelIT'.
The location and weather data of the site (Tiruchirappalli) were imported into the software. IESVE offers a dynamic thermal simulation program called "ApacheSim" based on mathematical modeling using the fundamental principles of heat transport systems inside and outside a structure [61]. The simulation uses real weather data and it covers any time period from a day to a year [62]. The 'MacroFlo' link, coupled with Apache simulation, gives information regarding the volume of inflow and outflow of each opening [58]. This was done to export the room surface temperature, room air temperature, and other information and variables as a boundary condition in the 'MicroFlo' simulation [59].
2.4.2. Boundary conditions for CFD model
The boundary conditions from the Apache simulation were imported into the 'MicroFlo' tool. The non-uniformity of the boundary temperatures of the interior walls, as assessed by IESVE, has the potential to enhance the precision of the indoor temperature readings [63]. The surface level boundary conditions, such as vents and openings, were added to the model. The solid heat source components were added in the domain to represent the burners in the kitchen. The temperature given for the solid source is 1240 K [4].
Grid Settings: The grid spacing and merging tolerance have been assigned to their default values. The merge tolerance enables grid lines separated by a distance less than the tolerance to be merged into a single grid line to reduce unnecessary gridding [59].
Turbulence Model: The domain's flow field has been computed using the k-ε turbulence model, the most widely accepted and utilized turbulence model [53,59,64,65]. The k-ε model calculates turbulent viscosity for each grid cell in the computational domain. This is accomplished by solving two additional partial differential equations, one determining turbulence kinetic energy and the other dissipation rate [59,62].
The field measurement day of each selected kitchen is used as the simulation date for that kitchen model. This helped to validate the simulation results with the experimental results directly.
2.5. Finding a relation between IAQ, ventilation performance, and building parameters
The experimental study analyzed the existing IAQ and ventilation performance of each kitchen. The LMA computed using CFD simulation is compared with building parameters to find the relation between IAQ, ventilation performance, and building parameters. The building parameters selected for the analysis are aspect ratio, slenderness ratio, OWR, and building volume [30].
2.6. Improved design of a kitchen
The study proposes modifications to the existing design of one selected kitchen (the kitchen having the least IAQ) to improve IAQ. Based on the findings from the investigation, some architectural design improvements have been incorporated into the computational model. The following revisions have been made.
Stage 1: Aspect ratio reduced.
Stage 2: Windows are added on the east and west walls at the working level.
Stage 3: Local exhaust ventilation (chimneys without fans) is added to the roof.
These revisions are illustrated in Fig. 4. CFD simulation studies were used to analyze these modifications.
Figure 4
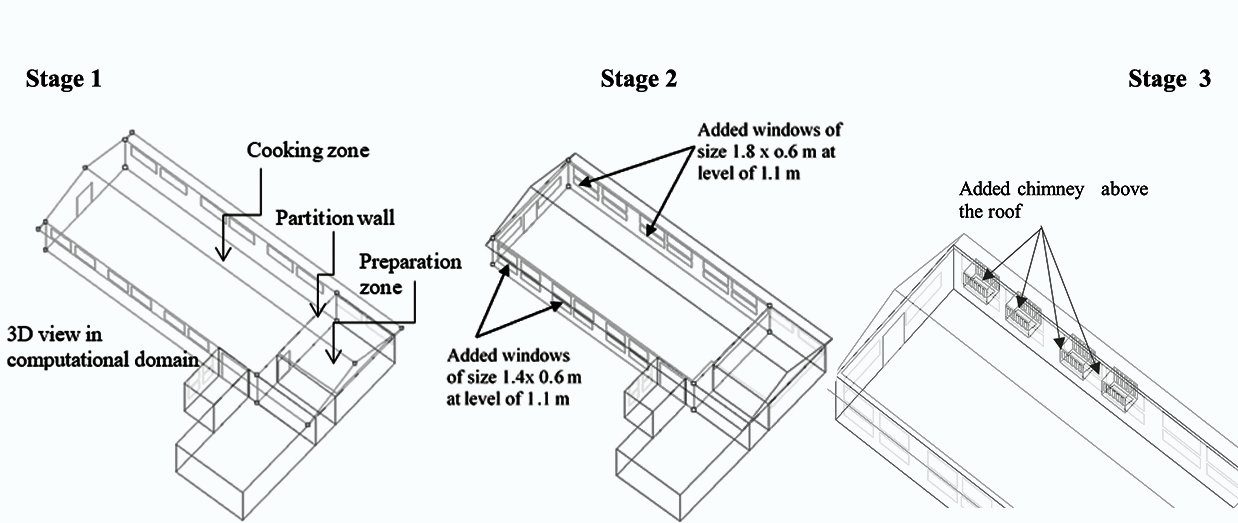
Fig. 4. Modification of an existing design.
3.Results and discussion
3.1. Experimental study
3.1.1. Ventilation performance of kitchens
The airflow at the cooking zone (at 0.6 m and 1.6 m levels) and ACH were determined to analyze the ventilation performance of each kitchen, as shown in Table 2.
Table 2
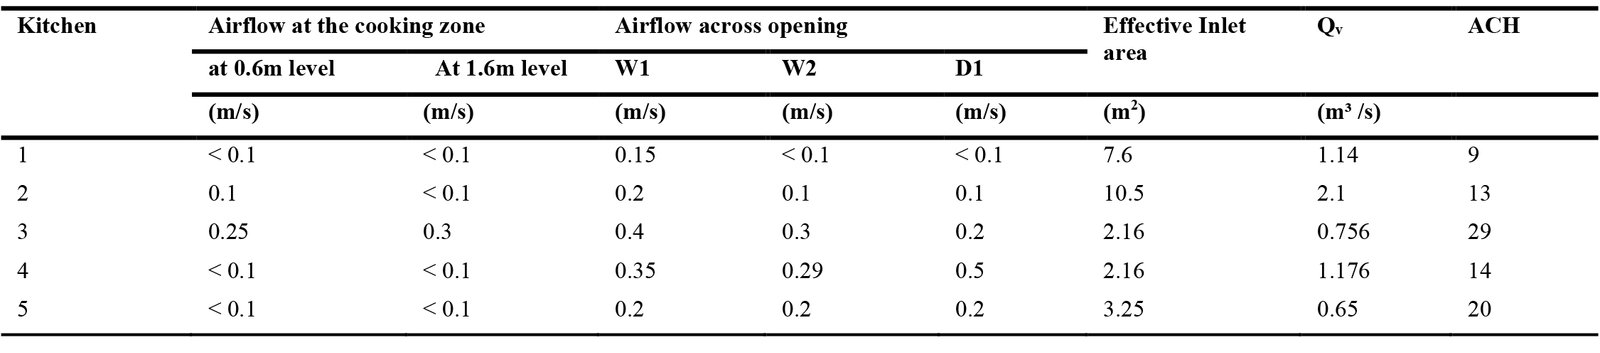
Table 2. Airflow at cooking zone & ACH.
Kitchen 3 has the highest number of ACH. Kitchen1 has the lowest rate of air exchange. All the kitchens except kitchen 3 experienced an airflow less than or equal to 0.1 m/s at the cooking zone at 0.6m level and breathing zone (1.6 m height from the ground). The minimum wind speed recommended by SP 41 for acceptable warm conditions of DBT 36°C, RH 40% is 2.7 m/s and DBT 35°C, RH 50% is 2.1m/s [66]. Overall, all the selected kitchens do not satisfy the minimum recommended wind speed.
3.1.2. IAQ in kitchens
To determine the IAQ, the concentration of PM2.5, PM10, and CO2, along with temperature and RH, were recorded during the cooking activity (Fig. 5). The maximum, minimum, and average value recorded in each kitchen is shown in Table 3.
Figure 5
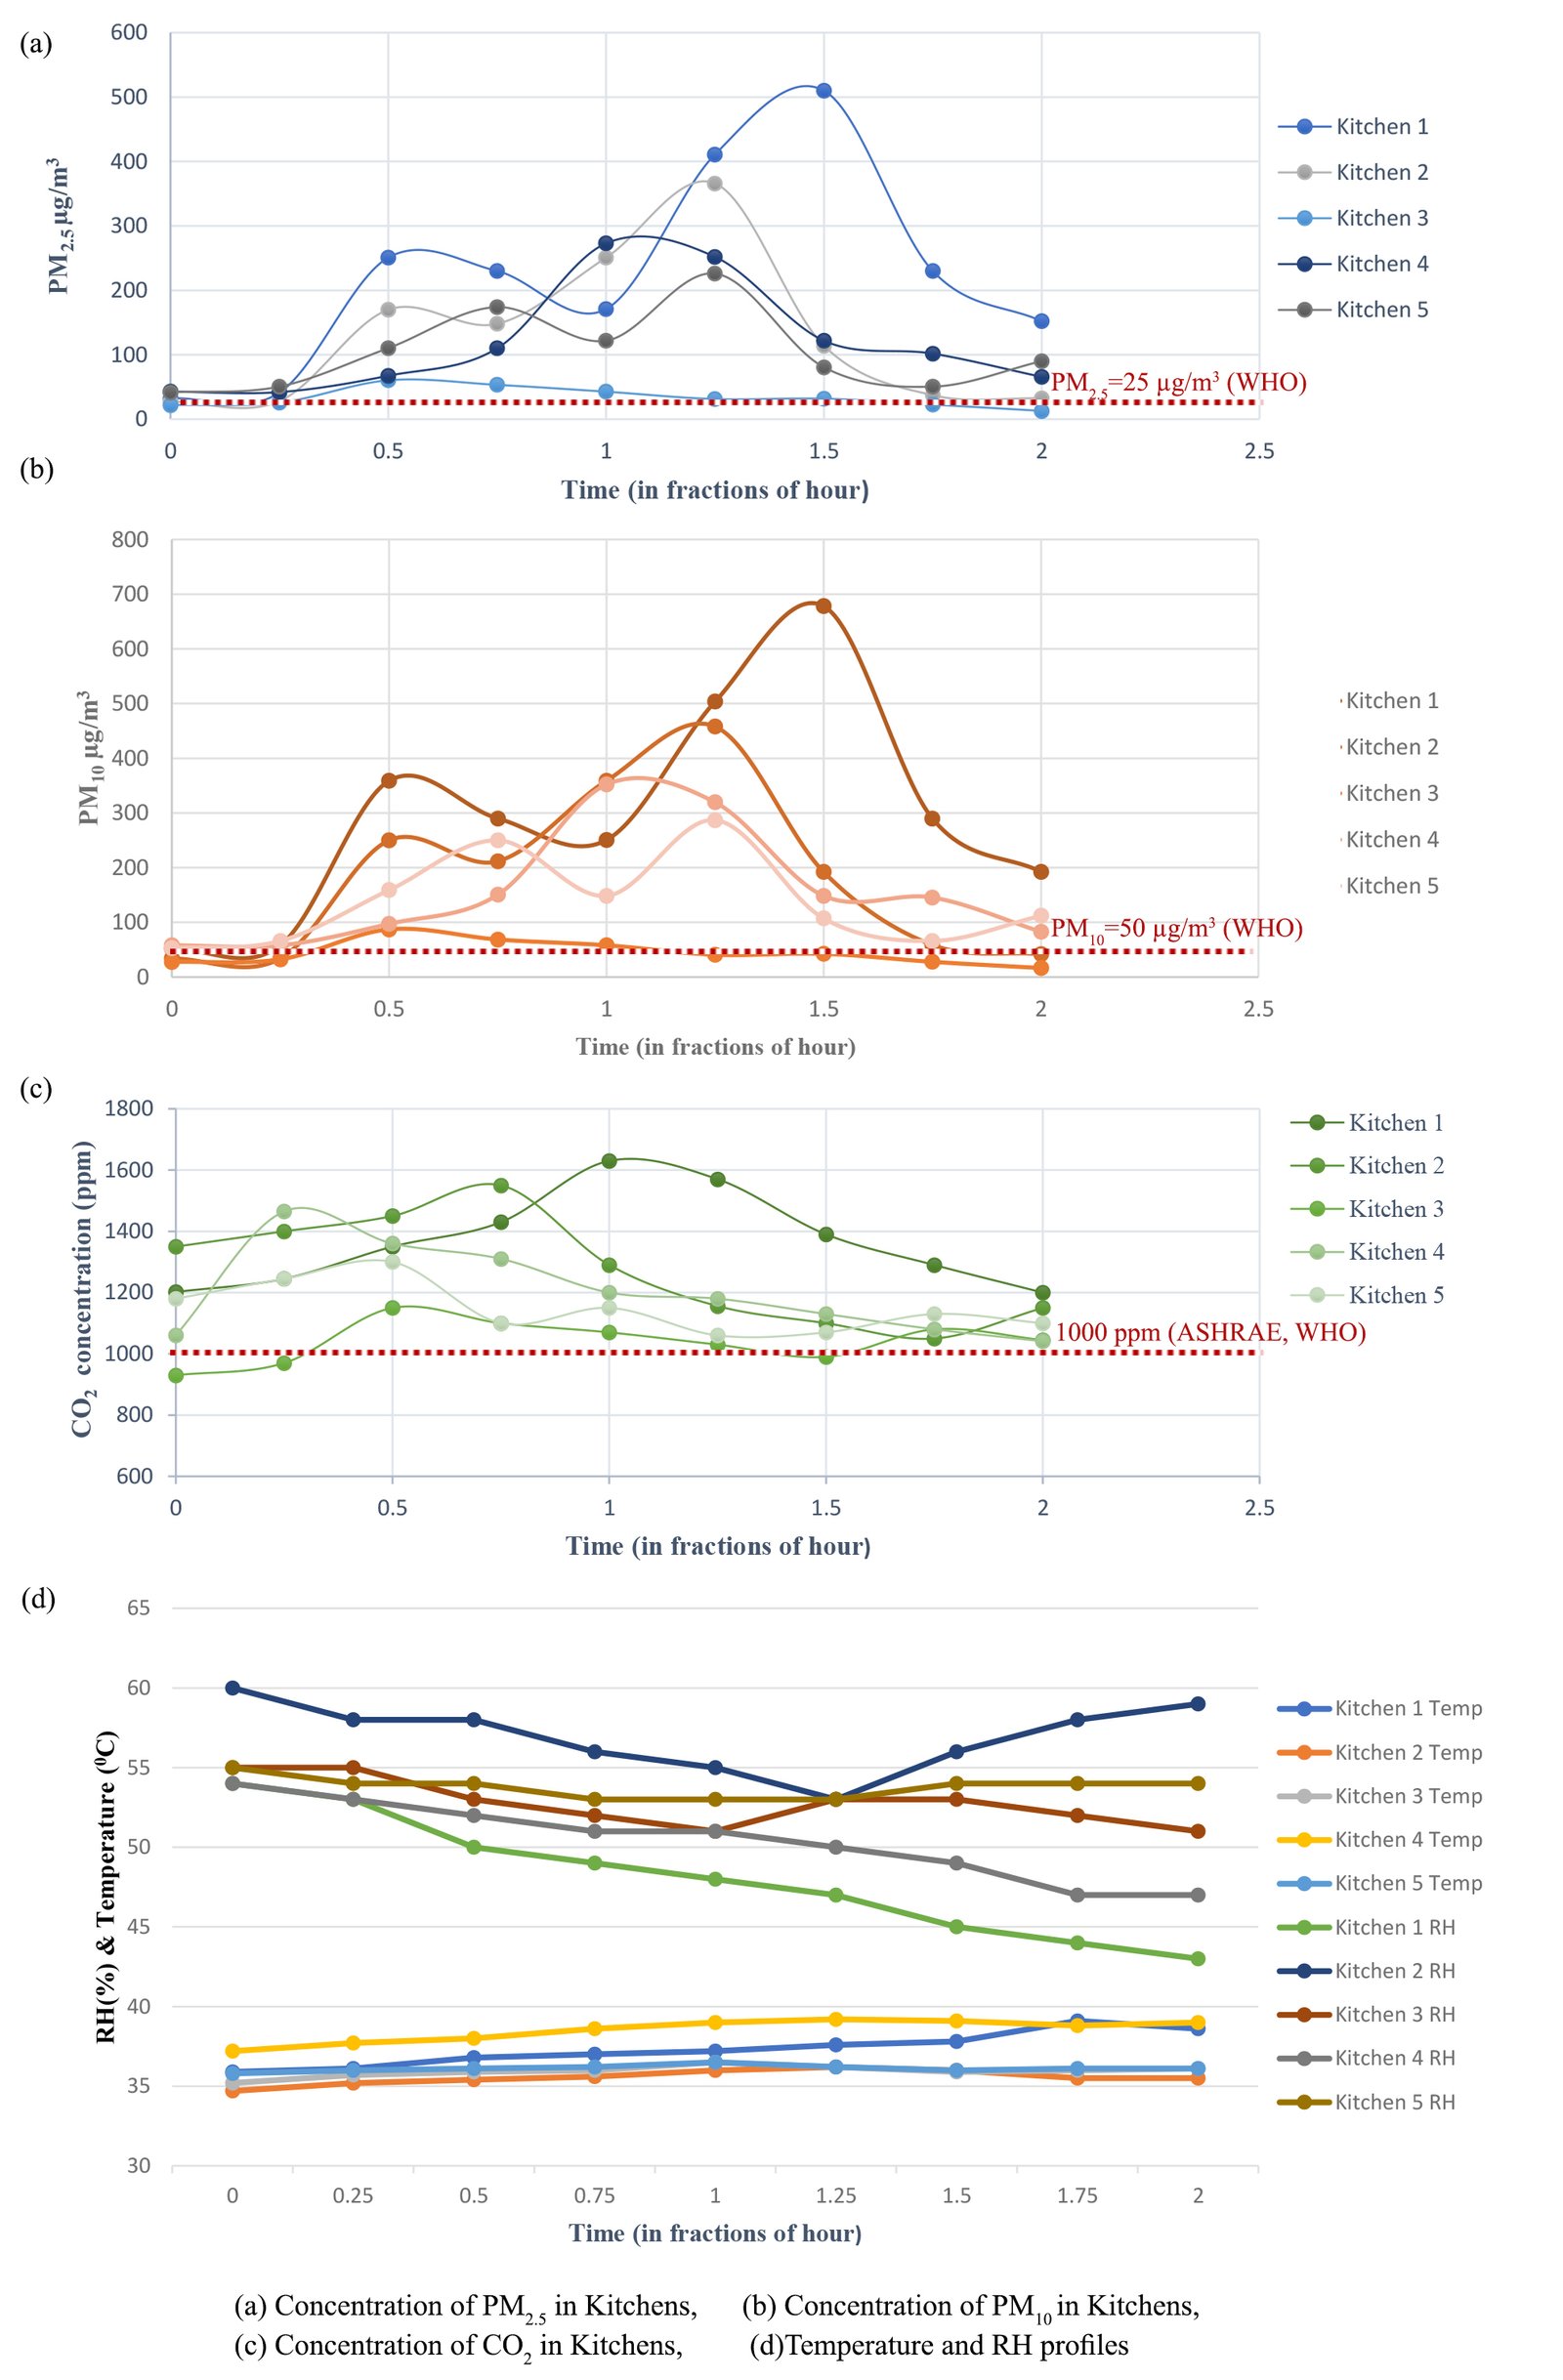
Fig. 5. The Field Measurement of PM2.5, PM10, CO2, Temperature, and RH in Kitchens.
Table 3
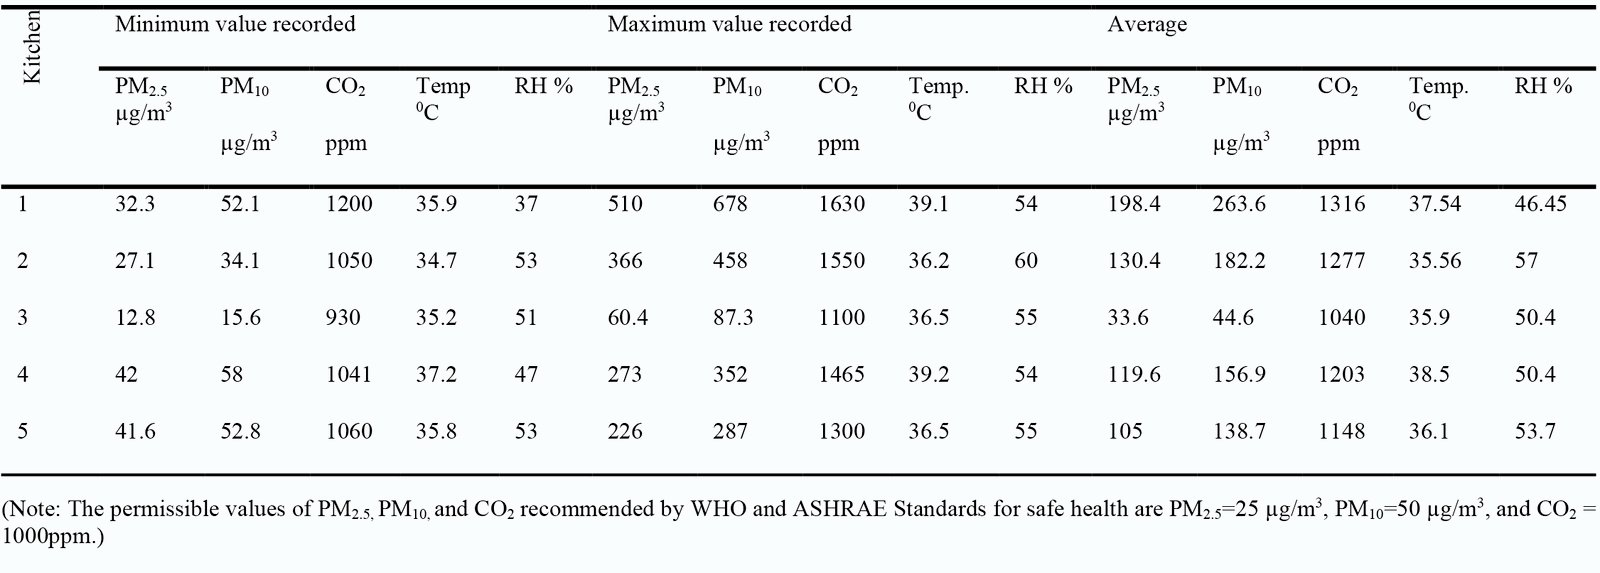
Table 3. Maximum, minimum, and average values recorded in the experimental study.
For all kitchens except kitchen 3, all recorded values of PM and CO2 concentration exceed the permissible value of PM2.5 = 25 µg/m3, PM10 = 50 µg/m3, and CO2 = 1000ppm recommended by WHO and ASHRAE for safe health [18,67-69]. These results indicate the possibility of health risks in these kitchens. In the case of Kitchen 3, the PM concentration recorded during the intensive cooking activity time (10:30 am to 11:30 am) exceeded the permissible safe value according to the ASHRAE standard and WHO. In kitchen 3, as the cooking started, the level of CO2 concentration started to increase and just exceeded the acceptable safe level (Fig. 5). The reported CO2 value was below the safe limit for the rest of the period. Among the selected samples, kitchen 3 was found to have the best IAQ, whereas kitchen 1 reported the lowest IAQ.
3.2. Validation of computational model
The air velocity values observed in the CFD simulation were compared with experimental data collected. Comparisons were made regarding the air velocity at three distinct locations (0.6m and 1.6 m in the cooking zone and at window opening inlets), which were determined by the measurement points of the experimental study. Figure 6 compares the measured and simulated air velocity findings at three distinct points in each kitchen, demonstrating a similar trend between experimental and CFD simulation, albeit with some deviations. The similar trend in the values of air velocity at both the levels in the cooking zone and inlet window in both experimental and CFD analysis validate the computational model (Fig. 6). The Mean Absolute Error (MAE) and Root Mean Square Error (RMSE) were calculated for the 3 cases using Eq. (3) and (4) and shown in Table 4.
MAE and RMSE are statistical quantities to evaluate the similarity or difference between two data sets and have been used in similar previous studies [70-73]. The MAE values for points a, b, and c are 0.047, 0.064, and 0.108, respectively, and all were within a range of ±11%. The RMSE values for points a, b, and c are 0.079,0.087, and 0.148, respectively, and the average of the obtained RMSE value is 0.104, which is considered acceptable. The highest percentage of error is observed at the inlet point, and this aligns with previous literature indicating that steady-state simulation is inadequate for predicting airflow fluctuation in openings [74-76].
Figure 6

Fig. 6. Experimental vs. computational simulation air velocity for all kitchens.
Table 4

Table 4. Mean Absolute Error (MAE) and Root Mean Square Error (RMSE) between the simulated and measured values.
3.3. Computational study: ventilation performance and LMA of kitchens
In this study, the LMA was expressed as an indicator of IAQ and ventilation performance. The air velocity, airflow pattern, and LMA in the simulated models are given in (Figs. 7-11).
Figure 7
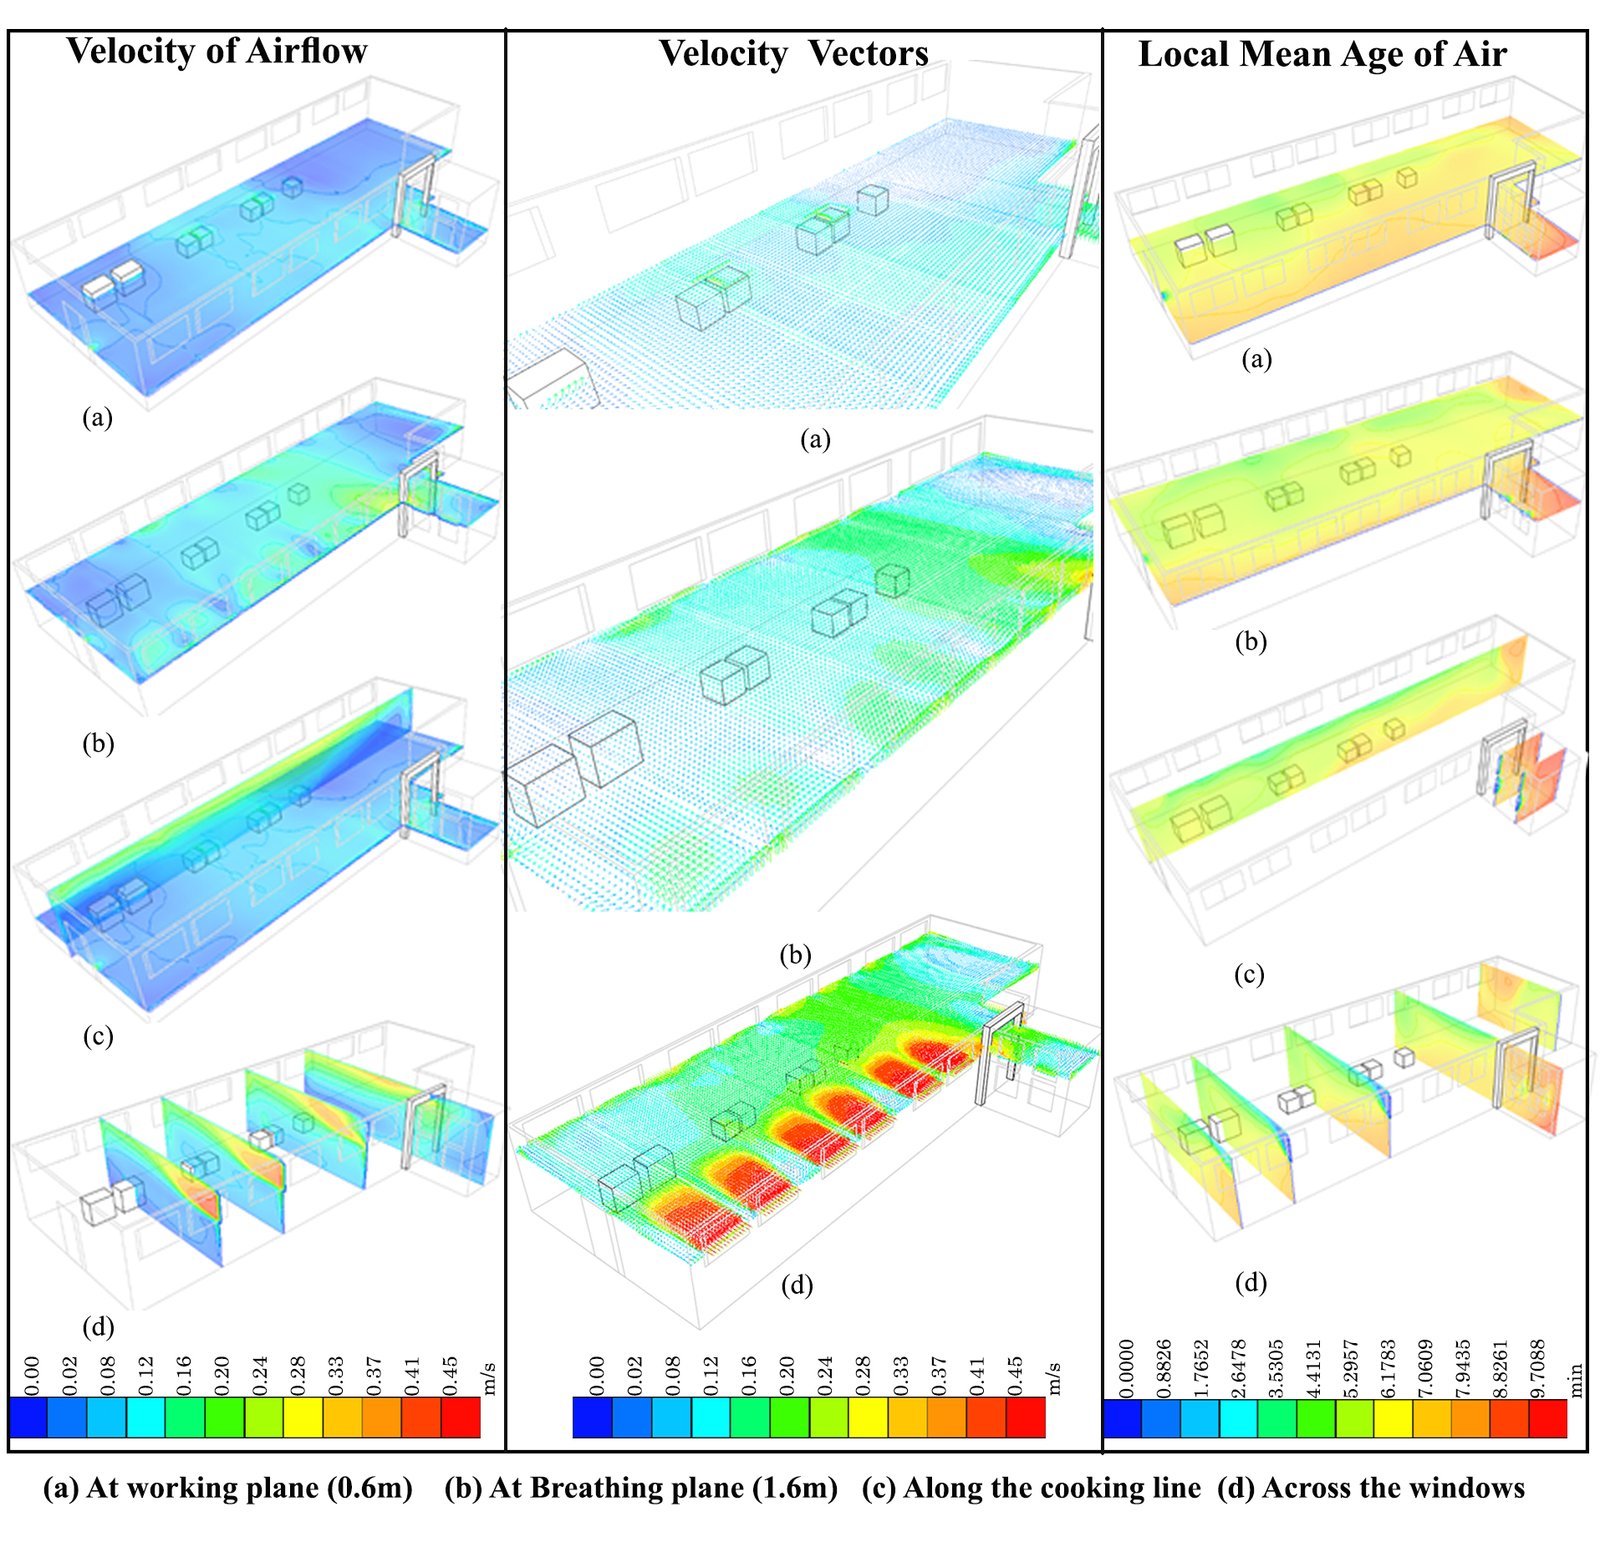
Fig. 7. Velocity field, velocity vector, and LMA of Kitchen 1.
Figure 8
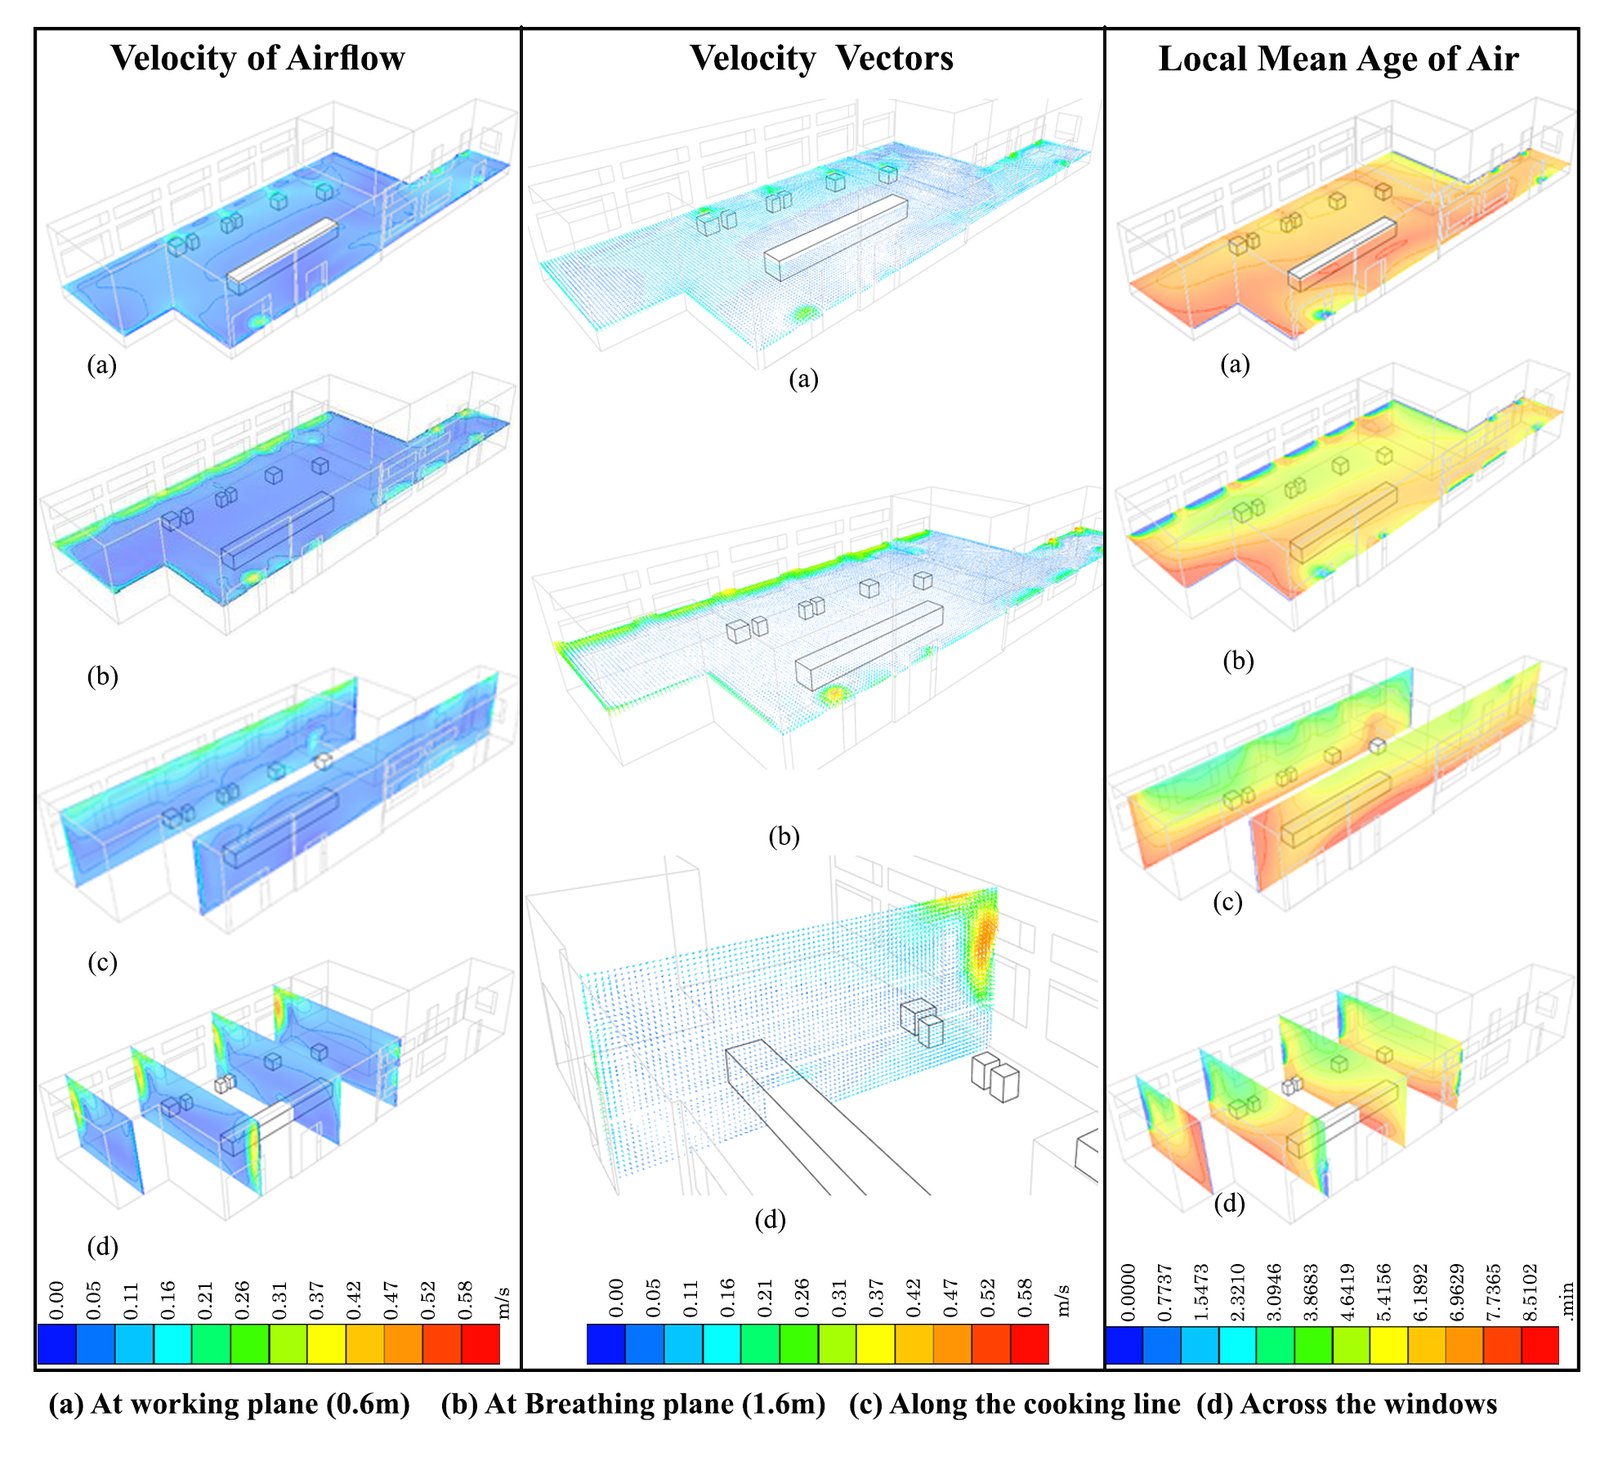
Fig. 8. Velocity field, velocity vector, and LMA of Kitchen 2.
Figure 9
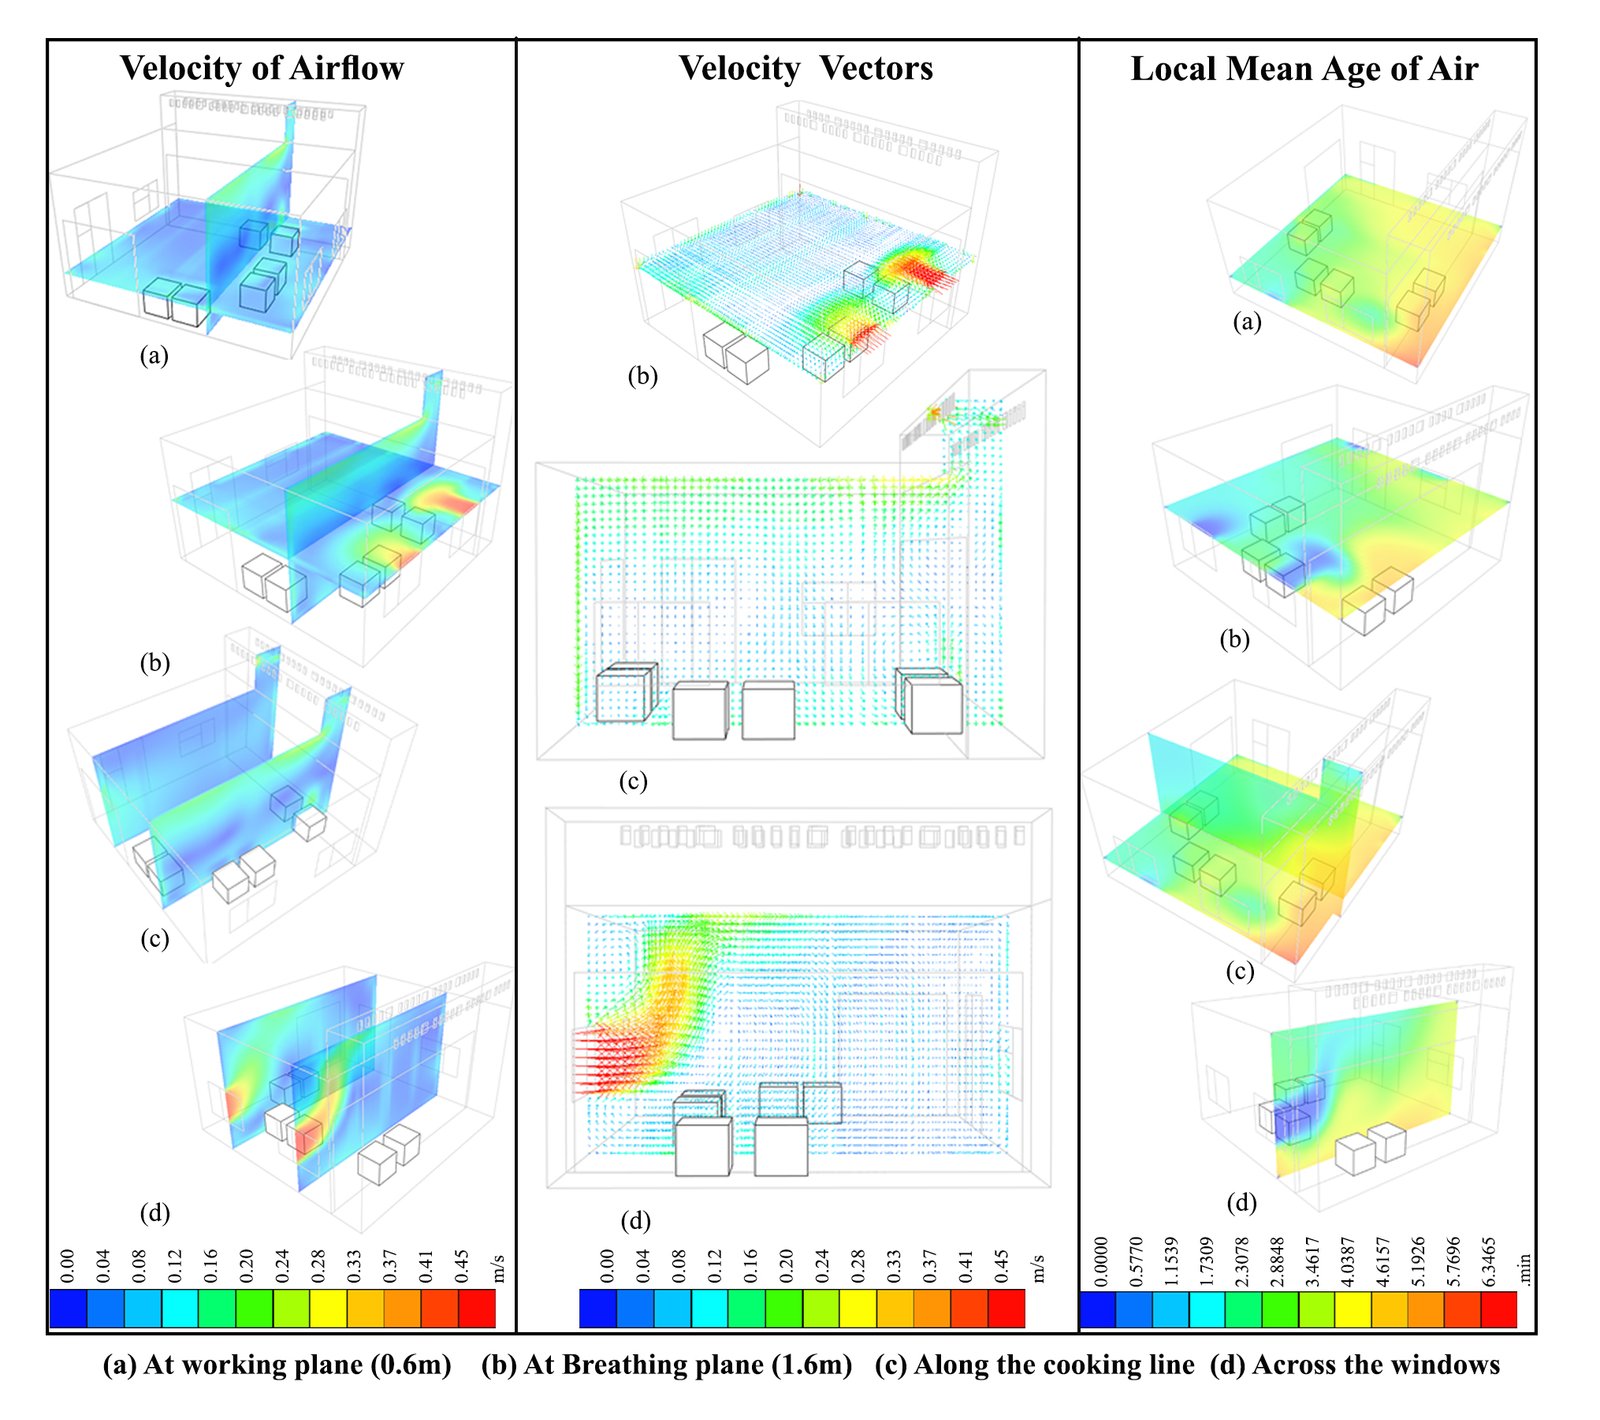
Fig. 9. Velocity field, velocity vector, and LMA of Kitchen 3.
Figure 10
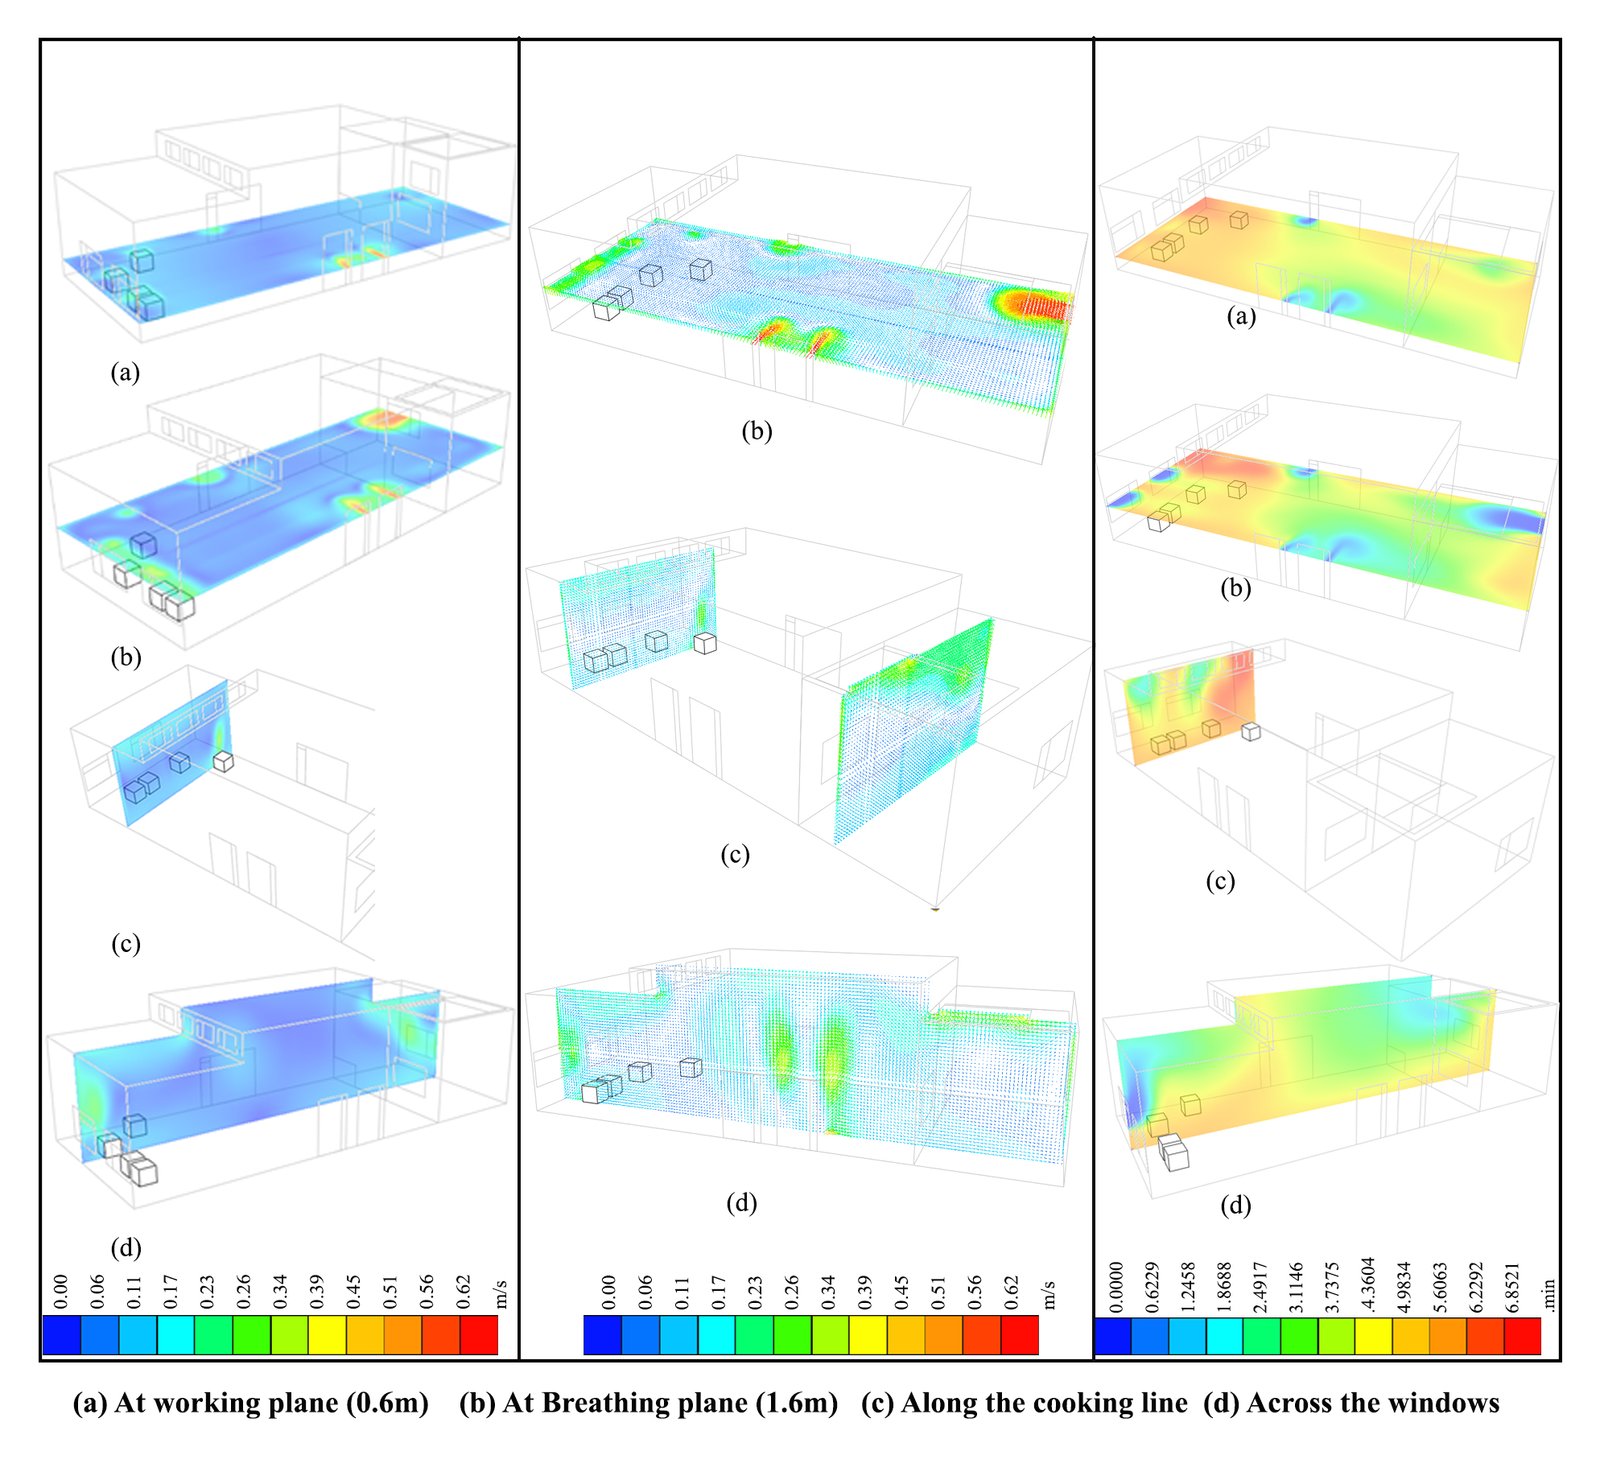
Fig. 10. Velocity field, velocity vector, and LMA of Kitchen 4.
Figure 11

Fig. 11. Velocity field, velocity vector, and LMA of Kitchen 5.
The west side windows in kitchen 1 act as inlet openings. The air velocity at the working and breathing plane ranges from 0.08 to 0.12 m/s. Visual analysis of simulation results and air velocity patterns at the working plane shows minimal fresh air circulation in the cooking zone (Fig. 7). Further, the LMA ranging from 6.1 to 7.1 minutes in the cooking zone indicates higher air stagnation.
The windows on the northwest side of kitchen 2 are the primary source of air inflow. The air velocity at the working plane is 0.11 m/s. The maximum air velocity of 0.21 m/s is experienced near the burner (Fig. 8). Further, an increased air movement is observed near the northwest side windows. The air entering from the window and exiting through the ventilator has no significant effect on the air movement in the cooking zone. The kitchen does not have adequate cross ventilation. The cooking zone has an LMA ranging from 5.4 to 6.1 minutes, which is reduced to 0.5 minutes near the windows (Fig. 8). The higher value of LMA in the cooking zone indicates a high stagnation of air.
The windows on the east side wall of kitchen 3 mainly contribute to the air inflow. The air velocity at the working plane ranges from 0.04 to 0.12 m/s (Fig. 9). The air velocity at the breathing plane ranges from 0.04 to 0.45 m/s, and the maximum value is observed near the east window, which is 0.45m/s. The average velocity inside the kitchen is 0.1 m/s at breathing level, excluding the area near the windows. Kitchen 3 has a chimney as a general or dilution ventilation system for expelling the air. The air enters from the east side window and exits through the window and door placed on the opposite wall and the chimney. Kitchen 3 is experiencing cross ventilation in the cooking zone. The LMA in the cooking zone ranges from 2.8 to 4 minutes (Fig. 9).
The air in Kitchen 4 enters through the window near the cooking zone and exits via the ventilators (Fig. 10). However, cross ventilation is not effective in the cooking zone. The air velocity at the working and breathing plane ranges from 0.06 m/s to 0.11m/s. The LMA in the cooking zone ranges from 4.98 to 6 minutes (Fig. 10). According to the CFD analysis, kitchen 4 has a low fresh air flow in the cooking zone, resulting in relatively high air stagnation.
The windows in kitchen 5 placed on the southern wall act as air inlets. There is a relatively smaller chimney (compared to kitchen 3) at the southeast corner. Airflow examination reveals that the air entering through the window rises above the cooking zone and spreads in various directions. A relatively minor portion of air exists through the chimney. High turbulences in the air are observed near the window and above the burners (Fig. 11). The cooking zone has an LMA ranging from 4.6 to 5.4 minutes. As a result, air stagnation is high. The highest LMA of 8 minutes is observed at the passage near the store area. The lower value for the LMA (almost zero) is observed near the chimney (Fig. 11).
3.4. Relation between IAQ, ventilation performance, and building parameters
The LMA calculated in CFD analysis is compared with the building parameters (aspect ratio, slenderness ratio, OWR, and kitchen volume) illustrated in Fig. 12.
Figure 12
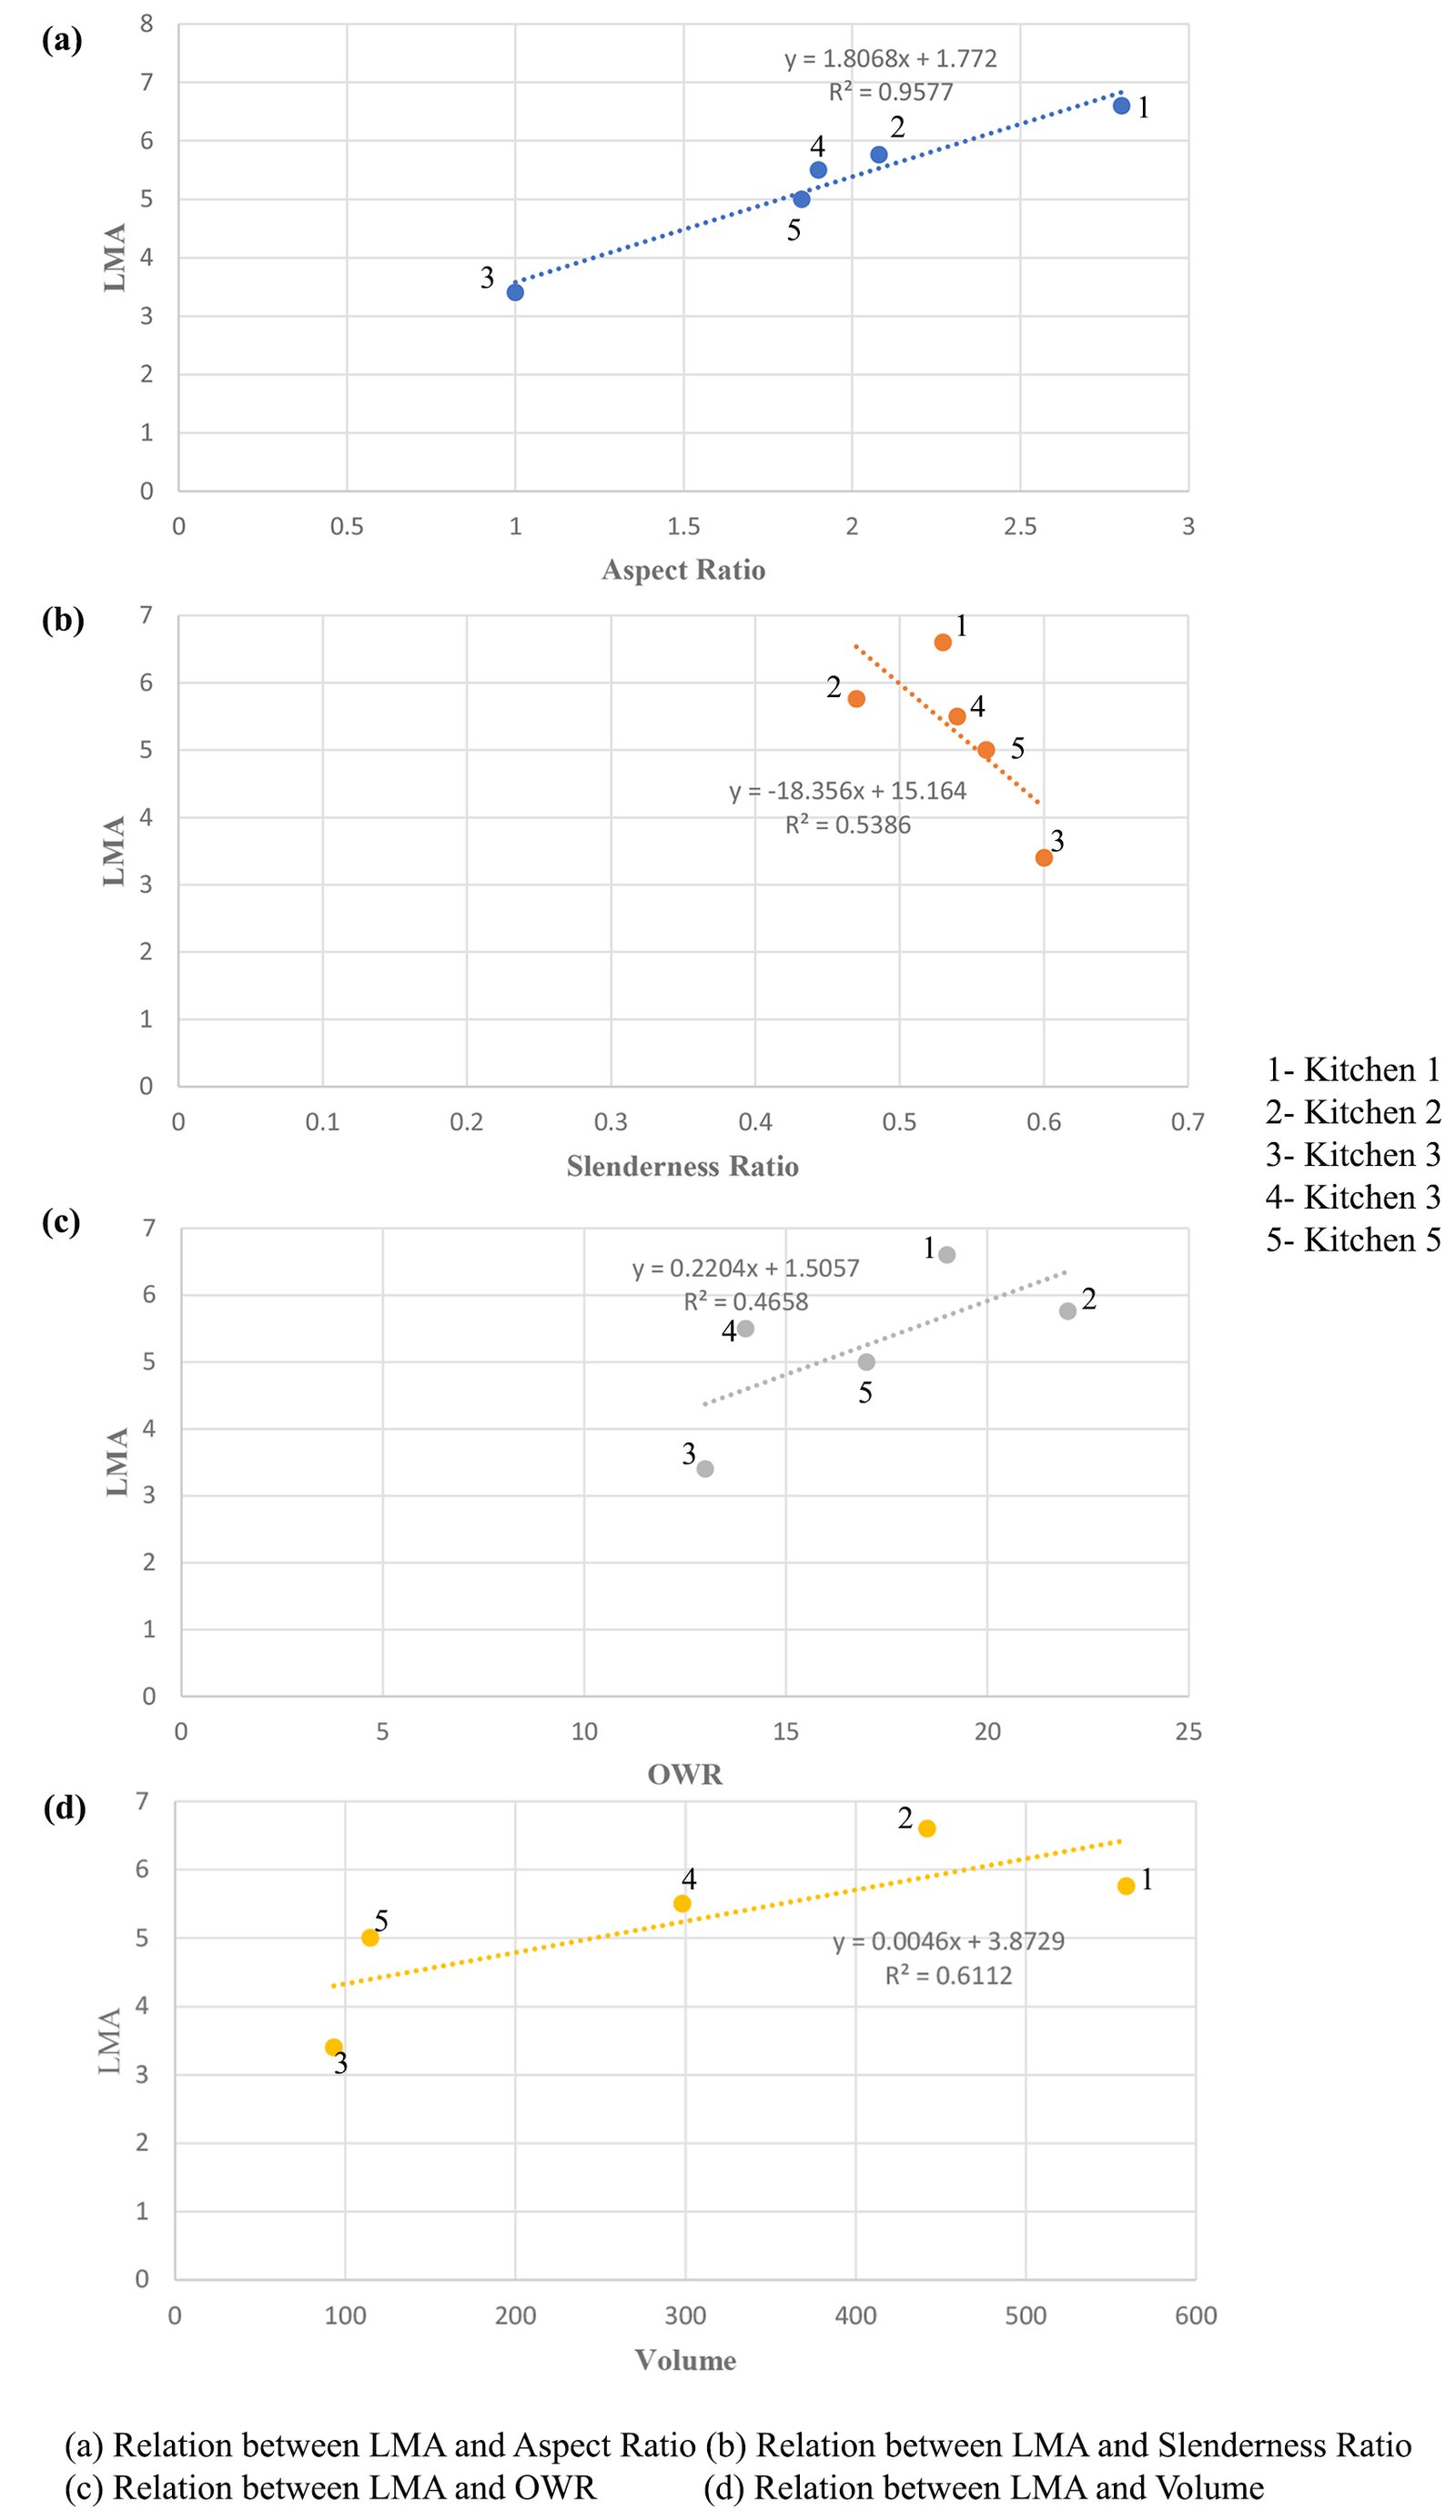
Fig. 12. The empirical relation between building parameters and the LMA.
It is observed that all the studied building parameters had a relation with the LMA. The kitchens with a higher aspect ratio have a longer duration of air accumulation (LMA) than those with a lower aspect ratio. The kitchens with a higher aspect ratio accumulate older air than kitchens with a lower aspect ratio, indicating that LMA increases with the aspect ratio. However, kitchens with a lower slenderness ratio accumulate older air. The study observed a rising trend in the LMA with higher OWR; however, the correlation coefficient is much lower. Moreover, the LMA increases with the room's volume.
Building design has a vital role in sustaining air exchange efficiency. It is observed that the LMA is increased with a higher value of aspect ratio, volume, and OWR and decreased with a higher value of slenderness ratio.
Debnath et al. [30] found that increasing the OWR increases air exchange and decreases the accumulation of air in space. However, even though kitchen 2 has a substantially higher OWR than other kitchens, the IAQ is poor, and the LMA value is high. Further, kitchen 3 has the lowest OWR ratio and better IAQ. The results suggest that, in addition to the OWR, kitchens with local exhaust ventilation, like a chimney, were found to have better IAQ due to higher ACH. Moreover, the combination of a low aspect ratio, a high slenderness ratio, and a small volume can be responsible for better IAQ. The results (of kitchen 5) also show that vents or chimneys in the kitchen enhance the ACH and IAQ. Therefore, despite having a lower OWR and all its windows on the same wall, which limits the possibility of cross ventilation, kitchen 5 has a lower LMA than kitchens 1, 2, and 4. Kitchen 5's small aspect ratio, volume, high slenderness ratio, and presence of a chimney can be attributed to better IAQ.
Another essential factor that can lead to a decrease in the LMA is the position of windows, which is the main driver behind adequate cross ventilation. Windows placed near the cooking zone and the working level enhances the air movement at the cooking zone. Saha et al. [4] examined the impact of strategically placing two windows of sufficient size on reducing CO2 and CO levels within large institutional kitchens, resulting in improved IAQ. The higher LMA in kitchens 1 and 2, despite higher OWR, can result from the position of windows. There is good air movement in kitchen 1 at a height above 1.6 m (from the floor level) due to the high OWR and windows positioned on opposite walls. Unfortunately, this has less impact on the cooking zone, resulting in low IAQ (Fig. 7). Kitchen 2 has the highest OWR, about 22%; however, all windows are on one side. Therefore, air movement through windows has little effect on the cooking zone (Fig. 8). Air entering through the window moves upward and escapes through the ventilators on top of the windows. Kitchens 1 and 2 feature a higher aspect ratio and volume and a lower slenderness ratio. In the experimental investigation, these kitchens were observed to have greater concentrations of PM2.5, PM10, and CO2 in the cooking zone than in other kitchens (kitchens 3, 4, and 5). The ventilators in Kitchen 4 enhance the cross ventilation in the space, thereby increasing the ACH and reducing the LMA, which agrees with the study done by Whelan [25] on the significance of cross ventilation in kitchen space to improve IAQ.
Kitchen 3 has better IAQ compared to other kitchens due to its small aspect ratio, high slenderness ratio, position of windows, and presence of a chimney. These results suggest that the LMA in the kitchens is influenced by building parameters such as aspect ratio, slenderness ratio, volume, window location, and local exhaust ventilation systems such as chimneys. Thus, low aspect ratio and volume, high slenderness ratio, the existence of cross-ventilation at the operational level, and the presence of vents or chimneys have the potential to increase the IAQ by decreasing the LMA inside the naturally ventilated building. Therefore, sustaining the good IAQ of naturally ventilated kitchens depends significantly on the building design. Such actions can potentially improve air exchange efficiency, thereby ensuring good IAQ.
4.Improved design of a kitchen
The modifications to kitchen 1 (with the lowest IAQ) have been analyzed using CFD simulation. The main findings from the computational study are shown in Fig. 13.
Figure 12
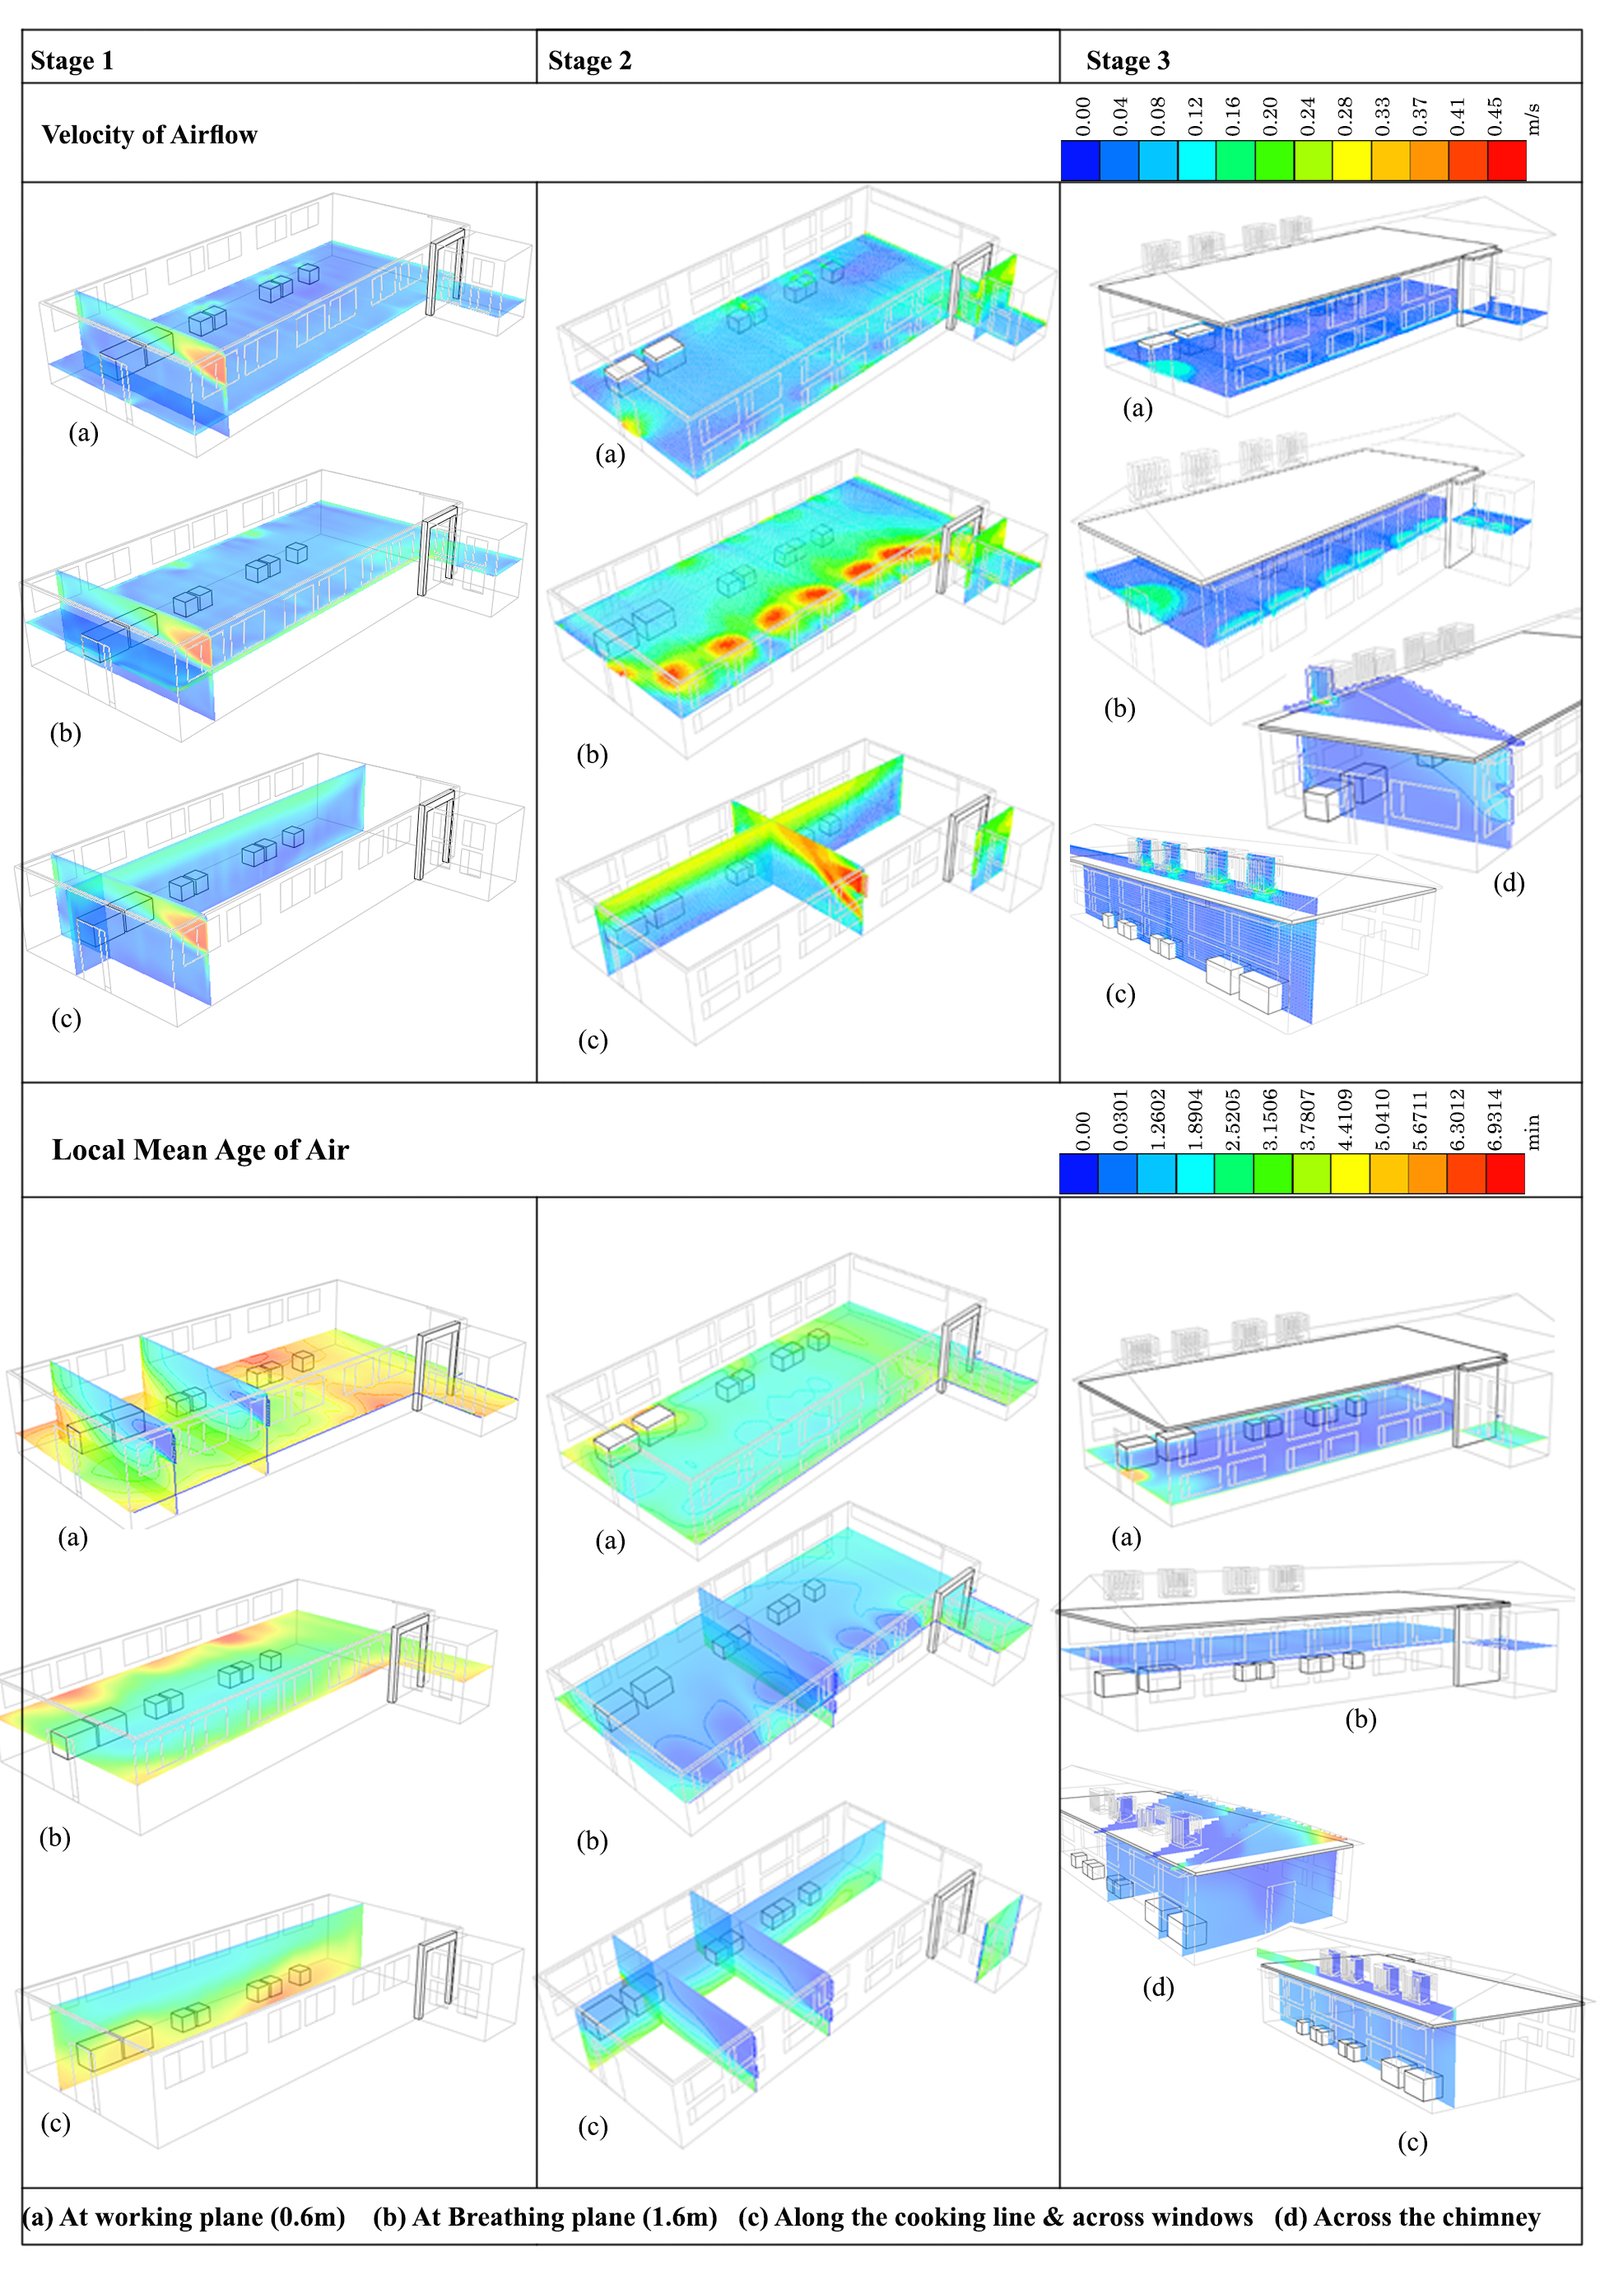
Fig. 13. Velocity of airflow and LMA of different stages of modification.
Stage 1: The aspect ratio of the existing design is reduced by making a partition wall between the preparation zone area and the cooking space (Fig. 4). The air velocity in the cooking zone remained the same. However, the LMA is reduced to 4.7 minutes at the working level and 2.5 minutes at the breathing level (Figs. 7 and 13). The average value of the LMA present at the cooking zone is 3.6 minutes (Fig. 13).
Stage 2: The windows are added on the east and west walls at a sill level of 1.1m. Six windows evenly distributed below the ventilators were added as air outlets (of size 1.8 m x 0.6 m) and inlets (of size 1.4 m x 0.6 m) on the west and east walls, respectively (Fig. 4). The total area of the inlets and outlets is kept to 30 percent of the floor area, as recommended by SP 41-1987 [66]. The results are shown in Fig. 13. The total air movement in the kitchen has increased. Specifically, the air velocity at the cooking zone is increased to a range of 0.12m/s to 0.2 m/s. However, the air velocity near the burner was only about 0.04m/s. Thus, this airflow pattern has a minimal effect at this functional level, which is preferred to keep fire in the burner. The LMA was reduced to about 2 minutes at the working level and 1.6 minutes at the breathing level. An average of 1.8 minutes older air is present in the cooking zone (Fig. 13).
Stage 3: Four small chimneys of size 1.1m x 0.7m x 1 m were added above the cooking zone, as shown in Fig. 4. Five openings are provided on the sides of the windward (0.5m x 0.1m) and leeward (0.8m x 0.1m). The results illustrated that the entire space has an air velocity of 0.2m/s (Fig. 13). At the cooking zone, the air velocity increases to an average of 0.25 m/s, approximately equal to the minimum desirable windspeed recommended by standards [66]. The LMA was reduced to 1.5 minutes at the cooking level and 1 minute at the breathing level. Overall, it is observed that the kitchen space has an LMA of fewer than 2 minutes (Fig. 13).
By incorporating architectural modifications derived from the study's findings into the existing design of Kitchen 1, a significant improvement in ventilation was observed, resulting in a substantial decrease in LMA. The findings presented in the study are consistent with the study conducted by Saha et al. [4], which showed that incorporating windows into the current design of an institutional kitchen improved IAQ. These results of present study also align with those of Debnath et al. [30], who observed that specific building parameters, such as high OWR, aspect ratio, and the presence of another window or opening, can significantly reduce the age of air in a naturally ventilated rural kitchen. However, the results from the current study indicate that strategic placement openings play a crucial role beyond merely enhancing OWR.
5.Conclusion
Appropriate ventilation is required in kitchens to remove the effluents and heat generated from the cooking to guarantee acceptable IAQ for the workers. Building characteristics such as aspect ratio and opening size influence the airflow in naturally ventilated spaces, which directly impact interior air quality.
The present study investigated the ventilation performance and IAQ of five institutional kitchens using experimental and computational methods. The chosen five kitchens are naturally ventilated and have various building parameters. The concentration of indoor air pollutants such as PM2.5, PM10, and CO2 was measured to evaluate the IAQ experimentally, while the LMA is used as a metric to evaluate the IAQ computationally. Also, the study analyzed the three-dimensional flow field of each kitchen for a better understanding of air velocity distribution inside the area.
The average concentration of PM2.5 and CO2 in all kitchens exceeds the WHO permissible value for a safe environment. The concentration limit of PM10 exceeds the safe limit in all kitchens except in kitchen 3. The kitchens investigated in this study pose health risks to the workers.
The study tried to find the impact of building parameters on the IAQ of institutional kitchen environments. The study found that the LMA is decreased with increased cross-ventilation at the working level, local exhaust ventilation like a chimney, and a higher slenderness ratio. In comparison, LMA increased with a larger aspect ratio and volume of the space. The study implied that the LMA, which can impact IAQ, can be regulated and lowered by appropriately designing the building environment.
Contradictory to previous research findings [30], this study's results indicate that increasing the OWR alone did not reduce the LMA. The strategic placement of windows is essential to achieve appropriate air exchange between indoors and outdoors. The theoretical study of the improved design of the kitchen also agrees with the findings.
CFD simulation represents a particular day for the analysis. Further investigation is required, including the unsteady nature of natural ventilation and year-round data that includes seasonal variation, to get more realistic data. Moreover, future research should consider the effect of burner position, the heat transfer from the burner, pollutants dispersion from the burner, and the discomfort level of occupants regarding IAQ for a more detailed investigation of IAQ.
This study signifies the need to develop design guidelines for a sustainable and healthy built environment for commercial kitchens. Hence, it is vital to study the strategic location, orientation, and dimensions of openings and chimneys to maintain good IAQ. Only limited studies focused on the commercial kitchen's natural ventilation design to create a healthy and safe environment. The research intends to improve IAQ in future large kitchen designs, particularly in developing nations where sufficient funding for installing mechanical ventilation may not always be feasible.
Acknowledgment
The authors extend their sincere appreciation to the Prime Minister's Research Fellows (PMRF) scheme, Ministry of Education (MoE), and the Government of India for funding this research work. Also, the authors would like to acknowledge the National Institute of Technology Tiruchirappalli for their support.
Contributions
Jesna Mathew: Conceptualization, Methodology, Investigation, Software Validation, Writing - Original Draft, Writing- review and editing. Gnanasambandam Subbaiyan: Conceptualization, Methodology, Investigation, Project administration, Supervision, Writing- review and editing.
Declaration of competing interest
The authors declare no conflict of interest.
References
- Comfort of workers in office buildings: The European HOPE project, Building and Environment 46 (2011) 280-288. https://doi.org/10.1016/j.buildenv.2010.07.024
- A.K. Melikov, Advanced air distribution: improving health and comfort while reducing energy use, Indoor Air 26 (2016) 112-124. https://doi.org/10.1111/ina.12206
- Z.M. Sultan, Estimates of associated outdoor particulate matter health risk and costs reductions from alternative building, ventilation and filtration scenarios, Science of The Total Environment 377 (2007) 1-11. https://doi.org/10.1016/j.scitotenv.2007.01.090
- S. Saha, A. Guha, S. Roy, Experimental and computational investigation of indoor air quality inside several community kitchens in a large campus, Building and Environment 52 (2012) 177-190. https://doi.org/10.1016/j.buildenv.2011.10.015
- S.D. Himanshu Lunawat, Indian Food Services Industry : Engine for Economic Growth & Employment- A roadmap for unlocking growth opportunities, Technopack, 2017. https://ficci.in/spdocument/20969/foodzania-2017-report.pdf.
- D.S. Conner, Institutional Food Service, in: P.B. Thompson, D.M. Kaplan (Eds.), Encyclopedia of Food and Agricultural Ethics, Springer Netherlands, Dordrecht, 2014: pp. 1258-1263. https://doi.org/10.1007/978-94-007-0929-4_80
- A. Simone, B.W. Olesen, J.L. Stoops, A.W. Watkins, Thermal comfort in commercial kitchens (RP-1469): Procedure and physical measurements (Part 1), HVAC&R Research 19 (2013) 1001-1015. https://doi.org/10.1080/10789669.2013.840494
- Z.A. Chafe, M. Brauer, Z. Klimont, R. Van Dingenen, S. Mehta, S. Rao, K. Riahi, F. Dentener, K.R. Smith, Household cooking with solid fuels contributes to ambient PM2.5 air pollution and the burden of disease, Environ Health Perspect 122 (2014) 1314-1320. https://doi.org/10.1289/ehp.1206340
- K. Ravindra, M.K. Sidhu, S. Mor, S. John, S. Pyne, Air Pollution in India: Bridging the Gap between Science and Policy, Journal of Hazardous, Toxic, and Radioactive Waste 20 (2016) A4015003. https://doi.org/10.1061/(ASCE)HZ.2153-5515.0000303
- K.R. Smith, N. Bruce, K. Balakrishnan, H. Adair-Rohani, J. Balmes, Z. Chafe, M. Dherani, H.D. Hosgood, S. Mehta, D. Pope, E. Rehfuess, Millions Dead: How Do We Know and What Does It Mean? Methods Used in the Comparative Risk Assessment of Household Air Pollution, Annual Review of Public Health 35 (2014) 185-206. https://doi.org/10.1146/annurev-publhealth-032013-182356
- J. (Jim) Zhang, K.R. Smith, Household Air Pollution from Coal and Biomass Fuels in China: Measurements, Health Impacts, and Interventions, Environ Health Perspect 115 (2007) 848-855. https://doi.org/10.1289/ehp.9479
- E. Bindu, M.V. Reddy, Indoor Air Quality in Commercial Kitchens, in: 2016. https://www.semanticscholar.org/paper/Indoor-Air-Quality-in-Commercial-Kitchens-Bindu-Reddy/d60e5db81b5df251e7d2653d41eae94357bd916a (accessed December 16, 2022).
- D. Chakraborty, N.K. Mondal, J.K. Datta, Indoor pollution from solid biomass fuel and rural health damage: A micro-environmental study in rural area of Burdwan, West Bengal, International Journal of Sustainable Built Environment 3 (2014) 262-271. https://doi.org/10.1016/j.ijsbe.2014.11.002
- B. Fluckiger, M. Seifert, T. Koller, C. Monn, Air quality measurements in a model kitchen using gas and electric stoves, 1 (2000).
- Y.-S. Kim, I.S. Walker, W.W. Delp, Development of a standard capture efficiency test method for residential kitchen ventilation, Science and Technology for the Built Environment 24 (2018) 176-187. https://doi.org/10.1080/23744731.2017.1416171
- I. Parajuli, H. Lee, K.R. Shrestha, Indoor Air Quality and ventilation assessment of rural mountainous households of Nepal, International Journal of Sustainable Built Environment 5 (2016) 301-311. https://doi.org/10.1016/j.ijsbe.2016.08.003
- M. Ruth, J. Maggio, K. Whelan, M. DeYoung, J. May, A. Peterson, K. Paterson, Kitchen 2.0: Design Guidance for Healthier Cooking Environments, IJSLE (2014) 151-169. https://doi.org/10.24908/ijsle.v0i0.5147
- M.K. Sidhu, K. Ravindra, S. Mor, S. John, Household air pollution from various types of rural kitchens and its exposure assessment, Science of The Total Environment 586 (2017) 419-429. https://doi.org/10.1016/j.scitotenv.2017.01.051
- J. Guo, G. Chai, X. Song, X. Hui, Z. Li, X. Feng, K. Yang, Long-term exposure to particulate matter on cardiovascular and respiratory diseases in low- and middle-income countries: A systematic review and meta-analysis, Front Public Health 11 (2023) 1134341. https://doi.org/10.3389/fpubh.2023.1134341
- A. Singh, R. Kamal, M.K.R. Mudiam, M.K. Gupta, G.N.V. Satyanarayana, V. Bihari, N. Shukla, A.H. Khan, C.N. Kesavachandran, Heat and PAHs Emissions in Indoor Kitchen Air and Its Impact on Kidney Dysfunctions among Kitchen Workers in Lucknow, North India, PLoS One 11 (2016) e0148641. https://doi.org/10.1371/journal.pone.0148641
- T. Abuimara, B.W. Hobson, B. Gunay, W. O'Brien, Exploring the adequacy of mechanical ventilation for acceptable indoor air quality in office buildings, Science and Technology for the Built Environment 28 (2022) 275-288. https://doi.org/10.1080/23744731.2021.1977588
- A. Li, Y. Zhao, D. Jiang, X. Hou, Measurement of temperature, relative humidity, concentration distribution and flow field in four typical Chinese commercial kitchens, Building and Environment 56 (2012) 139-150. https://doi.org/10.1016/j.buildenv.2012.03.001
- L. Ng, D. Poppendieck, W.S. Dols, S.J. Emmerich, Evaluating indoor air quality and energy impacts of ventilation in a net-zero energy house using a coupled model, Science and Technology for the Built Environment 24 (2018) 124-134. https://doi.org/10.1080/23744731.2017.1401403
- O. Rouaud, M. Havet, Numerical investigation on the efficiency of transient contaminant removal from a food processing clean room using ventilation effectiveness concepts, Journal of Food Engineering 68 (2005) 163-174. https://doi.org/10.1016/j.jfoodeng.2004.05.029
- K.M. Whelan, Kitchen 2.0: Investigation of the Effect of Ventilation on Indoor Air Quality, Master of Science in Environmental Engineering, Michigan Technological University, 2015. https://doi.org/10.37099/mtu.dc.etdr/57
- K. Grabow, D. Still, S. Bentson, Test Kitchen studies of indoor air pollution from biomass cookstoves, Energy for Sustainable Development 17 (2013) 458-462. https://doi.org/10.1016/j.esd.2013.05.003
- J. Xing, Y. Jin, S. You, The control of air quality in commercial kitchen, Indoor Air (2005).
- C. Buratti, R. Mariani, E. Moretti, Mean age of air in a naturally ventilated office: Experimental data and simulations, Energy and Buildings 43 (2011) 2021-2027. https://doi.org/10.1016/j.enbuild.2011.04.015
- W. Ye, X. Zhang, J. Gao, G. Cao, X. Zhou, X. Su, Indoor air pollutants, ventilation rate determinants and potential control strategies in Chinese dwellings: A literature review, Science of The Total Environment 586 (2017) 696-729. https://doi.org/10.1016/j.scitotenv.2017.02.047
- R. Debnath, R. Bardhan, R. Banerjee, Investigating the age of air in rural Indian kitchens for sustainable built-environment design, Journal of Building Engineering 7 (2016) 320-333. https://doi.org/10.1016/j.jobe.2016.07.011
- WHO, WHO indoor air quality guidelines: household fuel combustion, World Health Organization, Geneva, 2014.
- Donald Weekes Jr., Brent Stephen, John P Lapotaire, Andrew Persily, Jeffrey Siegel, Iain Walker, Pawel Wargocki, Bruce White, ASHRAE Position Document on Indoor Air Quality, (2020). https://www.ashrae.org/file%20library/about/position%20documents/pd_indoor-air-quality-2020-07-01.pdf.
- C.M. Mak, F.W.H. Yik, A Study of Natural Ventilation in a Kitchen Using Computational Fluid Dynamics (CFD), Architectural Science Review 45 (2002) 183-190. https://doi.org/10.1080/00038628.2002.9697509
- A. Murga, Z. Long, S.-J. Yoo, E. Sumiyoshi, K. Ito, Decreasing inhaled contaminant dose of a factory worker through a hybrid Emergency Ventilation System: Performance evaluation in worst-case scenario, Energy and Built Environment 1 (2020) 319-326. https://doi.org/10.1016/j.enbenv.2020.04.007
- National Building Code of India 2016- Volume 1, (2016). E:\Solarlits\Submitted papers\V11N1\490\zzzzzzz
- Y.E. Cetin, M. Avci, O. Aydin, Influence of ventilation strategies on dispersion and removal of fine particles: An experimental and simulation study, Science and Technology for the Built Environment 26 (2020) 349-365. https://doi.org/10.1080/23744731.2019.1701332
- A. Novoselac, J. Srebric, Comparison of Air Exchange Efficiency and Contaminant Removal Effectiveness as IAQ Indices, (n.d.).
- D.S.-K. Ting, Ventilation and Airflow in Buildings: Methods for Diagnosis and Evaluation, International Journal of Environmental Studies 65 (2008) 627-628. https://doi.org/10.1080/00207230802308944
- M. Sandberg, What is ventilation efficiency?, Building and Environment 16 (1981) 123-135. https://doi.org/10.1016/0360-1323(81)90028-7
- X. Li, D. Li, X. Yang, J. Yang, Total air age: an extension of the air age concept, Building and Environment 38 (2003) 1263-1269. https://doi.org/10.1016/S0360-1323(03)00133-1
- M. Alwetaishi, M. Gadi, New and innovative wind catcher designs to improve indoor air quality in buildings, Energy and Built Environment 2 (2021) 337-344. https://doi.org/10.1016/j.enbenv.2020.06.009
- A.A. Heidari, H. Eskandari, Impact of inlet and outlet opening height variation on the air quality and ventilation efficiency in the on-top wind catcher buildings: A CFD simulation, Science and Technology for the Built Environment 28 (2022) 1420-1438. https://doi.org/10.1080/23744731.2022.2089592
- T. Chen, S.-J. Cao, Numerical study on the integrated effects of supplied air velocity and exhaust velocity on particles removal for industrial buildings, Energy and Built Environment 2 (2021) 380-391. https://doi.org/10.1016/j.enbenv.2020.09.006
- C.F. Gao, W.L. Lee, Evaluating the influence of openings configuration on natural ventilation performance of residential units in Hong Kong, Building and Environment 46 (2011) 961-969. https://doi.org/10.1016/j.buildenv.2010.10.029
- K.B. Fernandez, N. Ikegaya, K. Ito, Q. Chen, Age of air, purging flow rate, and net escape velocity in a cross-ventilation model sheltered by urban-like blocks using LES, Building and Environment 226 (2022) 109759. https://doi.org/10.1016/j.buildenv.2022.109759
- Y. Choi, D. Song, How to quantify natural ventilation rate of single-sided ventilation with trickle ventilator?, Building and Environment 181 (2020) 107119. https://doi.org/10.1016/j.buildenv.2020.107119
- T. Yang, N.G. Wright, D.W. Etheridge, A.D. Quinn, A Comparison of CFD and Full-scale Measurements for Analysis of Natural Ventilation, International Journal of Ventilation 4 (2006) 337-348. https://doi.org/10.1080/14733315.2005.11683713
- S. Omrani, V. Garcia-Hansen, B. Capra, R. Drogemuller, Natural ventilation in multi-storey buildings: Design process and review of evaluation tools, Building and Environment 116 (2017) 182-194. https://doi.org/10.1016/j.buildenv.2017.02.012
- Z. Chen, J. Xin, P. Liu, Air quality and thermal comfort analysis of kitchen environment with CFD simulation and experimental calibration, Building and Environment 172 (2020) 106691. https://doi.org/10.1016/j.buildenv.2020.106691
- L. Lv, L. Zeng, Y. Wu, J. Gao, W. Xie, C. Cao, Y. Chen, J. Zhang, Effects of human walking on the capture efficiency of range hood in residential kitchen, Building and Environment 196 (2021) 107821. https://doi.org/10.1016/j.buildenv.2021.107821
- G. Gan, Effective depth of fresh air distribution in rooms with single-sided natural ventilation, Energy and Buildings 31 (2000) 65-73. https://doi.org/10.1016/S0378-7788(99)00006-7
- L. Iskandar, E. Bay-Sahin, A. Martinez-Molina, S. Toker Beeson, Evaluation of passive cooling through natural ventilation strategies in historic residential buildings using CFD simulations, Energy and Buildings 308 (2024) 114005. https://doi.org/10.1016/j.enbuild.2024.114005
- E. Bay, A. Martinez-Molina, W.A. Dupont, Assessment of natural ventilation strategies in historical buildings in a hot and humid climate using energy and CFD simulations, Journal of Building Engineering 51 (2022) 104287. https://doi.org/10.1016/j.jobe.2022.104287
- M. Qays, M.F. Mohamed, M.K.A. Mat Sulaiman, A. Che-Ani, S.N. Raman, Thermal Environment Accuracy Investigation of Integrated Environmental Solutions-Virtual Environment (IES-VE) Software for Double-Story House Simulation in Malaysia, Journal of Engineering and Applied Sciences 14 (2019) 3659-3665. https://doi.org/10.36478/jeasci.2019.3659.3665
- T. Reeves, S. Olbina, R. Issa, Validation of building energy modeling tools: ecotectTM, green building StudioTM and IES
TM, in: Proceedings Title: Proceedings of the 2012 Winter Simulation Conference (WSC), IEEE, Berlin, Germany, 2012: pp. 1-12. https://doi.org/10.1109/WSC.2012.6465223 - F. Pomponi, S. Barbosa, P.A.E. Piroozfar, On The Intrinsic Flexibility of the Double Skin Façade: A Comparative Thermal Comfort Investigation in Tropical and Temperate Climates, Energy Procedia 111 (2017) 530-539. https://doi.org/10.1016/j.egypro.2017.03.215
- M. Singh, R. Sharston, A literature review of building energy simulation and computational fluid dynamics co-simulation strategies and its implications on the accuracy of energy predictions, Building Services Engineering Research and Technology 43 (2022) 113-138. https://doi.org/10.1177/01436244211020465
- CFD: MacroFlo user guide user guide, (2015). https://www.iesve.com/downloads/help/ve2012/Thermal/MacroFlo.pdf.
- CFD: MicroFlo User Guide, (2015). https://www.iesve.com/downloads/help/CFD/MicroFlo.pdf (accessed December 16, 2022).
- ModelIT: Model builder, (2015). https://www.iesve.com/downloads/help/VE2015/ModelBuilder/ModelIT.pdf.
- ApacheSim User Guide, IES Virtual Environment 6.4, (n.d.). https://www.iesve.com/downloads/help/VE2015/Thermal/ApacheSim.pdf (accessed December 16, 2022).
- A. Almhafdy, N. Ibrahim, S.S. Ahmad, J. Yahya, Thermal Performance Analysis of Courtyards in a Hot Humid Climate Using Computational Fluid Dynamics CFD Method, Procedia - Social and Behavioral Sciences 170 (2015) 474-483. https://doi.org/10.1016/j.sbspro.2015.01.012
- Z. Liu, D. Wu, H. Yu, W. Ma, G. Jin, Field measurement and numerical simulation of combined solar heating operation modes for domestic buildings based on the Qinghai-Tibetan plateau case, Energy and Buildings 167 (2018) 312-321. https://doi.org/10.1016/j.enbuild.2018.03.016
- T.G. Farea, D.R. Ossen, S. Alkaff, H. Kotani, CFD modeling for natural ventilation in a lightwell connected to outdoor through horizontal voids, Energy and Buildings 86 (2015) 502-513. https://doi.org/10.1016/j.enbuild.2014.10.030
- J. Liu, J. Niu, CFD simulation of the wind environment around an isolated high-rise building: An evaluation of SRANS, LES and DES models, Building and Environment 96 (2016) 91-106. https://doi.org/10.1016/j.buildenv.2015.11.007
- SP 41 (1987): Handbook on Functional Requirements of Buildings (Other than Industrial Buildings), Bureau of Indian Standards (BIS) (1987). https://law.resource.org/pub/in/bis/S03/is.sp.41.1987.pdf.
- WHO, Air quality guidelines: global update 2005 ; particulate matter, ozone, nitrogen dioxide and sulfur dioxide, WHO Regional Office for Europe, Copenhagen, 2006.
- L. Damiano, D. Dougan, ANSI/ASHRAE Standard 62.1-2010: Ventilation for Acceptable Indoor Air Quality, in: B. Capehart (Ed.), Encyclopedia of Energy Engineering and Technology - 3 Volume Set (Print Version), American Society of Heating, Refrigerating and Air-Conditioning Engineers, Inc, Atlanta, 2007: pp. 50-62. https://doi.org/10.1201/9780849338960.ch6
- D. Kajjoba, H. Kasedde, P.W. Olupot, J.D. Lwanyaga, Evaluation of thermal comfort and air quality of low-income housing in Kampala City, Uganda, Energy and Built Environment 3 (2022) 508-524. https://doi.org/10.1016/j.enbenv.2021.05.007
- M.K. Commeh, A. Agyei-Agyemang, P.O. Tawiah, B.A. Asaaga, CFD analysis of a flat bottom institutional cookstove, Scientific African 16 (2022) e01117. https://doi.org/10.1016/j.sciaf.2022.e01117
- Y.S. Eom, D.H. Kang, D. Rim, M. Yeo, Particle dispersion and removal associated with kitchen range hood and whole house ventilation system, Building and Environment 230 (2023) 109986. https://doi.org/10.1016/j.buildenv.2023.109986
- X. Fu, V.C. Tai, L.K. Moey, N.F. Abd Rahman, K.A. Ahmad, D. Baglee, Opening configurations and natural cross ventilation performance in a double-loaded multi-level apartment building: A CFD analysis, Building and Environment 254 (2024) 111404. https://doi.org/10.1016/j.buildenv.2024.111404
- C. Chen, C. Gorlé, Full-scale validation of CFD simulations of buoyancy-driven ventilation in a three-story office building, Building and Environment 221 (2022) 109240. https://doi.org/10.1016/j.buildenv.2022.109240
- N. Izadyar, W. Miller, B. Rismanchi, V. Garcia-Hansen, A numerical investigation of balcony geometry impact on single-sided natural ventilation and thermal comfort, Building and Environment 177 (2020) 106847. https://doi.org/10.1016/j.buildenv.2020.106847
- N. Izadyar, W. Miller, B. Rismanchi, V. Garcia-Hansen, S. Matour, Balcony design and surrounding constructions effects on natural ventilation performance and thermal comfort using CFD simulation: a case study, Journal of Building Performance Simulation (2023) 1-20. https://doi.org/10.1080/19401493.2023.2185682
- L. James Lo, D. Banks, A. Novoselac, Combined wind tunnel and CFD analysis for indoor airflow prediction of wind-driven cross ventilation, Building and Environment 60 (2013) 12-23. https://doi.org/10.1016/j.buildenv.2012.10.022
Copyright © 2024 The Author(s). Published by solarlits.com.

3841
Total views
Citations
SHARE ON


