Volume 12 Issue 1 pp. 125-147 • doi: 10.15627/jd.2025.8
Uncertainty and Sensitivity Analyses of Switchable Slat Insulated Shades for Daylighting Performance based on Illuminance Thresholds and Objective Weights
Ali Ahmed Bahdad*
Author affiliations
Interior Design Department, College of Engineering, University of Prince Mugrin (UPM), Al Aqool, Medina, 42241, Saudi Arabia
*Corresponding author.
alibahaddad@gmail.com (A. A. Bahdad)
History: Received 5 October 2024 | Revised 24 January 2025 | Accepted 1 February 2025 | Published online 22 March 2025
Copyright: © 2025 The Author(s). Published by solarlits.com. This is an open access article under the CC BY license (http://creativecommons.org/licenses/by/4.0/).
Citation: Ali Ahmed Bahdad, Uncertainty and Sensitivity Analyses of Switchable Slat Insulated Shades for Daylighting Performance based on Illuminance Thresholds and Objective Weights, Journal of Daylighting 12 (2025) 125-147. https://dx.doi.org/10.15627/jd.2025.8
Figures and tables
Abstract
To balanced multi-criteria's daylighting performance in indoor spaces, several dynamic metrics have been proposed, but so far there is no convention on which daylight metrics thresholds are preferred and which objective weights are given priority in optimization of daylighting under certain climate. This study explores uncertainty and sensitivity analyses to identify and prioritize the most influencing critical objective weights and appropriate useful daylighting illuminance (UDI) threshold for designing glazed system with Insulated Glazed Units that include Parallel Slat Transparent Insulation Materials (IGUs/PS-TIMs) for office buildings in sub-tropics areas for achieving best level of daylighting availability with enhanced thermal and visual comfort. To ascertain which objectives and threshold have significantly impact the optimized IGUs/PS-TIMs parameters, the study performed a framework of three statistical methods-based multi-objective optimization (MOO) of Objective’s weights (OWs), Sensitivity analysis (SA) and uncertainty analysis (UA), were used. The framework comprises multi-optimization stages based on two main steps. In the first step, MOO based-multi statistical analysis was run for ranking UDI threshold control setpoint (UDI-TCS) and of critical objective weights (PC-OWs), meanwhile the second step, MOO based-optimal UDI-TCS and PC-OWs was run for final ranking solutions. The results showed that if considering the priority of PC-OWs in ranking final solutions based best UDI thresholds, the different schemes can be obtained, which is of great significance to the early design stage of buildings. Overall, the results showed that when considering PC-OWs in ranking final UDI thresholds, it can be clearly noticed that the UDI, ASE, and QV respectively, are the most PC-OWs, and UDI500-2000lux is the optimal threshold because it has significantly improved the UDI and ASE in all optimal cases compared to optimal cases resulted from UDI500-1000lux/50%. the total average percentage of UDI between 22.63% to 27.80%, meanwhile, the total average percentage of ASE improved between 2.14%. to 11.52%. For QV, the optimal cases result from UDI500-1000lux/50% threshold working better by slightly improving QV by 1.16% and 10.56%. Notwithstanding, these two pairs of UDI thresholds with given priority to UDI, ASE and QV as PC-OWs are suggested as the most appropriate conflicted objectives for optimizing daylight under sub-tropical climate conditions.
Keywords
Daylighting performance, Useful daylighting illuminance, Glazed system, Multi-objective optimization
Nomenclature
| UDI | Useful Daylighting Illuminance |
| IGUs | Insulated Glazed Units |
| PS-TIMs | Parallel Slat Transparent Insulation Materials |
| MOO | Multi-Objective Optimization |
| OWs | Objective’s Weights |
| SA | Sensitivity Analysis |
| UA | Uncertainty Analysis |
| UDI-TCS | UDI Threshold Control Setpoint |
| PC-OWs | Critical Objective Weights |
| ASE | Annual Solar Exposure |
| QV | Quality of View |
| GSs | Since Glazing Systems |
| DA | Daylight Autonomy |
| PD | Parametric Design |
| GA | Genetic Algorithm |
| EA | Evolutionary Algorithm |
| PSO | Particle Swarm Optimization |
1. Introduction
Since glazing systems (GSs) are important components of buildings, it need to be improved in order to use optimal daylighting to greatly cut energy consumption and improve thermal and visual performance [1]. Many objectives and dynamic restrictions are among the many considerations that go into optimizing the design of GSs. As a result, GSs built using conventional static methods with fixed design characteristics cannot adapt to changing climatic conditions. Therefore, a responsive multifunction smart GSs that adjusts to the living environment is required to increase overall building efficiency [2]. Researching state-of-the-art GSs that can effectively balance a range of daylighting performance factors, such as thermal and visual performance as well as energy-saving capabilities, is therefore imperative [3]. To improve the thermal efficiency of GSs, a number of glazing technologies have been investigated, including low-emissivity glazing materials, tinted, reflecting, and Insulated Glazed Units (IGUs) [1]. The notable visual comfort and thermal efficiency of IGUs have garnered a lot of attention. In order to properly limit heat transfer while maintaining light access, a great deal of research has been concentrated on the use of interstitial structures inside the cavity of IGUs to improve the overall thermal and energy-saving capabilities of the IGUs such as pleated blinds, horizontal Venetian blinds [3]. The Parallel Slat Transparent Insulation Materials (PS-TIMs) structure, which consists of switchable insulated shades composed of transparent insulating materials, is a novel and revolutionary sandwich interstitial element situated within the cavity of double-panels of GSs [1].
To improve interior thermal and visual comfort while reducing building energy consumption, new GSs with IGUs Integrated PS-TIMs (IGUs/PS-TIMs) have been created lately. As shown in the detailed schematic layout of the PS-TIM glazing system in Fig. 1, PS-TIM separates the air cavity between two glazing panes of IGUs into small horizontal, linear cells [4]. However, If PS-TIM integration is not well-designed, it might, however, decrease the quantity of daylight transmitted through the GSs double-panes and change how daylight is distributed in the space it serves. The enhanced thermal insulation provided by IGUs/PS-TIMs and its impact on the degree of interior illumination can eventually influence the building's thermal, visual, and total energy efficiency [5].
Figure 1
![A schematic diagram of the PS-TIM glazing system [5].](figures/12-125-1.jpg)
Fig. 1. A schematic diagram of the PS-TIM glazing system [5].
One challenge in designing and selecting a PS-TIMs with IGUs system is balancing system design parameters and numerous criteria for visual and thermal efficiency via optimal daylighting availability. Furthermore, although there is evidence that IGUs and PS-TIMs can enhance multi-criteria daylighting performance in some situations, there is a lack of comprehensive, systematic design guidelines to include them in daylighting performance design criteria. Determining which design parameters, objectives and daylighting threshold are most important and to what extent is particularly difficult when using IGUs/PS-TIMs. Therefore, it is critical and worthwhile to investigate the relative importance of all relevant IGUs/PS-TIMs design parameters, design objectives, and the optimal daylighting threshold in order to focus on the best daylight threshold control setpoint and Priority of design objectives based on their critical weights make the design process more efficient and structured. This will ultimately result in a well-directed design solution that more effectively controls multiple daylighting performance criteria, including energy efficiency and indoor visual and thermal comfort for buildings.
There were several metrics characterizing daylight performance with various thresholds, which made it possible to study daylighting performance under different thresholds as a daylight control setpoint. Static measures like daylight factor (DF) and point-in-time illuminances might be distinguished from dynamic/climate-based metrics like DA, UDI, or ASE [6]. However, the choice of optimal UDI-TCS has not been entirely consistent in previous studies. Nevertheless, not of all studies has yet defined a concept of adequate daylight and a suitable UDI-TCS to design IGUs/S-TIMs under certain climate with multi-criteria’s. Nevertheless, the correct selection of the prevailing IGUs/PS-TIMs variables based on the optimal daylighting threshold of UDI is often difficult and requires good knowledge of the system to achieve the multi-daylighting design objectives.
During the past decades, the application of intelligent optimization for building-efficient design, which combines parametric design (PD) and multi-objective optimization (MOO) using intelligent optimization tools (IOTs) to handle complex building systems, has emerged as a promising approach [7-10]. Finding the greatest and lowest values from one or more objectives and choosing the best solutions to a problem are two effective uses of optimization. In building design and research processes, an optimization is a method used to evaluate design possibilities and obtain the best outcomes for a certain goal [11]. Numerous optimization techniques have been developed, including generative, parametric, and sensitivity techniques. New analytical tools that relied on either more sophisticated modeling tools or simpler computations were swiftly introduced to support these approaches [12]. The primary optimization methods used in the building's design include genetic algorithm (GA), tabu search, sequential search, particle swarm optimization (PSO), and evolutionary algorithm (EA). The first two are part of the search algorithm, while the latter two are part of the evolutionary algorithm [13]. Considered to be among the greatest methods for analyzing and choosing among all potential solutions is the GA. Within the optimization sector, the GA is considered a very effective technique since it uses many genetic processes such as crossover, mutation, and selection to find the ideal solution [14-16]. The nature of the optimization can be determined by the number of objective functions to minimize or maximize. It should be mentioned that optimization with only one goal is known as mono-objective optimization, while optimization with two or more objectives at once is known as MOO [17].
Numerous genetic algorithm optimization strategies have been employed in the literature to support building designers throughout the decision-making process. Techniques for Sensitivity analysis (SA) and uncertainty analysis (UA) have been applied correctly and successfully to prioritize the design parameters [18]. During the past decades, application of intelligent genetic algorithm optimization, which combines uncertainty and SA integrated with parametric design to handle complex building systems have emerged as a promising approach. Combining an appropriate UA and SA approach with PD and MOO gives an effective and valuable tool to rank the design elements based on their value to increase building energy efficiency in the shortest feasible period [19]. In recent years, studies have been conducted on genetic algorithm optimization-based UA and SA have been widely studied for multi-objective daylight prediction by many researchers, considering different design parameters and objectives. Regarding the important role of IGUs with PS-TIMs on daylighting performance, few Studies have been conducted on genetic algorithm optimization-based UA and SA for multi-objective daylight prediction, considering different design parameters PS-TIMs and properties of IGUs panels under different UDI-TCS. However, the performance assessments focused merely on the limited types of IGUs panel and limited PS-TIMs parameters of the IGUs/PS-TIMs for optimal solutions without pointed out the optimal UDI-TCS threshold and critical objectives weights in selected the final solutions. Table 1 summarizes the variables, objectives, and methods of some previous studies in this area under the most frequency different UDI thresholds considering different design scheme of daylighting including PS-TIMs system in previous studies. Few studies assessed limited design parameters under a certain climatic condition or under certain daylight threshold or under local daylight standards. The perception of daylight, however, can vary depending on a number of factors, including the type of sunshine, the view outside, the availability of daylight, and glare protection [8], without Giving priority to choosing the optimal solution for the design goal with the greatest weight. Currently, most daylight standards do not take these aspects into consideration. Consequently, in practice, their suggestions may be rather restricted. It should be noted that these studies did not provide a detailed investigation and justifications of the UDI threshold that was used, and which objectives have critical weights are giving priority in choosing the optimal solution. Despite the previous studies, there is no study yet, to the best of the authors’ knowledge, had performed a preliminary UA and SA based on MOO of the behavior of the IGUs/PS-TIMs based on the optimal UDI-TCS and priority of critical objective weights (PC-OWs).
Table 1
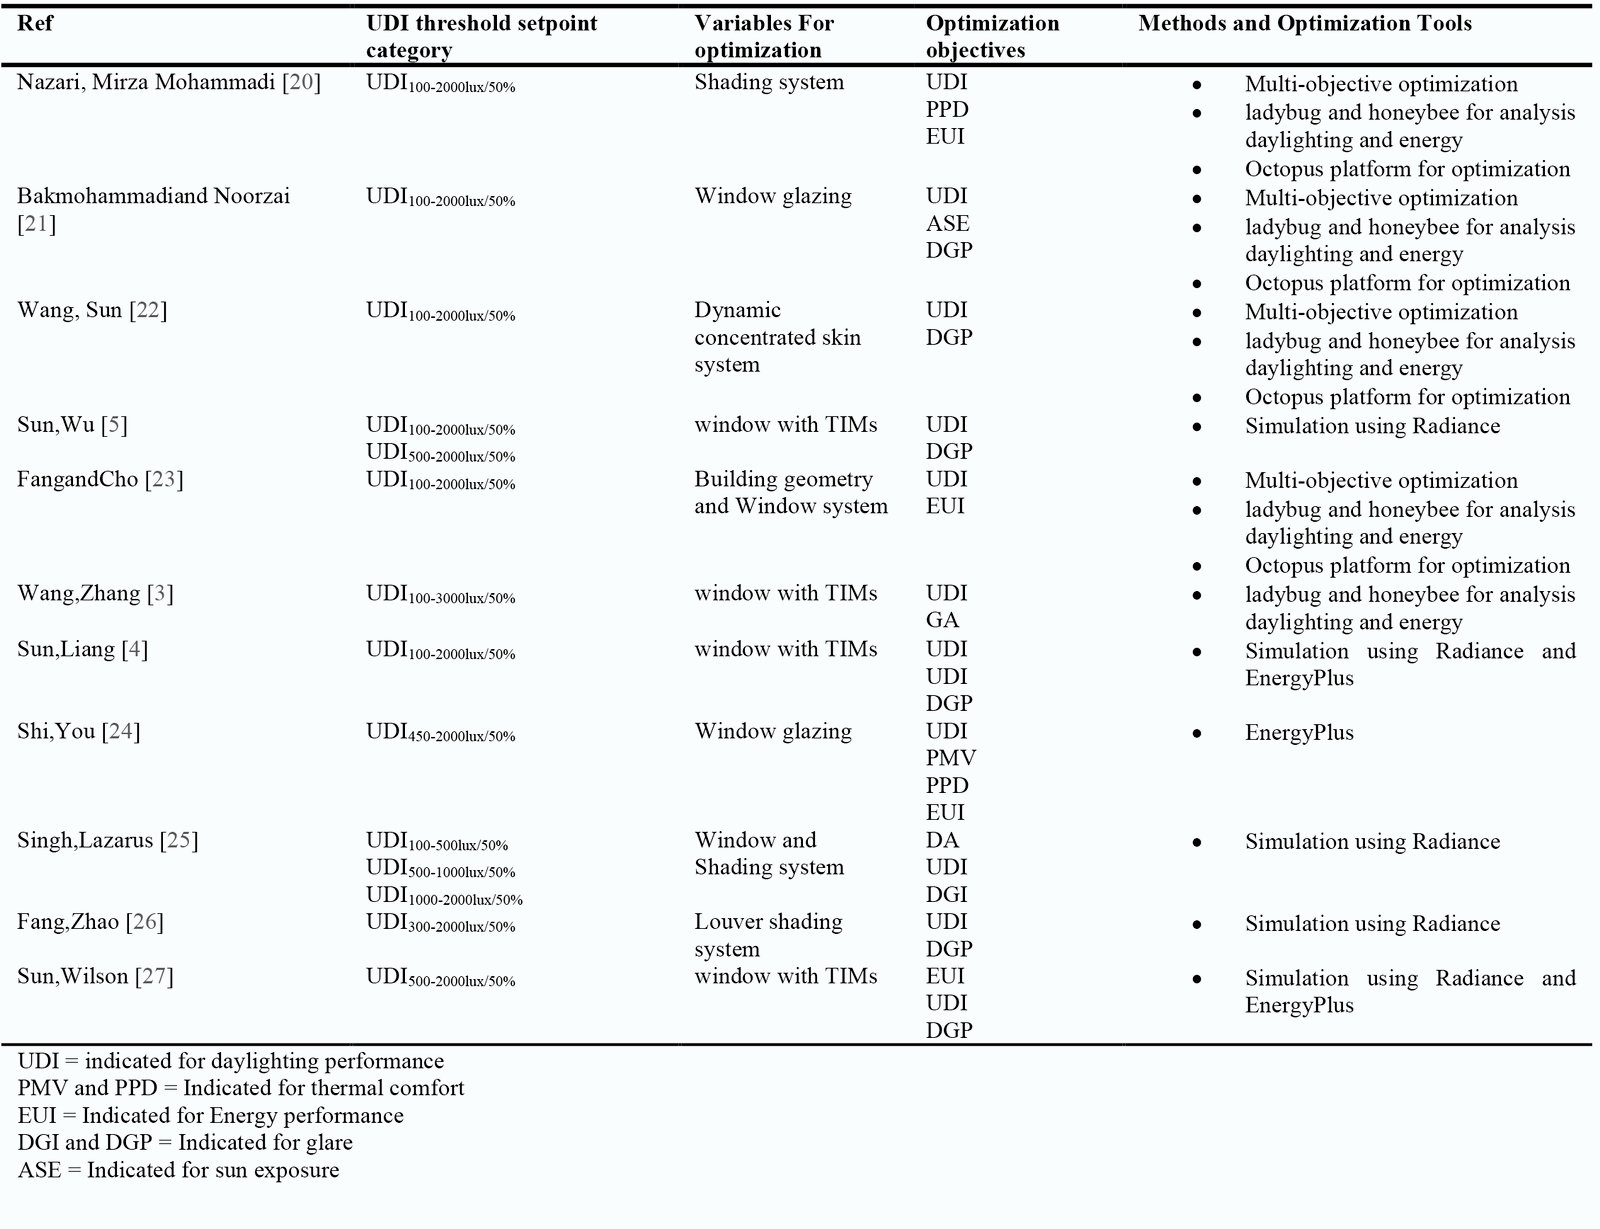
Table 1. A summary of some previous studies categorized under different UDI thresholds.
To get an ideal model of IGUs-TIMs for obtaining the greatest amount of daylighting availability and better thermal and visual comfort, multi-objective optimization is utilized to investigate the objective functions concurrent important elements based on GA optimization. Balancing system design characteristics and various daylighting requirements is one of the challenges in creating and choosing a TIMs with IGUs system. There is evidence that the PS-TIMs system, when integrated with IGUs can improve building performance in some situations, however there are currently no methodical design guidelines for integrating the smart TIMs system into IGUs with regard to window design factors and building performance design requirements based on optimal thresholds and critical design objectives. In particular, it is difficult to establish which building design variables and objective are the most improved by using PS-TIMs with IGUs glazing system, and to what extent. Nevertheless, the correct selection of the prevailing PS-TIMs within IGUs variables is often difficult and requires good knowledge of the system to achieve multi-design objective. In view of the present trend toward energy-efficient building design, this study must create a framework of PS-TIMs with IGUs in order to intelligently automate the design process of optimizing thermal performances and daylighting quality and quantity.
To close the above-mentioned gaps, this study aims to providing a detailed investigation of IGUs/PS-TIMs under appropriate UDI threshold based on PC-OWs to design optimal daylighting that can visually and thermally guiding making-decision of final solutions. This study performs multi-objective optimization based on EGA combines UA and SA to prioritize the most influencing objectives for designing PS-TIMs system applied to four types of IGUs glazing system based on different control parameter setpoints of daylighting quantity and quality for optimal visual and thermal comfort in office buildings in the hot subtropical climate zone. The novelty and originality of the presented work is to present a novel optimization-based optimal UDI-TCS and PC-OWs framework using multi-stage of MOO and UA and SA that can be used to optimize the IGUs/PS-TIMs based on more appropriate daylight thresholds control setpoint and more critical objectives weights. To the best of the authors’ knowledge this is the first comprehensive work to investigate daylighting based in highly sensitivity objectives and optimal UDI threshold under sub-tropical climate. The choice of the more appropriate UDI-TCS and PC-OWs for optimized IGUs/PS-TIMs is of foremost importance when selecting between different system alternatives based on the priority of critical objectives, or when optimizing the design of a specific innovative IGUs/PS-TIMs for multiple daylighting scenarios. Another novelty is that All studies performed sensitivity analyzes to determine the contributions of single design variable to the objectives. While this study focused on the contribution of all design variables as inputs to the ranking objectives weights simultaneously as outputs.
2. UA and SA methods
Finding the relative significance of input parameters in relation to the related output may be done effectively with SA. From the standpoint of building design, the SA seeks to ascertain how each individual design variable contributes to the overall performance of the design solution and to pinpoint the key design parameters associated with building performance; consequently, it concentrates building design and optimization on a smaller number of parameters. In the context of building performance simulation, SA is performed by varying the building model's input parameters and comparing the resulting output changes to the output using the starting values of the input parameters, sometimes referred to as a "reference model" [28]. However, there aren't any established rules or procedures that are regarded as the norm for SA [29]. Local SA (LSA) and global SA (GSA) are two categories into which the SA approaches used in the field of building energy performance may be divided [30]. LSA falls within the category of one-factor-at-a-time (OFAT) techniques. The OFAT approach examines how model outputs respond to variations in model inputs [31]. This approach holds all other parameters constant at their original mode while allowing one design variable to be varied over its whole range. You may use different variables to replicate this procedure [32]. Meanwhile, GSA techniques modify all of the parameters simultaneously throughout their complete input space in order to assess output variations caused by a single input variable [33]. GSA approaches are therefore viewed as more accurate and reliable tools for building analysis because, in contrast to LSA techniques, they use a representative collection of samples to explore the design space and provide robust sensitivity measurements in the presence of nonlinearity and parameter interactions [30]. In conclusion, GSA is more accurate than LSA because it considers the link between input elements and output objectives and all design parameters are changed simultaneously, while LSA is focused on only one design parameter at a time [34]. GSA has been used in this study to define the UDI-TCS and defining PC-OWs on designing daylighting by using IGUs/PS-TIMs system.
3. Research materials and methodology
3.1. Research framework
Figure 2 depicts multi-criteria approach of the genetic algorithm optimization based on multiple statistical analysis of Objective’s weights (OWs), UA, and SA and MOO framework proposed in this study to design PS-TIMs integrated to IGUs system. The framework combined PD, integrated daylight and thermal performance simulation tools, and Wallacie multi-objective optimization considers six output objectives based on maximizing DA and UDI, and QV, and minimizing ASE, PMV, and PPD. Besides the main PD steps for modelling the case study and defined the parameters value and materials of the IGUs/PS-TIMs, the framework comprises multi-optimization stages based on two main steps. In the first step, MOO based-multi statistical analysis was run for ranking UDI-TCS and PC-OWs, meanwhile the second step, MOO based-optimal UDI-TCS and PC-OWs was run for final ranking solutions. To this end, a single-zone in office building located on the hot-arid sup-tropical climate of Najran city, Saudi Arabia was selected and developed using Grasshopper parametric software. Afterward, the Ladybug and Honeybee energy and daylight plugins based on Radiance and EnergyPlus were employed for simulating thermal and visual conditions, and finally MOO was conducted with the Wallacie grasshopper plugin. The framework began by defining the 3D model in Rhino and its parametric plugin Grasshopper of the case study, and four types of IGUs systems, and then Define the PS-TIMs parameters and their values parametrically. The third step is multi-objective optimization-based statistical analysis of OWs, UA, and SA. The performance of the parametric TIMs is evaluated based on different objectives to find the optimal UDI-TCS based on ranking objectives based on their critical weights. The fourth step is multi-objective optimization. The performance of the parametric IGUs/PS-TIMs is evaluated based on the optimal UDI-TCS and critical objectives weights. The final step records and analyzes the optimization process data and optimization results of Pareto optimal solutions and exports to CSV file using TT toolbox Colibri plugin to render the final solutions as 2D parallel coordinates plot by using Design Explorer tool.
Figure 2

Fig. 2. Research framework.
In the statistical analysis of OWs, UA, and SA, the study used a three-step strategy of statistical analysis of OWs, UA correlation, and SA regression methods based on MOO. By analyzing the effects of input value changes, WOs, UA, and SA determine critical input factors impacting output indicators. In this study, OWs, UA and SA used multiple regression models for continuous alternative solutions to reach the optimal design choices for IGUs glazing with PS-TIMs systems by using the technique of GSA. In the first and second steps, MOO based-OWs and UA of design objectives were performed to assess the range of the main output of different UDI-TCS. In this step, optimization was run for different control setpoints of daylighting thresholds with considering an equal weight for all objectives and design parameters of PS-TIMs to present the optimal daylighting threshold setpoint that have the major impacts to balance the multi-objectives. In these steps, all design parameters have been optimized against one control setpoint at a time. In other words, one control setpoint of UDI and all design parameters of TIMs are variables, and the other control setpoints are defined as constants. Thus, the influence of all optimized input design variables of PS-TIMs on all outputs is based on one daylight threshold control point. The goal of this step is to determine the best daylighting threshold control point while identifying the most interconnected objectives in the optimization process. The second goal of this step is to give priority to the most impactful objectives instead of assigning equal weights for all criteria in the final optimization process. Based on the total order indices, In the third step, a multi-objective optimization based-SA is run based on the best optimal control setpoints to rank the optimal objectives based on their highly sensitivity and critical objectives weights are selected based on the priority of the objectives for final MOO.
3.2. Assessment of multi-criteria and selected UDI thresholds
A set of multi-domain criteria with competing fitness objectives for providing daylight availability into space without occupant visual and thermal discomfort is selected for the analysis in order to apply the multi-criteria approach for comparing and ranking the chosen range of optimal solutions alternatives under optimal UDI-TCS and PC-OWs. In this research, six competing objective functions are optimized under five daylighting thresholds of Useful Daylight Illuminance (UDI), divided into three groups by the evolutionary algorithm are used. The first fitness objective (FO1) is the sum of the average UDI with a different threshold, and the average Daylight Autonomy (DA) is considered (FO2) are selected for maximizing daylight availability. FO3 and FO4 are considered for improved visual comfort through maximizing Quality of View (QV) and Minimizing Annual sun exposure (ASE). Meanwhile, the two models of Predicted Mean Vote (PMV) and Predicted Percentage of Dissatisfied (PPD) are applied to evaluate thermal comfort in space (FO5 and FO6) as shown in Fig. 3.
Figure 3
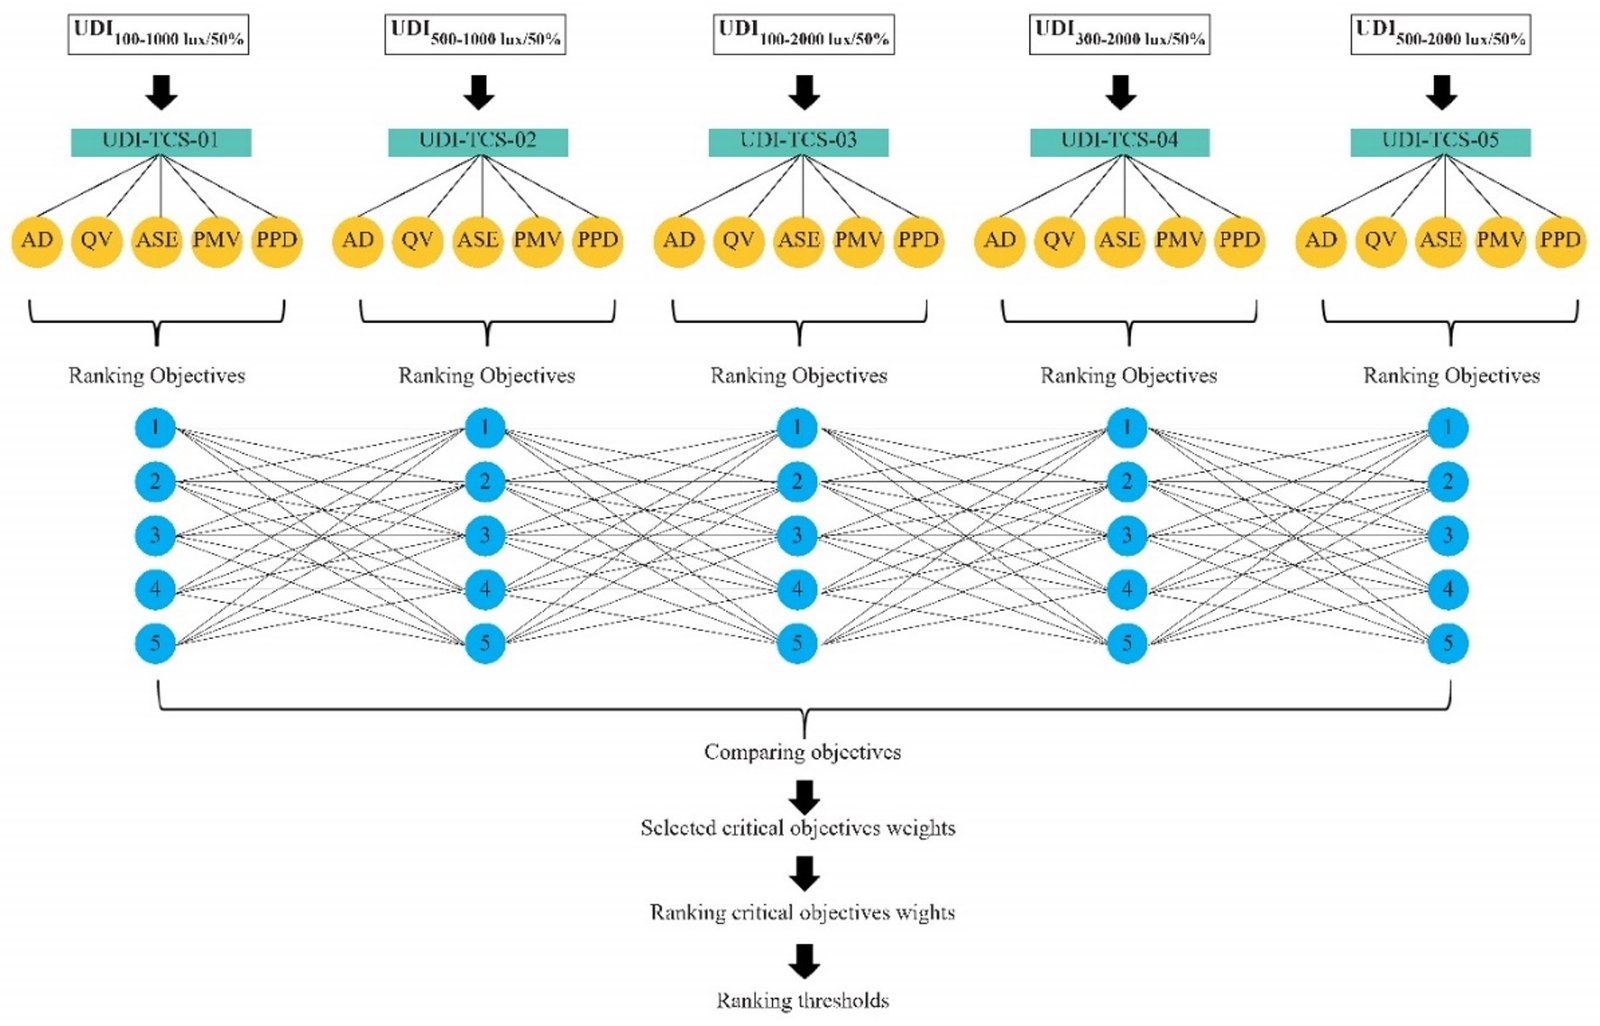
Fig. 3. Flowchart of interaction of six objective functions under five thresholds for MOO process.
UDI, which was introduced by Nabiland and Mardaljevic [35], is the annual time fraction that indoor horizontal daylight illuminance at a given test point reaches in a given domain. It has been used to analyze daylighting performance under various thresholds, and the thresholds chosen for this study are displayed in Fig. 3 based on the most frequently used thresholds for evaluating daylighting in earlier studies. UDI has been used to analysis daylighting performance under different thresholds. The UDI thresholds are selected in this study as shown in Fig. 3 based on the most thresholds frequency used to evaluate daylighting in previous studies i.e: UDI100-1000lux [36], UDI500-1000lux [37], UDI100-2000lux [38], UDI00-2000lux [34], and UDI500-2000lux [5]. DA is defined as the proportion of yearly daytime hours when a certain spot in a space exceeds a specific illuminance level. DA offer an accurate evaluation of illumination conditions based on latitude and their fluctuations across days and seasons [39]. The ASE ratio is the percentage of the examined space that receives more than a certain amount of direct sunlight during a specific number of hours per year. The Illuminating Engineering Society (IES) recommends ASE1000,250h, which is the proportion of space in which at least 250 occupied hours per year, direct sun exposure is higher than 1000 lux [40,41]. PMV and PPD are the two models used to model and evaluate thermal comfort [42]. Thermally acceptable indoor environments must satisfy at least 80% of space occupants, according to ASHRAE 55 criteria. It is also advised that the acceptable PPD for thermal comfort should be less than 10%, and the PMV should be between -0.5 and 0.5 [43]. Based on LEED v4, the goal of addressing QV demands is to give a direct view through view windows for 75% of the occupied area while also improving the link between the outer environment and the building inhabitants. These portions must not only occupy 75% of the index's occupied area. There are four indexes’ to evaluated QV. one of them is view factor (VF). which is used in this study to evaluate the QV listed below. More details about these QV index's as stated in study by Pilechiha,Mahdavinejad [44]. For more details about all these metrics refer to [2,35,43-45].
3.3. OWs, UA, and SA methods.
To ascertain which factors significantly impact the system or model, OWs, UA, and SA are frequently employed in optimization research. SA are frequently employed in building optimization and are capable of analyzing how each optimization variable affects the optimization objectives. As mentioned above, GSA has been used in this study to define the optimal UDI-TCS and defining PC-OWs on designing daylighting by using IGUs/PS-TIMs. A variety of methods can be used for SA [46]. The regression approach is the most often used GSA method and requires a very modest sample size [23]. In the OWs stage, a variety of approaches have been proposed in the literature to establish the weights of many competing goals. Using objective decision matrix information, the OWs were determined using the standard deviation weights (SDW) approach. However, it is critical to do a correlation and regression of UA and SA to see how the ultimate optimal [2]. The standardized rank regression coefficient (SRRC) and partial rank correlation coefficient (PRCC) are the key sensitivity indicators retrieved from the regression approach for use in UA correlation. The distinction between the two indicators is that PRCC is more appropriate for correlated inputs since it can eliminate the impact of the correlation between input variables [47]. This technique sorts the input and output values in ascending order and replaces their values with their rankings. From there, a linear regression model is extrapolated, same as with SRC. Thus, PRCC is a viable approach for both linear and nonlinear systems, and it was employed in our work. The model is more linear and fit as the summation approaches one. When the PRCC of a variable is high (near to 1), it indicates that the variable has a significant effect on the model output. When the coefficients are minimal (PRCC < 0.5), the scatter plot does not reveal any significant association [48,49]. The linear regression approach, used in SA, assesses the significance of each input to the outputs by identifying an approximation linear model to the non-linear function of building energy analysis. The dependability of a technique is determined by the coefficient of variation of root mean square error (CVRMSE), coefficient of determination (𝑅2), and p-value, as indicated by ASHRAE Guideline-14 and earlier research. In this step of SA, the R2 is utilized to evaluate the quality of the multiple linear regression. The model's predictive ability improves as R2 increases. R2 values greater than 0.7 are often considered acceptable for regression models. R2 was higher than this criterion for all of the provided simulations, hence the model was judged linear within the specified ranges of the inputs [50].
3.4. Parametric Modelling of case study and IUGs/PS-TIMs parameters
In order to validate the framework, this paper takes a hypothesis single-zone unit in an office building as a case study (RC) to apply the proposed framework approach. The building located on the hot-arid sup-tropical climate of Najran city, Saudi Arabia was selected and developed using Grasshopper parametric software and developed for energy and daylighting in the plugin’s ladybug and honeybee environmental tools analysis. Recently, several articles have successfully validated the Honeybee and Ladybug plug-ins [21]. As well as, these tools have been validated under this climate condition in previous paper by author [51].
The zone is rectangular, and three sides opaque, and only south-facing has a fully glazing to apply the proposed system, as shown in Fig. 4. The model dimension for depth, width, and hight are 10.00m * 7.00m * 3.00m respectively with fully glazing installed into the south-facing. The reflectance materials of the interior ceilings, walls, and floors being 64.8%, 81.2%, and 7.1%, respectively as ideal materials for office building under different climate recommended by previous studies [2]. The parametric model of RC and IGUs/PS-TIMs design variables was linked to the RADIANCE material library for completely establishing the walls, floor, ceiling, and glazing features. The daylight availability component was then updated with weather data, a work-plane sensor grid, and other daylighting standards information. The sensor grids for illuminance and view sensors were positioned in two work-planes at 0.8 m and 1.2 m above the floors. like a consequence, the number of sensors for each work plan was 280, with a grid size unit spacing of 0.5 m, like most earlier research. In the energy modelling, the RC and IGUs/PS-TIMs design parameters were linked to materials from the EnergyPlus library, with thickness, U-Factor, Solar Heat Gain Coefficient SHGC, and transmittance values defined. Tables 2 and 3 provide detailed information on the four IGU glazing qualities and six PS-TIM parameters utilized in the optimization procedure. The optimization for this study was carried out over a one-year period utilizing climate data for Najran City, Saudi Arabia (EnergyPlus weather file (.epw), Normally Meteorological Year - TMY) based on office building occupancy hours (8:00 a.m. to 17:00 p.m.).
Figure 4
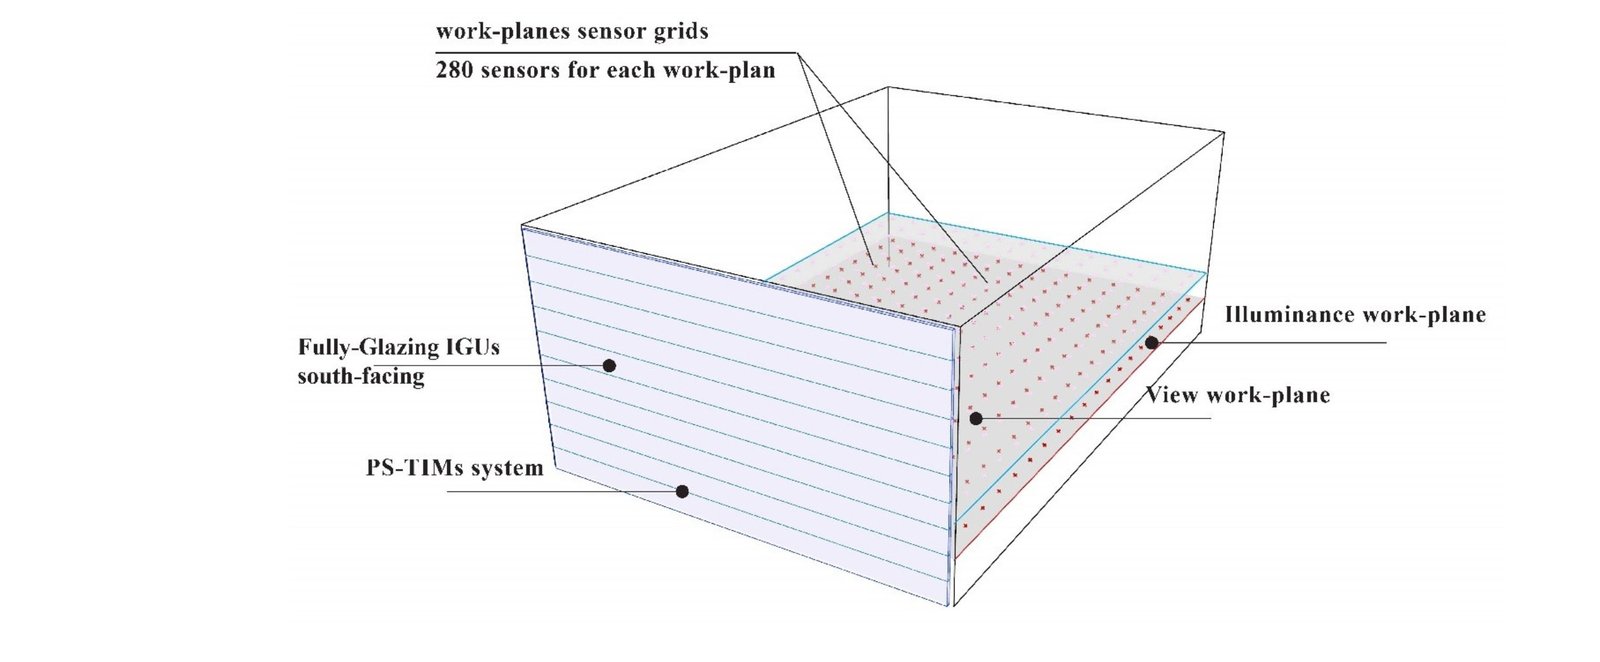
Fig. 4. 3D view of the reference case integrated with IGUs/PS-TIMs system.
Table 2
![Properties of selected IGUs glazing system adapted from [2].](figures/12-125-23.jpg)
Table 2. Properties of selected IGUs glazing system adapted from [2].
Table 3

Table 3. PS-TIMs parameters selected and their ranges.
4. Results and discussion
The final result is divided into two stages. In the first phase, statistical analysis based on three methods were used for UA and SA to predict the best acceptable daylighting threshold setpoint and determine the most feasible objectives that are closely related to each other to determine the final ranking of objectives based on their weights and linear relation and correlation for final optimized under sub-tropics climate. In the second stage of the results, multi-objective optimization result based on the best UDI-TCS thresholds and ranking objectives were analyzed to predict the most feasible solutions and to determine whether best UDI-TCS and optimized objectives based on optimal independent variables have dissimilar effects on the outcome objectives. The results of the optimization-based statistical analysis for best UDI-TCS based on ranking optimizing objectives are provided in three steps: Objective’s weights, correlation, and regression. UA and SA deals with the correlation and regression method to find out how input objective affect the daylight performance based different UDI-TCS by decomposing the variance of outputs into each input setpoint. In the UA correlation, the partial rank correlation coefficient (PRCC) is used, meanwhile, the coefficient of determination R2 is used in the SA regression.
4.1. Objective’s weights, correlation, and regression
4.1.1. Optimal UDI-TCS based on criteria’s weights
Choosing the optimal option from a finite collection of decision alternatives in terms of numerous competing objectives is typically a critical task. Thus, the PC-OWs play a very crucial part in the process of decision-making for the optimal choice. In this step of analysis, the OWs, determined by the SDW method, reflect the objective data information of the objectives for different UDI-TCS. For a better comprehension of the results, when ranking the objectives based on their weighted value, the smaller values of SDW, which show that the data points cluster closer to the mean, are more consistent. On the other hand, larger values indicate that the data deviates further from the mean. This step is the key to the decision-making process to selected best UDI-TCS, and generally, no eventual UDI-TCS design recommendation should be taken without establishing a correlation and regression of UA and SA. Table 4 shows the SDW analysis of the six optimized objectives based on five UDI-TCS. From the table, it can be noted that, All UDI-TCS showed the same theme in ranking objectives based on their weights, especially in first and second places. Meanwhile, UDI-TCS-03 showed a large dispersion in ranking the objectives. it can be seen that the QV and ASE weights were critical and more consistent against different UDI-TCS. The ASE is the objective that have the lowest value of SDW and is ranking in first place followed by QV ranking in second place in UDI-TCS-1, UDI-TCS-2, UDI-TCS-4, and UDI-TCS-5. Meanwhile, the third place was distributed between objectives. The PMV is placed in third place in UDI-TCS-4 and UDI-TCS-5. while the PPD in UDI-TCS-1, and DA in UDI-TCS-2. The DA ranking in fourth place in three UDI-TCS. and ASE and PMV in two UDI-TCS. Finally, the PMV placed in last ranking in three UDI-TCS, and PPM in two UDI-TCS. From analysis above it can be concluded that the ASE and QV are the most objectives that have critical weights against UDI for selected the best UDI-TCS, because they have the strong relationship to UDI than other objectives. Thus, UDI-TCS-02 is the best setpoint followed by UDI-TCS-05. UDI-TCS-04 and UDI-TCS-01 are the third and fourth best setpoints. Meanwhile the UDI-TCS-03 is the worst. However, the large dispersion of objectives ranking based on their weights in different UDI-TCS calls for a further analysis to identify the most influential daylight setpoints. Thus, the correlation and regression analysis for UA and SA needs to be performed for every UDI-TCS setpoint against the objectives.
Table 4

Table 4. SDW of ranking optimized objectives against UDI-TCS.
4.1.2. Correlation-based UA of objectives for ranking UDI-TCS
In this stage, the correlation method is used to determine the correlation between each daylighting threshold control setpoint, and each objective function based optimal solutions of TIMs design parameters applied to the base case model. In this step a partial rank correlation coefficient (PRCC) is used to test the linear relationship between UDI threshold control setpoints and objectives. For a better understanding of the results from the SA based correlation, If the correlation between daylighting threshold control setpoint and the objective located between -1 to -0.5 or 0.5 to 1 (negative or positive) are considered as linear correlated sensitive objective (CSO). Meanwhile, the objectives located between -0.5 and 0.5 are considered as un-linear and uncorrelated sensitive objectives (USO). The correlated sensitive objectives are included in the next optimization SA, by ranking them in first place and giving them the greatest weight in determining the best UDI control setpoint. Meanwhile, the uncorrelated optimized objectives are ranked in second place. As mentioned above, in this stage of optimization uncertainty analysis, all objectives are given an equal weight for all objectives and design parameters of TIMs to present the optimal daylighting threshold control setpoint based on the strongly correlated sensitive objectives that have the major impacts to balance between different UDI criteria.
Table 5 shows the PRCC correlation analysis of the six optimized objectives base five UDI-TCS. The cells are coloured with dark red representing a high negative value and dark blue representing a high positive number for a quick overview. The table shows that the model has a strong linear relationship for the various daylight quantity and quality parameters, but not so much for measurements of thermal comfort. This means that the PRCC correlation technique is suitable to rank the importance of the design objectives based different UDI threshold setpoints, since the PRCC is a valid technique for linear and non-linear systems. It’s clearly noted that from Table 5, for all objectives, it is evident that the UDI, QV, and AES is the objectives that have linear strong correlations against each other’s. In another words, improved UDI percentages greatly affect the QV and ASE percentages in the first place. while UDI correlation against DA is varied between linear and non-linear relation based on UDI control setpoints. Meanwhile, UDI correlation against PPD and PMV are performing the worse since it has non-linear relation.
Table 5
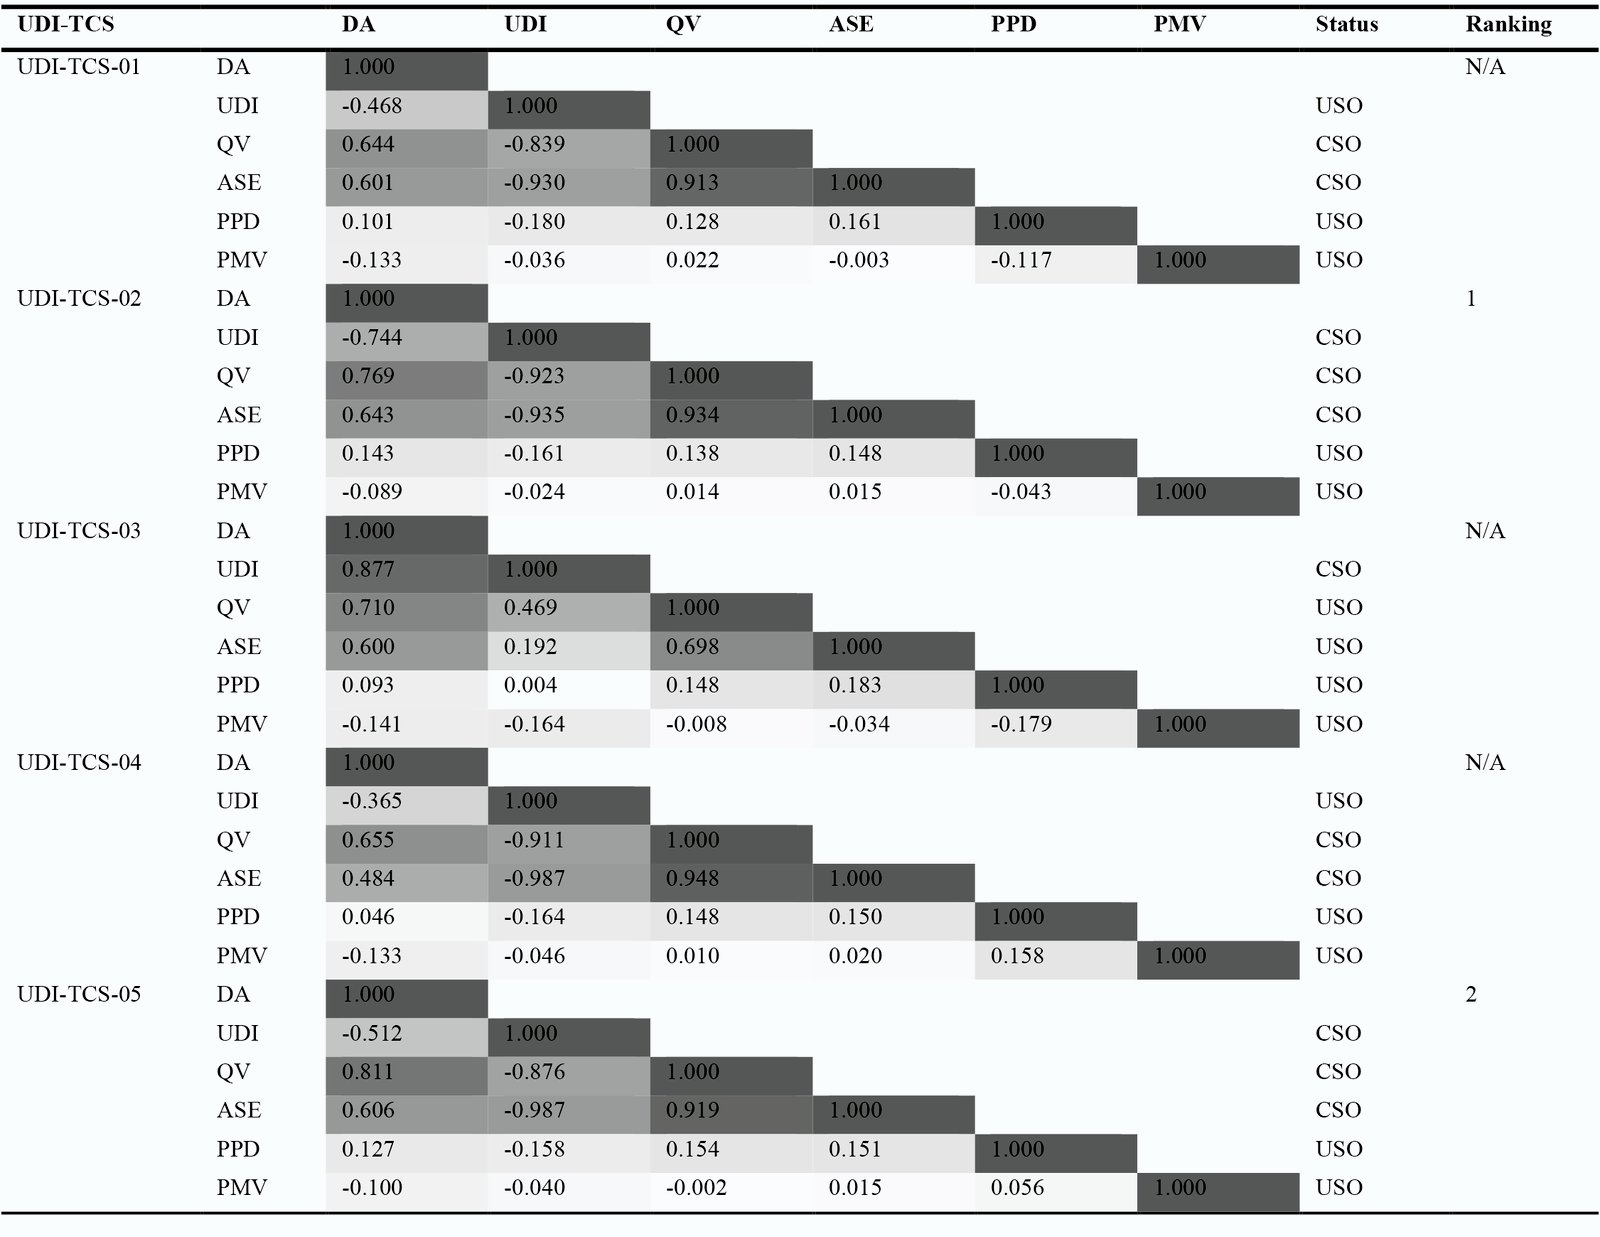
Table 5. PRCC correlation coefficient for ranking the optimized objectives in the different UDI-TCS.
Form all UDI-CTS, the PRCC correlation analysis based on first place and second place ranking objectives of QV, AES, and DA against UDI showed that the UDI 500-1000 setpoint ranked in the first place, because it has the best PRCC correlations with linear strong PRCC correlations value for QV, AES, and DA against UDI (PRCC = -0.923, -0.935, and -0.744) followed by UDI500-2000 (PRCC = -0.876, -0.987, and -0.512). while the setpoints of UDI300-2000 and UDI100-1000 ranked in second place with linear PRCC correlations for QV and AES (PRCC = -0.911 and -0.87; PRCC = -0.930 and -0.839) and non-linear PRCC correlation for DA (PRCC = -0.365, and PRCC = -0.468). Meanwhile, UDI100-2000 setpoint is the worse since it has non-linear PRCC correlation for QV and AES against UDI with PRCC = 0.469, and 0.192, and linear PRCC correlation for DA with PRCC = 0.877.
From the analysis above and Based on the PRCC correlation, the final selection criteria for best UDI-TCS will focus on the linear relationship of the QV, ASE, and DA as the most objectives impacts. However, the large dispersion of all daylight setpoints performance based on DA as second most affective objective shows different uncertainty characteristics between linear and non-linear relation calls for a further analysis to identify the most influential daylight setpoint. Thus, the SA needs to be performed for every setpoint for UDI against the DA, QV and AES objectives as main optimization objectives since they have a major impact on UDI thresholds in next step. From PRCC analysis, is can be noted that, UDI-TCS-02 is the best setpoint, followed by UDI-TCS-05. Meanwhile, UDI-TCS-01 and UDI-TCS-04 is considered out of recommended ranking range since the DA objective is considered as uncorrelated sensitive objective (PRCC= -0.4 and PRCC = -0.365 respectively). And the UDI-TCS-03 are the worst, since the QV and AES objectives considered as uncorrelated sensitive objective (PRCC= 0.469 and PRCC = 0.192 respectively). Thus, UDI-TCS-01, UDI-TCS-04, and UDI-TCS-03 are considered as N/A in ranking as shown in Table 5.
4.1.3. Regression-based SA of ranking objectives
After obtaining the optimal UDI-TCS, it is beneficial to estimate the variation of the objective’s weights. To investigate the stability of the results of optimal UDI-TCS against optimal objectives, proper sensitivity analyses must be conducted. Since the highest-ranked objectives in SA result in the greatest change in the relevant UDI, they should be carefully taken into account when making decisions of UDI-TCS. SA allowing to identify how the final optimal UDI-TCS would change if the criteria’s weights differ, and allowing to determine how the ranking of the optimized objectives might change in accordance with the variation of the UDI-TCS. This step is the key to the decision-making process for final optimization process. The goal of this step is to exclude the least influential objectives from the final optimization process for each best UDI-TCS. In this Step, multiple regression analysis based on coefficient of determination (𝑅2), has been used.
From the analysis above of the objectives' weights and UA, it was concluded that the UDI-TCS-02 and UDI-TCS-05 are the best thresholds. And QV, AES, and DA are the objectives that have linear correlations to UDI and against each other’s. Meanwhile, the worst objectives PPD and PMV which has un-linear and uncorrelated to UDI and will be ignored in this step. To better understand the relationship between every two linear correlations objectives in each best threshold; UDI-TCS-01 and UDI-TCS-04, the R2 results are calculated, as shown in the scatterplots in Figs. 5 and 6, respectively. The goal of this step is to rank the QV, ASE, and DA objectives in both optimal UDI-TCS. As seen in Fig. 6, For both optimal UDI-TCS, the objectives of ASE and QV have normal distribution plots showing a strong linear pattern, 𝑅2 greater than the threshold 0.7 against UDI and against each other’s, meanwhile the DA showed a lower linear pattern of R2 (less than the significance level 0.7) against UDI, ASE, and QV. From the figures, it can be concluded that the ASE objective has the best results for R2 against UDI when compared to QV against UDI. Table 6 summarized the linear relationship (LR) of R2 for ASE, QV, and DA against UDI and against each other’s for final ranking the objectives. From the table. it clearly seen that in both UDI-TCS, the ASE has the best R2 value and ranking in first place, followed by QV in second place. Meanwhile the DA was marked as non-linear relationship (N/LR), and which ignored in final optimization process.
Figure 5

Fig. 5. Coefficient of determination of linear correlations objectives against each other’s in best UDI-TCS-02.
Figure 6
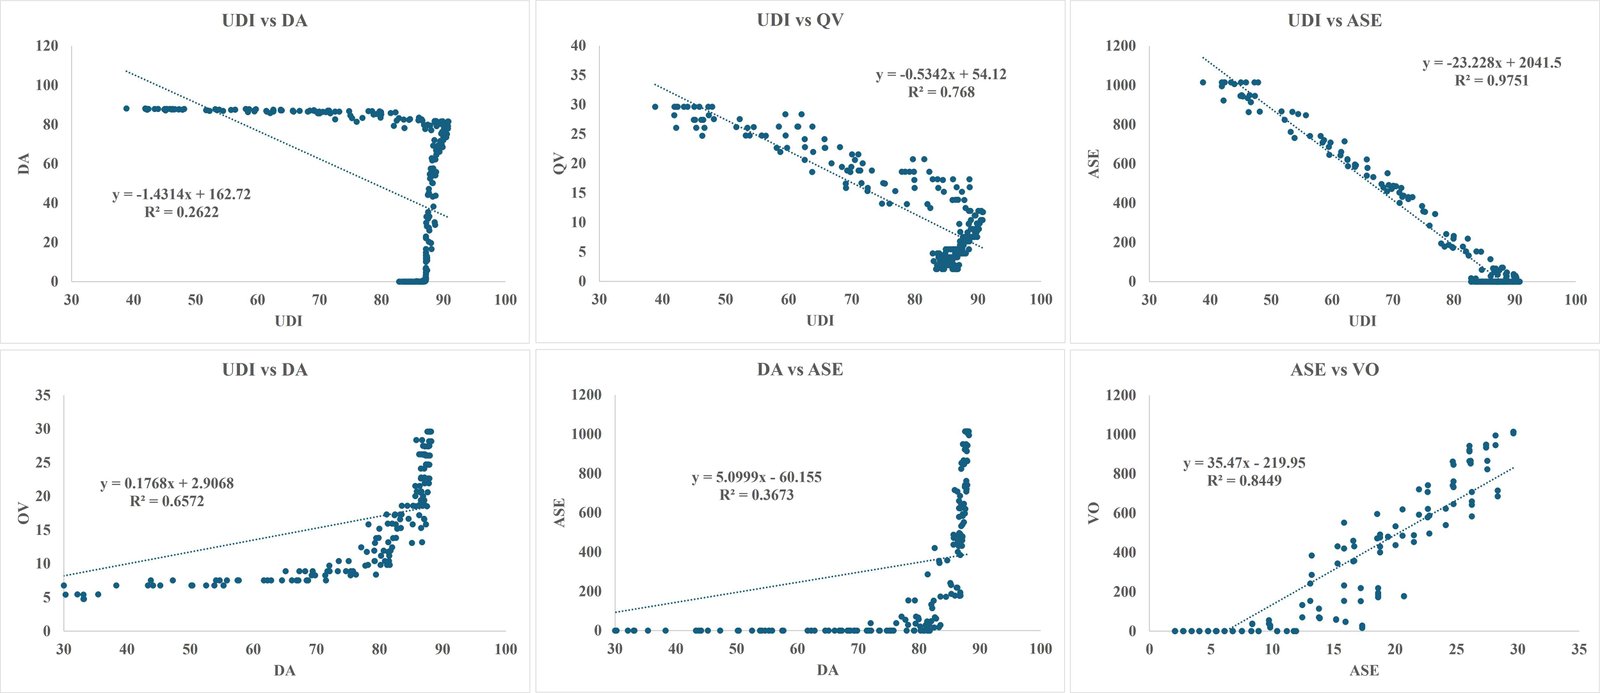
Fig. 6. R2 analysis of PC-OWs against each other’s under both best UDI-TCS thresholds and their final ranking.
Table 6
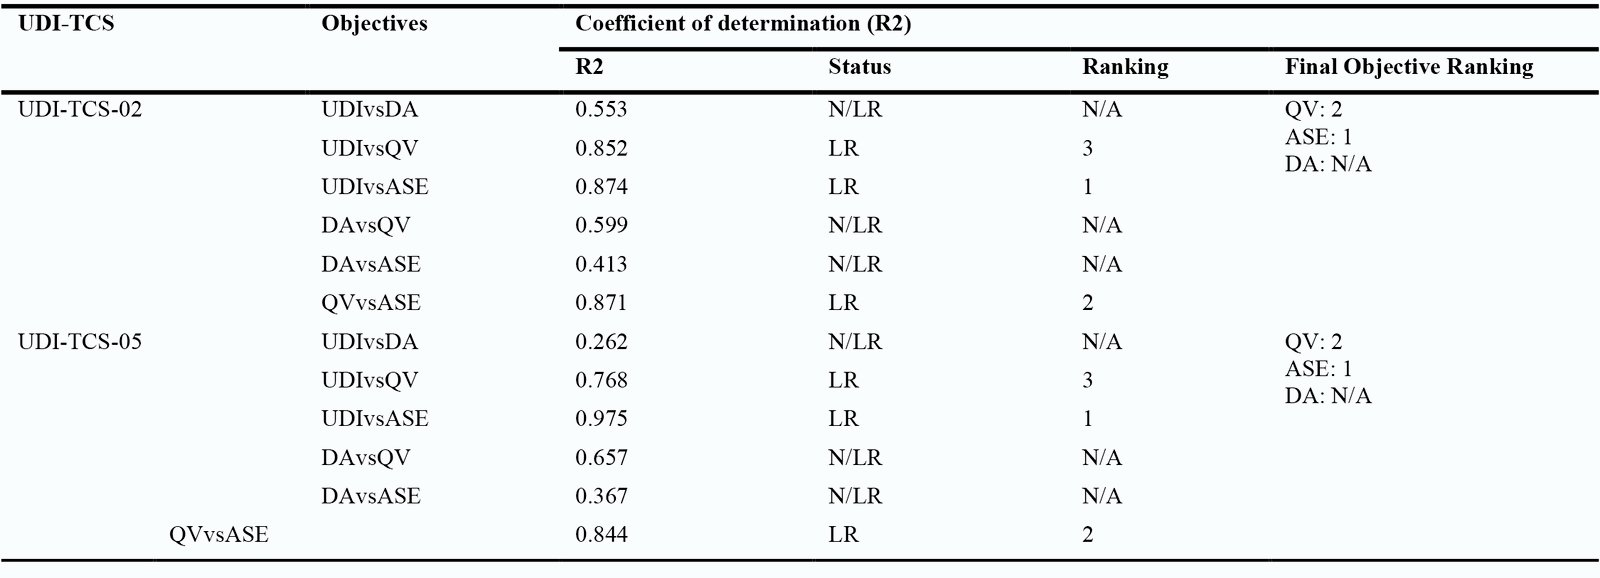
Table 6. R2 analysis of PC-OWs against each other’s under both best UDI-TCS thresholds and their final ranking.
4.2. IGUs/PS-TIMs optimal solutions
4.2.1. 2D trends visualization of optimal pareto solutions
This paper determined the best UDI threshold setpoints based on optimal Objectives weights, strong linear correlation and relationships between optimized objectives. Six objectives have been optimized representing daylight availability, visual discomfort, and thermal performance to find the best UDI threshold setpoint using different statistical analysis techniques based on OWs, UA correlation, and SA regression to ranking the best UDI-TCS based on critical objectives ranking. Overall, the statistical analysis of OWs, UA correlation, and SA regression results proved that the ranking of variables in the UDI-TCS sets did not change significantly in all cases. Therefore, the stability and certainty for the best UDI-TCS optimal thresholds and optimal critical objectives for final optimization step of the IGUs/PS-TIMs were validated. After getting the necessary formalities for selected objectives based on OWs, UA, and SA, MOO was conducted to get the optimal Pareto dominant solutions of the proposed system and ranking those solutions in the best UDI-TCS sets based on the critical objectives weights. based on OWs, UA, and SA analysis it found that the UDI-TCS-02 and UDI-TCS-05 as best UDI threshold setpoint, meanwhile, the UDI, ASE, and QV respectively, are the most objectives that have critical weights and strong linear correlation against each other’s meanwhile the DA, PMV, and PPD were the objectives that has been less objectives weights and have un-linear correlation. Thus, the final MOO run based on these critical objectives weights to find the best optimal Pareto dominant solutions and the other objectives are calculated for optimal solutions. However, the final ranking solutions for all design alternatives of best optimal Pareto dominant solutions for each best UDI-TCS depends on the high percentages of UDI followed by ASE value and then QV.
The MOO optimization process in this study is based on the Evolutionary Genetic algorithm (EGA) engine for Grasshopper3D, Wallacei, a multiple dependent objective optimization generator. After 30 iterations in every type of IGUs/PS-TIMs, the optimization results have reached convergence. The total design of four IGUS/PS-TIMs were generated over traversing 1260 parametric simulations. To better understand the relationship between input parameters and objectives in each optimal UDI-TCS setpoints, the Pareto optimal solutions are rendered as 2D parallel coordinates plot by using Design Explorer tool, as shown in Figs. 7 and 8, respectively. To display the multi-dimensional design space, Design Explorer was employed. Using all parametric simulation data that is input into a CSV file, this utility creates a 2D parallel coordinates display. However, due to the heavy number of simulation iterations, only five optimal Pareto solutions for every type of IGUS/PS-TIMs are presented. The figures illustrate the results of the parametric experimentation in a parallel coordinate plot, where each design solution and corresponding performance indicator are indicated by a single line with highlighted the critical objectives to identifying the best solution for each UDI-TCS set.
Figure 7
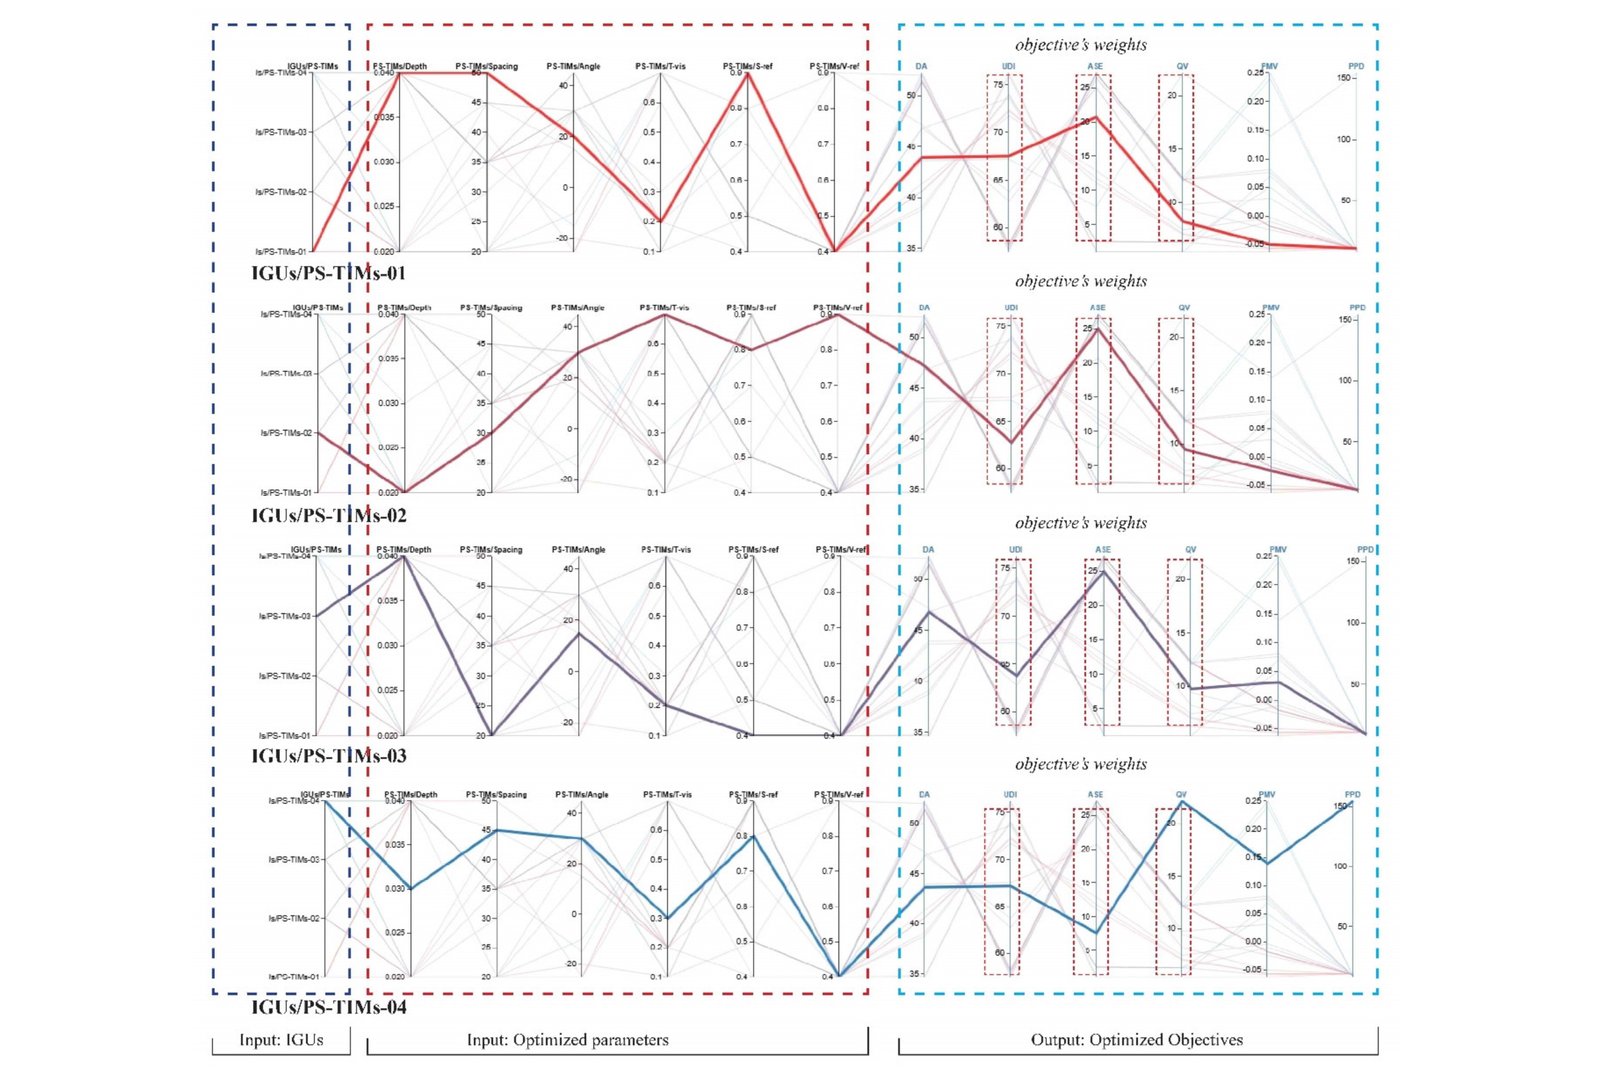
Fig. 7. Distribution of optimal Pareto solutions of four IGUs/PS-TIMs sets and filtered best optimal Pareto dominant solutions based on critical objectives weights first setpoint selected (UDI-TCS-02).
Figure 8
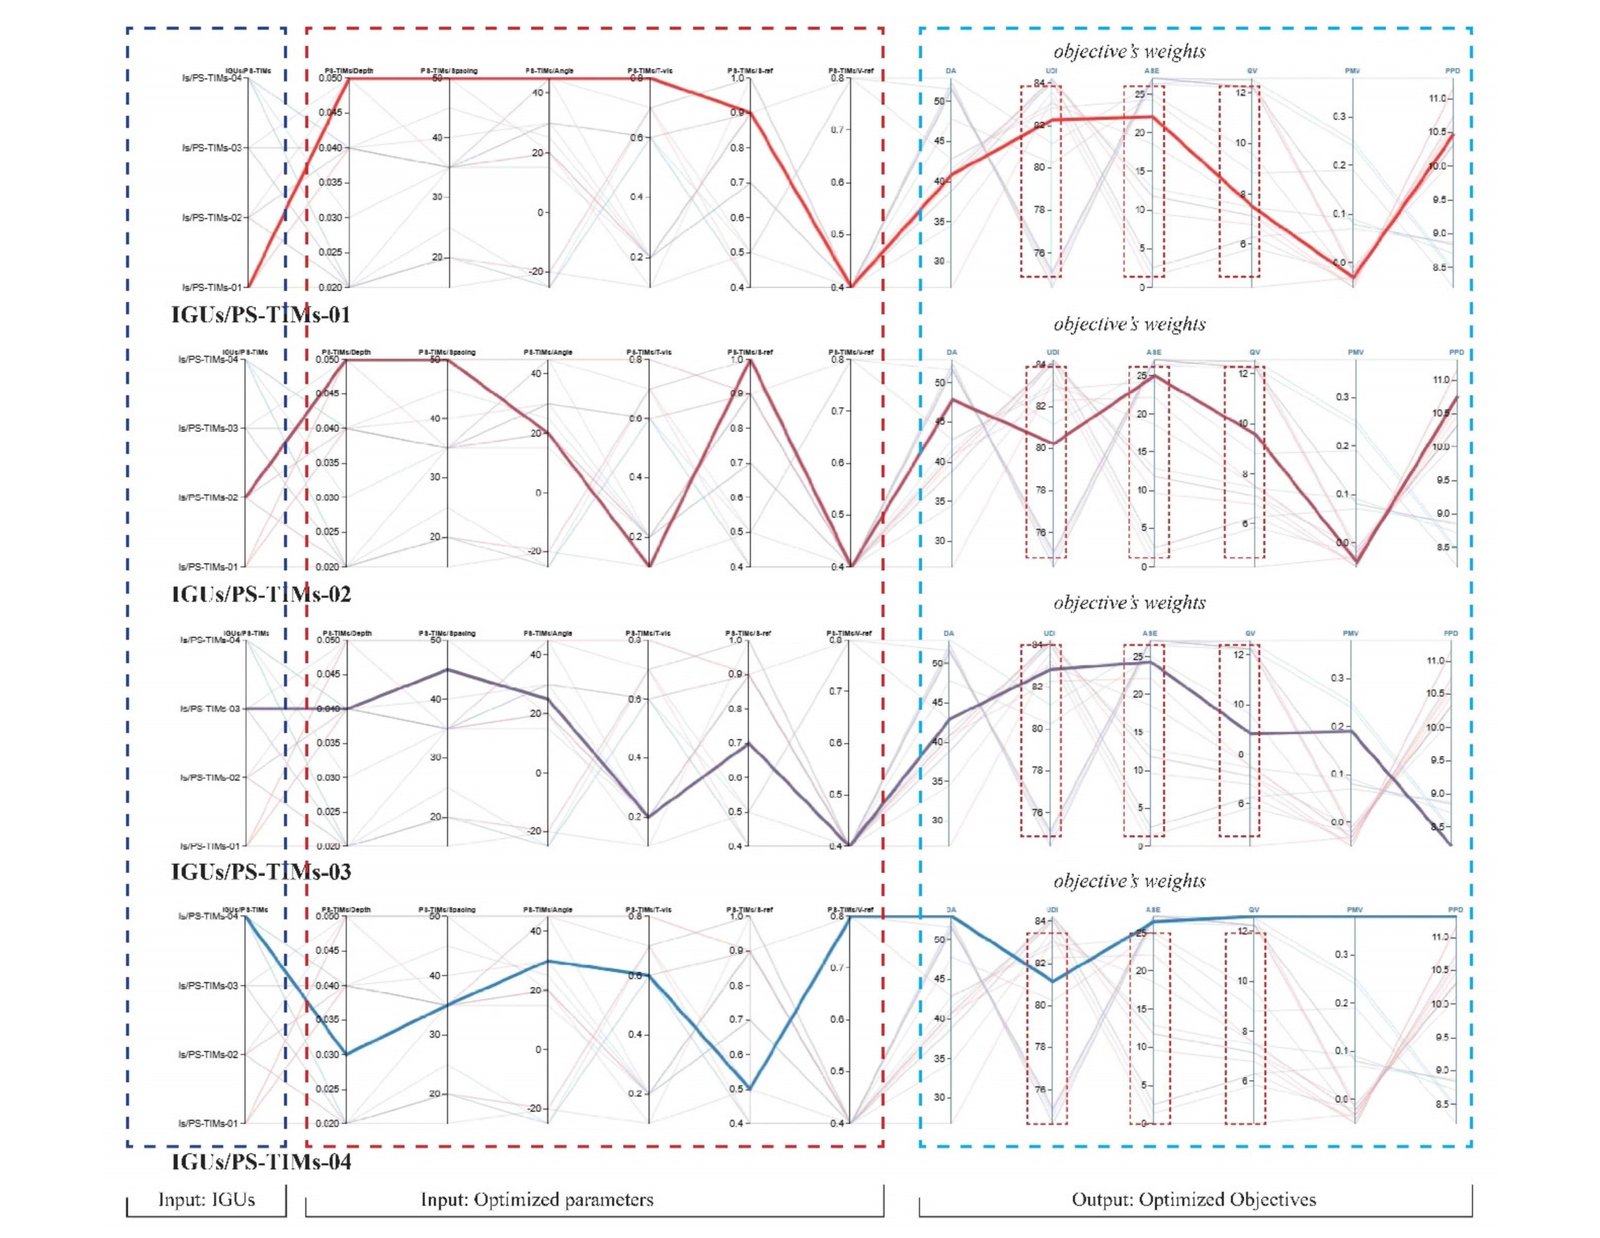
Fig. 8. Distribution of optimal Pareto solutions of four IGUs/PS-TIMs sets and filtered best optimal Pareto dominant solutions based on critical objectives weights second setpoint selected (UDI-TCS-05).
It is evident from Figs. 7 and 8, that there is conflict between the objective functions. One goal's optimality does not translate to other objectives' optimality. The goal functions in both UDI-TCS exhibit similar trend changes, suggesting that there is a coupling relationship between the objective functions. There is an interesting phenomenon that the critical objectives weights in all best Pareto optimal solutions in the both optimal UDI-TCS shows that with the increase of UDI, the ASE of best optimal Pareto solutions improved, meanwhile the QA was reduced a little. this result was confirmed by ranking the objectives in statistical analysis stages of OWs, UA, and AS. in other words, there is a strong positive relationship between UDI and ASE and positive relationship with QV but opposite direction. To find the relationship between UDI, ASE, and QV of the best Pareto solutions, these Pareto solutions were drawn in Figs. 9 and 10. It can be seen that in these Pareto solutions in both UDI-TCS, there is a positive correlation between UDI, ASE, and QV with R2 value ranged between 0.71 to 0.94 in UDI-TCS-02 and between 0.79 to 0.97 in UDI-TCS-05 for UDI, for ASE, the R2 value ranged between 0.94 to 0.97 in UDI-TCS-02 and between 0.96 to 0.98 in UDI-TCS-05, and for QV, the R2 value ranged between 0.83 to 0.96 in UDI-TCS-02 and between 0.89 to 0.95 in UDI-TCS-05. Overall, based on the ranking of the objectives weights and the value of objectives, it can be concluded that the best control point is the UDI-TCS-05 (UDI500-2000lux), as a result of its superiority in improving UDI and ASE. But when given the priority to QV, it can be concluded that the UDI-TCS-02 (UDI500-1000lux) is the optimal threshold.
Figure 9
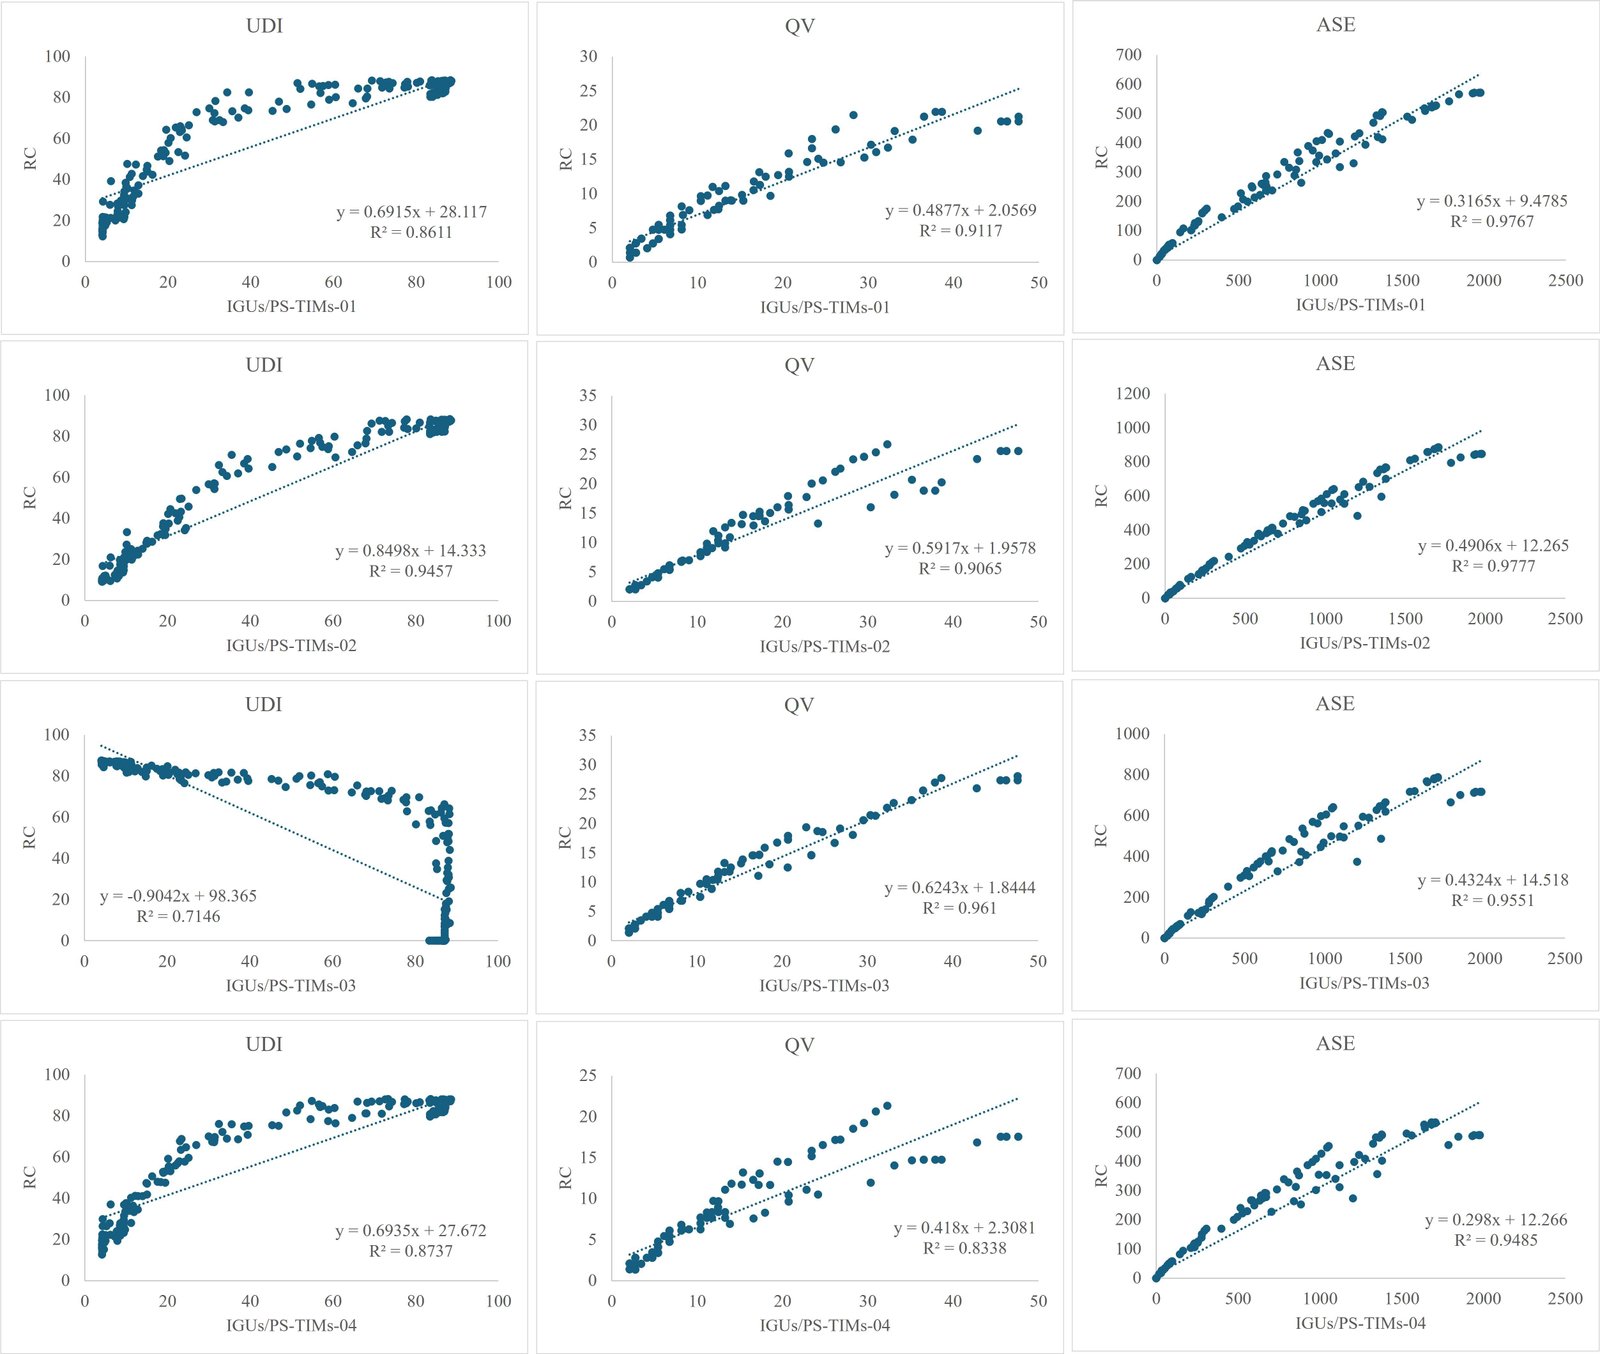
Fig. 9. Regression plot between objectives of best optimal Pareto dominant solutions and reference case based on first setpoint selected (UDI-TCS-02).
Figure 10
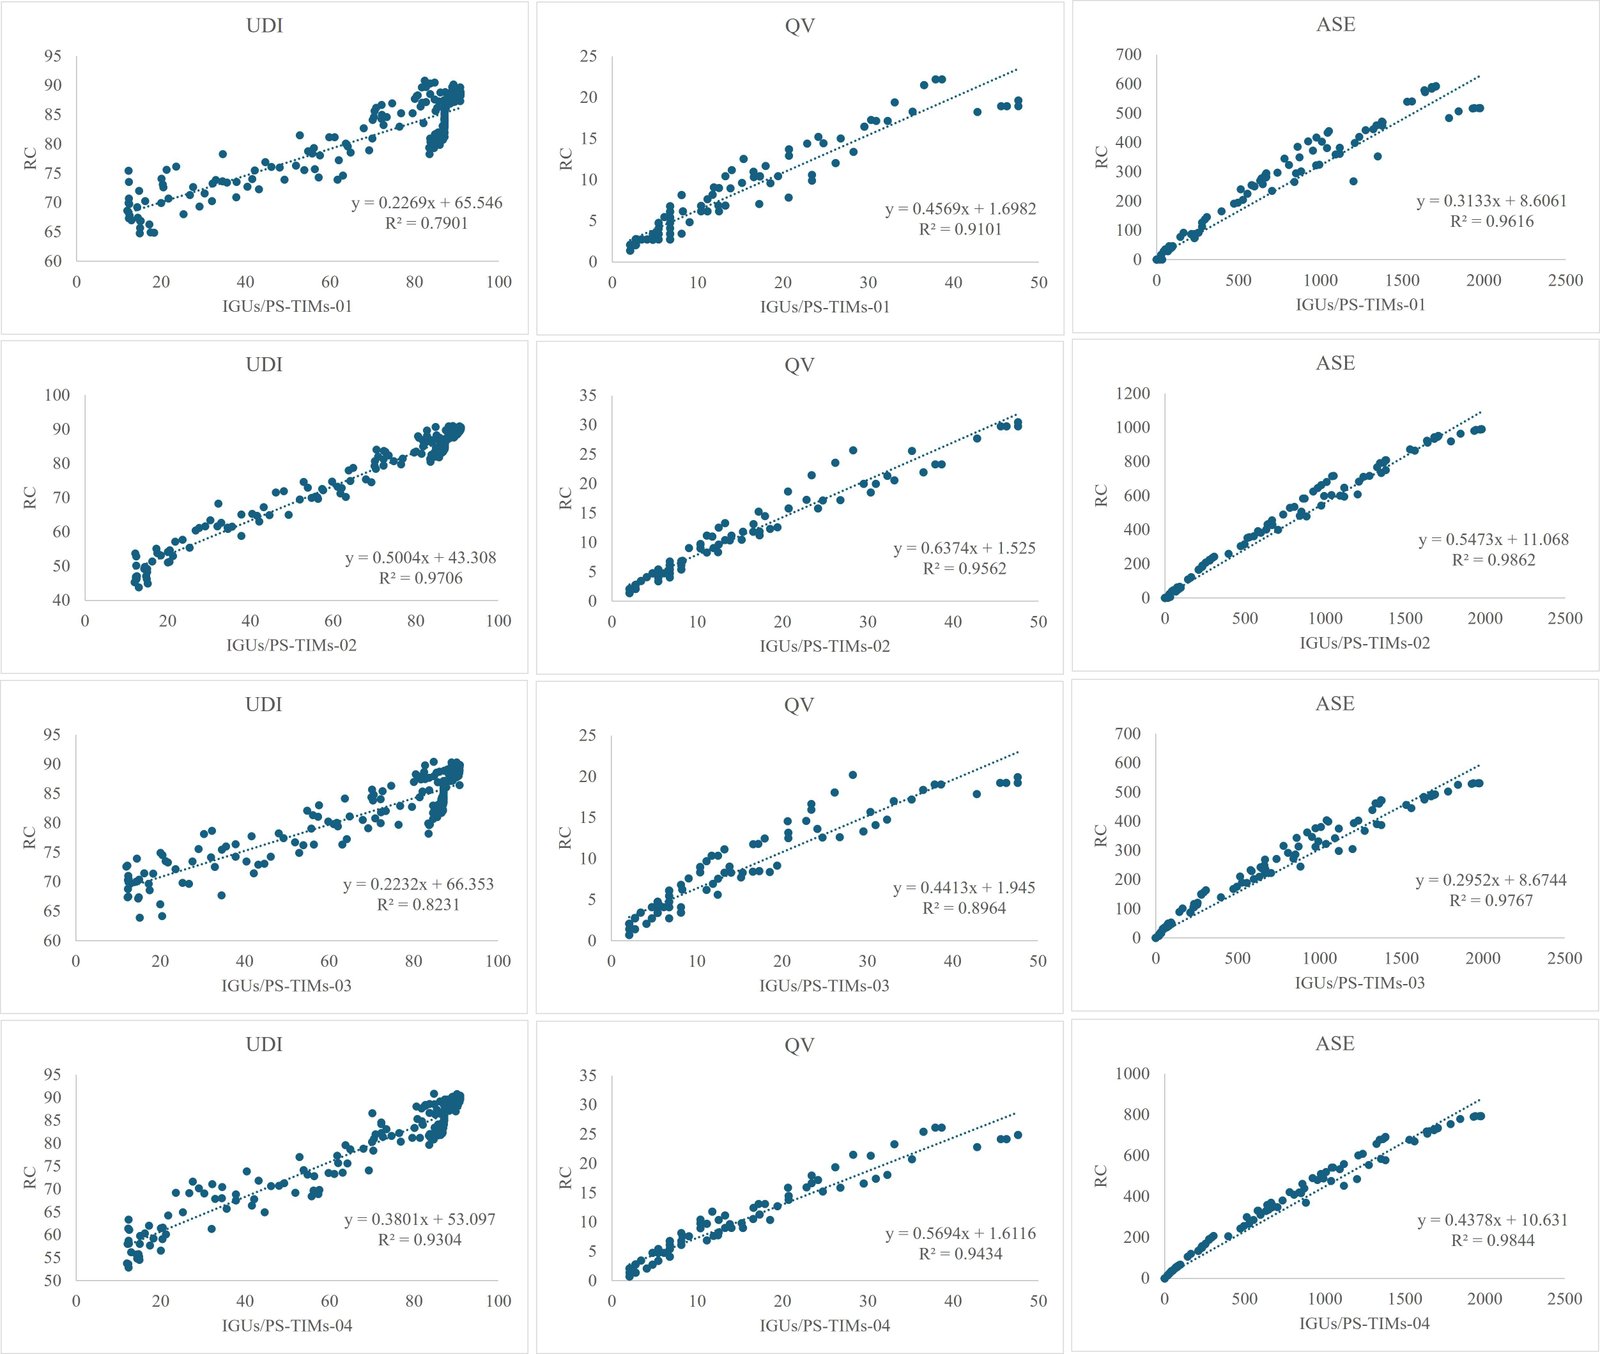
Fig. 10. Regression plot between objectives of best optimal Pareto dominant solutions and reference case based on second setpoint selected (UDI-TCS-05).
4.2.2. Fitness results analysis of optimal Pareto solutions
The ideal scheme values for the three objective functions of both UDI-TCS-02 and UDI-TCS-05 are normalized and shown in a radar map, as seen in Fig. 11, to better illustrate and comprehend the best value distribution of the three objective functions. From the density of distribution in three directions in Fig. 12, it can be seen that the relation between UDI and ASE is relatively close. It can also be found that, as for the antagonistic relationship between UDI, ASE, and QV, in all Pareto solutions selected for both UDI setpoints show that UDI and ASE are greatly improved with a slight decrease in QV. The frequency distribution of optimization objectives and optimal parameters in Pareto solutions of IGUs and PS-TIMs is shown in Table 7. That is evident from these Pareto solutions, there are significant differences between some of the most advised parameters for PS-TIM optimization variables in four IGUs for both UDI-TCS. It can be seen from the table, under the priority of interconnected weight goals of UDI, ASE, and QV respectively for ranking best balanced solutions, the best optimal configuration of the IGUs/PS-TIMs in UDI-TCS-02 is the IGUs/PS-TIMs-01 followed by IGUs/PS-TIMs-04, meanwhile IGUs/PS-TIMs-03 and IGUs/PS-TIMs-02 ranking in third and fourth respectively. In UDI-TCS-05 is the IGUs/PS-TIMs-03 ranking in the First Place followed by IGUs/PS-TIMs-01, meanwhile IGUs/PS-TIMs-03 and IGUs/PS-TIMs-04 ranking in third and fourth respectively. Figures 13 and 14 visualization of UDI comparison for optimal selected of four IGUs/PS-TIMs solutions based on UDI-TCS-02 and UDI-TCS-05 setpoints.
Figure 11

Fig. 11. Best balanced genes Fitness selected for best optimized objectives value under UDI-TCS-02.
Table 7
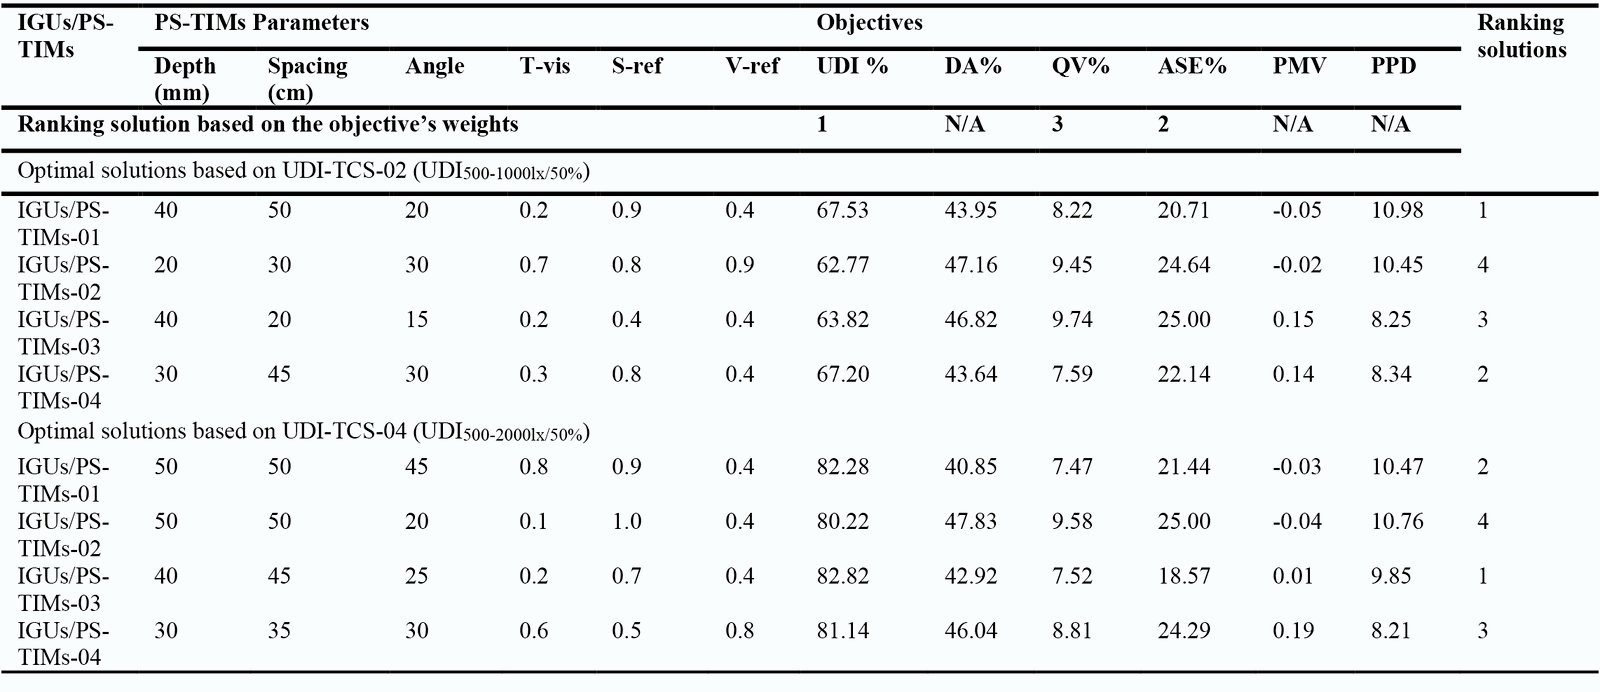
Table 7. Comparison results of the optimal design parameters of PS-TIMs for each IGUs in each best UDI-TCS set, and selected solution based on ranking objective’s weights.
Figure 12
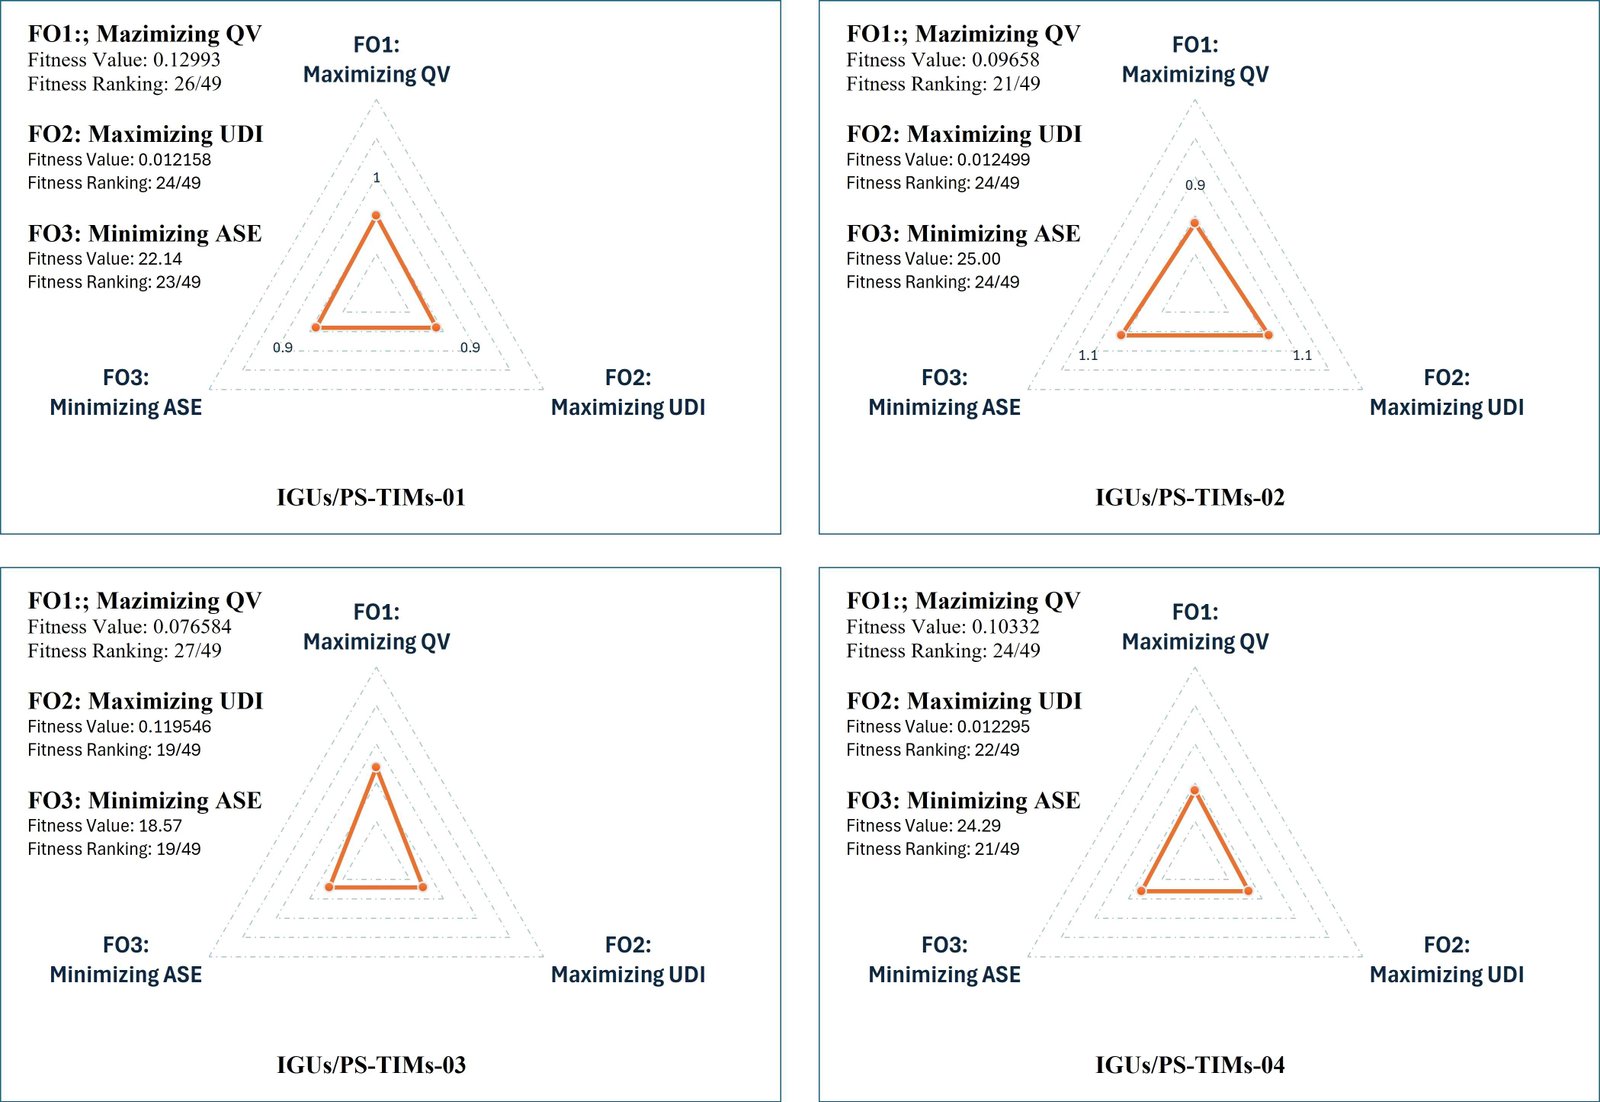
Fig. 12. Best balanced genes Fitness selected for best optimized objectives value under UDI-TCS-04.
Figure 13
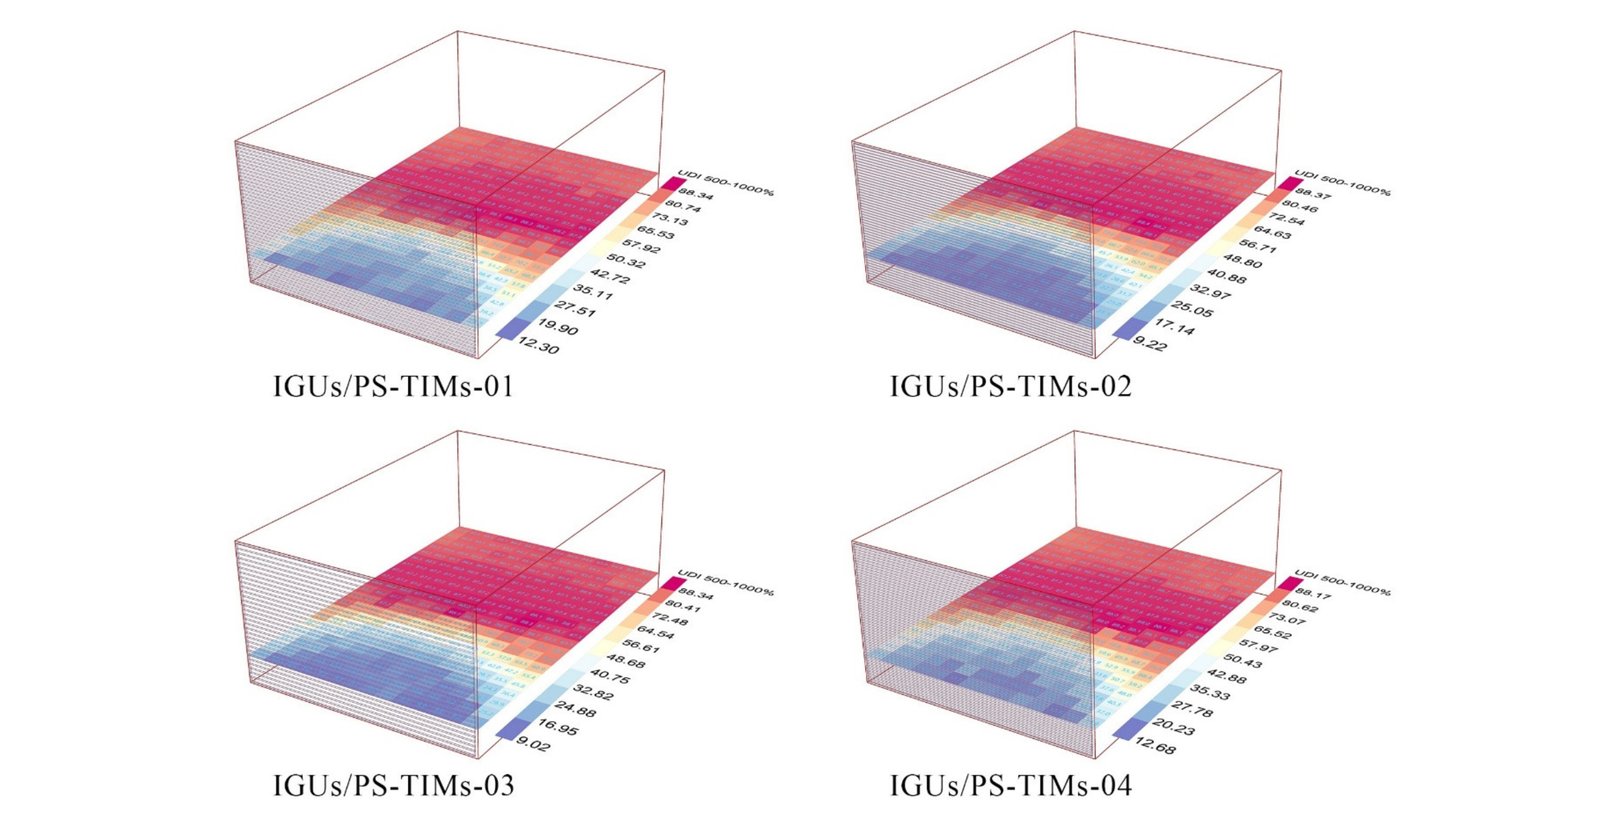
Fig. 13. Visualization of UDI comparison for optimal selected of four IGUs/PS-TIMs solutions based on UDI-TCS-02.
Figure 14

Fig. 14. Visualization of UDI comparison for optimal selected of four IGUs/PS-TIMs solutions based on UDI-TCS-05.
Figures 15-18 show the comparison results between the average and optimal design performances, at which the objectives of getting the high percentages of UDI and QV and minimizing ASE achieved by Pareto optimal solutions in the both optimal UDI-TCS compared to RC. However, because of the natural contrast between daylighting availability, and view quality against visual and thermal occupants’ comfort criteria group and based on the given the priority of interconnected goals in the MOO, the optimal design solutions provoked improvements in UDI and ASE, but slightly drawbacks in DA, QV, PMV, and PPD values. Compared to RC, the critical objectives weights are greatly improved especially UDI and ASE, while QV is slightly decreased. Meanwhile, the uncritical objectives; DA, PMV, and PPD were slightly decreased. The total average percentage of UDI for daylighting availability achieved by all optimal IGUs/PS-TIMs cases based on their ranking in UDI-TCS-02 by 67.53%, 67.20%, 63.82%, and 62.77% respectively, which resulted in increased UDI by 18.39%, 10.05%, 11.79%, and 17.81% respectively. The total average percentage of ASE for visual comfort achieved by 20.71%, 22.14%, 25.00%, and 24.64% respectively, which resulted in increased ASE by 21.64%, 16.23%, 5.41%, and 6.77% respectively. Meanwhile the total average percentage of QV for visual comfort achieved by 8.22%, 7.59%, 9.74%, and 9.45% respectively, which resulted in decreased QV by 34.71%, 39.72%, 22.69%, and 25.06% respectively. For the optimal IGUs/PS-TIMs ranking in UDI-TCS-05, the total average percentage of UDI for daylighting availability achieved by 82.82%, 82.28%, 81.14%, and 80.22% respectively, which resulted in increased UDI by 12.19%, 11.47%, 9.91%, and 8.67% respectively. The total average percentage of ASE for visual comfort achieved by 18.57%, 21.44%, 24.29%, and 25.00% respectively, which resulted in increased ASE by 29.74%, 16.23%, 8.10%, and 5.41% respectively. Meanwhile the total average percentage of QV for visual comfort achieved by 7.52%, 7.47%, 8.81%, and 9.58% respectively, which resulted in decreased QV by 40.26%, 40.65%, 30.05%, and 23.92% respectively. As mentioned before, the objective functions conflict with each other. When one goal is optimal, it is not optimal for other goals. This was confirmed by the results of this analysis, as can be observed the total average percentage of UDI and ASE are achieved by optimal cases resulted from UDI-TCS-05. Meanwhile, the better QV resulted in optimal cases from UDI-TCS-02.
Figure 15

Fig. 15. Variation of objectives at optimal solutions and RC resulted from UDI-TCS-02.
Figure 16
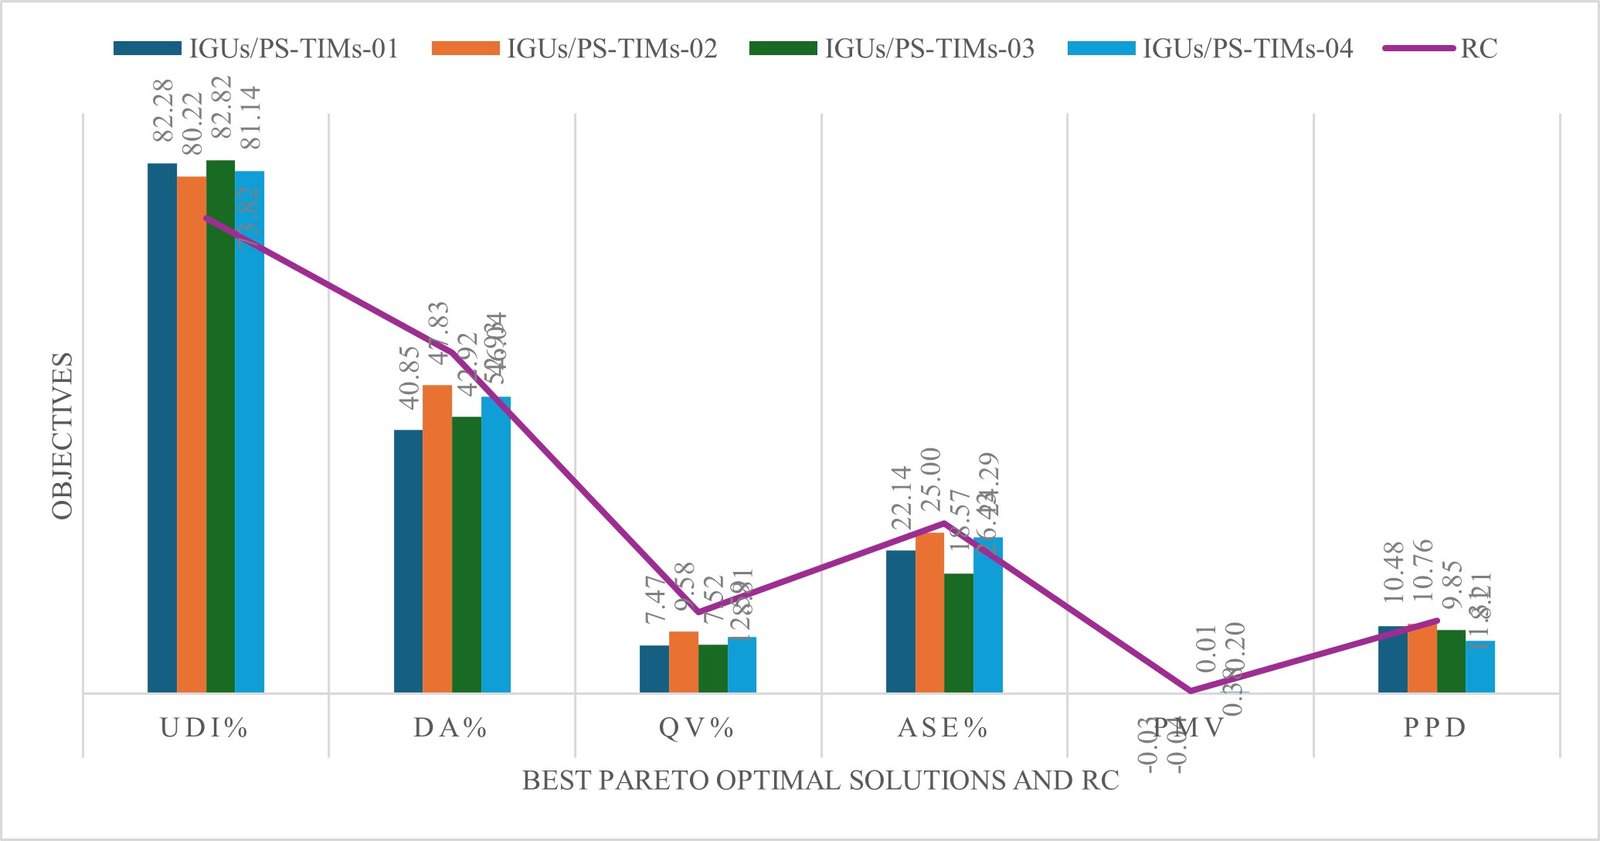
Fig. 16. Variation of objectives at optimal solutions and RC resulted from UDI-TCS-05.
Figure 17

Fig. 17. Comparison of objectives performance between optimal solutions and RC resulted from UDI-TCS-02.
Figure 18
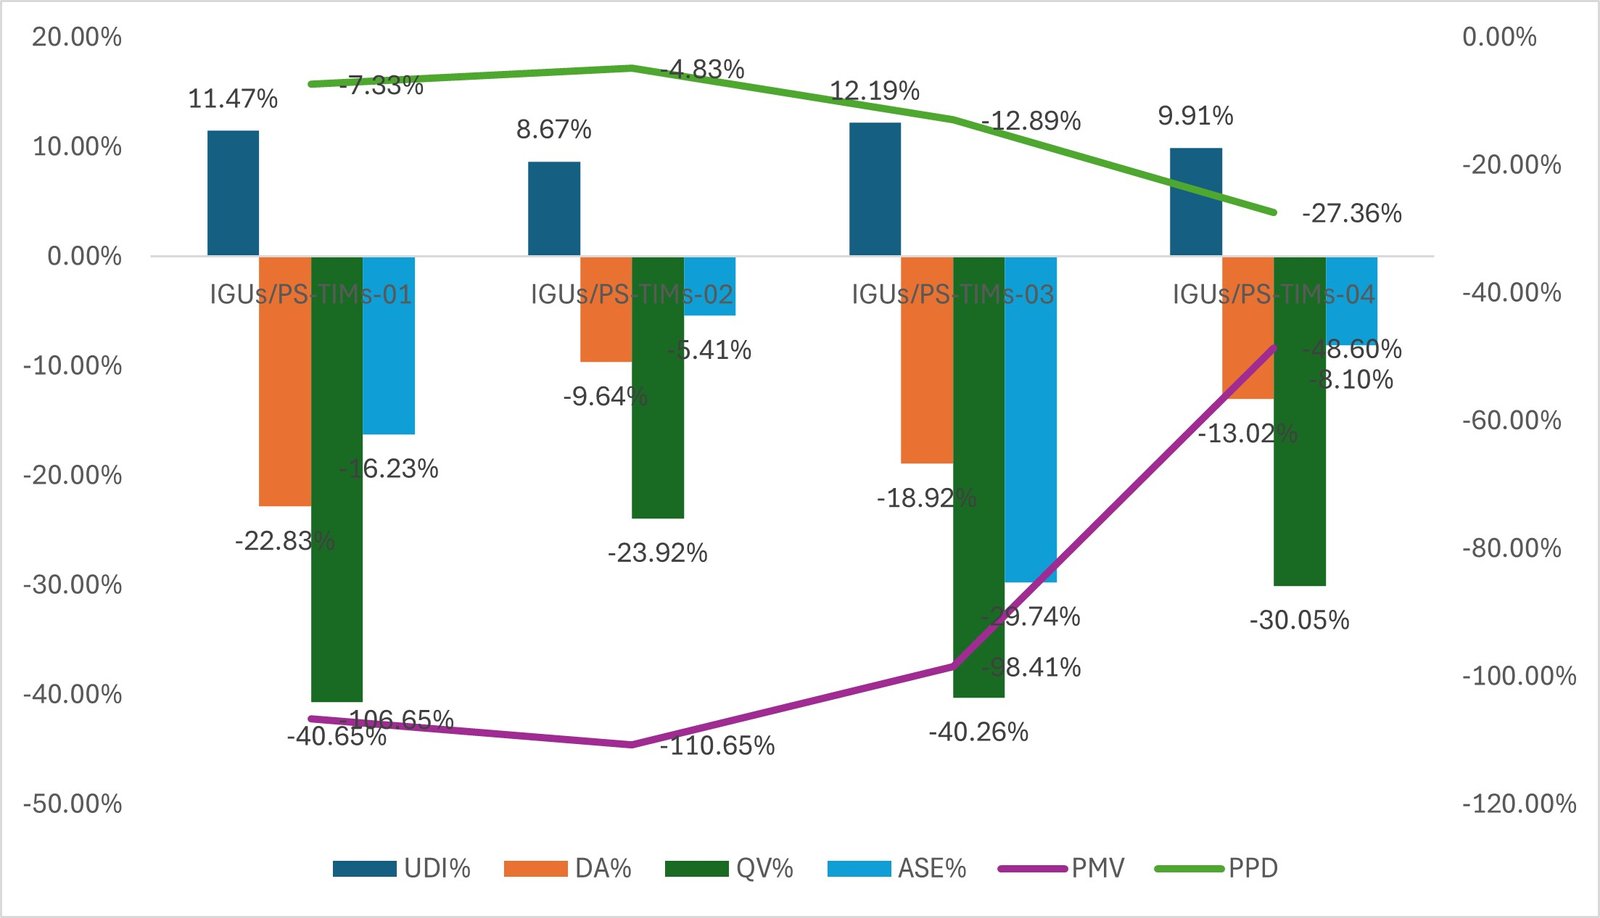
Fig. 18. Comparison of objectives performance between optimal solutions and RC resulted from UDI-TCS-05.
4.2.3. Comparison of optimal schemes in Pareto solutions
In pareto solutions, the scheme of each critical objectives weights is selected to obtain the final optimal ranking of optimal solutions in each threshold. In this condition, the optimal solutions of 8 cases based on two best UDI thresholds can be seen in Table 7 and the comparison between optimal ranking solution against each other based on critical objectives weights of UDI, ASE, QV can be seen in Figs. 19-21. Since multi-objective optimization pursues the simultaneous optimization of equal weight of the three objectives, it can be seen that the total UDI in the first ranking optimal solution of IGUs/PS-TIMs resulted from UDI-TCS-05 threshold had improved the total average percentage of UDI by 22.63% with average difference in UDI percentage about 15.25%. in second ranking solution, UDI improved by 22.44% with average difference in UDI percentage about 15.05%. in third and fourth ranking solutions, UDI improved by 27.64% and 27.80% respectively with average difference in UDI percentage about 17.64% and 17.45% respectively compared to the first ranking optimal of IGUs/PS-TIMs resulted from UDI-TCS-02 threshold. Meanwhile, discomfort percentage is improved when ASE were decreased by 11.52% with average difference in ASE percentage about 2.14% in the first ranking optimal solution, and slightly improved in third ranking solutions by decreased ASE by 2.92% with average difference in ASE percentage about 2.14%. in the fourth ranking optimal solutions, the optimal case resulted from UDI-TCS-02 working better by slightly improved ASE by 1.46%. Meanwhile the second ranking solutions have equal ASE results. For QV, the optimal cases result from UDI-TCS-02 threshold working better by slightly improving QV by 9.31%, 1.16%, 10.56%, and 1.48% respectively, with average difference in QV percentage about 0.7%, 0.12%, 0.93%, and 0.14% respectively.
Figure 19

Fig. 19. Comparison of the performance of UDI metric between optimal solutions of both UDI thresholds against each other’s.
Figure 20
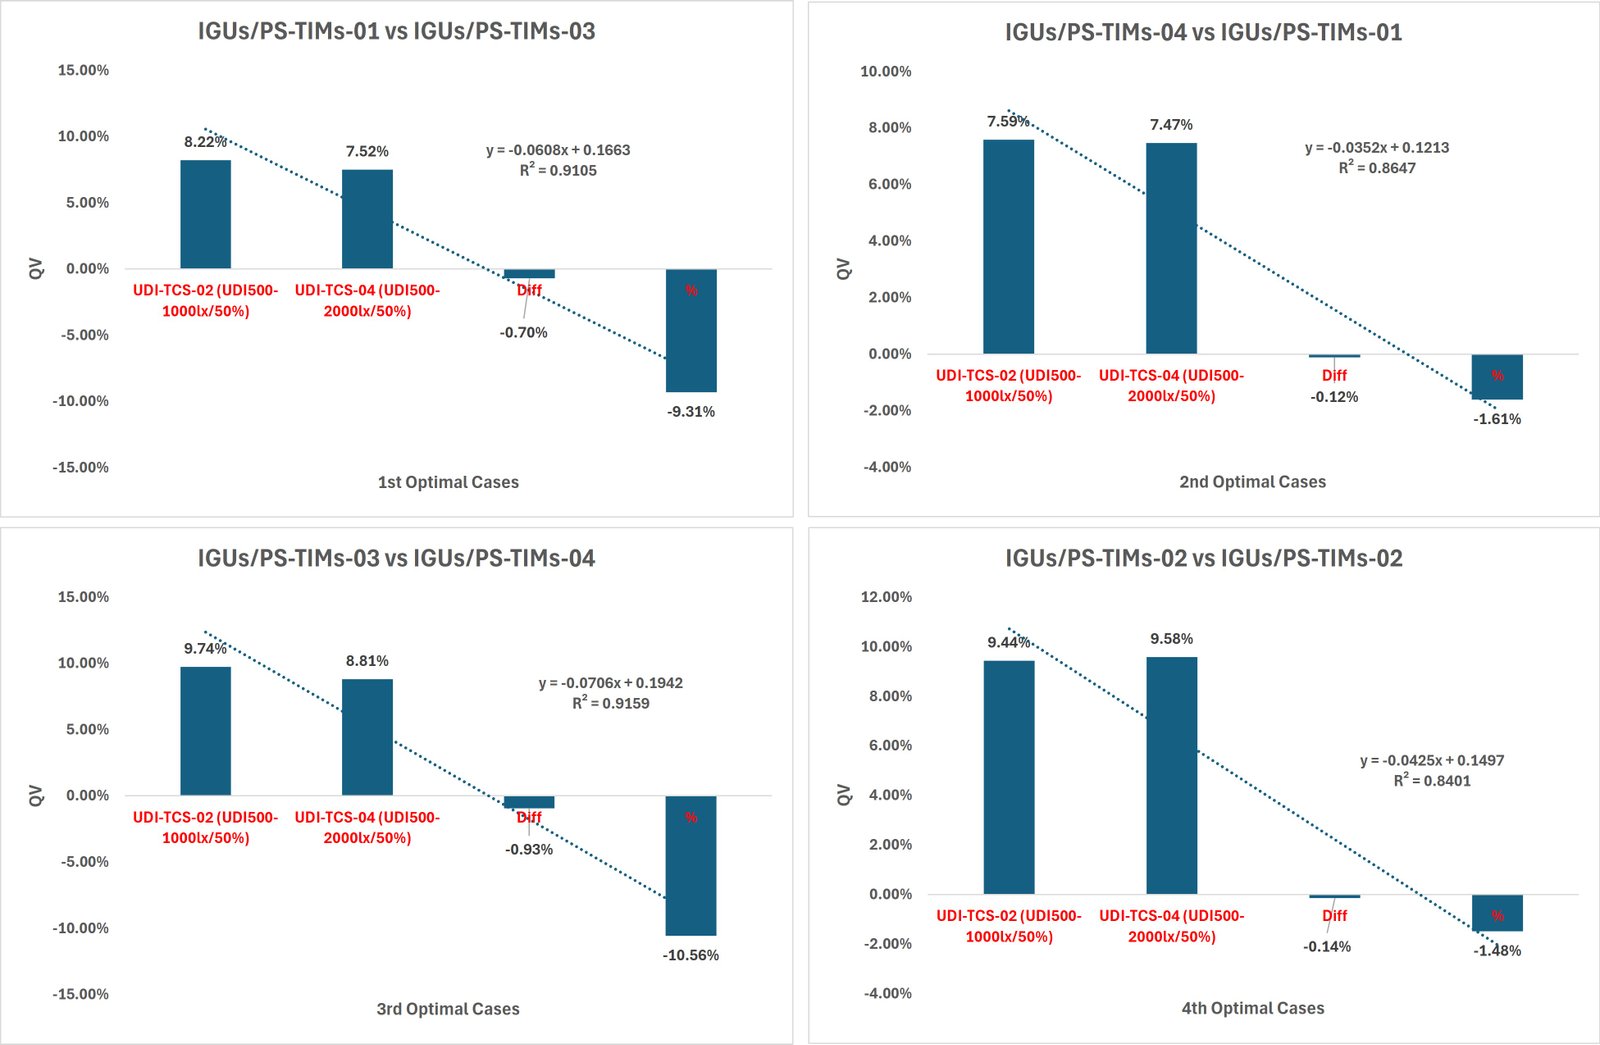
Fig. 20. Comparison of the performance of ASE metric between optimal solutions of both UDI thresholds against each other’s.
Figure 21

Fig. 21. Comparison of the performance of QV metric between optimal solutions of both UDI thresholds against each other’s.
Additional to the critical objectives weights analysis values, the regression analysis between the optimal schemes in Pareto solutions with the (R2 value) method is used to test the linearity of the outputs and their ranking. in this stage, Regression analysis allows for assessing the accuracy of the critical objectives’ weights of optimal solutions against each other’s based on two daylighting thresholds. Figure 8 shows the regression coefficients of R2 between optimal schemes. The predictions of the comparison all ranking optimal solutions were very close to 1, and showing a positive strong linear pattern, 𝑅2 greater than the threshold 0.7. Thus, the optimal solutions captured the correlation between the input thresholds and the critical objectives weights outputs, which demonstrating very sound agreements between the optimal UDI threshold setpoints and the optimal schemes in Pareto solutions of the proposed system under sub-tropics climate.
5. Conclusion
This study proposes a method to integrative design a window with a novel IGUs/PS-TIMs in a parametric model under sub-tropical climate and assess daylight availability performance and thermal performance based on optimal control daylighting thresholds setpoint and the most critical objectives weights, through developing a MOO framework based on UA, SA with three-stages of statistics analysis in terms of Objective’s weights, correlation, and regression to define the best UDI-TCS and the most critical objectives weights. The present study bridges the knowledge gap in applying IGUs/PS-TIMs strategies to address the multi-criteria daylight performance of office building under sub-tropical climate by optimization a novel IGUs/PS-TIMs system under optimal UDI-TCS threshold based on the most critical objectives weights, which has not been set decisively under this climate. This study employed the Rhino-Grasshopper, Ladybug tools, and Wallacei as multi-objectives platform aims to provide essential data and optimal Pareto solutions design schemes of four types of IGUs integrated with PS-TIMs system with multi-parameters design based on the ranking of the critical objectives weights under different UDI-TCS thresholds.
A multi-objective optimization algorithm was applied to determine the optimal range of variable values that simultaneously optimize the multi-criteria daylighting performance for maximizing the quality and quantity of daylight versus minimizing the thermal and visual discomfort degree based on different UDI-TCS. UA and SA deals with the SA regression method to find out how input objective affect the daylight performance based different UDI-TCS by decomposing the variance of outputs into each input setpoint. in UD and SA, the optimization was run to determine the influence of TIMs variables on the objectives against UDI-TCS separately, without determining the best range of variable values of TIMs for ranking optimal UDI-TCS based on the best objective value and the extent to which objectives interrelate with each other in the optimization process. After performing the global search UA and SA and in order to reduce the search space for best daylighting setpoint and optimal objectives for final optimization process as outlined previously, only best UDI-TCS was selected for final stage to optimize the IGUs/PS-TIMs system, whereas the non-influential objectives were disregarded from the final optimization process and have been calculated after selected final optimal solutions of the IGUs/PS-TIMs, as they will not significantly influence any of the final optimized IGUs/PS-TIMs parameters.
The OWs, UA, and SA show that selection of optimal daylighting threshold and critical objectives weights for optimized daylighting performance using IGUs/PS-TIMs system in office building is very crucial regarding their conflicted objectives for thermal performance and indoor visual comfort. which means that given priority to one goal will negatively affect other goals. In order to guarantee that all building performance indices are within the desired range, decisions should be made extremely carefully throughout the design phase.
In UA and SA, the highest ranked parameters should be given careful consideration in decision making in final optimization for final optimal solutions of IGUs/PS-TIMs as they cause the highest change in the corresponding building performance criterion. In general, the data concluded that UDI500-1000lux/50% (UDI-TCS-02) and UDI500-2000lux/50% (UDI-TCS-05) are the best daylighting threshold under sub-tropical climate. Meanwhile, The UDI, ASE, and QV are the objectives that have most critical weights, and they have linear strong correlations against each other’s.
When considering the equal weight of all critical objectives in ranking final solutions resulted from MOO process for best balanced objectives of critical objectives weights. It can be clearly noticed from the results that the UDI500-2000lux is the optimal threshold because this threshold has significantly improved the UDI and ASE in all optimal cases compared to optimal cases resulted from UDI500-1000lux/50%. Several schemes can be generated if various goals weights are assigned to the crucial objectives weights objectives when ranking final solutions based on the preferences of designers. This is very important for the early stages of building design. In this case If Giving priority to UDI and ASE in selected optimal threshold, the UDI500-2000lux is the optimal threshold, but if given to QV objective, the UDI500-1000lux is the optimal threshold. Overall, Compared the optimal cases against each other’s showed that the optimal solutions in UDI500-200lux/50% have improves the total average percentage of UDI between 22.63% to 27.80%, meanwhile, the total average percentage of ASE improved between 2.14%. to 11.52%. For QV, the optimal cases result from UDI500-1000lux/50% threshold working better by slightly improving QV by 1.16% and 10.56%.
In conclusion, to providing an appreciation of the most influential thresholds, variables and objectives that has more interactions for designing multi-criteria daylighting performance, this paper illustrates how the optimal daylighting threshold setpoint and critical objectives weights can change the relevance of some objectives performance and ultimately, the performance of the building. By using methods like UA and SA techniques and multi-objective optimization strategies, it is possible to achieve more energy building efficiency by including critical objectives weights simultaneously under optimal control daylighting in the early stages of the design process and by giving priority to the most influential objectives when choosing the final solutions.
The study approach was important in that it offered guidance and an alternative perspective for creating daylighting in a subtropical environment. Some constraints that set the scene for future research must be acknowledged in order to improve the efficiency of the suggested method. Despite the results of the study, however, the ranking of the objectives and optimal control daylighting threshold setpoint can vary not only for climate conditions but also for Glazing type and daylight control threshold. Therefore, a full generalization of the study's findings is not possible. Nonetheless, established techniques may be appropriately utilized to derive inferences for diverse climate types, and distinct design factors of the proposed system. Another Limitation is that this study did not take into account the weights of the design variables of the PS-TIMs on the ranking the best UDI thresholds and ranking critical objectives weights, and all design variables of PS-TIMs system given an equal weight in the MOO for UD and SA stages. Therefore, the order of the ranking solutions may differ if relative importance is given to the design variables in the UA and SA. It is also important to remember that this study was only based on a computer simulation, which presents a problem even in the presence of a thorough validation process for the IGUs and PS-TIMs because any simulation would inevitably have some inaccuracy. Therefore, further verification for performance of IGUs/PS-TIMs for optimal UDI threshold and critical objectives weights under different climates are required. Future research might concentrate on including additional crucial goals that the current study did not address, as well as various glazing units and other system characteristics.
Contributions
This research received no external funding.
Declaration of competing interest
The authors declare no conflict of interest.
References
- M. Dabbagh, and M. Krarti, Energy performance of switchable window insulated shades for US residential buildings, Journal of Building Engineering, 43 (2021) 102584. https://doi.org/10.1016/j.jobe.2021.102584
- D.M. Le, D.Y. Park, J. Baek, P. Karunyasopon, and S. Chang, Multi-criteria decision making for adaptive façade optimal design in varied climates: Energy, daylight, occupants' comfort, and outdoor view analysis, Building and Environment, 223 (2022) 109479. https://doi.org/10.1016/j.buildenv.2022.109479
- X. Wang, L. Zhang, X. Su, and H. Yang, Daylighting and energy performance of the window with transparent insulation slats in the humid subtropical climate zone, Energy and Buildings, 300 (2023) 113685. https://doi.org/10.1016/j.enbuild.2023.113685
- Y. Sun, R. Liang, Y. Wu, R. Wilson, and P. Rutherford, Development of a comprehensive method to analyse glazing systems with Parallel Slat Transparent Insulation material (PS-TIM), Applied Energy, 205 (2017) 951-963. https://doi.org/10.1016/j.apenergy.2017.08.041
- Y. Sun, Y. Wu, and R. Wilson, Analysis of the daylight performance of a glazing system with Parallel Slat Transparent Insulation Material (PS-TIM), Energy and Buildings, 139 (2017) 616-633. https://doi.org/10.1016/j.enbuild.2017.01.001
- F. Yu, R. Wennersten, and J. Leng, A state-of-art review on concepts, criteria, methods and factors for reaching 'thermal-daylighting balance', Building and Environment, 186 (2020) 107330. https://doi.org/10.1016/j.buildenv.2020.107330
- A.A. Bahdad, S. Syed Fadzil, and N. Taib, Evaluating kinetic light-shelves and their impacts on daylighting performance, Indonesian J Electr Eng Comp Sci, 19 (2020) 482-490. https://doi.org/10.11591/ijeecs.v19.i1.pp476-484
- A.A. Bahdad, N. Taib, F.S. Allahaim, and A.M. Ajlan, Parametric Optimization Approach to Evaluate Dynamic Shading Within Double-Skin Insulated Glazed Units for Multi-Criteria Daylighting Performance in Tropics, Journal of Daylighting, 11 (2024) 349-371. https://doi.org/10.15627/jd.2024.24
- A.A.S. Bahdad, and S.F.S. Fadzil, Design Optimization for Light-Shelves with Regard to Daylighting Performance Improvements in The Tropics, Journal of Advanced Research in Fluid Mechanics and Thermal Sciences, 100 (2022) 35-50. https://doi.org/10.37934/arfmts.100.3.3550
- A.A. Salem Bahdad, S.F. Syed Fadzil, H.O. Onubi, and S.A. BenLasod, Balancing daylight in office spaces with respect to the indoor thermal environment through optimization of light shelves design parameters in the tropics, Indoor and Built Environment, 31 (2022) 1963-1985. https://doi.org/10.1177/1420326X221086537
- A. Moradikazerouni, A. Hajizadeh, M.R. Safaei, M. Afrand, H. Yarmand, and N.W.B.M. Zulkifli, Assessment of thermal conductivity enhancement of nano-antifreeze containing single-walled carbon nanotubes: Optimal artificial neural network and curve-fitting, Physica A: Statistical Mechanics and its Applications, 521 (2019) 138-145. https://doi.org/10.1016/j.physa.2019.01.051
- J. Natanian, O. Aleksandrowicz, and T. Auer, A parametric approach to optimizing urban form, energy balance and environmental quality: The case of Mediterranean districts, Applied Energy, 254 (2019) 113637. https://doi.org/10.1016/j.apenergy.2019.113637
- Y. Wang, and C. Wei, Design optimization of office building envelope based on quantum genetic algorithm for energy conservation, Journal of Building Engineering, 35 (2021) 102048. https://doi.org/10.1016/j.jobe.2020.102048
- A.A. Bahdad, and S.S. Fadzil. Light-shelves technique (LST) for daylight enhancement using physical scaled model and simulation approaches. in Proceeding-7th Putrajaya Int. Built Env., Tech. and Eng. Conf. (PIBEC7). 2019.
- A.A. Bahdad, S.S. Fadzil, and N. Taib, Evaluating the effects of light-shelves to daylight distribution at south facing window using physical scaled-model method, International Journal of Sustainable Building Technology and Urban Development, 11 (2020) 2-15.
- A.A.S. Bahdad, S.F.S. Fadzil, and N. Taib, Optimization of daylight performance based on controllable light-shelf parameters using genetic algorithms in the tropical climate of Malaysia, Journal of Daylighting, 7 (2020) 122-136. https://doi.org/10.15627/jd.2020.10
- Z. Jalali, E. Noorzai, and S. Heidari, Design and optimization of form and facade of an office building using the genetic algorithm, Science and Technology for the Built Environment, 26 (2020) 128-140. https://doi.org/10.1080/23744731.2019.1624095
- H. Huo, W. Xu, A. Li, J. Chu, and Y. Lv, Sensitivity analysis and prediction of shading effect of external Venetian blind for nearly zero-energy buildings in China, Journal of Building Engineering, 41 (2021) 102401. https://doi.org/10.1016/j.jobe.2021.102401
- N. Delgarm, B. Sajadi, K. Azarbad, and S. Delgarm, Sensitivity analysis of building energy performance: A simulation-based approach using OFAT and variance-based sensitivity analysis methods, Journal of Building Engineering, 15 (2018) 181-193. https://doi.org/10.1016/j.jobe.2017.11.020
- S. Nazari, P.K. MirzaMohammadi, B. Sajadi, P. Pilehchi Ha, S. Talatahari, and P. Sareh, Designing energy-efficient and visually-thermally comfortable shading systems for office buildings in a cooling-dominant climate, Energy Reports, 10 (2023) 3863-3881. https://doi.org/10.1016/j.egyr.2023.10.062
- P. Bakmohammadi, and E. Noorzai, Optimization of the design of the primary school classrooms in terms of energy and daylight performance considering occupants' thermal and visual comfort, Energy Reports, 6 (2020) 1590-1607. https://doi.org/10.1016/j.egyr.2020.06.008
- B. Wang, L. Sun, Z. Shao, and Y. He, Multi-objective optimization of a novel dynamic concentrated skin system considering daylight, building skin capacity, and visual space, Building and Environment, 256 (2024) 111472. https://doi.org/10.1016/j.buildenv.2024.111472
- Y. Fang, and S. Cho, Design optimization of building geometry and fenestration for daylighting and energy performance, Solar Energy, 191 (2019) 7-18. https://doi.org/10.1016/j.solener.2019.08.039
- F. Shi, Y. You, X. Yang, and X. Hong, Annual evaluation of the visual-thermal comfort and energy performance of thermotropic glazing in a reference office room of China, Building and Environment, 254 (2024) 111378. https://doi.org/10.1016/j.buildenv.2024.111378
- R. Singh, I.J. Lazarus, and V.V.N. Kishore, Effect of internal woven roller shade and glazing on the energy and daylighting performances of an office building in the cold climate of Shillong, Applied Energy, 159 (2015) 317-333. https://doi.org/10.1016/j.apenergy.2015.09.009
- J. Fang, Y. Zhao, Z. Tian, and P. Lin, Analysis of dynamic louver control with prism redirecting fenestrations for office daylighting optimization, Energy and Buildings, 262 (2022) 112019. https://doi.org/10.1016/j.enbuild.2022.112019
- Y. Sun, R. Wilson, H. Liu, and Y. Wu, Numerical investigation of a smart window system with thermotropic Parallel Slat Transparent Insulation Material for building energy conservation and daylight autonomy, Building and Environment, 203 (2021) 108048. https://doi.org/10.1016/j.buildenv.2021.108048
- S. Yang, F. Fiorito, D. Prasad, A. Sproul, and A. Cannavale, A sensitivity analysis of design parameters of BIPV/T-DSF in relation to building energy and thermal comfort performances, Journal of Building Engineering, 41 (2021) 102426. https://doi.org/10.1016/j.jobe.2021.102426
- Z. Yang, and B. Becerik-Gerber, A model calibration framework for simultaneous multi-level building energy simulation, Applied Energy, 149 (2015) 415-431. https://doi.org/10.1016/j.apenergy.2015.03.048
- A.-T. Nguyen, and S. Reiter, A performance comparison of sensitivity analysis methods for building energy models, Building Simulation, 8 (2015) 651-664. https://doi.org/10.1007/s12273-015-0245-4
- W. Tian, A review of sensitivity analysis methods in building energy analysis, Renewable and Sustainable Energy Reviews, 20 (2013) 411-419. https://doi.org/10.1016/j.rser.2012.12.014
- P. Heiselberg, H. Brohus, A. Hesselholt, H. Rasmussen, E. Seinre, and S. Thomas, Application of sensitivity analysis in design of sustainable buildings, Renewable Energy, 34 (2009) 2030-2036. https://doi.org/10.1016/j.renene.2009.02.016
- A. Ioannou, and L.C.M. Itard, Energy performance and comfort in residential buildings: Sensitivity for building parameters and occupancy, Energy and Buildings, 92 (2015) 216-233. https://doi.org/10.1016/j.enbuild.2015.01.055
- A.A.S. Bahdad, S.F.S. Fadzil, H.O. Onubi, and S.A. BenLasod, Sensitivity analysis linked to multi-objective optimization for adjustments of light-shelves design parameters in response to visual comfort and thermal energy performance, Journal of Building Engineering, 44 (2021) 102996. https://doi.org/10.1016/j.jobe.2021.102996
- A. Nabil, and J. Mardaljevic, Useful daylight illuminance: a new paradigm for assessing daylight in buildings, Lighting Research & Technology, 37 (2005) 41-57. https://doi.org/10.1191/1365782805li128oa
- L. Li, M. Qu, and S. Peng, Performance evaluation of building integrated solar thermal shading system: Building energy consumption and daylight provision, Energy and Buildings, 113 (2016) 189-201. https://doi.org/10.1016/j.enbuild.2015.12.040
- H. Shen, and A. Tzempelikos, Daylighting and energy analysis of private offices with automated interior roller shades, Solar Energy, 86 (2012) 681-704. https://doi.org/10.1016/j.solener.2011.11.016
- E. Kızılörenli, and F. Maden, Modular responsive facade proposals based on semi-regular and demi-regular tessellation: daylighting and visual comfort, Frontiers of Architectural Research, 12 (2023) 601-612. https://doi.org/10.1016/j.foar.2023.02.005
- A. Bugeat, B. Beckers, and E. Fernández, Improving the daylighting performance of residential light wells by reflecting and redirecting approaches, Solar Energy, 207 (2020) 1434-1444. https://doi.org/10.1016/j.solener.2020.07.099
- C.F. Reinhart, and O. Walkenhorst, Validation of dynamic RADIANCE-based daylight simulations for a test office with external blinds, Energy and Buildings, 33 (2001) 683-697. https://doi.org/10.1016/S0378-7788(01)00058-5
- A. Tabadkani, S. Banihashemi, and M.R. Hosseini, Daylighting and visual comfort of oriental sun responsive skins: A parametric analysis, Building Simulation, 11 (2018) 663-676. https://doi.org/10.1007/s12273-018-0433-0
- N. Delgarm, B. Sajadi, and S. Delgarm, Multi-objective optimization of building energy performance and indoor thermal comfort: A new method using artificial bee colony (ABC), Energy and Buildings, 131 (2016) 42-53. https://doi.org/10.1016/j.enbuild.2016.09.003
- A. Khani, M. Khakzand, and M. Faizi, Multi-objective optimization for energy consumption, visual and thermal comfort performance of educational building (case study: Qeshm Island, Iran), Sustainable Energy Technologies and Assessments, 54 (2022) 102872. https://doi.org/10.1016/j.seta.2022.102872
- P. Pilechiha, M. Mahdavinejad, F. Pour Rahimian, P. Carnemolla, and S. Seyedzadeh, Multi-objective optimisation framework for designing office windows: quality of view, daylight and energy efficiency, Applied Energy, 261 (2020) 114356. https://doi.org/10.1016/j.apenergy.2019.114356
- A. Ebrahimi-Moghadam, P. Ildarabadi, K. Aliakbari, and F. Fadaee, Sensitivity analysis and multi-objective optimization of energy consumption and thermal comfort by using interior light shelves in residential buildings, Renewable Energy, 159 (2020) 736-755. https://doi.org/10.1016/j.renene.2020.05.127
- Y. Xu, G. Zhang, C. Yan, G. Wang, Y. Jiang, and K. Zhao, A two-stage multi-objective optimization method for envelope and energy generation systems of primary and secondary school teaching buildings in China, Building and Environment, 204 (2021) 108142. https://doi.org/10.1016/j.buildenv.2021.108142
- R. Wang, S. Lu, and W. Feng, Impact of adjustment strategies on building design process in different climates oriented by multiple performance, Applied Energy, 266 (2020) 114822. https://doi.org/10.1016/j.apenergy.2020.114822
- R. Gagnon, L. Gosselin, and S. Decker, Sensitivity analysis of energy performance and thermal comfort throughout building design process, Energy and Buildings, 164 (2018) 278-294. https://doi.org/10.1016/j.enbuild.2017.12.066
- S. Gou, V.M. Nik, J.-L. Scartezzini, Q. Zhao, and Z. Li, Passive design optimization of newly-built residential buildings in Shanghai for improving indoor thermal comfort while reducing building energy demand, Energy and Buildings, 169 (2018) 484-506. https://doi.org/10.1016/j.enbuild.2017.09.095
- E. Prataviera, J. Vivian, G. Lombardo, and A. Zarrella, Evaluation of the impact of input uncertainty on urban building energy simulations using uncertainty and sensitivity analysis, Applied Energy, 311 (2022) 118691. https://doi.org/10.1016/j.apenergy.2022.118691
- A.M. Qahtan, A.A.S. Bahdad, N. Al-Tamimi, and S.F. Syed Fadzil, Optimizing daylighting in lecture halls within hot-arid climates through modification of glazing systems with light-shelves: A parametric design approach, Indoor and Built Environment, 33 (2024) 929-956. https://doi.org/10.1177/1420326X241226651
Copyright © 2025 The Author(s). Published by solarlits.com.

2245
Total views
Citations
SHARE ON


