Volume 12 Issue 1 pp. 167-189 • doi: 10.15627/jd.2025.10
Balancing the Parameters of Perforated Solar Screens to Optimize Daylight and Glare Performance in Office Buildings
Aya M.F. El-Bahrawy*
Author affiliations
Department of Architecture, Faculty of Engineering, Helwan University, Egypt
*Corresponding author.
aya_mahmoudfawzy@m-eng.helwan.edu.eg (A. M.F. El-Bahrawy)
History: Received 11 December 2024 | Revised 4 March 2025 | Accepted 19 March 2025 | Published online 4 May 2025
Copyright: © 2025 The Author(s). Published by solarlits.com. This is an open access article under the CC BY license (http://creativecommons.org/licenses/by/4.0/).
Citation: Aya M.F. El-Bahrawy, Balancing the Parameters of Perforated Solar Screens to Optimize Daylight and Glare Performance in Office Buildings, Journal of Daylighting 12 (2025) 167-189. https://dx.doi.org/10.15627/jd.2025.10
Figures and tables
Abstract
Perforated solar screens (PSSs) have been widely used as an outer skin for the fully glazed façades of office buildings for their environmental and aesthetic benefits. However, PSS have several parameters that can affect their efficiency, including perforation percentage, thickness, material properties, and others. Controlling and balancing the influence of these parameters is critical for optimizing the quality of the indoor environment while meeting the required demands and needs. This paper investigates the impact of balancing the effect of four design parameters—matrix, perforation percentage, thickness, and separation distance—on promoting the daylighting and glare performance of south façades in office buildings in a hot, dry climate. The analyses were performed with Honeybee and Ladybug plugins through Grasshopper interface in Rhinoceros 3D software on a base case (without PSS), four independently optimized solutions for each parameter, and a balanced solution at three times per four days around the year. Genetic algorithms and the Python component in Grasshopper were utilized to identify the optimal balanced solutions. The results showed a noticeable reduction in the overlit areas in the balanced solutions by 21-61% compared to the base case, outperforming independent parameter optimizations by up to 36%. Additionally, the balanced solutions effectively eliminated glare across all analyzed periods and provided more effective solutions in terms of visual access and material sustainability. These findings suggest that balancing the influence of multiple design parameters is more effective than optimizing individual parameters, providing better control over daylight efficiency and glare reduction.
Keywords
Perforated solar screens, Daylight simulation, Daylight glare probability, Genetic algorithms
1. Introduction
According to the International Energy Agency (IEA), artificial lighting contributes to approximately 19% of global electricity consumption. Replacing artificial lighting with natural daylighting has the potential to reduce energy consumption related to electric lighting by 50–80%. Beyond its energy-saving benefits, natural daylight has the capability to provide positive psychological, physiological, and mental effects to the building occupants. It enhances productivity, well-being, mood, alertness, and circadian rhythms. Consequently, integrating natural daylight into architectural design has become a fundamental strategy for improving energy efficiency, promoting sustainability, and enhancing users’ health and well-being [1-3].
In contemporary architecture, fully glazed façades are widely utilized in office buildings to maximize natural daylight, create an open visual environment, and enhance aesthetic appeal. However, in hot, dry (HD) climates, such façades are considered significant challenges regarding both energy efficiency and occupant visual comfort due to their clear, sunny skies, extended sunshine durations, and minimal cloud cover throughout most of the year. Expanding glazed surfaces in these climatic conditions increases the building envelope’s exposure to excessive solar radiation, thereby increasing cooling loads, visual discomfort, and glare, and elevating the dependence on artificial lighting [2,4-7]. These challenges are particularly pronounced when glazed façades are oriented towards the west or south in the northern hemisphere, leading to raising the overheating and thermal discomfort [8].
Perforated solar screens (PSSs), a type of passive shading system, have been implemented in office buildings to balance the two purposes: reducing heat gain and lowering cooling energy demand while simultaneously allowing natural daylight penetration and minimizing direct and reflected glare. Additionally, PSSs maintain visual access to external views, thereby contributing to a more balanced indoor climate and visual comfort condition [4-7]. Moreover, the shading perforated screen has cultural and historical meaning in multiple urban environments, as they resemble the traditional Mashrabeya, which was historically used to enhance privacy and promote natural ventilation. This connection emphasizes the capability of PSSs to provide efficient environmental performance while reflecting aesthetic values in architectural heritage [4,5].
However, despite their advantages, shading devices can sometimes present conflicting functions. For instance, maximizing solar protection may reduce daylight penetration, potentially affecting the visual comfort of occupants and increasing the artificial lighting demands. Therefore, an optimized screen design is essential to achieve a balance between heating, cooling, and lighting demands. The effectiveness of shading screens is influenced by several factors, including the façade orientation, the screens’ type, material, color, geometric form, depth, and perforation percentage, among others. To balance the influence of these factors, parametric design and multi-objective optimization algorithms have been widely used in the last decades. These advanced tools have the ability to enhance the overall building performance by facilitating multi-objective optimization, which aims to identify solutions that effectively balance multiple goals among numerous solutions with very similar environmental performance [4,9-11].
Over the past few decades, numerous researchers have examined the various parameters of PSSs and their influence on enhancing indoor environmental performance. However, a limited number of studies have explored the simultaneous optimization of multiple parameters within the design process and the difference between manipulating single versus multiple parameters. The objective of this paper is to investigate the combined effect of balancing four design parameters of PSS to optimize the daylight and glare performances for a south-facing office façade in Egypt, where the HD climate significantly influences the design and performance of shading systems. The study also assesses the differences between manipulating multiple parameters simultaneously versus single parameters independently. For this purpose, the Grasshopper interface was utilized for PSS modeling, and Honeybee and Ladybug for simulating and analyzing the daylight and glare performances. Additionally, the Galapagos optimization engine, in conjunction with the Python component in Grasshopper, was used to identify optimal solutions across the 12 tested durations throughout the year. The novelty of the current research lies in integrating a Python script into the genetic optimization process to control and filter alternatives more effectively within the single optimization process and assessing the difference between manipulating single versus multiple parameters on daylight and glare performances. The results revealed that the balanced solutions outperformed both the base case (without PSS integration) and the four single-parameter solutions (where each parameter was optimized individually). Moreover, they effectively mitigate excessive daylight illuminance, minimize daylight glare probability, and provide more effective solutions in terms of visual access and material sustainability.
2. Literature review
Approximately 40% of the world's total primary energy is consumed by the building sectors [12], and it is expected to reach 50% by 2050 [13]. According to the International Energy Agency (IEA), artificial lighting alone accounts for around 19% of global electricity consumption [3].
In Egypt, the built environment has been found to consume more than 60% of the country's total electric energy, as reported by the recently published Egyptian Electricity Holding Company (EEHC) report. Within Egypt’s office building sector, air conditioning and artificial lighting during working hours account for more than two-thirds of total energy consumption [14]. Therefore, integrating natural daylight into architectural design, rather than relying primarily on artificial lighting, has become a fundamental strategy for enhancing energy efficiency and promoting sustainability.
2.1. Natural lighting and glare in office environments
Providing adequate visual comfort is a critical factor in office spaces, as it directly impacts occupants' well-being and productivity. Visual comfort depends on the ability to control light performance by ensuring an adequate amount of natural daylight, a uniform luminance distribution, avoiding excessive brightness and sharp contrasts, and preventing glare [15].
Since employees spend most of their time indoors, natural lighting is a crucial design element in office spaces. Studies showed that natural light has important non-visual influences on human biological processes, offering positive psychological, physiological, and mental benefits. It enhances productivity, health, well-being, circadian rhythms (including sleep-wake cycles and activity/inactivity rhythm), mood, and alertness [1,15-17]. For instance, melatonin production (the darkness hormone) is strengthened under illuminance levels below 100 lux, while illuminance levels exceeding 1000 lux are necessary to prevent seasonal affective disorder (SAD). An illuminance level of approximately 2000 lux is recommended for synchronizing circadian rhythms, with levels above 1000 lux generally considered optimal for regulating the biological clock [18,19]. Beyond its biological and psychological benefits, daylighting also plays a key role in reducing reliance on artificial lighting and active thermal conditioning systems, thereby improving energy efficiency [9,16,20].
However, natural daylight needs to be balanced, as insufficient daylighting can negatively affect users' comfort, productivity, and working quality and increase lighting energy demands [21]. Conversely, excessive daylight can cause glare, leading to visual discomfort and, in some cases, a loss of visibility, and increasing reliance on artificial lighting and air conditioning. Therefore, an effective daylighting strategy must ensure sufficient natural light while minimizing glare to enhance both visual comfort and energy efficiency [1,11].
In recent decades, modern office architecture has increasingly incorporated fully glazed façades to reflect a sense of luxury, maximize natural light, and provide an open visual environment [9,11,16]. The extensive use of glazing has been shown to have a positive psychological impact on occupants, enhancing satisfaction and performance because of the sense of openness of the space. Research indicates that employees prefer working in office spaces with natural daylight, minimal glare, and visual access to the outdoors [11]. Still, the widespread implementation of fully glazed buildings without considering climatic variations across different regions can lead to excessive energy consumption for heating and cooling, as well as thermal and visual discomfort [9,11,16].
2.2. Excessive daylight and glare in hot dry climate
Hot, dry climate regions, like Egypt and Saudi Arabia, are characterized by high daylight availability and clear skies, offering an excellent opportunity for optimizing natural light utilization in indoor spaces. However, the use of fully glazed façades in such regions can lead to significant visual discomfort and cause glare and disturbing reflections. High levels of daylight in office space have the opposite effect of the optimum levels of visual conditions; it causes visual discomfort, glare, eye strain, and difficulties in performing tasks, and potentially increases reliance on artificial lighting [1,9,11,15,16,22].
Beyond visual discomfort, fully glazed façades also compromise the thermal performance of buildings because of their excessive solar radiation, which leads to overheating indoor spaces. This, in turn, significantly increases cooling loads, particularly during the hot months. Consequently, achieving a balance between daylight sufficiency and minimizing glare remains one of the greatest challenges in HD climate regions [10,13].
2.3. Illuminance and glare performance assessment metrics
Several performance metrics have been developed to address the variation between individuals in the sufficient illuminance range for the human eye. These metrics, primarily annual climate-based metrics, utilize illuminance to assess daylight sufficiency by considering actual sky conditions and dynamic calculations over extended periods. They evaluate illuminance levels at a given point based on specific minimum and maximum thresholds, based on research on occupant preferences, comfort, and daylighting requirements. The daylighting performance at that point is then assessed accordingly as being adequate or not according to the percentage of hours throughout the year when it meets or falls within these thresholds [5,15].
The most commonly used daylighting metrics include:
- Daylight autonomy (DA): the percentage of occupied hours during which daylight illuminance at a point remains above a specified minimum threshold. According to the Illuminating Engineering Society of North America (IESNA), a threshold of 300 lux is statistically significant for daylight performance assessment [15].
- Useful Daylight Illuminance (UDI): the annual percentage of time during which indoor daylight levels are useful for occupants. The UDI categorized illuminance levels into three ranges: underlit or insufficient (<100 lux), usable daylight (100-2000 lux), and overlit or excessive brightness that may cause glare (>2000 lux) [1,15,23,24].
- Spatial Daylight Autonomy (SDA): the percentage of floor area that exceeds a specified illuminance level for a specified number of annual hours (typically 50% of the hours from 08:00 a.m. to 06:00 p.m.) [15].
- Annual Sunlight Exposure (ASE): the percentage of the occupied area where direct sunlight illuminance exceeds a specific value (usually 1000 lux) for a defined number of hours per year (typically 250 hours) [15].
While the above metrics are primarily used to assess daylight sufficiency, other metrics help in assessing glare phenomena. Glare is the sensation caused by excessively high luminance in the field of view, which prevents the eye from adapting effectively. It occurs either when an excessive amount of light reaches the observer's eyes or when the observer experiences an extreme contrast between illuminated and dark areas in the visual field [1,11].
Discomfort Glare Probability (DGP), a luminance‐based metric, is considered one of the most powerful metrics in analyzing glare phenomena. DGP measures the probability that a person will experience discomfort due to glare, rather than assessing the actual intensity of glare [1,15]. DGP is categorized into four levels based on its impact on visual comfort. Intolerable glare (DGP≥0.45) is the most severe, causing extreme discomfort and significantly affecting vision. Disturbing glare (0.4≤DGP<0.45) is noticeable, making it difficult to work comfortably. Perceptible glare (0.35≤DGP<0.4) is slightly distracting but still tolerable for occupants. Finally, imperceptible glare (DGP < 0.35) is barely noticeable and does not interfere with visual tasks. As DGP values increase, the level of discomfort rises, which can impact productivity and indoor environmental quality [1,25]. Figure 1 clarifies the glare classification of DGP.
These performance metrics play a crucial role in designing daylighting strategies that optimize both daylight availability and visual comfort while minimizing glare and excessive solar exposure.
Figure 1
![The glare classification of DGP [15].](figures/12-167-1.jpg)
Fig. 1. The glare classification of DGP [15].
2.4. Illuminance and glare standards for office buildings
Lighting requirements in indoor workplaces vary across international standards. Different countries and organizations provide guidelines for recommended illuminance levels to ensure optimal working conditions. In the UK, the recommended illuminance levels are 300 lux for computer-based work and 500 lux for paper-based tasks. In North America, the suggested range for workplace illuminance is between 300 and 500 lux. In Australia and New Zealand, routine office tasks require an illuminance level of 320 lux [18]. In Malaysian standard MS1525, recommended illuminance levels vary based on task type—200 lux for general background lighting, 400 lux for routine work, and 600 lux for tasks with poor contrast [26]. In European Standard EN 12464-1, the required illuminance levels range from 500 lux for reading and writing tasks to 750 lux for technical drawing [27]. However, according to the three institutions Illuminating Engineering Society of North America (IESNA), the NRC Institute for Research in Construction, and the European Standard for Light and Lighting for Indoor Workspaces, the illuminance range of 500–2000 lux is recommended for workplaces [28].
2.5. Research on occupant preferences for illuminance levels
Several studies have investigated the useful illuminance range in office environments. They built their results based on surveys about occupant preferences and behavior in daylit offices. The Lawrence Berkeley National Laboratory (USA) allowed office workers to create their own lighting environment by manually controlling the blade angles of mechanical Venetian blinds and varying the intensity of electric lighting. The result illuminance range was 782 lux to 2146 lux [23]. L. Roche (2002) noted that the daylight illuminance range of 700 lux to 1800 lux was acceptable for both computer- and paper-oriented tasks [29]. According to a survey conducted by A. Nabil and J. Mardaljevic (2005), office employees felt most comfortable during working hours when the illuminance range was between 100 lux and 2000 lux [24]. A. Kaushik, et al. (2021) investigated the relationships between indoor environmental quality, occupant comfort, and productivity in a Middle Eastern office over 12 months. The survey asked occupants to respond to illumination levels and how it was affecting their productivity. Results indicate an illuminance level of 225 lux had a ‘positive’ effect on productivity, while levels between 325 and 450 lux had a 'very positive' impact [17].
2.6. Shading systems and perforated solar screens
Solar shading systems have been a primary strategy for optimizing the indoor environment of fully glazed facades in office buildings. They have the capability to reduce lighting, heating, and cooling energy consumption, solar heat gain, control daylight levels, and enhance thermal and visual comfort [30,31]. Solar shading systems have various types, including perforated solar screens, fixed solar screens, fixed overhangs, operable solar screens, Venetian blinds, louvers, and roller blinds. The effectiveness of these shading systems depends on many factors, such as façade orientation, material properties, and operational flexibility [7,32].
Perforated solar screens (PSSs), one of the main shading systems, are flat, opaque perforated panels placed in front of fully glazed building facades to enhance aesthetic appeal and promote building environmental performance [33]. PSSs hold significant cultural and historical value, as they are deeply rooted in traditional architectural elements, particularly in hot climate regions. They resemble Mashrabeya in Egypt, Moshabak in Iran, and the Jali in India, all of which are characterized by wooden latticework following repetitive arabesque patterns. These traditional screens have been employed for centuries to mitigate solar heat gain, improve natural ventilation, diffuse daylight, and ensure privacy, demonstrating their enduring relevance in contemporary sustainable architecture [5,16,22,34].
In the modern era, the traditional mashrabiya was reinterpreted as lightweight latticework, enabling fully glazed façades while simultaneously enhancing indoor environmental performance [34]. The perforations of PSSs, including their shape, arrangement, size, and ratio, filter direct sunlight according to the spatial requirements while maintaining visual connectivity to the exterior. The opaque parts act as solar control systems, reflecting sunlight, reducing solar heat gain, managing daylight penetration, mitigating glare, enhancing visual and thermal comfort, and ensuring privacy [9,30,32,33,35]. Thereby, the design and properties of PSSs play a critical role in determining their effectiveness in enhancing indoor environmental performance [15]. This reflects the essentiality of understanding the effect of screen variable parameters, such as thickness, perforation percentage, separation distance, and others [9].
Historically, the design of shading screens was primarily driven by aesthetic, morphological, and symbolic considerations rather than their contribution to improving indoor environmental conditions [33]. However, in recent decades, many studies have been conducted to enhance the performance of various shading systems by manipulating key parameters such as geometrical shape and dimensions, perforation percentages, material properties, color, static versus dynamic configurations, and climatic adaptability.
For instance, studies have explored the impact of location and climate zones on the efficiency of shading systems. Research has analyzed the performance of fixed exterior shading systems (FESSs) in cities across Iran—including Yazd, Bushehr, Kerman, Rasht, and Mashhad—each representing desert, semi-arid, and Mediterranean climates [36]. Further studies have assessed the effectiveness of Venetian blinds in Houston (hot climate) and Minneapolis (cold climate) in the United States [37]. The Venetian blinds across various climate zones in China [38]. PSSs in Lahore, Pakistan (hot-humid climate), and Doha, Qatar (hot-arid climate) [35]. Jali perforated screens in hot-moderate (Lahore, Pakistan), hot-arid (Doha, Qatar), and hot-humid (Los Angeles, United States) environments [39].
Other researchers have focused on the influence of shading systems orientation; southern façades were highly investigated for their intensive radiation [15,40-42]. Others have examined the influence of shading systems on west-facing façades for their unequal distribution of solar radiation and thereby non-uniform daylighting distribution [3,16].
Different types of fixed shading devices have been studied as tools to enhance indoor energy, thermal comfort, and daylight performance; such as; overhang, H-louver, V-louver, side fins, light-shelf, egg-crate [10], vertical louver, horizontal louver, light shelf, overhang, and egg-crate [36], overhanging, overhang & side, side fins, vertical, horizontal, eggcrate and geometrical [43], light shelves [12], PSS [8,13,25,30,44], parametric Mashrabiya [3], louver screen [45], Venetian blinds [37,38,46,47], double-tilted Venetian blind [4], prismatic slats [48], nonuniform woven solar shading screens [32], optical louver system and a conventional Venetian horizontal blind [49], venetian and the roller blinds [26].
Dynamic shading systems have also been investigated to assess their effect on energy and daylight performances, glare potential, and thermal comfort: fixed horizontal louvers with static control, external roller blinds, and Venetian blinds [7], integrated kinetic fins [21], dynamic shading system [50], automated shading system [51], kinetic shading system [40]. Further studies have focused on the influence of shading systems’ material [45], and others on color [4].
Many researchers have investigated perforate solar screens (PSSs) and the influence of their variable parameters on enhancing indoor environmental performance. For instance, the non-uniformity of PSS was studied by L. Huang, et al. (2024), investigated the influence of non-uniform circular perforated PSS on daylighting performance, daylight availability, daylight uniformity, and annual glare probabilities. They utilized orthogonal experiments and data envelopment analysis in their analysis. The results showed that non-uniform PSS with specific perforation patterns significantly outperformed uniform screens in terms of daylighting performance at equal perforation ratios [13]. F. Oghazian, et al. (2017) have studied the influence of geometry and non-uniform distribution of seven geometries—circle, hexagonal, square, cross, jagged hexagonal (circle), rhombus, and tabl (decagram tile)—on the daylighting and glare performance of south-facing façade of an office room in Tehran, Iran, by using Honeybee plugin via Grasshopper. The results showed that rhombus-shaped cells performed best in terms of SDA due to their larger grid area compared to other geometries. For screens with a constant cell size, square-shaped perforations yielded higher SDA values, whereas cross-shaped patterns were the least effective. Additionally, the study found that non-uniformity in the pattern of solar screens had varying effects based on the location of the attractor line [52].
The shape of the perforations have also been explored. D. Pool (2019) has used circular geometrical shapes for his PSS perforations to study the influence of their orientation, perforation, matrix, thickness, and distance on the daylighting and shading performance of office buildings in a Mediterranean climate. He used Design through Orthogonal Arrays (DOA) and DIVA plugin for Grasshopper/Rhinoceros 3D in his analysis. The results showed that the optimal solutions at south orientation are PP 20-50%, M 3×7, T 3-7 cm, and D 90-120 cm. At east orientation are PP 30-50%, M 3×7 and 6 × 14, T 7 cm, and D 120 cm. At west orientation are PP 40-50%, M 3×7 and 6 × 14, T 7 cm, and D 60-120 cm [9]. While O. Etman, et al. (2013) used rectangular geometrical shapes for his PSS perforations to enhance indoor illuminance distribution of West-facing façades in office buildings in Egypt. They used Grasshopper/Rhinoceros 3D and DIVA and Galapagos plugins. The results showed that the optimal module was 10x10 cm with a 180° rotation angle, improving illumination distribution from 54% to 78% with illuminance levels of 300-500 lux and reducing glare probability [16]. C. Lavina and F. Fiorito (2017) have studied the impact of varying sizes and distribution of the square perforations on UDI and DGP of a northwest orientation office space in Australia. They used Rhinoceros/Grasshopper, Ladybug and Honeybee, and Galapagos plugins. They could improve UDI by up to 86% and reduce DGP compared to the base case [11]. A. El-Bahrawy (2025) has explored the optimal perforation ratio of an Islamic pattern screen that decreases annual solar irradiance while optimizing thermal comfort and energy cooling loads for a mosque in Cairo, Egypt. Grasshopper/Rhinoceros 3D, Honeybee, Ladybug, and Galapagos plugins were utilized in the simulation and optimization process. The result indicated that, compared to the current screen, implementing a 0.25% perforation ratio PSS on the southeast and southwest façades, along with a 0.2% PSS on the roof, could reduce peak annual solar irradiance by 19%, enhance thermal comfort, and slightly decrease cooling loads [53]. A. Maksoud, et al. (2022) have sought to improve the visual and thermal comfort of the corridors at the university in UAE by varying the porous size, shape, and gradient of Islamic patterns perforations. They have used Rhinoceros/Grasshopper, Ladybug plugin in their analysis. The results showed improvement in the useful daylight illumination compared to the current status, with an increase in excess of 54%, a decrease in vertical and horizontal radiation exposure, and the potential glare by more than 9% [54].
Other researchers compared the efficiency of PSS and other shading systems. B. Dabaj, et al. (2022) have compared the influence of PSS and three types of Venetian blinds (exterior, interior, and exterior integrated with overhangs) on the visual comfort, daylight, and glare performance of a library’s reading room in Rasht, Iran. They used Rhinoceros/Grasshopper, Ladybug, and Honeybee plugins for their analysis. The results stated that PSS is effective in enhancing annual daylight metrics and view quality but less effective in reducing glare. In contrast, the three Venetian blinds successfully mitigated glare on most dates, despite variations in their characteristics [1].
Researchers have also studied the various parameters of PSS, to detect their optimal ratios. T. Srisamranrungruang and K. Hiyama (2021) studied the influence of three PSS parameters: perforation percentage, facade orientation, and thickness for an office building in Tokyo, Japan, on the daylight, energy saving, and natural ventilation performance. They utilized DIVA plugin for Grasshopper/Rhinoceros 3D and EnergyPlus plugin in DesignBuilder. The results showed that thickness had the lowest impact, with 0.5 m being the optimal value. For the best daylighting access without glare, the PP of 40% on the south and 10% on the west were the optimal ratios. However, to achieve a balance between natural ventilation and daylighting, a PP of 10% on the south and 30% on the west proved to be the most effective for year-round heat removal [44]. F. Çağlar and G. Gedik (2021) aimed to optimize solar radiation, ASE, and the view of a classroom in Istanbul, Turkey by varying the dimensions, perforation ratio, width, distance, twist angle, and rotation angle of a screen. They used Rhinoceros/Grasshopper, Ladybug and Honeybee, and Galapagos plugins in their analysis, which showed that the twist angle of 0° has the optimal results for solar radiation [8]. D. Chi, et al. (2019) have studied the influence of perforation percentage, matrix, shape, and orientation of PSS on the daylight availability of office buildings in Seville, Spain. He used Radiance-based Daysim and orthogonal and listing methods in his analysis. The results showed that PP was the most influential parameter, followed by orientation, matrix, and shape. The optimal PP was 37.5%, then 50%, reducing overlit areas by 27%-36%. Matrices with bigger sizes are recommended to reduce the overlit area. Irregular shapes are not suggested since they increase the overlit area, and the north orientation has the best performance [20]. A. Sherifa, et al. (2012) have studied the influence of changing the perforation percentage and depth of PSS on the annual energy loads for a residential lounge in El-Kharga Oasis, Egypt. They used Design Builder and EnergyPlus modeling software in their analysis. The results noted that solar screens with perforation rates between 40% and 90% provided an illuminance of 200 lux for at least 50% of annual occupancy hours, covering at least 30% of space. Additionally, energy consumption was reduced by up to 30% for west and south orientations [6]. A. Sherifa, et al. (2012) analyzed the screen perforations for a residential living room in Cairo, Egypt, to improve its daylight and thermal performance and reduce glare. They used Diva for Rhino and Evalglare in their analysis. The result indicated that a perforation ratio of 80% for south-oriented screens achieved an acceptable annual performance improvement of 34% while also reducing glare probability [22].
The above-mentioned studies have demonstrated the effectiveness of shading systems in general and PSSs in particular in enhancing indoor environmental performance. In addition, due to the numerous parameters influencing the efficiency of shading screens, many researchers have turned to parametric modeling and, in some cases, genetic algorithms to optimize their performance through a multi-objective optimization process.
2.7. Parametric Modeling and Genetic Algorithms Optimization of Shading Systems
Parametric design and genetic algorithms play a crucial role in enhancing the efficiency of shading systems and improving overall building performance. These strategies facilitate the exploration of a wide range of design alternatives and enable the identification of optimal solutions among numerous options with comparable environmental performance, facilitating a multi-objective optimization process [10]. As highlighted in previous studies, many researchers have employed parametric modeling and genetic algorithms in their simulation and optimization processes to enhance the performance of shading screens. Table 1 summarizes a number of performed studies within the last five years with the aim of highlighting parametric modeling and genetic algorithms’ contribution to the shading system optimization process. These studies follow a similar approach to the present research; however, they may vary in terms of building functions, climate zones, investigated parameters, and optimization requirements.
Table 1
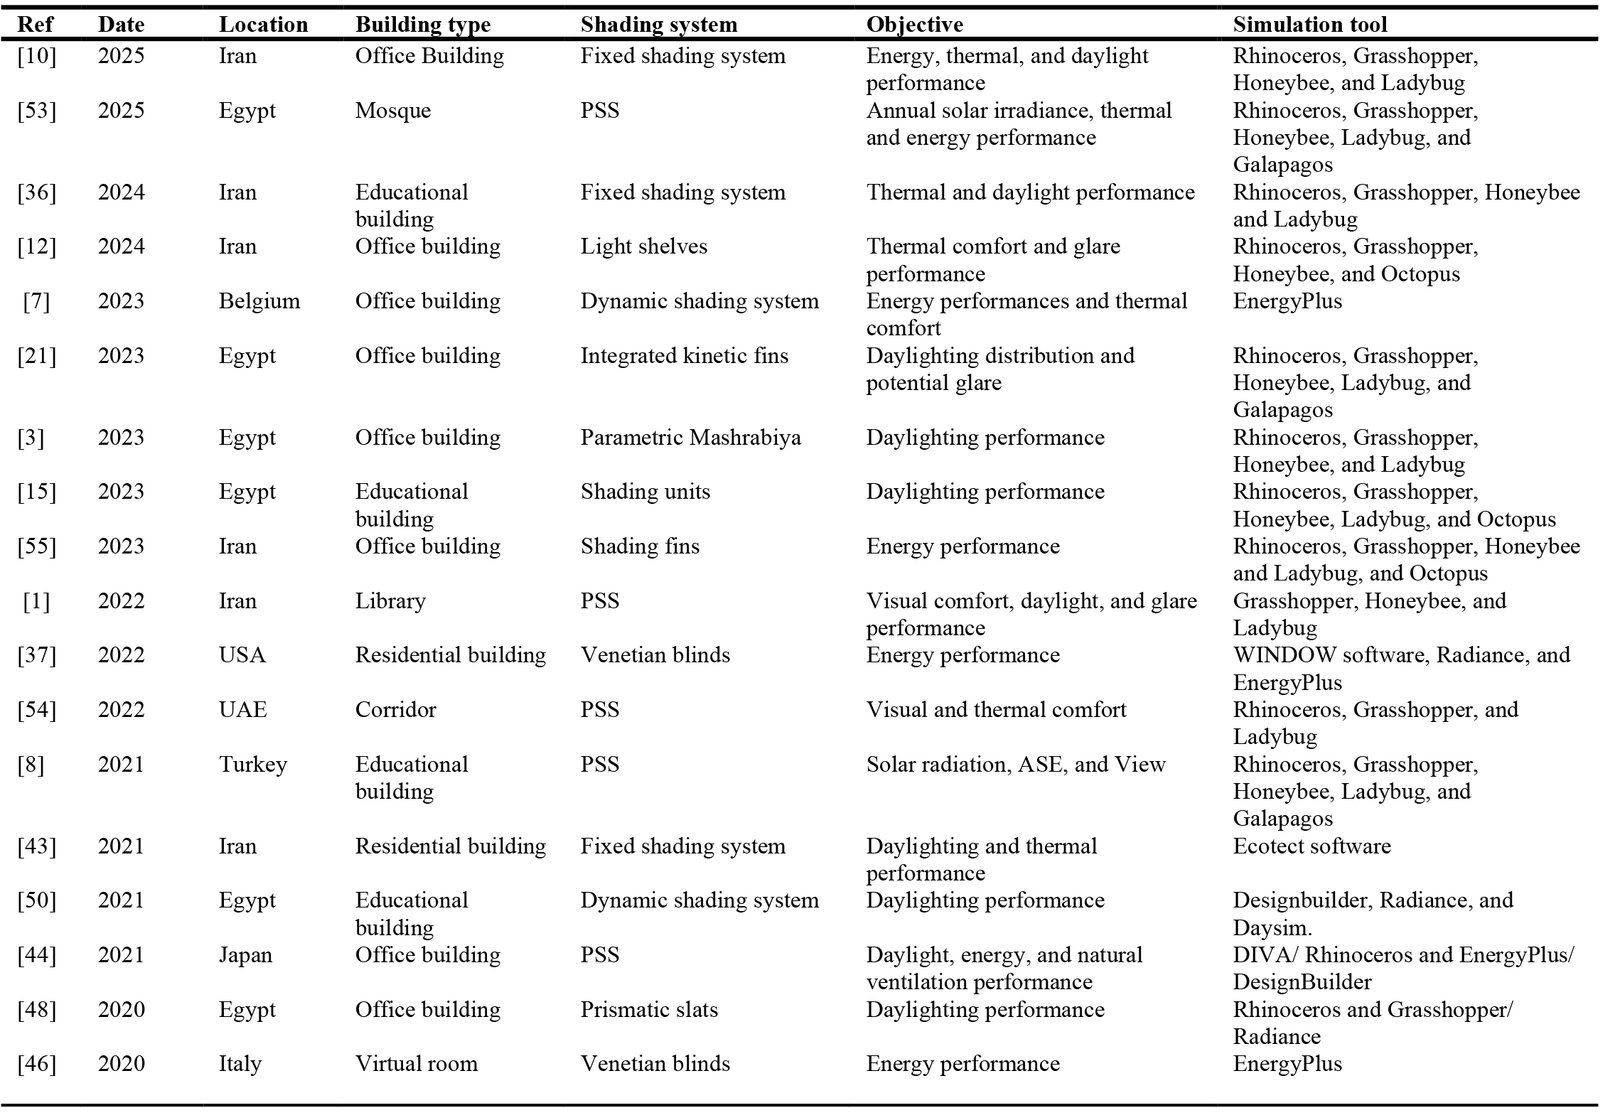
Table 1. Summary of recent studies utilized parametric modeling and genetic algorithms for shading systems optimization.
3. Materials and method
The research aims to investigate the influence of balancing four PSS design parameters—Matrix (M), Perforation Percentage (PP), Thickness (T), and Separation Distance (SD)—on optimizing daylight efficiency and reducing glare probability of an office space in Cairo, Egypt. With a target illuminance range of 100–2000 lux across at least 75% of the office area. The research methodology comprised two main phases. The first phase included an overview of the office space, including its location, characteristics, and settings, as well as the PSS and its four variable parameters. The second phase introduced the software and plugins employed, the modeling process and its settings adjustments, and the daylight illuminance and daylight glare probability simulations.
3.1. Case study description
The analysis was performed on a virtual office space in Cairo, Egypt. Egypt is classified as a hot, arid desert climate according to Koeppen’s climate classification [56]. Cairo, the capital city, is located at a latitude of 30.0444° North and a longitude of 31.2357° East. It experiences a hot and dry summer season, with temperatures ranging up to 43°C during the day. Cairo receives minimal annual precipitation, averaging approximately 10 mm, and experiences high humidity levels during the summer months [57]. Cairo was selected for the current research due to its distinct climate characteristics, which require specialized façade treatments to minimize heat gain while ensuring sufficient daylighting and glare control.
The office space has a total area of 81 m2 and a height of 3.5 m, as shown in Fig. 2. It features a fully glazed south-facing façade, which is covered by a triangular perforated solar screen (PSS). Four design parameters were selected for the optimization process: matrix, perforation percentage, thickness, and separation distance. The matrix (M) refers to the number of horizontal and vertical divisions within the perforated screen. The perforation percentage (PP) defines the ratio of triangular voids in the screen; the triangular shape was selected as one of the basic geometrical shapes to study its potential in optimizing daylight and glare performance. The perforation percentages could be either constant or random along the façade to assess their impact on the optimization process. The thickness (T) refers to the depth of the screen, while separation distance (SD) defines the gap between the screen and the glazed façade. The characteristics and specifications of the office space, glazing, PSS, and the four design parameters are summarized in Table 2.
Figure 2

Fig. 2. The plan, section, and perspective view of the office space.
Table 2
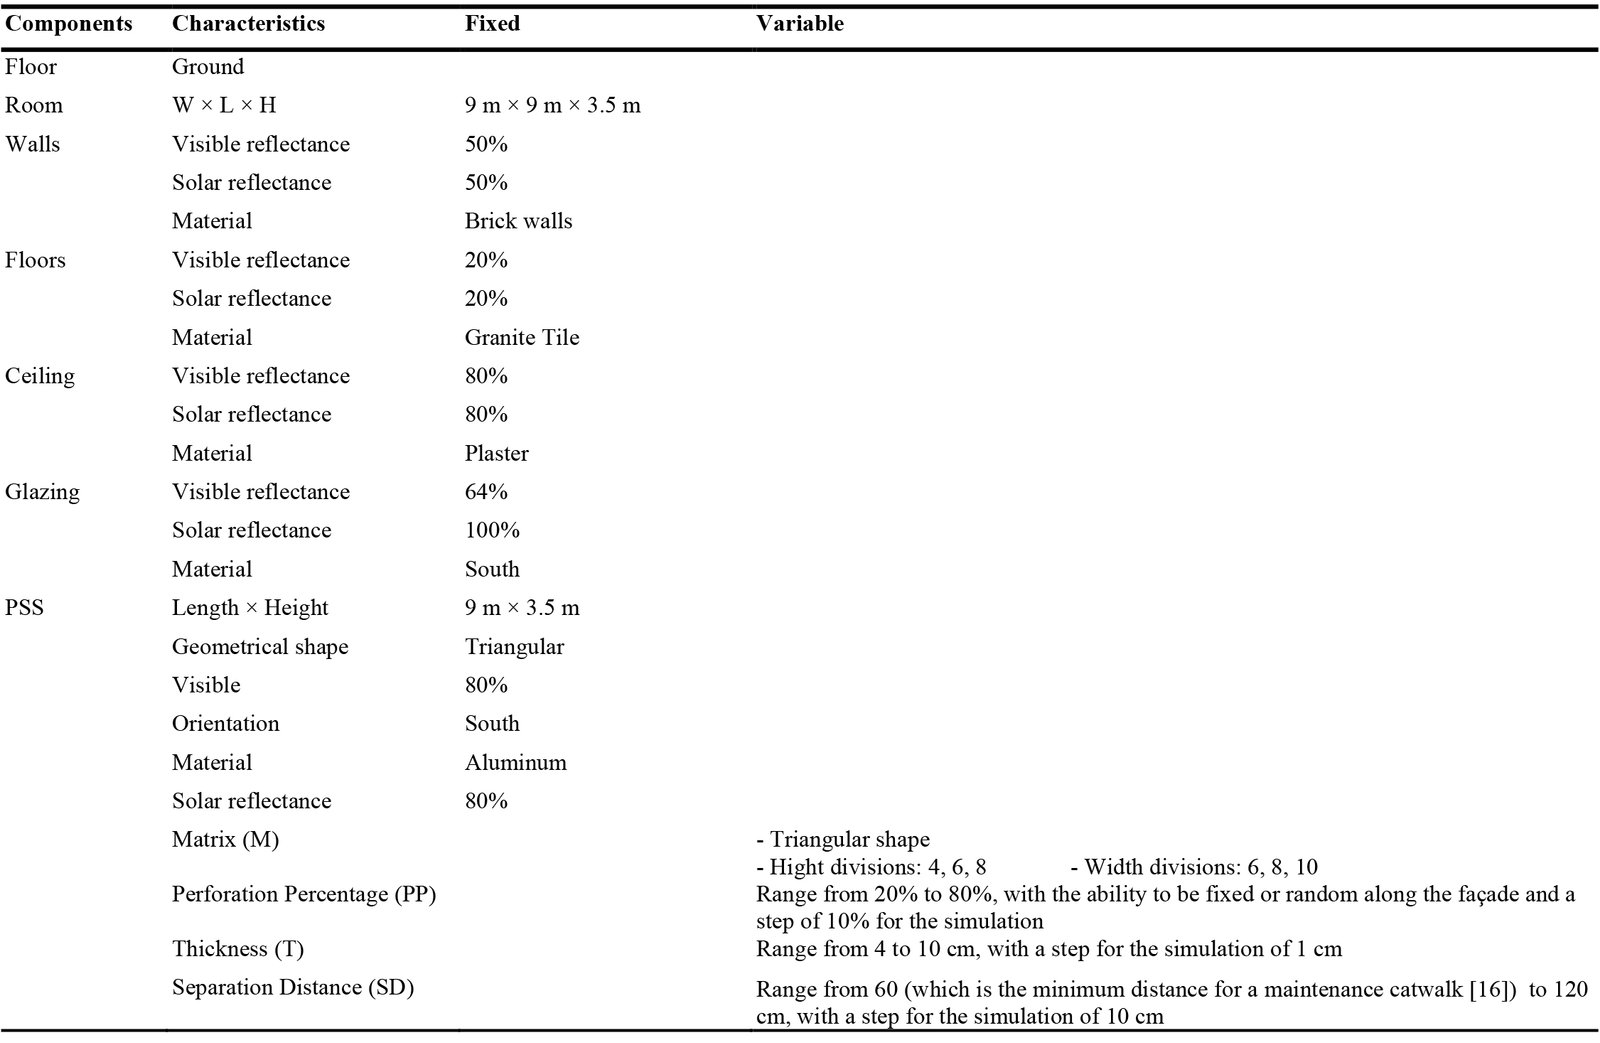
Table 2. Characteristics of the case study model and the four design parameters of the PSS.
Figure 3 provides samples for the matrix and perforation percentage parameters to clarify the properties and range of the triangular perforated screen. In each parameter, the average values of the remaining parameters were held constant to ensure a clear representation of their influence on the screen's formation.
Figure 3

Fig. 3. Samples of the matrix and perforation percentage parameters.
3.2. Modeling and simulations
3.2.1. Software and plugins
The study utilized Rhinoceros 3D software alongside the Grasshopper interface, as well as Ladybug and Honeybee (Version 1.6.0) and Galapagos plugins. Rhinoceros is a 3D computer-aided design (CAD) software. Its parametric capabilities are gained by Grasshopper, a parametric form-generating interface. Grasshopper is a visual programming tool that enables designers to algorithmically script and manipulate geometries through mathematical functions (a set of constraints or parameters defined by the designer) [54,58].
Honeybee and Ladybug are open-source plugins for the Grasshopper interface. Honeybee has the ability to create, simulate, and visualize detailed analyses, including annual daylight, electric daylight, illuminance, and glare, using Radiance software. It also performs energy modeling, indoor and outdoor thermal comfort analyses, air-flowing studies, and HVAC performance assessments through Open Studio or EnergyPlus software. Ladybug can import EnergyPlus weather files (.epw) into Grasshopper and perform several analyses such as sun path, solar radiation, out¬door thermal comfort, and view analyses while providing tools for visualizing environmental analysis results [58-60].
Galapagos is an evolutionary solver and GAs-based tool accessed via the Grasshopper interface [8]. Galapagos operates by defining a criterion and one or more sets of variable parameters, iteratively simulating and refining solutions until it reaches the optimal solution that fulfills the specified criterion efficiently [30,61,62].
3.2.2. Modeling and settings
The office model was constructed in Rhinoceros 3D software, with its surfaces and material specifications scripted in Grasshopper interface through Honeybee plugin. The program and the occupancy schedules were set as a medium-closed office with operational hours from 9:00 a.m. to 5:00 p.m. The PSS geometry was parametrically constructed in Grasshopper, enabling accurate control over its variable parameters during the optimization processes. The perforated screen was then integrated as a shading system covering the south-facing façade. The material specifications of the screen were also scripted via Honeybee plugin. The specifications of the office surfaces, glazing, and PSS were held constant throughout all simulations to ensure their effects on the results were neutralized. The only variables were the four design parameters of PSS: M, PP, T, and SD.
All the adjustments were linked to the “HB Model” component to enable simulating the model as one environment. A sensor grid was then added to the HB model; it was configured with a spacing of 1×1 m and a height of 91.6 cm, which is the average sitting height for males (94.05 cm) and women (89.34 cm) [63].
To simulate daylight illuminance at a specific time and date, the “HB Point-In-Time Grid-Based” component was used. It uses a specific location weather file (the Ladybug plugin was used to import Cairo’s climatic data [64]) and a specific duration month, day, and time to simulate the required analysis. The Ladybug plugin was then used to visualize the results of the simulations.
The result of each illuminance simulation comprised 81 values (corresponding to the 81 sensor grid points). The office space is exposed to excessive daylight, attributed to its geographic location. Thereby, the target of the optimization process was to reduce the highest illuminance value to its lowest possible value by manipulating the PSS parameters. However, some configurations could result in illuminance levels below 100 lux, contradicting the study’s minimum illuminance target. Therefore, a Python script was implemented within the Grasshopper interface using the "GhPython Script" component. The script was coded to pass the result to the optimization engine only if its lowest value is equal to or more than 100 lux. If a configuration fell below this threshold, the script would turn the values into a number that the optimization engine would reject (50000 lux in this study), effectively filtering out unsuitable configurations and ensuring that all areas maintain a minimum illuminance above 100 lux. This balance was critical, as integrating a PSS may reduce illuminance in zones farther from the daylight source. Figure 4 illustrates the Python script within the "GhPython Script" component.
Figure 4

Fig. 4. The Python code in the "GhPython Script" component.
After the “GhPython Script" component filtered and passed the suitable results, the accepted values were sorted in descending order, from highest to lowest. The highest value was then assigned as the fitness criterion that needed to be minimized in Galapagos optimization engine. Meanwhile, the four PSS parameters were set as the genome, representing the variable parameters that Galapagos adjusted iteratively during the optimization process. Figure 5 presents the complete Grasshopper script, while Fig. 6 demonstrates the optimization process steps.
Figure 5

Fig. 5. The complete grasshopper script.
Figure 6

Fig. 6. The steps of the optimization process.
Lastly, to analyze the glare probability of the optimal solutions, the “HB Point-In-Time View-Based” component was utilized to enable simulating glare at a specific time and date. It also used the location weather file and specific duration. The results were then connected to the “HB Glare Postprocess” component to simulate DGP.
3.2.3. Daylight illuminance simulations
This section represents the research core; it describe the daylight performance of six cases: a base case without PSS, four cases representing the optimal solution for each parameter individually, and the last case for the optimal balanced solution of the four parameters. The simulations were performed to explore the effectiveness of each case in achieving optimal daylighting performance while mitigating glare, identify the differences in their performance across the year, determine the most influential parameters, and assess the benefits of optimizing multiple parameters simultaneously versus individual optimization.
Each case was simulated independently for four specific days of the year—21st March, 21st July, 21st September, and 21st December—representing spring, summer, autumn, and winter, respectively. Simulations were conducted three times per day (9:00 a.m., 12:00 p.m., and 3:00 p.m.). Simulating specific days, rather than an entire year, was essential for two reasons: (1) to reveal the variations in performance during the day and across seasons, due to the sun's changing position and angle, and (2) to enable the genetic algorithm and Python code to effectively control the minimum and maximum illuminance values during the optimization process. This phase is comprised of three stages.
3.2.3.1. The base case
In this stage, the office space was analyzed as a base case without integrating the PSS to achieve three main objectives: (1) identify the areas requiring optimization, (2) quantify the potential optimization range achievable through optimizing one or balancing multiple parameters, and (3) emphasize the importance of implementing a PSS to enhance daylight performance.
3.2.3.2. Single parameter optimization
This stage aimed to evaluate the effectiveness of each of the four parameters separately—matrix, perforation ratio, thickness, and distance— in reducing the high illuminance levels while maintaining a minimum illuminance above 100 lux. For each parameter simulation, the average values of the remaining three parameters were fixed throughout the process to neutralize their effects.
The matrix, thickness, and separation distance parameters were manually simulated due to their relatively small number of variables—9 for M and 7 for both T and SD. However, the perforation percentage involved a larger number of variables, as it was programmed to include both constant and random perforation, controlled by two number sliders. Consequently, Galapagos and "GhPython Script" components were used to detect the optimal solution, with an average iteration of 100 in each of the twelve durations.
3.2.3.3. Multiple parameter optimization
This stage directly addressed the research objective by optimizing the four selected parameters simultaneously to balance their combined effects on daylight illuminance. Manually manipulating all four parameters would be impractical and time-consuming for the vast number of potential solutions. To overcome this challenge, Galapagos optimization engine and "GhPython Script" components were employed to identify the optimal solution for each of the twelve durations, with an average iteration of 750 in each of the twelve durations.
3.2.4. Daylight glare probability simulations
This phase evaluates the impact of the generated solutions across six scenarios on glare probability. The DGP was simulated for the base case, the four optimal solutions derived from single-parameter optimizations, and the optimal solution from the multi-parameter optimization for each of the twelve durations. The primary objective was to ensure that the balanced solutions effectively minimize glare, maintaining imperceptible glare levels throughout the year.
4. Results
4.1. Daylight illuminance simulations results
The results of the daylight simulations for the six scenarios are presented in Figs. 7 and 8, illustrating the percentage of overlit and usable zones for each scenario. These figures provide a comparative analysis, highlighting the effectiveness of each optimization approach in achieving balanced daylight distribution.
Figure 7

Fig. 7. The results of daylight illuminance simulations in March and June.
Figure 8
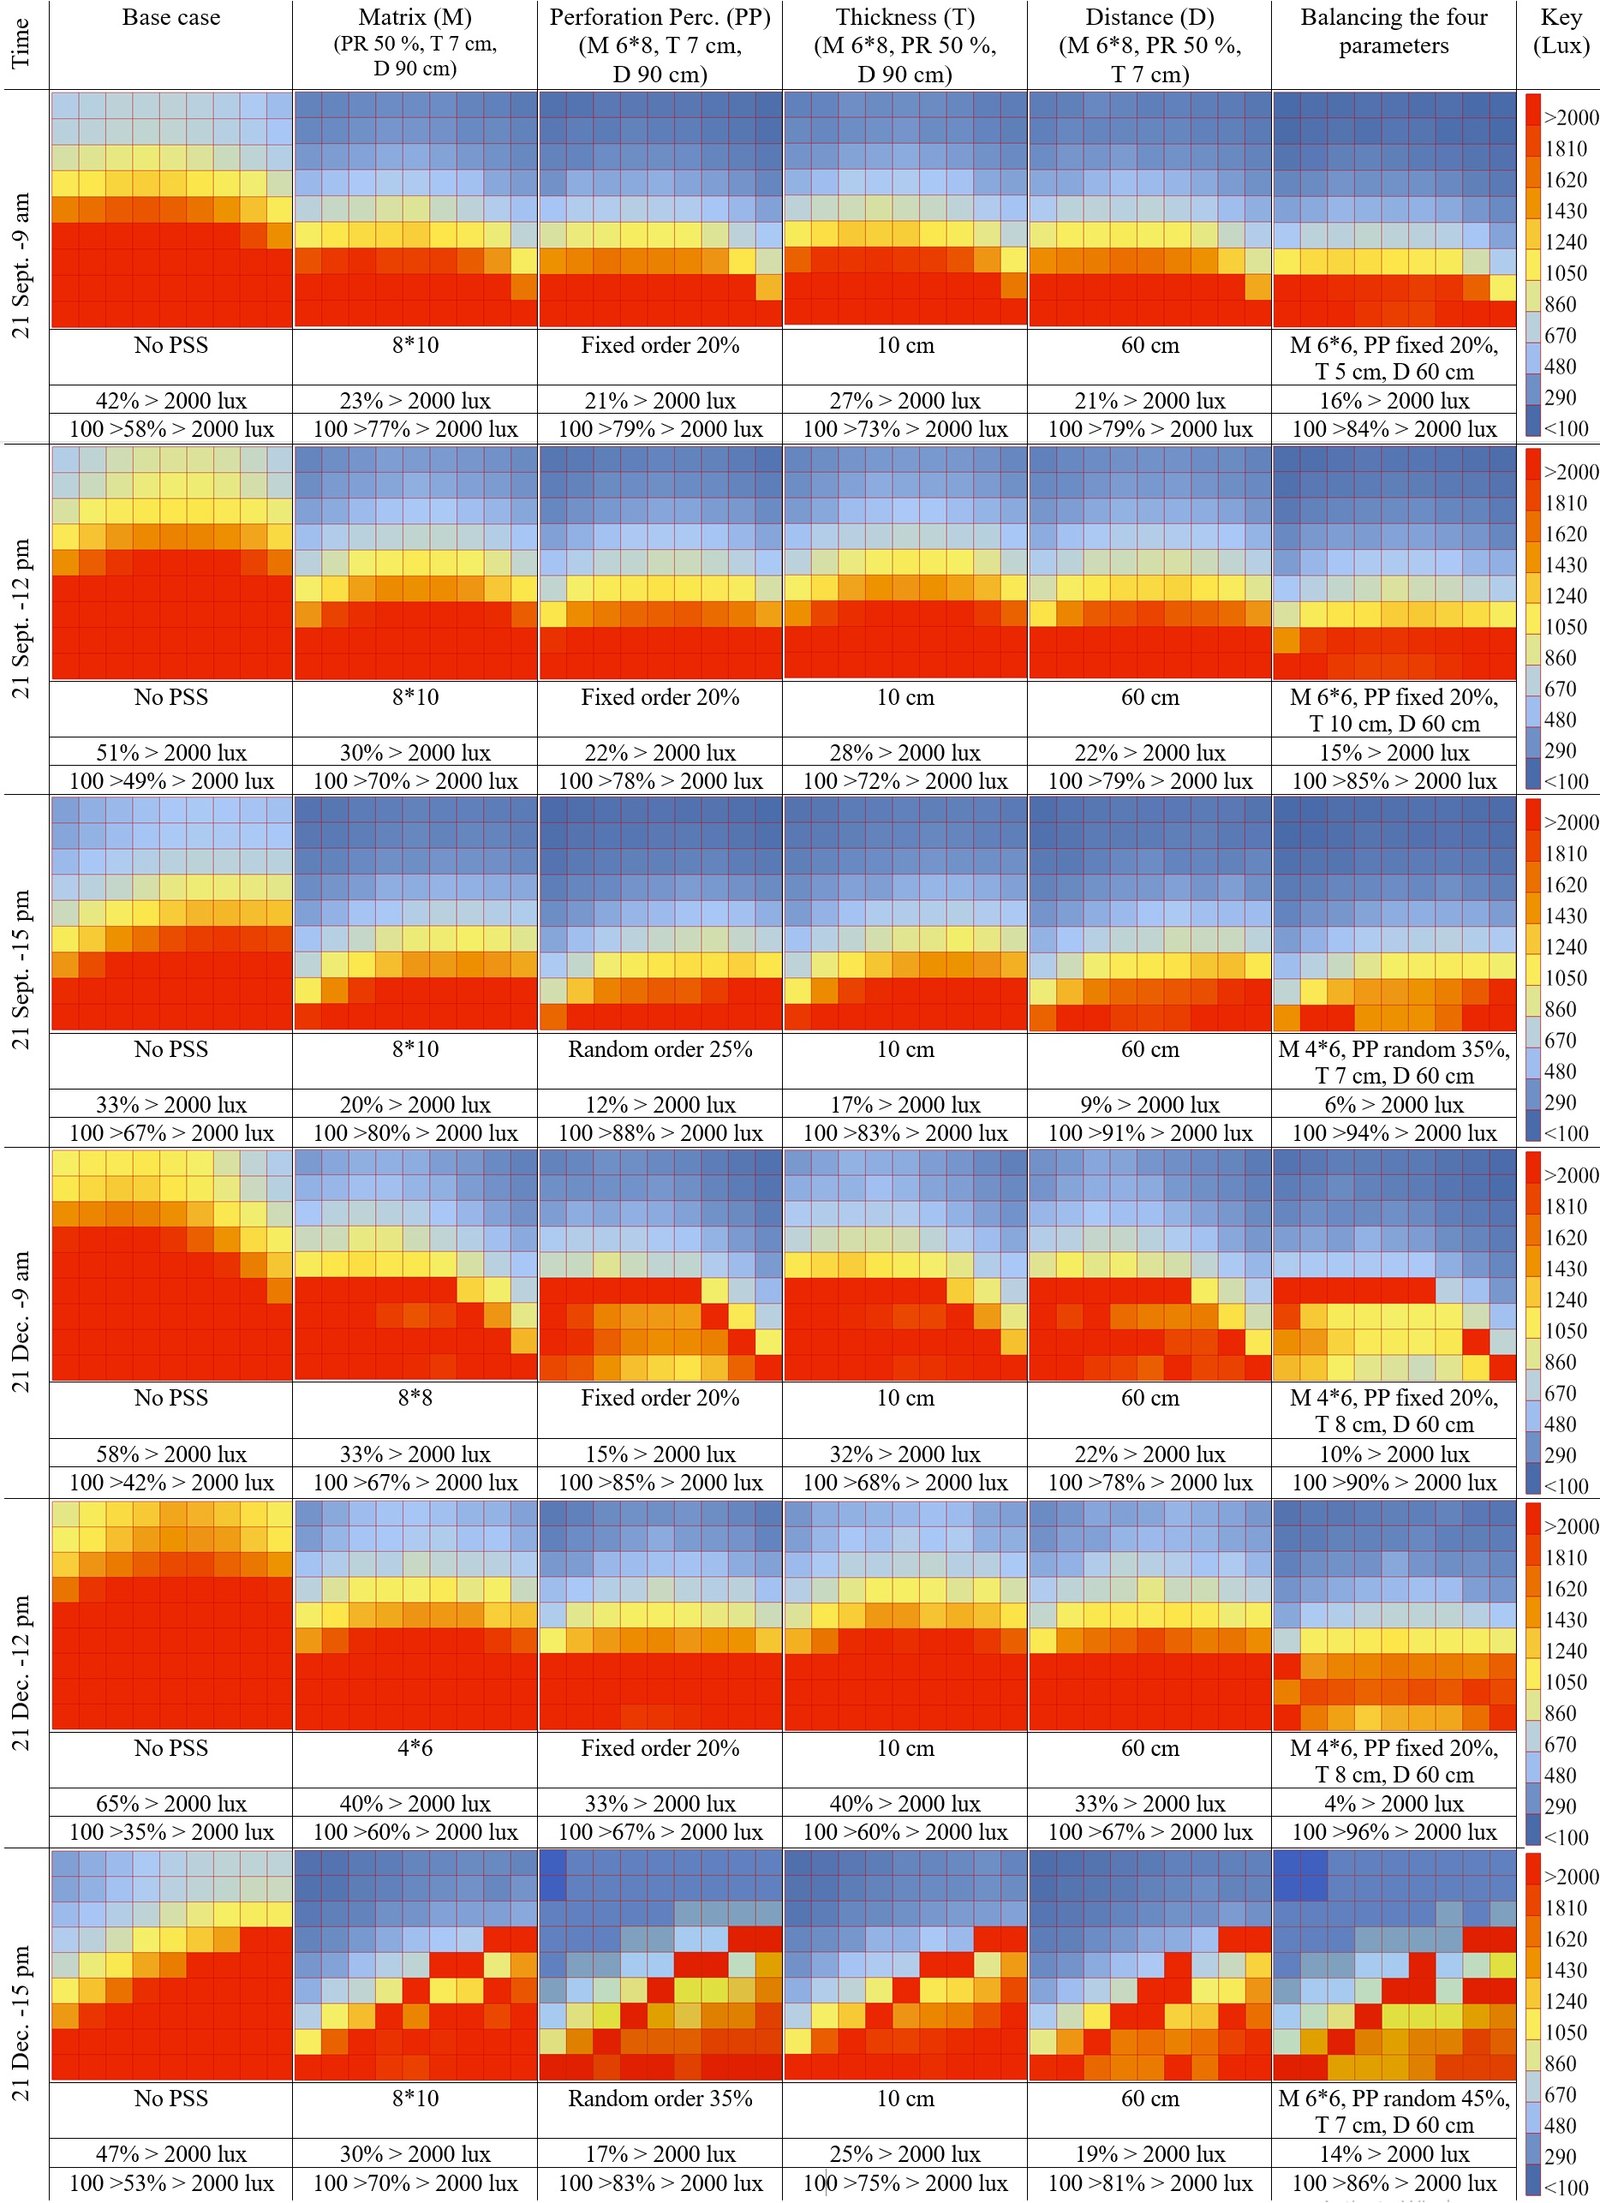
Fig. 8. The results of daylight illuminance simulations in September and December.
4.1.1. The base case
The results of the base case revealed excessively high luminance levels, with 27% to 65% of the office space exceeding 2000 lux. The peak overlit condition was observed on Dec. 21 at 12:00 PM, when 65% of the space experienced excessive daylight. While variations were observed throughout the year, and notably, no zones within space had illuminance levels below 100 lux. Thereby, the daylight optimization process must focus on reducing excessive luminance while preserving the lowest illuminance value above 100 lux.
4.1.2. Single parameter optimization
The results of the optimal solutions of the four parameters showed varying effectiveness in reducing overlit areas throughout the year:
- Matrix: The overlit area ranged from 10% to 40% of the office space, achieving a 17–26% reduction in solar penetration compared to the base case. The optimal matrix divisions were primarily 8×8 and 8×10. The Matrix achieved its highest influence on reducing the overlit percentage on Jun. 21 at 12 pm, followed by Dec. 21 at 9 am and 12 pm.
- Perforation percentage: The overlit area ranged from 1% to 33%, demonstrating the highest impact, with a 20–43% reduction in solar penetration. The optimal perforation percentage ranged from 20 to 35%. It had its highest influence on reducing the overlit percentage on Dec. 21 at 9 am, followed by Dec. 21 at 12 pm. Additionally, among the 12 evaluated durations, random perforations were more effective in 4 durations, while fixed perforations performed better in 8 durations.
- Thickness: The overlit area ranged from 10% to 40%, resulting in a 15–26% reduction in solar penetration. The optimal solution remained constant across all durations at 10 cm, the maximum allowed thickness. Thickness had its highest impact on reducing the overlit percentage on Dec. 21 at 9 am and Jun. 21 at 12 pm followed by Dec. 21 at 12 pm.
- Separation distance: The overlit area ranged from 0% to 33%, leading to a 20–36% reduction in solar penetration. The optimal separation distance was consistently 60 cm, the closest allowed distance between the screen and the façade. Thickness had its highest impact on reducing the overlit percentage on Dec. 21 at 9 am, followed by Dec. 21 at 12 pm.
Based on these findings, PP has the highest influence on reducing overlit zones, followed by SD, matrix, and finally thickness.
4.1.3. Multiple parameter optimization
In the optimal balanced solutions, the overlit area ranged from 0% to 22% of the office space, achieving a 21–61% reduction in solar penetration compared to the base case. The balanced solution, contrary to the base case, reached its optimal optimization level on Dec. 21 at 12 pm, reducing the overlit area percentage to 4% of the space, thereby increasing the usable daylit areas by 61%.
Throughout the year, the balanced solution showed noticeable variations in the four parameters and their optimal balanced range. This variation can be summarized as follows:
- Matrix: The optimal divisions were typically 6×6 and 4×6.
- Perforation percentage: The optimal PP ranged from 20 to 45%. Further, among the 12 evaluated durations, random perforations were more effective in 3 durations, while fixed perforations performed better in 9 durations.
- Thickness: The optimal T ranged in most cases from 6 to 8 cm.
- Separation distance: The optimal SD remained consistently 60 cm.
Based on these results, the balanced solutions outperformed the individually optimized parameter solutions.
In brief, across the year, the balanced solution could significantly reduce the overlit areas and outperform the individual parameter solutions by reducing the overlit areas by up to 29% more than the PP and SD solutions and up to 36% more than the matrix and thickness solutions. Accordingly, the balanced solution had the highest impact in reducing high illuminance levels, followed by the PP solutions, then the SD solutions, with the matrix and thickness solutions having the least impact. The percentages of overlit areas of the six scenarios throughout the year are illustrated in Fig. 9.
Figure 9
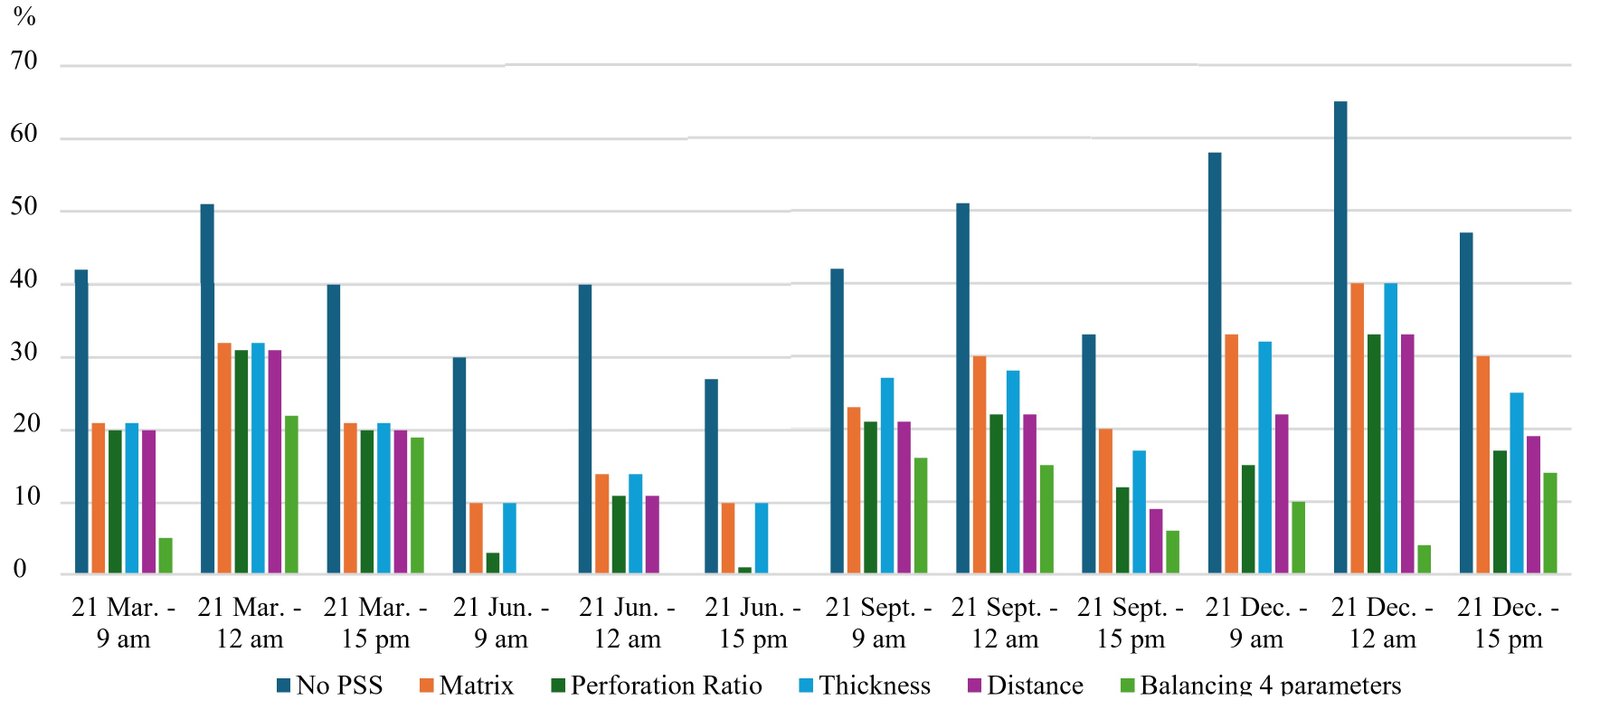
Fig. 9. The percentage of overlit zones (>2000 lux) across the year.
4.2. Daylight glare probability results
The results of the daylight glare probability simulations for the base case, the four single-parameter optimal solutions, and the balanced solution are presented in Figs. 10 and 11. Illustrating the percentage of glare probability in each scenario, providing a comparative analysis of their effectiveness in mitigating glare.
Figure 10

Fig. 10. The results of the DGP simulations in March and June.
Figure 11

Fig. 11. The results of the DGP simulations in September and December.
4.2.1. The base case
The results of the base case revealed a high daylight glare probability, peaking on Dec. 21 at 9 and 12 pm with intolerable glare levels. These findings align with the daylight illuminance results, confirming the excessive luminance in the office space. Across the twelve evaluated durations, no imperceptible glare was observed; the DGP levels fell within intolerable glare (0.5 and 0.55 DGP), disturbing glare (0.41 to 0.43 DGP), and perceptible glare (0.35 to 0.40 DGP). Highlighting the importance of integrating a shading system to enhance visual comfort and focusing on reducing excessive luminance in the daylight optimization process.
4.2.2. Single parameter optimization
The DGP results of the optimal solutions of the four parameters can be summarized as follows:
- Matrix and Thickness: The two parameters exhibited identical performance across the twelve durations. They achieved an imperceptible glare in eleven durations, with a DGP ranging from 0.29 to 0.34, and perceptible glare in one duration (21 Dec. at 12 pm, a peak glare period in the base case) with a DGP of 0.37. They could reduce the high DGP of the base case by 6 to 18%.
- Separation distance: Demonstrated slightly better performance. SD achieved an imperceptible glare in eleven durations with DGP ranging from 0.28 to 0.33 and a perceptible glare in one duration on 21 Dec. at 12 pm, similar to M and T; however, with a slightly lower DGP value of 0.36 DGP. It could reduce the high DGP of the base case by 7 to 20%.
- Perforation percentage: Provided the most effective glare reduction among the four parameters. It effectively achieves an imperceptible glare in the twelve durations, with DGP ranging from 0.27 to 0.33 DGP. Its highest recorded DGP occurred on 21 Dec. at 12 pm (similar to M, T, and SD), with an imperceptible glare of 0.33 DGP. PP could reduce the high DGP of the base case by 8 to 23%.
Based on these results, the PP has the highest in reducing DGP, followed by SD, and then M and T are the least efficient with the same performance.
4.2.3. Multiple parameter optimization
The balanced screen solutions demonstrated their effectiveness in mitigating glare across all twelve durations, achieving imperceptible glare levels with DGP ranging from 0.26 to 0.31. They could reduce the high DGP of the base case by 7 to 24%. Additionally, the balance solutions peak and highest influence on reducing DGP was on 21 Dec. at 12 pm with an imperceptible glare of 0.31 DGP, outperforming all single-parameter optimizations.
In brief, across the year, the balanced screen solution proved to be the most effective approach for glare mitigation, ensuring optimal visual comfort throughout the year while outperforming single-parameter optimizations, especially during high-glare periods. They reduced the DGP by up to 1% more than the PP solutions, up to 4% more than the SD solutions, and up to 6% more than the T and M solutions. Thereby, balanced solutions had the highest influence on reducing glare probability, followed by PP, SD, and then thickness and matrix solutions. Additionally, only the balanced and PP solutions were able to completely eliminate glare in the highest glare probability duration (on 21 Dec. at 12 pm). The percentages of daylight glare probability of the six cases throughout the year are demonstrated in Fig. 12.
Figure 12

Fig. 12. The percentages of daylight glare probability throughout the year.
4.3. Comparative analysis between single and multi-parameter optimization
This section analyzes the variations in the optimal solutions when manipulating a single parameter compared to balancing four parameters, aiming to emphasize the significance of integrating the influences of multiple parameters in enhancing daylight efficiency, reducing glare phenomenon, and generating more comprehensive and effective solutions. The analysis is structured into two key phases: first, an evaluation of the differences between the optimal solutions of the four individual parameters and the balanced solution throughout the year. Second, a comparison of the top five optimal solutions for each of the four parameters and the balanced solution during the two highest peak glare durations, providing insights into their relative effectiveness in extreme daylight conditions.
4.3.1. The optimal solutions
4.3.1.1. Matrix (M)
When optimizing solely the matrix to minimize the high illuminance levels, the optimal divisions were primarily 8×8 and 8×10. These divisions are characterized by their small, narrow perforations along the screen, which effectively reduce solar penetration by 17–26% and DGP by 6–18%; however, they significantly obstruct the external view and limit the user’s connection to the outdoor environment. In contrast, the optimal divisions of the balanced solution were typically 6×6 and 4×6, as shown in Fig. 13. These divisions have larger and wider perforations, which provide better views of the exterior while further reducing daylight illuminance by 21–61% and DGP by 7–24%, despite permitting more solar penetration.
Figure 13

Fig. 13. The differences between manipulating M and M within four parameters.
4.3.1.2. Perforation percentage (PP)
The optimal perforation percentages, when manipulating PP only to reduce high illuminance, ranged from 20 to 35%, resulting in a reduction of overlit areas by 20–43% and DGP by 8–23%. However, when PP was balanced with the other three parameters, the percentage increased to between 20 and 45%, with further reduction in overlit areas to 21–61% and DGP by 7–24%. Across the twelve durations, both approaches shared a 20% perforation percentage in six durations, as shown in Fig. 14. However, in the remaining six durations, the balanced solutions had larger perforation percentages, improving both daylight illuminance and outdoor view.
Figure 14

Fig. 14. The differences between manipulating PP and PP within four parameters.
4.3.1.3. Thickness (T)
While optimizing the thickness alone, the optimal solution across all durations was 10 cm, the maximum allowed thickness in the simulation. This thickness could reduce the high illuminance values by 15–26% and DGP by 6–19%. However, in the balanced solutions, when manipulating the thickness alongside three other parameters, the thickness was generally reduced, in most cases, to 6–8 cm, as shown in Fig. 15. The balanced solution could increase the material efficiency by reducing its consumption and promoting sustainability while reducing the high illuminance values by 21–61% and DGP by 7–24%.
Figure 15

Fig. 15. The differences between manipulating T and T within four parameters.
4.3.1.4. Separation distance (SD)
For both single-parameter optimization and multi-parameter balancing, the optimal separation distance was consistently 60 cm (the closest allowed distance in the simulation), as shown in Fig. 16. However, when optimizing SD alongside three other parameters, the balanced solutions achieved a 21–61% reduction in the percentage of overlit areas and 7–24% in DGP, compared to the reduction of 20–36% in the percentage of overlit areas and 7–20% in DGP attained through optimizing SD only.
Figure 16

Fig. 16. The differences between manipulating SD and SD within four parameters.
4.3.2. The top five optimal solutions
This section compares the top five optimal solutions for each of the four parameters and the balanced solution during the two peak illuminance durations, December 21 at 9 am and 12 pm. The durations were chosen based on the results of daylight and glare simulation, as they exhibited the most significant influence of the four parameters and the balanced solution on daylight performance and glare reduction. Table 3 demonstrates a detailed comparison of the top five solutions of the four parameters and the balanced solutions at these time periods.
According to Table 3, the results of the top five of the optimal solution during the two peak illuminance durations can be summarized as follows:
Table 3
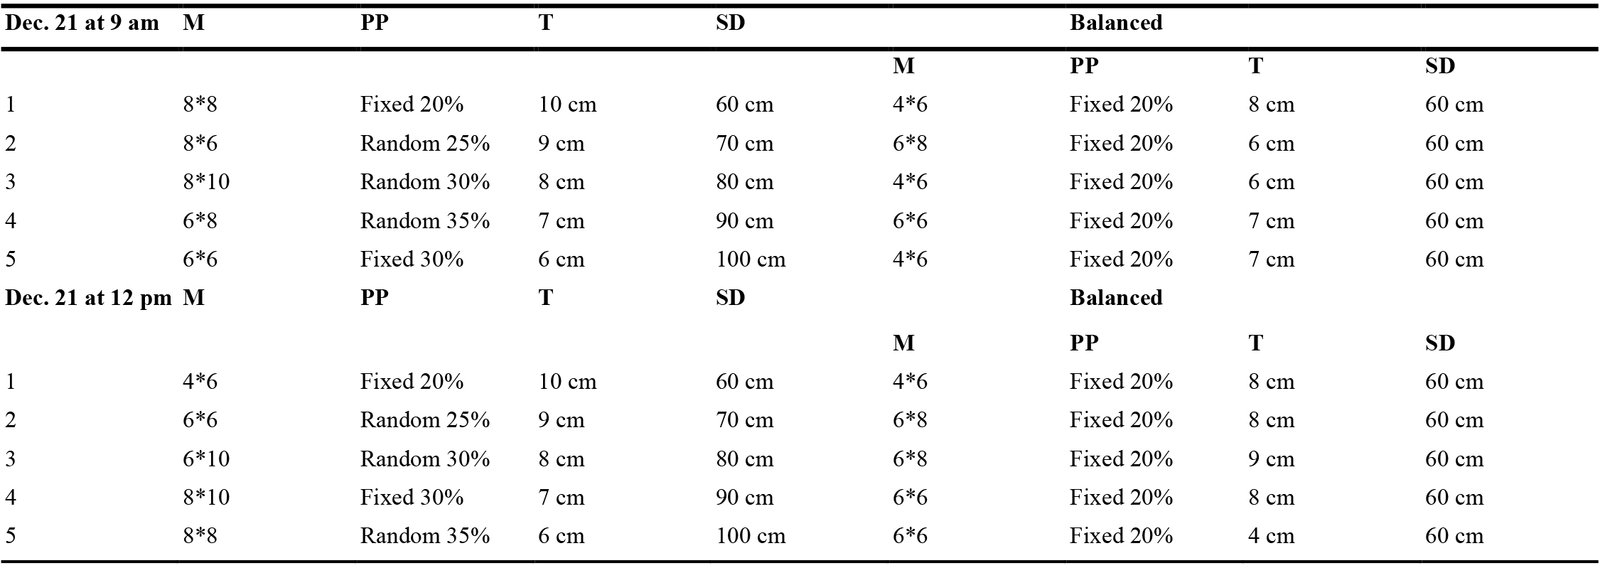
Table 3. The top five optimal solutions of the four parameters and the balanced solution on December 21 at 9 am and 12 pm.
- Matrix: The five solutions showed varying divisions across both durations.
- Perforation percentage: The first three solutions showed identical results across both durations, with a fixed 20% being the most influential, followed by random PP of 25% and 30%. While the fourth and fifth solutions—random 35% and fixed 30%—were interchanged between the two durations. The results highlight the capability of the random perforations to reduce excessive illuminance levels, allowing larger perforation percentages that enhance both daylight illuminance and outdoor visibility.
- Thickness: The five solutions revealed identical results in both durations, with the maximum allowed thickness of 10 cm as the optimal solution and decreasing constantly until reaching 6 cm as the fifth place.
- Separation distance: The five solutions showed identical results in both durations, with the closest distance of 60 cm being the optimal solution and increasing constantly to 100 cm in fifth place.
- The balanced solutions: The matrix showed similar divisions in both durations, with 4×6 emerging as the optimal configuration, followed by 6×8 and 6×6 divisions. The perforation percentage remained fixed at 20% across the top five solutions. Thickness varied, with 8 cm being the optimal value. Separation distance was consistently maintained at 60 cm among the top five solutions in both durations.
4.4. The seasonal variations in optimal balanced solutions
This part presents a detailed analysis of the daylighting and glare control of the optimal balanced solutions, illustrating how they vary throughout the day and across the year. This analysis focuses on four seasonal scenarios: spring, summer, autumn, and winter, emphasizing how the differences in the solar angle and path influence the balanced solutions.
- Spring - 21st March: Moderate matrix division (6×8 to 6×6), varied perforation percentages (20% to 40%), thickness 6 cm, and separation distance 60 cm. Achieved 78–95% useful daylight, 5–22% overlit areas, and 0.28–0.29 DGP.
- Summer- 21st June: Moderate matrix division (6×8 to 6×6), varied perforation percentages (20% to 40%), thickness 6 cm, and separation distance 60 cm. Achieved 100% useful daylight, 0% overlit areas, and 0.26-0.28 DGP.
- Autumn- 21st September: Large matrix divisions (6×6 to 4×6), varied perforation percentages (20% to 35%), varied thickness (5 to 10) cm, and separation distance 60 cm. Achieved 84–94% useful daylight, 6–16% overlit areas, and 0.28-0.29 DGP.
- Winter- 21st December: Large matrix divisions (6×6 to 4×6), varied perforation percentages (20% to 45%), varied thickness (7 to 8) cm, and separation distance 60 cm. Achieved 86-96% useful daylight, 4-14% overlit areas, and 0.28-0.31 DGP.
In brief, across the four seasons, the balance solutions could keep the useful daylight percentage above 79%, reduce the overlit areas percentage up to 100%, and preserve DGP values equal to or below 0.31, providing imperceptible glare throughout the year. However, there were variations in optimal balanced solutions throughout the day and year, which required a PSS capable of responding dynamically to different times of day to achieve optimal performance. The seasonal variation of the optimal balanced solutions and their impact on useful daylight, overlit areas, and daylight glare probability across the year was illustrated in Fig. 17.
Figure 17

Fig. 17. The seasonal variations in optimal balanced solutions and it’s on daylight and glare performance across the year.
Summarizing the results, the study demonstrated the effectiveness of balanced solutions in reducing high illuminance levels and mitigating glare compared to individually optimized parameters. They reduced the overlit areas by up to 61% compared to the base case, outperforming the perforation percentage and separation distance by up to 29% and matrix and thickness by up to 36%. Additionally, balanced solutions eliminated the glaring probability across all twelve durations, reducing the high DGP of the base case by up to 24% and outperforming PP by up to 1%, SD by up to 4%, and M and T by up to 6%. Accordingly, balanced solutions were the most effective in reducing high illuminance levels and glare probability, followed by the PP solutions, then the SD solutions, with the matrix and thickness solutions having the least impact. Furthermore, a comparison between the single and multiple optimization approaches revealed that the balanced solutions not only enhance daylight and glare performance but also present more sustainable solutions in terms of material saving, providing better views of the exterior with larger matrix divisions and perforation percentages, and lower material usage. However, they showed noticeable variations throughout the day and year, emphasizing the need for a PSS that can dynamically adapt to different times of the day for optimal performance. Lastly, the balance solutions maintained a useful daylight percentage above 79%, surpassing the research target, while ensuring imperceptible glare throughout the year.
5. Discussion
The research highlights the effectiveness of Perforated Solar Screens (PSSs) in improving daylighting and glare performance. It demonstrates how the interaction of PSS parameters within a holistic design strategy can significantly enhance their performance. The research studied the combined influence of four design parameters—matrix, perforation percentage, thickness, and separation distance—on the daylighting and glare performance of a south-facing façade of an office building in Egypt, characterized by a hot, dry climate. Computational tools such as Rhinoceros 3D, Honeybee and Ladybug plugins, and Galapagos, along with the “GhPython Script” component in Grasshopper, were employed for office modeling, daylight and glare simulations, result visualization, and optimization processes.
The results revealed a significant reduction in overlit areas in the balanced solutions, ranging from 21–61% compared to the base case, which exhibited high daylight illuminance throughout the year. They also outperformed single-parameter optimizations, which achieved reductions in overlit zones ranging between 15% and 43%. Additionally, at the time, the base case exhibited perceptible, disturbing, and intolerable glare; the balanced solutions could eliminate the glare across all the analyzed periods, reducing the DGP by 7–24%. It also outperformed the single-parameter optimizations’ glare control, which achieved DGP reductions of 6–23%. Accordingly, balanced solutions exerted the highest influence in reducing high illuminance levels and glare probability, followed by the PP solutions, then the SD solutions, with the matrix and thickness solutions having the least influence.
A comparative analysis of individual parameter optimizations and balanced solutions revealed that balanced solutions provide more sustainable solutions. For instance, optimizing the matrix alone led to smaller perforation sizes (8x8 and 8x10 divisions) that reduced solar penetration but also limited visual access. In contrast, the balanced solutions employed larger perforations (6x6 and 4x6 divisions) that not only enhanced daylight distribution but also improved views. Similarly, optimizing the thickness only led to thicker screens (10 cm), while the balanced solutions generated thinner screens (6-8 cm), contributing to both sustainability (by material savings and reduced environmental impact) and optimal daylighting performance. The results support the idea of a balanced approach that interplays multiple parameters for more effective solutions.
The results also noted that PP of 20-45%, M of 4×6, 6×6, and 6×8, T of 5-10 cm, and SD of 60 cm are the optimal parameter values for south-orientation façades in hot, dry climates. The perforation percentage values align with previous research by Pool (2019), who studied circular PSS perforations in a Mediterranean climate, which is characterized by hot, dry summers, and found that PP of 20%-50%, M of 3×7, T of 3-7 cm, and SD of 90-120 cm are the optimal parameters at the south orientation façade [9]. While matrix and thickness parameters were relatively close, the separation distance differed significantly from the current study's results.
Furthermore, an analysis of the four single-parameter optimizations in daylight and glare performance revealed that perforation percentage exerted the highest influence, followed by separation distance, matrix configuration, and thickness, which had the least impact. These findings are consistent with the research by Srisamranrungruang and Hiyama (2021), who identified a PP of 40% as optimal for an office building in Tokyo, Japan (hot and humid summer climate), while also noting that thickness had the lowest impact on daylight performance [44]. Similarly, Chi et al. (2019) found that PP was the most influential parameter in PSS design, reporting an optimal perforation percentage of 37.5% for office buildings in Seville, Spain (Mediterranean climate), followed by orientation, matrix, and shape [20].
The study also demonstrated the effectiveness of random perforation percentages in enhancing daylighting performance. Among the twelve evaluated durations, random triangular perforations emerged as the optimal solution in reducing overlit areas in four durations. Additionally, within the top five optimal solutions identified during the two highest peak durations, random perforations occupied three positions in each. These findings support those of Huang et al. (2024), who studied the impact of non-uniform circular perforations on PSS daylighting performance and found that non-uniform screens with specific perforation patterns significantly outperformed uniform screens at the same perforation ratio [13].
The research adopted a multi-objective optimization approach using Galapagos optimization engine to minimize excessive illuminance levels by simultaneously adjusting all four parameters with equal weight. This approach aimed to assess the individual impact of each parameter on daylight and glare performance while identifying their optimal balance. In contrast, D. Pool (2019) utilized the Design through Orthogonal Arrays (DOA) analysis method to examine the influence of orientation, perforation, matrix, thickness, and distance on daylighting and shading performance in a Mediterranean climate. The DOA method reduced the number of experimental runs by selecting a subset of possible factorial combinations, thereby leveling the influence of different parameters. In Pool’s study, PP was analyzed at six levels due to its direct impact on both daylight penetration and glare control, while the other three parameters were assessed at three levels each [9]. Similarly, Chi et al. (2019) applied orthogonal listing methods to analyze the effects of PP, M, shape, and orientation on daylight availability in office buildings in Seville, Spain (Mediterranean climate) [20]. While both studies employed multi-objective optimization approaches, the current research differs by focusing on neutralizing the influence of all four parameters and treating them equally. This approach ensures a more comprehensive assessment of each parameter’s impact on daylight and glare performance while determining their optimal balance.
Additionally, the research employed Grasshopper/Rhinoceros 3D, along with Honeybee, Ladybug, and Galapagos plugins for daylight performance analysis. This approach aligns with previous studies, such as A. El-Bahrawy (2025), who utilized the same computational tools to explore the optimal perforation ratio of an Islamic pattern screen for enhancing thermal comfort and energy efficiency in a mosque in Cairo, Egypt [53]. Similarly, A. Maksoud et al. (2022) used Rhinoceros/Grasshopper and the Ladybug plugin to improve visual and thermal comfort in university corridors in the UAE (hot arid climate) [54]. Likewise, C. Lavina and F. Fiorito (2017) applied Rhinoceros/Grasshopper, Honeybee, Ladybug, and Galapagos plugins to analyze the impact of varying square perforation sizes and distributions on UDI and DGP [11]. While these studies employed similar computational approaches, the current research extends their methodology by integrating Python scripting into the optimization process. The study incorporates the “GhPython Script” component to ensure that the generated solutions adhere to the target illuminance range. This integration contributes to the novelty of the research by enabling the simultaneous simulation of all parameters while maintaining optimal illuminance levels within a single optimization process.
The study also demonstrates that seasonal variations in solar angles and paths require adjustments in matrix configurations, perforation percentages, and thickness of the balanced solutions to maintain optimal daylighting performance and imperceptible glare levels. Therefore, the implementation of dynamic systems, such as kinetic or adaptable PSS, is recommended to accommodate these changes over time, achieving optimal daylight and glare management.
Finally, the research highlights the capability of perforated solar screens to promote daylighting and glare performance by integrating the influence of multiple parameters within a cohesive design strategy. Furthermore, it emphasizes the critical role of computational simulation tools, genetic algorithms, and Python scripting in balancing design parameters to enhance daylight and glare performance. These findings provide a robust framework for future research and the practical implementation of optimized PSS solutions in architectural design.
6. Conclusion
The research highlights the potential of PSS in improving the visual performance of office buildings in hot, dry climate zones by studying the combined influence of four design parameters—matrix, perforation percentage, thickness, and separation distance—on enhancing daylighting and glare performance. The results revealed that the balanced approach led to a noticeable reduction in overlit zones by up to 61% and effectively eliminated glare, compared to the base case without PSS, offering a more efficient and sustainable solution. Additionally, it outperformed the optimization of individual parameters independently. Furthermore, the research revealed the capabilities of integrating advanced simulation tools, such as Honeybee and Ladybug in Grasshopper, along with genetic algorithms and Python scripting for balancing design parameters, which provides a robust framework for future research and practical applications.
The current study has focused on a specific climate zone, façade orientation, building type, definite parameters, and visual comfort aspects. However, the results may vary in different geographical locations or for façades with different orientations. Future research could investigate the performance of these design parameters in different climate zones and orientations, evaluate additional environmental aspects such as thermal performance and energy efficiency, and explore the combined influence of other parameters, such as different materials and various shapes of perforations.
Funding
This research received no external funding.
Declaration of competing interest
The authors declare no conflict of interest.
References
- B. Dabaj, M. Rahbar, and B. Fakhr, Impact of Different Shading Devices on Daylight Performance and Visual Comfort of A Four Opening Sides' Reading Room In Rasht, Journal of Daylighting, 9(1) (2022) 97-116. https://doi.org/10.15627/jd.2022.7
- I. Ullah and S. Shin, Highly concentrated optical fiber-based daylighting systems for multi-floor office buildings, Energy and Buildings, 72 (2014) 246-261. https://doi.org/10.1016/j.enbuild.2013.12.031
- M. Fahmy and M. Elsoudany, Parametric Mashrabiya as a Shading System for Optimized Daylighting in Egypt, Engineering Research Journal, 177 (2023) 76-95. https://doi.org/10.21608/erj.2023.289551
- M. Gomes, A. Santos, and M. Calhau, Experimental study on the impact of double tilted Venetian blinds on indoor daylight conditions, Building and Environment, 225 (2022) 109675. https://doi.org/10.1016/j.buildenv.2022.109675
- M. Elcharkawi, H. Abdel-Salam, and M. Fikry, Facades Solar Screens Impact on Daylighting Performance in Buildings, in: Proceedings of the REAL CORP 2023, Ljubljana, Slovenia, 18-20 September 2023, pp. 281-292.
- A. Sherifa, A. El-Zafarany, R. Arafa, External perforated window Solar Screens: The effect of screen depth and perforation ratio on energy performance in extreme desert environments, Energy and Buildings, 52 (2012) 1-10. https://doi.org/10.1016/j.enbuild.2012.05.025
- A. Norouziasas, A. Tabadkani, R. Rahif, M. Amer, D. Dijk, H. Lamy, S. Attia, Implementation of ISO/DIS 52016-3 for adaptive façades: A case study of an office building, Building and Environment, 235 (2023) 110195. https://doi.org/10.1016/j.buildenv.2023.110195
- F. Çağlar and G. Gedik, A New Design Proposal for Perforated Solar Screens and Optimization in terms of Solar Control, Civil Engineering and Architecture, 9(7) (2021) 2416 - 2426. https://doi.org/10.13189/cea.2021.090727
- D. Pool, A Comprehensive Evaluation of Perforated Façades for Daylighting and Solar Shading Performance: Effects of Matrix, Thickness and Separation Distance, Journal of Daylighting, 6(2) (2019) 97-111. https://doi.org/10.15627/jd.2019.10
- M. Abedini, H. Gholami, and H. Sangin, Multi-objective Optimization of Window and Shading Systems for Enhanced Office Building Performance: A Case Study in Qom, Iran, Journal of Daylighting, 12(1) (2025) 91-110. https://doi.org/10.15627/jd.2025.6
- C. Lavina and F. Fiorito, Optimization of an external perforated screen for improved daylighting and thermal performance of an office space, Procedia Engineering, 180 (2017) 571 - 581. https://doi.org/10.1016/j.proeng.2017.04.216
- F. Rezaei, H. Sangin, M. Heiranipour, and S. Attia, A Multi-objective Optimization of Window and Light Shelf Design in Office Buildings to Improve Occupants' Thermal and Visual Comfort, Journal of Daylighting, 11(1) (2024) 55-68. https://doi.org/10.15627/jd.2024.4
- L. Huang, K. Zou, X. Zhang, S. Zhao, Effects of non-uniform perforated solar screen on daylighting and visual comfort performance, Journal of Building Engineering, 97 (2024) 110684. https://doi.org/10.1016/j.jobe.2024.110684
- M. El-Agami, G. Hanafy and M. Osman, Investigating the Effect of High-Rise Buildings' Mass Geometry on Energy Efficiency within the Climatic Variation of Egypt, Sustainability, 13(19) (2021) 10529. https://doi.org/10.3390/su131910529
- W. Rakha, A. Nessim, and M. Ismail, Retrofitting Shading Units To Optimize Daylighting in The Governmental School Building in Cairo, Journal of Al-Azhar University Engineering Sector, 18(66) (2023) 183-202. https://doi.org/10.21608/auej.2023.283049
- O. Etman, O. Tolba, and S. Ezzeldin, Double-Skin Façades in Egypt between Parametric and Climatic Approaches, in: Proceedings of the 31st eCAADe conference, Faculty of Architecture, Delft University of Technology, Delft, The Netherlands, 18-20 September 2013, pp. 459- 465. https://doi.org/10.52842/conf.ecaade.2013.1.459
- A. Kaushik, M. Arif, , O.J. Ebohon , H. Arsalan, M.Q. Rana, and L. Obi, Effect of indoor environmental quality on visual comfort and productivity in office buildings, Journal of Engineering, Design and Technology, 21(6) (2021) 1746-1766. https://doi.org/10.1108/JEDT-09-2021-0474
- S. Preto and C. Gomes, Lighting in the Workplace: Recommended Illuminance (lux) at Workplace Environs, in: Proceedings of AHFE 2018 International Conference on Applied Human Factors and Ergonomics, Washington, DC, USA, 24-28 July 2019, In Advances in Intelligent Systems and Computing, Springer: Cham, Switzerland, 2019, pp. 180-191.
- Y. Kort, Light and Quality of Life, In Encyclopedia of Quality of Life and Well-Being Research, 1st edition, Springer: Berlin/Heidelberg, Germany, 2014, pp. 3615-3620. https://doi.org/10.1007/978-94-007-0753-5_3961
- D. Chi, D. Moreno, and J. Navarro, Statistical Methods Applied to Optimize Perforated Façade Design for Daylight Availability, Journal of Architectural Engineering, 25(1) (2019) 04018034. https://doi.org/10.1061/(ASCE)AE.1943-5568.0000339
- M. Fahmy, A. Eltaweel, R. Rizi, and N. Imani, Integrated Kinetic Fins for Western Facades in Territories with Low Solar Altitudes, Buildings, 13(3) (2023) 782. https://doi.org/10.3390/buildings13030782
- A. Sherif, H. Sabry, and T. Rakha, External perforated Solar Screens for daylighting in residential desert buildings: Identification of minimum perforation percentages, Solar Energy, 86(6) (2012) 1929-1940. https://doi.org/10.1016/j.solener.2012.02.029
- J. Mardaljevic, M. Andersen, N. Roy, and J. Christoffersen, Daylighting metrics: is there a relation between useful daylight illuminance and daylight glare probability?, in: Proceedings of the First Building Simulation and Optimization Conference, Loughborough University, Loughborough, England, 10-11 September 2012, pp. 189-196.
- A. Nabil and J. Mardaljevic, Useful daylight illuminance: A new paradigm for assessing daylight in buildings, Lighting Research and Technology, 37(1) (2005) 41-59. https://doi.org/10.1191/1365782805li128oa
- H. Sabry, A. Sherif, M. Gad Elhak, and T. Rakha, External Perforated Solar Screen Parameters and Configurations: Daylighting Performance of Screen Axial Rotation and Opening Proportion in Residential Desert Buildings, in: Proceedings of the 14th ICCCBE Conference, Moscow, Russia, 27-29 June 2012, pp. 1- 8.
- A. Othman and A. Khalid, Comparative Performance of Internal Venetian Blind and Roller Blind with Respects to Indoor Illumination Levels, Procedia - Social and Behavioral Sciences, 101 (2013) 542-553. https://doi.org/10.1016/j.sbspro.2013.07.227
- F. Leccese, F. Fantozzi, V. Vandelanotte, G. Salvadori, M. Rocca, and T. Corucci, Energy Consumption, Operating Costs and CO2 Emission of LED Lighting in Office Building, in: Proceedings of the 15th CIRIAF National Congress, Perugia, Italy, 9-11April 2015, pp. 1-16.
- A. Zayed, M. Elkhateib, M. Mahdy, and I. Elwy, Daylighting Distribution Enhancement for Deep Office Spaces via Dynamic Louvers System, a case study in Cairo, Egypt, in: Proceedings of the 12th ICCAE Conference, Cairo, Egypt, 3-5 April 2018, pp. 1-11. https://doi.org/10.21608/iccae.2018.30005
- L. Roche, Summertime performance of an automated lighting and blinds control system, Lighting Research and Technology, 34(1) (2002)11-27. https://doi.org/10.1191/1365782802li026oa
- D. Chi, D. Moreno, and J. Navarro, Design Optimisation of Perforated Solar Façades In Order to Balance Daylighting with Thermal Performance, Building and Environment, 125 (2017) 383- 400. https://doi.org/10.1016/j.buildenv.2017.09.007
- M. Abedini, E. Sarkardehi, and H. Sabzevar, Investigating effective parameters for enhancing energy efficiency with an attached solar greenhouse in residential buildings: a case study in Tabriz, Iran, Asian Journal of Civil Engineering, 26(3) (2025) 1257-1271. https://doi.org/10.1007/s42107-024-01249-9
- Y. Lu, H. Lin, S. Liu and Y. Xiao, Nonuniform Woven Solar Shading Screens: Shading, Mechanical, and Daylighting Performance, Sustainability, 11(20) (2019) 5652. https://doi.org/10.3390/su11205652
- D. Chi, D. Moreno, P. Esquivias, and J. Navarro, Optimization method for perforated solar screen design to improve daylighting using orthogonal arrays and climate-based daylight modelling, Journal of Building Performance Simulation, 10(2) (2017) 144-160. https://doi.org/10.1080/19401493.2016.1197969
- N. Azmi and S. Ibrahim, A comprehensive review on thermal performance and envelope thermal design of mosque buildings, Building and Environment,185 (2020) 107305. https://doi.org/10.1016/j.buildenv.2020.107305
- I. Elzeyadi and A. Batool, Learning from the Vernacular: The Impacts of Massive Perforated Screen Shades on Building Energy Savings and Thermal Comfort in Two Different Hot Climate Zones, in: Proceedings of the ASHRAE Winter Conference Proceedings, Chicago, Illinois, United States, 20-24 January 2018, pp. 261-268.
- M. Talaei and H. Sangin, Multi-objective optimization of energy and daylight performance for school envelopes in desert, semi-arid, and mediterranean climates of Iran, Building and Environment, 255 (2024) 111424. https://doi.org/10.1016/j.buildenv.2024.111424
- Y. Tan, J. Peng, Y. Luo, J. Gao, Z. Luo, M. Wang, and D. Curcija, Parametric study of venetian blinds for energy performance evaluation and classification in residential buildings, Energy, 239(D) (2022) 122266. https://doi.org/10.1016/j.energy.2021.122266
- H. Huo, W. Xu, A. Li, J. Chu, and Y. Lv, Sensitivity analysis and prediction of shading effect of external Venetian blind for nearly zero-energy buildings in China, Journal of Building Engineering, 41 (2021) 102401. https://doi.org/10.1016/j.jobe.2021.102401
- I. Elzeyadi and A. Batool, Veiled Facades: Impacts of Patterned-Mass Shades on Building Energy Savings, Daylighting Autonomy, and Glare Management in Three Different Climate Zones, in: Proceedings of the International Building Performance Simulation Association Conference, San Francisco, USA, 7-9 August 2017, pp. 2651 - 2660. https://doi.org/10.26868/25222708.2017.772
- A. Mahmoud and Y. Elghazi, Parametric-based designs for kinetic facades to optimize daylight performance: Comparing rotation and translation kinetic motion for hexagonal facade patterns, Solar Energy, 126 (2016) 111-127. https://doi.org/10.1016/j.solener.2015.12.039
- E. Aljofi, The potentiality of reflected sunlight through Rawshan screens, in: Proceedings of the International Conference Passive and Low Energy Cooling for the Built Environment. Santorini, Greece, 19-21 May 2005, pp. 817-822.
- A. Wagdy and F. Fathy, A parametric approach for achieving optimum daylighting performance through solar Screens in desert Climates, Journal of Building Engineering, 3 (2015) 155-170. https://doi.org/10.1016/j.jobe.2015.07.007
- A. Heidari, M. Taghipour, and Z. Yarmahmoodi, The Effect of Fixed External Shading Devices on Daylighting and Thermal Comfort in Residential Building, Journal of Daylighting, 8(2) (2021) 165-180. https://doi.org/10.15627/jd.2021.15
- T. Srisamranrungruang and K. Hiyama, Correlations between building performances and design parameters of double-skin facade utilizing perforated screen, Japan Architectural Review, 4(3) (2021) 533-544. https://doi.org/10.1002/2475-8876.12222
- R. Gutiérrez, J. Du, N. Ferreira, A. Ferrero, and S. Sharples, Daylight control and performance in office buildings using a novel ceramic louvre system, Building and Environment, 151 (2019) 54-74. https://doi.org/10.1016/j.buildenv.2019.01.030
- F. Nicoletti, C. Carpino, M. Cucumo, and A. Arcuri, The Control of Venetian Blinds: A Solution for Reduction of Energy Consumption Preserving Visual Comfort, Energies, 13(7) (2020) 1731. https://doi.org/10.3390/en13071731
- A. Eltaweel and Y. Su, Controlling venetian blinds based on parametric design; via implementing Grasshopper's plugins: a case study of an office building in Cairo, Energy and Buildings, 139 (2017) 31-43. https://doi.org/10.1016/j.enbuild.2016.12.075
- A. Eltaweel, M. Mandour, Q. Lv, and Y. Su, Daylight Distribution Improvement Using Automated Prismatic Louvre, Journal of Daylighting, 7(1) (2020) 84-92. https://doi.org/10.15627/jd.2020.7
- K. Konis and E. Lee, Measured daylighting potential of a static optical louver system under real sun and sky conditions, Building and Environment, 92 (2015) 347-359. https://doi.org/10.1016/j.buildenv.2015.04.024
- E. Ahmed, Utilizing dynamic shading system to achieve daylight performance according to LEED standards V.4: case study, university classrooms in Egypt, HBRC Journal, 17(1) (2021) 177-200. https://doi.org/10.1080/16874048.2021.1920138
- J. Xie and A. Sawyer, Simulation-assisted data-driven method for glare control with automated shading systems in office buildings, Building and Environment, 196 (2021) 107801. https://doi.org/10.1016/j.buildenv.2021.107801
- F. Oghazian, K. Daneshjoo, and M. Mahdavinejad, The role of geometry and non-uniform distribution of openings in daylighting performance of solar screens, in: Proceedings of the PLEA 2017 Conference, Edinburgh, Scotland, 3-5 July 2017, pp. 3332-3339.
- A. El-Bahrawy, Optimizing the Perforation Ratio of Mosques' Solar Screen by Using Genetic Algorithms: A Case Study on El-Farouq Mosque, Cairo, Egypt, Fayoum University Journal of Engineering, 8(1) (2025) 48-67. https://doi.org/10.21608/fuje.2024.294258.1080
- A. Maksoud, E. Mushtaha, Z. Al-Sadoon, H. Sahall and A. Toutou, Design of Islamic Parametric Elevation for Interior, Enclosed Corridors to Optimize Daylighting and Solar Radiation Exposure in a Desert Climate: A Case Study of the University of Sharjah, UAE, Buildings, 12(2) (2022) 161. https://doi.org/10.3390/buildings12020161
- S. Heidarzadeh, M. Mahdavinejad, and F. Habib, External shading and its effect on the energy efficiency of Tehran's office buildings, Environmental Progress & Sustainable Energy, 24(6) (2023) e14185. https://doi.org/10.1002/ep.14185
- M. Kottek, J. Grieser, C. Beck, B. Rudolf, and F. Rubel, World Map of the Köppen-Geiger climate classification updated, Meteorologische Zeitschrift, 15(3) (2006) 259-263. https://doi.org/10.1127/0941-2948/2006/0130
- Climate Change Knowledge Portal (n.d.). Current Climate, Climatology, Country: Egypt. www.climateknowledgeportal.worldbank.org/country/egypt/climate-data-historical (27/2/2025).
- A. Aksamija, and D. Brown, Integration of Parametric Design Methods and Building Performance Simulations for High-Performance Buildings: Methods and Tools, Perkins+Will Research Journal, 10.01 (2018) 28-53.
- Ladybug Tools, Honeybee, www.ladybug.tools/honeybee.html (19-12-2024).
- Ladybug Tools, Ladybug, www.ladybug.tools/ladybug.html (19-12-2024).
- C. Cubukcuoglu, B. Ekici, M. Tasgetiren, and S. Sariyildiz, OPTIMUS: Self-Adaptive Differential Evolution with Ensemble of Mutation Strategies for Grasshopper Algorithmic Modeling, Algorithms, 12(7) (2019) 141. https://doi.org/10.3390/a12070141
- M. Souza and R. Pauletti, Parametric Design and Optimization of Shell Structures Using the Natural Force Density Method, in: Proceedings of the IASS Annual Symposium, Tokyo, Japan, 26-30 September 2016, pp. 1- 9.
- B. Masanovic, F. Arifi and J. Gardasevic, Relationship Between Sitting Height Measurements and Standing Height: A Prospective Regional Study among Adolescents in the Southern Region of Kosovo, International Journal of Morphology, 38(6) (2020) 1681-1685. https://doi.org/10.4067/S0717-95022020000601681
- Ladybug Tools, EPW Map, www.ladybug.tools/epwmap/ (16/8/2024).
Copyright © 2025 The Author(s). Published by solarlits.com.

3030
Total views
Citations
SHARE ON


