Volume 12 Issue 1 pp. 190-214 • doi: 10.15627/jd.2025.11
Assessing the Indoor Thermal Comfort and Adaptive Behaviours of Older People in the Residences of Warm and Humid Climate, India
Niveditha Sudarsanam,a,b,∗ D. Kannammaa
Author affiliations
a Department of Architecture, National Institute of Technology, Tiruchirappalli, Tamil Nadu, India
b School of Architecture (V-SPARC), Vellore Institute of Technology, Vellore, Tamil Nadu, India
*Corresponding author.
niveditha.s@vit.ac.in (N. Sudarsanam)
401119051@nitt.edu (D. Kannamma)
History: Received 15 October 2024 | Revised 10 March 2025 | Accepted 1 April 2025 | Published online 4 May 2025
Copyright: © 2025 The Author(s). Published by solarlits.com. This is an open access article under the CC BY license (http://creativecommons.org/licenses/by/4.0/).
Citation: Niveditha Sudarsanam, D. Kannamma, Assessing the Indoor Thermal Comfort and Adaptive Behaviours of Older People in the Residences of Warm and Humid Climate, India, Journal of Daylighting 12 (2025) 190-214. https://dx.doi.org/10.15627/jd.2025.11
Figures and tables
Abstract
Population aging, extreme weather conditions, and rising energy costs present significant challenges, especially in developing Asian countries like India. A key sustainability goal for future age-friendly cities is to ensure that older adults live in housing tailored to their specific needs. However, existing thermal comfort studies in India often treat the adult population as homogeneous, overlooking the unique thermal comfort requirements of the older people. This study addresses this gap by examining seasonal variations in indoor thermal comfort and associated behavioural adjustments among older adults in their residences of warm and humid climate of India. Data were collected from 1,480 respondents through a longitudinal survey and simultaneous measurements of indoor environmental variables. Linear regression analysis revealed that comfort temperatures (TSV ±1) for the older people are 30°C in summer, 28.1°C in winter, and 29.2°C overall. The steeper slope of the summer regression indicates that even minor increases in indoor temperature significantly affect thermal sensations, highlighting the difficulties older adults face in warmer months. At a prevailing mean outdoor temperature (PMOT) of 25°C, the comfort band for older individuals ranges from 26°C to 31°C. Under ASHRAE 55-2020 conditions (TSV ±0.5), the comfort range is 26.9°C to 29.7°C. Notably, the comfort range for older individuals in this study is narrower compared to IMAC R, IMAC NV, and ASHRAE 55-2020 models, with a regression slope of 0.56 indicating heightened sensitivity to temperature variations. Additionally, relative importance index analysis shows that older males favour active cooling measures in summer, such as wearing lighter clothing and seeking airy spaces, while females prioritize modifying daily routines. In winter, both genders adopt warming strategies, with males emphasizing hot showers and females choosing heavier clothing.
Keywords
Thermal comfort, Adaptive behaviour, Environmental controls, Warm and humid climate
Nomenclature
| ASHRAE | American Society of Heating, Refrigerating and Air Conditioning Engineers |
| IMAC NV | Indian Model for Adaptive Comfort for Naturally ventilated spaces |
| IMAC R | Indian Model for Adaptive Comfort for Residences |
| IQR | Inter Quartile Range |
| NBC | National Building Code |
| PMV | Predicted Mean Vote |
| PMOT | Prevailing Mean Outdoor Temperature |
| RCC | Reinforced Cement Concrete |
| RII | Relative Important Index |
| SD | Standard Deviation |
| SE | Standard Error |
| TSV | Thermal Sensation Vote |
| TSVE | Thermal Sensation Vote of older adults |
| TPV | Thermal Preference Vote |
| TA | Thermal Acceptability |
| WHO | World Health Organization |
| clo/ Icl | Clothing Insulation |
| PMOT30 | 30 days of prevailing mean outdoor temperature |
| Ta | Air temperature |
| Tg | Globe temperature |
| Tneu/Tcomf | Comfort temperature |
| Tmrt | Mean radiant temperature |
| Top | Operative temperature |
| Va | Air Velocity |
1. Introduction
1.1. Background
Aging, once perceived as an emerging concern, has now become a pressing reality [1,2] as the world undergoes one of the most profound demographic shifts in human history—the rapid aging of the global population [3]. Currently, approximately 600 million people worldwide are aged 60 and above, a number expected to quadruple by 2050 [4]. This demographic shift is particularly pronounced in Asian countries, which host nearly 70% of the global older adults population [5]. Among these nations, India stands out due to the unprecedented rate at which its older population is expanding [6]. With 140 million individuals aged 60 and above, India has the world’s second-largest older people population, trailing only China’s 250 million [4]. The annual growth rate of India’s older people population is nearly three times higher than that of the overall population [7], underscoring the need for policymakers, researchers, and urban planners to prioritize the health, well-being, and productivity of older adults [8].
In this context, providing medical, social, economic, and physical support to the older people has become increasingly complex, especially for those who are homebound or have multiple comorbid conditions [9]. The older people’s interaction with their living environment is a crucial determinant of healthy aging. Given that older individuals spend 80% to 90% of their time in residential settings [10,11], the quality of the indoor environment significantly influences their physical and mental well-being. According to the World Health Organisation (WHO), climate-related diseases result in over 150,000 deaths each year, with older people, children, and the socially isolated being the most vulnerable [12]. Prior studies have shown that extreme temperature events, whether hot or cold, are associated with increased mortality rates among the older adults [13]. The older people are particularly susceptible to such temperature fluctuations due to physiological changes associated with aging [14].
Physiological aging is often accompanied by health issues, mobility challenges, weakened sensory systems, and other changes, such as decreased cardiac output, reduced perspiration ability, lower muscle mass, diminished thermal sensitivity, and an increased percentage of body fat [15,16]. These factors make it more difficult for older individuals to maintain thermal equilibrium and adequately respond to temperature variations [17]. Older people perception of the built environment is likely to differ from that of younger, healthier individuals, as they may experience a delay in perceiving and responding to temperature changes [13,18]. This insensitivity to thermal environments can lead to heat-related illnesses and, in extreme cases, even mortality. Consequently, there is a growing need for studies focused on the indoor thermal environment of older people, particularly in Asian countries like India, where climatic conditions and socio-cultural contexts differ significantly from those in Western nations [8].
1.2. Aging and thermal comfort: a physiological perspective
Thermal comfort is defined as a state of mind in which an individual expresses satisfaction with the surrounding thermal environment [19]. It is influenced by the characteristics of the environment that affect heat exchange between the human body and its surroundings. Typically, thermal comfort is assessed based on parameters such as air temperature, relative humidity, air velocity, and mean radiant temperature [20]. The human body maintains thermal equilibrium through physiological mechanisms like sweating, shivering, and blood flow regulation [21]. However, these mechanisms become less efficient with age, making it increasingly challenging for older individuals to regulate their core body temperature in response to changing environmental conditions [13].
Given the heightened vulnerability of older adults to extreme thermal conditions, adaptive thermal comfort models are particularly relevant for this group, as they are more susceptible to the impacts of climate change [22]. The older people often have a distinct thermal perception compared to younger adults due to factors such as frailty, existing health issues, and a diminished ability to regulate body temperature [23,24]. Their thermal comfort is influenced by a broader range of variables, including behaviour, activity levels, economic status, physiological regulation, and metabolic rate, among others [23,25,26]. Although numerous models and standards have been developed for predicting and assessing thermal comfort, they predominantly cater to the general population, primarily involving younger and healthier individuals. These models overlook the distinct physical and mental health conditions of older adults, thereby creating a gap in comprehensive guidelines and standards specifically tailored to address the unique thermal comfort needs of the older individuals [27,28].
Field studies indicate that current regulations may not be fully applicable to older people, prompting researchers worldwide to examine the thermal comfort of the older adults in various contexts and climatic conditions [29]. For instance, Barquero et al. [14] noted that older adults have a reduced capacity to regulate and perceive changes in body temperature, while Forcada et al. [30] found that older residents in Mediterranean environments exhibited higher comfort levels than their caretakers. The vulnerability of older adults to extreme environmental events is further exemplified by the excess mortality rates observed during the heat waves of 1995 in Chicago [31], 2003 in England [32], and 2003 in France [33].
Several studies have explored how thermal perception and adaptability differ between older and younger adults. Schellen et al. [24] compared these factors across two age groups—individuals aged 22 to 25 and 67 to 73. Their findings revealed that older adults reported thermal sensations that were 0.5 scale units lower than younger participants. When exposed to a stable indoor temperature of 21.5°C, older adults preferred a warmer environment, while younger individuals did not indicate a need for adjustments. Similarly, Mendes et al. [34] conducted a study at a Portuguese aged care centre in a naturally ventilated room. They found that 42% of the older participants were dissatisfied with winter indoor conditions, describing them as "slightly cool," whereas only 8% reported discomfort during summer. In another study by Jiang et al. [35] conducted in Japanese nursing homes, it was observed that even when predicted mean vote (PMV) values exceeded typical comfort thresholds, older residents reported feeling "neutral." Meanwhile, Wang et al. [36] conducted a year-long environmental survey involving 10 older individuals in Beijing, finding that their comfortable temperature range during summer fell between 26°C and 30°C. In another study, Tartarini et al. [37] examined thermal perception and adaptive behaviours among older adults across five retirement facilities. They identified a neutral temperature of 22.9°C for these residents during summer, with the comfort range spanning from 20.0°C to 26.2°C.
In summary, numerous studies from different countries have explored the thermal comfort and indoor environmental conditions of older adults in various settings, including residential homes, nursing facilities, and other living arrangements. However, the findings remain inconclusive. While some researchers [38-40] suggest that there are no significant differences in thermal perception between younger and older individuals, others [24,34,41,42] report clear disparities. Similarly, there is conflicting evidence regarding the comfort temperature ranges, with some studies indicating that older adults have a broader comfort band [30,42,43], while others [44,45] argue that their comfort range is narrower compared to younger individuals. These inconsistencies in the existing literature highlight the need for further research on the thermal comfort of older adults, particularly in a diverse country like India, where variations in climate, culture, and social practices significantly influence comfort perception and adaptation [38,46].
1.3. State-of-art of older people in India
Population aging in India is inevitable, and the nation is currently ill-prepared to address the expanding and evolving needs of its older adult population [8]. The underlying demographic shifts indicate that the proportion of the older population in India is expected to rise considerably, increasing from 10.1 percent in 2021 to 15 percent by 2036 [6] at the national level (Fig. 1). This growth will lead to an older population of over 320 million, almost equivalent to the current population of the United States [8]. While research on the thermal comfort needs of the older people has been conducted internationally since the 1870s, studies focused on the Indian context are scarce.
Figure 1
Fig. 1. Decadal growth (%) of older population from 1961-2031. (Source: Census of India 2011, Ministry of Home Affairs, Government of India).
India, with its vast cultural diversity, has also seen changes in living arrangements over time. Traditionally, multi-generational living was the norm, and the joint family system ensured that the older individuals were cared for within the family unit [47]. However, increasing urbanization and migration for career opportunities have led to a rise in nuclear family structures [8]. As young adults move to different cities or even abroad, older parents are often left behind [48], highlighting a growing need for independent thermal comfort assessments for the older population. Despite this shift, most thermal comfort studies conducted overall tend to treat adults as a homogeneous group, overlooking the fact that the older people may have distinct thermal comfort demands and perceptions [49]. Inadequate indoor thermal conditions that fail to meet the physiological needs of older adults can result in discomfort, negative health effects, and higher energy consumption [14]. Therefore, it is essential to account for the distinct cognitive and physiological traits of older individuals when designing and regulating indoor thermal environments [5,50].
Current thermal comfort studies in Indian residential buildings primarily focus on understanding how climatic diversity, building design, indoor environmental conditions, occupant behaviour, and socioeconomic factors influence residents’ comfort [51]. Researchers [46,52,53] have explored the influence of regional and seasonal climatic variations on thermal perception and adaptive behaviour, emphasizing the need for region-specific comfort models. The role of building design elements such as orientation, shading, insulation, and construction materials is also assessed for their impact on indoor thermal conditions, along with the effectiveness of traditional versus modern construction practices. Additionally, occupant behaviour [54,55], including clothing adjustments, fan usage, and window operations, is studied to understand how people adapt to varying thermal conditions [56].
However, few studies in India have explicitly investigated the impact of age on thermal comfort in residential buildings. Thapa et al. [57] observed that clothing insulation among younger subjects (mean 0.85 clo) was significantly lower than that of senior-aged subjects. Consequently, comfort temperatures for younger subjects (mean 20.4 °C) were significantly higher compared to mid-aged subjects (mean 17.5 °C) and senior subjects (16.7 °C). This difference was attributed to the lower clothing insulation of younger subjects. Indraganti and Rao [38] also reported that older Indian subjects exhibited lower thermal sensation and higher thermal acceptance compared to younger adults. In contrast, Singh and Chani [58] found no significant difference in neutral temperatures between middle-aged (26.6 °C) and older subjects (26.4 °C). Despite these insights, a comprehensive understanding of aging-specific thermal comfort needs is still lacking. There is a pressing need for targeted research to address the unique thermal comfort requirements of this vulnerable group, particularly in Indian residential settings.
1.4. Research scope, aim and objectives
The World Health Organization (WHO) advocates for adapting the existing housing stock to meet the evolving needs and demands resulting from the global aging population [10]. Among the various factors, thermal comfort is a crucial aspect of a healthy indoor environment, as it significantly influences the well-being and productivity of older adults [59,60]. This is particularly relevant in India, where the diverse climatic conditions, ranging from hot and dry to warm and humid, make the older population more susceptible to thermal discomfort and its associated health risks, such as heat stress and hypothermia [8,11,61].
In an earlier study [62], the authors analysed the thermal comfort of older adults specifically during the summer months. To gain a more comprehensive understanding, this paper extends the analysis to cover both summer and winter seasons, providing a holistic view of thermal comfort for older individuals living in warm and humid climates in India. The primary objective of this paper is to determine the thermal comfort ranges for older residents throughout the year and to identify the adaptive strategies they employ to maintain a comfortable indoor environment. This research aims to fill a critical gap by presenting seasonal thermal comfort variations and associated behavioural adjustments that are unique to older adults in these climatic conditions.
2. Methodology
This work is a part of a more extensive study focussing on the indoor thermal comfort conditions in the residential settings of the older population. In our recent work, Sudarsanam and Kannamma [62] investigated the indoor thermal environment of older people in the summers of warm and humid climate, India. This work represents the second part of the study, delving into a detailed discussion of indoor thermal environment and the adaptive behaviours of older people in their residences in both summer and winter of warm and humid climate, India. The current study involved measurement of indoor and outdoor environmental variables, monitoring of older adults’ behavioural actions and a questionnaire survey to evaluate the subjective responses. Indoor and outdoor environmental variables were measured during the subject’s active time and the subjective responses were collected simultaneously. This investigation was conducted in five residential buildings with 10 older occupants, accumulating 1480 responses over a five-month period. A comprehensive explanation of the methodology is presented in the subsequent sections and shown in the Fig. 2.
2.1. Study location, climate and building description
The study was conducted in individual residences of older individuals in Salem city (11.65° N, 78.16° E), located in the state of Tamil Nadu, India (Fig. 3). Salem falls within a warm and humid climate zone as defined by the National Building Code (NBC-2016) [63] and is categorized under the tropical wet and dry or savanna climate (Aw) according to the Köppen climate classification [64]. A summary of the weather data for Salem city is presented in the Fig. 4. The city experiences its peak outdoor temperatures from March to May, and the lowest temperatures during December and January. The highest temperature recorded in May is 37.8°C, whereas the lowest temperature in January is 18.3°C. The average relative humidity during January and May is 77% and 65%, respectively. From December through June, the mean outdoor wind speed varies between 1.4 m/s and 2 m/s. To encompass the full range of climatic variations, the field study was conducted over 74 days during the months of December to February (winter) and May to June (summer).
Figure 3
Fig. 3. Map showing the geographical location of Salem city in India and investigated residential buildings.
Figure 4
Fig. 4. Weather data summary of Salem city: Air temperature (mean), Relative humidity mean (%), Average air speed. (Source: www.meteoblue.com).
The field survey was conducted in the residences of older individuals during both summer and winter months. These residences were selected based on their location within a warm and humid climate zone, the similarity in living arrangements (older couples living with a spouse), and the presence of a naturally ventilated environment. The houses exhibit comparable design features, allowing for a consistent analysis across different households. The selected houses include a mix of single-story and multi-story structures. Houses 1 and 2 are single-story dwellings comprising a lounge, dining space, kitchen, two bedrooms, and a partially open porch. Houses 3 and 4 are two-story residences, with the ground floor containing a lounge, dining area, kitchen, two bedrooms, and a semi-open porch, while the upper floor includes a secondary sitting area, an extra bedroom, and a balcony. House 5 is a first-floor unit that features a lounge, dining area, kitchen, and two bedrooms linked by an internal corridor. All five houses share similar construction attributes, including plastered brick walls without insulation and flat roofs made of reinforced cement concrete (RCC). The consistent architectural and construction features across the selected houses provide a reliable basis for comparing thermal comfort and adaptive strategies employed by older occupants in a warm and humid climatic setting. (refer Fig. 5).
2.2. Characteristics of survey respondents
A total of 1,480 responses were collected, comprising 740 responses each from male and female older individuals. The sample consisted of ten older participants (five males and five females) residing in five separate households. All participants were above 60 years of age, categorizing them as older adults. The basic demographic details of each participant (e.g., age, height, weight, and BMI) are presented concisely in Table 1. All older couples have been acclimatized to the local climate for at least three years and were considered healthy based on Rockwood et al.'s Frailty Scale [65]. The Rockwood Frailty Scale includes seven categories: very fit (1), well (2), well with treated diseases (3), apparently vulnerable (4), mildly frail (5), moderately frail (6), and severely frail (7). As part of the questionnaire survey, the participants were asked to self-assess their health status. Older individuals who rated their frailty status between 1 (very fit) to 4 (apparently vulnerable) were considered healthy and included in this study. All occupants lived solely with their spouses, without the presence of children or other relatives. During the survey, the average clothing insulation values for female participants were found to be 0.85 clo in summer and 0.95 clo in winter, while for male participants, the average values were 0.45 clo in summer and 0.7 clo in winter, respectively. These clothing values indicate seasonal variations in thermal insulation due to adaptive clothing choices made by the older people to maintain comfort in varying indoor thermal environments.
2.3. Field measurements and survey
The measuring instruments were positioned 1.2 meters away from the occupants, with measurements starting after a 20-minutes stabilization period, upon obtaining the occupants’ consent (refer Fig. 5). Indoor climatic parameters were measured simultaneously as the occupants responded to the questionnaires. The measurements were recorded at a height of 1.1 meters from the floor, in compliance with the Class-II protocol of ASHRAE Standard 55 [20]. A Heat Stress WBGT meter was used to measure air temperature, globe temperature, and relative humidity, while air velocity was recorded using a Bluetooth Hot Wire Anemometer. Table 2 summarizes the instruments used in the study to monitor indoor environmental parameters. Simultaneously, personal variables such as clothing insulation and metabolic activity were recorded. Outdoor climatic data for Salem District during the study period were obtained from the Meteoblue database [66] (www.meteoblue.com), which has been widely used in thermal comfort studies in India [67]. The measured indoor and outdoor environmental parameters for each house in both the seasons are presented in Tables 3 and 4.
The field surveys were conducted twice daily, from 7:30 AM to 10:00 PM, without disrupting the participants’ daily routines. Night-time surveys (after 10:00 PM) were not performed due to privacy and access constraints. All surveys took place in the living rooms of the older participants' residences in a one-on-one format (author and occupant), adhering to COVID-19 protocols. Prior to the surveys, all older participants were briefed about the topic, content, and nature of the questionnaire. On the first day, participants provided anthropometric data (e.g., age, gender, height, and weight), educational qualifications, frailty test results, and information about house characteristics, daily routines, and habits related to overcoming thermal discomfort. With the participants' consent, the surveys were conducted twice daily, accompanied by field monitoring of indoor environmental conditions. The author documented the occupants’ adaptive and personal control actions during each survey. Participants were asked to sit and rest for 15 minutes indoors (in the living area) before completing the survey.
The questionnaire, designed in both English and the regional language (Tamil) with an increased font size (16) to enhance readability for the older adults, was developed based on outcomes from the pilot study. While some participants completed the questionnaire independently, others provided verbal responses, which the author documented simultaneously.
The "right-here, right-now" questionnaire collected sensation and preference ratings for indoor temperature, relative humidity, and air velocity during each visit. Sensation ratings were recorded using the ASHRAE 7-point scale, accompanied by graphical representations, while preference ratings were measured using the 5-point Nicol’s scale. Overall thermal satisfaction was evaluated on a 5-point scale, where 1 indicated "satisfied" and 5 indicated "dissatisfied." The thermal acceptance of the indoor environment was assessed using the ASHRAE 2-point scale (1 = Yes, 2 = No). Table 5 provides the scales used for assessing environmental sensations, preferences, acceptance and overall thermal satisfaction.
2.4. Calculation of environmental and personal parameters
To evaluate the indoor environmental conditions of the older people, the various environmental parameters such as air temperature, globe temperature, relative humidity and air velocity was measured. By using these parameters, mean radiant temperature was calculated by using the following Eq. (1) as defined in ASHRAE 55-2016 [20].
where, Tmrt, Ta and Tg is the mean radiant temperature, air temperature and globe temperature respectively. and D (0.05m) refer to the emissivity of the black surface and diameter of the globe used in the study.
The indoor environmental conditions are represented by the indoor operative temperature (Top) in most of the thermal comfort studies [14,22,28] which is using in the current study as well by using the following Eq. (2).
where Top, Tmrt, and Ta are operative temperature, mean radiant temperature and air temperature, respectively. The aforementioned formula is applicable to occupants who are not directly exposed to sunlight but experience air velocities (Va) exceeding 0.20 m/s and engage in near sedentary activities with metabolic rates ranging between 1.0 and 1.4 met. The present study was conducted in a naturally ventilated setting, where occupants employed adaptive behaviours, such as opening windows and using ceiling fans, to increase airflow and achieve thermal comfort.
Further, the prevailing mean outdoor air temperature (PMOT) was calculated by the arithmetic mean of daily mean outdoor air temperatures of all the past 30 days.
The comfort temperature (Tneu) was calculated using Griffith’s method (Eq. (3)) as followed by the previous researchers [67-69].
where Tneu is called Griffith’s neutral temperature, Top is indoor operative temperature, TSV is the thermal sensation vote and R is called the Griffith’s constant. Nicol and Humphreys [71] recommend using the regression coefficient greater than 0.40. Thus, previous studies [38,67-69] have used the value of Griffiths’ constant as 0.50, which has also been used in this study.
The elementary factors influencing thermal comfort include both environmental factors (air temperature, mean radiant temperature, air speed and relative humidity) and personal factors (clothing insulation and metabolic rate). In an adaptive thermal environment, clothing not only affects thermal comfort but also serves as a means to regulate it. In this study, a detailed checklist was used to document the garments worn by each occupant at the time of the survey. The clothing insulation values (Clo) were primarily derived from the ASHRAE 55-2020 standard [19]. For certain traditional Indian garments, such as saris and dhotis, the Clo values were calculated using the following Eq. (4) provided by Hanada et al. [72].
where Icl is the clothing insulation in Clo, and W is the weight of the garment in grams. The Clo value for Indian saris was referenced from the studies by Indraganti et al. [73], and an additional 0.15 Clo was added for the petticoat, which is worn along with the sari. For the traditional male attire (dhoti), a clothing insulation value of 0.19 Clo was calculated as follows (Eq. 5):
Additionally, 0.04 Clo was added for undergarments for all participants. An upholstery insulation value of 0.15 Clo was further incorporated whenever the occupants were seated on chairs, but not when seated on the floor.
Metabolic rates (1 met = 58.2 W/m²) corresponding to the activities reported by the occupants 15 minutes prior to completing the survey were selected from the checklist provided in the ASHRAE 55-2020 standard. In this study, the metabolic rate of participants ranged from 0.7 met (for lying down) to 1.7 met (for moving around).
2.5. Data management and analysis
The original data collected from the field surveys were entered and organized into data files using Microsoft Excel, with the identities of the participants replaced by subject codes to ensure confidentiality. Data analysis was then conducted using a range of statistical software packages, including IBM SPSS (version 26), Tableau (version 2022.3), JASP, and Jamovi. Various statistical methods were employed, each fulfilling a specific analytical purpose. Descriptive statistics—such as percentages, mean, maximum, and minimum values—were utilized to provide an overview of the data distribution. Cronbach’s Alpha (α) was calculated to assess the internal consistency of the thermal comfort questionnaire items, yielding a high reliability coefficient of α = 0.74. Linear regression analysis was conducted to examine the relationship between subjective perceptions and environmental parameters, with the goal of establishing the thermal comfort band specifically for older adults living in warm and humid climates. The level of statistical significance was set at 0.05. The R² value was used to assess the goodness-of-fit for the linear models, with values closer to 1 indicating a better fit. Further, Ordinal regression analysis, using probit as the link function and operative temperature as the covariate, was conducted to estimate the thermal comfort zone of the surveyed participants. Outliers were carefully removed before conducting regression analysis, ensuring that the integrity of the variables involved was maintained. To rank the environmental and behavioural control actions taken by the older people across different seasons, the Relative Importance Index (RII) was employed which was used widely in previous studies [74].
3. Results
3.1. Analysis of thermal sensation, preferences and overall acceptability
Thermal sensation votes represent the subjective feeling of warmth or coolness than individuals experience in their thermal environment. The ASHRAE seven- point thermal sensation scale of -3 (cold) to +3 (hot) is chosen in this study. Figure 6 illustrates the percentage distribution of thermal sensation votes collected from older individuals in their residences during both summer and winter seasons. It is observed that the highest percentage of votes for both seasons falls within the “Neutral” sensation (37.7% in summer and 40% in winter), reflecting a significant portion of the older population perceiving their thermal environment as neither too hot nor too cold. However, during summer, more than half (51.2%) of the votes skewed towards hotter sensations (combining +1, +2 and +3), indicating a possible thermal discomfort due to higher temperatures. In contrast, during winter, while 40% of the votes remained in the “Neutral” category, a slightly higher proportion (43.2%) leaned on the cooler side (-1, -2 and -3) of the scale indicated a noticeable shift towards cooler sensations, with many older people feeling colder during winters.
Further, the thermal sensation of older individuals was also analysed by gender across both seasons as shown in Fig. 7. During the summer, both genders predominantly reported a “Neutral” sensation, with a slightly higher percentage of males (20.3%) compared to females (17.4%). However, females (28.4%) were more inclined to vote on the warmer end of the scale (+1, +2, and +3) than their male counterparts (22.8%). In contrast, a notable shift was observed in winter, where a larger proportion of female participants (24.8%) reported a “Neutral” sensation compared to males (15.2%). Additionally, a significant percentage of males (26%) registered votes on the cooler side of the scale, surpassing the percentage of females (17.2%). These findings revealed that female older occupants tend to be more sensitive to heat, whereas male occupants are more sensitive to cooler environment.
The preference of thermal environment votes was collected by using Nicol’s scale, that is -2 (much cooler), -1 (a bit cooler), 0 (No change), 1 (a bit warmer) and 2 (much warmer), respectively. Figure 8 demonstrates the percentage distribution of thermal preference votes (TPV) of older individuals with respective to its thermal sensation votes (TSV) for both summer and winter seasons. In the summer, those who felt "Cool" or "Slightly Cool" mostly preferred no change, with 100% and 83% of the votes, respectively, expressing satisfaction with their current thermal environment. As the thermal sensation moved towards "Neutral," a noticeable shift occurred, with 50% preferring cooler conditions. This preference for cooler environments became even more pronounced among those who felt "Slightly Warm," "Warm," or "Hot," where 87%, 93%, and 95% of the respondents, respectively, preferred cooler conditions. This indicates that the majority of older individuals experience discomfort with warmer temperatures in the summer and desire cooler conditions to enhance their comfort.
Conversely, in the winter season, a significant preference for warmer conditions is observed among those who felt "Cold" or "Cool," with 100% and 70% of the participants, respectively, indicating a desire for warmth. As the thermal sensation moved towards "Neutral," 86% preferred no change, showing comfort in moderate temperatures. However, as the sensation of warmth increased to "Slightly Warm" and "Warm," there was a noticeable shift, with 46% and 51% of the respondents, respectively, preferring cooler conditions, suggesting that overly warm environments could lead to discomfort even during the winter. Thus, in outline, the older population's thermal preferences exhibited a seasonal variation, with a predominant preference for cooler environments during the summers and warmer environments in the winters.
The acceptance of the indoor thermal environment of the older people were measured by using ASHRAE 2- point scale of 1 represents “Acceptable” and 2 represents “Not acceptable” respectively. Figure 9 shows the percentage distribution of Thermal acceptability (TA) votes in relation to thermal sensation votes (TSV) among older individuals revealed significant seasonal variations. Older individuals generally found cooler conditions more acceptable. The acceptability of the thermal environment was highest when individuals felt “Cool” or “Slightly cool”, with nearly 100% acceptability. However, as sensations shifted towards neutral and warmer conditions, the acceptability dropped dramatically, with 10% of older occupants found “hot” sensation as acceptable. Thus, the findings clearly indicate a strong preference for cooler indoor environments during summer, with significant discomfort experiences as temperature increases. Interestingly, in winters, it is observed that significant majority older people found their indoor thermal environment to be acceptable across various thermal sensations. Specifically, even at the extreme of the "Cold" sensation, 70% of the respondents still considered the environment acceptable. This acceptability increased notably in the "Cool" and "Slightly Cool" categories, with 91% and 95% acceptance, respectively. The highest level of acceptability was observed in the "Neutral" sensation, where 98% of respondents found the conditions satisfactory. As the sensation moved towards "Slightly Warm" and "Warm," acceptability slightly decreased to 92% and 82%, respectively. Despite this decline, the majority still perceived the conditions as acceptable, demonstrating that during the winter season, older individuals generally tolerated a range of thermal environments with a high level of acceptance.
The overall thermal satisfaction (satisfied, slightly satisfied, neither satisfied nor dissatisfied, slightly dissatisfied and dissatisfied) of the older individuals across both the seasons were plotted in the Fig. 10. It is evident that during winters, a higher proportion of respondents reported “satisfied” (25%) or “slightly satisfied” (35.2%), totalling 60.2% who were generally content with their thermal environment. Only a small fraction (15.3%) reported being "Slightly dissatisfied," and an even smaller percentage (0.7%) were "Dissatisfied”. In contrast, during the summer season, the levels of satisfaction were notably lower. Only 18.4% of respondents were "Satisfied," and 17.2% were "Slightly satisfied," making a combined 35.6% who found the thermal environment acceptable. However, a significant portion, 38.8%, were "Slightly dissatisfied," and 10.3% were "Dissatisfied," indicating a higher level of discomfort during the warmer months. The graph also indicates that a notable proportion of older individuals fell into the "Neither satisfied nor dissatisfied" category during both seasons (23.8% in winters and 15.3% in summers), indicating the state of ambivalence towards their thermal environment. Overall, it is reflected that older individuals experienced a greater thermal discomfort in summer compared to winter, with a substantial number expressing dissatisfaction with their indoor thermal conditions during the hotter season. This disparity could be attributed to the increased ability to control environmental and behavioural factors in winter, such as taking hot showers, wearing heavier clothing, and adjusting openings. In contrast, managing excessive heat in summer, particularly in naturally ventilated indoor spaces, might pose greater challenges, leading to higher levels of discomfort and dissatisfaction.
3.2. Personal adaptive control actions of older people in both the seasons
The older participants typically dressed in traditional Indian attire, such as sarees, lungis, and vestis (see Fig. 5). Some female participants also wore nighties (maxis) as a comfortable option during peak summer. Figure 11 illustrates the various clothing styles worn by respondents during the field survey. In this study, clothing insulation for female older individuals was consistently higher across both seasons, ranging from 0.6 to 1.1 clo in summer (mean = 0.85 clo) and 0.7 to 1.1 clo in winter (mean = 0.95 clo). Conversely, male older individuals exhibited lower clothing insulation, with values ranging from 0.35 to 0.6 clo in summer (mean = 0.45 clo) and 0.5 to 0.85 clo in winter (mean = 0.7 clo), as depicted in the Fig. 11.
The box plot reveals that the interquartile range (IQR) for females was broader, indicating a higher level of thermal adaptation among females in summer, whereas males demonstrated a more concentrated range of clo values. Additionally, outliers among males with very low insulation values suggest that some male respondents opted for lighter clothing during this period. In winter, both genders increased their clothing insulation values, yet females maintained higher median values (around 0.95 clo) compared to males (approximately 0.55 clo). This trend suggests that females generally chose warmer clothing than males in both seasons. The variability among females remained high in winter, consistent with summer, while the IQR for males was slightly narrower, though still reflecting some variability. These differences may be influenced by cultural norms or societal expectations regarding appropriate attire for each gender, particularly within the female population. Similar findings have been observed in previous studies [38,46,74] conducted in the context of Indian residential buildings.
3.3. Predicting Neutral temperature and comfort ranges
3.3.1. Linear regression analysis
Thermal sensitivity and neutral temperature of the older population across both the seasons were obtained by using linear regression method by plotting indoor operative temperature (Top) against thermal sensation votes (TSV) of the older participants using 0.5֯C binned data which is shown in Fig. 12. The following Eq. (6), (7), and (8) expresses the best fitted TSV across both the seasons and for the overall dataset. The comfort temperature across both the seasons and overall was obtained by setting TSV= 0 and therefore the comfort temperatures are 30֯C, 28.1֯C and 29.2֯C for summer, winter and overall dataset respectively.
Comfort equation for summers:
Comfort equation for winters:
Comfort equation for overall dataset:
In order to find the comfort temperature range of -1 ≤ TSV ≤ +1, TSV is set at -1 and +1 and the obtained comfort ranges are 27.2֯ C to 32.2֯ C in summer, 24.6֯ C to 31.7֯ C for winter and 27.7֯ C to 30.6֯ C for the overall dataset. Therefore, it is evident from the results that the older population has a narrower comfort range when considering both seasons together, compared to individual seasonal ranges. The findings suggested that while there are seasonal differences in comfort preferences, there is a consistent preference for moderate temperatures overall. The narrower range also reflects the older people’s sensitivity to temperature variations and highlights the need to ensure thermally comfortable indoor environments throughout the year. Furthermore, the obtained comfort temperature range is narrower than younger people comfort studies [75-78] conducted the residences of warm and humid climatic regions in India but showed good agreement with other thermal comfort studies [28,45] for older people at residences which is discussed further in discussion section.
According to ASHRAE 55-2020, when a higher standard of thermal comfort is required, especially for sensitive age groups like the older adults, the comfort temperature range can be refined to -0.5 ≤ TSV ≤ +0.5. Applying this criterion, the comfort temperature range was found to be 28.4°C to 29.9°C. This narrower range underscores the heightened thermal sensitivity of the older population compared to other age groups. Additionally, the steeper slope of the linear regression line during summer (0.354) as compared to winters (0. 281) indicates that even a slight increase in indoor operative temperature resulted in a more noticeable shift towards warmer thermal sensations. In winter, they might use various strategies (such as wearing warmer clothing) to maintain thermal comfort, which made them less sensitive to temperature changes. Conversely, in summer, despite potential cooling strategies, the increase in thermal discomfort with rising temperatures is more pronounced.
3.3.2. Probit analysis method
Probit analysis method is familiar and widely used in many thermal comfort studies to model and interpret the probabilistic relationship between environmental conditions and comfort responses, especially when dealing with binary or ordinal data. Rijal et al. [80], Singh et al. [81], and Kumar and Singh [52] used the probit analysis method to predict the possible thermal comfort zone of their surveyed buildings. In this study, the probit analysis method was used to estimate the possible thermal comfort zone of older occupants under Naturally ventilated residential settings across both the seasons (summer and winter). Ordinal regression was used with probit as a link function with the indoor operative temperature (Top). The probability curve was drawn by using Eq. (9).
where CDF. NORMAL is the cumulative distribution function for the normal distribution, quant is the air temperature ( ֯C) and S.D is the standard deviation. The resulting equations of the probit regression across both the seasons are shown in the Table 6.
The probit regression line equations represent the probability of a thermal sensation vote (TSV) falling within a specified range. For example, P(≤ -3) indicates the probability of voting -2 or lower, encompassing the range from 'cold' to 'cool.' The probit regression coefficients for older individuals were calculated using IBM-SPSS 26 software, yielding values of 0.396/K for summer and 0.410/K for winter. The mean temperature of the probit line is determined by dividing the y-intercept by the constant. For instance, in winter, the equation P(≤ -3) = 0.410Top - 8.314 results in a mean temperature of 8.314/0.410 = 20.27°C. The standard deviation (SD) is the inverse of the constant, calculated as 1/0.396 = 2.52 for summer and 1/0.410 = 2.43 for winter. The sigmoid curves representing the probabilities for each thermal sensation scale are illustrated in Figs. 13 and 14, with detailed equations for both seasons provided in Table 6. These curves allow for the estimation of the probability of voting at or below a specific scale point across the observed temperature range.
The results indicate that during summer, over 80% of older individuals reported feeling comfortable—voting within the central three categories (TSV = -1, 0, +1)—when the operative temperature ranged from 25.7°C to 32°C. Additionally, 90% of the population felt comfortable (according to ASHRAE-55 2020 special conditions) when the operative temperature varied between 26.9°C and 30.9°C. In winter, 80% of older individuals were comfortable within an operative temperature range of 25.4°C to 32.1°C, while 90% comfort was achieved between 26.4°C and 31°C. Overall, it is evident that older people preferred consistently warmer environments to maintain thermal comfort across both the seasons.
3.4. Adaptive thermal comfort model for naturally ventilated residential buildings of the older people
A weighted linear regression analysis was performed to explore the relationship between indoor comfort temperature (Tneu) and the 30-day prevailing mean outdoor temperature (PMOT). The indoor comfort temperature was determined using the Griffith method, employing Griffith's constant of 0.5, which is widely recognized for its broad applicability in thermal comfort field studies [53,67,68]. The PMOT was calculated as the arithmetic mean of daily mean outdoor air temperatures over the past 30 days. The regression model was weighted based on the number of votes within each temperature bin.
To determine acceptability bands, 0.85 and 0.5 sensation votes were used to establish 80% and 90% acceptability limits, respectively, following Fanger’s comfort model [82]. The linear regression equation (equation (8)) was utilized to calculate the resultant temperature difference from the neutral temperature, yielding differences of 2.5°C for the 80% acceptability limit and 1.45°C for the 90% acceptability limit. The outcomes of the linear regression analysis are presented in Eq. (10), (11), and (12). A graph (Fig. 15) was plotted by using these equations.
The graph clearly indicates that older individuals exhibit a distinct thermal comfort range, necessitating warmer indoor conditions both at lower and higher outdoor temperatures. At a PMOT (Prevailing Mean Outdoor Temperature) of 25°C, the comfort temperature for 90% acceptability among older individuals is approximately 28.25°C, whereas the 80% acceptability comfort temperature is around 27°C. As the PMOT increases to 31°C, the comfort temperature for 90% acceptability rises to approximately 32.5°C, and for 80% acceptability, it reaches around 30.5°C. This suggests that the older occupants might experience discomfort in cooler indoor environments due to physiological factors such as reduced metabolic rates and decrease in blood circulation levels.
To gain a deeper understanding, the current study was compared with prominent national and international adaptive comfort models such as IMAC R [83], IMAC NV [84] and ASHRAE 55 2020 models. The comfort models used for comparison are expressed through specific Eqs. (13), (14) & (15). The analysis revealed that the slope of the regression curve for the current study is found to be 0.56 which is notably steeper than both ASHRAE 55 (0.31) model and IMAC R (0.42) model and slightly higher than the IMAC NV (0.54) model. Furthermore, it is interesting to note that the older residents are having narrower comfort band than the IMAC R, NV and ASHRAE 55 comfort models. Overall, the results indicate that older people have a distinct preference for warmer indoor environments, which is not fully captured by existing models like IMAC NV, IMAC R, and ASHRAE 55-2020. The comfort temperature for older individuals, even at the 80% acceptability level, exceeds the recommendations of these models across various outdoor temperatures. The results further indicate that the older people are highly sensitive to outdoor environmental conditions than the younger population. This heightened sensitivity may be attributed to their reduced ability to utilize adaptive opportunities to maintain thermal comfort as frequently as the general population, due to various physiological and psychological factors. Similar results have been reported in thermal comfort studies conducted in other countries for older people [14,36,50].
3.5. Behaviour control actions by the older people
In thermal comfort studies, behavioural control actions refer to the strategies individuals employ to modify their immediate thermal environment or adjust their personal comfort levels to achieve a more desirable thermal state. These behaviours are generally categorized into two types: environmental control actions and personal control actions.
This study utilized the Relative Importance Index (RII) method to assess the behavioural control actions of older individuals. The RII approach was applied to prioritize and rank the various strategies participants used to maintain thermal comfort. As a statistical tool, the RII evaluates the relative significance of different factors by accounting for both their likelihood of occurrence and the degree of impact they exert on the given outcome [74].
The RII is calculated using the following Eq. (16):
where RII is the Relative Importance Index.
W represents the weight or priority assigned to each factor by respondents, ranked on a scale (e.g., 1 to 6, where 1 indicates "most preferred" and 6 indicates "least preferred").
A is the highest weight in the ranking scale (in this case, 6).
N is the total number of respondents.
The RII value ranges from 0 to 1, with higher values indicating more critical or impactful actions. In this context, a higher RII suggests that the corresponding behavioural control action is more crucial for the older people in achieving and maintaining thermal comfort.
3.5.1. Environmental control actions
The bar chart (Fig. 16) illustrates the relative importance index (RII) of various environmental control actions taken by older adults, categorized by gender, to manage indoor thermal comfort. The analysis reveals notable gender differences in preferences and behaviours. Male older adults predominantly rely on active measures such as turning on or off ceiling fans (RII= 0.83) and portable fans (RII= 0.73), with these actions showing the highest relative importance indices (RII) among this group. They also exhibit a higher preference for relocating to semi-outdoor or outdoor places (RII= 0.6) to manage their comfort compared to females. This could be due to traditional gender roles and socialization of males with outdoor environment as compared with females. Similar inferences were drawn by Malik et al. [75] in her study while studying the socio-cultural preferences and contextual impediments within low-income housing of Mumbai, India. In contrast, female older adults demonstrate a broader range of strategies, with a strong emphasis on fine-tuning indoor environments. They show a higher propensity for adjusting fan speed (RII= 1), as well as manipulating windows, doors, and curtains (RII= 0.7), indicating a preference for more passive and nuanced approaches. While both genders engage in similar actions such as opening (RII = 0.7 for females and ≈ 0.65 for males) or closing (RII =0.6 for females and = 0.55 for males) windows and doors, females tend to use these methods more frequently. The actions of shifting furniture (RII = 0.4 for females and = 0.55 for males) and watering the terrace floor (RII = 0.35 for females and = 0.45 for males) are less significant overall, particularly among females, although males are slightly more inclined to use these methods. Based on the verbal interviews, it was observed that although older adults expressed an inclination to use terraces or shift furniture, these actions were the least preferred due to physical impairments, such as knee and joint pain, associated with aging.
3.5.2. Personal control actions
The graph (Fig. 17) provides a comparative analysis of the personal control actions adopted by older adults during summer and winter months. with actions further categorized by gender. In summer, males predominantly rely on wearing lighter clothing (RII = 1.0), moving to airy spaces like terraces (RII = 0.9), and taking cold showers (RII = 0.7), reflecting a preference for environmental adjustments and direct cooling methods.
Females, while also prioritizing lighter clothing (RII = 0.9) and cold showers (RII = 0.8), place significant importance on changing the cooking time (RII = 0.73) to avoid additional heat. Conversely, the least preferred activities in summer include tying up hair/adjusting hairstyle (RII = 0.12) for males and adjusting sleep cycles (RII = 0.3) for females. In winter, both genders shift towards warming strategies, with females emphasizing wearing heavier clothing (RII = 1.0) and using blankets and woollen head covers (RII = 0.73), while males prioritize hot showers (RII = 1.0) and drinking hot beverages (RII = 0.9). Males also incorporate more physical activities (RII = 0.61) into their winter routines, indicating a blend of passive and active warming strategies. The least preferred winter activities are changing the cooking time (RII = 0.21) and accessing terrace/balcony spaces for warmth (RII = 0.5) among males and moving to semi-outdoor spaces for sunbathing (RII = 0.52) and terrace access (RII = 0.23) among females. These activities were not highly prioritized by the older occupants, likely due to physical limitations or perceived inefficacy in managing thermal comfort.
3.6. Impediments of using adaptive controls
Radar charts are commonly utilized in various scientific research [85-88] to visualize multivariate data. In this study, the radar chart (Fig. 18) is employed to illustrate the various impediments to behavioural actions among older individuals, segmented by gender. It was noted that various non-thermal factors influenced the behavioural adaptations of the occupants. These factors included mosquitoes and insects, concerns about safety and security, mobility and sensory impairments, memory challenges, social anxiety and lack of support, as well as issues related to noise, odour, dust, and financial constraints. Anecdotal responses from older occupants indicated that both male and female older individuals faced substantial challenges with mobility issues (100%), which were identified as a major obstacle in adopting behavioural strategies to alleviate thermal discomfort. These findings align with a similar study conducted by Sudprasert [89] in older residential buildings in Thailand. However, older females faced higher impediments in several areas compared to males. Security (93.3%) & safety concerns (80%), privacy concerns (93.5%) and social anxiety (82.5%) are more pronounced among older female, suggesting a higher sensitivity to these issues than their male counterparts. Conversely, economic reasons (95.5%), mosquitoes/ insects (100%) and resistance to adopt (87.2%) to new environment posed a significant barrier for males but are less of a concern for females. Additionally, sensory impairments are more challenging for older females (54.5%), whereas memory issues are more problematic for older males (80%). It was observed from the verbal interview sessions, that female older adults faced difficulty in identifying proper switches to on/ off electrical appliances.
Social and support obstacles also present a significant challenge for females (40%) compared to males (13.33%), indicating a disparity in social support systems between the genders. Environmental factors such as noise (22%) and odour (35.6%) are more problematic for males, while dust (82%) poses a greater challenge for females, likely due to their closer association with household activities like cleaning and cooking. House ownership also presents a slightly higher challenge for females (65.4%) than males (55.8%). Overall, the findings emphasize that older individuals, particularly those living alone or with spouses, face significant issues related to mobility, security, and insect presence. The widespread installation of security grills and mosquito nets in the surveyed homes underscores the importance of these concerns. Additionally, older female subjects tend to prioritize privacy and safety, whereas their male counterparts are more concerned with economic issues, given their role as primary earners and greater involvement in operating electronic appliances. Field observations further indicate that older women show a stronger preference for naturally ventilated environments over air-conditioned ones.
However, many older adults, particularly those with physical disabilities, face challenges in utilizing adaptive strategies, such as watering terrace floors or moving to higher areas to access fresh air, to maintain thermal comfort. Additionally, since most of the surveyed homes include a porch or portico that acts as a buffer zone between the road and living spaces, issues like noise and unpleasant odours were not major concerns for the occupants.
4. Discussion
This section provides a comprehensive comparison of the current study across three distinct categories. First, it compares the thermal comfort findings of older individuals (current study) with those from general population studies conducted in residential buildings across various climatic regions of India. This comparison offers a detailed understanding of how the thermal comfort preferences of the older population differ from those of the general population. Second, the study is evaluated against Indian adaptive comfort standards to identify any discrepancies or variations. Finally, the study is compared with previous thermal comfort research involving older populations in other countries, assessing their comfort requirements and behavioural adaptations to achieve thermally comfortable indoor environments.
4.1. Comparison of current study with other younger people studies in the residential buildings of various climatic regions of India
Thermal comfort research in Indian residential buildings is essential due to the country's diverse climatic conditions, varied living arrangements that include different age groups, and a wide range of socio-economic and cultural factors. However, previous research in this area has primarily focused on the general population, with minimal attention given to the older people demographic. Despite existing studies highlighting the unique thermal comfort needs of the older population, dedicated research on this subject remains limited in India. The current study seeks to fill this gap by examining the thermal comfort requirements of older individuals within their residential environments and by developing an adaptive comfort model tailored specifically to this age group. Based on linear regression analysis, the indoor comfort temperature (Top) for the older adults was determined under two conditions: an 80% comfort range, defined by a Thermal Sensation ote (TSV) of −1 ≤ TSV ≤ +1, and a 90% comfort range, defined by a TSV of −0.5 ≤ TSV ≤ +0.5. The resulting indoor comfort temperature ranges are 27.7°C to 30.6°C for the 80% comfort range, and 28.4°C to 29.9°C for the 90% comfort range. To contextualize these findings within broader thermal comfort trends, the results of the current study were compared with those from thermal comfort studies conducted on the general population in residential buildings across various climatic regions of India, as illustrated in the Fig. 19. According to the NBC, the comfort temperature range for Indian residential buildings lies between 25°C and 30°C. However, the current study indicates that older people require slightly warmer indoor environments, with a comfort range of 28.4°C to 29.9°C for a neutral thermal sensation vote (TSV) of +0.5 and 27.7°C to 30.6°C for a TSV of +1. This suggests that the older population has a narrower and warmer comfort range compared to the general standards recommended by NBC 2005[90].
Figure 19
Fig. 19. Comparison of current study with other younger people studies across various climatic regions of India.
The comparative analysis clearly demonstrates that, regardless of climatic types or residential settings, previous studies [38,57,58,75-78,92-96] involving the general population (younger individuals) exhibit significantly broader comfort temperature ranges compared to the current study focused on older individuals. In studies with younger populations, the difference between the upper and lower limits of comfort temperatures is typically at least 5 degrees as seen in the works of Indraganti et al. [92], Rajasekar and Ramachandraiah [79], Subramanian et al. [77], and Singh et al. [81]. In contrast, our current study reveals a much narrower comfort range for older participants, with an 80% acceptability range spanning just 2.9 degrees. This finding underscores that older people have a more limited tolerance for temperature variations compared to the general population. Similar observations have been reported in previous studies [14,30] conducted in other countries focusing on older populations. These studies consistently highlight that older individuals tend to have narrower comfort temperature ranges, reinforcing the notion that their thermal comfort needs are distinct and more restrictive compared to those of the general population.
The upper temperature limit of the current study (30.6°C) closely aligns with previous research conducted with the general population, including studies by Sharma and Tiwari [91] in composite climates, Udaykumar et al. [96] in hot and dry climates, and Subramanian et al. [76], Rajasekar and Ramachandraiah [78] in warm humid climatic region. However, when considering the lower temperature limit, the comfort range for older individuals, starting at 27.7°C, significantly deviates from most previous studies. While it nearly coincides with the findings of Indraganti and Rao [69], it differs substantially from other studies, even those conducted in similar warm and humid climates [76,78].
This deviation highlights the sensitivity of older individuals to cooler environments and their increased vulnerability to extreme temperature fluctuations. Factors such as reduced metabolic rate, thinner skin, and lower blood circulation in older adults contribute to their heightened sensitivity to cooler temperatures, causing them to feel cold more quickly and prefer warmer indoor conditions [23,50]. These findings underscore the necessity of tailored thermal comfort strategies that address the specific needs of the older population.
4.2. Comparison with Indian adaptive thermal comfort (IMAC) standards
The comparison of the linear regression model from the current study with prominent Indian adaptive thermal comfort models, such as IMAC-R and IMAC-NV, is illustrated in the Fig. 20. The thermal sensation votes (TSV) were plotted against the operative temperature (Top), and the linear regression equations from the current study for both seasons (equations (6) & (7)) and overall (equation (8)), along with the equations (17) & (18) from the IMAC-R and IMAC-NV models, were plotted together. The results of the comparative analysis reveal that older individuals demonstrated a more pronounced sensitivity to temperature changes compared to the general population, as indicated by the steeper slopes in the thermal sensation vote (TSV) data. The overall slope of 0.68 in the current study suggests that as the operative temperature (Top) increases, older participants experienced a more significant change in their thermal sensation as compared to the predictions by IMAC-R (slope= 0.085) and IMAC-NV (slope= 0.12) models.
In particular, during the winter, the slope of 0.28 suggests that older individuals felt colder more quickly as temperatures drop, while in the summer, the slope of 0.35 indicates that they felt warmer more rapidly as temperatures rise. These seasonal variations highlight the increased vulnerability of older people to both colder and hotter indoor environments. The steeper slopes observed in this study imply that older individuals require more precise temperature regulation to maintain comfort, particularly during periods of extreme outdoor temperatures. The flatter slopes of the IMAC models suggest that general populations can tolerate a broader range of temperatures without significant discomfort, whereas the older individuals are more sensitive, and thus, generalized models like IMAC-R and IMAC-NV may not adequately address their needs. This discrepancy may stem from the fact that older individuals are less able to fully utilize adaptive strategies due to various physiological and psychological factors.
4.3. Comparison with other older people studies
The graph (Fig. 21) provides a comparison between the thermal sensation votes (TSV) and indoor operative temperatures (Top) for older populations across various studies, with the current study conducted in India. The linear regression equations obtained from the current study (overall data, summer and winter) and the other older people studies from neighbouring countries are plotted in the figure. It is interesting to note that the comfort temperature in the other older population studies ranges from 22 ֯C to 26 ֯C, which is lower than the current study (29.2 ֯C). Intriguingly, the upper limit for Indian older individuals is significantly higher than those in neighbouring countries, suggesting that Indian older adults are more tolerant of higher temperatures.
In the current study, the winter slope of 0.28 indicates a more gradual increase in TSV with rising Top, implying that older individuals in cooler conditions have a broader tolerance for temperature variations. This finding aligns with studies such as Xiong et al. in China [42] and Jiao et al. in Shanghai [17], where similar adaptations to cooler climates were observed among older populations. Conversely, the summer data from the current study, with a slope of 0.35, reflects a steeper increase in TSV, indicating a heightened sensitivity to warmer temperatures. This suggests that older individuals in this study, similar to those in warmer regions like Thailand [89] and South Australia [97] experience discomfort more rapidly as temperatures rise. This narrower comfort range underscores the need for effective cooling strategies during hot conditions to ensure thermal comfort for the older adults.
When examining the overall data, the slope of 0.68 is the steepest, highlighting the pronounced sensitivity of older individuals to temperature fluctuations across all seasons. This steep slope is consistent with findings from other international studies, such as those by Hwang and Chen in Taiwan [45] and Forcada et al. (2020) in Spain [30], where older populations also demonstrate narrow thermal comfort ranges.
4.4. Limitations and future directions
This study offers a valuable contribution to understanding the thermal comfort and adaptive behaviours of older people in warm and humid climates. However, there are several limitations that should be acknowledged. First, the field surveys were conducted during the COVID-19 pandemic, which restricted the ability to collect data from a larger sample size. Although 1480 responses were gathered, the sample size remains relatively small and should be expanded in future studies to enhance the generalizability of the findings. Second, the surveys were limited to the daytime, between 7:00 AM and 10:00 PM, with no data collected during nighttime hours. Given the physical and privacy concerns of the older participants, monitoring their thermal comfort during night hours was not feasible. Nighttime thermal comfort conditions could differ significantly from daytime conditions, particularly in warm and humid climates, and future studies should aim to include this crucial period. Additionally, while this research provides important insights into the thermal comfort range of older individuals, it does not account for other relevant factors, such as building characteristics (e.g., insulation, orientation, ventilation) or neighbouring environmental influences (e.g., outdoor temperature, proximity to green spaces, urban heat islands). These factors can have significant impacts on indoor thermal conditions and should be incorporated into future investigations. Finally, the findings of this study offer a foundation for developing more targeted policies aimed at improving the living conditions of older adults. Researchers and policymakers can utilize this knowledge to design age-friendly housing that promotes thermal comfort and supports adaptive behaviours, thereby enhancing the health and well-being of the older population in warm and humid climates. Expanding this work to include different climate zones would further aid in tailoring housing policies to the diverse thermal comfort needs of older people across India.
5. Conclusion
This study presents an in-depth analysis of indoor thermal comfort in the residences of older individuals during both the summer and winter seasons in the warm and humid climate of India. A total of 1480 responses were gathered through a longitudinal survey, accompanied by simultaneous measurements of indoor environmental variables. In addition to examining thermal comfort, the research also investigated the adaptive behaviours and environmental control actions adopted by older adults to manage their indoor thermal environments. The key conclusions derived from these findings are summarized below:
- The descriptive analysis of TSV and TPV results reveals that older individuals predominantly experience neutral thermal sensations in both summer (37.7%) and winter (40%), though the perception shifts towards warmer sensations in summer and cooler sensations in winter. Gender differences were evident, with female older occupants being more sensitive to heat, while male older occupants showed a greater sensitivity to cooler environments.
- Older individuals reported higher overall thermal satisfaction in winter (60.2%) compared to summer (35.6%), with greater dissatisfaction noted in summer (49.1%). This increased discomfort in summer could be due to the limited ability to manage heat in naturally ventilated spaces, unlike the easier control of conditions in winter.
- Thermal sensitivity and neutral temperature for the older population across both seasons were determined using linear regression analysis. The comfort temperatures, derived by setting the thermal sensation votes (TSV) to zero, are 30°C for summer, 28.1°C for winter, and 29.2°C for the overall dataset. The steeper slope of the summer linear regression concludes that even minor increases in indoor operative temperature significantly affect thermal sensation, emphasizing the challenges the older people face in maintaining comfort during warmer months.
- Probit analysis results show that in summer, over 80% of older individuals felt comfortable at operative temperatures ranging from 25.7°C to 32°C (TSV = -1, 0, +1), and 90% people felt comfortable between 26.9°C and 30.9°C. In winter, the 80% comfort range was 25.4°C to 32.1°C, while 90% comfort occurred between 26.4°C and 31°C. The findings indicate a consistent preference for warmer indoor environments across both seasons.
- At PMOT of 25°C, the comfort band (TSV±1) of the older individuals are found to be between 26°C to 31°C and for the special conditions (TSV±0.5) as per ASHRAE 55- 2020, the comfort range was found to be between 26.9°C to 29.7°C. The comfort range for older individuals is narrower than those observed in IMAC R, IMAC NV, and ASHRAE 55-2020 models, further the slope of the regression curve for the older population (0.56) is steeper than those of ASHRAE 55 (0.31), IMAC R (0.42), and IMAC NV (0.54) models, indicating a higher sensitivity to temperature variations.
- The relative important index analysis reveal that older males favour environmental adjustments and direct cooling in summer, like wearing lighter clothing and moving to airy spaces, while females prioritize modifying daily routines, such as changing cooking times. In winter, both genders adopt warming strategies, with males focusing on hot showers and females on heavier clothing.
In summary, this study is a novel attempt to determine the thermal comfort range of older people residing in warm and humid regions of India. The findings provide valuable insights into the specific thermal preferences and comfort needs of this demographic, which can be effectively utilized by policymakers and designers when planning and designing residential setups for the older community. Implementing these insights will contribute to creating a comfortable indoor environment that promotes the well-being and health of older individuals. Moreover, by aligning building designs with the thermal preferences of the older population, there is significant potential for optimizing energy consumption, leading to enhanced energy savings.
Acknowledgement
This work was funded by the Prime Minister’s Research Fellows (PMRF) scheme (Grant number: 3500972) under the Ministry of Education (MoE), Government of India. We sincerely thank all the older participants and their families for their valuable cooperation and participation in this study.
Contributions
N. Sudarsanam: Conceptualization, Methodology, Software, Formal analysis, Investigation, Resources, Data curation, Writing- Original Draft and Visualization. D. Kannamma: Conceptualization, Methodology, Validation, Formal analysis, Investigation, Data curation, Visualization and Supervision.
Funding
This research received no external funding.
Declaration of competing interest
The authors declare no conflict of interest.
References
- S. Banerjee, Determinants of rural-urban differential in healthcare utilization among the elderly population in India, BMC Public Health, 21 (2021) 939. https://doi.org/10.1186/s12889-021-10773-1
- L. M. Vaishnav, S. H. Joshi, A. U. Joshi, and A. M. Mehendale, The National Programme for Health Care of the Elderly: A Review of its Achievements and Challenges in India, Ann Geriatr Med Res, 26 (2022) 183-195. https://doi.org/10.4235/agmr.22.0062
- L. Naz, U. Ghimire, and A. Zainab, Behavioral factors associated with utilization of healthcare services among elderly in Pakistan: evidence from a nationally representative survey, BMC Geriatr, 21 (2021) 42. https://doi.org/10.1186/s12877-021-02005-3
- UN- DESA, United Nation's World Population Prospects. New York, NY: United Nations, (2022).
- Y. Lee, J. Hwang, S. Lim, and J. T. Kim, Identifying Characteristics of Design Guidelines for Elderly Care Environments from the Holistic Health Perspective, Indoor and Built Environment, 22 (2013) 242-259. https://doi.org/10.1177/1420326X12471101
- United Nations Population Fund 2023, India Ageing Report 2023, Caring for Our Elders, International Institute for Population Sciences & United Nations Population Fund, New Delhi, India, (2023).
- V. Lipman, Garimella Giridhar, K. M. Sathyanarayana, Sanjay Kumar, K. S. James and Moneer Alam (eds.) Population Ageing in India. Delhi: Cambridge University Press, 10 (2015) 73-77. https://doi.org/10.3384/ijal.1652-8670.2014_2A
- D. E. Bloom, T. V. Sekher, and J. Lee, Longitudinal Aging Study in India (LASI): new data resources for addressing aging in India, Nat Aging, 1 (2021) 1070-1072. https://doi.org/10.1038/s43587-021-00155-y
- B. Ramraj and M. Logaraj, Is home bound a major burden towards health access among the elderly population? A community based cross sectional study in the selected northern districts in Tamilnadu, Clinical Epidemiology and Global Health, 9 (2021) 132-136. https://doi.org/10.1016/j.cegh.2020.08.002
- World Health Organization, World report on ageing and health. Geneva: World Health Organization, (2015). Accessed: May 23, 2022. [Online]. Available: https://apps.who.int/iris/handle/10665/186463
- M. Simoni, M. S. Jaakkola, L. Carrozzi, S. Baldacci, F. Di Pede, and G. Viegi, Indoor air pollution and respiratory health in the elderly, European Respiratory Journal, 21 (2003) 15S - 20s. https://doi.org/10.1183/09031936.03.00403603
- World Health Organization, Did you know the when you have climate change strategies, you are improving your health?, WHO, (2008).
- J. van Hoof, L. Schellen, V. Soebarto, J. K. W. Wong, and J. K. Kazak, Ten questions concerning thermal comfort and ageing, Building and Environment, 120 (2017), 123-133. https://doi.org/10.1016/j.buildenv.2017.05.008
- M. T. Baquero, R. Vergés, K. Gaspar, and N. Forcada, A Field Investigation of the Thermal Comfort of Older Adults in Cold Winter Climates, Indoor Air, 2023 (2023) 1-14. https://doi.org/10.1155/2023/9185216
- S. Guergova and A. Dufour, Thermal sensitivity in the elderly: A review, Ageing Research Reviews, 10 (2011) 80-92. https://doi.org/10.1016/j.arr.2010.04.009
- P. Roelofsen, Healthy ageing: differences between elderly and non-elderly in temperature sensation and dissatisfied, Intelligent Buildings International, 9 (2017) 123-136. https://doi.org/10.1080/17508975.2015.1063474
- Y. Jiao, Y. Yu, H. Yu, and F. Wang, The impact of thermal environment of transition spaces in elderly-care buildings on thermal adaptation and thermal behavior of the elderly, Building and Environment, 228 (2023) 109871. https://doi.org/10.1016/j.buildenv.2022.109871
- O. Edholm and R. G. Hopkinson, Thermal Balance and Thermal Comfort in the Built Environment, Engineering in Medicine, 5 (1976) 73-74. https://doi.org/10.1243/EMED_JOUR_1976_005_027_02
- Thermal Environmental Conditions for Human Occupancy ANSI/ASHRAE Standard 55-2020, ASHRAE, (2020).
- ANSI/ASHRAE Standard 55-2017, p. 66.
- A. Sharma, A. Kumar, and K. S. Kulkarni, Thermal comfort studies for the naturally ventilated built environments in Indian subcontinent: A review, Journal of Building Engineering, 44 (2021) 103242. https://doi.org/10.1016/j.jobe.2021.103242
- R. Vergés, K. Gaspar, and N. Forcada, Assessment of the energy implications adopting adaptive thermal comfort models during the cooling season: A case study for Mediterranean nursing homes, Energy and Buildings, 299 (2023) 113598. https://doi.org/10.1016/j.enbuild.2023.113598
- J. V. Hoof and J. L. M. Hensen, Thermal comfort and older adults, Gerontechnology, 4 (2006) 223-228. https://doi.org/10.4017/gt.2006.04.04.006.00
- L. Schellen, W. D. Van Marken Lichtenbelt, M. G. L. C. Loomans, J. Toftum, and M. H. De Wit, Differences between young adults and elderly in thermal comfort, productivity, and thermal physiology in response to a moderate temperature drift and a steady-state condition: Differences between young adults and elderly in thermal comfort, productivity, and thermal physiology, Indoor Air, 20 (2010) 273-283. https://doi.org/10.1111/j.1600-0668.2010.00657.x
- D. T. Novieto and Y. Zhang, Thermal Comfort Implications of the Aging Effect on Metabolism, Cardiac Output and Body Weight, in: Proceedings of Adapting to change: New thinking on comfort, Cumberland Lodge, Windsor, UK, 2010, 9-11.
- N. R. I. Ryti, Y. Guo, and J. J. K. Jaakkola, Global Association of Cold Spells and Adverse Health Effects: A Systematic Review and Meta-Analysis, Environ Health Perspect, 124 (2016) 12-22. https://doi.org/10.1289/ehp.1408104
- H. Zhan, J. Yu, and R. Yu, Assessment of older adults' acceptance of IEQ in nursing homes using both subjective and objective methods, Building and Environment, 203 (2021) 108063. https://doi.org/10.1016/j.buildenv.2021.108063
- N. Forcada, M. Gangolells, M. Casals, B. Tejedor, M. Macarulla, and K. Gaspar, Field study on thermal comfort in nursing homes in heated environments, Energy and Buildings, 244 (2021) 111032. https://doi.org/10.1016/j.enbuild.2021.111032
- W. Zheng, T. Shao, Y. Lin, Y. Wang, C. Dong, and J. Liu, A field study on seasonal adaptive thermal comfort of the elderly in nursing homes in Xi'an, China, Building and Environment, 208 (2022) 108623. https://doi.org/10.1016/j.buildenv.2021.108623
- N. Forcada, M. Gangolells, M. Casals, B. Tejedor, M. Macarulla, and K. Gaspar, Summer thermal comfort in nursing homes in the Mediterranean climate, Energy and Buildings, 299 (2020) 110442. https://doi.org/10.1016/j.enbuild.2020.110442
- K. Healy, Heat Wave: A Social Autopsy of Disaster in Chicago, University of Chicago Press, 8 (2002), 283-289.
- R. S. Kovats, Heat waves and health protection, BMJ, 333 (2006) 314-315. https://doi.org/10.1136/bmj.333.7563.314
- J.-M. Robine et al., Death toll exceeded 70,000 in Europe during the summer of 2003, Comptes Rendus. Biologies, 331 (2007) 171-178. https://doi.org/10.1016/j.crvi.2007.12.001
- A. Mendes et al., Indoor Air Quality and Thermal Comfort-Results of a Pilot Study in Elderly Care Centers in Portugal, Journal of Toxicology and Environmental Health, 76 (2013) 333-344. https://doi.org/10.1080/15287394.2013.757213
- Y. Jiang, Y. Ryu, and H. Kagawa, Measurement of thermal environment and mental reaction of elderly people in welfare facilities, Nihon Kenchiku Gakkai Kankyokei Ronbunshu, 73 (2008) 191-197. https://doi.org/10.3130/aije.73.191
- Z. Wang, B. Cao, B. Lin, and Y. Zhu, Investigation of thermal comfort and behavioral adjustments of older people in residential environments in Beijing, Energy and Buildings, 217 (2020) 110001. https://doi.org/10.1016/j.enbuild.2020.110001
- R.-L. Hwang, M.-J. Cheng, T.-P. Lin, and M.-C. Ho, Thermal perceptions, general adaptation methods and occupant's idea about the trade-off between thermal comfort and energy saving in hot-humid regions, Building and Environment, 44 (2009) 1128-1134. https://doi.org/10.1016/j.buildenv.2008.08.001
- M. Indraganti and K. D. Rao, Effect of age, gender, economic group and tenure on thermal comfort: A field study in residential buildings in hot and dry climate with seasonal variations, Energy and Buildings, 42 (2010) 273-281. https://doi.org/10.1016/j.enbuild.2009.09.003
- C. Peng, Survey of thermal comfort in residential buildings under natural conditions in hot humid and cold wet seasons in Nanjing, Front. Archit. Civ. Eng. China, 4 (2010) 503-511. https://doi.org/10.1007/s11709-010-0095-1
- R. Becker and M. Paciuk, Thermal comfort in residential buildings - Failure to predict by Standard model, Building and Environment, 44 (2009) 948-960. https://doi.org/10.1016/j.buildenv.2008.06.011
- K. Natsume, T. Ogawa, J. Sugenoya, N. Ohnishi, and K. Imai, Preferred ambient temperature for old and young men in summer and winter, Int J Biometeorol, 36 (1992) 1-4. https://doi.org/10.1007/BF01208726
- J. Xiong, T. Ma, Z. Lian, and R. de Dear, Perceptual and physiological responses of elderly subjects to moderate temperatures, Building and Environment, 156 (2019) 117-122. https://doi.org/10.1016/j.buildenv.2019.04.012
- Y. Wu et al., Thermal adaptation of the elderly during summer in a hot humid area: Psychological, behavioral, and physiological responses, Energy and Buildings, 203 (2019) 109450. https://doi.org/10.1016/j.enbuild.2019.109450
- J. Yang, I. Nam, and J.-R. Sohn, The influence of seasonal characteristics in elderly thermal comfort in Korea, Energy and Buildings,126 (2016) 583-591. https://doi.org/10.1016/j.enbuild.2016.07.037
- R.-L. Hwang and C.-P. Chen, Field study on behaviors and adaptation of elderly people and their thermal comfort requirements in residential environments: Thermal comfort requirements of elderly people, Indoor Air, 20 (2010) 235-245. https://doi.org/10.1111/j.1600-0668.2010.00649.x
- M. Indraganti, Behavioural adaptation and the use of environmental controls in summer for thermal comfort in apartments in India, Energy and Buildings, 42 (2010) 1019-1025. https://doi.org/10.1016/j.enbuild.2010.01.014
- Times of India, HelpAge India. Old-age Homes: Providing Security and Company for the Aged., (2014).
- S. K. Maheshwari, R. Chaturvedi, and P. Sharma, Effectiveness of psycho-educational intervention on psychological distress and self-esteem among resident elderly: A study from old age homes of Punjab, India, Clinical Epidemiology and Global Health,11 (2021) 100733. https://doi.org/10.1016/j.cegh.2021.100733
- H. Zhou et al., Adaptative thermal comfort analysis in the elderly based on Fried frailty classification in residential buildings during summer, Building and Environment, 252 (2024) 111262. https://doi.org/10.1016/j.buildenv.2024.111262
- Y. Jin, F. Wang, S. R. Payne, and R. B. Weller, A comparison of the effect of indoor thermal and humidity condition on young and older adults' comfort and skin condition in winter, Indoor and Built Environment, 31 (2022) 759-776. https://doi.org/10.1177/1420326X211030998
- S. K. Sansaniwal, J. Mathur, V. Garg, and R. Gupta, Review of studies on thermal comfort in Indian residential buildings, Science and Technology for the Built Environment, 26 (2020) 1-22. https://doi.org/10.1080/23744731.2020.1724734
- S. Kumar and M. K. Singh, Field investigation on occupant's thermal comfort and preferences in naturally ventilated multi-storey hostel buildings over two seasons in India, Building and Environment, 163 (2019) 106309. https://doi.org/10.1016/j.buildenv.2019.106309
- S. Thapa and M. Indraganti, Evaluation of thermal comfort in two neighboring climatic zones in Eastern India-an adaptive approach, Energy and Buildings, 213 (2020) 109767. https://doi.org/10.1016/j.enbuild.2020.109767
- R. V. Andersen, J. Toftum, K. K. Andersen, and B. W. Olesen, Survey of occupant behaviour and control of indoor environment in Danish dwellings, Energy and Buildings, 41 (2009) 11-16. https://doi.org/10.1016/j.enbuild.2008.07.004
- B. F. Balvedi, E. Ghisi, and R. Lamberts, A review of occupant behaviour in residential buildings, Energy and Buildings, 174 (2018) 495-505. https://doi.org/10.1016/j.enbuild.2018.06.049
- R. de Dear, J. Xiong, J. Kim, and B. Cao, A review of adaptive thermal comfort research since 1998, Energy and Buildings, 214 (2020) 109893. https://doi.org/10.1016/j.enbuild.2020.109893
- S. Thapa, Insights into the thermal comfort of different naturally ventilated buildings of Darjeeling, India - Effect of gender, age and BMI, Energy and Buildings, 193 (2019) 267-288. https://doi.org/10.1016/j.enbuild.2019.04.003
- S. Singh and P. S. Chani, Thermal comfort analysis of Indian subjects in multi-storeyed apartments: An adaptive approach in composite climate, Indoor and Built Environment, 27 (2018) 1216-1246. https://doi.org/10.1177/1420326X17712797
- R. Aghamolaei and M. R. Ghaani, Balancing the impacts of energy efficiency strategies on comfort quality of interior places: Application of optimization algorithms in domestic housing, Journal of Building Engineering, 29 (2020) 101174. https://doi.org/10.1016/j.jobe.2020.101174
- T. Niemelä, J. Vinha, R. Lindberg, T. Ruuska, and A. Laukkarinen, Carbon dioxide permeability of building materials and their impact on bedroom ventilation need, Journal of Building Engineering, 12 (2017) 99-108. https://doi.org/10.1016/j.jobe.2017.05.009
- M. Bentayeb et al., Indoor air quality, ventilation and respiratory health in elderly residents living in nursing homes in Europe, Eur Respir J, 45 (2015) 1228-1238. https://doi.org/10.1183/09031936.00082414
- N. Sudarsanam and D. Kannamma, Investigation of summertime thermal comfort at the residences of elderly people in the warm and humid climate of India, Energy and Buildings, 291 (2023) 113151. https://doi.org/10.1016/j.enbuild.2023.113151
- National Building Code. New Delhi: Bureau of Indian Standard, (2016).
- G. Betti, F. Tartarini, C. Nguyen, and S. Schiavon, CBE Clima Tool: A free and open-source web application for climate analysis tailored to sustainable building design, Build. Simul., 17 (2024) 493-508. https://doi.org/10.1007/s12273-023-1090-5
- K. Rockwood, A global clinical measure of fitness and frailty in elderly people, Canadian Medical Association Journal, 173 (2005) 489-495. https://doi.org/10.1503/cmaj.050051
- Meteoblue, Meteoblue: Weather and Climate Data, Meteoblue, Web Page. Accessed: Feb. 26, (2025). [Online]. Available: www.meteoblue.com
- K. B. Debnath, D. P. Jenkins, S. Patidar, and A. D. Peacock, Understanding Residential Occupant Cooling Behaviour through Electricity Consumption in Warm-Humid Climate, Buildings, 10 (2020) 78. https://doi.org/10.3390/buildings10040078
- N. Bhandari, S. Tadepalli, and P. Gopalakrishnan, Influence of non-uniform distribution of fan-induced air on thermal comfort conditions in university classrooms in warm and humid climate, India, Building and Environment, 238 (2023) 110373. https://doi.org/10.1016/j.buildenv.2023.110373
- M. Indraganti and K. D. Rao, Thermal Comfort in Indian Apartments, Sustainable Houses and Living in the Hot-Humid Climates of Asia, T. Kubota, H. B. Rijal, and H. Takaguchi, Eds., Singapore: Springer Singapore, (2018) 165-174. https://doi.org/10.1007/978-981-10-8465-2_16
- S. Thapa and M. Indraganti, Evaluation of thermal comfort in two neighboring climatic zones in Eastern India-an adaptive approach, Energy and Buildings, 213 (2020) 109767. https://doi.org/10.1016/j.enbuild.2020.109767
- F. Nicol and M. Humphreys, Derivation of the adaptive equations for thermal comfort in free-running buildings in European standard EN15251, Building and Environment, 45 (2010) 11-17. https://doi.org/10.1016/j.buildenv.2008.12.013
- Hanada K, Mihira K, and Sato Y, Studies on the thermal resistance of men's underwear, Journal of Japan Research Association for Textile End- Users, 24 (1983), 363-369.
- Madhavi Indraganti, Juyoun Lee, Hui Zhang, and Edward A. Arens, Why is the Indian Sari an all-weather gear? Clothing insulation of Sari, Salwar-Kurti, Pancha, Lungi, and Dhoti, presented at the 9th Windsor Conference: Making comfort relevant, Cumberland Lodge, Windsor, UK, (2016), 18.
- M. A. Kassem, M. A. Khoiry, and N. Hamzah, Using Relative Importance Index Method for Developing Risk Map in Oil and Gas, Jurnal Kejuruteraan, 32(2020), 85-97. https://doi.org/10.17576/jkukm-2020-32(3)-09
- J. Malik, R. Bardhan, T. Hong, and M. A. Piette, Contextualising adaptive comfort behaviour within low-income housing of Mumbai, India, Building and Environment, 177 (2020) 106877. https://doi.org/10.1016/j.buildenv.2020.106877
- M. Ponni and D. R. Baskar, Summer Thermal Performance of a Multistoried Residential Building, International Journal of Engineering Science Invention, 6 (2017) 7.
- C. V. Subramanian, N. Ramachandran, and S. Senthamil Kumar, Design and Analysis of Solar Passive Architecture for Thermal Comfort of Residential Buildings in Warm-Humid Climate of Thanjavur Region, Indian Journal of Science and Technology, 10 (2017) 1-8. https://doi.org/10.17485/ijst/2017/v10i9/103647
- A. S. Dili, M. A. Naseer, and T. Z. Varghese, Thermal comfort study of Kerala traditional residential buildings based on questionnaire survey among occupants of traditional and modern buildings, Energy and Buildings, 42 (2010) 2139-2150. https://doi.org/10.1016/j.enbuild.2010.07.004
- E. Rajasekar and A. Ramachandraiah, Adaptive comfort and thermal expectations - a subjective evaluation in hot humid climate, presented at the Adapting to Change: New thinking on comfort, Cumberland Lodge, Windsor, UK, 2010, 18.
- H. B. Rijal, M. A. Humphreys, and J. F. Nicol, Towards an adaptive model for thermal comfort in Japanese offices, Building Research & Information, 45 (2017) 717-729. https://doi.org/10.1080/09613218.2017.1288450
- M. K. Singh, R. Ooka, H. B. Rijal, and M. Takasu, Adaptive thermal comfort in the offices of North-East India in autumn season, Building and Environment, 124 (2017) 14-30. https://doi.org/10.1016/j.buildenv.2017.07.037
- S. Kumar, A. Mathur, M. K. Singh, and K. B. Rana, Adaptive thermal comfort study of workers in a mini-industrial unit during summer and winter season in a tropical country, India, Building and Environment,197 (2021), 107874. https://doi.org/10.1016/j.buildenv.2021.107874
- R. Rawal et al., Adaptive thermal comfort model based on field studies in five climate zones across India, Building and Environment, 219 (2022) 109187. https://doi.org/10.1016/j.buildenv.2022.109187
- S. Manu, Y. Shukla, R. Rawal, L. E. Thomas, and R. de Dear, Field studies of thermal comfort across multiple climate zones for the subcontinent: India Model for Adaptive Comfort (IMAC), Building and Environment, 98 (2016) 55-70. https://doi.org/10.1016/j.buildenv.2015.12.019
- T. Shafighfard, F. Kazemi, N. Asgarkhani, and D.-Y. Yoo, Machine-learning methods for estimating compressive strength of high-performance alkali-activated concrete, Engineering Applications of Artificial Intelligence, 136 (2024) 109053. https://doi.org/10.1016/j.engappai.2024.109053
- T. Shafighfard, F. Kazemi, F. Bagherzadeh, M. Mieloszyk, and D. Yoo, Chained machine learning model for predicting load capacity and ductility of steel fiber-reinforced concrete beams, Computer aided Civil Eng, 39 (2024) 3573-3594. https://doi.org/10.1111/mice.13164
- F. Bagherzadeh, T. Shafighfard, R. M. A. Khan, P. Szczuko, and M. Mieloszyk, Prediction of maximum tensile stress in plain-weave composite laminates with interacting holes via stacked machine learning algorithms: A comparative study, Mechanical Systems and Signal Processing, 195 (2023) 110315. https://doi.org/10.1016/j.ymssp.2023.110315
- F. Kazemi, N. Asgarkhani, T. Shafighfard, R. Jankowski, and D.-Y. Yoo, Machine-Learning Methods for Estimating Performance of Structural Concrete Members Reinforced with Fiber-Reinforced Polymers, Arch Computat Methods Eng, 32 (2025) 571-603. https://doi.org/10.1007/s11831-024-10143-1
- S. Sudprasert, Study of Thermal Comfort and the adaptive behaviours of the elderly in naturally ventilated houses, International Journal of Building, Urban, Interior and Landscape Technology, 16 (2020) 9.
- Bureau of Indian Standards, Ed., National Building Code of India (NBC) 2005. New Delhi: Bureau of Indian Standards, (2001). E:\Solarlits\Submitted papers\data\zzzzzzzzzzzzzzzz
- A. Sharma and R. Tiwari, Evaluation of data for developing an adaptive model of thermal comfort and preference, Environmentalist, 27 (2007) 73-81. https://doi.org/10.1007/s10669-007-9018-7
- M. Indraganti, Using the adaptive model of thermal comfort for obtaining indoor neutral temperature: Findings from a field study in Hyderabad, India, Building and Environment, 45 (2010) 519-536. https://doi.org/10.1016/j.buildenv.2009.07.006
- S. Kumar, An adaptive approach to define thermal comfort zones on psychrometric chart for naturally ventilated buildings in composite climate of India, Building and Environment, 109 (2016) 135-153. https://doi.org/10.1016/j.buildenv.2016.09.023
- M. K. Singh, S. Mahapatra, and S. K. Atreya, Adaptive thermal comfort model for different climatic zones of North-East India, Applied Energy, 88 (2011) 2420-2428. https://doi.org/10.1016/j.apenergy.2011.01.019
- K. I. Praseeda, M. Mani, and B. V. V. Reddy, Assessing Impact of Material Transition and Thermal Comfort Models on Embodied and Operational Energy in Vernacular Dwellings (India), Energy Procedia, 54 (2014) 342-351. https://doi.org/10.1016/j.egypro.2014.07.277
- A. Udaykumar, E. Rajasekar, and R. Venkateswaran, Thermal comfort characteristics in naturally ventilated, residential apartments in a hot-dry climate of India, Indoor and Built Environment, 24 (2015) 101-115. https://doi.org/10.1177/1420326X13504120
- R. Bills, Addressing the relationships between ageing, thermal comfort, house design and health: A study in South Australia, The University of Adelaide, Australia, (2019).
Copyright © 2025 The Author(s). Published by solarlits.com.
 HOME
HOME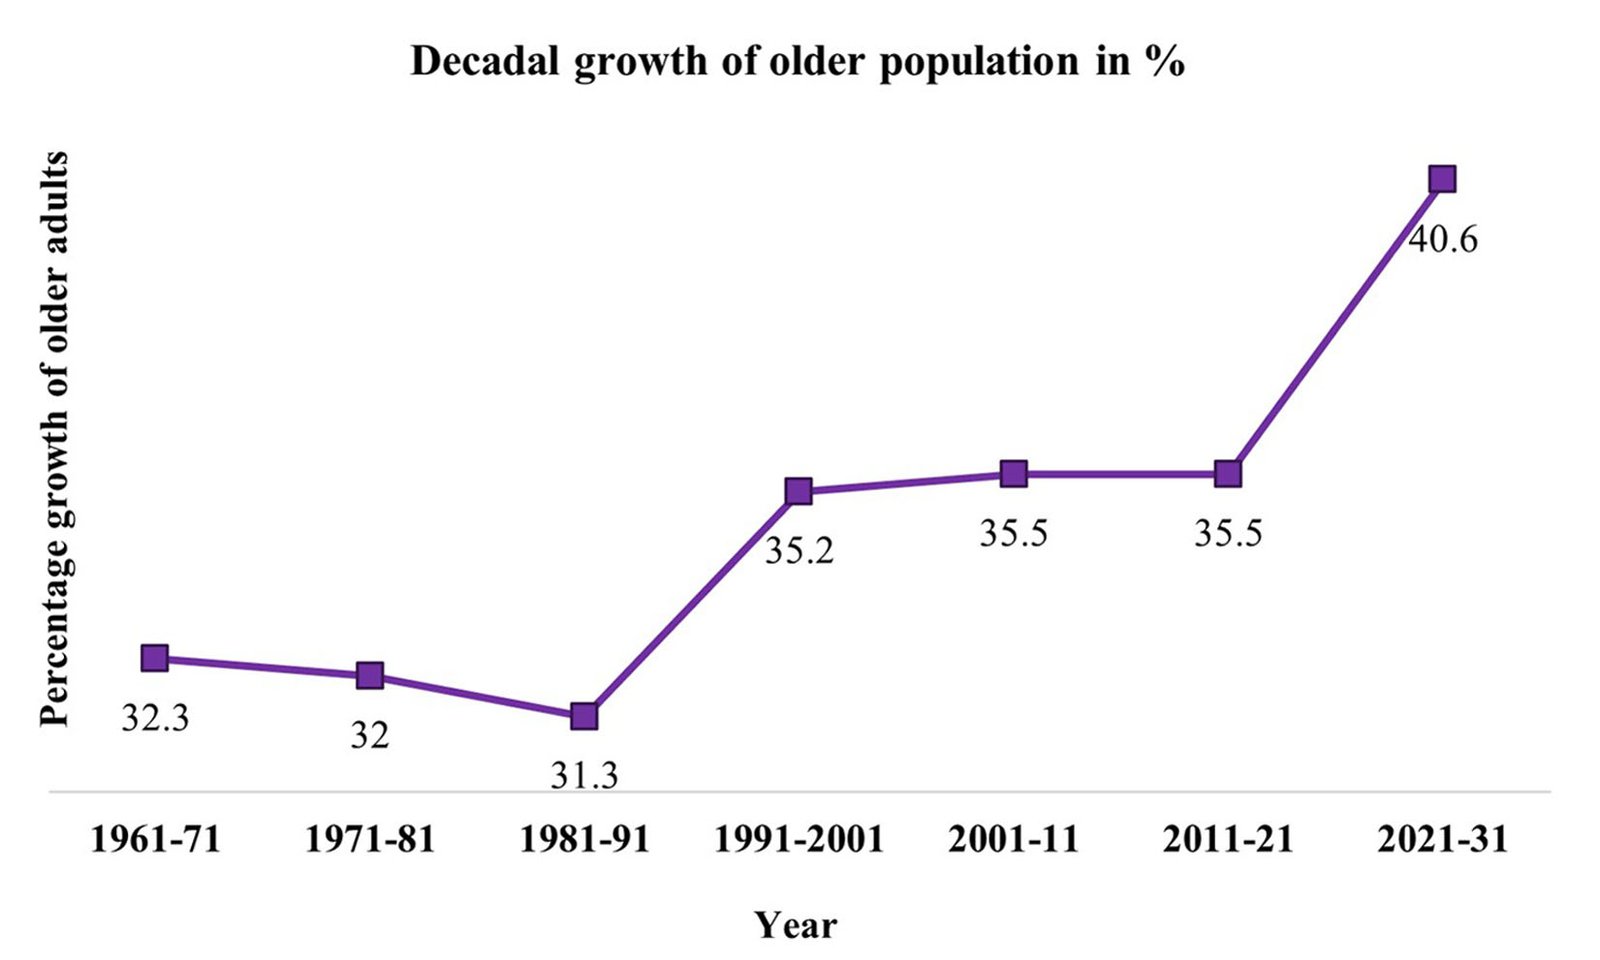 Figure 1
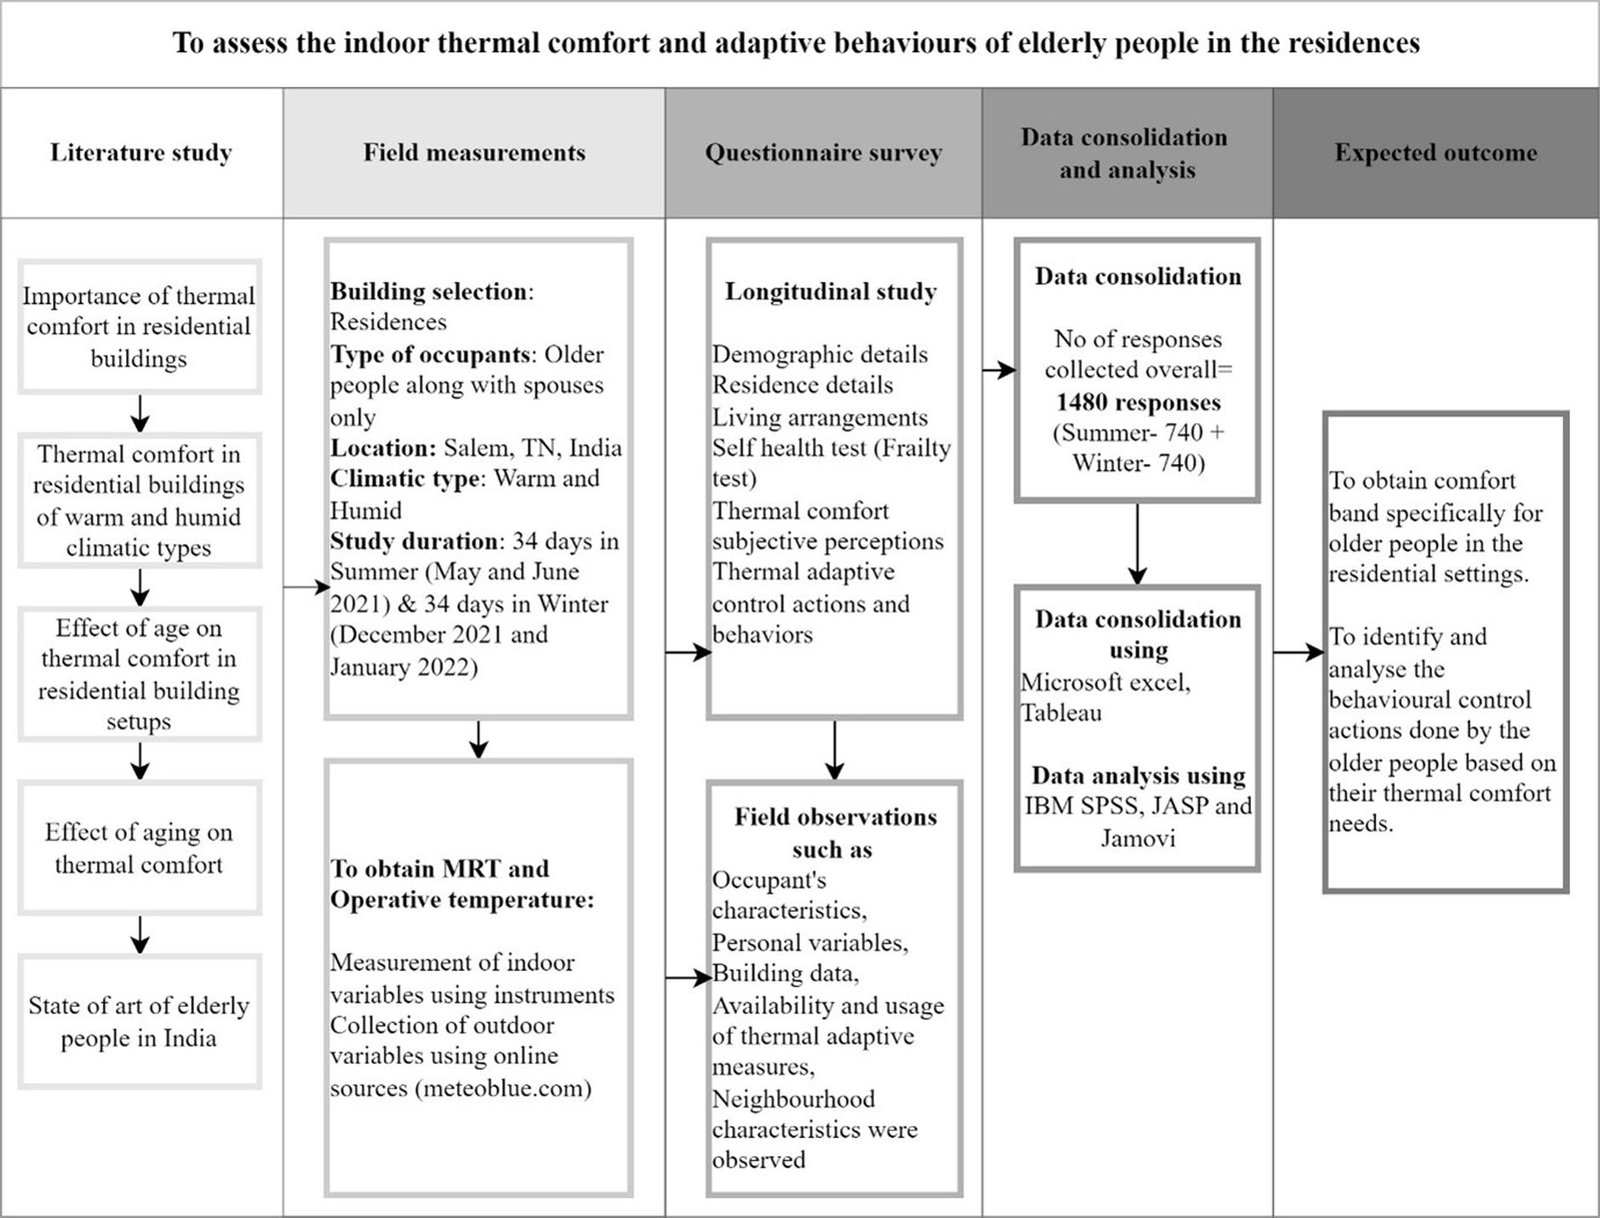 Figure 2
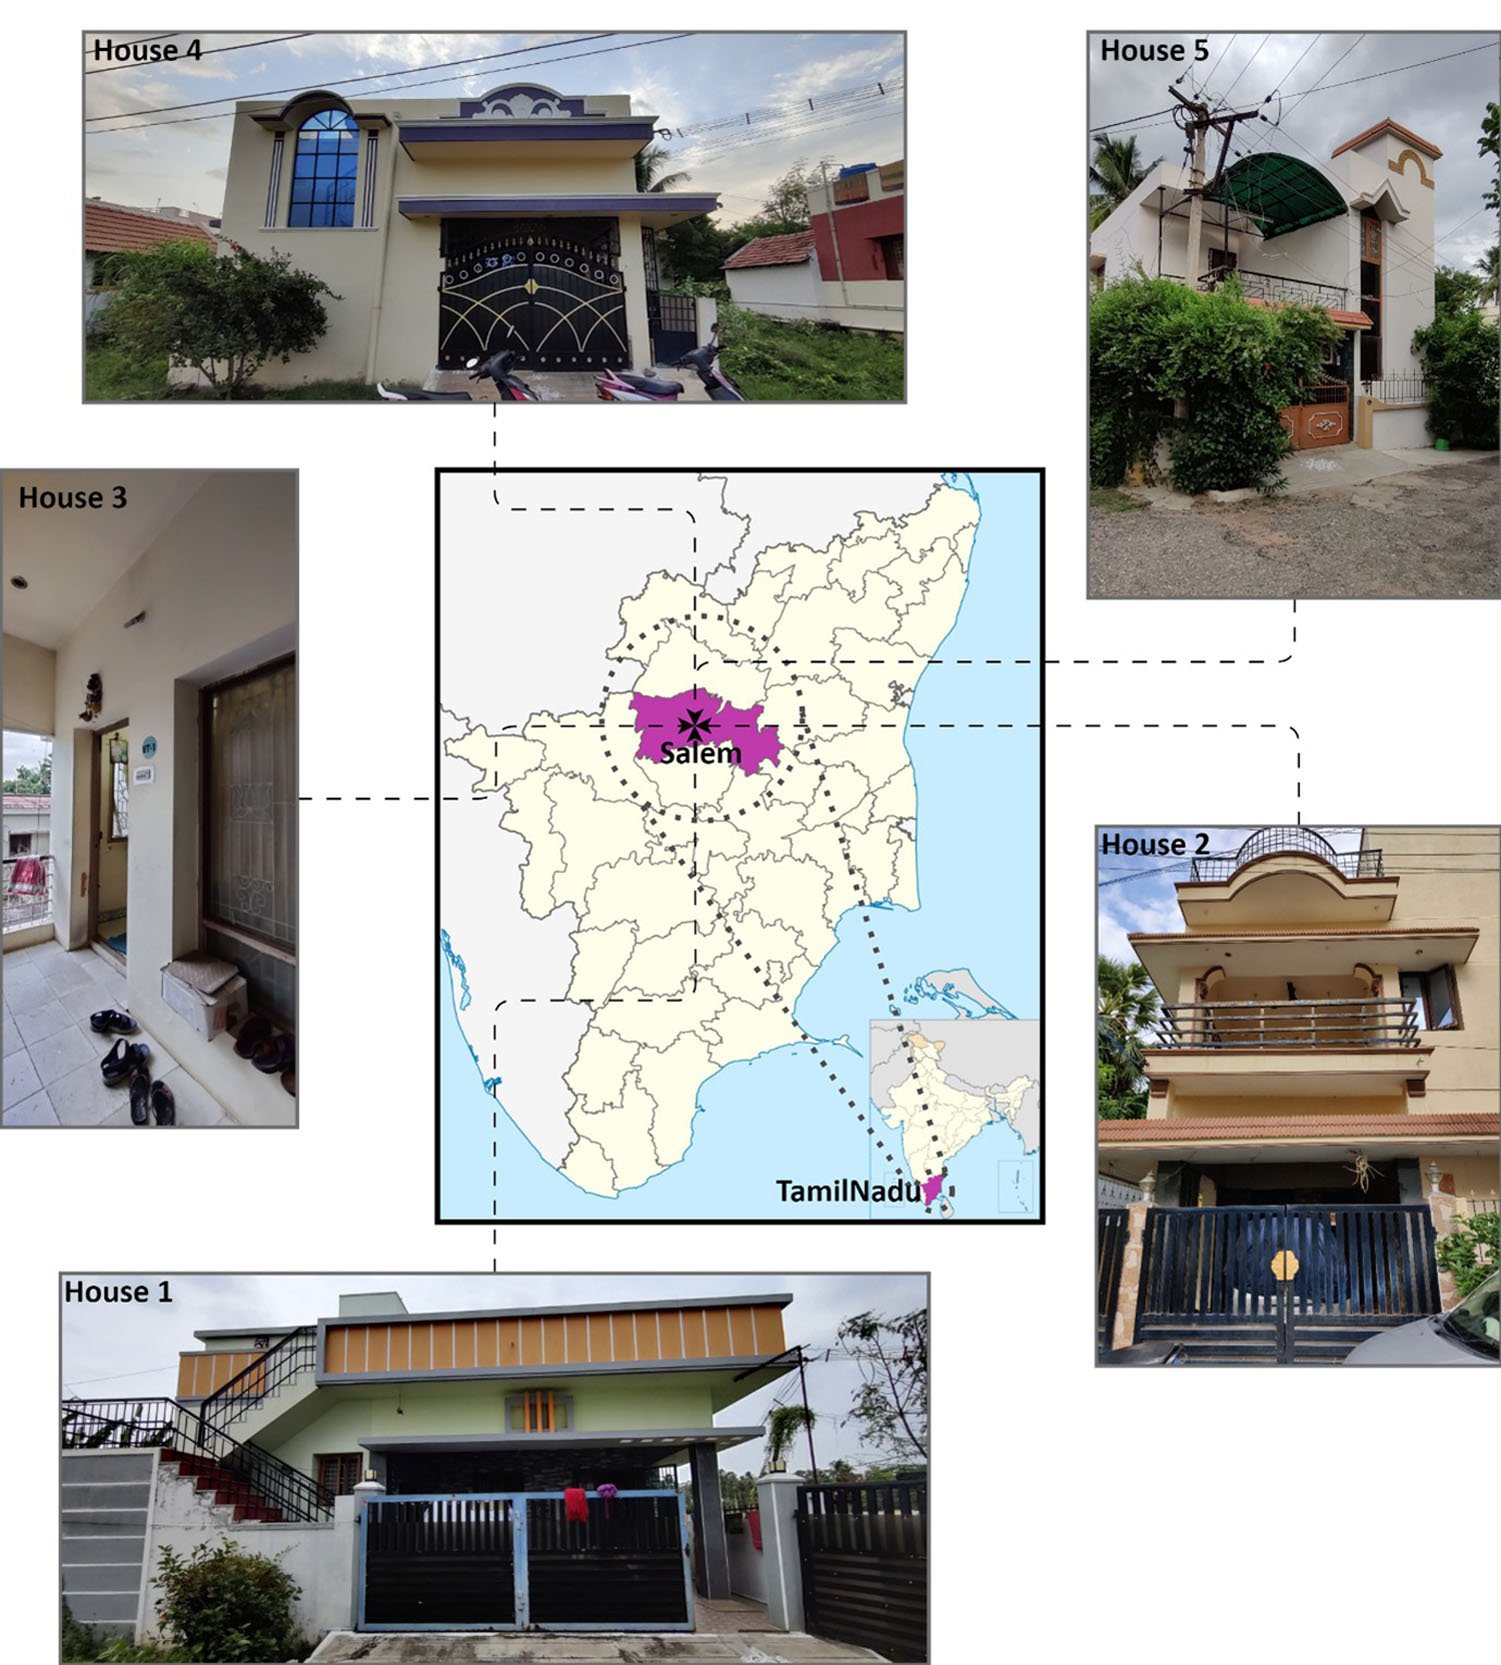 Figure 3
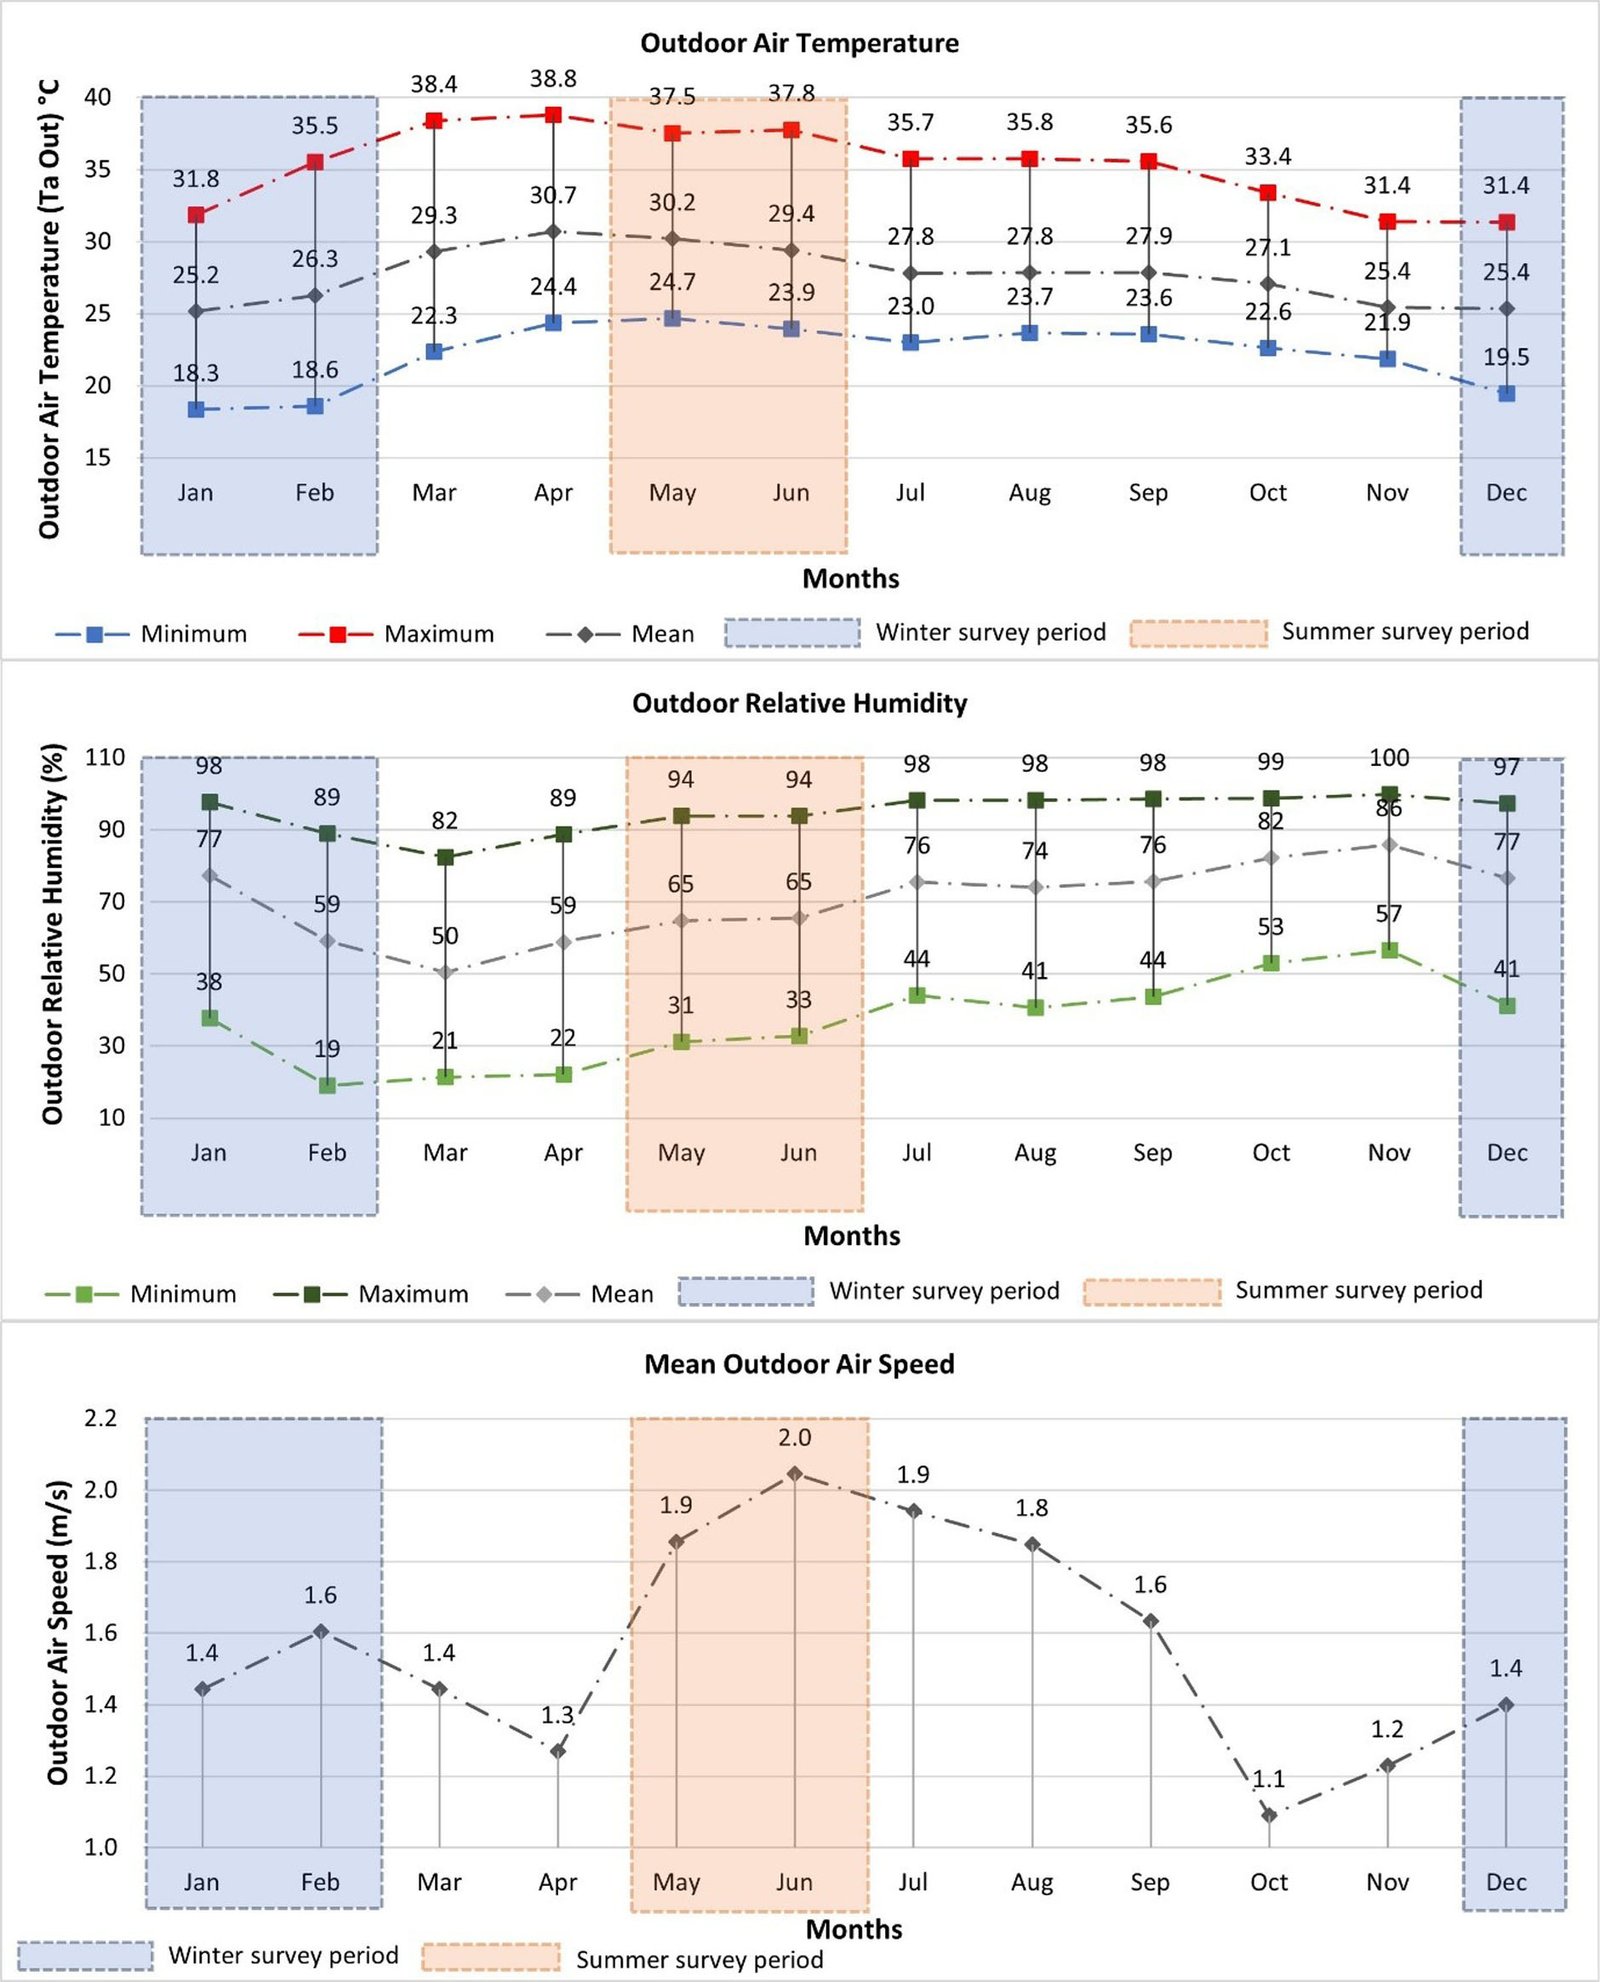 Figure 4
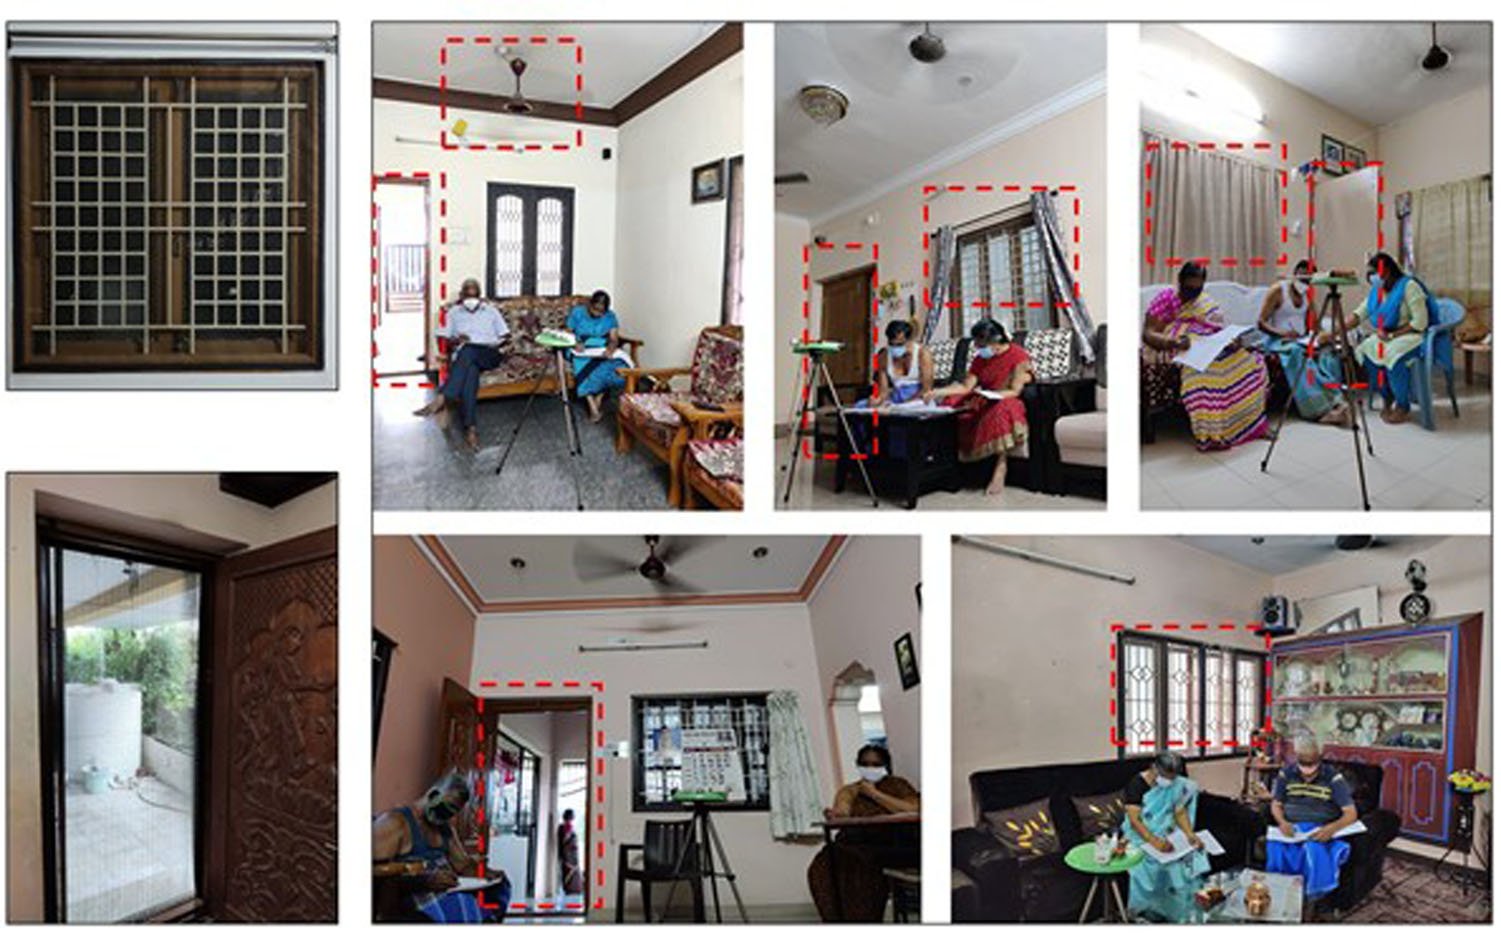 Figure 5
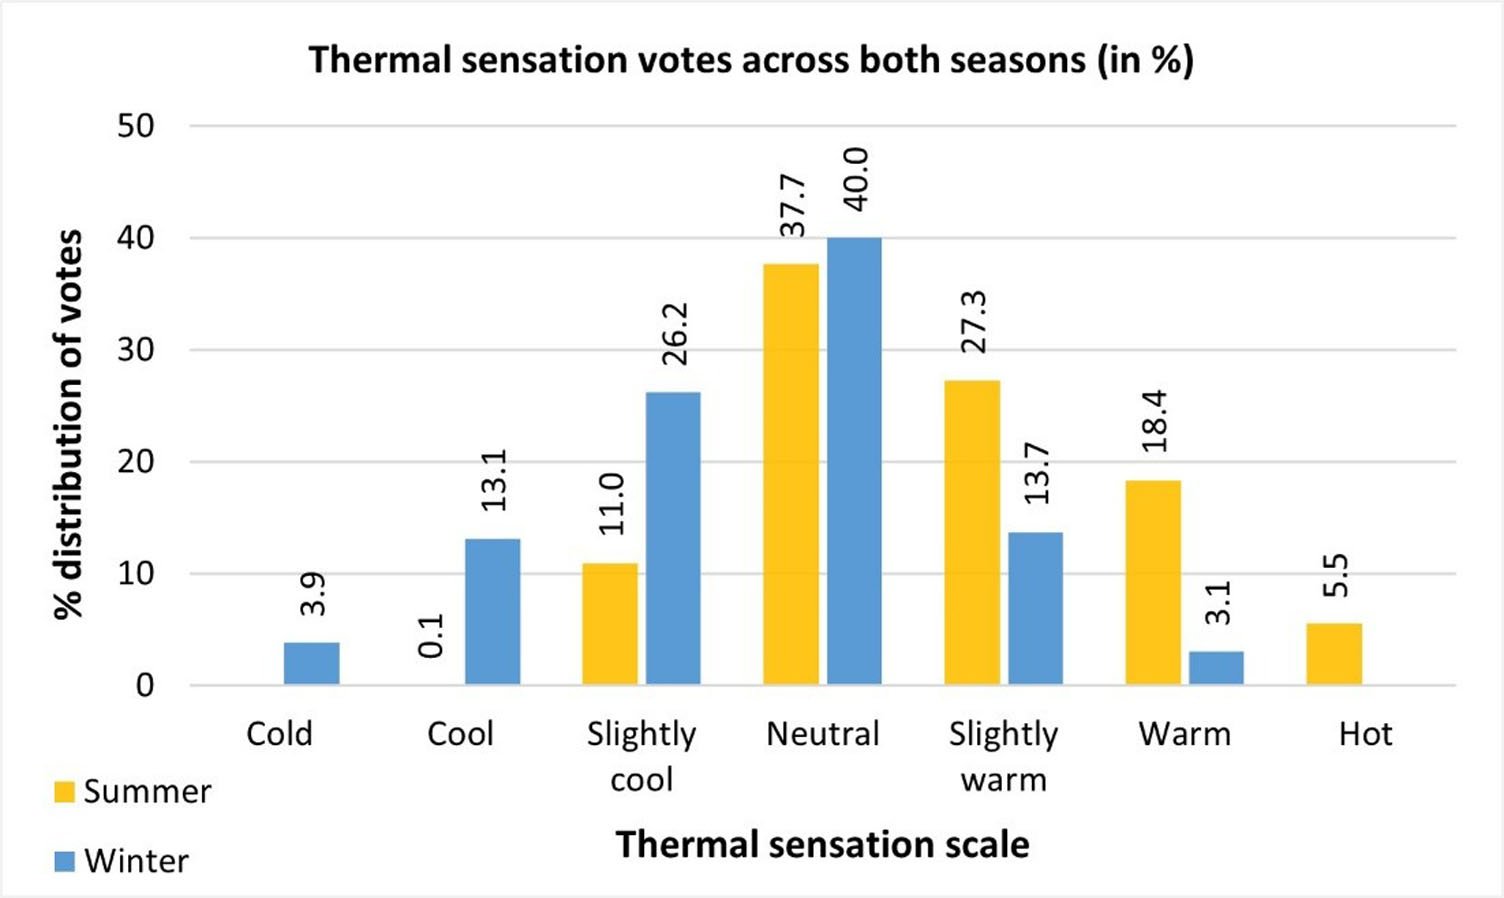 Figure 6
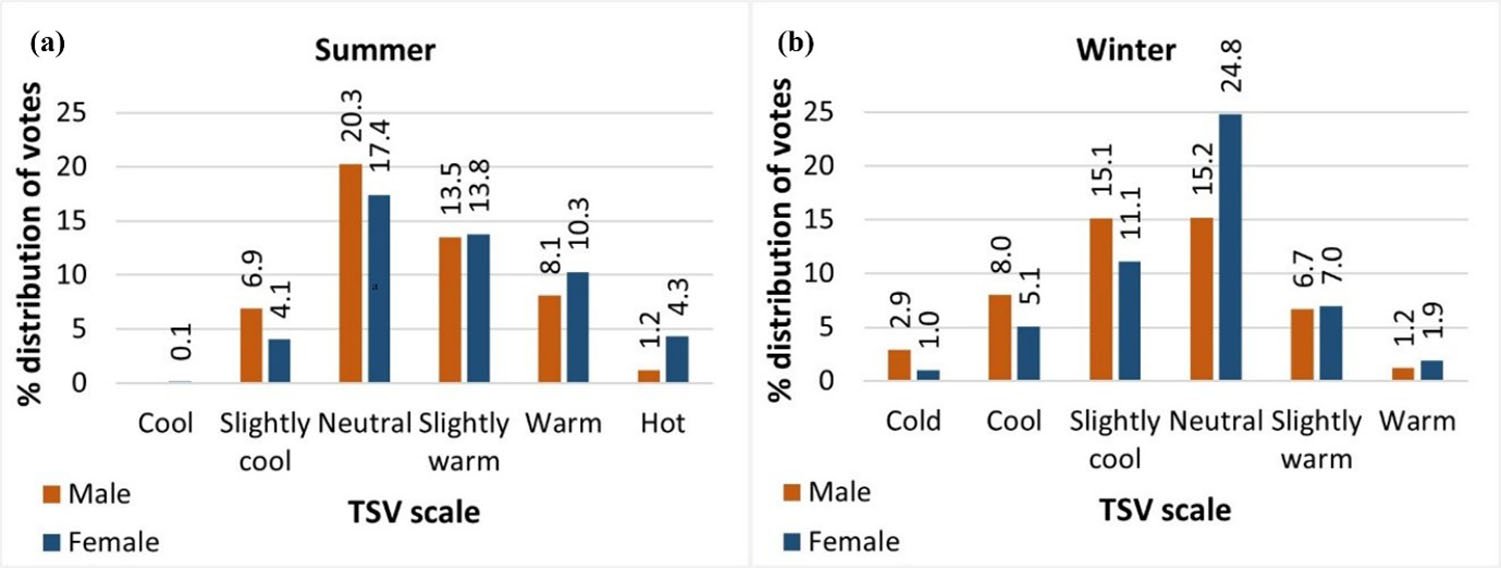 Figure 7
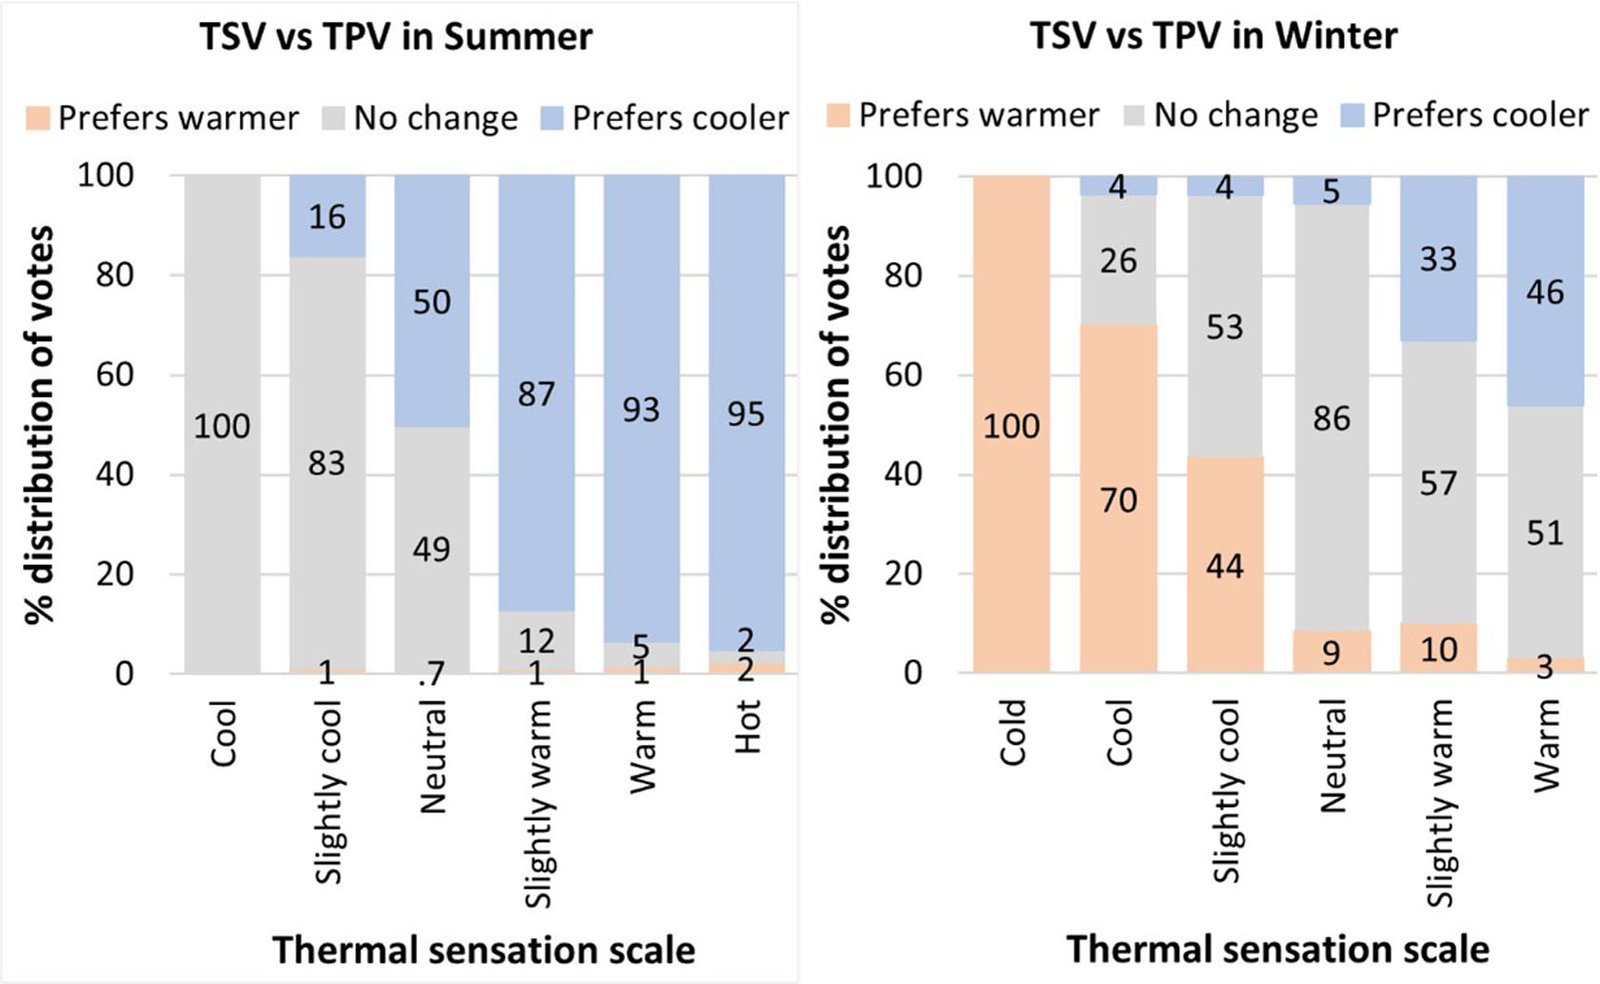 Figure 8
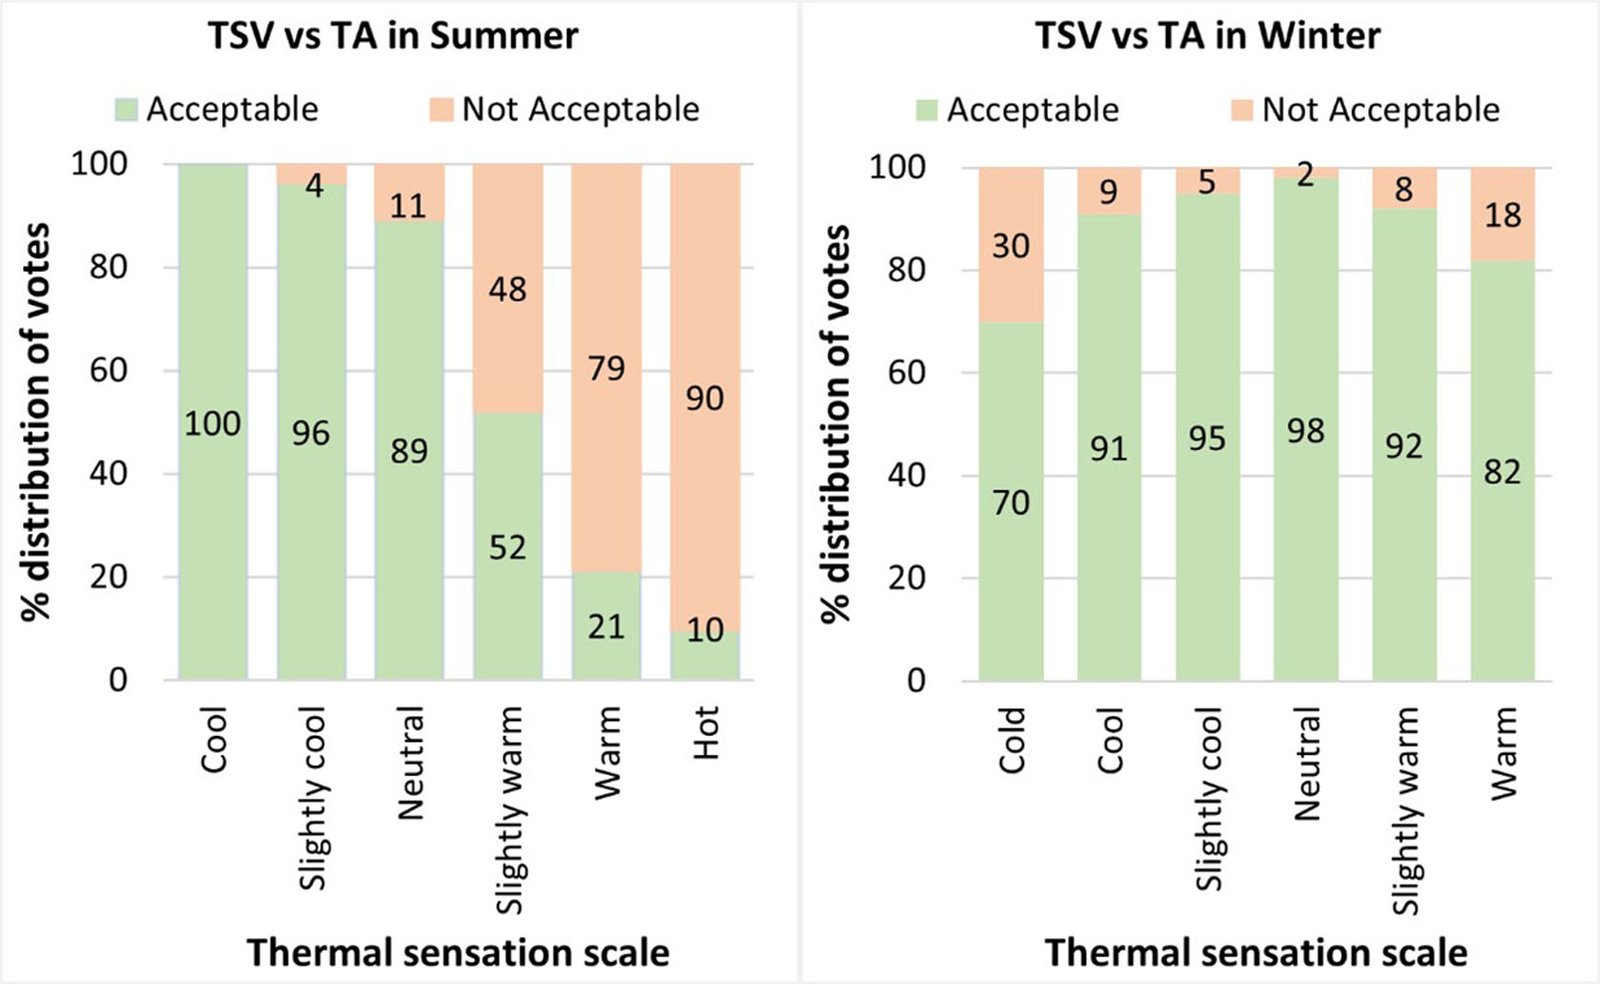 Figure 9
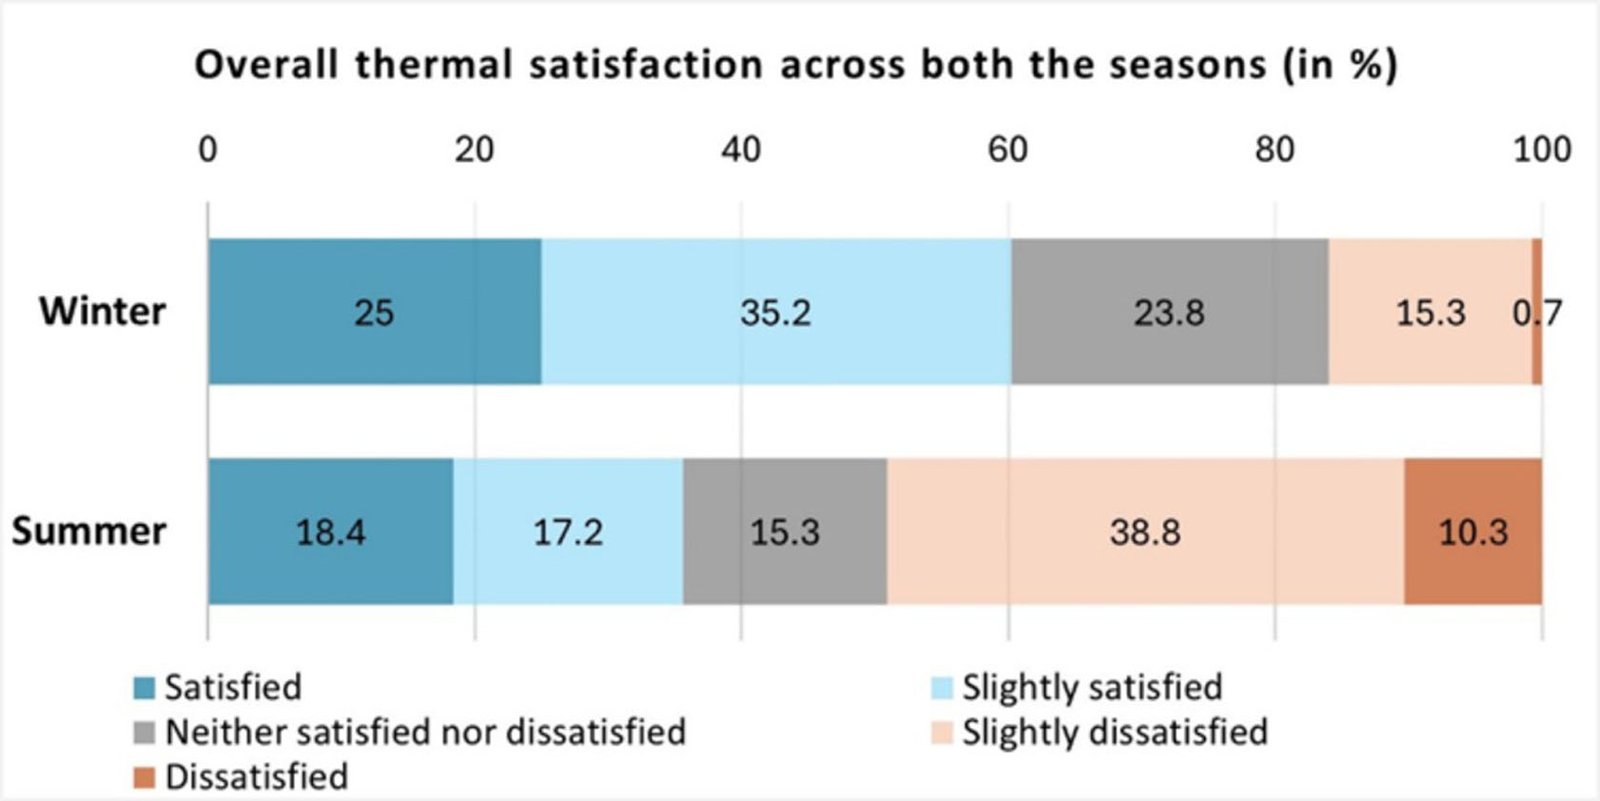 Figure 10
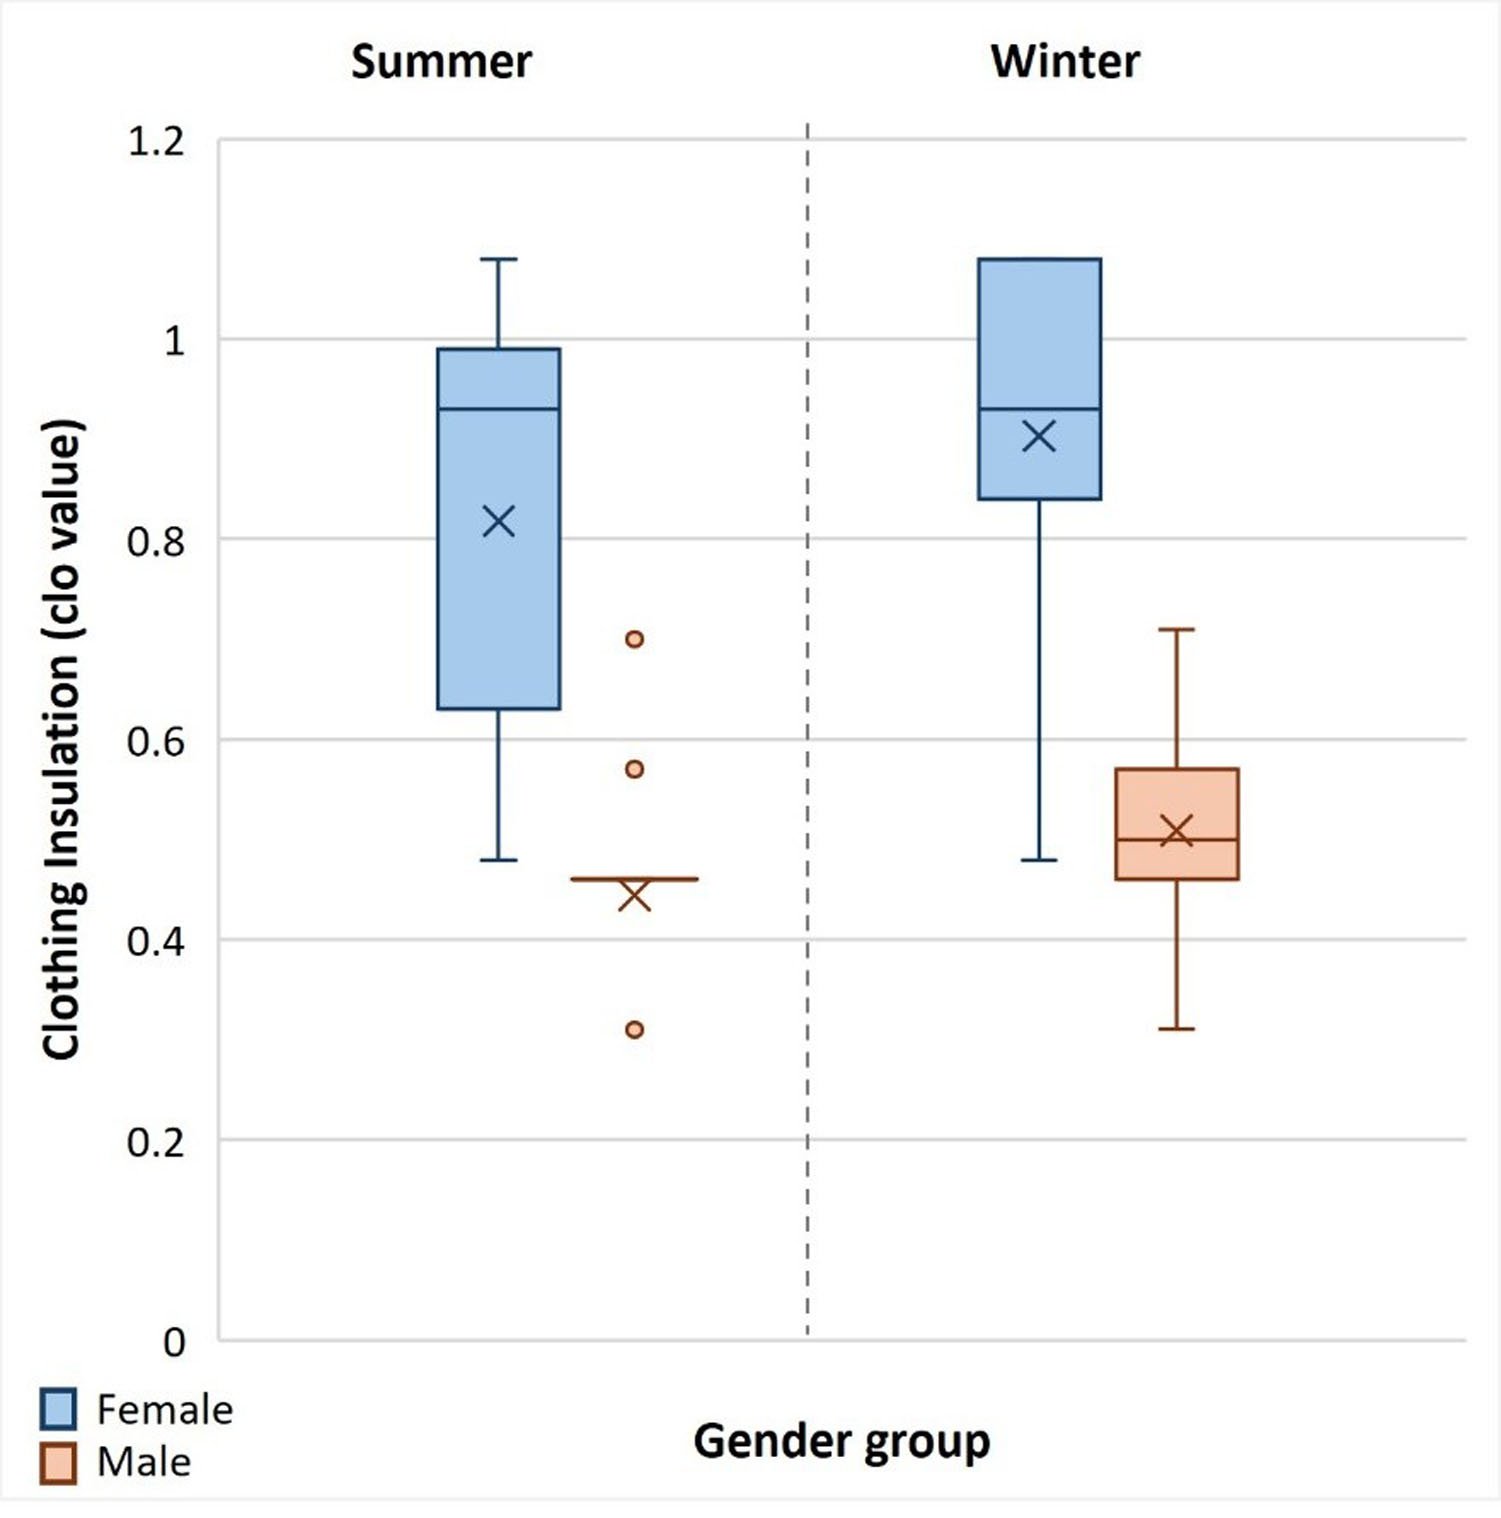 Figure 11
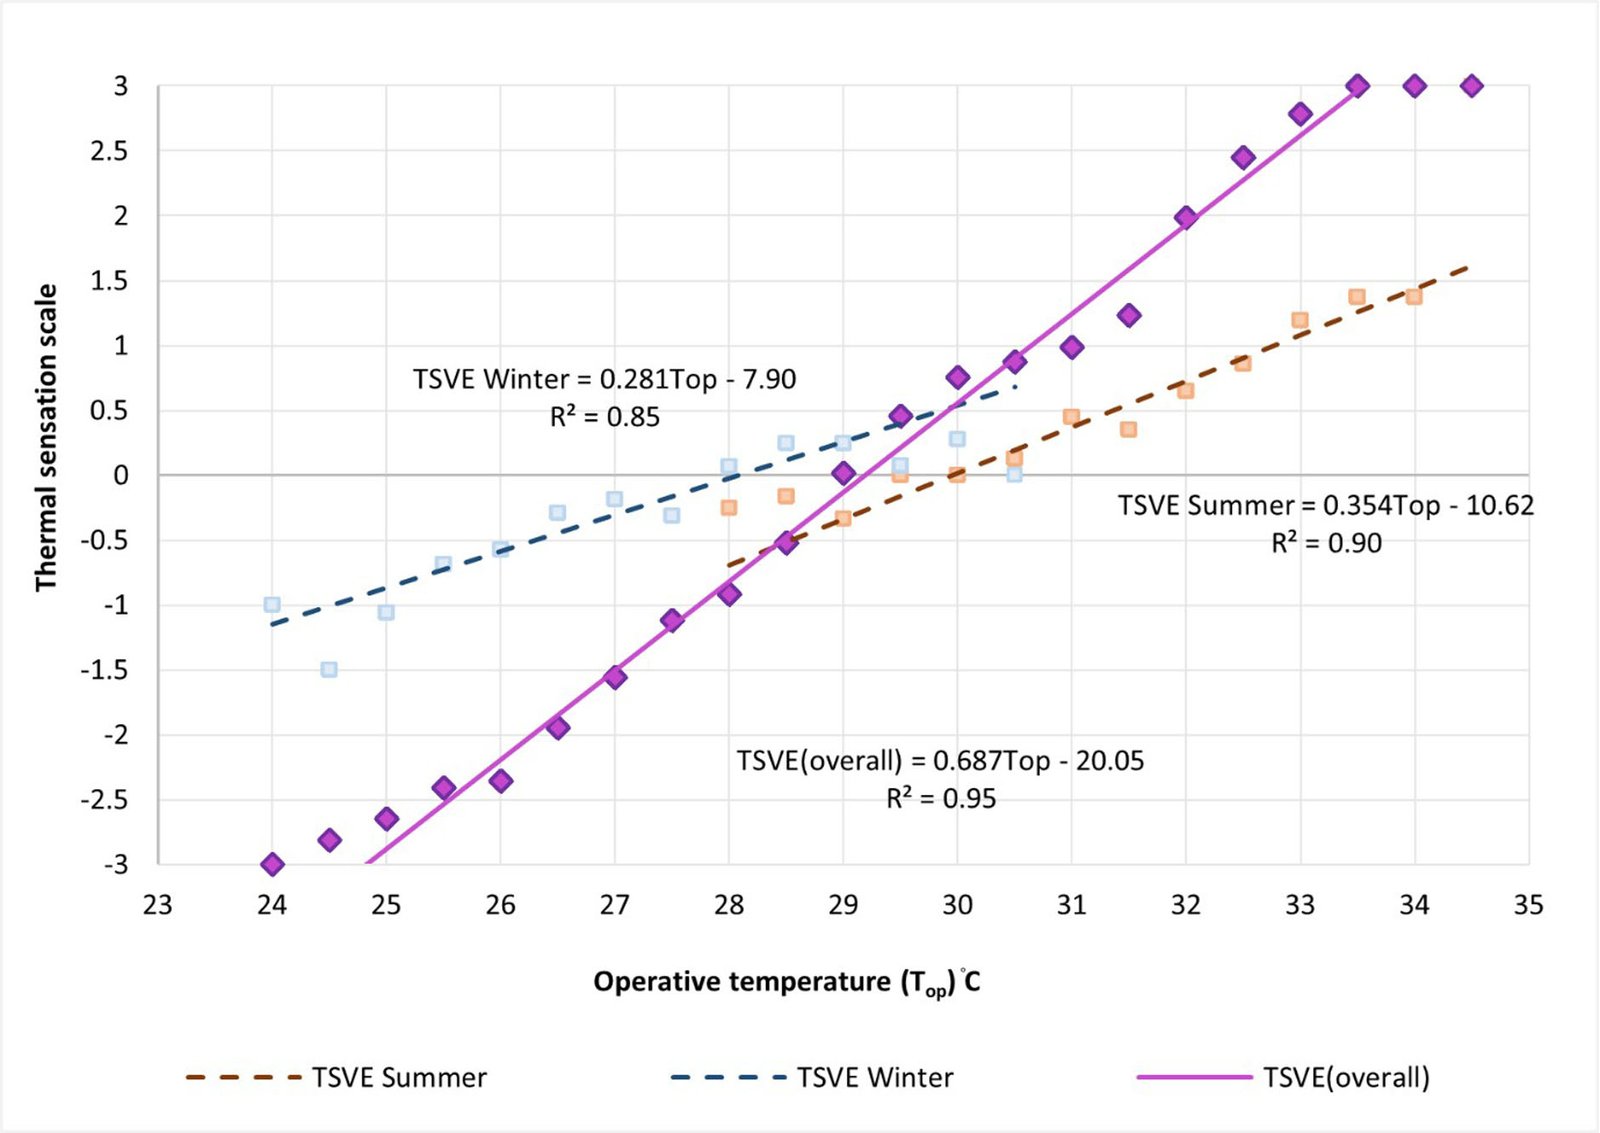 Figure 12
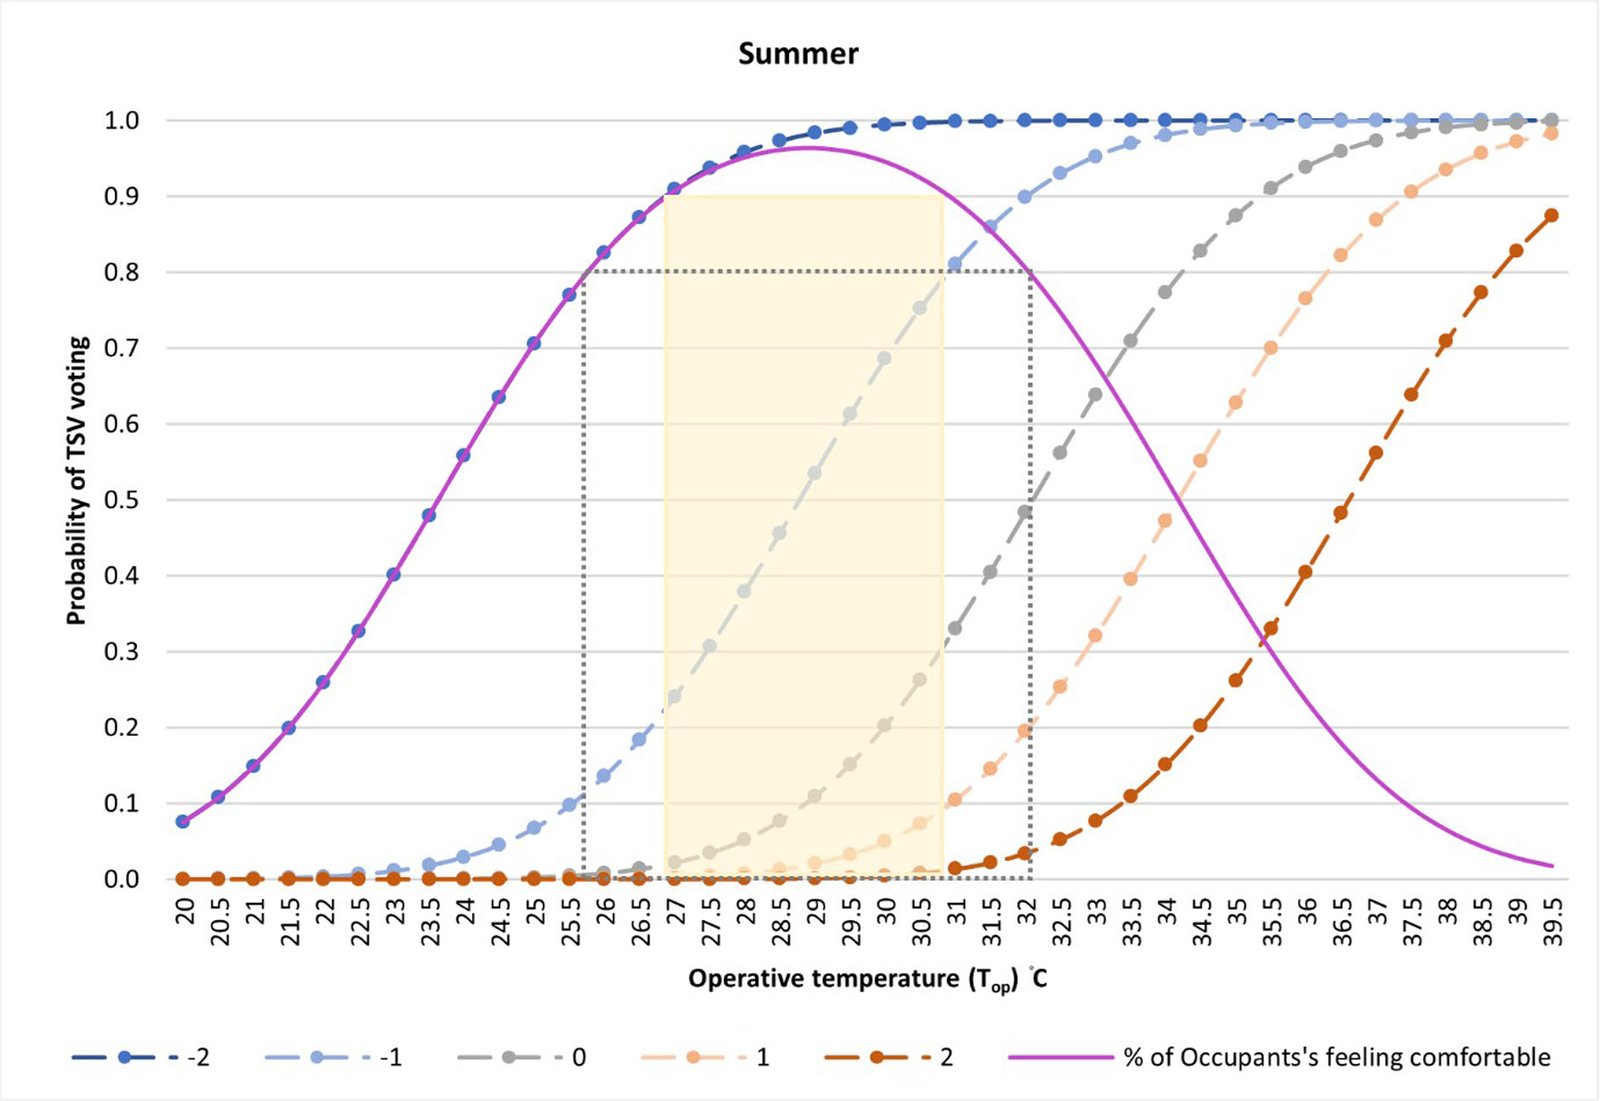 Figure 13
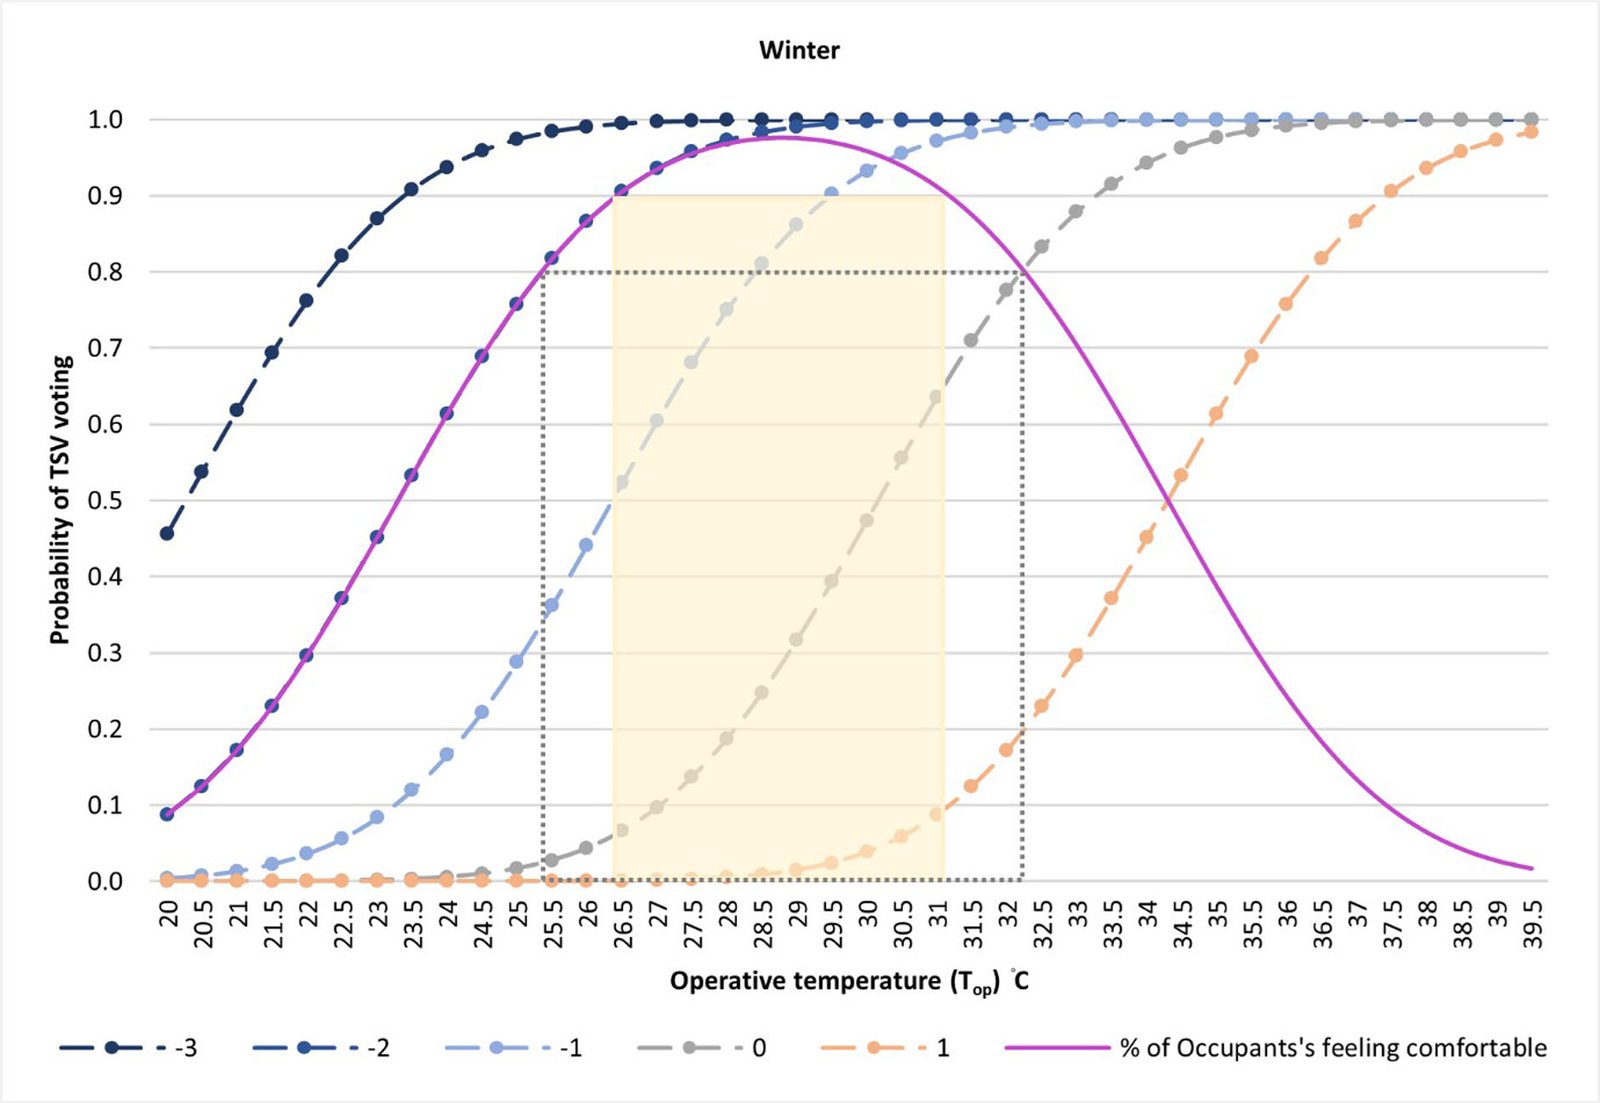 Figure 14
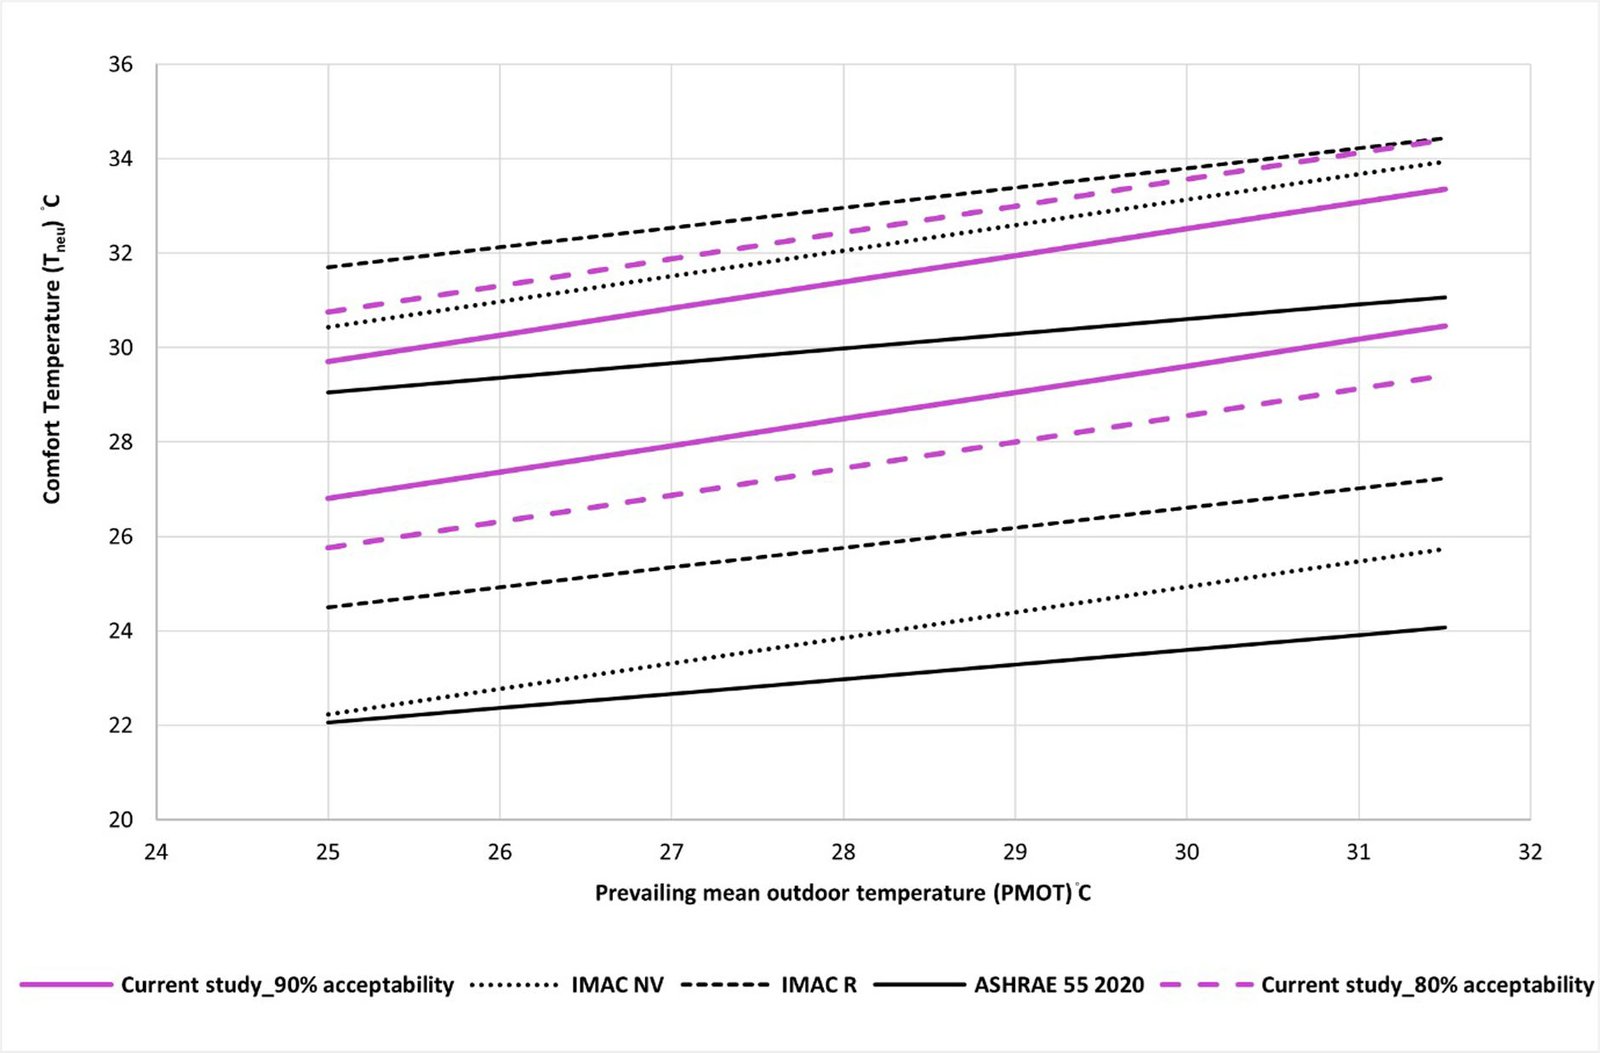 Figure 15
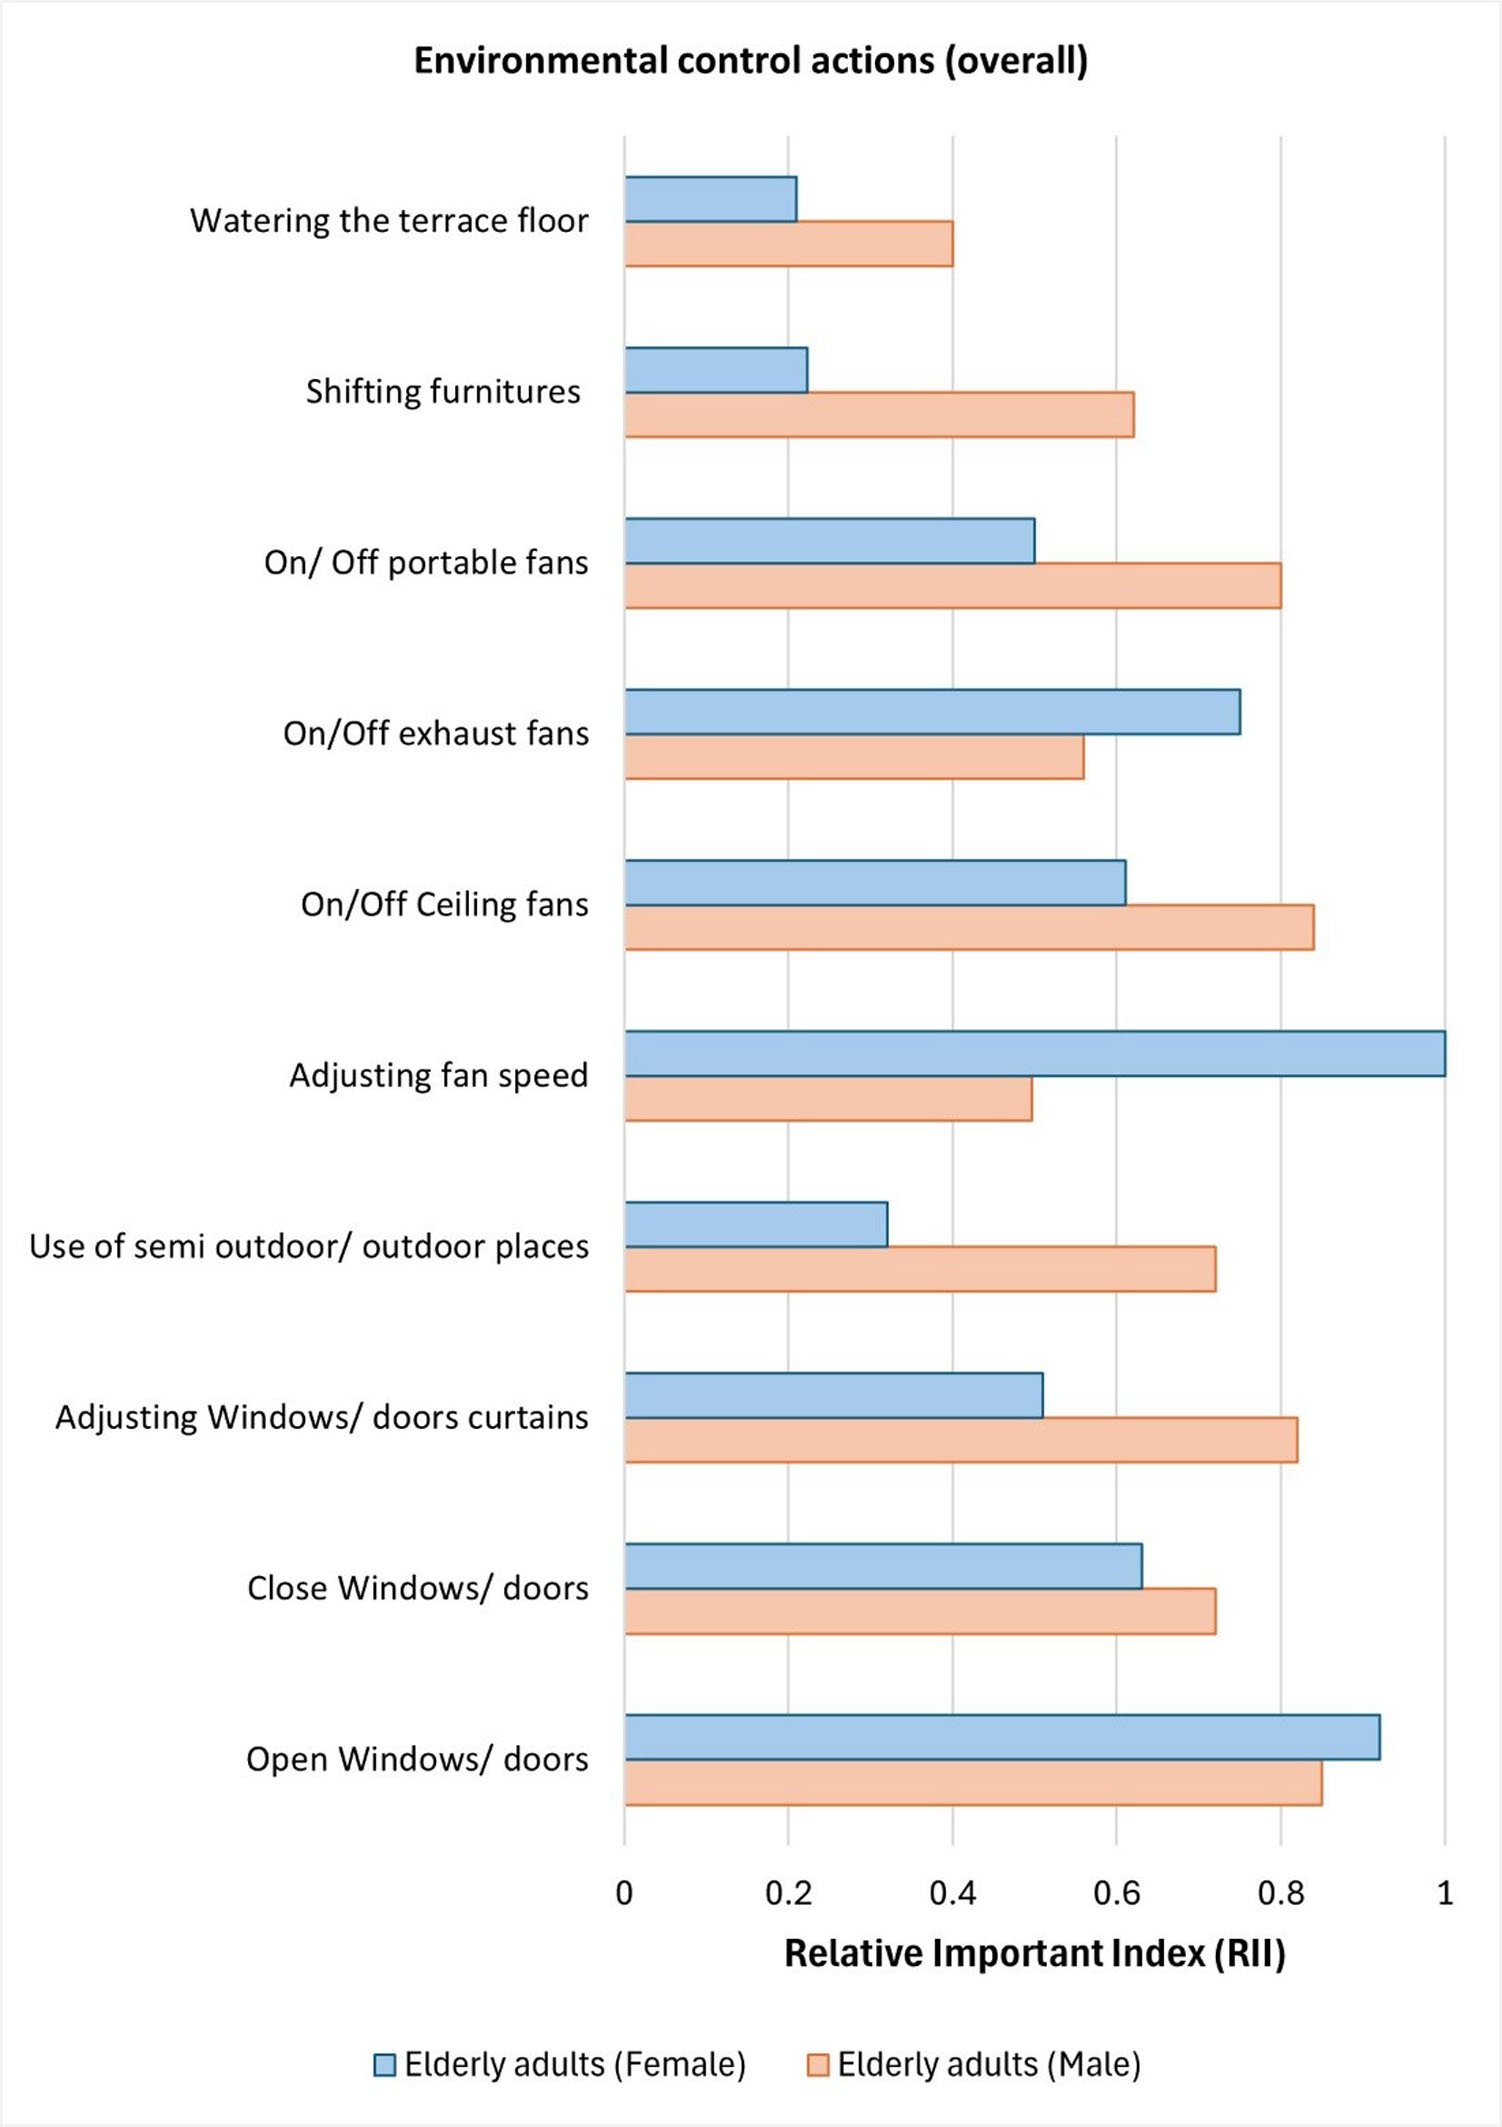 Figure 16
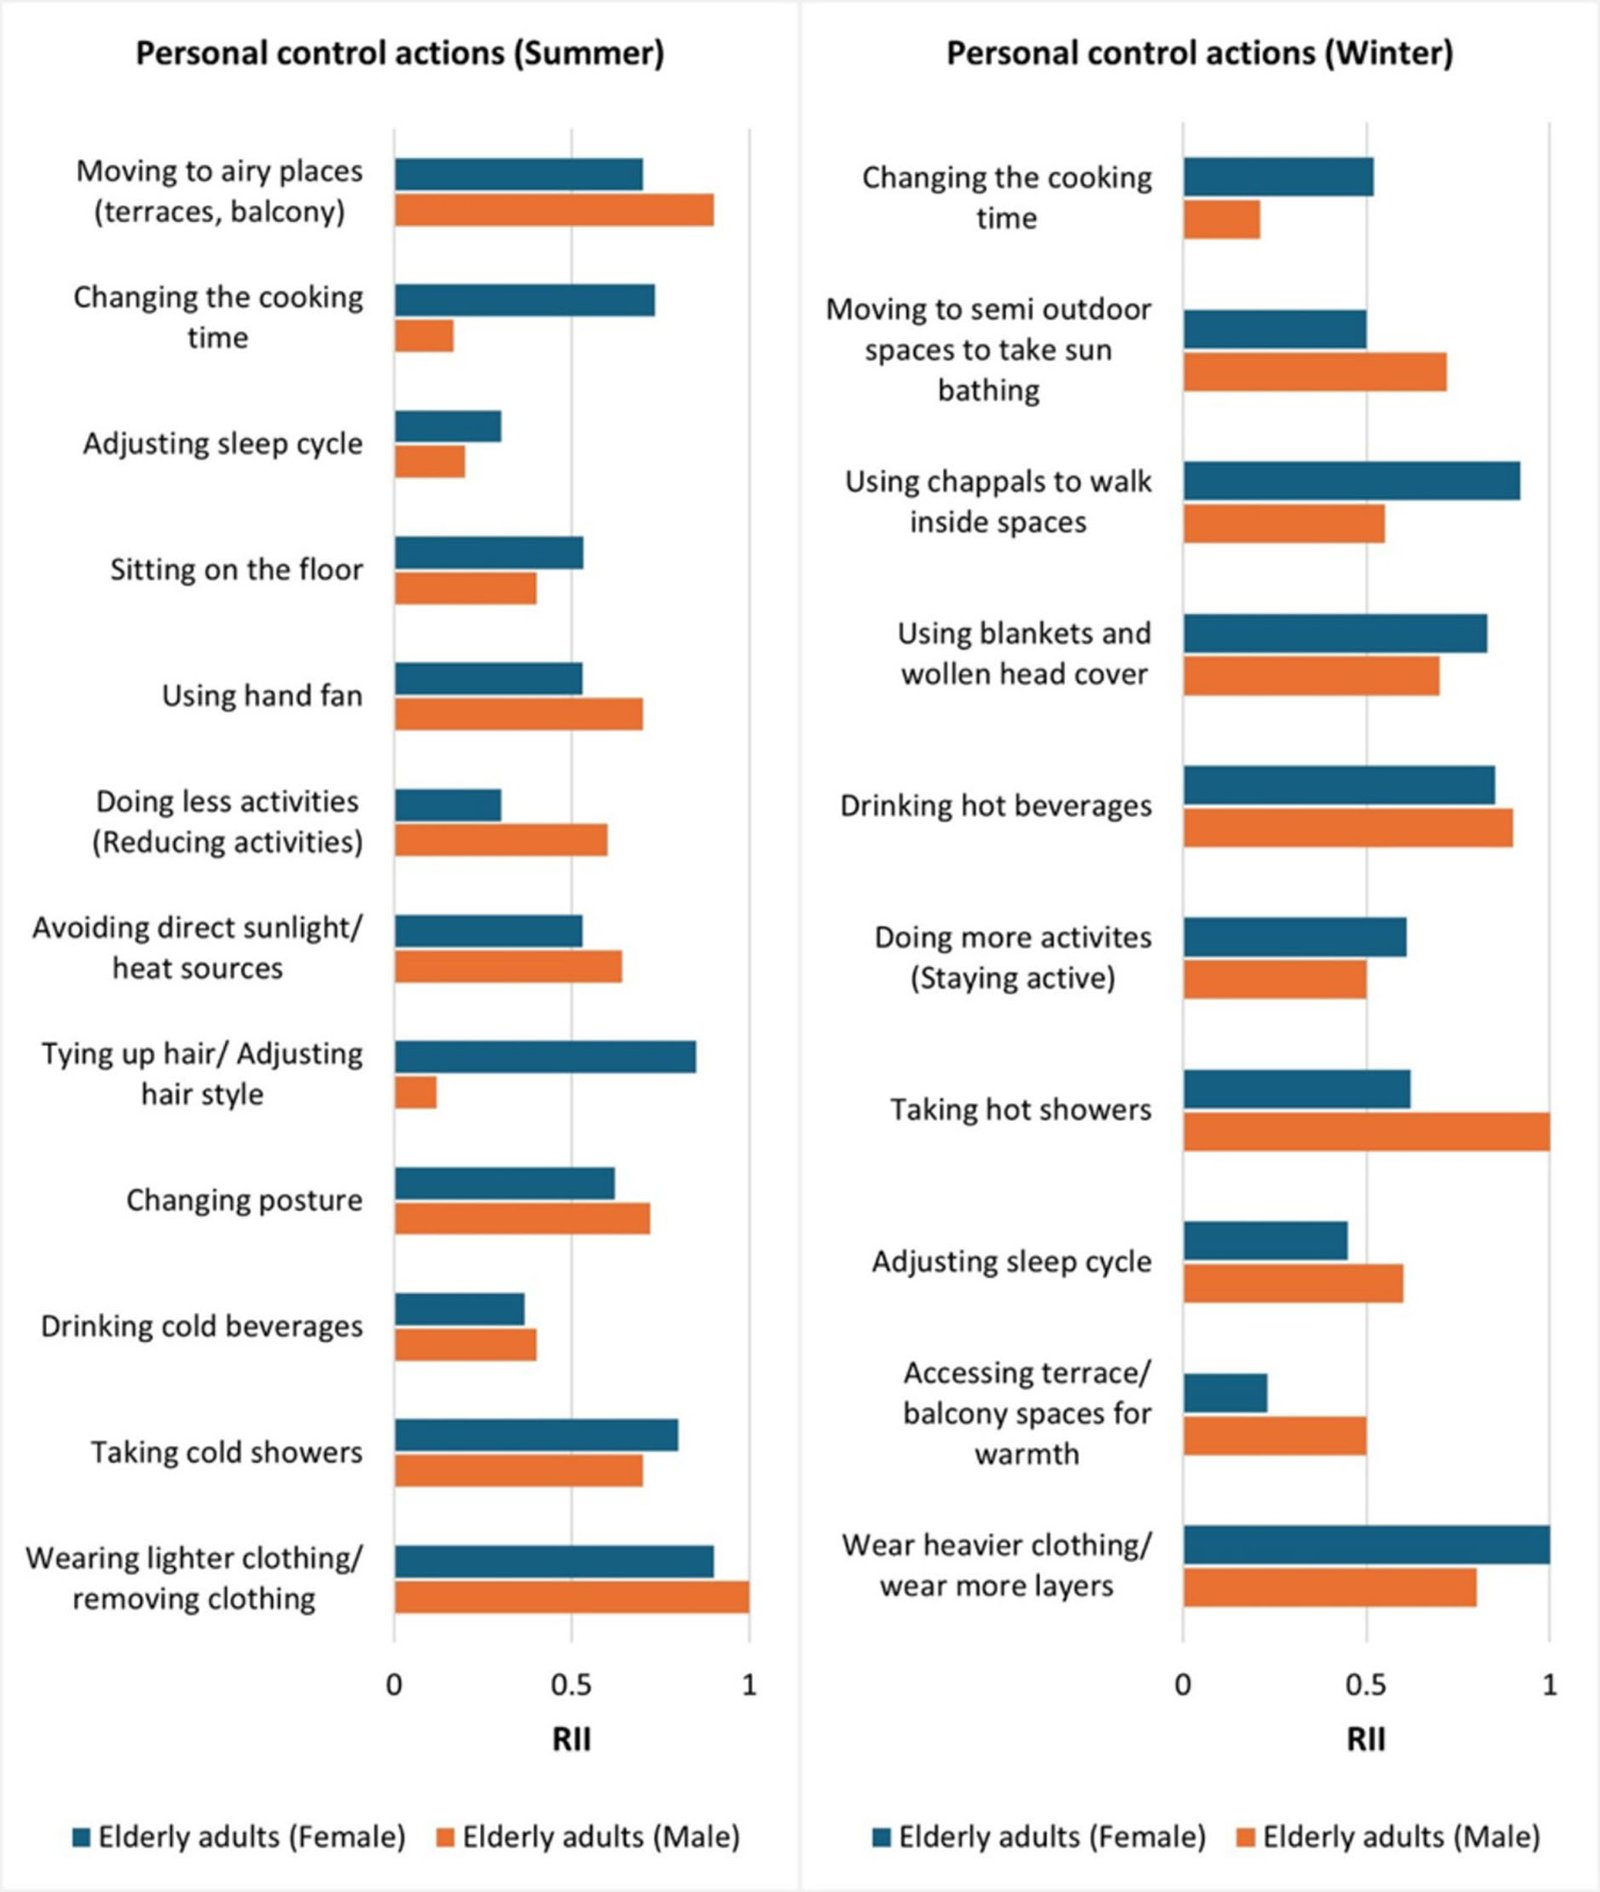 Figure 17
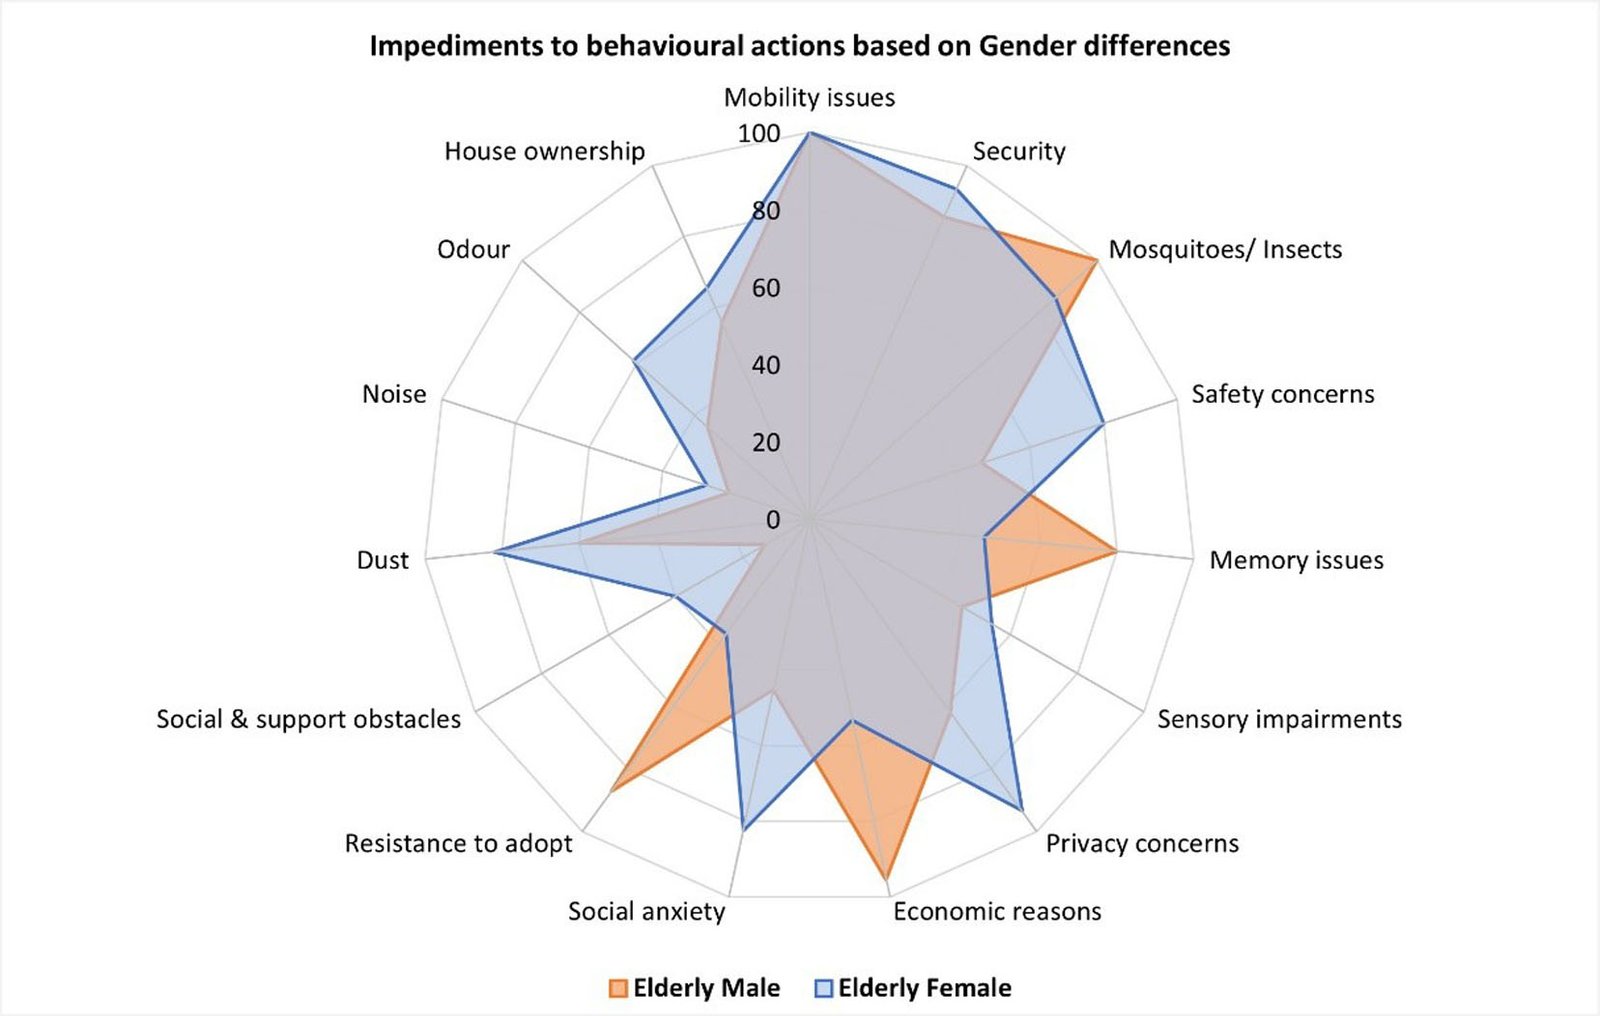 Figure 18
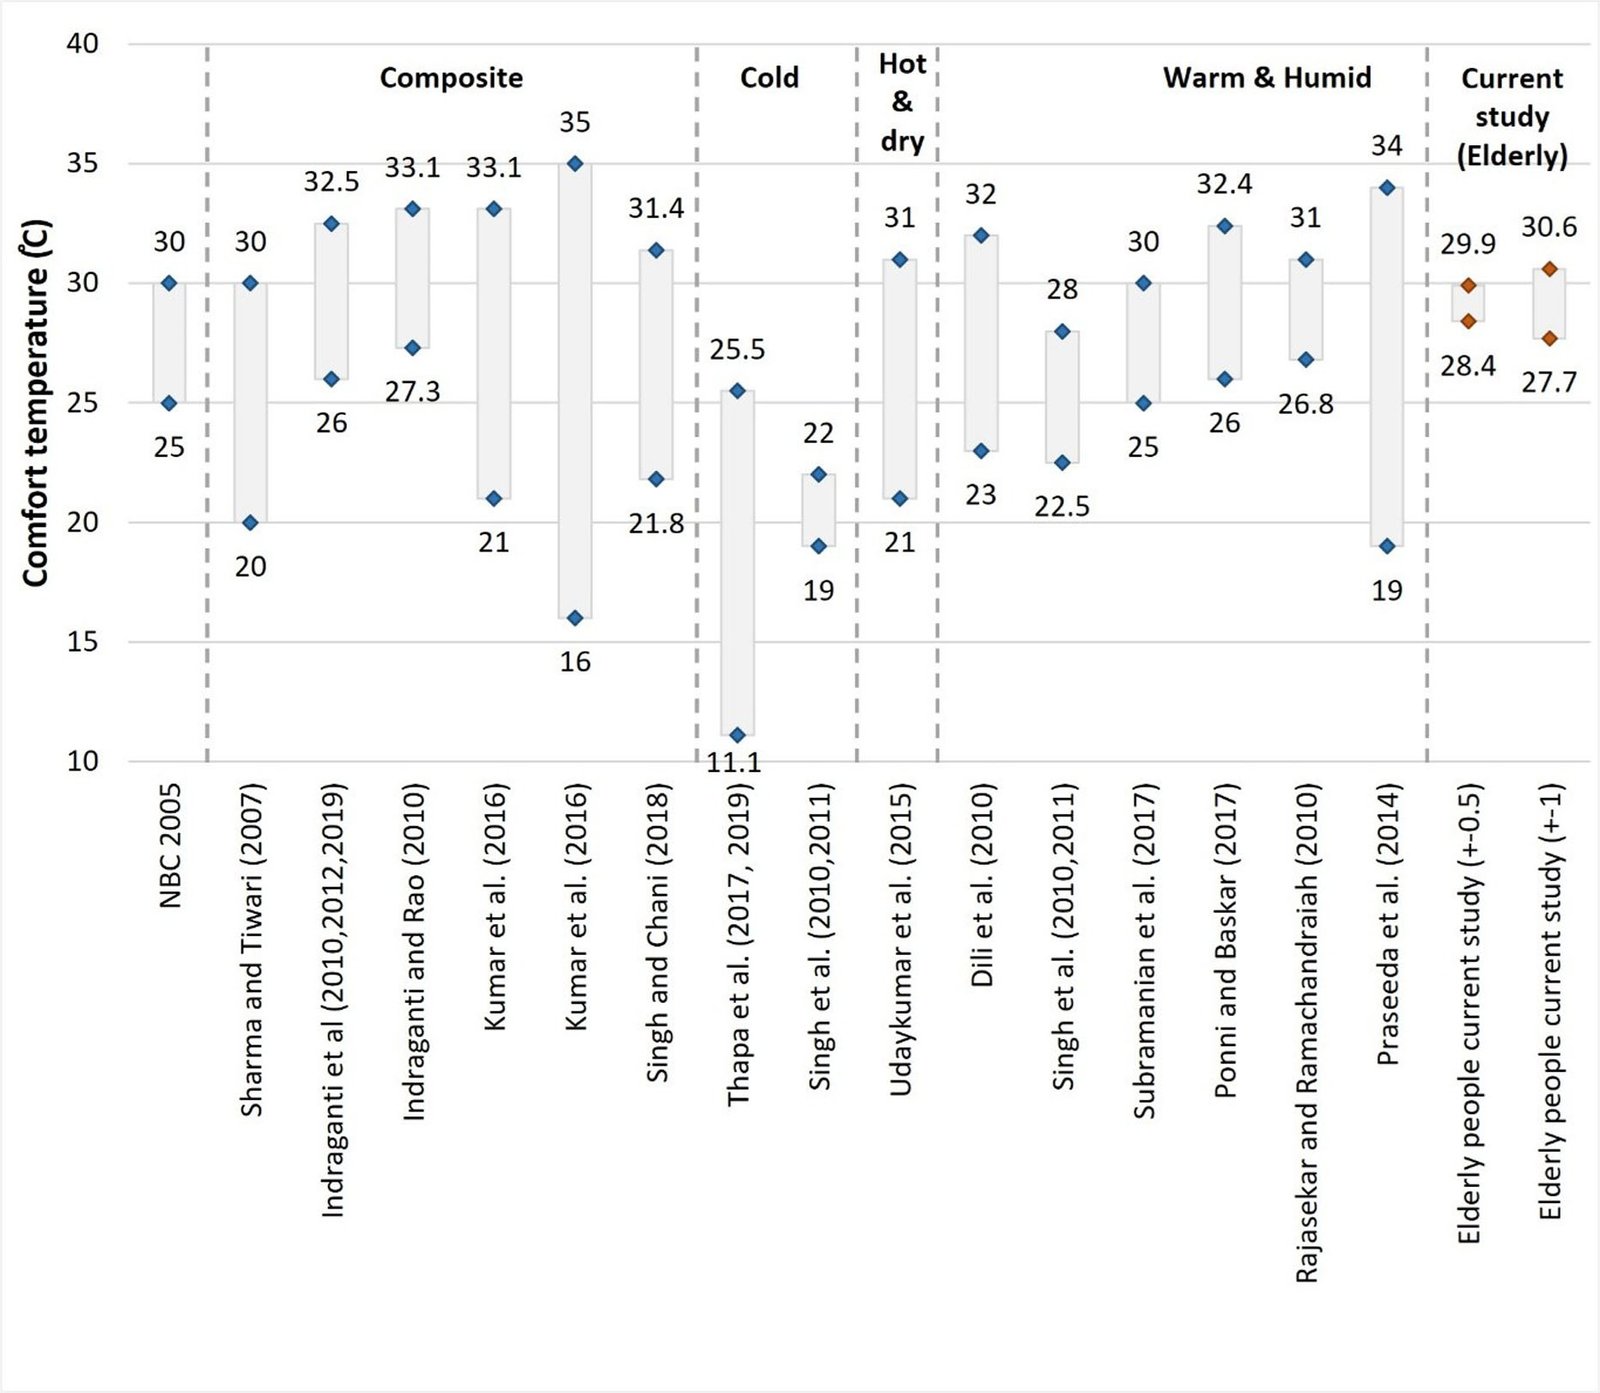 Figure 19
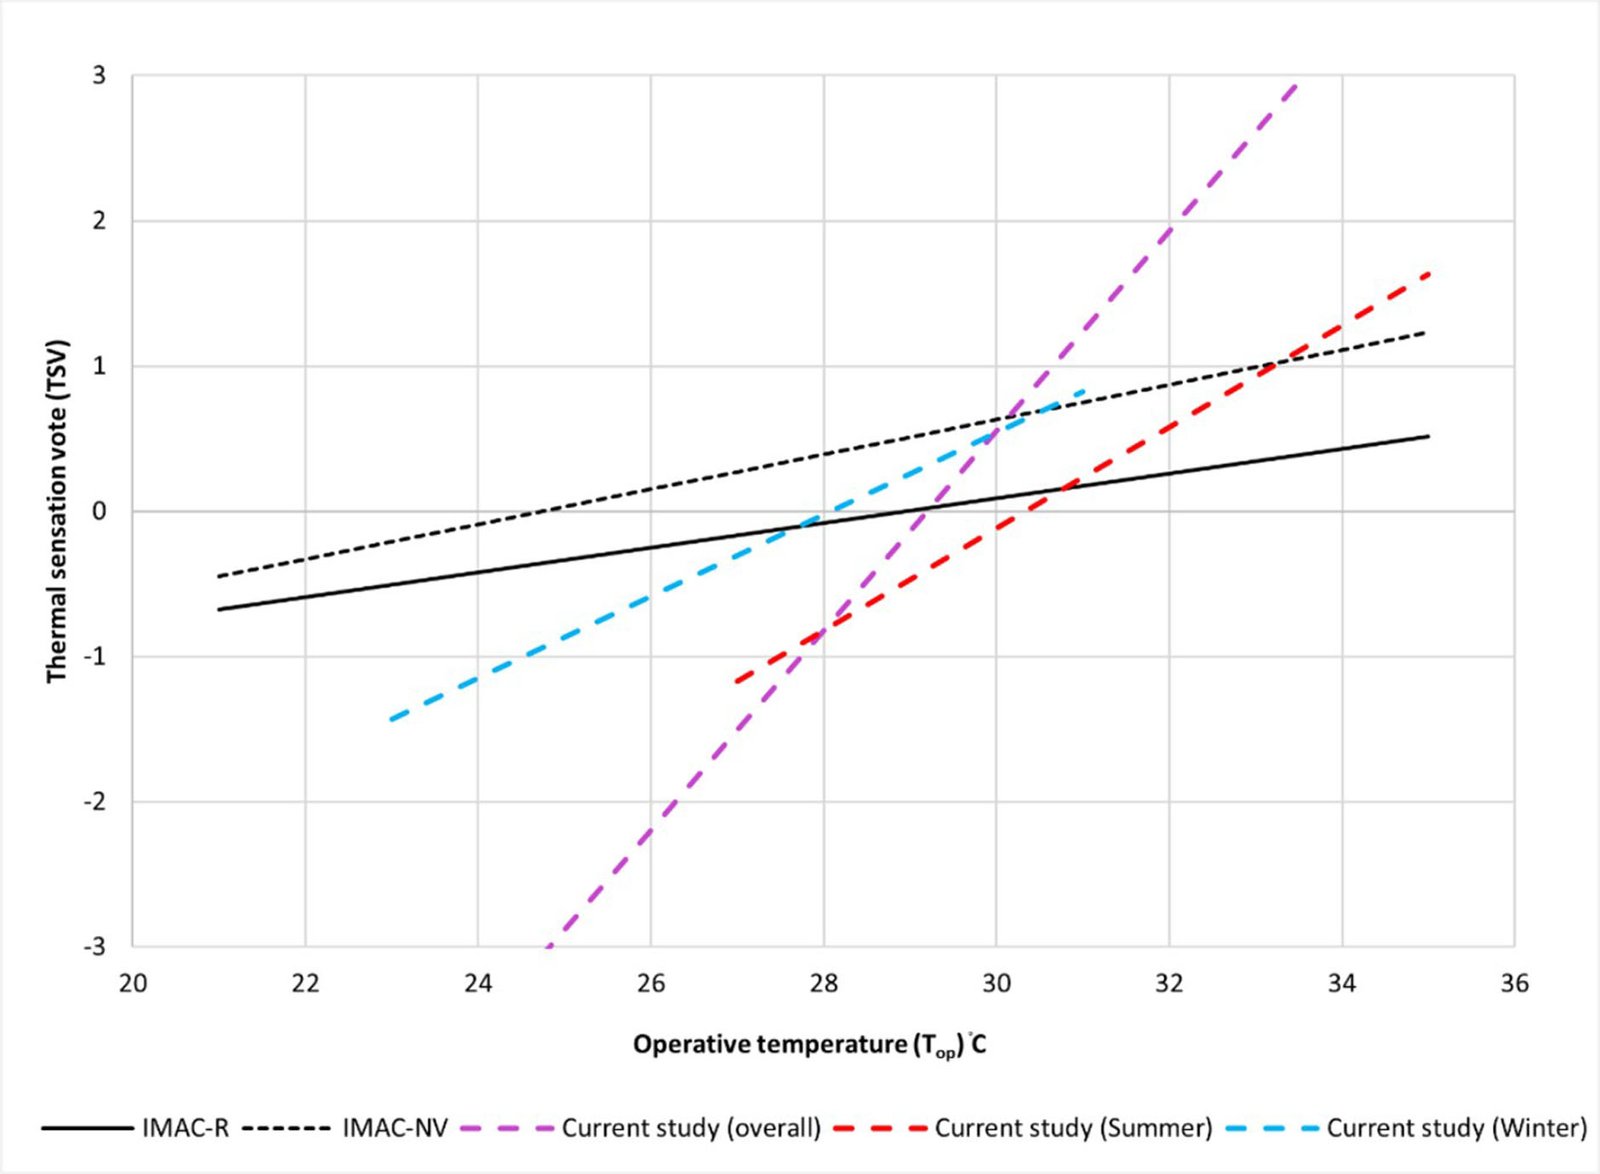 Figure 20
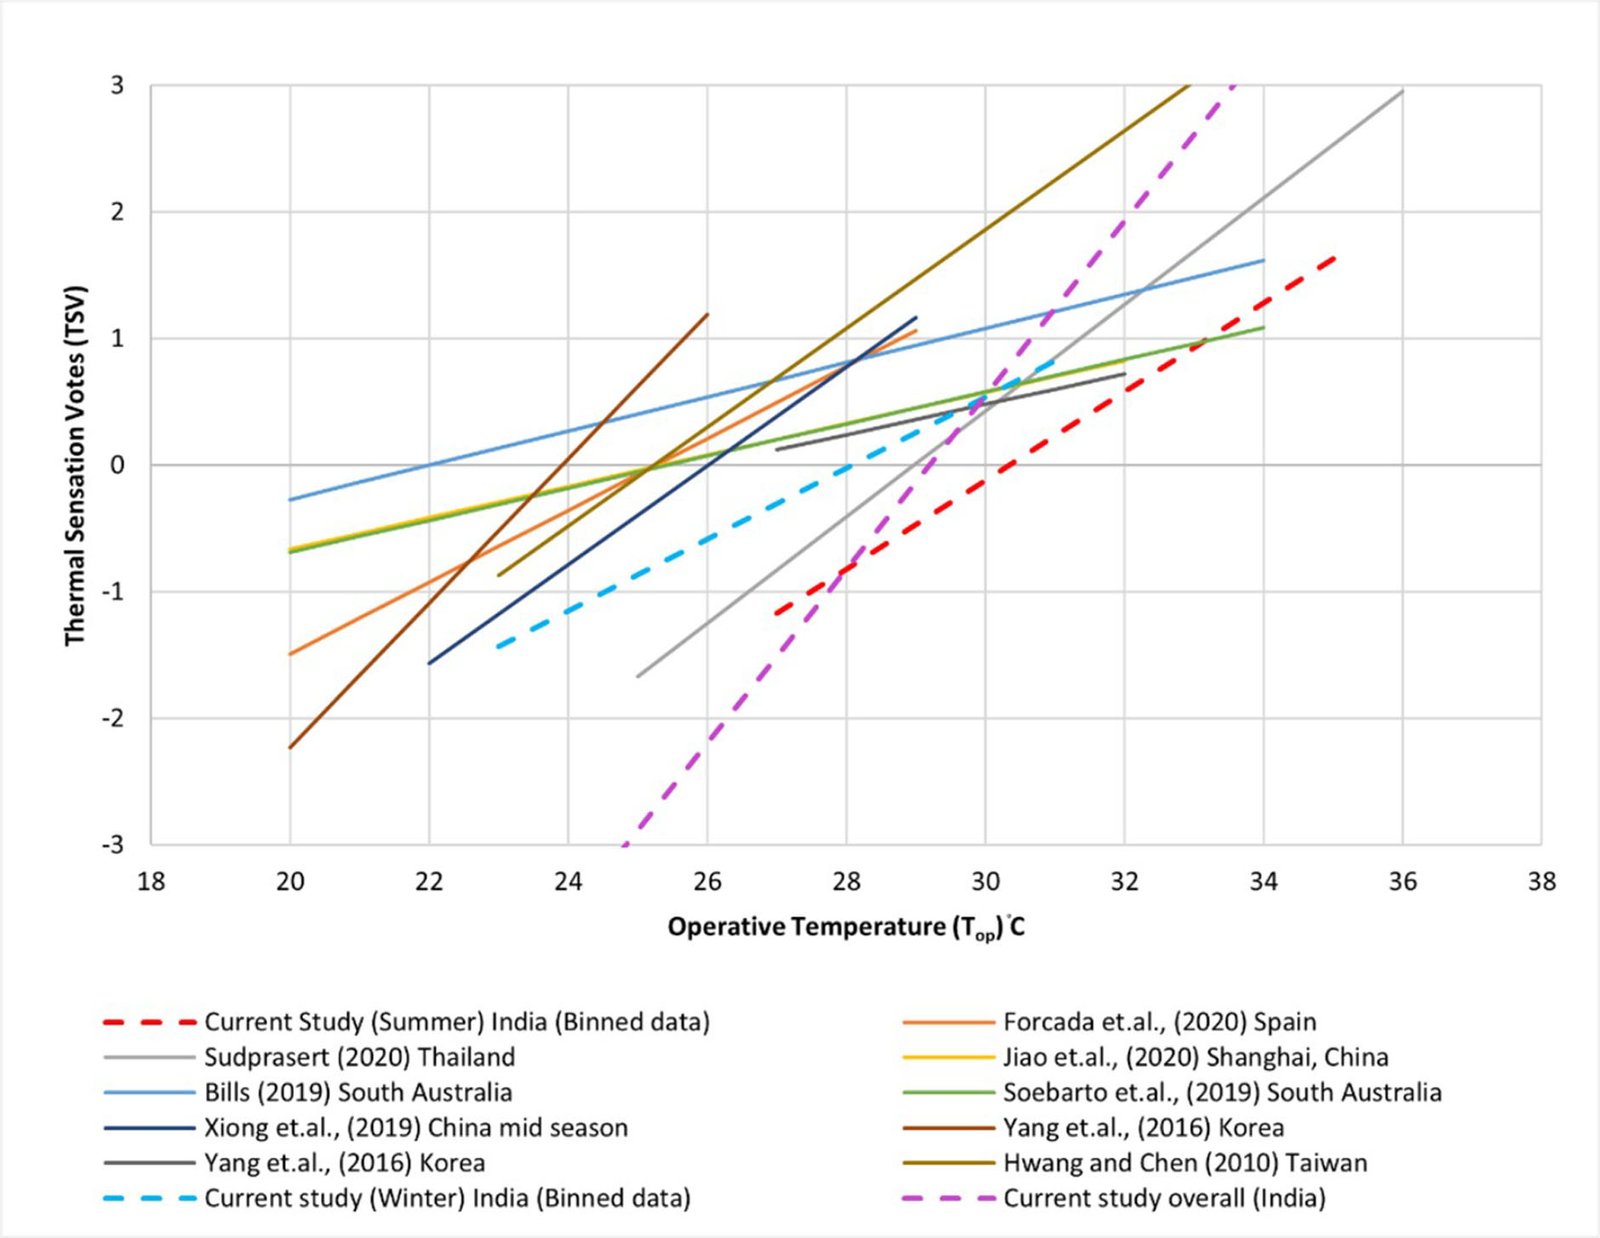 Figure 21
 Table 1
 Table 2
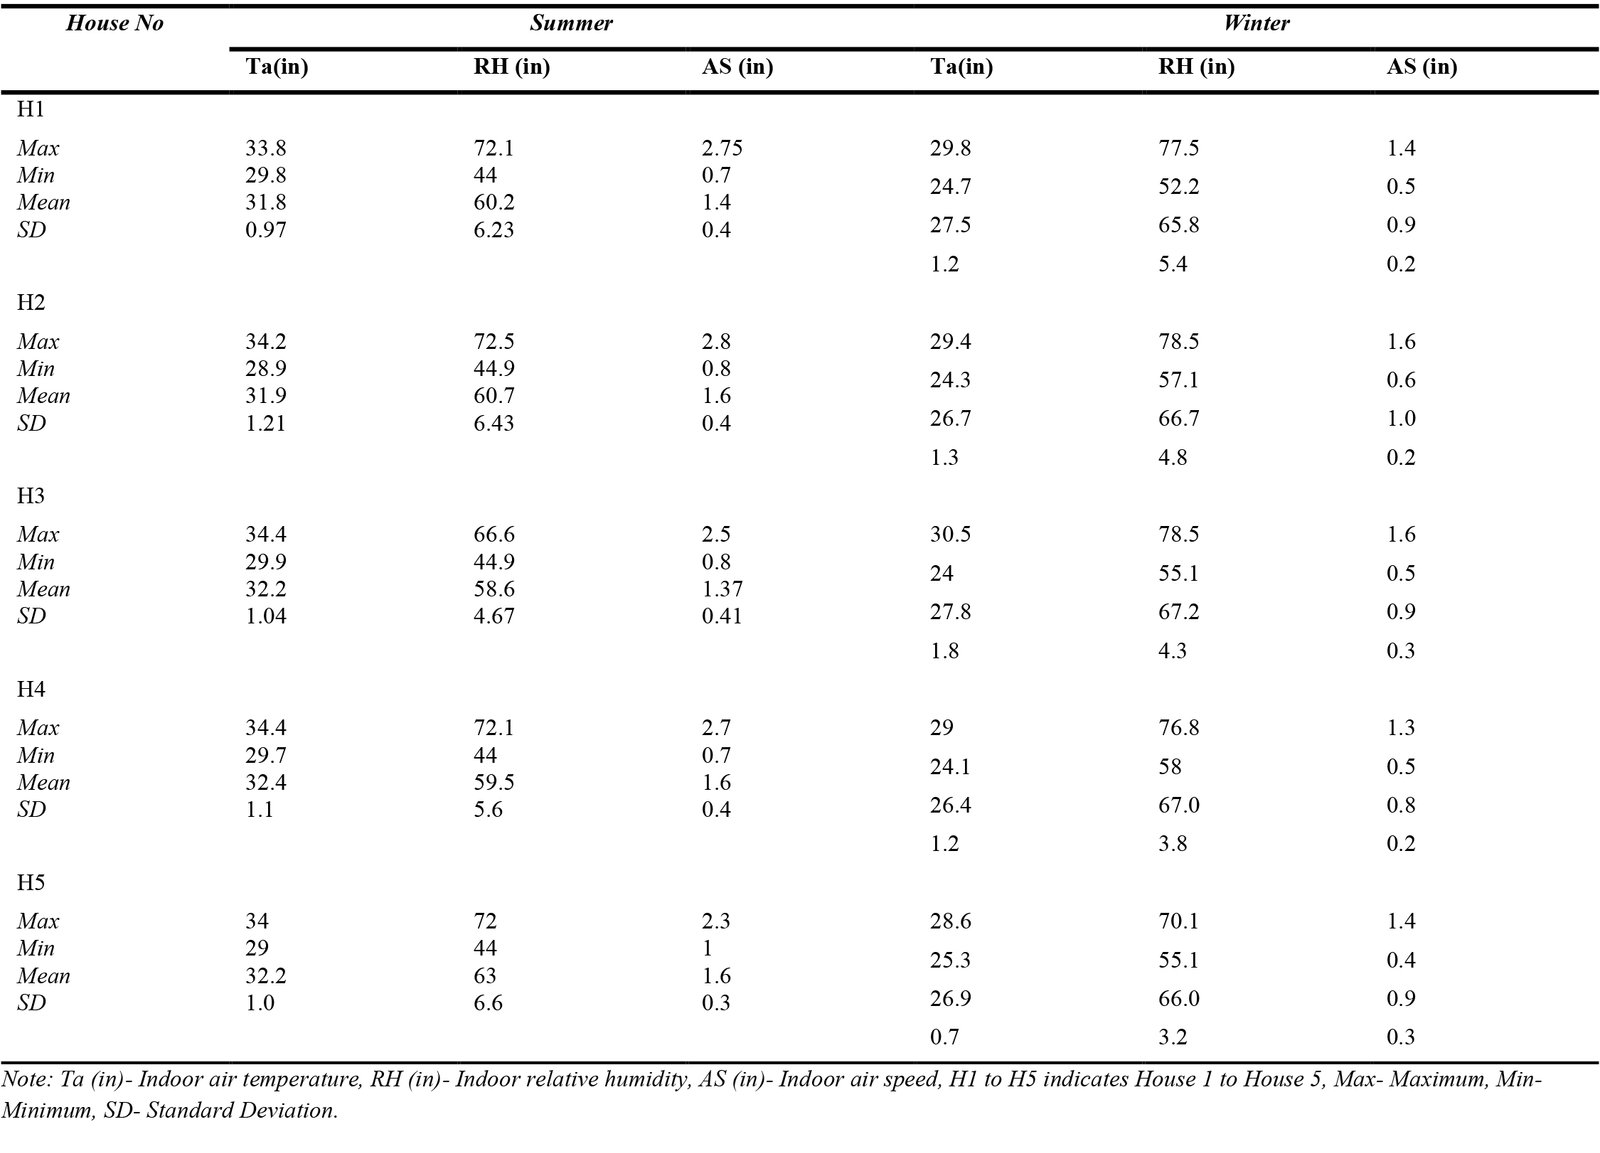 Table 3
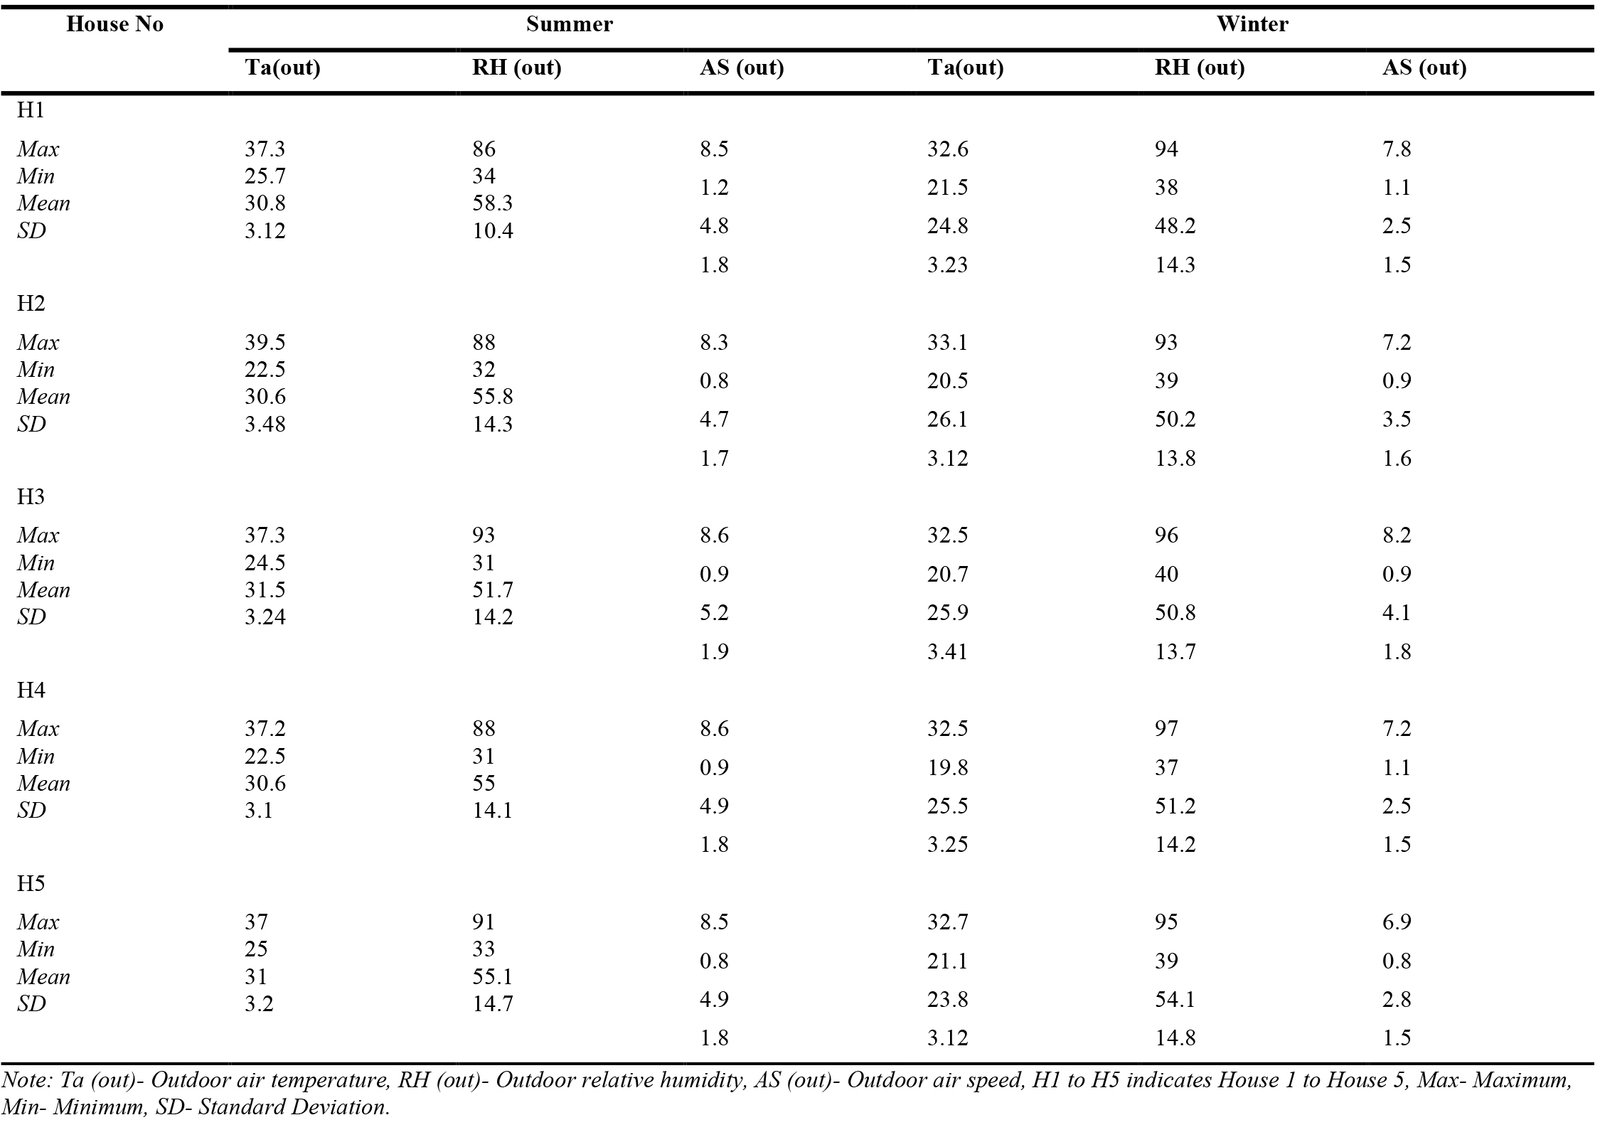 Table 4
 Table 5
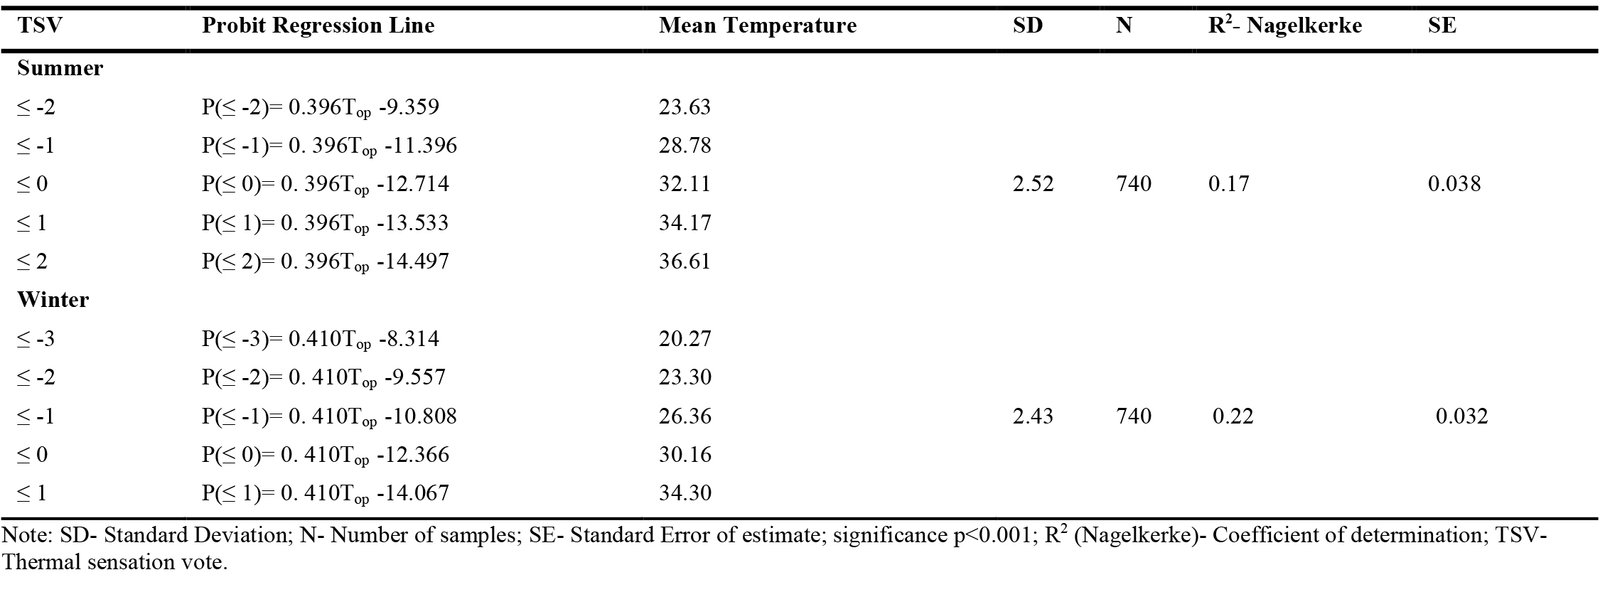 Table 6


