Volume 12 Issue 2 pp. 343-358 • doi: 10.15627/jd.2025.22
Enhancing Year-Round Thermal Comfort with Solar Control Films: A Solar-Adjusted and Spatial Assessment Considering Adaptive Clothing Behavior
Maureen De Gastines,* Darío Jaime, Andrea E. Pattini
Author affiliations
Instituto de Ambiente, Hábitat y Energía (INAHE) – Centro Científico Tecnológico Mendoza – Consejo Nacional de Investigaciones Científicas y Técnicas (CONICET) – A. Ruiz Leal s/n, 5500 Mendoza, Argentina
*Corresponding author.
mdegastines@mendoza-conicet.gob.ar (M. De Gastines)
djaime@mendoza-conicet.gob.ar (D. Jaime)
apattini@mendoza-conicet.gob.ar (A. E. Pattini)
History: Received 3 April 2025 | Revised 11 June 2025 | Accepted 26 June 2025 | Published online 24 August 2025
2383-8701/© 2025 The Author(s). Published by solarlits.com. This is an open access article distributed under the terms and conditions of the Creative Commons Attribution 4.0 License.
Citation: Maureen De Gastines, Darío Jaime, Andrea E. Pattini, Enhancing Year-Round Thermal Comfort with Solar Control Films: A Solar-Adjusted and Spatial Assessment Considering Adaptive Clothing Behavior, Journal of Daylighting, 12:2 (2025) 343-358. doi: 10.15627/jd.2025.22
Figures and tables
Abstract
Windows significantly contribute to thermal discomfort in high solar irradiance climates by allowing excessive heat gains and uneven indoor temperatures. This study introduces a solar-adjusted analytical framework for evaluating year-round indoor thermal comfort, integrating dynamic shortwave solar radiation effects, spatial zoning, and occupant behavior into comfort assessments. The methodology employs the Predicted Mean Vote adjusted via the SolarCal model and long-term comfort metrics to evaluate the effectiveness of Solar Control Films (SCFs) across twelve orientations at 30º intervals, in a cold arid (BWk) climate. Results demonstrate that absorbing SCFs with solar transmittance values between 0.22 and 0.40 reduce heat-related discomfort by 70–90% on average across all orientations, while the reflective film completely eliminates heat-related discomfort under all studied conditions. Although SCFs increase cold discomfort hours, the overall impact remains beneficial. Integrating hourly clothing adjustments into the framework reduces predicted warm discomfort by more than half and cold discomfort by 28% on average, offering a more realistic evaluation of occupant experience. Importantly, the choice of metric influences performance rankings: for average Thermal Comfort Availability (TCAmean), the reflective film excels in north, northwest, and west orientations, while absorbing films perform best in east and northeast. For time Thermal Comfort Usability (tTCU10-90), the reflective film outperforms other options across most orientations, doubling hours with 90% of the space in comfort conditions in north and northeast orientations, where heat discomfort is most critical. SCFs also reduce overheating near windows and homogenize thermal comfort across spaces, enabling optimized HVAC operation. This work highlights the potential of integrating solar radiation impacts and dynamic, spatially resolved metrics into thermal comfort assessments, providing insights for retrofitting strategies and climate-responsive design.
Keywords
low-cost retrofitting, thermal comfort indicators, adaptive behavior, solar radiation
1. Introduction
Overheating is a major concern in building design and operation, further aggravated by urban heat islands and climate change [1]. Windows play a significant role in shaping the indoor thermal environment and are often perceived as a source of dissatisfaction concerning thermal comfort [2,3]. Large glazed facades exacerbate this issue, particularly in regions with pronounced seasonal contrasts in heating and cooling demands [4]. Conventional window designs prioritize energy performance metrics for heating and cooling, yet frequently overlook solar-induced discomfort caused by direct and diffuse radiation as well as temperature fluctuations on the internal surfaces of the windows [5,6].
In the context of global warming and the growing challenge of enhancing energy efficiency in existing buildings, passive solar control strategies have gained significant importance [7,8]. Rising temperatures and increasingly extreme climate patterns underscore the need to mitigate overheating in the built environment without relying solely on active cooling systems. Within this framework, solar control films (SCFs) have emerged as a practical and cost-effective solution to enhance indoor environmental quality and reduce cooling energy demand. By altering the optical and thermal properties of glazing systems, they reduce solar heat gains while maintaining outdoor views and allowing natural daylight to enter. SCFs not only lower thermal loads and improve indoor comfort but also enhance energy efficiency, minimize glare, and block ultraviolet radiation [9-11]. Furthermore, SCFs support the effective use of natural light, decreasing reliance on artificial lighting and its associated energy consumption. When properly managed to avoid glare, natural light has been widely recognized for its positive effects on occupant well-being, including mood enhancement, circadian rhythm regulation, improved visual comfort, and increased productivity [12,13]. Moreover, SCFs preserve outdoor views, further contributing to occupant satisfaction and overall health [14-16]. Compared to emerging technologies such as smart glazing or dynamic façades, SCFs offer a lower-cost, less invasive alternative – particularly suitable for large-scale retrofits of existing buildings that fall short of modern energy standards [17], as well as for buildings in emerging economies where access to advanced materials or control systems may be limited. Their ease of implementation makes them especially advantageous for improving thermal performance without removing original window systems, a critical benefit in the rehabilitation of historic buildings where architectural alterations are often restricted [18]. Given these multiple advantages, SCFs have seen widespread adoption worldwide.
Direct solar radiation significantly affects occupants’ thermal comfort, particularly in areas near windows. Research has shown that solar radiation can induce considerable fluctuations in mean radiant temperature (MRT), negatively impacting comfort [19-22]. In hot and sunny climates, the intensity of solar radiation can sharply raise temperatures in the vicinity of windows, creating uncomfortable conditions even when indoor air temperature is maintained within acceptable ranges [5,23]. Conventional thermal comfort models, such as Predicted Mean Vote (PMV) and adaptive models, often underestimate these critical overheating scenarios as they do not account for solar effects [24,25].
Various methodologies incorporate direct solar radiation effects into comfort models [25-27]. However, among these, only the Arens model [28] has been standardized [29]. This model, based on the Effective Radiant Field (ERF), which quantifies additional long-wave radiation energy received by the human body when surrounding surface temperatures differ from air temperature, also integrates direct, diffuse, and reflected solar radiation into MRT calculations. The SolarCal tool, developed by the same authors, provides rapid estimates of solar radiation effects in simplified geometries, highlighting how direct solar heating can result in discomfort [24]. Although it is a steady-state model for uniform thermal environments [30], it is considered a reliable predictive tool, particularly for solar altitudes above 20º [25]. A major advantage is that Ladybug components are available to calculate solar-adjusted MRT through the SolarCal model, facilitating its use.
Various investigations[23,27,31,32] have studied the effect of glazing with varying optical properties on thermal comfort, factoring in solar radiation exposure. These works conclude that Solar Heat Gain Coefficient (SHGC) and solar transmittance (Tsol) are critical variables in determining thermal comfort, especially near windows where direct solar radiation is most intense. Hwang et al. [23] established a linear relationship between SHGC and long-term comfort indicators, such as cumulative overheating hours and overheating severity. Chaiyapinunt and Khamporn [33] found that reflective glazing (i.e., with low solar transmittance and low absorptance) is most suitable for tropical climates, as it effectively reduces transmitted radiation and internal surface temperatures, thereby minimizing thermal discomfort. Other studies have quantified comfort improvements linked to reduced Tsol. Zani et al. [34] reported a 19% reduction in discomfort hours in Milan (Cfa) when switching from Tsol = 0.60 to 0.28. Kheybari et al. [35] conducted a comprehensive comparative study of seven glazing types – including standard, advanced, and water-filled options – across nine climates. In the cold semi-arid climate of Torrens (BSk), they showed that replacing clear double glazing (Tsol = 0.62) with reflective glass (Tsol = 0.20) increased annual comfort hours in office building from 11% to 20%. Singh [36] evaluated 15 glazing types across six Indian climate zones, concluding that the optimal type varies significantly with climate: reflective solar control glazings performed best in hot and arid locations like Jodhpur, while clear glazings were more suitable in cold regions such as Leh. Collectively, these studies highlight the necessity of incorporating solar exposure into glazing performance evaluations to ensure accurate assessments of indoor thermal comfort.
Neglecting the effects of solar radiation exposure in simulations can lead to biased conclusions about the comfort-related benefits of SCFs, particularly in high-irradiance contexts. However, not only existing studies on the effects of SCFs on indoor comfort are scarce [36-42], but very few address the specific impact of SCFs on thermal comfort by accounting for short-wave solar radiation exposure.
Chaiyapinunt et al. [38,39] emphasized the dual impact of SCFs: while they mitigate heat gains, they may increase glass surface temperatures, potentially undermining their benefits in terms of thermal comfort. The authors introduced methodologies that incorporate solar radiation effects into comfort indices such as the Predicted Percentage of Dissatisfied (PPD) and investigated the implications of optical properties and heat transfer coefficients of glazing systems. Singh et al. [40] expanded this framework to diverse climatic conditions, demonstrating – as previously mentioned – the climate-dependent efficacy of different SCFs, while Zhang et al. [41] provided insights into orientation-specific overheating in heating-dominated climates using an Overheating Index.
Despite these advancements, significant gaps remain. Climate plays a key role in the selection and performance of SCFs for thermal comfort, yet no study to date [11] has focused on the cold arid (BWk) or cold semi-arid (BSk) climates – conditions characterized by very high solar irradiation, hot summers, cold winters, and significant daily and seasonal temperature swings. Although temperate continental and mediterranean climates also face the dual challenge of reducing overheating in summer while preserving solar gains in winter, this challenge is particularly intensified in cold arid and semi-arid regions due to their intense solar irradiation, low humidity, and large temperature fluctuations. Additionally, most studies on SCFs have been conducted under static conditions, focusing on specific scenarios rather than accounting for dynamic annual variations in solar radiation. As a result, their findings may not accurately reflect long-term thermal comfort across diverse orientations and occupant locations. Furthermore, intermediate orientations, which present specific solar angles, remain largely unexplored. Lastly, the mentioned studies assumed clothing insulation to be constant, but occupants tend to adjust their attire in response to thermal stimuli [43]. In thermally conditioned buildings, hourly typical adjustments in clothing insulation (clo value) range around ±0.2 clo, equivalent to the insulation provided by adding or removing a jacket or sweater [44]. Conejo Fernández’s thesis [45] explored how variations in clothing insulation affect indoor thermal comfort, particularly in spaces exposed to solar radiation. The results demonstrated that clothing adjustments are effective in restoring comfort in irradiated environments. Incorporating this adaptive behavior into simulations could significantly enhance the accuracy of thermal comfort predictions.
Although SCFs effectively reduce summer discomfort, their impact on winter conditions is less straightforward. In colder seasons, SCFs can shield occupants from excessive solar radiation but may also exacerbate cold discomfort by limiting beneficial solar gains [5,46], presenting a trade-off in year-round performance. This highlights the importance of conducting dynamic annual simulations to evaluate SCFs’ effects on thermal comfort both near windows and in shaded zones. Furthermore, gaps remain in understanding intermediate orientations and incorporating dynamic occupant behaviors, such as clothing adjustments. Addressing these gaps is important, particularly in high-irradiance climates where solar exposure strongly influences indoor thermal conditions.
Regarding thermal comfort indexes, recent advancements in thermal comfort assessment have emphasized the need for long-term and spatially resolved metrics to adequately capture the performance of building envelope solutions over extended periods [47,48]. To address this, Atzeri et al. [49] proposed a set of integrated metrics, including spatial Thermal Comfort Availability (sTCA) and time Thermal Comfort Usability (tTCU). The sTCA metric evaluates the percentage of floor space that maintains acceptable thermal conditions for a given fraction of time, providing a zonal assessment of comfort availability. Meanwhile, tTCU assesses the fraction of time during which a minimum percentage of the space is simultaneously comfortable, offering a time-integrated measure of usability.
In order to address the detected gaps, this study evaluates the year-round effectiveness of Solar Control Films (SCFs) in mitigating thermal discomfort, while factoring in occupant hourly clothing adjustments. Optimum solutions are identified for cardinal and intermediate orientations and according to different spatial long-term comfort metrics. The research addresses the following questions:
- How do SCFs perform near windows versus farther away? Do long-term usability (tTCU) and zonal availability (sTCA) metrics adequately reflect their nuanced impact in shaping the space indoor thermal environment?
- To what extent do SCFs mitigate year-round indoor thermal discomfort in high solar irradiance climates, balancing heat reduction benefits with potential cold-season drawbacks?
- What role does orientation play in selecting the optimal SCF type to minimize thermal discomfort?
While the proposed analytical framework is applied here to SCFs, its methodology is adaptable to broader multi-objective optimization studies involving window systems and solar control strategies across diverse climatic contexts [50-54]. By delivering objective values that account for dynamic solar exposure, spatial variability, occupant adaptation, and tailored comfort metrics, this approach provides a replicable method for enhancing indoor thermal performance.
2. Methodology
2.1. Proposed workflow
To evaluate thermal comfort while incorporating the effects of transmitted short-wave solar radiation and occupant clothing adaptation, we propose a methodology that integrates parametric tools with established theoretical models. This workflow is implemented in Grasshopper, the visual programming environment of Rhinoceros 3D, using the Ladybug and Honeybee plugins. These plugins provide advanced capabilities for environmental analysis, offering a flexible and visually intuitive approach to integrating climate data, computational modeling, and performance evaluation.
Ladybug facilitates the import, visualization, and analysis of standard EnergyPlus Weather (.epw) files, allowing users to explore climate variables and their impact on building performance. It includes tools for solar radiation analysis, indoor and outdoor comfort modeling, and climate-responsive design strategies.
Honeybee extends these capabilities by integrating validated simulation engines such as EnergyPlus for thermal analysis, Radiance for daylighting and glare assessment, and Daysim for dynamic daylight performance metrics. It enables detailed building energy modeling, thermal comfort evaluations, and lighting simulations within a parametric design workflow.
Together, these tools streamline the evaluation of comfort conditions by automating calculations, providing spatially and temporally resolved insights, and enabling iterative optimization of design strategies. By integrating validated computational tools, the proposed methodology offers a rigorous and adaptable framework for assessing thermal comfort and enhancing climate-responsive design. Figure 1 presents a diagram of the proposed workflow.
Figure 1
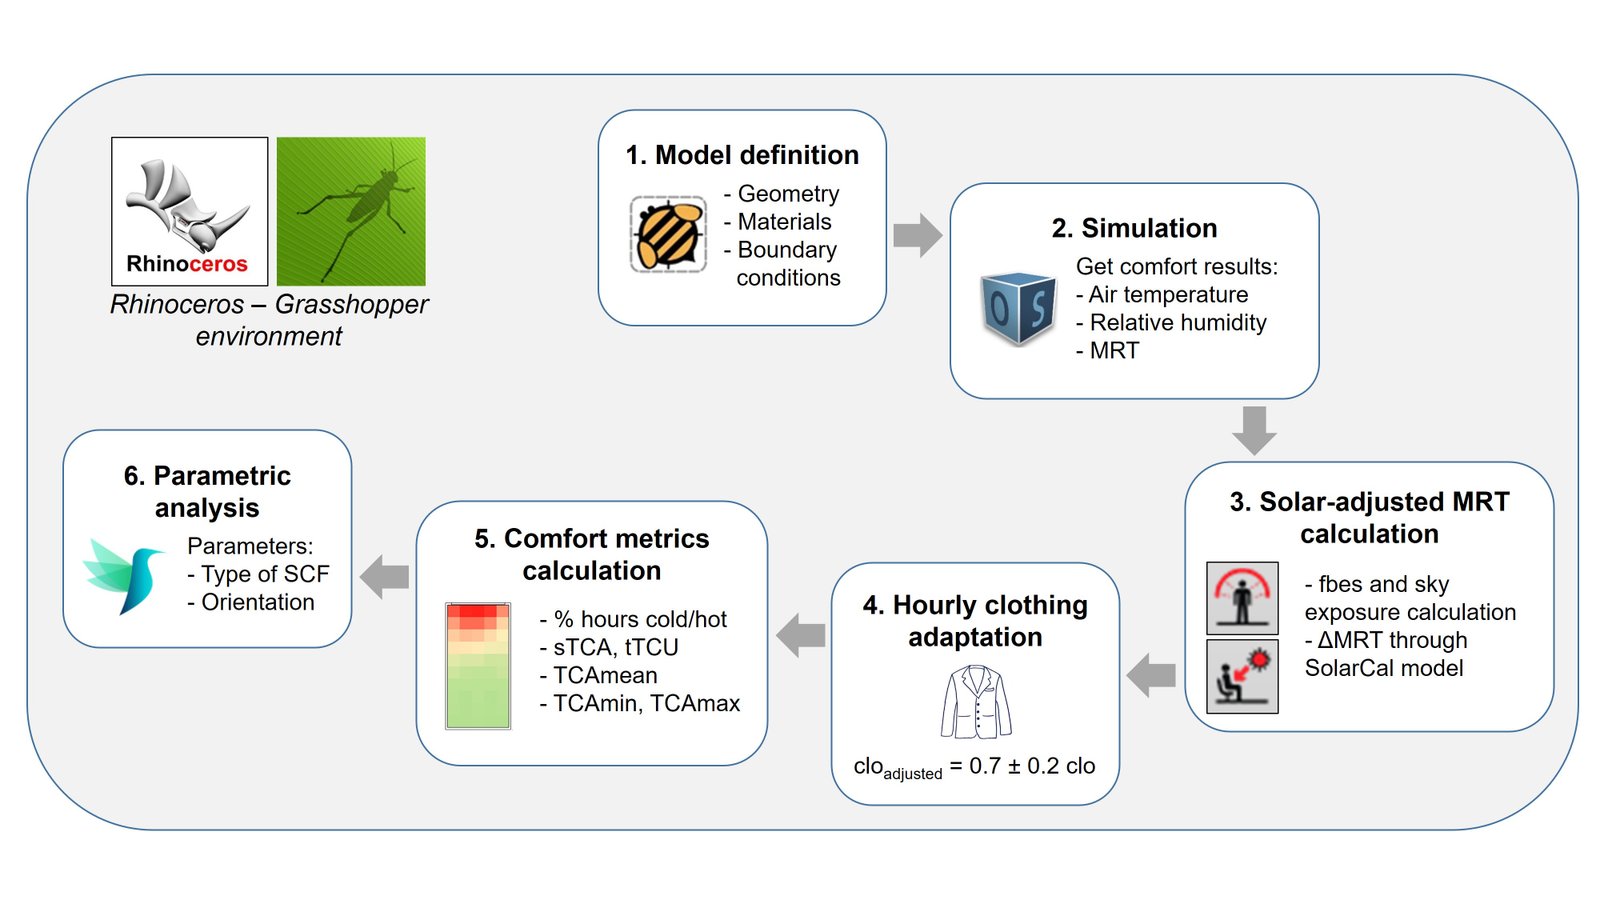
Fig. 1. Schematic of the different steps of proposed workflow.
2.1.1. Model definition and simulation
First, the model geometry is constructed in the Rhinoceros/Grasshopper environment using the Honeybee plug-in. Material properties and boundary conditions are carefully defined. The “HB Model to OSM” component is then used to simulate zone-level air temperature and longwave mean radiant temperature (MRT). A key assumption in this process is the uniformity of air temperature within each thermal zone, as is standard in most building energy simulation workflows. Likewise, surface temperatures are assumed to be spatially consistent within the zone and are derived from steady-state surface heat balance calculations. It is important to note that the present study focuses solely on thermal comfort; visual comfort and energy performance are not addressed in this analysis.
2.1.2. Calculation of solar-adjusted MRT
Solar-adjusted MRT is calculated using the SolarCal model adopted by ASHRAE 55 (2017) [29]. As described by Arens et al. [28], SolarCal simplifies the evaluation of short-wave solar radiation effects on thermal comfort by representing the occupant as a whole-body model with fixed posture and projected area factors, without accounting for local variations in exposure or clothing. The model computes solar heat gain as an additional mean radiant temperature (ΔMRT), derived from the net short-wave radiation absorbed by the body – integrating direct, diffuse, and reflected components. These are spatially simplified: diffuse radiation is assumed to act on the upper half of the body, and floor-reflected radiation on the lower half, including an approximate longwave contribution from warmed surfaces.
To implement this within the simulation workflow, we used the "LB Human to Sky Relation" and "Indoor Solar MRT" components from Ladybug Tools. These components are built upon the Effective Radiant Field (ERF) formulation that underpins SolarCal, which quantifies the net radiative flux received by the body. "LB Human to Sky Relation" performs ray-tracing analyses to determine the fraction of the body exposed to direct sunlight (fbes) and the fraction of the sky vault visible to the occupant (sky exposure), based on the occupant’s position and surrounding geometry. These inputs, along with clothing and posture assumptions, are passed to "Indoor Solar MRT", which calculates the resulting shortwave-induced ERF using hourly solar irradiance data, glazing transmittance, and surface reflectance. The computed ERF is then translated into ΔMRT and added to the longwave MRT obtained from the previous step. The resulting solar-adjusted MRT is used to calculate PMV using Fanger’s model, enabling a more accurate representation of thermal comfort in sunlit indoor environments.
2.1.3. Clothing adaptation
Based on data from thermal comfort field studies conducted in various countries and climate zones, Schiavon and Lee reported that the median clothing insulation in office environments is 0.69 clo in winter and 0.50 clo in summer [55]. These findings suggest that actual clothing levels tend to remain within a relatively narrow range, even across seasons. Given the controlled thermal conditions typically found in office buildings, it is unlikely for occupants to wear clothing with insulation values below 0.5 clo or above 0.9 clo. Therefore, this study adopts a reference value of 0.7 clo and considers adaptive variations of ±0.2 clo, in line with [44] and [45], which captures the most representative range of indoor clothing behavior (0.5–0.9 clo) while allowing for dynamic, hour-by-hour adjustments.
To account for clothing adaptation, the “LB PMV Comfort” component is applied twice. First, it is used with a fixed clothing insulation value of 0.7 clo to assess thermal comfort condition (hereafter denoted as CC). The CC is defined as 0 when the PMV falls within the standard comfort range (-0.5 to 0.5), 1 if PMV > 0.5, and -1 if PMV < -0.5. Based on this classification, adjusted clothing values are computed using Eq. (1).
The adjusted clo values are then used as input for a second run of the “LB PMV Comfort” component, generating hourly continuous datasets for each analysis point. This two-step approach provides a simplified yet effective representation of dynamic clothing adaptation within the PMV framework. The selected base value and adjustment range can be modified to reflect seasonal clothing patterns or adapted to specific climatic or cultural contexts.
2.1.4. Comfort metrics calculation
Resulting PMV data is filtered in order to keep only occupancy hours; then various indicators are calculated: average percentage of occupancy hours with cold discomfort, comfort (equivalent to average TCA) and warm discomfort; spatial Thermal Comfort Availability (sTCA) and time Thermal Comfort Usability (tTCU) [49]. Additionally, minimum and maximum TCA (denoted TCAmin and TCAmax) are introduced for a better understanding of comfort conditions disparities through the space.
2.1.5. Parametric analysis
Lastly, a parametric study is conducted using Colibri, a component of TT Toolbox plug-in which facilitates the exploration of design alternatives by systematically varying parameters, recording results, and visualizing performance rankings [56]. This approach is particularly useful when selecting the best option from a limited set of predefined alternatives, such as the existing and commercially available SCFs examined in this study.
2.1.6. Optimization
Although optimization is not included in the current framework, the thermal comfort metrics calculated in the previous step could serve as objective values in future optimization studies. For example, in cases involving a continuous design space – such as the angle, width, and spacing of slats in a shading system, or the selective deployment of SCFs on specific façades or building zones – these metrics could guide single- or multi-objective optimization processes, which are supported by several tools available within the Grasshopper environment [54,55]. Relevant trade-offs could involve thermal comfort versus daylight availability, glare control, retrofit cost, or energy consumption.
However, a key limitation for integrating the proposed methodology into optimization workflows lies in its high computational demand, especially in the context of multi-objective optimization (MOO) workflows. MOO typically requires a large number of simulations to adequately explore the design space and construct meaningful Pareto fronts, making computational cost a critical bottleneck. To mitigate this challenge, two complementary strategies could be explored:
- Reducing the number of evaluated points: Instead of analyzing a high-resolution grid, a more targeted approach could be adopted by selecting representative points that capture the spatial variability of thermal comfort. In the simplified geometry analyzed, points P1 and P4 – located near and far from the window, respectively – correspond to the minimum and maximum values of thermal comfort availability (TCA). These points effectively differentiate the comfort conditions near and away from the window, offering a computationally efficient yet informative representation of spatial comfort distribution. A preliminary spatial analysis, such as the one conducted in the application example for the base case (clear glass, the most critical scenario), could help define annual thermal comfort patterns and guide the selection of key points for optimization.
- Leveraging computational efficiency techniques: Surrogate modeling approaches, such as those implemented in Goat, could be explored to approximate simulation outcomes, reducing computational overhead while preserving result accuracy. Additionally, sensitivity analysis could be employed to identify and prioritize the most influential design parameters, effectively reducing the problem's dimensionality and optimizing computational resources.
By refining these methodological aspects, the framework could be effectively scaled for more complex optimization scenarios while maintaining the benefits of accounting for solar effects, clothing adaptation, and spatial comfort indicators.
2.2. Framework application
A parametric study was conducted using Colibri to evaluate the performance of different SCFs in relation to thermal comfort, considering the influence of window orientation and a clothing adaptation range of 0.7 ± 0.2 clo. Twelve orientations were examined, with the azimuth varying from 0° to 330° in 30° increments.
The base case consists of a 3mm single clear glass window. Five SCFs with distinct optical properties were selected from locally available commercial options to ensure representation across a range of solar transmittance values and film types – including absorbing, reflective, and high visible transmittance variants. This resulted in a total of six glazing configurations. Their optical properties – according to the International Glazing Database (IGDB) – are detailed in Table 1.
Table 1
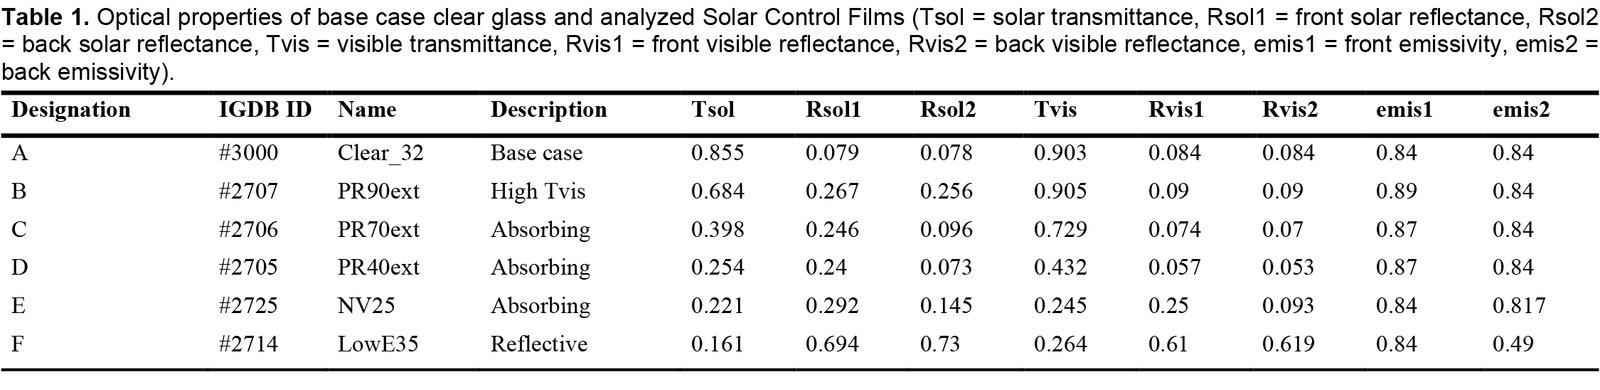
Table 1. Optical properties of base case clear glass and analyzed Solar Control Films (Tsol = solar transmittance, Rsol1 = front solar reflectance, Rsol2 = back solar reflectance, Tvis = visible transmittance, Rvis1 = front visible reflectance, Rvis2 = back visible reflectance, emis1 = front emissivity, emis2 = back emissivity).
2.2.1. Case study description
The case study examines a lightweight construction office building, which is particularly prone to overheating. This susceptibility arises from its combination of low thermal inertia, typical insulation levels, and significant internal heat gains primarily due to computer use and daytime occupancy patterns [57,58]. The office is located in Mendoza, Argentina, an arid region with high annual solar irradiance, where Global Horizontal Irradiation (GHI) exceeds 2000 kWh/m²·year. The climate is classified as cold arid (BWk) according to the Köppen system, characterized by hot, dry summers with high solar exposure and cold winters with occasional frost. Figure 2 illustrates the typical dry bulb temperature and relative humidity values, while Fig. 3 depicts the global horizontal, direct normal, and diffuse solar irradiation for a typical meteorological year.
Figure 2
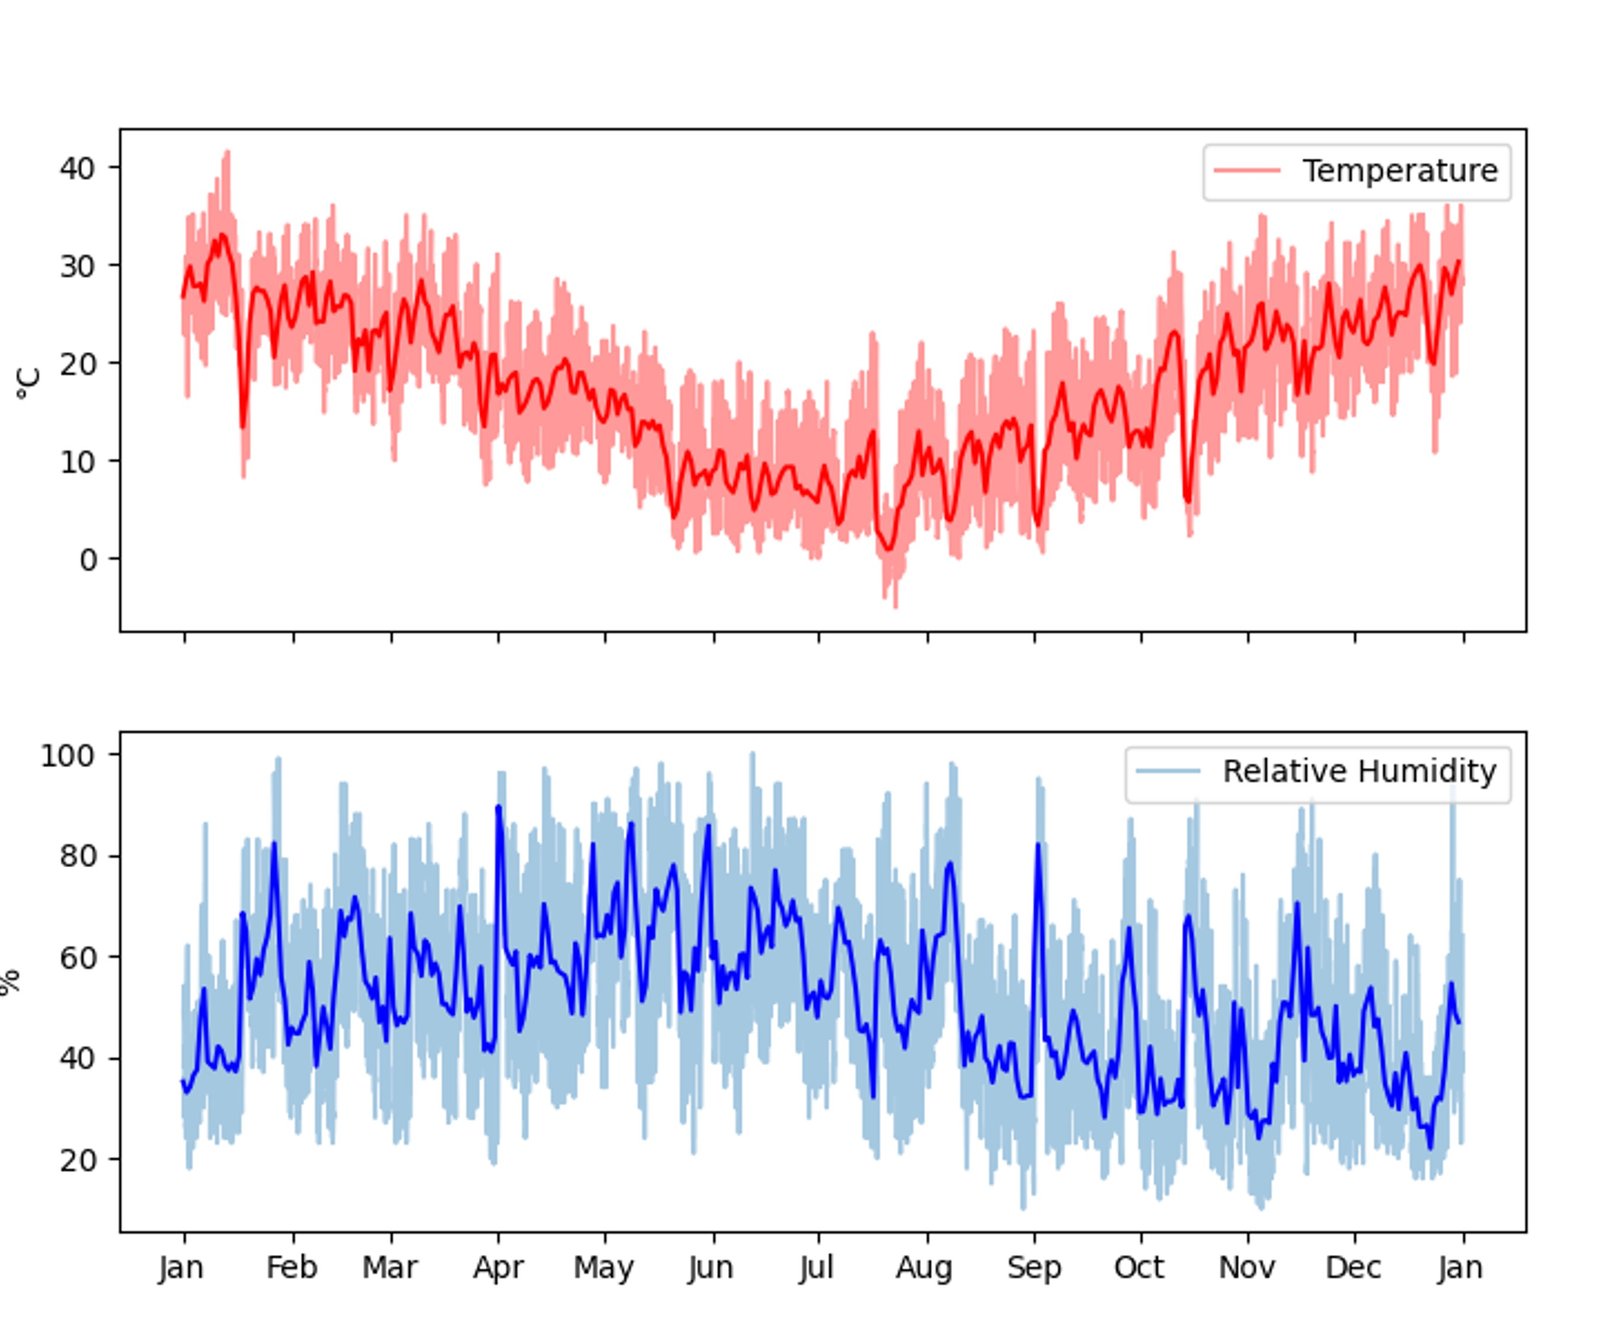
Fig. 2. Dry bulb temperatures (ºC) and Relative Humidity (%) according to Typical Meteorological Year for Mendoza, Argentina.
Figure 3
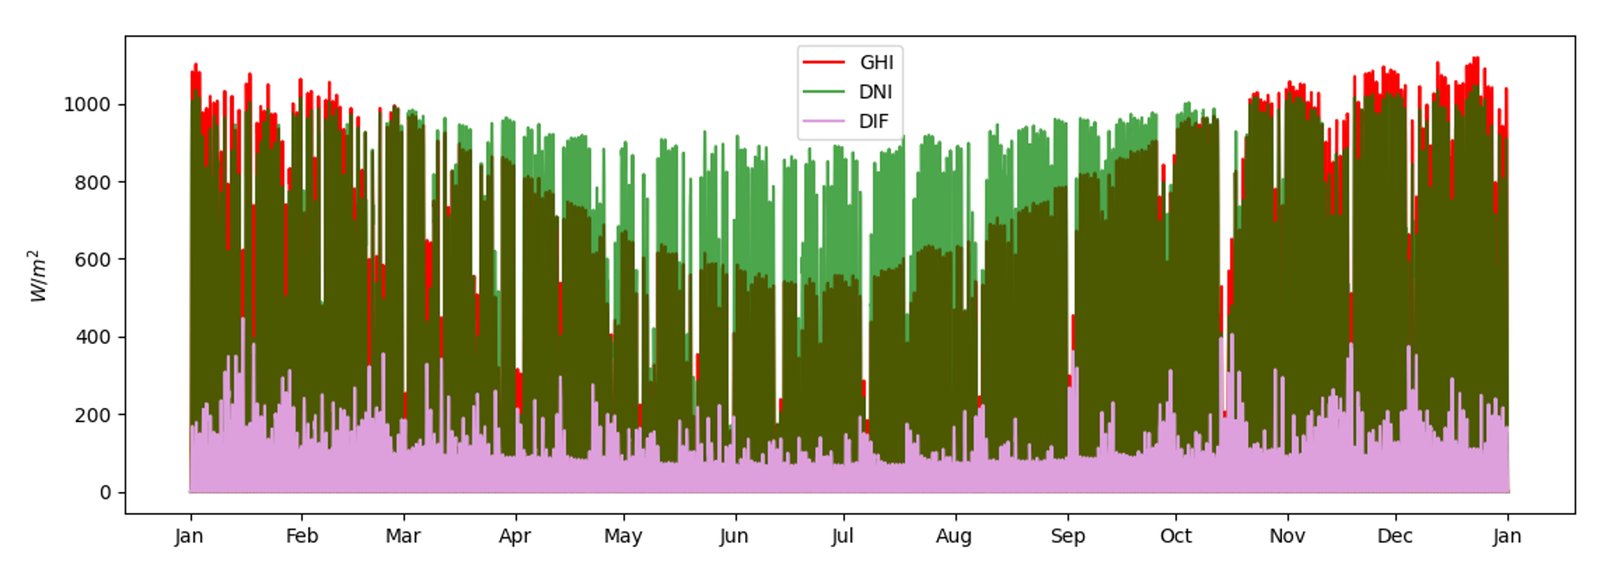
Fig. 3. Global Horizontal irradiation (GHI), Direct Normal Irradiation (DNI) and Diffuse Solar Irradiation (DIF) for TMY in Mendoza, Argentina, expressed in W/m2.
2.2.2. Thermal simulation configuration
The meteorological data used in the simulation corresponds to a Typical Meteorological Year (TMY) for Mendoza Airport, sourced from the OneClimateBuilding database [59] and based on the 2009–2023 period.
The analysis was based on a hypothetical shoe-box office with a floor area of 18 m² (3 m x 6 m), a height of 2.60 m, and a side window measuring 2.60 m x 1.20 m (width x height), resulting in a Window-to-Wall Ratio (WWR) of 40%. The model envelope consists entirely of lightweight construction materials and all surfaces are considered adiabatic except for the facade with the window. The opaque envelope thermophysical properties are detailed in Table 2.
Table 2
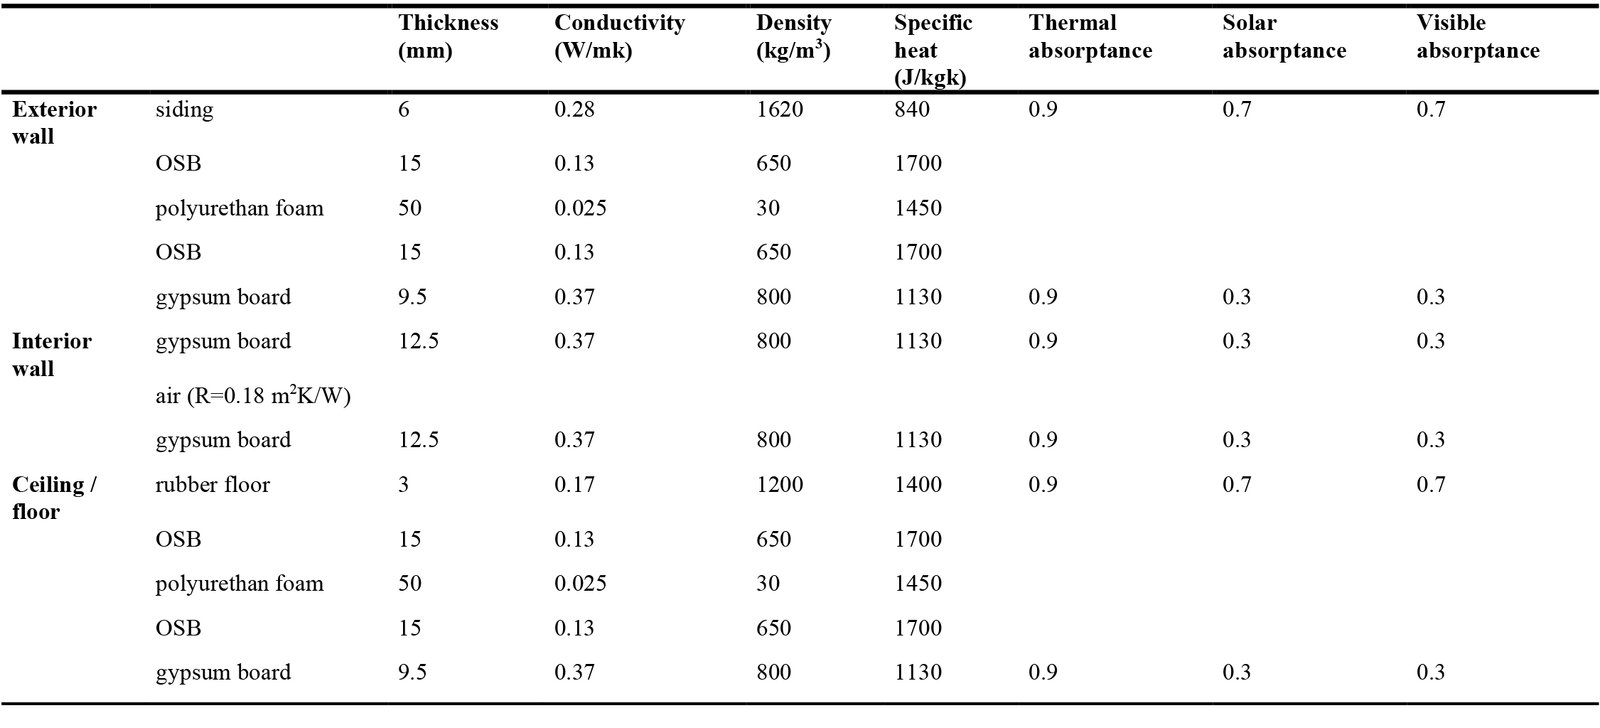
Table 2. Thermophysical properties of the opaque envelope.
The simulations included a typical aluminum window frame commonly used in the region, with a thermal conductance (K) of 500 W/m²·K and a width of 130 mm. These frames have a significant impact on thermal exchanges in the building envelope, influencing the overall energy performance of the window system [60].
The office was assumed to be occupied by two people daily from 9:00 to 18:00. Occupants were modeled as performing sedentary office work (1.2 met) and wearing clothing with an insulation value of 0.7 clo year-round, with hourly variations of ±2 clo to account for adaptive behavior.
Each of the two desktop computers was assumed to have an average power consumption of 180 W, operating during working hours and turned off outside these hours. The lighting power density was set at 6.9 W/m². For heating and cooling, an ideal air conditioning system was modeled to maintain indoor air temperatures between 21°C and 24°C from 8:00 to 18:59. Humidity control was not included due to the arid climate conditions. An air change rate of 0.8 ACH was considered.
Table 3 summarizes the parameters used in the simulation model.
Table 3
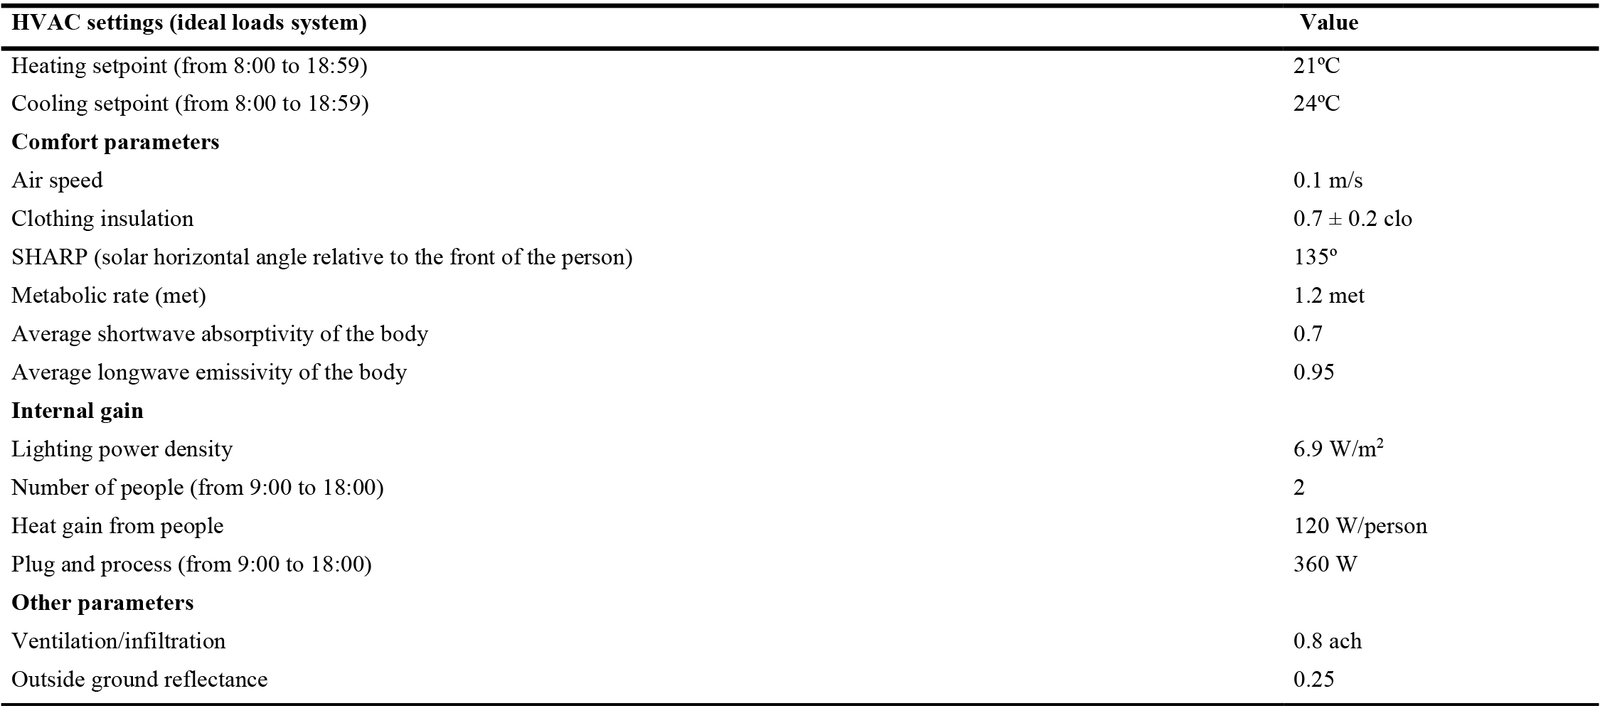
Table 3. Parameters considered in the simulation model.
3. Results
3.1. Base case (clear glazing)
The PMV (Predicted Mean Vote) and fbes (fraction of body exposed to direct sunlight) were analyzed at four points within the space (P1 to P4, Fig. 4) to compare thermal comfort near the window and farther away from it for the base case. Figures 5-7 present hourly plots of both variables for the north, east, and west orientations, respectively.
Figure 4
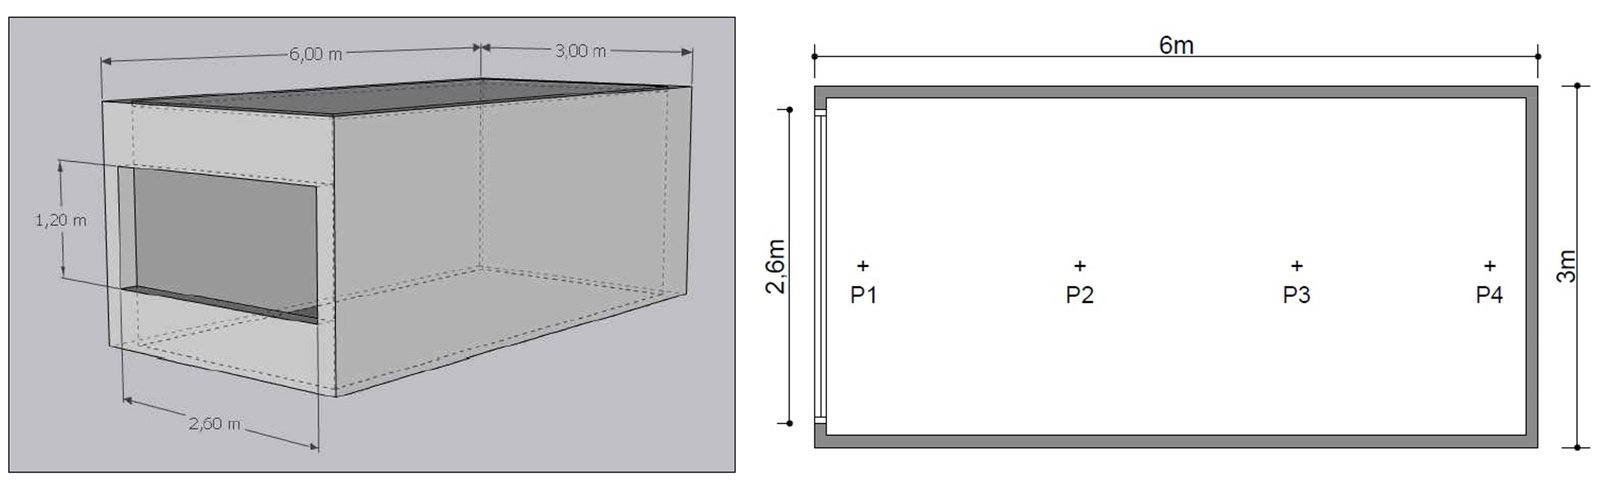
Fig. 4. Schematic of the simulated space, showing its dimensions and the four specific points analyzed for thermal comfort.
Figure 5
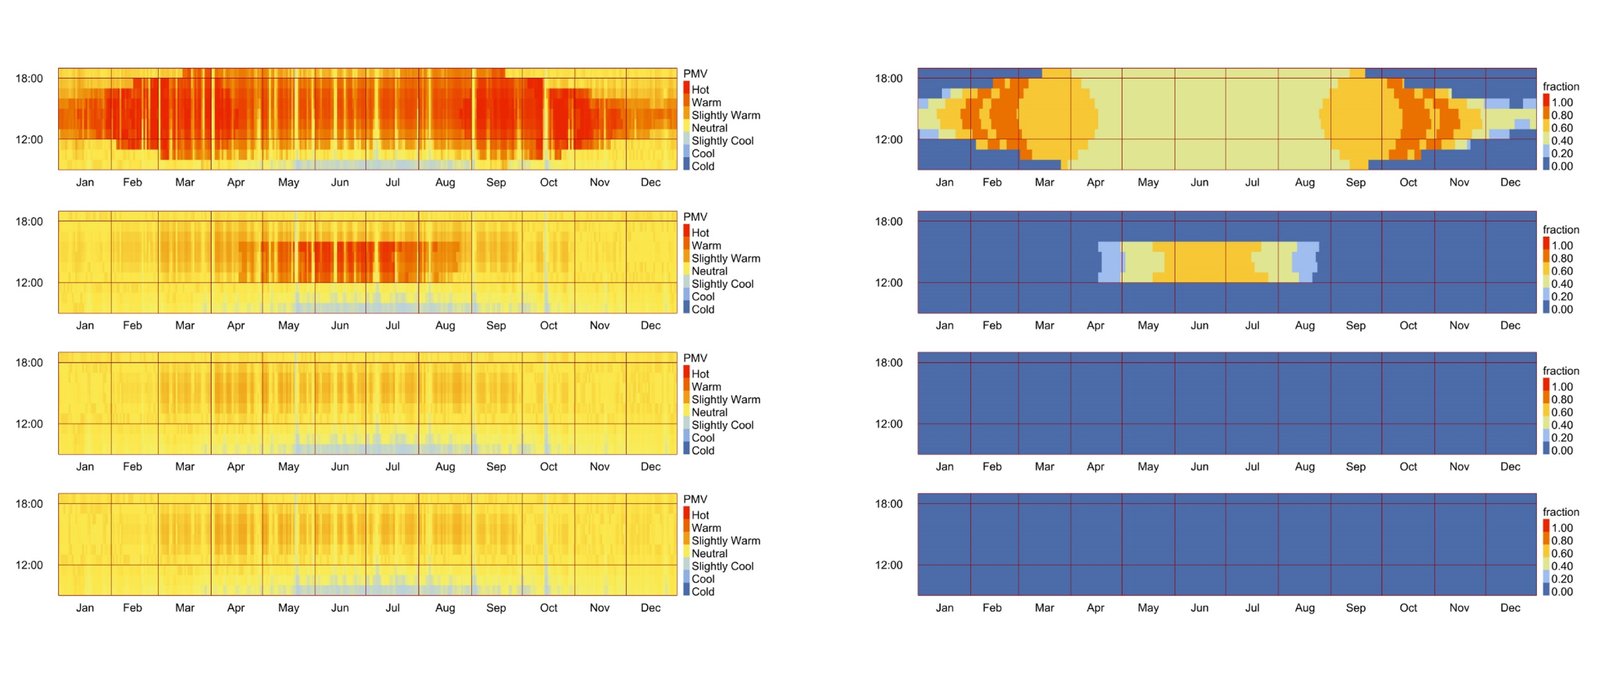
Fig. 5. Hourly plot of PMV (left column) and fbes (right column) for the four points P1, P2, P3, and P4 (from top to bottom) for the north orientation (azimuth 0). Baseline case (clear glass A).
Figure 6
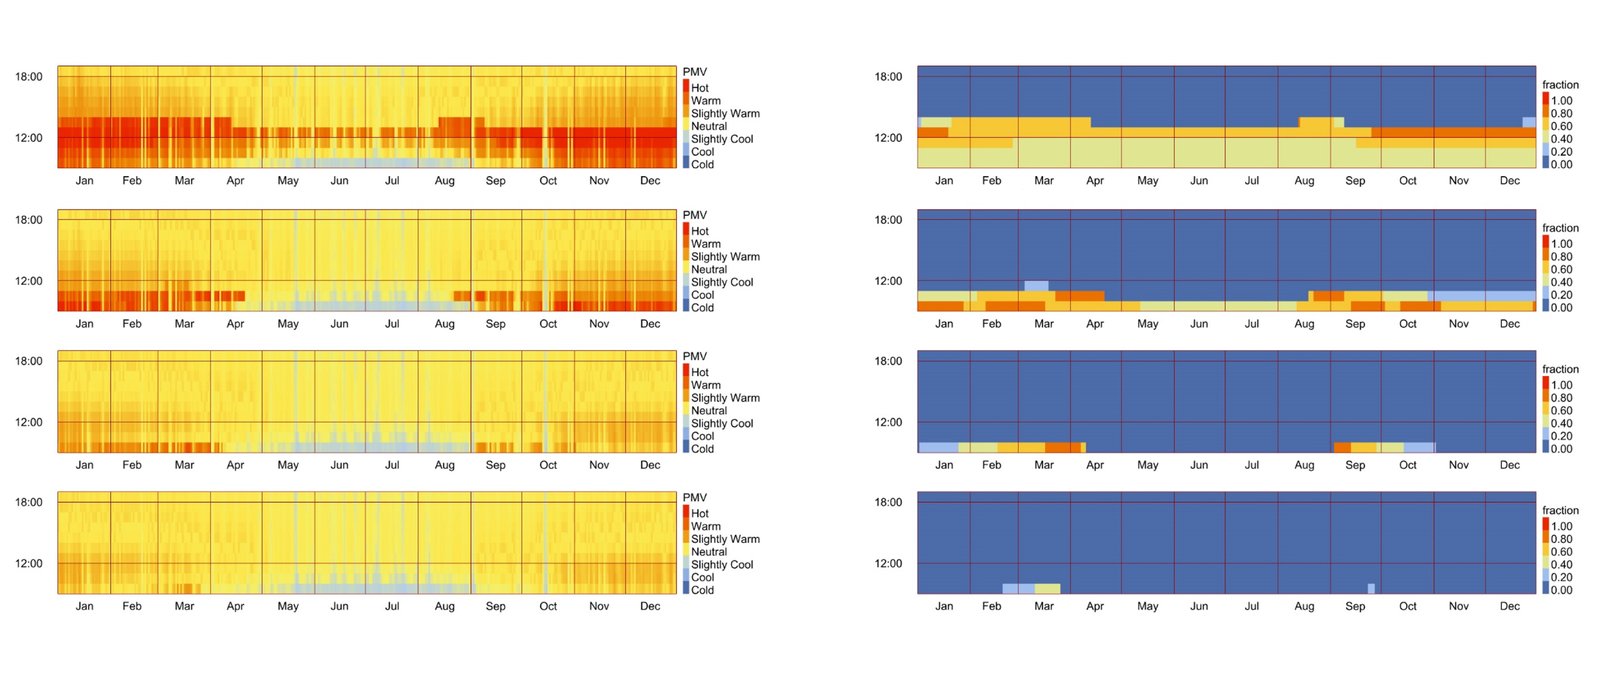
Fig. 6. Hourly plot of PMV (left column) and fbes (right column) for the four points P1, P2, P3, and P4 (from top to bottom) for the east orientation (azimuth 90). Baseline case (clear glass A).
Figure 7
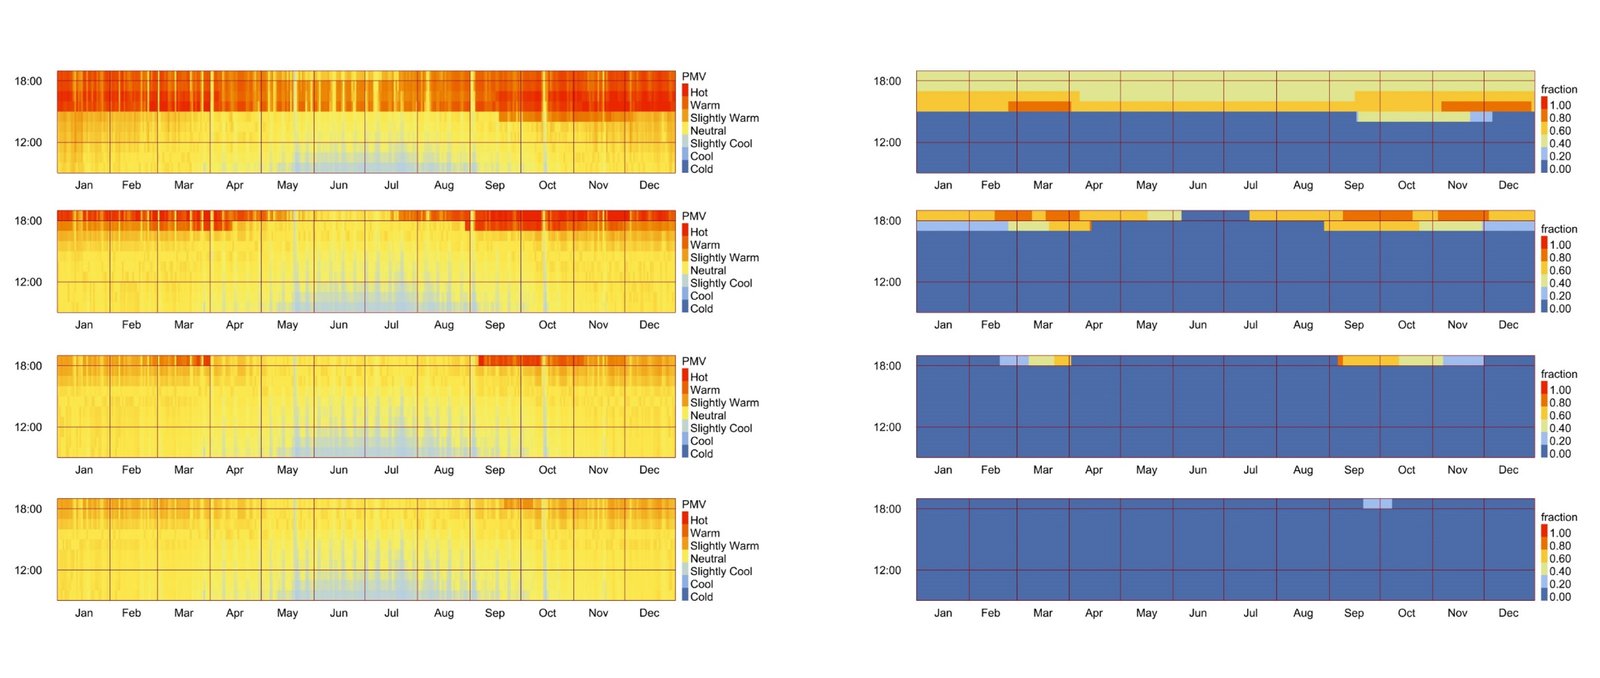
Fig. 7. Hourly plot of PMV (left column) and fbes (right column) for the four points P1, P2, P3, and P4 (from top to bottom) for the west orientation (azimuth 270). Baseline case (clear glass A).
Observing the hourly PMV plots for the north orientation (Fig. 5) reveals that heat discomfort predominantly occurs near the window, where direct sunlight is present (fbes>0). In contrast, cold discomfort is distributed more uniformly throughout the space and primarily occurs during the winter months, especially in the early hours when outdoor temperatures are at their lowest.
For the east orientation (Fig. 6), a similar pattern is observed in the distribution of hours with cold discomfort. Although fbes is non-zero near the window during these hours, it is insufficient to offset the impact of low outdoor temperatures. Regarding heat discomfort, it occurs in the morning and peaks during the hours preceding solar noon, which occurs between approximately 1:20 PM and 1:50 PM local time.
In the west orientation (Fig. 7), cold discomfort is more prevalent, often persisting for several hours in the morning during the colder months. Before solar noon, the absence of beam radiation incidence on the window results in a low surface temperature and a reduced mean radiant temperature, negatively affecting thermal comfort throughout the space. In contrast, pronounced heat discomfort, characterized by a "hot" Predicted Mean Vote, occurs after solar noon, particularly near the window, and is directly linked to direct solar incidence on the occupant (fbes>0).
3.2. Impact of SCF and clothing adjustments on discomfort hours
To assess the impact of clothing adjustments on thermal comfort, the percentage of occupied hours with a warm discomfort (PMV > 0.5) and cold discomfort (PMV < -0.5) was evaluated under two scenarios: (i) without clothing adjustments (Fig. 8) and (ii) with a ± 0.2 clo variation to account for adaptive behavior (Fig. 9). On average, across all orientations and based on a grid of 50 evaluation points within the space, the percentage of discomfort due to heat decreased by 56% in the base case and up to 96% with SCFs when adaptive clothing adjustments were considered, highlighting greater discrepancies among glazing types. Similarly, the percentage of cold-related discomfort showed a consistent reduction of 27–28% for all glazing variants when clothing variation was included.
Figure 8
Fig. 8. Percentage of occupancy hours with warm discomfort (left) and cold discomfort (right), without clothing adjustments.
Figure 9
Fig. 9. Percentage of occupancy hours with warm discomfort (left) and cold discomfort (right), considering ± 0.2 clo variations.
Looking at Fig. 9, it is observed that, as the window solar transmittance decreases, the percentage of occupied hours with warm discomfort decreases, while the percentage of hours with cold discomfort increases. However, the reduction in heat discomfort appears to have a more significant effect than the increase in cold discomfort. With absorbing films C, D, and E, the heat-related discomfort is reduced by 71%, 84%, and 89%, respectively, when averaged across the 12 analyzed orientations; while the cold-related discomfort increases by 20%, 29% and 33%, respectively. Reflective film F eliminates heat-related discomfort across all orientations but increases cold-related discomfort hours, with increments ranging from 23% at azimuth 180 to 85% at azimuth 90, compared to the baseline case.
Regarding orientations, heat discomfort is most pronounced at azimuths 330, 0, 30, and 60 for the base case, with a peak at the northeast orientation (azimuth 60). When an absorbing film is applied to the window (cases C, D, and E), the northwest orientation (azimuths 300 and 330) becomes the most critical. This shift is due to the reduced impact of short-wave radiation, which enhances the relative influence of long-wave radiation, becoming more significant in the afternoon as outdoor air temperatures rise. Heat discomfort at azimuths 180 and 210 remains minimal (below 2%) and is completely mitigated across all orientations when the reflective film (F) is applied.
Cold discomfort is most pronounced in the south and southwest orientations, while it is minimal in the northeast orientation (azimuths 30 and 60). Notably, for these orientations, the discomfort curve for the absorbing films aligns more closely with the base case curve, diverging further from the reflective film curve. This can be explained by the fact that, by absorbing solar radiation, the absorbing films increase the window's surface temperature, compensating for the reduction in short-wave radiation transmitted through the window, thereby mitigating the increase in the percentage of hours with cold discomfort.
3.3. Thermal comfort availability
Table 4 presents the relative differences in the average thermal comfort availability (TCAmean) for the various solar control films compared to the base case across the different analyzed orientations. It is evident that solar control films are not recommended for the south, southeast, and southwest orientations (azimuths 150 to 240), where heat discomfort is already low, as they result in a decrease in comfort hours or a negligible increase. For the other orientations, comfort hours can be increased by 8% to 35%, with the most significant improvements observed for azimuths 330, 0, 30, and 60, where the increase exceeds 33%.
Table 4
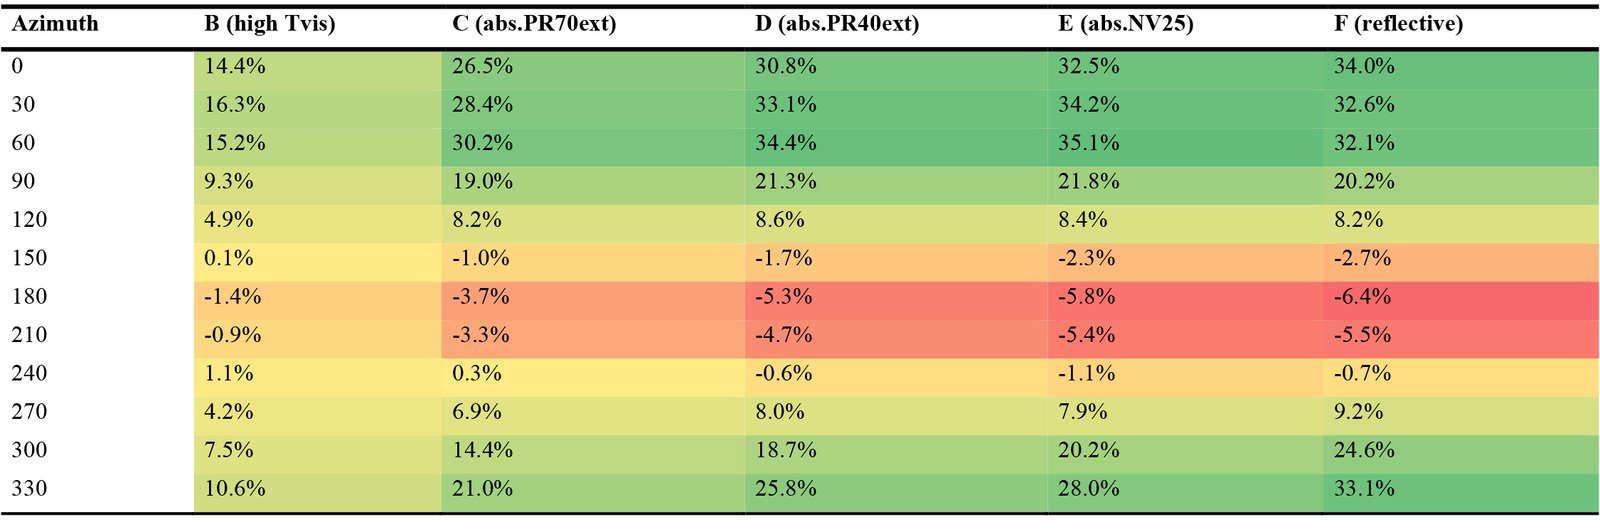
Table 4. Relative variation of the percentage of occupancy hours with comfort conditions (ΔTCAmean) compared to the baseline case (clear glass A), based on azimuth.
Notably, the film providing the highest percentage of comfort hours varies by orientation: Film D for azimuth 120, Film E for the northeast and east (azimuths 30 to 90), and Film F for north, northwest, and west (azimuths 270 to 360).
Additionally, the maximum improvement in TCA relative to the base case occurs in the northeast orientations (azimuths 30 and 60). Results for azimuth 60 are notably closer to those for the north orientation than the east orientation, highlighting the importance of analyzing intermediate orientations.
sTCA10-90 represents the fraction of the space with a Thermal Comfort Availability (TCA) greater than 90% (i.e., 90% of the time with a PPD < 10%). In this study, due to the low outdoor temperatures during the early hours of the colder months, hours of cold discomfort exceed 10% of the time in all orientations in the base case. Since the films tend to increase cold discomfort, all films result in a null sTCA10-90.
However, analyzing the spatial distribution of TCA offers valuable insights. Figure 10 illustrates the TCA values corresponding to a grid of 50 points for the different orientations and selected film configurations (A, B, D, and F). The lowest occurrence of thermal comfort is observed in the base case, where TCA values fall below 30% near the window for orientations facing the equator. With the absorbing film D, these percentages improve, but elevated thermal discomfort remains near the windows. Conversely, the reflective film (F) results in a more uniform thermal condition throughout the space.
Figure 10
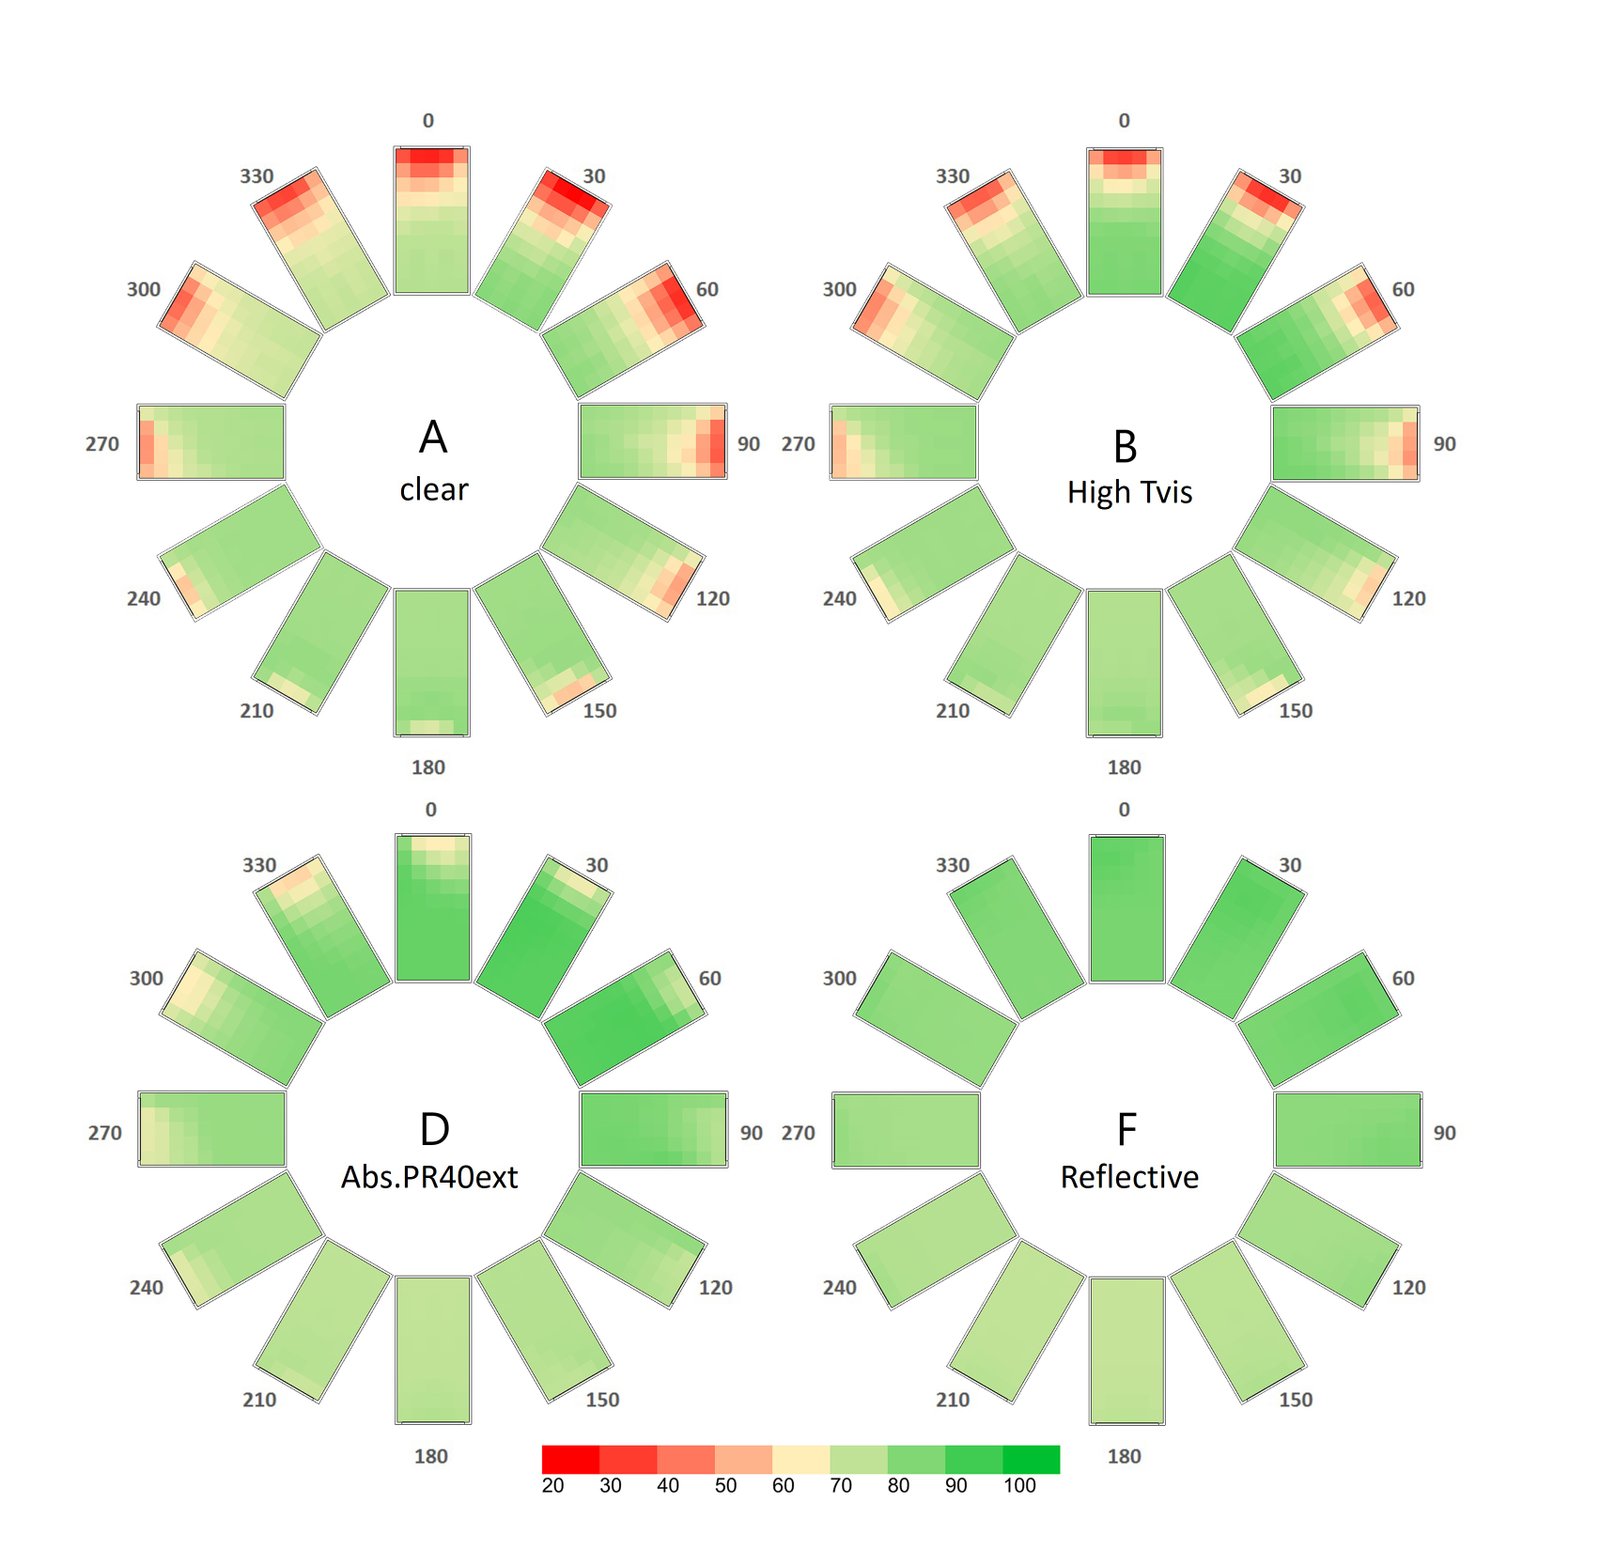
Fig. 10. Grid of TCA values for Glasses A, B, D, and F across different orientations.
From these observations, we can infer that reducing the solar transmittance of the window helps to homogenize TCA and mitigate thermal discomfort near the windows. However, it is noteworthy that in areas farther from the window, different effects are observed as the influence of short-wave radiation diminishes. For the south orientation (without direct solar exposure), the base case achieves the highest TCA (77%), while the TCAmax value decreases progressively as solar transmittance decreases, reaching 71% with the reflective film F. For the northeast orientation (azimuth 30), the base case achieves a TCAmax of 79%, the reflective film F increases this to 86%, and the highest TCAmax (88%) is obtained with absorbing films (cases C, D, and E), which have intermediate transmittance values.
3.4. Thermal comfort usability
Table 5 presents the tTCU10-90 values, which represent the fraction of time when Thermal Comfort Usability (TCU) exceeds 90% (i.e., at least 90% of the space with PPD < 10%). Higher values are highlighted in green, while lower values are shown in red.
Table 5
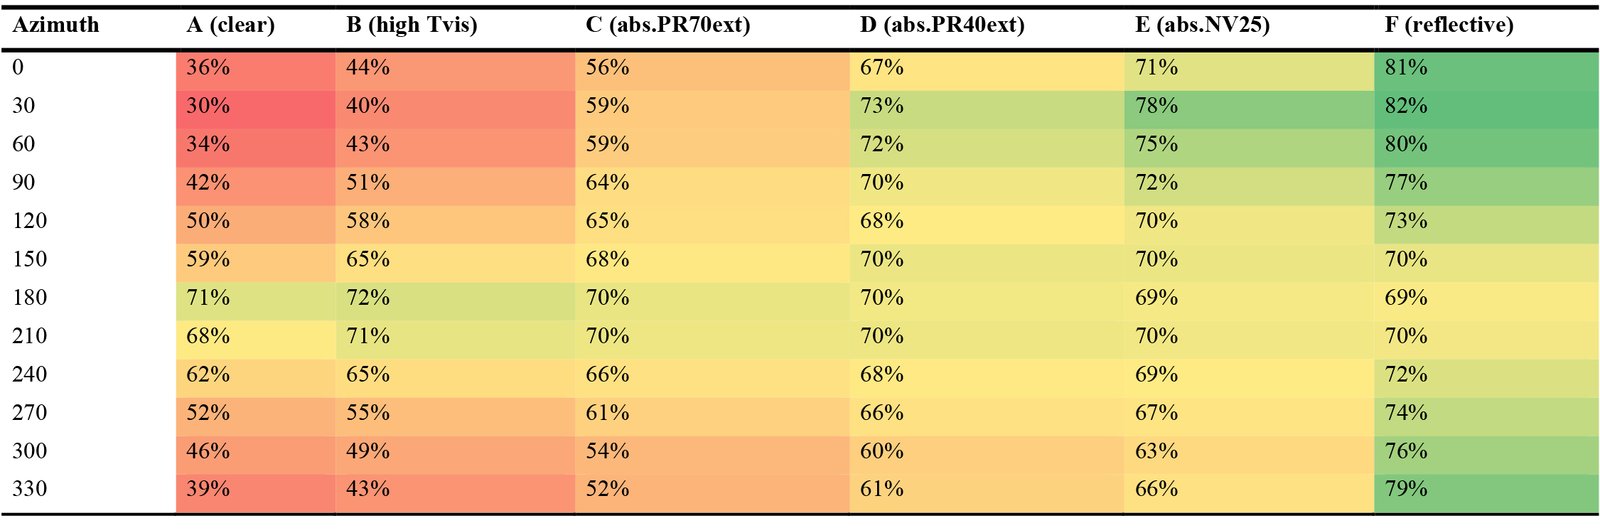
Table 5. Comparison of tTCU10-90 values for the baseline case (clear glass) and five types of Solar Control Films (B to F) across different orientations.
In most of the analyzed orientations (excluding azimuths 150, 180, and 210), the reflective film (F) achieves the highest time Thermal Comfort Usability (tTCU10-90, i.e., at least 90% of the space meeting comfort criteria), with values exceeding 80% in the north and northeast orientations. This represents a significant improvement compared to values below 36% observed in the base case. These orientations are identified as the most thermally critical, and the application of low solar transmittance films results in a substantial increase in the number of hours meeting the comfort criteria as defined by tTCU10-90, effectively doubling their occurrence.
Conversely, for the south orientation, the base case achieves a tTCU10-90 of 71%, which slightly decreases with the application of most solar control films (except Film B). This underscores the limited suitability of solar control films in this orientation. Similarly, the azimuth 210 shows minimal improvements in this indicator with the use of SCFs. Interestingly, despite a reduction in average comfort hours reported in Table 4, the tTCU10-90 values increase with the application of films. Furthermore, the optimal films identified using the tTCU10-90 metric differ from those determined based on the TCAmean metric (Table 4). For instance, at azimuth 30, the reflective film F achieves the highest time Thermal Comfort Usability, while the absorbing films D and E perform better in terms of average Thermal Comfort Availability across the entire space. This distinction highlights the critical importance of selecting appropriate thermal comfort metrics, as the choice of indicator significantly influences the assessment and subsequent decision-making process.
3.5. Optimal SCF
Table 6 identifies the optimal SCF option for each azimuth based on the different indicators analyzed, clearly showing that the thermally optimal film varies depending on the metric used.
Table 6
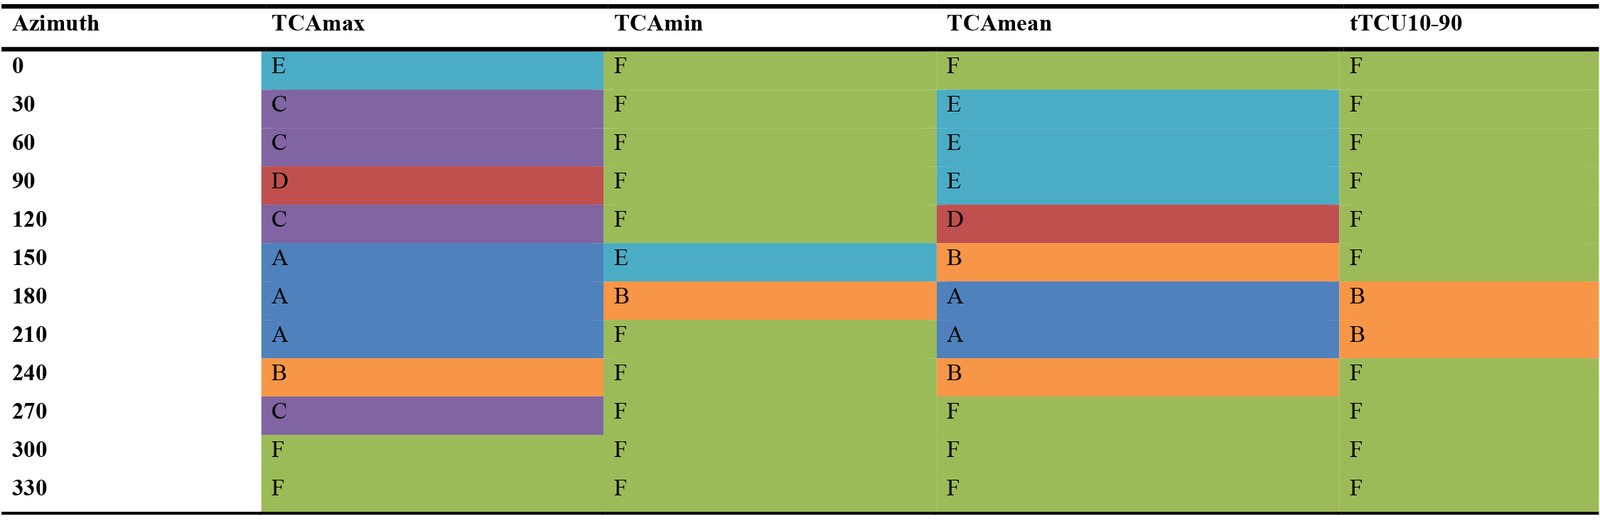
Table 6. Comparison of the optimal film for the 12 analyzed orientations, based on four different indicators: minimum and maximum Thermal Comfort Availability (TCAmin and TCAmax, respectively), average Thermal Comfort Availability (TCAmean) and time Thermal Comfort Usability (tTCU10-90).
Figure 10 shows that, in every configuration, the highest TCA value occurs in areas farther from the window, while the lowest value is found in the zone closest to the window. The tTCU10-90 indicator is strongly influenced by the TCA near the window (TCAmin), as this region represents the most critical area for thermal comfort – accounting for over 10% of the total floor area. Conversely, the TCAmax indicator is useful for identifying the best-performing film in areas farther from the window. Therefore, the selection of the most relevant performance indicator should depend on the intended use and occupancy pattern of the space.
While the tTCU10-90 indicator highlights reflective film F as the optimal alternative for nearly all orientations, the TCAmean indicator points to a more balanced solution – particularl for azimuths between 30° and 150°, where the best-performing film features intermediate Tsol values. These values are low enough to reduce heat-related discomfort near the window, yet still allow sufficient solar gains to help mitigate cold discomfort. This is a noteworthy finding, as absorbing films usually exhibit higher visible transmittance values than reflective films (in this case, 0.729 and 0.432 for films C and D, respectively), and therefore could offer a better balance between thermal and visual impacts.
4. Conclusion
The proposed framework enables a detailed and nuanced analysis of thermal comfort, offering valuable insights into the influence of short-wave solar radiation on indoor environments throughout a typical meteorological year. By accounting for spatial and temporal variations in solar exposure, the framework reveals significant disparities in thermal conditions between near-window zones and areas farther from windows, as well as notable differences in the performance of solar control films depending on orientation. These findings highlight the critical role of short-wave radiation in thermal comfort assessments, as neglecting solar effects or focusing solely on a central point may overlook essential spatial variations. Moreover, the integration of clothing adaptation into the framework allows for a more realistic evaluation of occupant comfort, demonstrating how adaptive behaviors can mitigate discomfort hours – reducing predicted warm discomfort by more than half and decreasing predicted cold discomfort hours by 28% on average across 12 orientations. This level of detail not only enhances the accuracy of comfort assessments but also supports the selection of optimal solar control strategies tailored to specific building orientations and occupant needs.
Regarding the case study, results indicated that, except in orientations with low exposure to direct solar radiation, solar control films are an effective solution for mitigating indoor thermal discomfort in cold arid climates. By reducing the solar transmittance of the window, SCFs decrease the percentage of hours with heat-related thermal discomfort, achieving zero occurrence for all orientations when using reflective films and considering clothing variations. Although the application of SCFs increases the number of hours associated with cold-related discomfort, the overall annual balance remains beneficial.
When considering the comfort hours averaged across the entire space, optimal performance is achieved with Film E (solar-absorbing, solar transmittance of 0.22) for east and northeast orientations, and with Film F (reflective, solar transmittance of 0.16 and emissivity of 0.49) for north, northwest, and west orientations. Furthermore, low solar transmittance films offer an additional benefit by homogenizing comfort conditions across the space, enabling adjustments to air system settings that improve thermal conditions throughout the entire thermal zone.
Window orientation has been demonstrated as a critical factor when evaluating the impact of solar control films (SCFs) on indoor thermal comfort. Both the magnitude of this impact and the selection of the optimal film, in terms of comfort hours, vary depending on the azimuth. The percentage improvement in the Thermal Comfort Availability (TCA) compared to the baseline is highest for northeast orientations (azimuths 30 and 60), highlighting the importance of analyzing intermediate orientations in addition to the traditionally studied four cardinal directions.
The analysis revealed that the effects of SCFs differ between the zone near the window and the zone farther away. Furthermore, the optimal film for each azimuth varies depending on whether the TCAmean or the tTCU10-90 metric is considered. These findings underscore the necessity of carefully selecting the thermal comfort indicator to support effective decision-making.
These results emphasize that the impact of a window's optical properties is complex and cannot be universally predicted. A nuanced approach is required, one that considers the balance between cold- and heat-related discomfort, the influence of orientation, the specific thermal comfort metric employed, and the occupant's position within the space (near or far from the window). This complexity suggests that no single film is ideal for all scenarios, as lower solar transmittance does not necessarily correlate with reduced discomfort. A more detailed and context-sensitive analysis is therefore essential.
4.1. Limitations and future work
The key findings of this study are derived from mean radiant temperature (MRT) calculations using OpenStudio, which interfaces with the EnergyPlus simulation engine, and from the application of the SolarCal model. While EnergyPlus has been extensively validated in numerous studies, SolarCal – despite its integration into ASHRAE Standard 55-2017 – has undergone validation in a more limited number of studies. Further in-field validation would therefore strengthen the reliability of the results presented here.
Several limitations arise from simplifications made within the proposed methodology. While hourly clothing adaptation is implemented, occupancy patterns are assumed to be static, and metabolic rates are considered constant, without accounting for variations due to posture, task intensity, or behavioral patterns. The SolarCal model also operates under steady-state assumptions and does not capture transient thermal adaptation or partial body exposure to sunlight. Moreover, the analysis was confined to a single space configuration in one climate zone, limiting the generalizability of the findings.
Future research will expand the scope of the analysis by incorporating a wider range of building typologies and climatic contexts, including mixed-mode and naturally ventilated environments. Moreover, the framework’s applicability could be enhanced by integrating real-time data streams (e.g., weather, occupancy, and sensor-based thermal conditions) to support dynamic control strategies. This could be achieved through thermal feedback loops that enable continuous adjustment of indoor conditions based on occupant thermal responses. Additionally, forthcoming studies will include a multi-objective performance evaluation of SCFs, addressing not only thermal comfort but also visual comfort parameters (e.g. daylight availability, glare control) and energy performance, thus providing a more comprehensive understanding of their role in climate-responsive retrofit strategies.
Funding
This research was supported by the National Scientific and Technical Research Council (CONICET, Grant PUE 0096) and the National Agency for the Promotion of Science and Technology (ANPCyT, Grant PICT 2019-04356).
Contributions
Maureen de Gastines: Conceptualization, Methodology, Software, Formal analysis, Investigation, Data curation, Writing, Visualization; Darío Jaime: Resources, Visualization, Software; Andrea Pattini: Supervision, Funding Acquisition.
Declaration of competing interest
The authors declare no conflict of interest.
References
- I. Jaffal, C. Inard, N. Ghaddar, and K. Ghali, A metamodel for long-term thermal comfort in non-air-conditioned buildings, Architectural Engineering and Design Management, 16:6 (2020) 441-472. https://doi.org/10.1080/17452007.2020.1719813
- N. Ma, Q. Zhang, F. Murai, W. W. Braham, and H. W. Samuelson, Learning building occupants ' indoor environmental quality complaints and dissatisfaction from text-mining Booking . com reviews in the United States, Building and Environment, 237 (2023) 110319. https://doi.org/10.1016/j.buildenv.2023.110319
- Y. Zhai, Y. Wang, Y. Huang, and X. Meng, A multi-objective optimization methodology for window design considering energy consumption, thermal environment and visual performance, Renewable Energy, 134 (2019) 1190-1199. https://doi.org/10.1016/j.renene.2018.09.024
- H. Teixeira, M. da G. Gomes, A. Moret Rodrigues, and J. Pereira, In-Service Thermal and Luminous Performance Monitoring of a Refurbished Building with Solar Control Films on the Glazing System, Energies, 14:5 (2021) 1388. https://doi.org/10.3390/en14051388
- B. Song, L. Bai, and L. Yang, The Effects of Exterior Glazing on Human Thermal Comfort in Office Buildings, Energies, 17:4 (2024) 776. https://doi.org/10.3390/en17040776
- H. Zhang, D. Duan, X. Yang, and W. Zheng, Application of CPMV * for improving the indoor thermal environment under global solar radiation, Indoor and Built Environment, 32:4 (2023) 797-814. https://doi.org/10.1177/1420326X221140299
- A. Chetouni, S. I. Kaitouni, and A. Jamil, Climate change impacts on future thermal energy demands and indoor comfort of a modular residential building across different climate zones Journal of Building Engineering, 102 (2025) 111927. https://doi.org/10.1016/j.jobe.2025.111927
- S. Murtyas, R. Qian, T. Matsuo, N. W. Tuck, S. A. Zaki, and A. Hagishima, Thermal comfort in a two-storey malaysian terrace house: Are passive cooling methods sufficient in present and future climates?, Journal of Building Engineering, 96 (2024) 110412. https://doi.org/10.1016/j.jobe.2024.110412
- C. Li, J. Tan, T. Chow, and Z. Qiu, Experimental and theoretical study on the effect of window films on building energy consumption, Energy and Buildings, 102 (2015) 129-138. https://doi.org/10.1016/j.enbuild.2015.04.025
- E. Moretti, E. Belloni, and E. Lascaro, The influence of solar control films on energy and daylighting performance by means of experimental data and preliminary unsteady simulations, Energy Procedia, 78 (2015) 340-345. https://doi.org/10.1016/j.egypro.2015.11.660
- J. Pereira, H. Teixeira, M. da G. Gomes, and A. M. Rodrigues, Performance of Solar Control Films on Building Glazing: A Literature Review, Applied Sciences, 12:12 (2022) 5923. https://doi.org/10.3390/app12125923
- R. G. Rodriguez, J. Yamin Garretón, and A. E. Pattini, Glare indicators : an analysis of ocular behaviour in an office equipped with venetian blinds, Indoor and Built Environment, 25:1, (2016) 69-80. https://doi.org/10.1177/1420326X14538082
- J. M. Monteoliva, J. A. Y. Garretón, and A. E. Pattini, Comparative Investigation of Daylight Glare Probability ( DGP ) Comfort Classes in Clear Sky Condition, Journal of Daylighting, 8 (2021) 284-293. https://doi.org/10.15627/jd.2021.22
- W. H. Ko et al., Window View Quality: Why It Matters and What We Should Do, Leukos, 18:3 (2022) 259-267. https://doi.org/10.1080/15502724.2022.2055428
- E. S. Lee, B. Szybinska, D. Geisler-moroder, S. E. Selkowitz, and L. Heschong, Advocating for view and daylight in buildings : Next steps, Energy and Buildings, 265 (2022) 112079. https://doi.org/10.1016/j.enbuild.2022.112079
- A. Oliveira and A. Pedrini, Thermal performance of highly glazed office buildings in the tropics : Contradicting architects ́ expectations, Energy and Buildings, 296 (2023) 113344. https://doi.org/10.1016/j.enbuild.2023.113344
- S. A. Moghaddam et al., Low-Emissivity Window Films as an Energy Retrofit Option for a Historical Stone Building in Cold Climate, Energies, 14:22 (2021) 7584. https://doi.org/10.3390/en14227584
- H. Wang, J. Hang, J. Yang, Z. Gao, J. Zhao, and F. Xu, Reduced-scale experimental study on the cooling effect of solar control films and cool materials, Energy and Buildings, 320 (2024) 114636. https://doi.org/10.1016/j.enbuild.2024.114636
- A. L. Navarro et al., Occupant-Centred Control strategies for Adaptive Facades : A preliminary study of the impact of shortwave solar radiation on thermal comfort, proceedings of Building Simulation 2019: 16th Conference of IBPSA, Rome, Italy, 2-4 September 2019, 4910-4917. https://doi.org/10.26868/25222708.2019.211013
- S. G. Hodder and K. Parsons, The effects of solar radiation on thermal comfort, International journal of biometeorology, 51 (2007) 233-250. https://doi.org/10.1007/s00484-006-0050-y
- S. Godbole, Investigating The Relationship Between Mean Radiant Temperature ( MRT ) And Predicted Mean Vote ( PMV ) A case study in a university building, KTH Royal Institute of Technology, 2018.
- M. Y. Chan and C. W. Mak, Thermal Comfort Levels in a Room with Solar Radiation, Indoor and Built Environment, 852 (2008) 516-524. https://doi.org/10.1177/1420326X08097388
- R. Hwang, P. Fang, and W. Chen, Impact of solar radiation on indoor thermal comfort near highly glazed façades in a hot-humid subtropical climate : An experimental evaluation, Build. Environ., vol. 243, no. August, p. 110725, 2023. https://doi.org/10.1016/j.buildenv.2023.110725
- A. M. Atzeri, Energy Efficiency, Thermal and Visual Comfort - Integrated Building Performance Modelling and Measurement. Bozen-Bolzano University Press: Bozen-Bolzano, Italy, 2017.
- L. Huang and Z. (John) Zhai, Critical review and quantitative evaluation of indoor thermal comfort indices and models incorporating solar radiation effects, Energy and Buildings, 224 (2020) 110204. https://doi.org/10.1016/j.enbuild.2020.110204
- M. M. Pinto and F. S. Westphal, Assessment of thermal comfort in workstations located near highly glazed façades: solar - adjustment models, Ambiente Construído, 22:4 (2022) 155-177. https://doi.org/10.1590/s1678-86212022000400634
- X. Xiang, Y. He, and N. Li, Evaluating annual thermal discomfort time ratio of indoor occupants caused by solar radiation using a novel model, Architectural Intelligence 3:1 (2024) 26. https://doi.org/10.1007/s44223-024-00072-1
- E. Arens, T. Hoyt, X. Zhou, L. Huang, H. Zhang, and S. Schiavon, Modeling the comfort effects of short-wave solar radiation indoors, Building and Environment, 88 (2015) 3-9. https://doi.org/10.1016/j.buildenv.2014.09.004
- A. ASHRAE, Thermal Environmental Conditions for Human Occupancy: ANSI/ASHRAE Standard 55-2017 (2017).
- D. Enescu, A review of thermal comfort models and indicators for indoor environments, Renewable and Sustainable Energy Reviews, 79 (2017) 1353-1379. https://doi.org/10.1016/j.rser.2017.05.175
- C. Huizenga, H. Zhang, P. Mattelaer, T. Yu, and E. Arens, Window performance for human thermal comfort, ASHRAE Transactions, 111:1 (2006) 254-275.
- P. Fang, Y. Lu, W. Chen, and R. Hwang, Impacts of glazing system design factors upon dynamic indoor thermal comfort incorporating solar radiation effects, E3S Web of Conferences, 396 (2023) 01030. https://doi.org/10.1051/e3sconf/202339601030
- S. Chaiyapinunt and N. Khamporn, Effect of solar radiation on human thermal comfort in a tropical climate, Indoor and Built Environment, 30:3 (2021) 391-410. https://doi.org/10.1177/1420326X19891761
- A. Zani, A. G. Mainini, J. D. B. Cadena, S. Schiavon, and E. Arens, A new modeling approach for the assessment of the effect of solar radiation on indoor thermal comfort, proceedings of 2018 Building Performance Analysis Conference and SimBuild, Chicago, USA, 26-28 September 2018.
- A. G. Kheybari, M. Gutai, B. Mok, and G. Cavana, Thermal comfort of standard and advanced glazed building envelopes, Energy and Buildings, 329 (2025) 115211. https://doi.org/10.1016/j.enbuild.2024.115211
- H. Teixeira, M. G. Gomes, A. Moret Rodrigues, and J. Pereira, Thermal and visual comfort, energy use and environmental performance of glazing systems with solar control films, Building and Environment, 168 (2020) 106474. https://doi.org/10.1016/j.buildenv.2019.106474
- E. Moretti and E. Belloni, Evaluation of energy , thermal , and daylighting performance of solar control fi lms for a case study in moderate climate, Building and Environment, 94 (2015) 183-195. https://doi.org/10.1016/j.buildenv.2015.07.031
- S. Chaiyapinunt and B. Phueakphongsuriya, Performance rating of glass windows and glass windows with films in aspect of thermal comfort and heat transmission, Energy and Buildings, 37 (2005) 725-738. https://doi.org/10.1016/j.enbuild.2004.10.008
- S. Chaiyapinunt and N. Khamporn, Selecting glass window with film for buildings in a hot climate, Engineering Journal, vol. 13:1 (2009) 29-42. https://doi.org/10.4186/ej.2009.13.1.29
- M. C. Singh, S. N. Garg, and R. Jha, Different glazing systems and their impact on human thermal comfort - Indian scenario, Building and Environment, 43 (2008) 1596-1602. https://doi.org/10.1016/j.buildenv.2007.10.004
- S. Zhang, J. Fine, M. F. Touchie, and W. O'Brien, Quantifying overheating in highly glazed buildings and evaluationg films as a mitigation strategy, Proceedings of 2nd International Conference on New Horizons in Green Civil Engineering (NHICE-02), Victoria, Canada, 26-28 August 2020, pp. 178-181.
- H. Teixeira, M. G. Gomes, A. M. Rodrigues, and D. Aelenei, Solar responsive building glazing : Experimental analysis of the impact of photochromic glazing on indoor thermal and luminous conditions, Journal of Building Engineering, 92 (2024) 109812. https://doi.org/10.1016/j.jobe.2024.109812
- J. Liu, R. Yao, and R. Mccloy, An investigation of thermal comfort adaptation behaviour in office buildings in the UK, Indoor and Built Environment, 23:5 (2014) 675-691. https://doi.org/10.1177/1420326X13481048
- M. De Carli, B. W. Olesen, A. Zarrella, and R. Zecchin, People ' s clothing behaviour according to external weather and indoor environment, Building and Environment, 42 (2007) 3965-3973. https://doi.org/10.1016/j.buildenv.2006.06.038
- J. Conejo Fernández, Towards occupant-based building performance simulations : Considering Spatial Thermal Comfort Conditions and Personal Clothing Adaptation in the Evaluation of Sun-Irradiated Indoor Environments, Free University of Bozen-Bolzano, 2021.
- R. Yang, H. Zhang, S. You, W. Zheng, and X. Zheng, Study on the thermal comfort index of solar radiation conditions in winter, Building and Environment, 167 (2020) 106456. https://doi.org/10.1016/j.buildenv.2019.106456
- T. Kramer, S. Schiavon, and V. Garcia-Hansen, Spatial Thermal Autonomy ( sTA ): A New Metric for Enhancing Building, Proceedings of CATE 2024 Conference, Seville, Spain, 20-22 November 2024. https://escholarship.org/uc/item/9pj5g228.
- P. Li et al., Improved long-term thermal comfort indices for continuous monitoring, Energy and Buildings, 224 (2020) 110270. https://doi.org/10.1016/j.enbuild.2020.110270
- A. M. Atzeri, F. Cappelletti, A. Tzempelikos, and A. Gasparella, Comfort metrics for an integrated evaluation of buildings performance, Energy and Buildings, 127 (2016) 411-424. https://doi.org/10.1016/j.enbuild.2016.06.007
- E. Jalilzadehazhari, P. Johansson, J. Johansson, and K. Mahapatra, Developing a decision-making framework for resolving conflicts when selecting windows and blinds, Archit. Eng. Des. Manag., 15:5 (2018) 357-381. https://doi.org/10.1080/17452007.2018.1537235
- S. Nazari, A multi-objective optimization approach to designing window and shading systems considering building energy consumption and occupant comfort, Eng. Reports, 5:10 (2023) 12726. https://doi.org/10.1002/eng2.12726
- J. Zhao and Y. Du, Multi-objective optimization design for windows and shading configuration considering energy consumption and thermal comfort: A case study for office building in different climatic regions of China, Solar Energy, 206 (2020) 997-1017. https://doi.org/10.1016/j.solener.2020.05.090
- A. Rubel and A. R. Joarder, Performance of Shading Against West Glass Facades to Optimise Daylight , Thermal Comfort and Energy Efficiency of Office Buildings, Journal of Daylighting, 11 (2024) 131-148. https://doi.org/10.15627/jd.2024.8
- F. Rezaei, H. Sangin, M. Heiranipour, and S. Attia, A Multi-objective Optimization of Window and Light Shelf Design in Office Buildings to Improve Occupants ' Thermal and Visual, Journal of Daylighting, 11 (2024) 55-68. https://doi.org/10.15627/jd.2024.4
- S. Schiavon and K. H. Lee, Dynamic predictive clothing insulation models based on outdoor air and indoor operative temperatures, Building and Environment, 59 (2013) 250-260.
- Y. Ibrahim, Integration of Advanced Techniques for The Optimisation of Energy Consumption and The Mitigation of Urban Heat Island, University of Bath, 2022.
- M. de Gastines and A. E. Pattini, Window energy efficiency in Argentina - Determining factors and energy savings strategies, Journal of Cleaner Production, 247 (2020), 119104. https://doi.org/10.1016/j.jclepro.2019.119104
- J. Kim, C. Caradonna, and A. Parker, Window Film, ComStock, 2023. https://nrel.github.io/ComStock.github.io/docs/upgrade_measures/env_window_film.html (accessed 7 July 2025).
- L. K. Lawrie and D. B. Crawley, Development of Global Typical Meteorological Years (TMYx). https://climate.onebuilding.org, (paper in progress), 2022.
- M. de Gastines, E. Correa, and A. Pattini, Impacto de la consideración de marcos de ventana en la estimación de consumo energético edilicio, in Proceedings of XIV ENCAC - X ELACAC, Balneário Camboriú/SC., Brazil, 27-29 September 2017, pp. 1647-1655.
2383-8701/© 2025 The Author(s). Published by solarlits.com. This is an open access article distributed under the terms and conditions of the Creative Commons Attribution 4.0 License.

3009
Total views
Citations
SHARE ON


