Volume 12 Issue 2 pp. 420-440 • doi: 10.15627/jd.2025.26
Evaluating the Impact of Lighting Conditions on Workers’ Safety and Health in Industrial Settings
Dalia Abdelfattah,1,2,* Sahar Abdelwahab,1,3 Mohamed Z. Eldars,1 Mohammed S. Mayhoub1
Author affiliations
1 Architecture Department, Faculty of Engineering, Al-Azhar University, Cairo, Egypt
2 Cairo Higher Institute of Engineering, Computer Science and Management, Egypt
3 Leicester School of Architecture, De Montfort University, Leicester, UK
*Corresponding author.
daliaabdelfatah@azhar.edu.eg (D. Abdelfattah)
sahar.abdalrahman@dmu.ac.uk (S. Abdelwahab)
pac_zak@yahoo.com (M. Z. Eldars)
msm@azhar.edu.eg (M. S. Mayhoub)
History: Received 26 April 2025 | Revised 3 August 2025 | Accepted 19 August 2025 | Published online 12 October 2025
2383-8701/© 2025 The Author(s). Published by solarlits.com. This is an open access article distributed under the terms and conditions of the Creative Commons Attribution 4.0 License.
Citation: Dalia Abdelfattah, Sahar Abdelwahab, Mohamed Z. Eldars, Mohammed S. Mayhoub, Evaluating the Impact of Lighting Conditions on Workers’ Safety and Health in Industrial Settings, Journal of Daylighting, 12:2 (2025) 420-440. doi: 10.15627/jd.2025.26
Figures and tables
Abstract
Lighting is a key element of design that plays a significant role in affecting workers’ health and safety in industrial workspaces. Given the scarcity of scientific studies addressing visual environments in relation to workers health in industrial buildings, this field study was conducted to explore workers' responses to multiple lighting scenarios inside production halls on their occupational health and safety in six factories in Sadat City, Egypt. Self-assessments of 456 factory workers during day and night shifts were collected and correlated to light measurements collected at the factories. The statistical analysis of data revealed a significant reduction in workers reporting eye strain, alleviating headaches, and enhancing the ability to concentrate under daylight conditions compared to mixed and/or artificial lighting conditions. Moreover, it was found that lighting levels lower than 140 lux led to visual fatigue(p=0.03), headaches (p=0.014), drowsiness (p=0.004), and rapid loss of concentration (p=0.149) among workers. Poor lighting was shown to increase the likelihood of making occupational errors. Despite the health benefits of natural light compared to artificial lighting, glare from sunlight can sometimes cause headaches. This study emphasizes the importance of improving lighting quality in production halls within industrial environments, as it is a crucial factor in maintaining the health and safety of workers and enhancing professional performance.
Keywords
industrial workplaces, integrated lighting, light characteristics, non-visual effects
1. Introduction
Recently, human health, safety, and productivity have become a major focus of indoor lighting research [1]. Human health is affected by light through both visual and non-visual systems [2]. Light influences not only vision but also circadian rhythm, hormone secretion, and levels of alertness and attention. These effects, known as non-image forming effects (NIFs), are mediated by melanopsin-sensitive retinal ganglion cells (ipRGCs) and play a pivotal role in regulating sleep-wake rhythms and circadian activity levels. Medical research has shown that light stimulates the brain's internal timing systems [3], directly impacting physical and emotional health and the sleep-wake cycle [4-5]. In the absence of natural light, artificial lighting becomes crucial to ensuring adequate vision and visual comfort [1,5]. Lighting also affects the hormones melatonin and serotonin, leading to effects on sleep, mood, and blood pressure [6-8]. On the other hand, light influences the visual systems, whereby improper lighting design can cause headaches, eye strain, interference with circadian rhythms, and falls [2,9]. The results of a study [10], in which researchers examined the visible and invisible effects of light within work cells, with measurements made at work surfaces and operators' eye level, revealed that lighting values that met regulatory standards provided good support for circadian rhythms.
In the context of day/night shift workplaces, social jet lag is a disorder that can have serious implications for people's health and well-being. It is a consequence of modern work patterns that cause misalignment between circadian and social and cultural clocks of modern work patterns that cause a mismatch between circadian and sociocultural clocks [11-12]. While most lighting studies have focused on office, school, and healthcare environments, industrial settings are still overlooked by a lack of research on the impact of lighting on worker health and safety [13-16]. This represents a clear research gap that warrants further study, especially since these environments require high visual performance and rapid response.
Factory systems are highly personal environments, involving direct interactions between workers, production lines, and machinery. Workers' tasks range from operation, monitoring, manual inspection, and assembly, all of which require clear vision and rapid response to changes. Given the continuous nature of industrial operations in many factories, work systems often rely on shifts, including night shifts, to ensure continuous production. In this context, artificial lighting becomes the primary source of light, especially during the night hours, making its quality a critical factor in supporting visual performance and mental alertness. In this context, there is a need to carefully study the impact of lighting conditions on workers to ensure they are compatible with the requirements of night work. This reduces the likelihood of problems related to reduced visual efficiency or decreased attention, which may result in errors, fatigue, drowsiness, and headaches, all of which affect performance and occupational safety in the factory environment. Studies have shown that night shift work is associated with circadian disruption, which impacts physical and mental health [17-18]. Night shifts force workers to sleep and work at times that are inconsistent with their circadian rhythms, disrupting melatonin production and its regulatory functions [19-22]. As such, lighting plays a pivotal role in this context, as its timing, intensity, and spectrum affect non-visual photoreceptors (ipRGCs). This suggests that lighting patterns can disrupt sleep and increase drowsiness, which can negatively impact on workers' health and safety.
Recently, research studies have focused attention on nighttime lighting design. For example, Figueiro et al. (2016) indicated that exposure to red light during night shifts may enhance alertness and performance without inhibiting melatonin secretion, unlike white light, which improves performance but disrupts circadian rhythms [23]. Another study [24] also indicated that workers' exposure to intense light in the morning and before their lunch break (1440 lux compared to 70 lux) increased their sense of alertness during work, especially in the afternoon. A study by Sadeghniiat-Haghighi [19] also showed that exposing night shift workers to bright light (~2500 lux) during their break reduced drowsiness by 22% compared to average lighting (300 lux), indicating the effectiveness of bright light in improving alertness during extended work shifts. Regarding visual effects, numerous studies have demonstrated the effective role of lighting in reducing accidents and visual illnesses in the workplace in general, as well-designed lighting reduces the number of occupational accidents and eye diseases [25]. Insufficient lighting in the workplace can contribute to worker fatigue [17], disturb occupants, and affect their visual performance in general tasks [26]. Moreover, insufficient lighting has been shown to cause eye strain and discomfort due to glare and flicker [27-28], as well as eye irritation, blurred vision, and headaches [29]. Previous research examined the effect of indoor lighting on eye strain and headaches among 100 workers in a Slovakian factory. The results concluded that lighting conditions, whether high, low, or too bright, affect eye function and cause eye strain [1]. Furthermore, the potential for workplace accidents caused by glare was identified [20].
The evidence suggests a potential relationship between lighting conditions in industrial work environments and workers' perception, performance, and the likelihood of accidents and visual stress. However, understanding of this relationship remains limited due to a lack of rigorous research. To date, recommendations for determining the appropriate lighting quality for shift workers are still under development [20,30]. Additionally, given the prevalence of night work in large sectors [18], the need for lighting solutions that combine visual and non-visual effects is increasing, a concept known as "integrated lighting" as defined by the International Commission on Illumination [31]. In this regard, lighting recommendations for luminous quantities (visual effects) and melanopic (non-visual effects), were reviewed in the following sections.
Visual effects: The recommendations set by the Egyptian Code for Lighting in the Work Environment are a minimum of 300 lux in assembly shops and 500 lux in precision industries [32]. This is consistent with the recommendations of the Chartered Institute of Building Services Engineers (CIBSE) and the Illuminating Engineering Society of North America (IESNA) for a minimum of 500 lux on the work surface in office environments. According to European standard EN 12464-1:2021 [33], lighting requirements for industrial assembly tasks are determined based on their precision, recommending an illumination of at least 300 lux for coarse collection, 500 lux for medium collection, and up to 1000 lux or more for fine-grained tasks. Moreover, it is required to maintain uniformity and a color rendering index (CRI) of at least 80 [10]. The standards also stipulate that the minimum illumination requirement may be increased in the event of poor natural light, high visual resolution requirements, or prolonged task duration.
Non-visual effects: To achieve the term "integrated illumination," specific metrics have been proposed to quantify the degree of light-induced stimulation of the non-visual system, complementing the traditional light quantities already in use. Currently, there are two main metrics:
The first is the Circadian Stimulus (CS), developed by Marina Figueiro [34], which measures the human response to light through the melatonin suppression ratio. It recommends exposure to high levels of light during the day (CS ≥ 0.3) [35], particularly in the morning hours, to promote regulation of the circadian rhythm and improve alertness and mood, while minimizing exposure to high-melanopic light in the evening to avoid sleep disturbances.
The second is the Melanopic Equivalent Daylight Illuminance (mel-EDI), an internationally recognized metric defined by the Commission International on Illumination in CIE S 026:2018. (CIE) [36], as well as the WELL Building Standard V.1, developed by the International Building Institute (IWBI) in New York, USA in 2014 [37], recommends exposure to at least 250 lux of melanopic illumination (EDI) at eye level during daylight hours. Mel-EDI is a SI-compliant measure based on the spectral response of the light-sensitive pigment melanopsin. This measure is defined as the luminous intensity produced by irradiance equivalent to standard daylight (D65), which produces the same level of melanopic stimulation as the light source under consideration [38].
2. Study aim
This study postulates that lighting characteristics could influence the health and safety of workers. The aim of this study is to investigate the effects of lighting characteristics of indoor lighting, i.e., daylight from natural, natural and artificial sources and nightlight from artificial sources—on the health and safety of workers in industrial environments (i.e., factories). The following hypothesis is put forward:
- There is a correlation between lighting characteristics and workers' safety related to workplace errors or injuries
- There is a correlation between lighting characteristics of lighting illuminance and color temperature, versus workers' physiological health related to eye fatigue and strain, headache, drowsiness, and loss of concentration and their operational safety, identified by the number of errors or injuries at work.
To achieve the study aim, a set of objectives was set as follows:
- Evaluating the extent to which lighting conditions in industrial work environments affect workers' physiological health by gathering workers' experiences of eye strain, headache and drowsiness during day and night light shifts.
- Evaluating the extent to which lighting conditions in industrial work environments affect workers' safety by gathering workers' feedback on the number of errors or injuries at work.
3. Methodology
The lead author of this paper is conducting a doctoral study on workers' responses to indoor lighting. A field study was designed to investigate the effects of indoor lighting on workers' visual and non-visual responses in industrial workplaces. This paper presents the scope of the project, focusing on the health and safety of workers.
A field study was conducted in Sadat City, Egypt, an industrial city with a hot-dry climate, located at 30.4182° latitude, 30.5747° longitude, 30° 25′ 6″ north latitude, and 30° 34′ 29″ east longitude. To fulfil the research aim, a survey was used to collect workers’ responses. The survey method has been widely used in indoor lighting research and subjective visual responses [39-40].
Both the self-assessment and illumination measurements were conducted in mid-February 2023. To better understand the relationship between lighting and workers' health and operational safety measures under seasonal changes, the self-assessment was repeated during the summer of the same year. Lighting measurements of illuminance (horizontal-vertical), Correlated Color Temperature (CCT), and Color Rendering Index (CRI) were collected at various times during night and day shifts. The study sample and case studies were selected based on criteria explained in the following sections.
3.1. Case Studies
A set of selection criteria was imposed to facilitate the robustness of the data and generalization of the findings, as shown below:
- The industrial buildings should be in similar climatic regions to reduce external variability in climatic conditions and study population sample, while ensuring the reliability of data with a sufficient sample size.
- The field includes spaces that rely on daylighting and/or mixed lighting (natural and artificial) during day shifts, as well as artificial lighting during night shifts.
- The case studies should be production halls, where workers spend periods of no less than 8 hours during day and night shifts- for six days a week, to count sufficient exposure time and ensure the reliability of subjective responses under day/night shifts.
- Factories with precision industries that require special lighting standards were excluded.
- Accessibility of data collection at various times of the day (morning, noon, and evening), approved by the responsible administrative authority. Additionally, the availability of data and information related to workers, productivity, and error rates after approval by the administrative authority responsible.
Based on the criteria mentioned above, six case studies were selected. Figure 1-6 shows the case studies, with each figure including (a)floor plan, (b) production Hall internal view, and (c) external view). Table 1 summarizes the details of the selected case studies, zone, type of industry, and the type of light source(s) available in production halls.
Figure 1
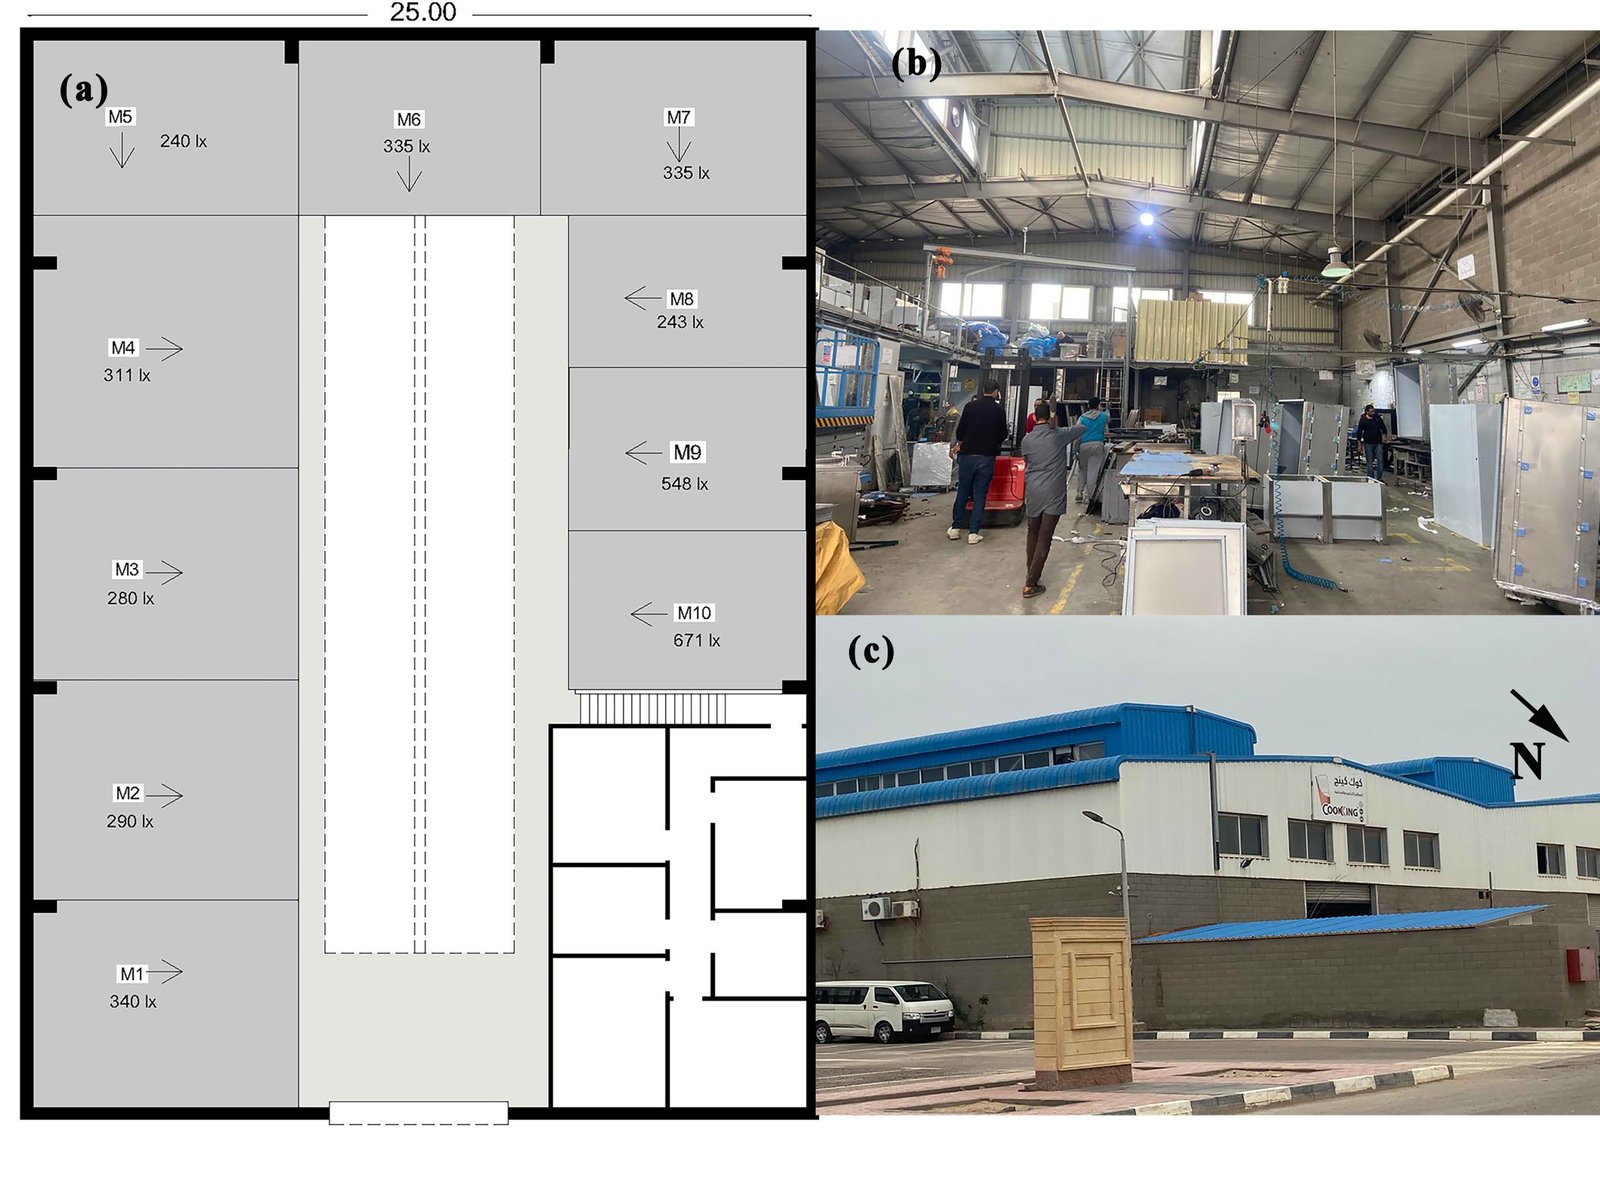
Fig. 1. Case study 1, (a) floor plan, (b) production hall internal view, and(c) external view.
Figure 2

Fig. 2. Case study 2, (a) floor plan, (b) production hall internal view, and(c) external view.
Figure 3
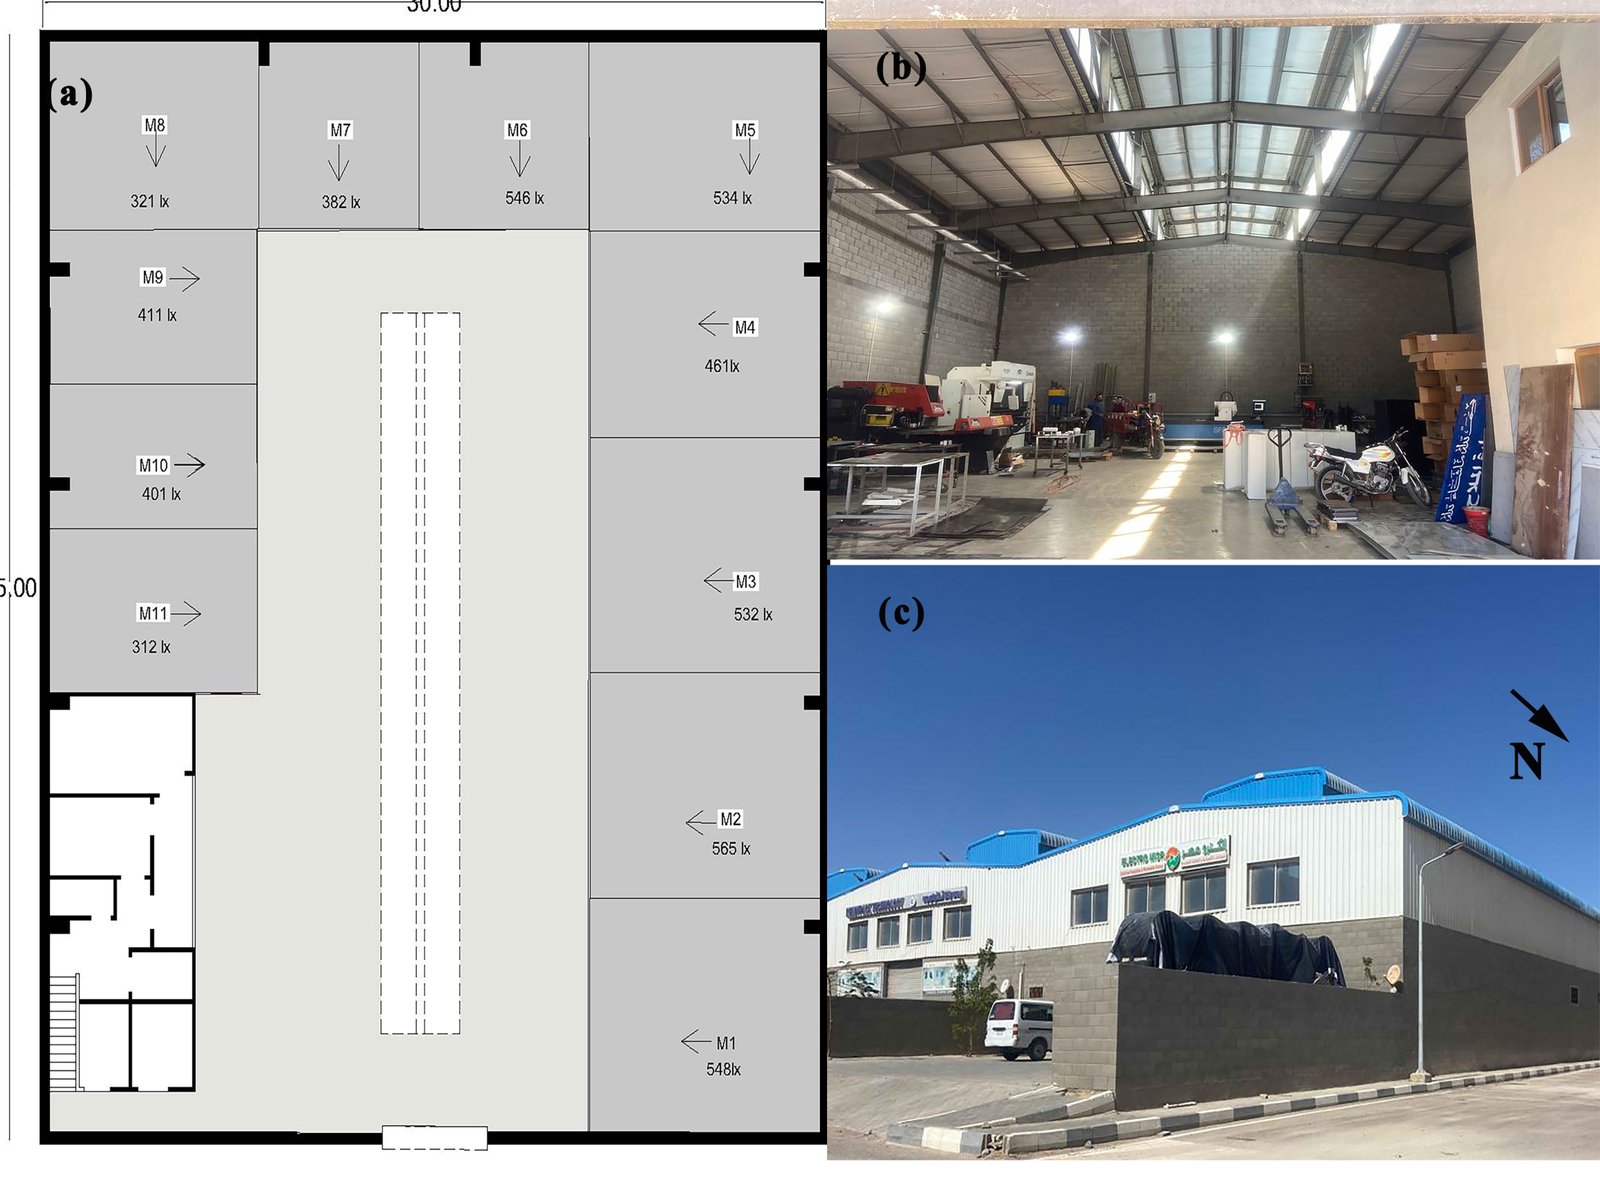
Fig. 3. Case study 3, (a) floor plan, (b) production hall internal view, and(c) external view.
Figure 4
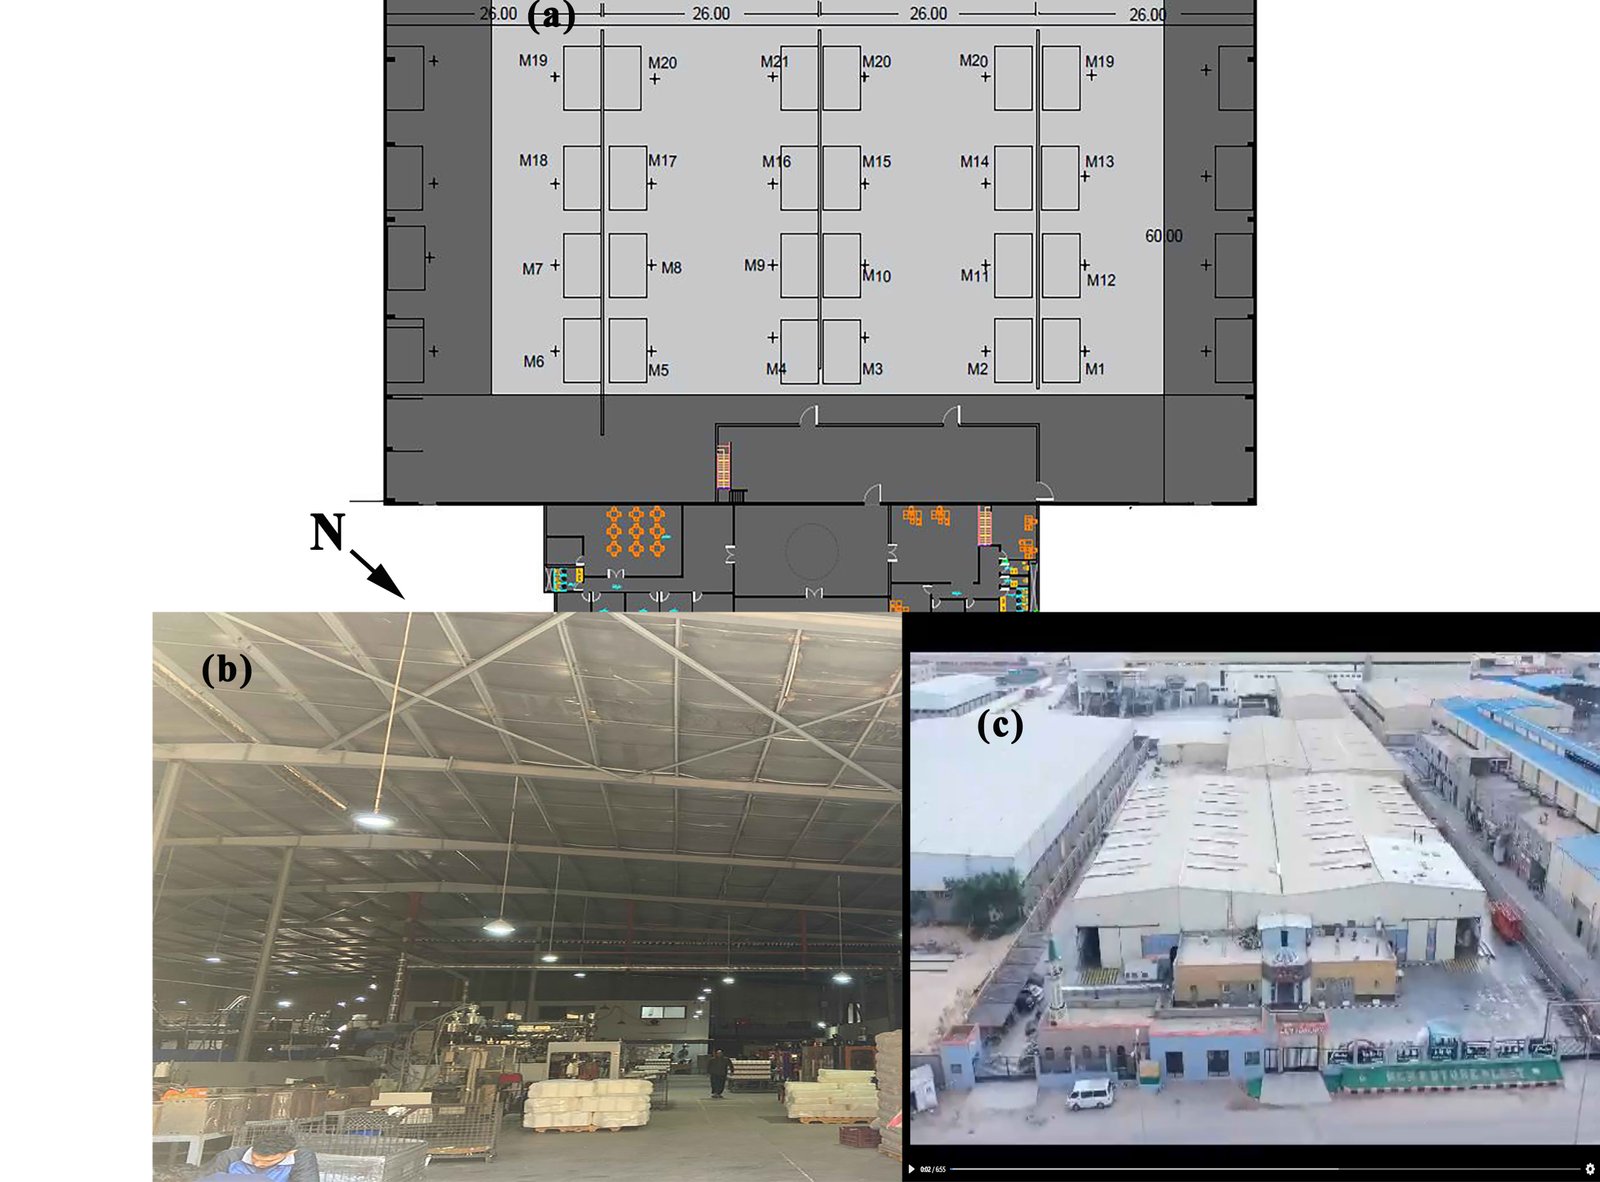
Fig. 4. Case study 4, (a) floor plan, (b) production hall internal view, and(c) external view.
Figure 5
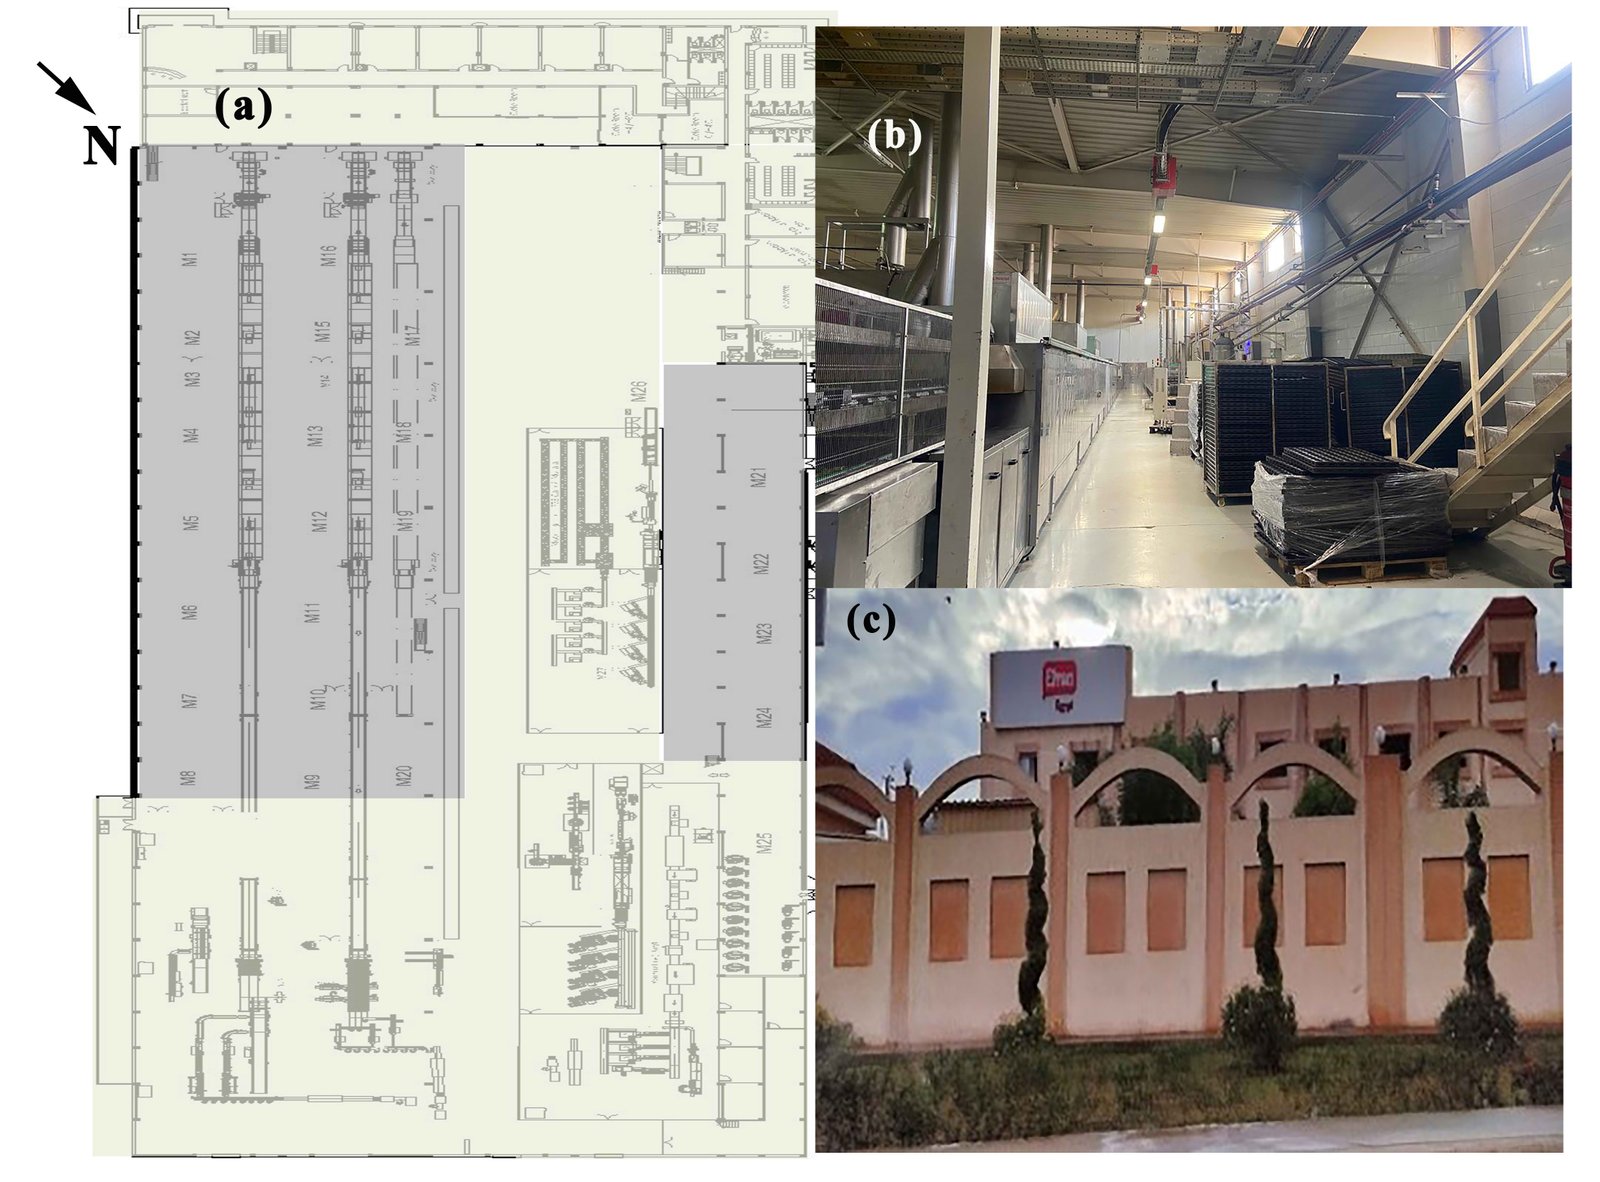
Fig. 5. Case study 5, (a) floor plan, (b) production hall internal view, and(c) external view.
Figure 6
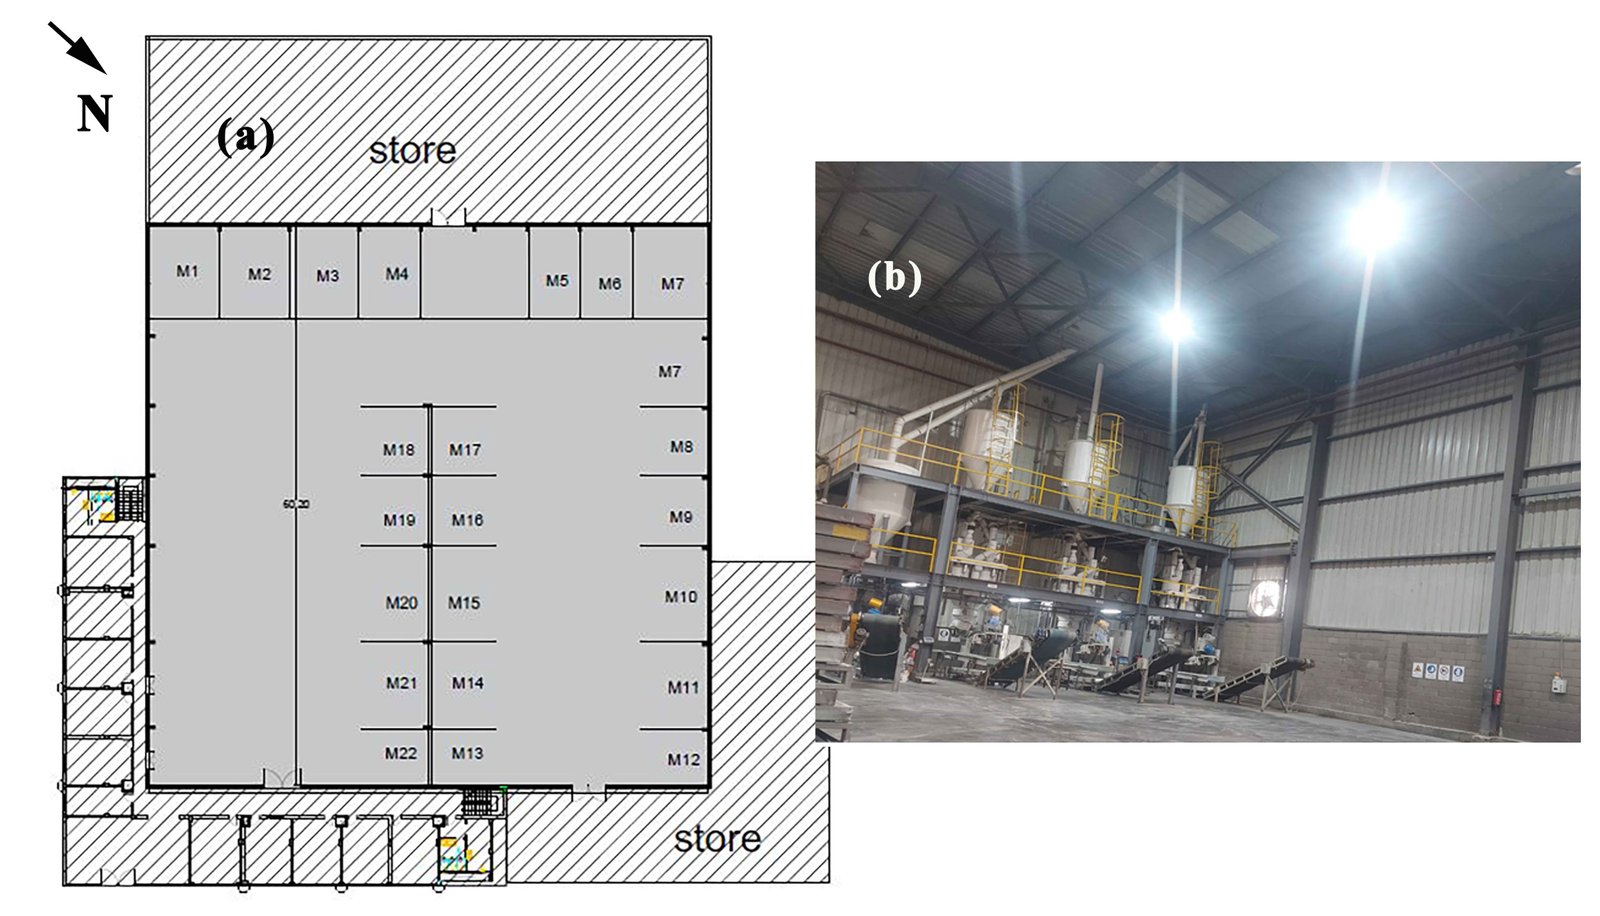
Fig. 6. Case study 6 (a) floor plan, (b) production hall internal view, and (c) external view.
Table 1
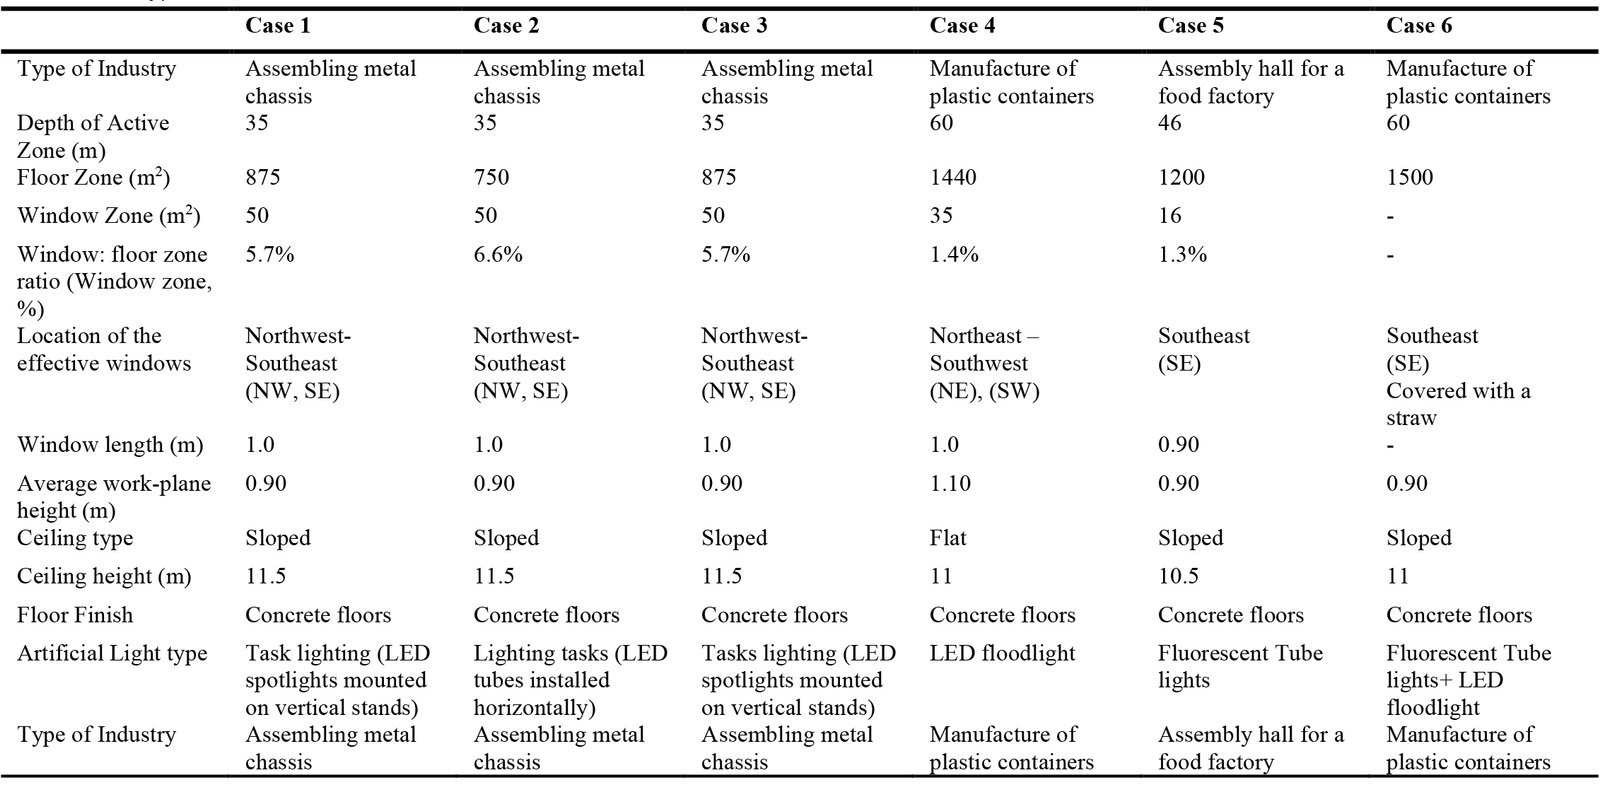
Table 1. Optical properties of base case clear glass and analyzed Solar Control Films (Tsol = solar transmittance, Rsol1 = front solar reflectance, Rsol2 = back solar reflectance, Tvis = visible transmittance, Rvis1 = front visible reflectance, Rvis2 = back visible reflectance, emis1 = front emissivity, emis2 = back emissivity).
3.2. Light measurements
A GL SPECTIS 1.0 touch spectrometer was used to measure illumination levels (horizontal and vertical), correlated color temperature (CCT), and color rendering index (CRI) during daytime. To record horizontal illuminance (Eh), the spectrometer was mounted horizontally at the level of the workers' work surface (0.9–1.2 m). The spectrometer was oriented vertically to monitor the vertical illuminance (Ev) toward the workers' eyes [41-42]. Equivalent melanopic illuminance (EML) and equivalent daylight illuminance (E-MDI) values were calculated. These values were recorded at each worker's position as shown in Table 1. Light measurements were collected for two lighting scenarios: 1) natural lighting, i.e., a combination of natural and artificial lighting during the daytime, and 2) artificial lighting during the night shift. The measurement points were based on the workers' locations in each factory.
3.3. Questionnaire design and administration
The design of the questionnaire was based on workers' self-assessment of the impact of indoor lighting on their health and operational safety at work. The original questionnaire was divided into 24 questions, exploring visual and non-visual responses to light. This research presents a section of the questionnaire focused on health and safety. Nine questions (listed in Table 2) were used after the demographic questions, based on workers' self-assessment of the likelihood of errors and injuries at work, or experiencing eye fatigue, headaches, drowsiness, and loss of concentration. The questionnaire questions were derived from previous studies on health and operational safety [1,29,43] and initially developed in English and subsequently translated into Arabic by a professional translator. To ensure accuracy, the translation was reviewed and then back translated into English by a second translator.
Table 2
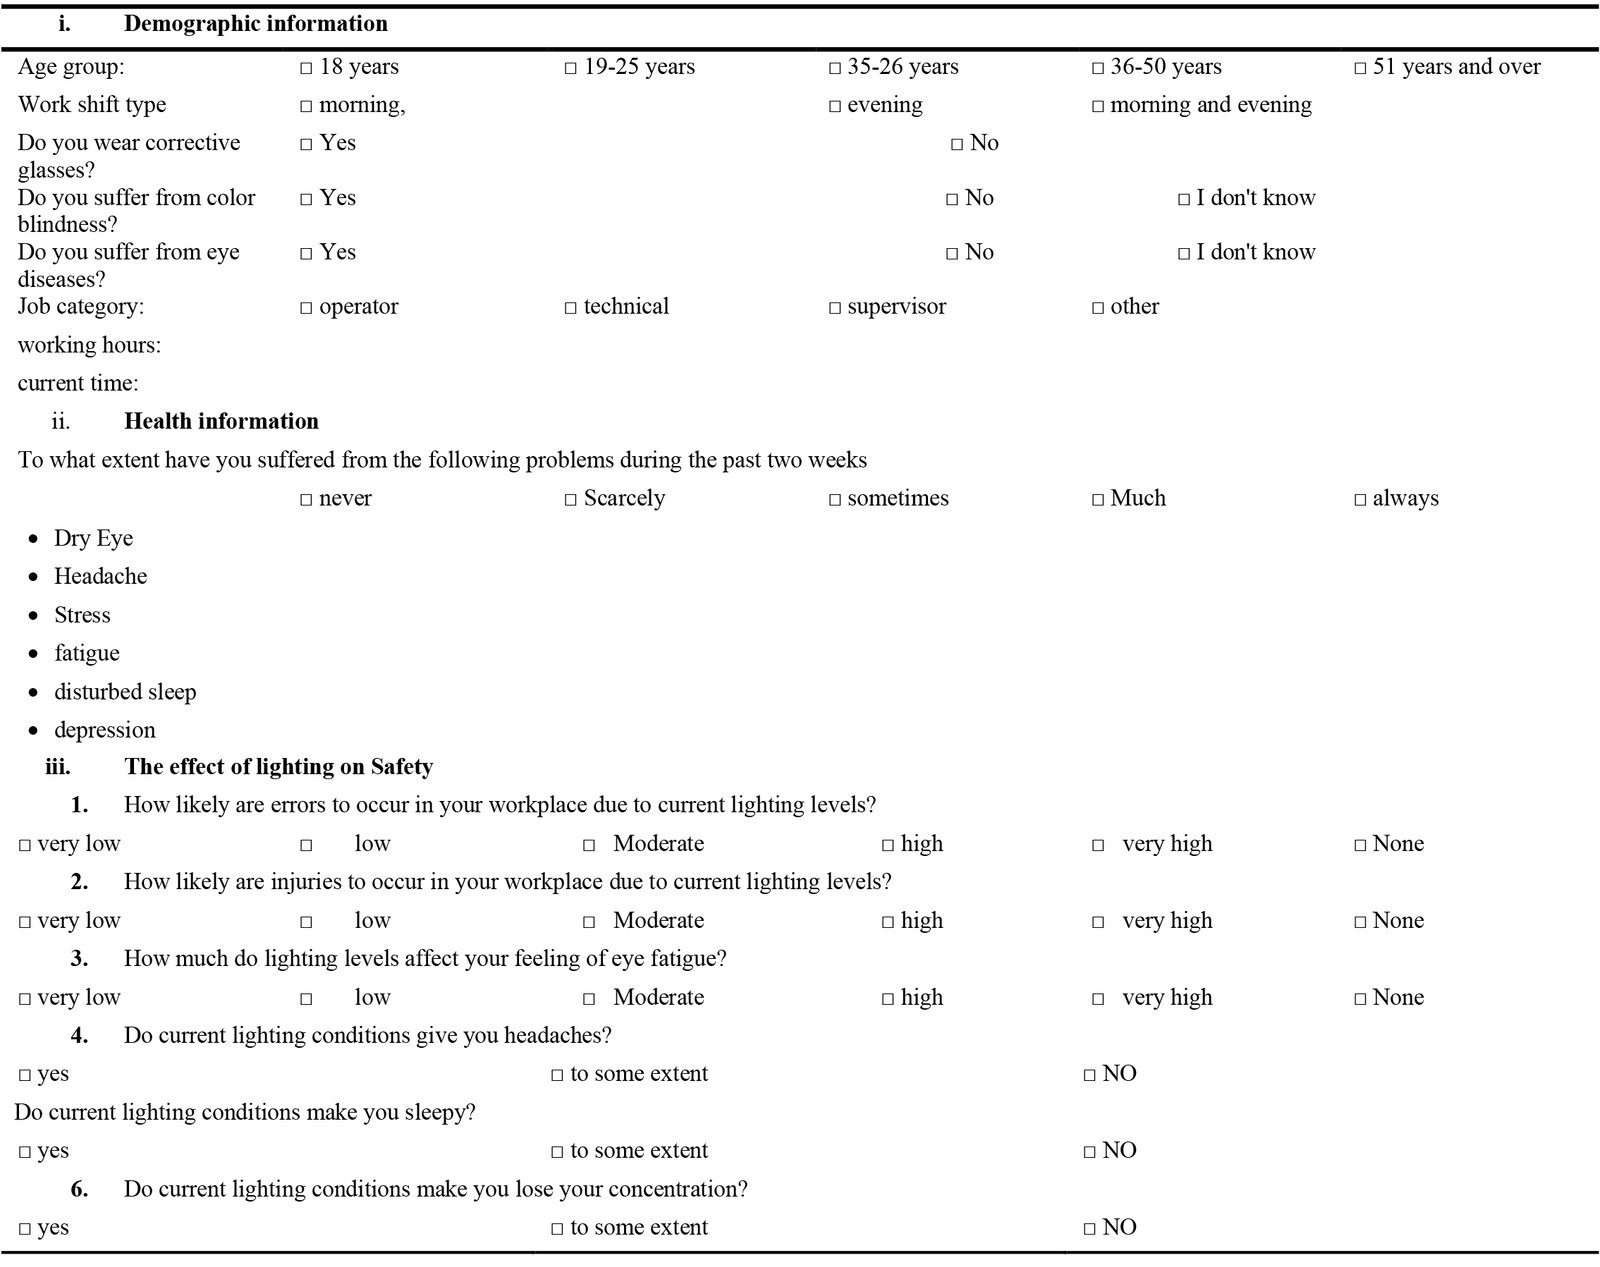
Table 2. Questionnaire.
3.4. Participants
The following criteria were applied to select participants:
- Participants must be from the category of workers who spend at least 8 full hours in the production halls.
- The workers must not suffer from any visual, health, or psychological problems that could affect their responses.
- The workers must have worked in the factory for at least two months to ensure adaptability and proper time exposure to the existing light conditions.
- The workers must agree to conduct the questionnaire at all times specified by the study during the day, following the approval of the administrative body responsible.
The number of participating workers was determined using the Krejcie & Morgan equation for limited communities, such as the community of workers in factories in general [44]. The following Eq. (1) was applied:
where:
d: The error rate that can be exceeded, with a maximum value of 0.05.
z: The standard deviation corresponds to a 95% confidence level and to an allowable error of 0.05, which is equal to 1.96.
p: The response rate, which represents the population density, is equal to 0.5.
n: The minimum size to calculate the sample size of the study
When substituting in this equation, it resulted in a minimum sample size of 385 subjects.
In total, 456 factory workers in day and night shifts were recruited, (Table 3). Participants' ages ranged from 19 to 39 years (mean =30.45). No visual problems or severe health problems were reported.
Table 3
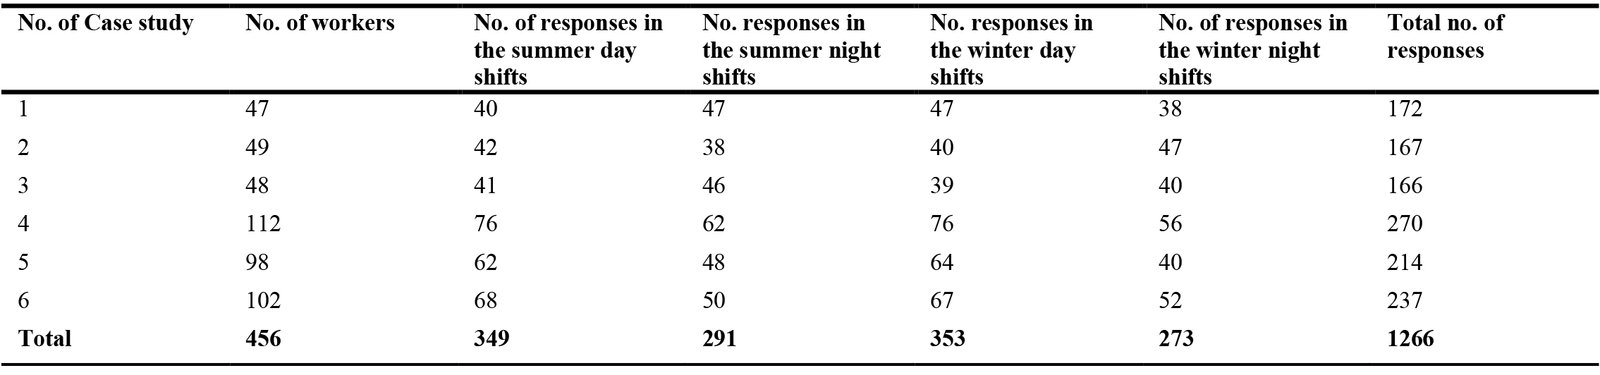
Table 3. Number of participants in each case study.
3.5 Layout of Worker Distribution within Production Halls
The nature of the workforce within the factories under study varies depending on the type of industry and production lines. However, the general pattern shows a recurrence of specific job categories,
including operators, assemblers, quality inspectors, and packaging workers. Fig. 7. shows the layout of workers within the production halls in the case studies. In the first three factories (cases 1–3), which specialize in the manufacture of metal chassis, workers are stationed around large U-shaped worktables, working in collaborative teams at various stages, such as bending, assembly, and inspection. It should be noted that some workers are not fixed in their positions, moving between tables to perform flexible tasks as needed.
Figure 7
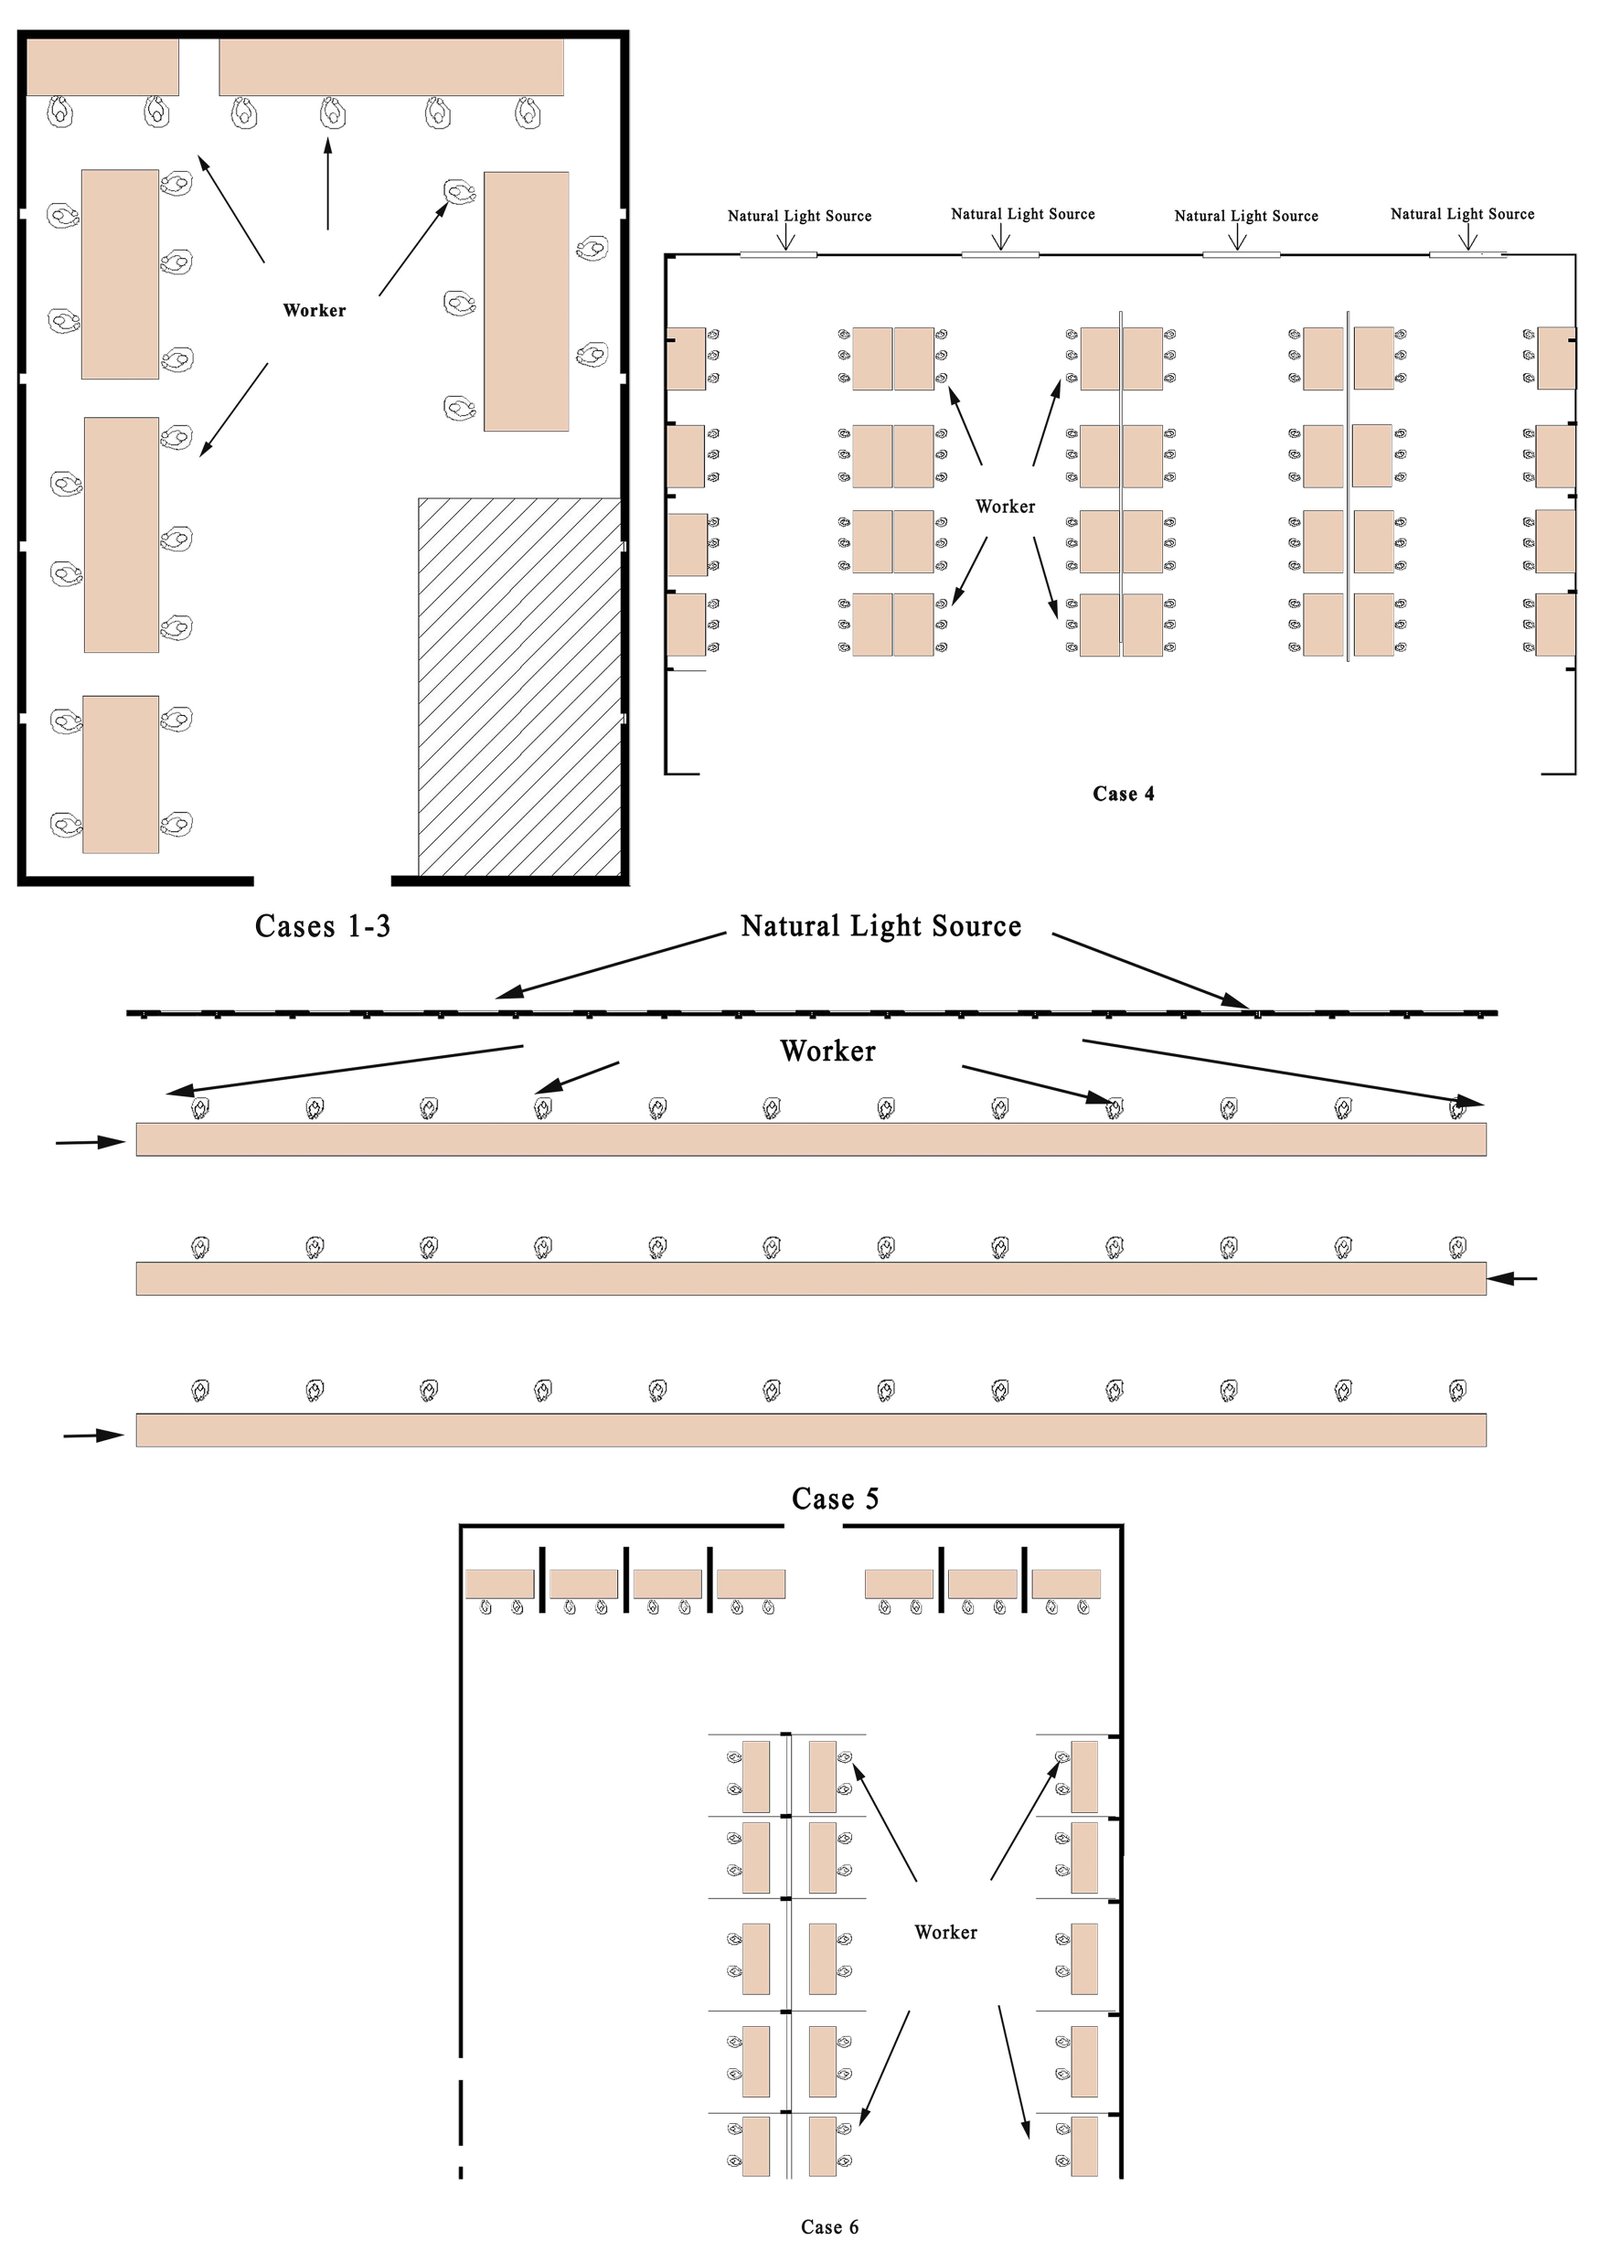
Fig. 7. Layout of Worker Distribution within Production Halls.
In the fourth case, a factory producing plastic containers and bottles, the work is organized around injection or blow molding machines. Approximately three workers are stationed at each machine, manually performing tasks such as assembling the product from the mold after forming, trimming excess plastic, and monitoring the quality of the final product. Work in this type of factory relies on direct coordination between humans and machines, keeping the workforce semi-fixed around the operating positions but constantly interacting with the machines' output. There are also non-fixed workers, such as quality inspectors. In the fifth factory, which specializes in the food industry, there is a fixed production line that passes through several stages, from manufacturing to packaging. Workers are clustered along this line, with some assigned to monitor the product as it passes through, while others focus on packaging tasks. This environment requires a consistent and organized presence around the production process to ensure efficiency and quality. The sixth factory, which produces plastic containers, follows a similar pattern to the fourth, with workers deployed around forming machines and performing manual product handling and quality inspections, as well as final product packaging.
3.6. Statistical tests
The validity and reliability of the questionnaire questions were tested using Cronbach's alpha test. The evaluation score for each individual part ranged from 0.68-0.90, which indicates the clarity of the questions, the appropriateness of the answer method, and the possible generalizability of the results [45]. The collected data was analyzed using IBM SPSS version 26. After filtering the participants’ answers from contradictory answers and missing data and excluding participants with missing data, 456 valid questionnaires remained, as shown in Table 3 Descriptive analysis was first presented to summarize the responses and photometric measures and identify key trends of results. The Kolmogorov-Smirnov test was used to verify the normality of the distribution of variables. The correlations between the independent (lighting conditions) and dependent variables (measures of workers’ health and safety) were studied using the Pearson coefficient. The correlations are considered statistically significant if < 0.05 and highly statistically significant if < 0.001. The effect size was interpreted from tables provided by Ferguson [46], where conventional values were suggested as criteria for “small” (the recommended minimum effect size that represents a significant effect), “moderate,” and “strong.” Effect sizes were 0.20, 0.50, and 0.80, respectively. The degree of the correlation coefficient was also interpreted from the tables presented by [47], where a value of (0-0.3) indicates that the correlation is weak, a value of (0.4-0.6) indicates that the degree of correlation is moderate, and a value of (0.7-0.1) indicates that the degree of correlation is strong. Mann-Whitney test and Kruskal-Walli’s test were used to compare separate groups of non-normally distributed quantitative variables and followed by Post Hoc test for pairwise comparison between independent variables [48]. The Friedman and Wilcoxon tests were also applied for pairwise comparisons between correlated samples. Regression analysis was applied to discover the most independent influencing factors in some cases. To balance the trial error rate resulting from multiple pairwise comparisons, Bonferroni corrections were applied to the same data for each statistical test. The level of statistical significance ( =0.05) was divided by the number of tests ( ) [46]. The effect size was calculated according to the following Equation (2):
where N= the number of pairwise tests, and the Z value is the result of the statistical tests [50].
4. Results
4.1. Field photometric measurements
Figure 8, shows light measurements of EH, EV, EML, m-EDI, CCT, and CRI at each day and night shift in each case study. The differences in lighting conditions in the case studies are due to the percentage of natural light in each factory, size, and the orientation of the openings. Case studies 1, 2, and 3 receive direct natural light from the door openings towards the southwest and from the upper openings in the roof towards the southeast and northwest, see Table 1. Case 4 receives natural light only from the doors towards the southwest, while case 5 receives light from the southwest direction from the upper windows. Table 1 shows the mean values of EH, EV, EML, m-EDI, CCT, and CRI in summer and winter. Lighting performance within spaces in daytime reflects a complex lighting environment, which is one of the challenges of field studies in real-world settings, where it is difficult to control dynamic daylighting. Therefore, it was necessary to calculate the arithmetic mean and median of lighting data to provide a central estimate, while clarifying the standard deviation values to determine the extent of dispersion within each space (see Table 4). Following the collection of illuminance data, the lighting levels were divided into four light categories based on the values of the nearby lighting levels (EH) in the production halls, regardless of the type of lighting source. Natural light contribution percentages were estimated based on daytime and nighttime illumination values, and these percentages were used as a descriptive element for the identified zones.
Figure 8
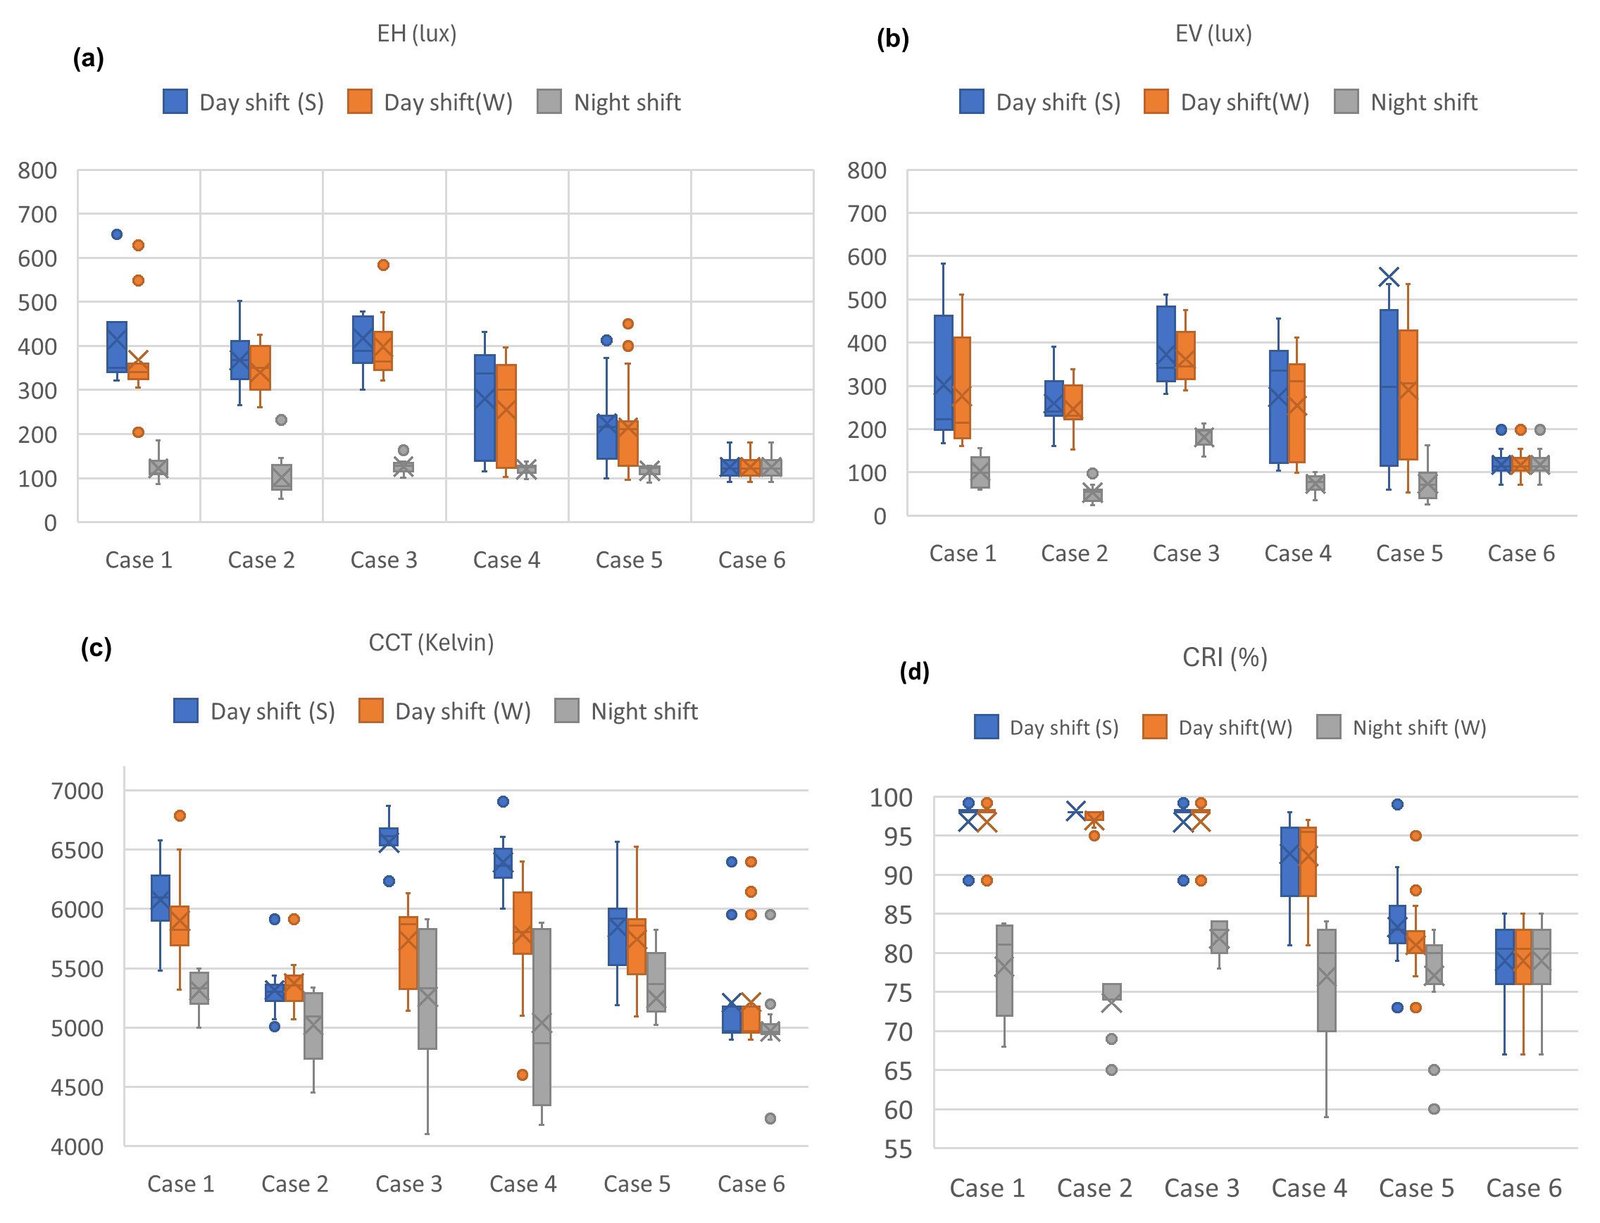
Fig. 8. (a)The mean and median values of Eh, (b) the mean and median values of Ev, (c) the mean and median values of CCT, and (d) the mean and median values of CRI, in the study cases. S=summer; W=winter.
Table 4
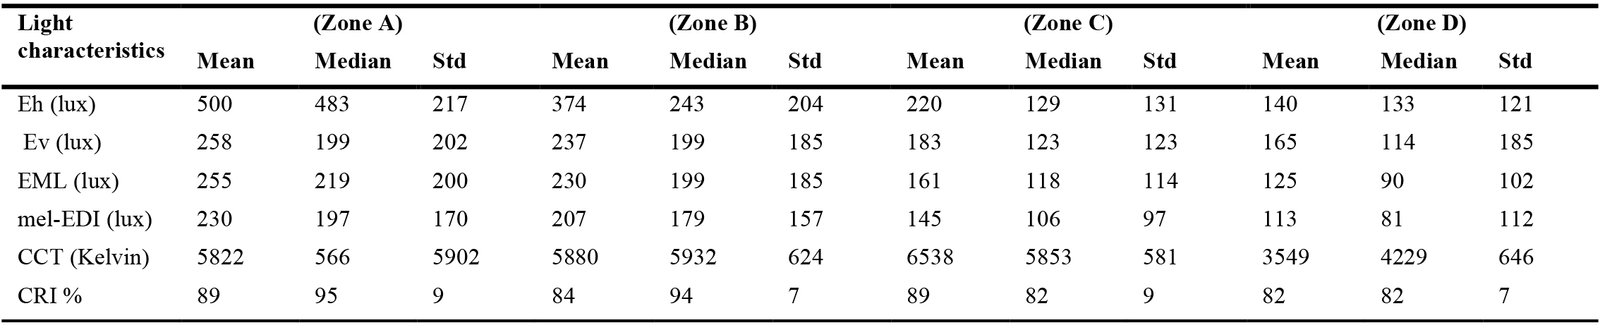
Table 4. The mean, median and standard deviation (Std) of lighting measurements in the six case studies.
Lighting zones were defined as follows:
- Zone A: Features spaces that rely primarily on natural lighting with artificial task lighting, where approx. 75% of the lighting is natural and 25% artificial. Measured lighting levels range Eh avg= 572±218 lux, and m-EDI avg=230±170lux.
- Zone B: Features spaces that rely on mixed lighting (approx. 50% natural - 50% artificial), and lighting levels range Eh avg=374 ±204 lux, and m-EDI avg=207±157lux.
- Zone C: Features spaces that rely on artificial lighting (approx. 40% natural - 60% artificial), and lighting levels range Eh avg= 220±131 lux, and m-EDI avg=145±97lux.
- Zone D: Features spaces that rely entirely on artificial lighting (Case 6). This also includes measurements in the evening shifts for all cases, where Eh avg= 140±121 lux, and m-EDI avg=113±112lux.
The results show that the highest E-MDI average value was (E-MDI avg = 230±200 lux) within light categories in category A, i.e., in cases 1-3, which is considered lower than the CIE recommendation (250 lux minimum). The EH values within categories C (Eh avg = 220±131 lux) and D (Eh avg = 140±121 lux) are considered lower than the Egyptian code recommendation (300 lux minimum).
Notably, there is a high standard deviation for EH, EV, EML, E-MDI, CCT, and CRI readings. This is attributed to the heterogeneous distribution of illuminance within each factory. For example, in cases (1–3), there is a variation in EH values due to the heterogeneous distribution of industrial lighting units, which are often installed on vertical poles and concentrated only in manual work areas, leading to a marked contrast between the brightest and least lit areas within the same space. The presence of windows or doors on one side and the depth of the factory in cases 4 and 5 also contributed to an unbalanced distribution of natural light, which was reflected in the large dispersion in field readings. Fig. A1. shows the distribution of light categories according to horizontal illumination (EH) values in the study cases. The results presented in Fig. 8(a)-(d) show that cases (1–3) had higher light levels with category A predominating in most areas, except for a few locations that fell under category B. This is attributed to the fact that these cases relied on intensive artificial lighting, with little contribution from natural light. In cases 4 and 5, lower light levels were observed, with categories B and C predominating, due to the low levels of natural light within spaces. It is worth noting that category B was often identified near openings (windows and doors), which represented the sole source of natural light, while category C was prevalent in the middle of the space, specifically in the second half, far from natural light sources.
4.2. Lighting effect on workers’ safety
To study the effect of lighting on workers' operational safety at the industrial spaces and the possibility of errors or accidents due to lighting conditions, participants' answers were collected on four questions concerning the extent to which lighting conditions. A six-point Likert scale was used to measure participants' responses. Lighting effects on safety are presented in the following sections, including the descriptive frequencies of workers' evaluations of light, and the relationship between lighting characteristics and workers' evaluations of the effect of lighting on safety.
4.2.1. Descriptive statistics of workers’ response
Table 5 shows the frequencies and percentages of workers' ratings of the impact of lighting on aspects of safety in the workplace. The independence of the safety questions was confirmed by a chi-square test with statistical significance (p< 0.000). Overall, workers' feedback on the lighting conditions in Zone D, where Eh avg = 140 ± 121 lux, was more negative regarding their safety than in the other zones. As such, 51.8% and 50.7% of workers indicated that lighting could cause errors in summer and winter, respectively.
Table 5
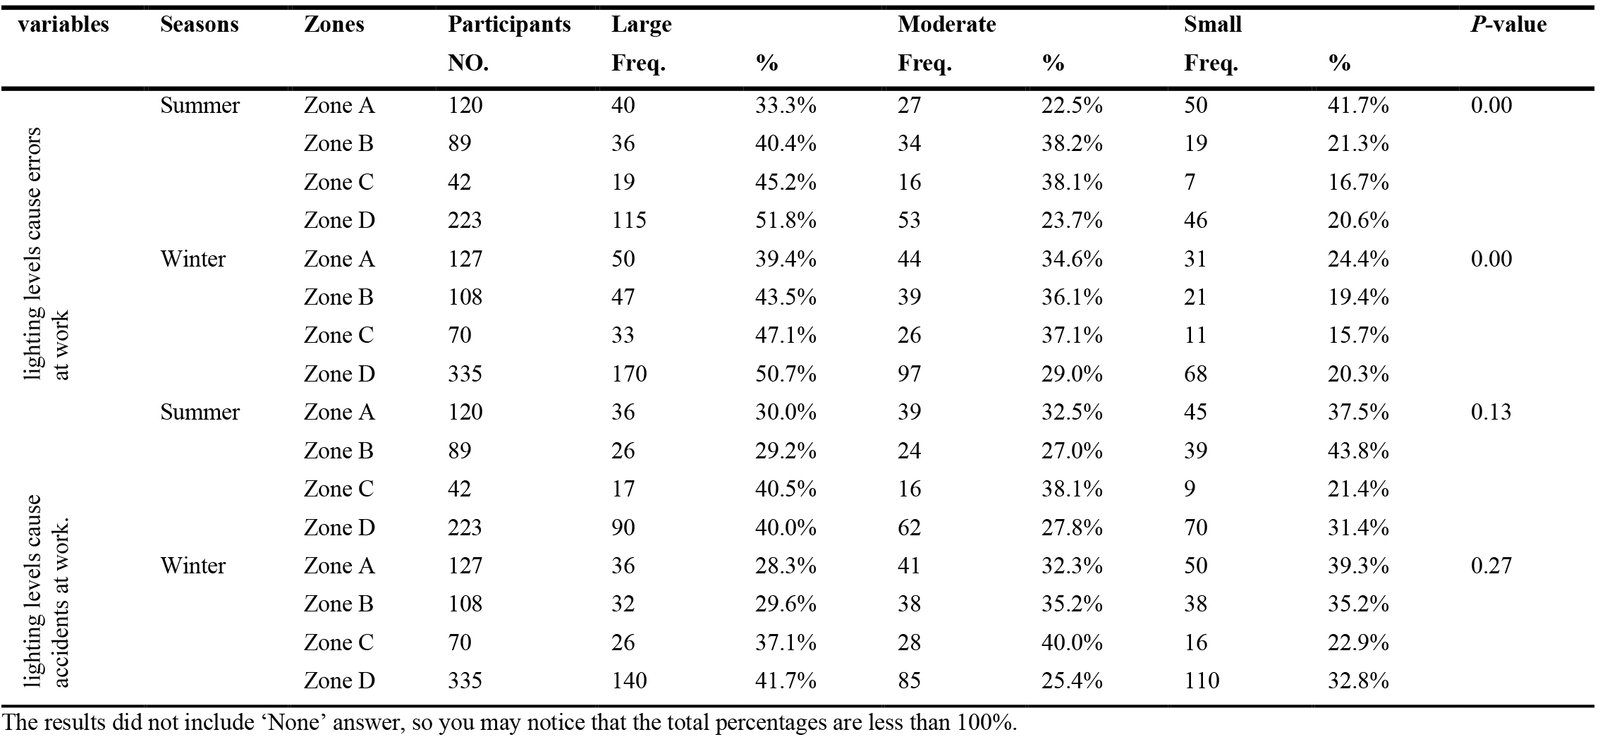
Table 5. Percentages and frequencies of workers' ratings of the impact of lighting on operational safety.
Additionally, 40.0% and 41.7% of the responses indicated that light conditions could cause accidents in production halls in summer and winter, respectively. On the contrary, workers in Zone A, which relies on natural lighting (Eh avg = 500 ± 217 lux), showed low ratings of likelihood of errors or injuries, with 39.4% of responses in winter and 33.3% in summer indicating that lighting conditions lead to errors. On the other hand, 28.3% of workers in winter and 30.0% in summer reported the likelihood of accidents due to lightning in the production halls.
Figures 9 and 10 show the workers’ evaluation rates of the extent to which lighting affects errors and accidents for four lighting categories in production halls. As can be seen from the results in Table 6, most of the workers’ feedback was consistent between summer and winter, showing no significant difference between the two seasons.
Figure 9
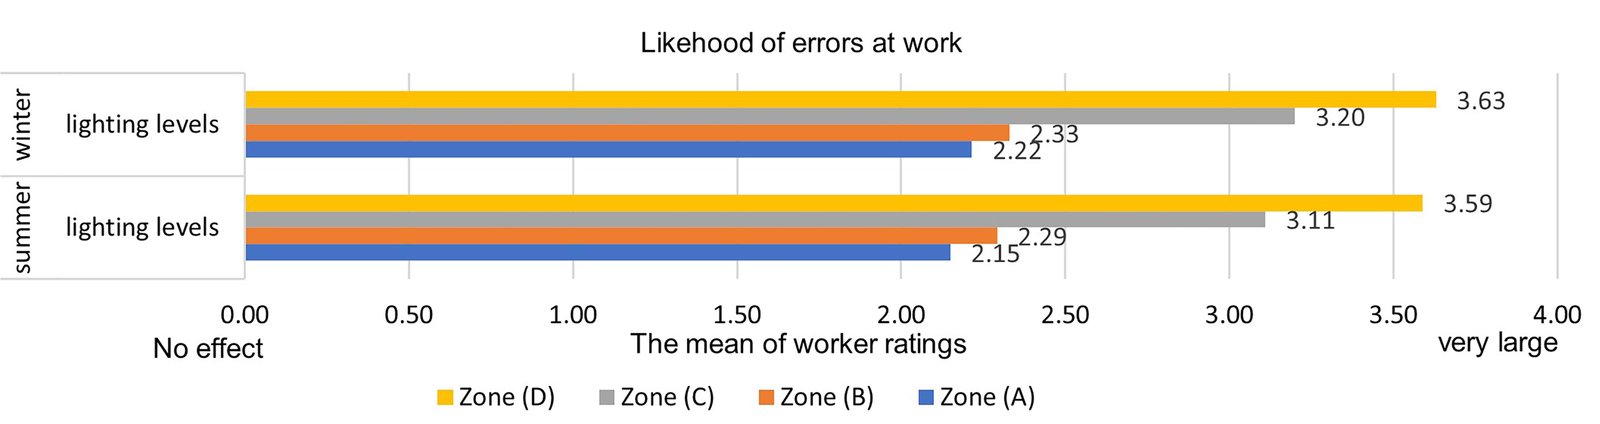
Fig. 9. The mean of worker ratings about current lighting levels, disturbances causing errors at work.
Figure 10
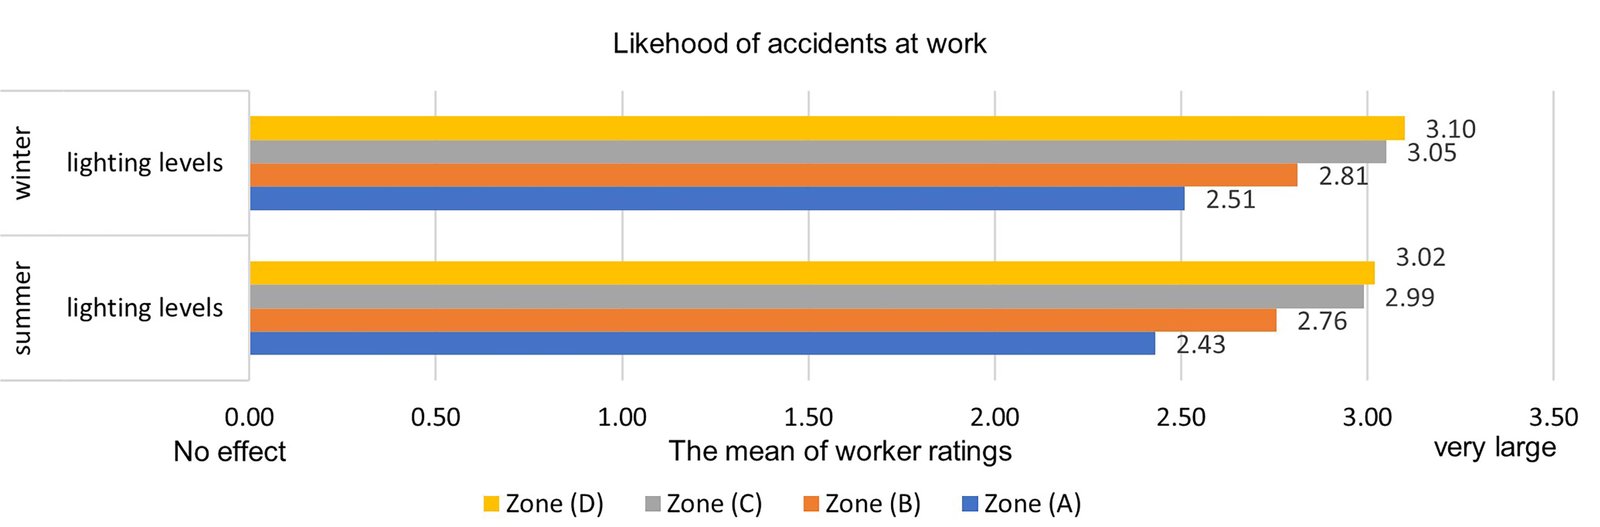
Fig. 10. Worker ratings about current lighting levels, disturbances causing accidents at work.
Table 6
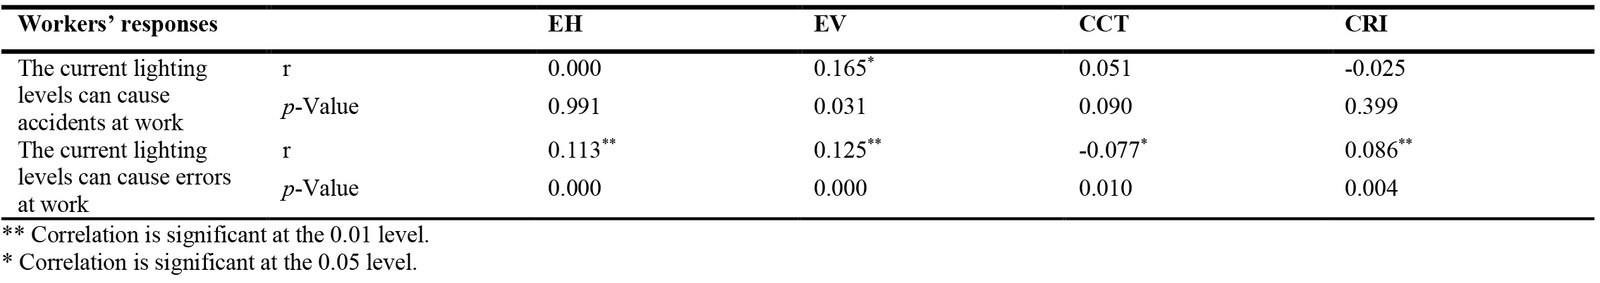
Table 6. Correlation between workers' opinions on the effect of lighting on safety, and EH, EV, CCT and CRI.
4.2.2 Lighting characteristics and workers’ safety
The correlation between lighting characteristics (EH, EV, CCT, CRI) and workers' ratings of the probability of errors or accidents due to lighting conditions in the four zones (A, B, C, D) was examined using Spearman's correlation coefficient test. The results showed a weak positive association between vertical lighting level (EV) and workers' rating of the probability of accidents, with statistical significance (p=0.031). Nevertheless, other light variables (EH, CCT, CRI) did not show significant associations with workers’ expectations of accidents due to lighting conditions.
On the other hand, there was a statistically significant association (p=0.031) between EH, EV and CRI with the probability of errors. In contrast, there was a weak negative association between CCT and the probability of errors, with statistical significance (p=0.010) (Table 7).
Table 7
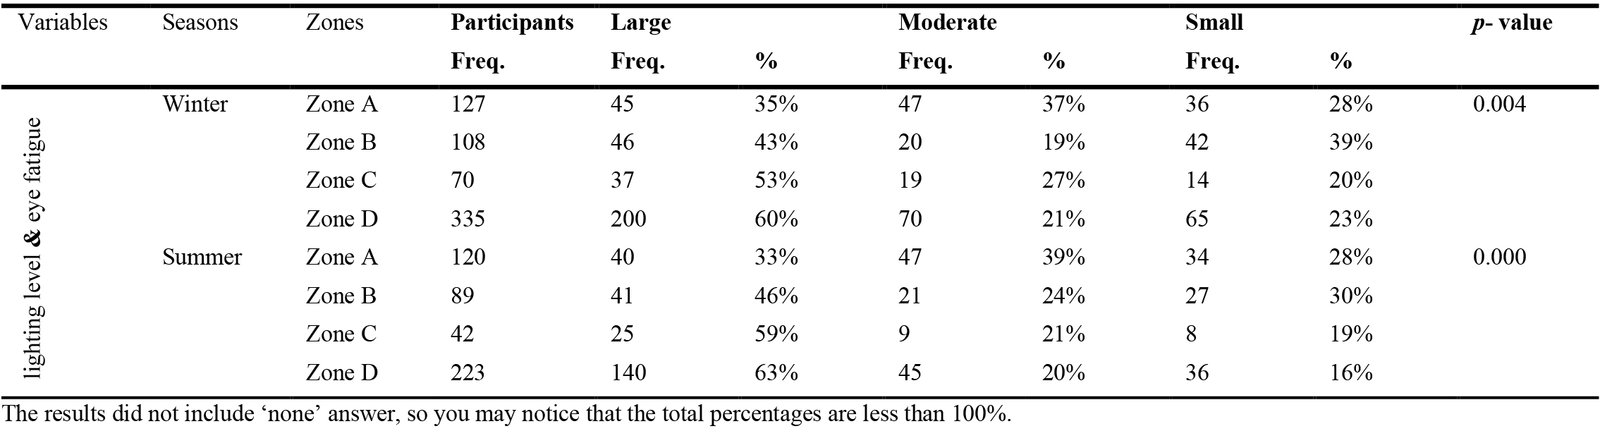
Table 7. Percentages and frequencies of workers' ratings of the impact of lighting on eye fatigue.
Differences between workers' ratings for lighting zones (A, B, C, and D) were analyzed using the Kruskal-Walli’s test. Post hoc tests using the Mann-Whitney pairwise test were run to determine where the variations lay under each zone.
The results of the Kruskal-Wallis (Table A2) and Mann-Whitney tests (see Table A3 and Table A4) showed significant differences between participants’ ratings in the four lighting zones (P = 0.001). Pairwise comparisons revealed statistical differences between Zone B (mixed natural and artificial lighting) and Zone D (artificial lighting) (p = 0.034). Similarly, statistical differences were detected between participants’ ratings in Zone C (mixed natural and artificial lighting) and Zone D (p = 0.028).
This was due to Zone D (artificial lighting) recording negative ratings of the likelihood of work errors compared to other lighting zones. Statistical differences were also found between participants' ratings on the likelihood of accidents due to lighting in Zone A (daylight lighting) and Zone C (mixed lighting).
The findings suggest that the lighting conditions in Zone D are perceived to have the most detrimental effect on workers’ perceptions of operational safety. In contrast, Zone A is associated with more favorable lighting conditions, which correspond to more positive evaluations of safety by the workers. This contrast highlights the significant influence of lighting quality on how safe employees feel in their work environment (Table A3 and Table A4).
4.3. Lighting Effect on Workers’ Health
To study the impact of lighting on workers' health in industrial places, workers’ responses to four questions related to the extent to which lighting conditions affect eye strain, headaches, drowsiness, and loss of concentration during work were collected. A description of the frequencies and analysis of workers' assessments of the lighting categories in lighting zones A, B, C, and D were analyzed, and the relationship between lighting characteristics and workers' assessments of the impact of lighting on their health was examined and presented in the following sections.
4.3.1. Descriptive statistics of workers’ response
Table 7 shows workers’ ratings under four lighting conditions collected in lighting zones A, B, C and D. The data were verified to be independent and significant (p< 0.001), indicating that lighting conditions can significantly affect eye strain among workers. In essence, the fully artificial lighting conditions in Zone D received the highest proportion of responses indicating experiences of eye strain, particularly under an average horizontal illuminance (Eh avg) of 140 ± 120 lux.
This zone recorded the highest reported rates of severe eye strain, with 60% of respondents indicating discomfort during the winter and 63% during the summer. Natural lighting in zone A was rated more comfortable in winter (Eh avg = 498 ± 225 lux), with 35% reporting eye strain, compared to 33% in summer (Eh avg = 572± 218 lux). The mixed lighting zones (zone B) showed moderate effects of light on workers, with 43% of workers reporting feeling very tired in winter and 46% in summer. Similar results were obtained in zone C with mixed lighting, 53% of workers reported feeling very tired in winter, and this percentage rose to 59% in summer. These findings underscore the adverse impact of suboptimal artificial lighting on workers' experience of eye fatigue compared to natural lighting. As seen from the results, marginal differences were spotted between summer and winter, suggesting that eye fatigue symptoms were higher in summer than in winter. Table 8 provides more details to understand workers’ reporting symptoms of headaches, drowsiness, or impaired concentration due to lighting in the four lighting zones.
Table 8
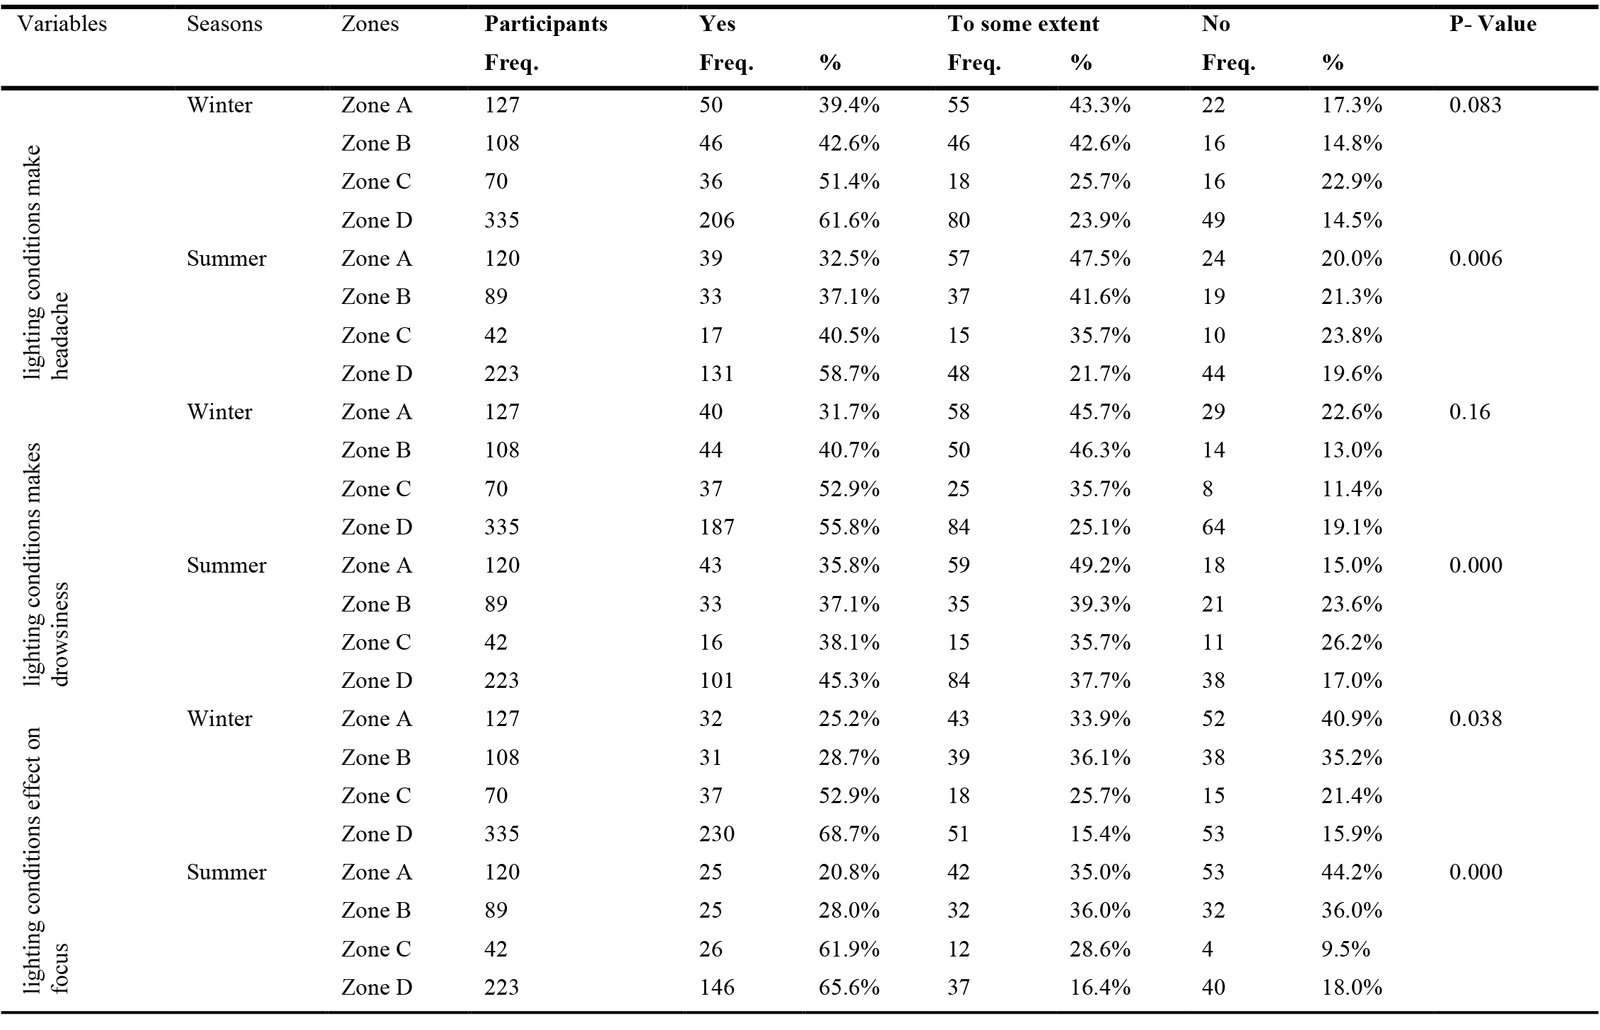
Table 8. Percentages and frequencies of workers' ratings of the impact of lighting on workers’ operational safety.
The results showed that Zone D (artificial lighting, Eh avg = 140 ± 120 lux) recorded the highest votes of experiencing headache in winter (61.6%) and summer (58.7%), compared to Zone A featuring natural daylighting (Eh avg = 498 ± 225 lux in winter, 572 ± 218 lux in summer), which was deemed the lowest headache rates (39.4% in winter, 32.5% in summer). Mixed lighting conditions in zones B and C also showed a high number of workers reporting headaches, (see Table 8).
Regarding drowsiness, a large number of participants in Zone D reported drowsiness (55.8% in winter, 45.3% in summer), indicating the effect of artificial-low lighting levels on increasing drowsiness, especially in winter. In the case of loss of concentration, 68.7% of workers in Zone D reported a negative impact on 68.7% of workers in winter and 65.6% in summer, thereby recording the highest rate among workers in different lighting zones. The lowest ratings of concentration loss were reported in Zone A (25.2% in winter and 20.8% in summer), reflecting the positive feedback under natural lighting in reducing concentration loss.
These results indicate that low levels of light are associated with increased health and attention-related complaints. This is shown in Fig. 11, which shows evident differences in workers' eye fatigue ratings under the four light zones.
Figure 11
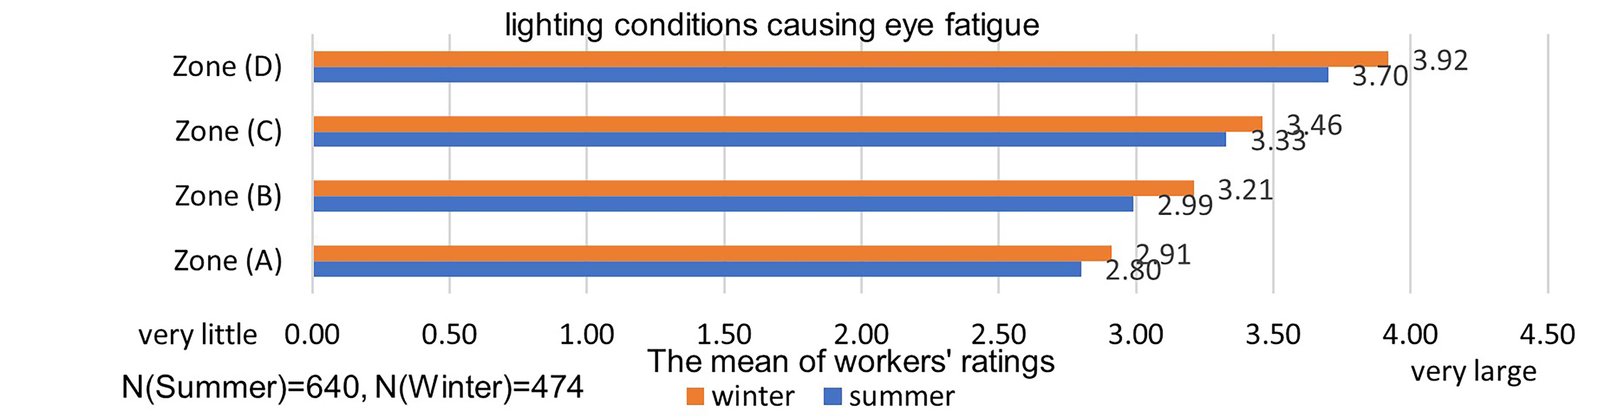
Fig. 11. The mean of workers’ ratings about lighting conditions causing eye fatigue.
Figures 12-14 show the rate at which workers feel headaches, drowsiness, and loss of concentration on a three-point scale in the four light zones. The results show that the mean rates were high in experiencing eye fatigue mean=3.9, headache mean=2.30, drowsiness mean=2.59, and loss of concentration mean=2.88, at Zone D (artificial lighting, Eh avg = 140 ± 120 lux). Mean ratings decreased to 2.9, 1.6, 1.1, and 1.1, respectively, at zone A featuring natural light levels (Eh avg = 498 ± 225 lux in winter, 572 ± 218 lux in summer).
Figure 12
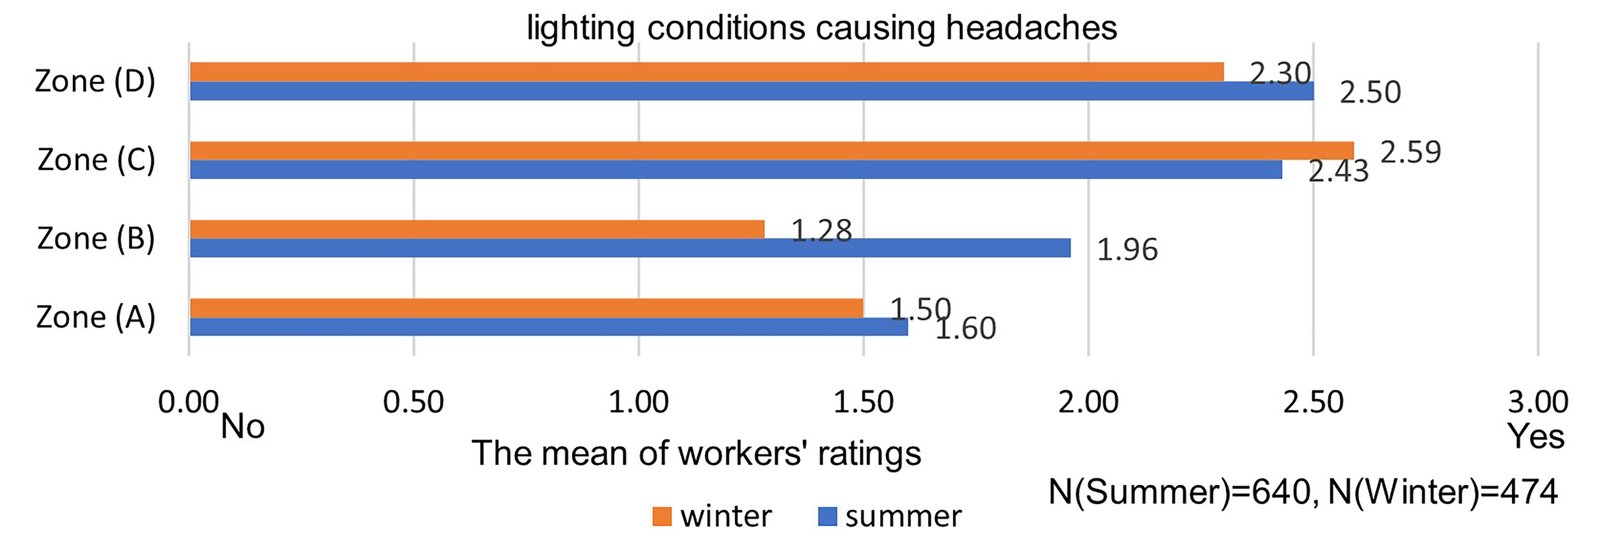
Fig. 12. The mean of workers’ ratings about lighting conditions causing headaches.
Figure 13
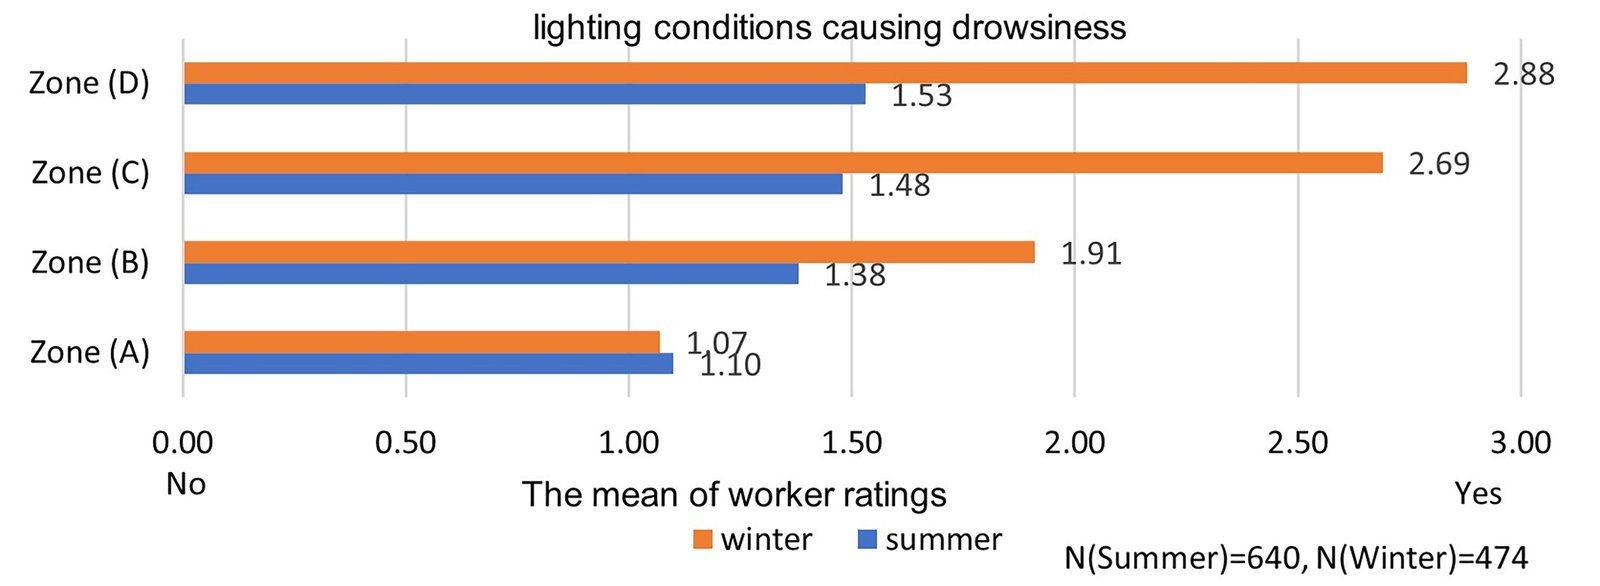
Fig. 13. The mean of worker ratings about lighting conditions causing drowsiness.
Figure 14
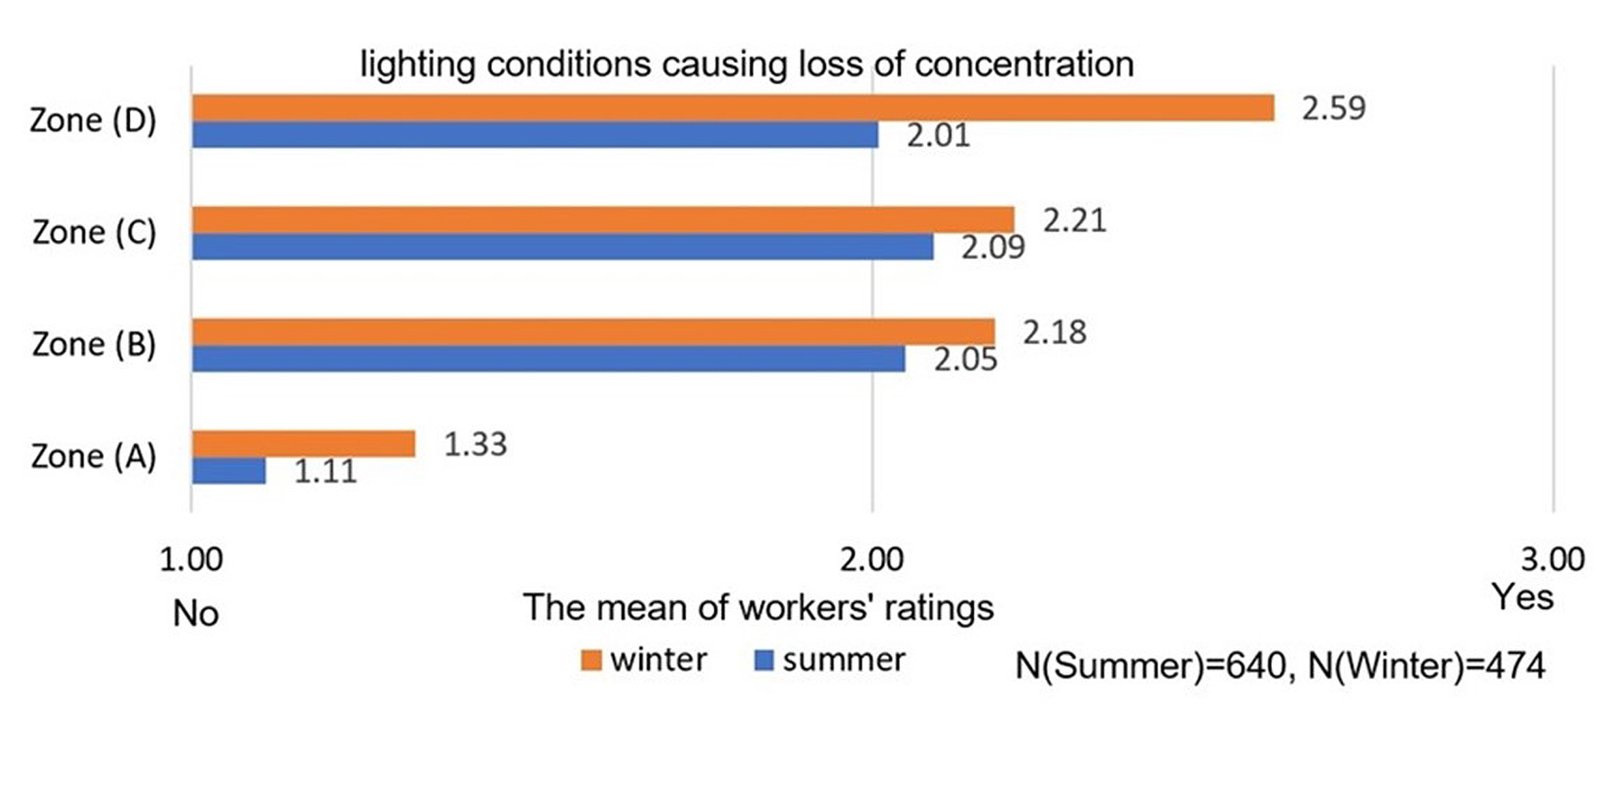
Fig. 14. The mean of worker ratings about lighting conditions causing loss of concentration.
4.3.2. Lighting Characteristics and Workers' Health
Table 9 shows the association of lighting characteristics with workers' ratings of visual fatigue, headache, drowsiness, and loss of concentration indicators. Horizontal illumination (Eh) was shown to have a significant negative association with workers’ reporting of eye fatigue (r = 0.514, p = 0.020) and headache (r = 0.643, p = 0.014). This finding indicates that low levels of horizontal illuminance (Eh) may be a contributing factor to the intensification of these symptoms. Interestingly, vertical illuminance (Ev) did not exhibit any statistically significant correlations with the health indicators assessed in this study (p>0.05). Levels of CCT recorded in this study had weak but significant associations with most visual health variables, being negatively correlated with eye fatigue, drowsiness, and loss of concentration. CRI value also showed a weak negative correlation with the reported symptoms of headache (r= 0.084, p= 0.005), drowsiness (r = 0.062*, p = 0.038), and loss of concentration (r= -0.112**, p= 0.000). This suggests that the spectral quality of light, as reflected by high CRI values, may play a subtle yet meaningful role in supporting workers’ health. The negative association also indicates that higher CRI values- expressing more accurate rendering of colors- could potentially contribute to reduced visual strain in workplace environments.
Table 9
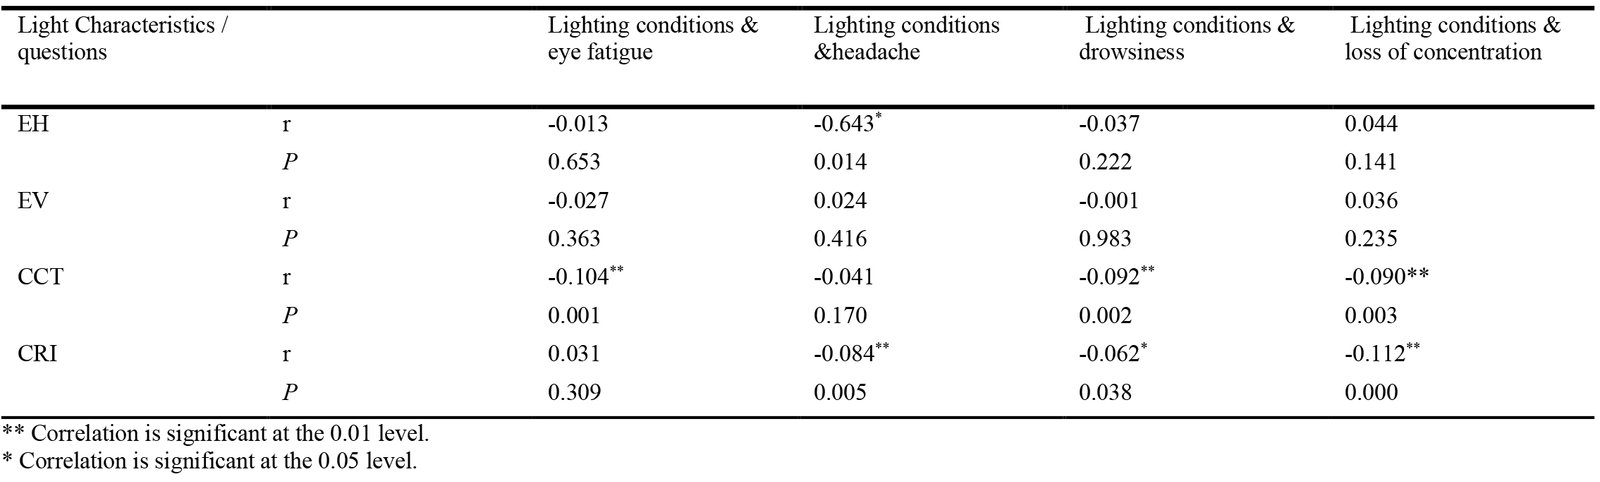
Table 9. Correlation between lighting characteristics and workers’ assessment of their feeling of eye fatigue, headache, drowsiness, and loss of concentration.
To study the effect of seasons on workers’ eye fatigue ratings due to lighting conditions, the Croxall-Wallis test was conducted to determine differences between workers’ ratings across summer and winter. The tests did not yield statistically significant differences between the two seasons. The same test was then conducted for worker groups in each of the four zones, followed by the Mann-Whitney test for paired comparisons, which yielded statistically significant differences between worker groups in zones A, B, C, and D. The analysis detected significant differences (Δ = 0.214, P< 0.001) between workers’ perceptions of eye fatigue in zone A lit by natural lighting (Eh avg = 500±217), and zone D lit by artificial lighting (Eh avg= 140±120). This could suggest that low illuminance levels Eh avg = 140±120 to cause more eye fatigue compared to higher lighting levels. See Tables A5-A8, in the appendix.
The results also showed significant differences (Δ= 0.153, P= 0.004) between low Eh avg= 140±120 Lux and moderate lighting levels Eh avg=500±217 Lux, in the effect on workers' health, as seen by the large percentage of workers reporting headaches in zone D compared to the rest of the lighting zones.
5. Discussion
This paper endeavored to identify how lighting conditions in industrial workspaces affect workers’ safety and health.
Occupational safety is an important aspect that researchers focus on, particularly in factory environments where the risk of recurrent injuries is highly probable. Various factors play a role in this regard, such as the nature of the work, machinery, and workers’ fatigue, particularly drowsiness, especially for night shift workers. This aspect was investigated in the study by exploring workers’ perceptions of how lighting conditions may contribute to the occurrence of injuries or operational errors. Subjects’ responses were compared to field-measured lighting values, and correlations and differences between groups were also studied under different lighting conditions in different lighting zones A, B, C, and D.
The results indicate that nearly a third of the participants reported that lighting conditions could lead to errors during work. This assessment appears to be related to the low illuminance levels measured (Eh avg = 140 ± 120 lux), values that are clearly lower than the minimum recommended by the Egyptian Code for Lighting in Workplaces, which is 300 lux in assembly shops and up to 500 lux in precision industries. This is consistent with what was indicated by the study [25], which linked inadequate lighting conditions to an increased likelihood of accidents and health risks in the work environment.
A small percentage of workers in zones A and B indicated that lighting conditions made them vulnerable to errors or injuries. A plausible assertion is that discomfort glare from natural light may have been a contributing factor to the negative responses reported by participants. Such visual disturbance can hinder task performance and reduce overall comfort, thereby influencing occupants’ subjective evaluations of the environment. The existence of a statistical correlation between workers' ratings of the impact of lighting on operational safety and both CCT and CRI indicates that lighting spectral quality -reflected by neutral CCT ranges and high CRI- is important for workers' occupational safety.
On the other hand, most workers reported that the lighting levels in their work environment caused eye fatigue and headaches, particularly in zones D and C, characterized by low lighting levels. In contrast, zone A, which relies on natural light (Eh avg = 500 ± 217 lux), was reported to be more visually comfortable than the other zones, suggesting a more favorable impact on eye comfort and reduced visual strain among workers. Nevertheless, 33.0% of workers in zone A reported experiencing eye fatigue in winter and 32.0% in summer. This is likely due to glare from natural lighting, as glare imposes a greater visual burden on the eyes [50].
This also could be linked to a previous study [50] concluded that workers with dry eyes were more likely to experience uncomfortable glare than those without dry eyes. In lighting zone D (Eh avg = 140 ± 121 lux), 56.0% of workers in winter and 63.0% in summer reported experiencing eye strain. This is consistent with research evidence showing that low lighting levels force the eyes to exert additional effort, increasing the likelihood of developing symptoms of visual strain [51].
This is also consistent with Boyce's study [28], indicating that eyestrain occurs because of physiological reasons, related to fatigue of the eye muscles responsible for fixation and accommodation. Although the results indicate a statistical correlation between lighting levels and workers' self-assessments regarding the likelihood of errors, accidents, and symptoms such as headaches or eye strain, it is important to interpret these findings with caution. As such, these associations may be partially explained by the nature of tasks performed within each factory. For example, Factories (1–3), which specialize in the manufacturing of light metal chassis, involve the use of sharp tools, welding, and assembly machines. Despite being categorized as light industries -with recommended lighting levels of at least 300 lux according to the Egyptian Code- the potentially hazardous nature of these tasks may increase workers’ sensitivity to lighting conditions. Similarly, Factories (4 and 6), which produce plastic bottles and cans, require continuous visual monitoring and manual assembly, which may heighten awareness of lighting adequacy. Factory 5 involves packaging and quality control, which also demands visual precision.
Furthermore, differences in exposure duration (12-hour shifts in Factories 1–3 vs. 8-hour shifts in Factories 4–6) could have contributed to varying perceptions of lighting impact. While age can influence visual comfort or perceptual response, its effect in this study might have been limited due to the relatively narrow age distribution of participants (predominantly between 25–35 years). Nonetheless, it is acknowledged that additional factors, including prior health conditions, task complexity, and individual sensitivity, may also play a role in shaping workers’ perceptions which were not fully controlled for in this study.
The results also showed a statistical correlation between CCT and CRI and workers' reporting of eye fatigue, underscoring the importance of lighting quality in maintaining eye health and safety. The latter finding is consistent with previous research [51] concerning worker assessments of lighting levels 350 -500 lux to be most comfortable for the eyes, provided that annoying glare is avoided.
The study revealed that 39.3% of workers in winter and 32.5% in summer reported headaches due to lighting in Zone A which is lit by natural daylighting, compared to 61.6% and 58.6% in Zone D which relies entirely on artificial lighting. The results also indicate that Zone A lighting (Eh avg = 500±217 lux, m-EDI avg = 230 ± 200 lux, CCT avg = 5822±566 K, CRI avg= 89±9 %) was perceived as more comfortable, compared to the lower lighting levels in Zone D and C (Eh avg in zone C = 220±131 lux, and in zone D = 140±120 lux). However, some workers in Zone A experienced headaches due to glare from natural lighting. This finding is consistent with a previous study [52] indicating that glare and highlighting are triggers for headaches in individuals with photosensitivity. Moreover, a statistical association was found between eye fatigue, headaches, and low lighting levels, supporting other studies in the literature [1]. This study also found that 55.8% and 45.2% of workers in winter and summer respectively indicated that the low lighting in-Zone D caused them to feel sleepy, while 68.7% and 65.5% reported occasional loss of concentration for the same reason. Analyses also revealed a statistically significant relationship (p < 0.05) from weak to moderate between drowsiness, poor concentration, and lighting conditions. These findings are linked to a previous study [53-54] showing that poor lighting may cause symptoms such as headaches, eye fatigue, tears, visual fatigue, concentration loss, and increased drowsiness during work. A negative correlation was found between workers' reporting of headache, drowsiness, and loss of concentration and both CCT and CRI values, indicating that lighting quality- -reflected by neutral CCT ranges and high CRI- positively affects workers' health.
6. Conclusion
This study aimed to evaluate the impact of lighting on worker health and safety in industrial work environments by collecting self-assessments from 456 factory workers and correlating them with light measurements in six different factories in Sadat City, Cairo. Statistical tests were used to measure the relationship between lighting characteristics (Eh, Ev, CCT, EML, m-EDI and CRI) and worker responses in different lighting zones that differ in the quality and quantity of light spectra. These zones are characterized by Zone A, which relies primarily on natural lighting with artificial task lighting; Zone B, which relies on mixed lighting; Zone C, which relies primarily on artificial lighting; and Zone D, which relies entirely on artificial lighting. Lighting emerges in this study as a critical factor in supporting worker occupational safety, as it influences visual comfort and the non-visual effects of light on the human body. Adequate lighting is essential to ensure ideal working conditions.
The main results of the field study indicated the following:
- The results clearly indicated that the areas falling within light categories A (Eh avg = 572 ± 218 lux) and B (Eh avg = 374 ± 204 lux), which are study cases 1-3 and some areas near windows in cases 4 and 5, had light levels suitable for visual tasks according to the Egyptian Code (minimum 300 lux), but were unsuitable for non-visual tasks, with m-EDI avg = 230 ± 200 lux and m-EDI avg = 207 ± 179 lux. Light category C (Eh avg = 220 ± 131 lux, EDI avg= 145±97lux) mainly was identified in the latter half of factories 4 and 5, and Light categories D (Eh avg = 140 ± 121 lux, m-EDI avg= 113±112 lux), exclusively featured in night shifts, were unsuitable for both visual and non-visual tasks.
- A large percentage of workers in the lighting category (Eh avg≤ 220 lux) reported that lighting levels significantly impact occupational safety, which is expected given the nature of their work. This finding was reinforced by statistical tests that confirmed a significant correlation between field-measured lighting values and worker assessments.
- The color temperature ranges examined in this study (CCT avg = 5770 + 389 K) had no significant effect on these indicators. Analyses also revealed statistically significant differences between worker responses in areas with artificial lighting versus areas with a combination of natural and artificial lighting, reinforcing the hypothesis of a link between lighting and worker safety.
- On the occupational health front, worker assessments showed a significant relationship between low artificial lighting levels (m-EDI avg ≤ 145 lux, Eh ≤ 220 lux) and increased symptoms of eye strain, such as headaches, drowsiness, and loss of concentration. A weak association was also found between color temperature (CCT) and workers' feelings of visual fatigue, drowsiness, and loss of concentration. Analyses also revealed statistical differences between workers' responses across the four lighting zones (p<0.05). This reinforces the hypothesis that lighting conditions are linked to workers' health, meaning that improving lighting quality may positively impact occupational well-being in the workplace.
- The industrial environment is a complex one in which workers are exposed to difficult occupational conditions related to the nature of their work and physiological conditions resulting from the number of working hours and shift work, which impact their physiological nature and, consequently, their circadian rhythm. Therefore, the non-visual effects associated with lighting cannot be overlooked. Thus, research on integrated lighting in these environments must be expanded to achieve satisfactory results from both visual and non-visual perspectives.
- Accordingly, this study suggests that low lighting levels lead workers to believe that low lighting levels make them more susceptible to injuries and errors during work. They also negatively impact their overall health, particularly eye health, causing headaches and loss of concentration.
- Nonetheless, the generalization of these results needs to be approached with caution because of the limitations of the study to specific industrial facilities. Other factors, such as the nature of tasks, lighting requirements and work patterns, may also play a role and were not addressed in this study. Therefore, the relationship between lighting and workers’ occupational health remains an open topic for further research.
APPENDIX A
Figure A1
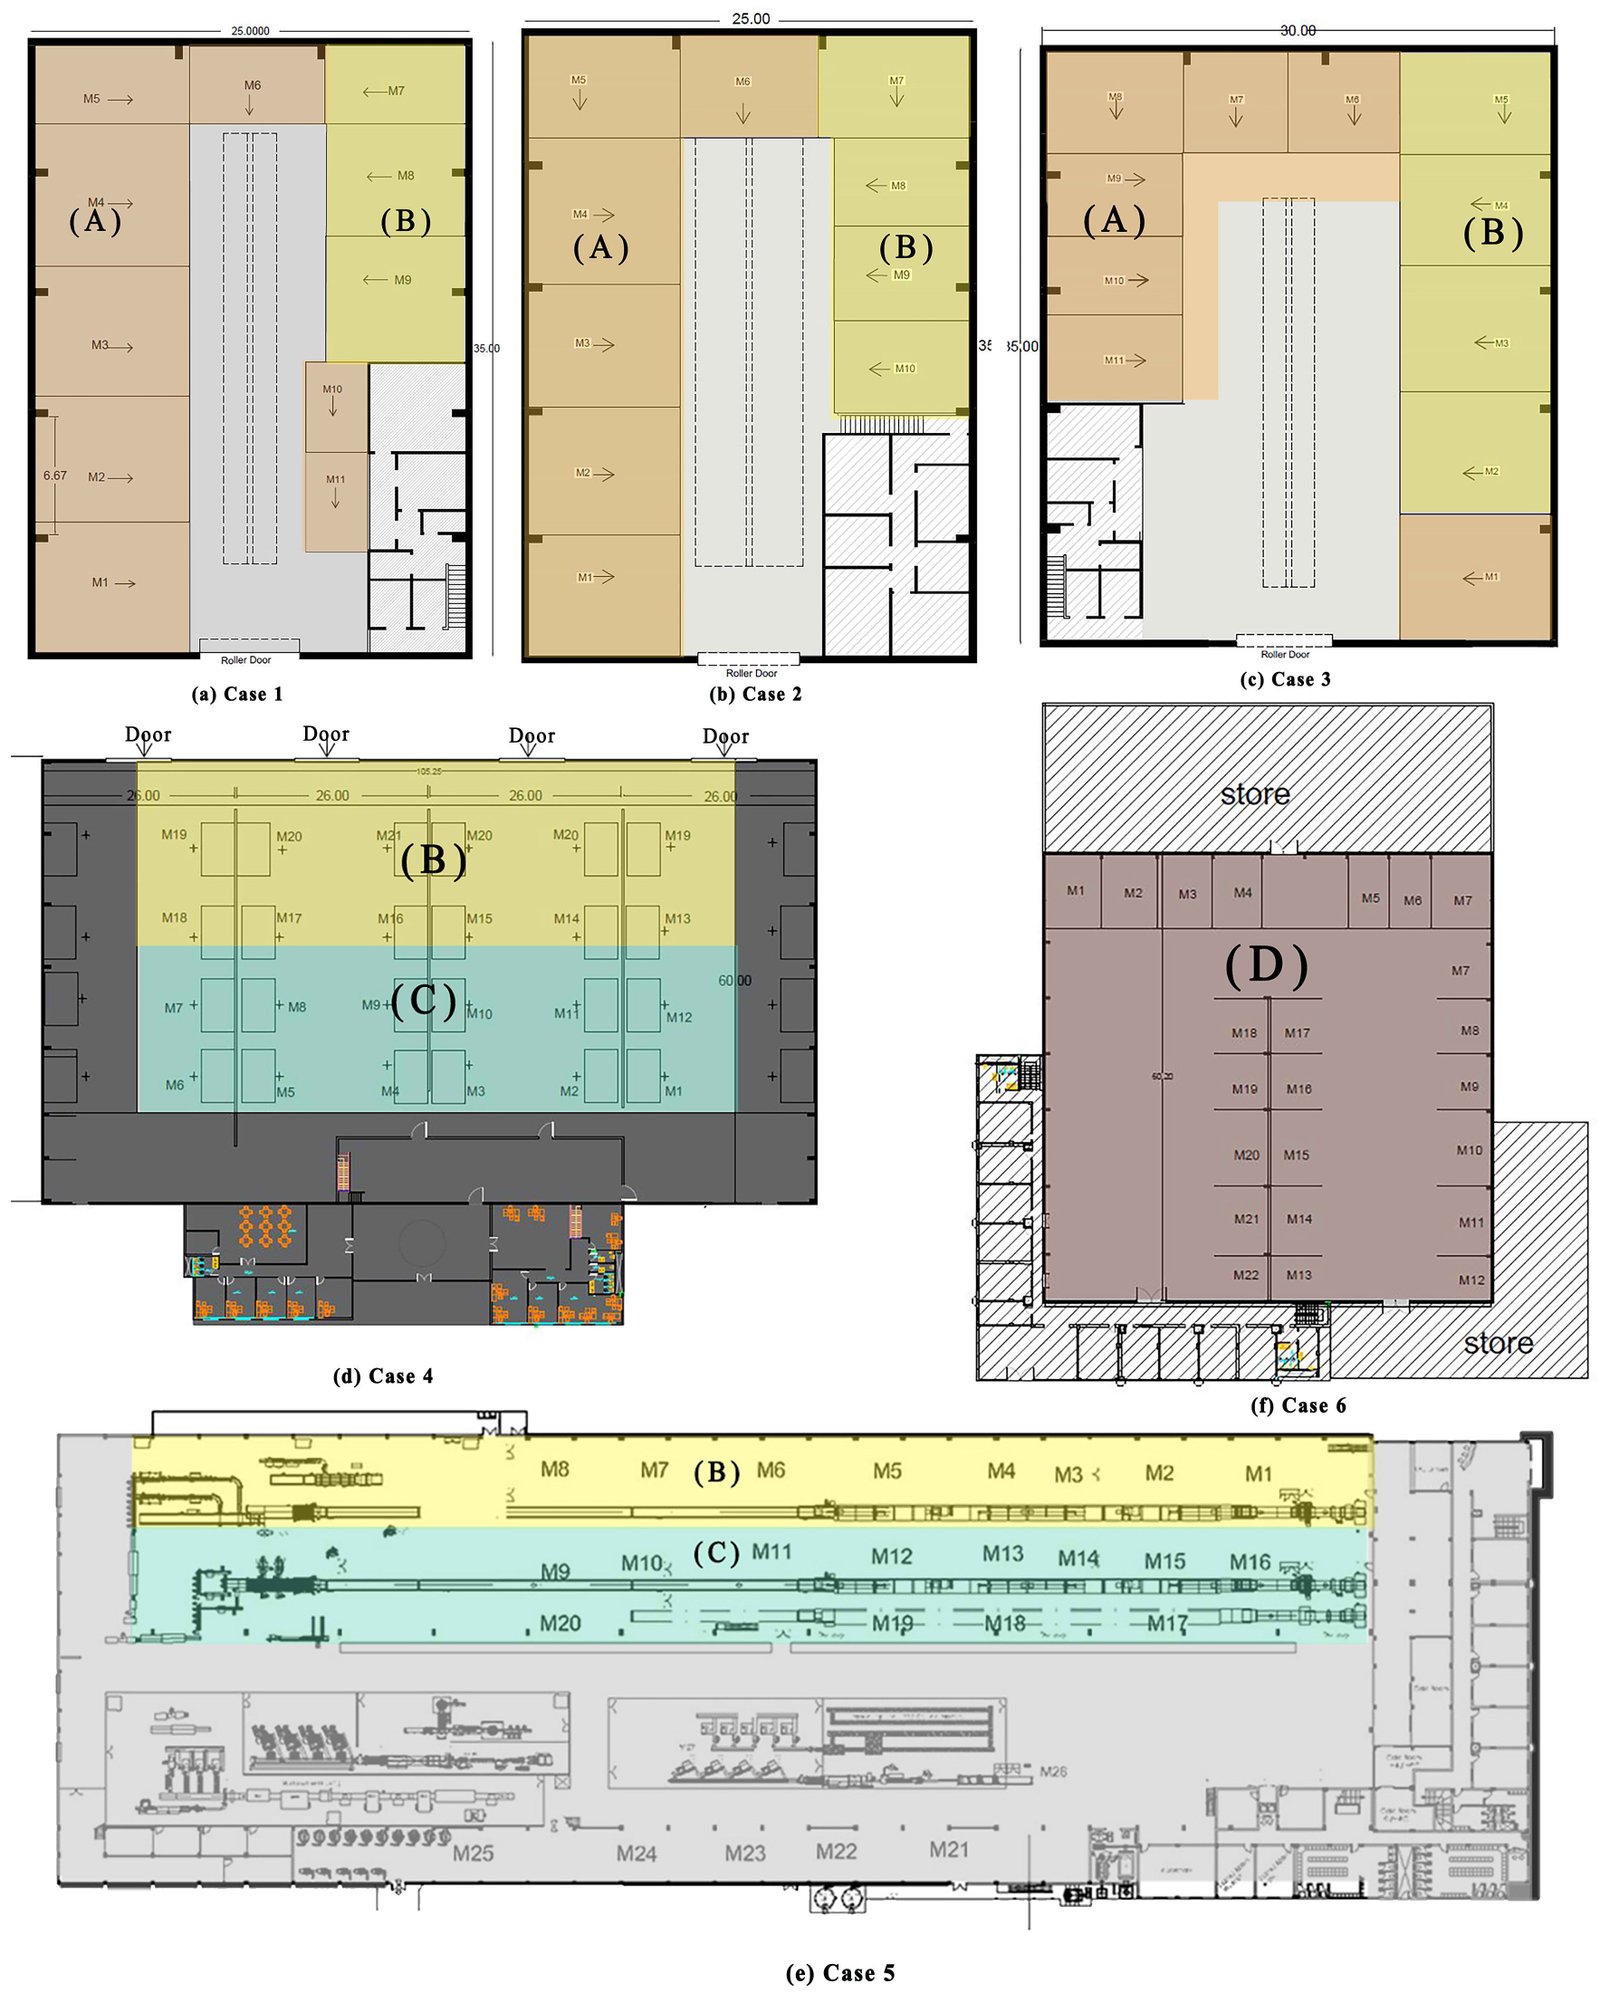
Fig. A1. Distribution of light classes A, B, C, D within the study cases (a) Case 1, (b) Case A, (c) Case 3, (d) Case 4, (e) Case 5, and (f) Case 6.
Table A1
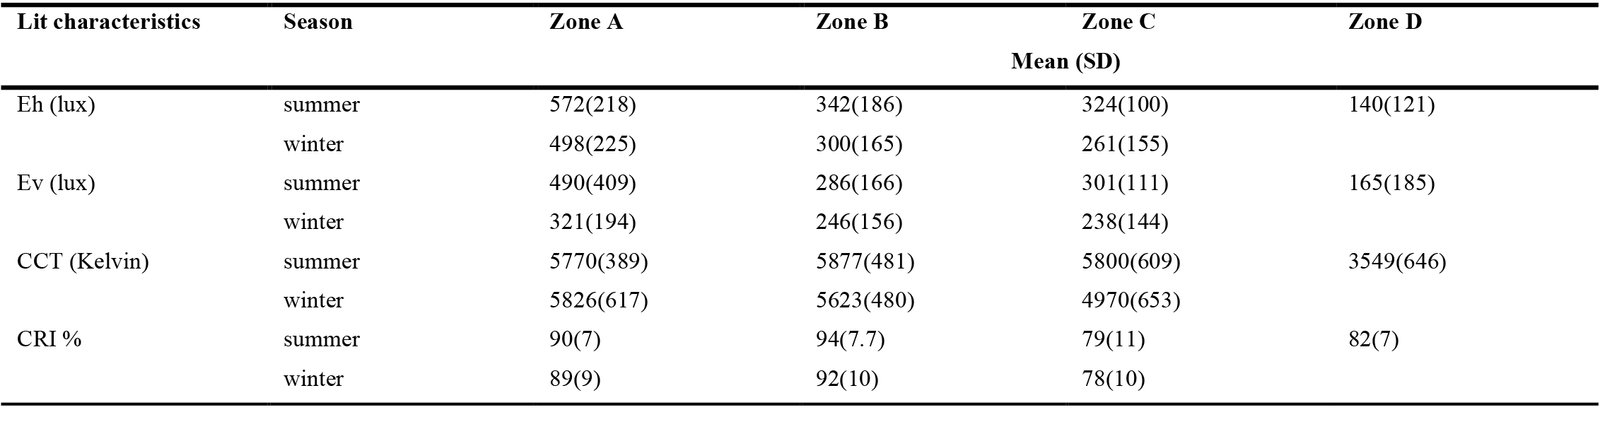
Table A1. The mean, standard deviation (SD) of lighting measurements in summer and winter in the six case studies.
Table A2
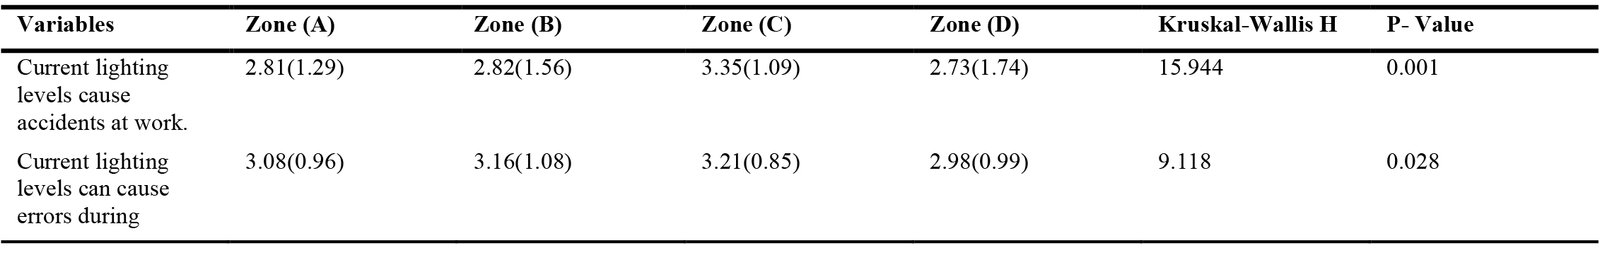
Table A2. Differences in workers’ evaluations between the four Zones.
Table A3
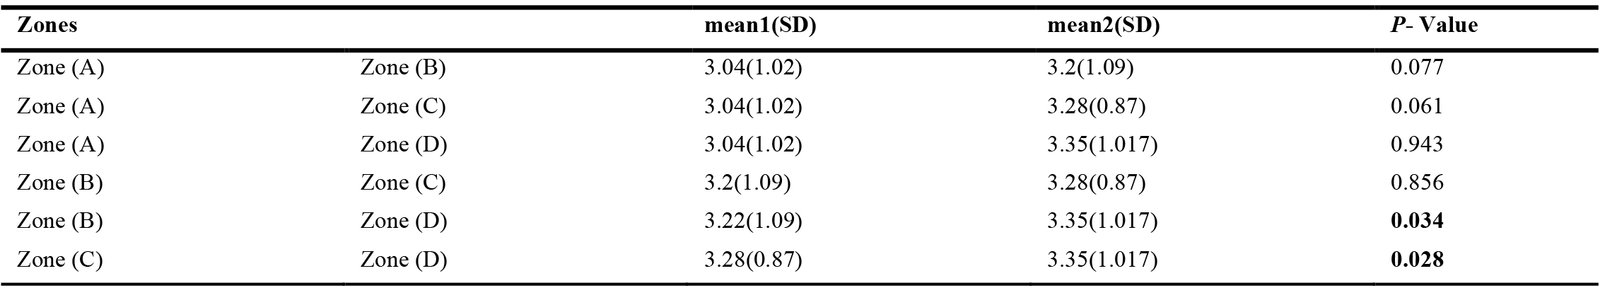
Table A3. Results of the Mann-Whitney test for pairwise comparisons between workers' ratings in zones A, B, C, and D regarding current lighting levels and errors during work.
Table A4
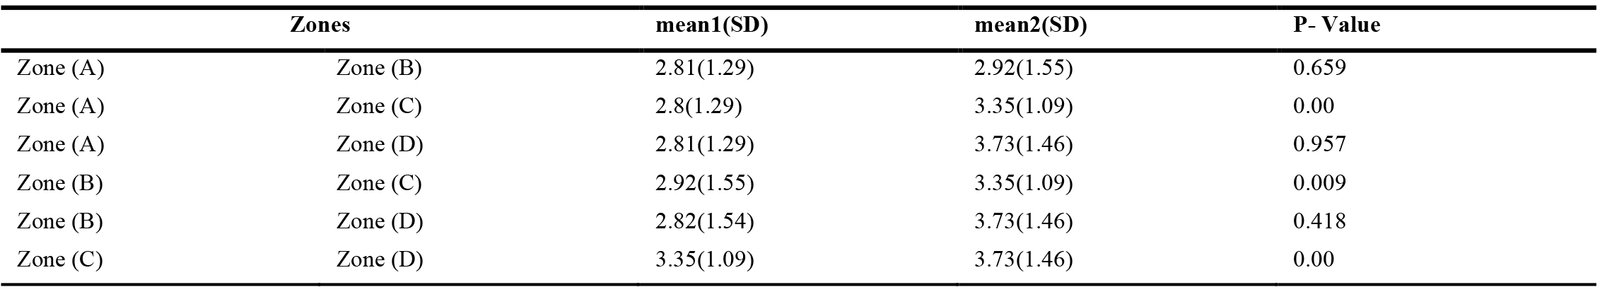
Table A4. Results of the Mann-Whitney test for pairwise comparisons between workers' rating in zones A, B, C, and D regarding current lighting levels and accidents at work.
Table A5
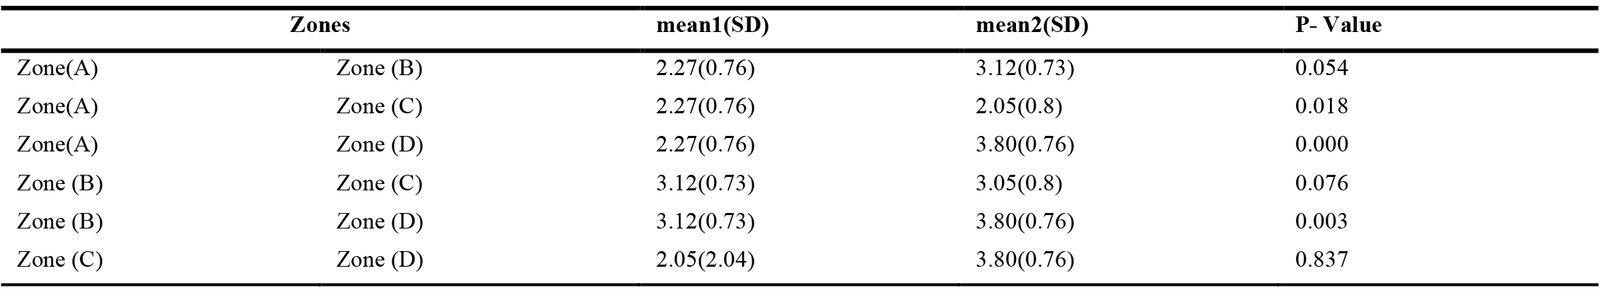
Table A5. Results of the Mann-Whitney test for pairwise comparisons between workers' ratings in zones A, B, C, and D regarding level and eye fatigue.
Table A6
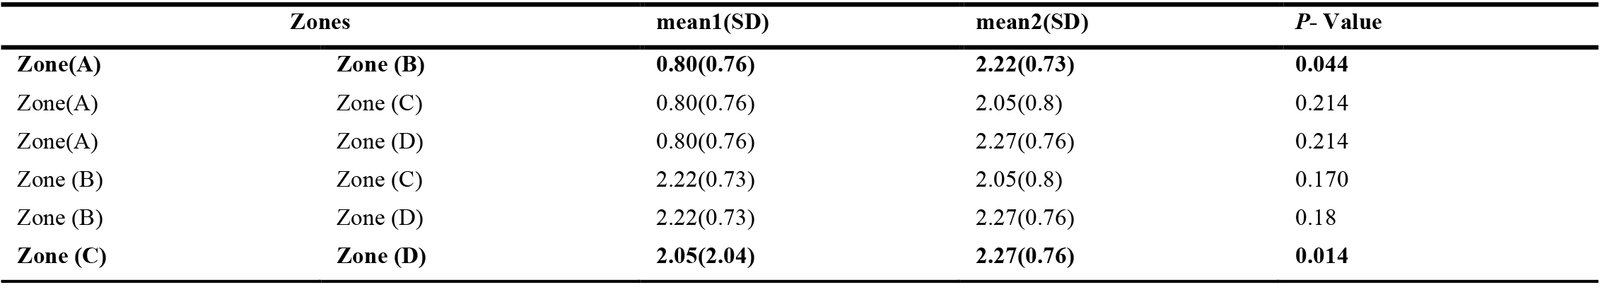
Table A6. Results of the Mann-Whitney test for pairwise comparisons between workers' rating and headache.
Table A7
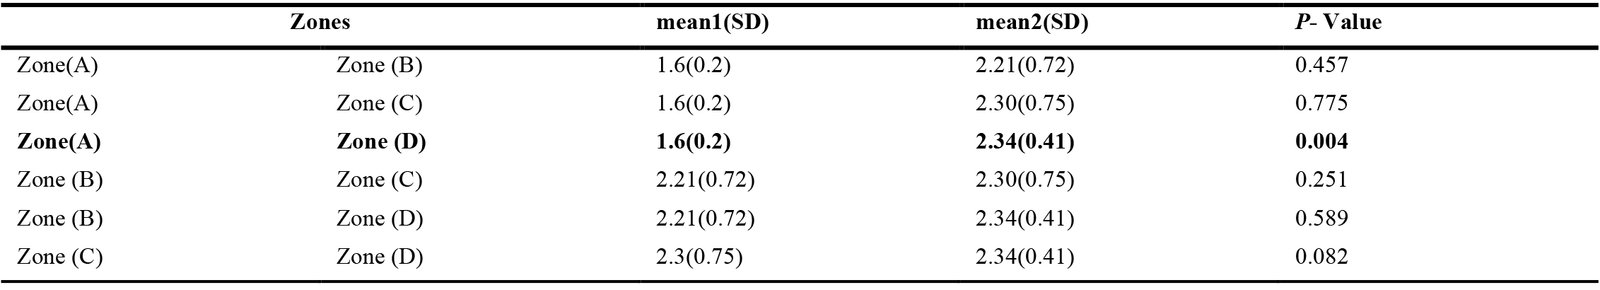
Table A7. Results of the Mann-Whitney test for pairwise comparisons between workers' rating and drowsiness.
Table A8
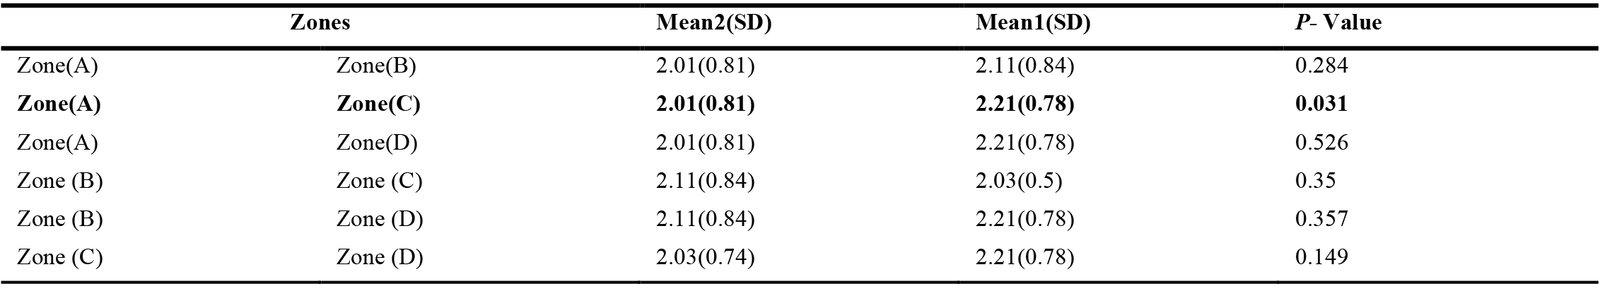
Table A8. Results of the Mann-Whitney test for pairwise comparisons between workers' rating and loss concentration.
Acknowledgement
The authors would like to express their sincere gratitude to Dr Rania Labib for their support throughout this work.
Funding
This research received no external funding.
Contributions
Dalia Abdelfattah: Conceptualization, Methodology, Software, Formal analysis, Investigation, Data curation, Writing – original draft, Visualization; Sahar Abdelwahab: Writing – review & editing, Supervision, Resources, Project administration; Mohamed Z. Eldars: Supervision; Mohammed S. Mayhoub: Writing – review & editing, Supervision, Project administration, Resources.
Declaration of competing interest
The authors declare no conflict of interest.
References
- R. Králiková, E. Lumnitzer, L. Džuňová and A. Yehorova, Analysis of the impact of working environment factors on employee's health and wellbeing; workplace lighting design evaluation and improvement, Sustainability, 13:16 (2021) 8816. https://doi.org/10.3390/su13168816
- P. R. Boyce, Light, lighting and human health. Lighting Research & Technology, 54:2(2022.) 101-144. https://doi.org/10.1177/14771535211010267
- T. A. Bedrosian and R. J. Nelson, Timing of light exposure affects mood and brain circuits, Transl Psychiatry, 7:1 (2017) e1017. https://doi.org/10.1038/tp.2016.262
- P. R. Boyce, Lighting research for interiors: the beginning of the end or the end of the beginning, Lighting Research & Technology, 36:4 (2004) 283-293. https://doi.org/10.1191/11477153504li118oa
- C. Blume, C. Garbazza and M. Spitschan, Effects of light on human circadian rhythms, sleep and mood, Somnologie (Berl), 23:3 (2019) 147-156. https://doi.org/10.1007/s11818-019-00215-x
- E. E. Lee, A. Amritwar, L. E. Hong, I. Mohyuddin, T. Brown and T. T. Postolache, Daily and seasonal variation in light exposure among the old order Amish, International journal of environmental research public health 17:12 (2020) 4460. https://doi.org/10.3390/ijerph17124460
- M. Figueiro, R. Nagare and L. Price, Non-visual effects of light: How to use light to promote circadian entrainment and elicit alertness, Lighting Research Technology 50:1 (2018) 38-62. https://doi.org/10.1177/1477153517721598
- L. J. M. Schlangen and L. L. A. Price, The Lighting Environment, Its Metrology, and Non-visual Responses, Front Neurol, 12:) 2021) 624861. https://doi.org/10.3389/fneur.2021.624861
- O. Osibona, B. D. Solomon and D. Fecht, Lighting in the Home and Health: A Systematic Review, Int J Environ Res Public Health, 18:2 (2021) 609. https://doi.org/10.3390/ijerph18020609
- V. R. M. Lo Verso and A. Carlin, Human-Centric Lighting in Assembly Workstations 4.0 to Improve Well-Being and Health of Operators: A Case Study in the Automotive Sector, International Journal Of Mechanics And Control, 26:01 (2025) 185-212. https://doi.org/10.2139/ssrn.4966566
- C. Papatsimpa and J.-P. J. S. Linnartz, Personalized office lighting for circadian health and improved sleep, Sensors, 20:16 (2020) 4569. https://doi.org/10.3390/s20164569
- E. M. Harrison, E. A. Schmied, A. P. Easterling, A. M. Yablonsky, G. L. Glickman and p. health, A hybrid effectiveness-implementation study of a multi-component lighting intervention for hospital shift workers, International journal of environmental research and public health, 17:23 (2020) 9141. https://doi.org/10.3390/ijerph17239141
- R. Nielsen and J. P. Meyer, Evaluation of metabolism from heart rate in industrial work, Ergonomics, 30:3 (1987) 563-572. https://doi.org/10.1080/00140138708969745
- R. Hétu, Mismatches between auditory demands and capacities in the industrial work environment, Audiology, 33:1 (1994) 1-14. https://doi.org/10.3109/00206099409072950
- O. Hämmig and G. F. Bauer, Work, work-life conflict and health in an industrial work environment, Occupational Medicine, 64:1 (2014) 34-38. https://doi.org/10.1093/occmed/kqt127
- K.-M. Pham, V. Garcia Hansen and G. Isoardi, Appraisal of the visual environment in an industrial factory: a case study in subtropical climates, Journal of Daylighting, 3:2 (2016) 12-26. https://doi.org/10.15627/jd.2016.4
- J. Zauner and H. Plischke, Designing Light for Night Shift Workers: Application of Nonvisual Lighting Design Principles in an Industrial Production Line, Applied Sciences, 11:22 (2021) 10896. https://doi.org/10.3390/app112210896
- M. Szkiela, E. Kusideł, T. Makowiec-Dąbrowska and D. Kaleta, Night shift work-a risk factor for breast cancer, International Journal of Environmental Research Public Health,17:2 (2020) 659. https://doi.org/10.3390/ijerph17020659
- K. Sadeghniiat-Haghighi, Z. Yazdi, H. Jahanihashemi and O. Aminian, The effect of bright light on sleepiness among rapid-rotating 12-hour shift workers, Scandinavian journal of work, environment & health, 37:1 (2011) 77-79. https://doi.org/10.5271/sjweh.3086
- A. Lowden and G. Kecklund, Considerations on how to light the night-shift, Lighting Research & Technology, 53:5 (2021) 437-452. https://doi.org/10.1177/14771535211012251
- R. G. Foster, Sleep, circadian rhythms and health, Interface Focus, 10:3 (2020) 20190098. https://doi.org/10.1098/rsfs.2019.0098
- W. H. Walker, 2nd, J. C. Walton, A. C. DeVries and R. J. Nelson, Circadian rhythm disruption and mental health, Transl Psychiatry, 10:1 (2020) 28. https://doi.org/10.1038/s41398-020-0694-0
- M. G. Figueiro, L. Sahin, B. Wood and B. Plitnick, Light at Night and Measures of Alertness and Performance: Implications for Shift Workers, Biol Res Nurs, 18:1 (2016) 90-100. https://doi.org/10.1177/1099800415572873
- S. He and Y. Yan, Impact of advance light exposure on assembly-line workers' subjective work alertness and sleep quality, Lighting Research &Technology, 55:2 (2023) 105-128. https://doi.org/10.1177/14771535221078763
- K. Reinhold and P. Tint, Lighting of workplaces and health risks, Elektronika ir elektrotechnika, 90:2 (2009) 11-14.
- K. C. Parsons, Environmental ergonomics: a review of principles, methods and models, Appl Ergon, 31:6 (2000) 581-594. https://doi.org/10.1016/S0003-6870(00)00044-2
- P. R. Boyce, Human Factors in Lighting, 2nd ed.,Taylor & Francis: London, UK, 2003, pp. https://doi.org/10.1201/9780203426340
- P. Boyce, C. Hunter and O. J. T. Howlett, New York: Rensselaer Polytechnic Institute, The benefits of daylight through windows, Lighting Research Center , Rensselaer Polytechnic Institute, Troy, New York, 12th September, (2003), pp. 12180-3352
- I. Dianat, A. Sedghi, J. Bagherzade, M. A. Jafarabadi and A. W. Stedmon, Objective and subjective assessments of lighting in a hospital setting: implications for health, safety and performance, Ergonomics, 56:10 (2013) 1535-1545. https://doi.org/10.1080/00140139.2013.820845
- T. Brown, G. Brainard, C. Cajochen, C. Czeisler, J. Hanifin, S. Lockley, R. Lucas, M. Munch, J. O'Hagan and S. Peirson, Recommendations for healthy daytime, evening, and night-time indoor light exposure, PLoS Biol, 20:3 (2020), e3001571. https://doi.org/10.1371/journal.pbio.3001571
- CIE, CIE Position Statement-Proper Light at the Proper Time, غير متوفرة: Vienna, Austria, 2019.
- National Housing and Building Research Center (Egypt), Egyptian Code for Design Principles and Implementation Conditions for Lighting Works (Code No. 308), Ministry of Housing, Utilities and Urban Development: Cairo, Egypt, 2006.
- CEN (Comité Européen de Normalisation), European Standard 12464-1:2021, Light and Lighting-Lighting of Work Places-Part 1: Indoor Work Places, CEN: Brussels, Belgium, 2021.
- M. S. Rea, M. G. Figueiro, J. D. Bullough and A. Bierman, A model of phototransduction by the human circadian system, Brain Res Brain Res Rev, 50:2 (2005) 213-228. https://doi.org/10.1016/j.brainresrev.2005.07.002
- M. Figueiro, M. Kalsher, B. Steverson, J. Heerwagen, K. Kampschroer and M. Rea, Circadian-effective light and its impact on alertness in office workers, International journal of lighting research and technology, 51:2 (2019) 171-183. https://doi.org/10.1177/1477153517750006
- CIE (Commission Internationale de l'Eclairage), CIE Position Statement on Integrative Lighting Recommending Proper Light at the Proper Time, CIE Central Bureau: Vienna, Austria, 2024.
- International WELL Building Institute (IWBI), WELL Building Standard v2, Version Q2 2024, IWBI: New York, USA, 2024.
- L. Giovannini, V. R. M. Lo Verso, L. Valetti, J. G. Daltrozo and A. Pellegrino, Analysis of integrative lighting through field measurements and annual daylight simulations in offices, Lighting Research & Technology, 57:4-5 (2025) 421-450. https://doi.org/10.1177/14771535241311606
- S. Abdelwahab and S. J. L. Altomonte, Daylighting Through Electrochromic Glazing Under Overcast Skies: Impacts on Visual Task Performance and Perception, LEUKOS (2024) 1-25. https://doi.org/10.1080/15502724.2024.2350584
- M. G. Kent, S. Altomonte, R. Wilson and P. R. Tregenza, Temporal effects on glare response from daylight, Building and Environment, 113:(2017) 49-64. https://doi.org/10.1016/j.buildenv.2016.09.002
- M. Boubekri, J. Lee, P. MacNaughton, M. Woo, L. Schuyler, B. Tinianov and U. Satish, The Impact of Optimized Daylight and Views on the Sleep Duration and Cognitive Performance of Office Workers, Int J Environ Res Public Health, 17:9 (2020) 3219. https://doi.org/10.3390/ijerph17093219
- Borisuit, A., The impact of light including non-image forming effects on visual comfort. 2013, EPFL.
- M.Figueiro, Nonvisual lighting effects and their impact on health and well-being, in Encyclopedia of color science and technology. Springer, Berlin, Heidelberg, 2023, pp. 1236-1246. https://doi.org/10.1007/978-3-030-89862-5_118
- R. V. Krejcie and D. W. Morgan, Determining Sample Size for Research Activities, Educational and psychological measurement, 30:3 (2016) 607-610. https://doi.org/10.1177/001316447003000308
- M. Tavakol and R. Dennick, Making sense of Cronbach's alpha, Int J Med Educ, 2:(2011) 53-55. https://doi.org/10.5116/ijme.4dfb.8dfd
- C. J. Ferguson, An effect size primer: a guide for clinicians and researchers, American Psychological Association, 40:5(2016 )301-310. https://doi.org/10.1037/14805-020
- H. Akoglu, User's guide to correlation coefficients, Turk J Emerg Med, 18:3 (2018) 91-93. https://doi.org/10.1016/j.tjem.2018.08.001
- A. Field, Discovering statistics using IBM SPSS statistics, sage: London, UK, 2024, PP. 1079-1094.
- R. Mork, H. K. Falkenberg, K. I. Fostervold and H. M. S. Thorud, Visual and psychological stress during computer work in healthy, young females-physiological responses, International archives of occupational environmental health, 91:7 (2018) 811-830. https://doi.org/10.1007/s00420-018-1324-5
- K. H. Lin, C. C. Su, Y. Y. Chen and P. C. Chu, The Effects of Lighting Problems on Eye Symptoms among Cleanroom Microscope Workers, Int J Environ Res Public Health, 16:1 (2019) 101. https://doi.org/10.3390/ijerph16010101
- E. Simonson and J. J. J. Brozek, Effects of illumination level on visual performance and fatigue, Journal of the Optical Society of America,38:4 (1948) 384-397. https://doi.org/10.1364/JOSA.38.000384
- Main, A. Dowson and M. Gross, Photophobia and phonophobia in migraineurs between attacks, Headache: The Journal of Head Face Pain, 37:8 (1997) 492-495. https://doi.org/10.1046/j.1526-4610.1997.3708492.x
- M. Rosenfield, Computer vision syndrome: a review of ocular causes and potential treatments, Ophthalmic Physiol Opt, 31:5 (2011) 502-515. https://doi.org/10.1111/j.1475-1313.2011.00834.x
- H. Juslén and A. Tenner, Mechanisms involved in enhancing human performance by changing the lighting in the industrial workplace, International Journal of Industrial Ergonomics, 35:9 (2005) 843-855. https://doi.org/10.1016/j.ergon.2005.03.002
2383-8701/© 2025 The Author(s). Published by solarlits.com. This is an open access article distributed under the terms and conditions of the Creative Commons Attribution 4.0 License.

5624
Total views
Citations
SHARE ON


