Article | 30 March 2026
Volume 13 Issue 1 pp. 143-166 • doi: 10.15627/jd.2026.9
Impact of Building Height and Window Configurations on Ventilation Performance and Temperature Distribution: A CFD Study of an Institutional Kitchen Environment
Jesna Mathew,1,* Gnanasambandam Subbaiyan,1 Hareesh Krishnan H2,3
Author affiliations
Department of Architecture, National Institute of Technology, Tiruchirappalli, Tamil Nadu 620015, India
Department of Energy and Environment, National Institute of Technology, Tiruchirappalli, Tamil Nadu 620015, India
Department of Mechanical Engineering, Mar Athanasius College of Engineering, Kothamangalam, Kerala 686666, India
*Corresponding author.
jmjesnamathew@gmail.com (J. Mathew)
subbaiah@nitt.edu (G. Subbajyan)
hareeshkrish2747@gmail.com (H. Krishnan H)
History: Received 30 December 2025 | Revised 23 February 2026 | Accepted 28 February 2026 | Published online 30 March 2026
2383-8701/© 2026 The Author(s). Published by solarlits.com. This is an open access article distributed under the terms and conditions of the Creative Commons Attribution 4.0 License.
Citation: Jesna Mathew, Gnanasambandam Subbaiyan, Hareesh Krishnan H, Impact of Building Height and Window Configurations on Ventilation Performance and Temperature Distribution: A CFD Study of an Institutional Kitchen Environment, Journal of Daylighting, 13:1 (2026) 143-166. doi: 10.15627/jd.2026.9
Figures and tables
Abstract
Institutional kitchens often experience inadequate thermal comfort and indoor air quality (IAQ) due to intense heat generation and pollutant emissions from cooking activities, increasing workers’ exposure to heat stress and related health risks. Providing adequate ventilation is essential to ensure acceptable IAQ and comfortable working conditions. Enhancing natural ventilation through architectural design can reduce reliance on mechanical systems and energy consumption. This study investigates the influence of two key design parameters, building height and window configuration, on ventilation performance and thermal environment in institutional kitchens. A validated computational fluid dynamics (CFD) model developed in ANSYS Fluent was used to evaluate airflow patterns, IAQ, and temperature distribution across 53 design configurations that varied in height, cross-ventilation pattern, window–ventilator combination, and window distribution. The impact of these variables was assessed using a performance score derived from Principal Component Analysis. Results indicate that the configuration with a 4 m building height and 40% window-to-wall ratio (WWR) on both windward and leeward sides achieved the best performance, whereas the configuration with a 4.5 m height, 40% WWR on the windward side, and 10% on the leeward side performed the poorest. The findings provide design insights for improving natural ventilation and thermal comfort in institutional kitchens.
Keywords
institutional kitchen, ventilation performance, IAQ, CFD, window configuration, age of air, thermal environment
Nomenclature
| IAQ | Indoor Air Quality |
| CFD | Computational Fluid Dynamics |
| WWR | Window-to-Wall Ratio |
| WFR | Window-to-Floor Ratio |
| NV | Natural Ventilation |
| CV | Cross Ventilation |
| PCA | Principal Component Analysis |
| LMAA | Local Mean Age of Air |
| MAA | Mean Age of Air |
1. Introduction
Thermal comfort and good IAQ in the workplace are essential for ensuring good health, well-being, and productivity of occupants. In India, approximately 40% of the national burden of disease is due to environmental and occupational risk factors, with air pollution indoors and outdoors being the most important [1]. A wide variety of occupations, including work in large kitchens of the food industry, are carried out in adverse conditions [2]. The indoor environmental quality of commercial kitchen space is often unsatisfactory due to the primary activity, the cooking process. Kitchen workers are particularly vulnerable to heat stress in the workplace due to the intense heat generated from cooking activities, especially in tropical countries like India [2]. The air quality in the kitchen is affected by the high emission rate of contaminants released from the cooking processes [3]. Ventilation plays an important role in securing optimum air quality and providing comfortable and productive working conditions.
Cooking emits pollutants such as particulate matter (PM), carbon monoxide (CO), oxides of sulphur (SOx), and oxides of nitrogen (NOx), which are highly prone to harming human health [4]. Studies have reported elevated concentrations of pollutants, including CO, CO₂, polycyclic aromatic hydrocarbons (PAHs)and particulate matter (PM) in kitchens [2,5-7].
CO and CO₂, produced from incomplete combustion in gas stoves, are classified as hazardous by the Wisconsin Department of Health Services [4]. Rahimi-Gorji et al. [8] reported that PM in the 1–10 μm size range poses health risks due to deposition in the respiratory system. The exposure to cooking oil fumes has been linked to respiratory diseases such as rhinitis, emphysema, asthma, abnormal lung function, and increased lung cancer mortality among hotel and restaurant staff [9]. Wong et al. [10] reported that individuals working in gas-fueled kitchens exhibited poorer lung function than those working in kitchens with electric appliances due to higher exposure to and .
Commercial kitchens are characterised by high temperatures and high humidity levels, creating a thermally challenging environment for workers. Prolonged exposure to such conditions can cause heat-related illnesses [2]. The main contributors to heat stress in commercial kitchens include high ambient air temperature, increased humidity, radiant heat from cooking appliances, insufficient ventilation, occupant density, type of clothes, long work duration, etc [11].
IAQ in the kitchen is influenced by various factors, including kitchen design, the type of fuel used, the type of dishes being cooked, and the ventilation strategies [12]. Effective mitigation measures, including range hoods and properly designed ventilation systems, can significantly reduce pollutant exposure [12,13]. Inadequate ventilation design can lead to an increase in the indoor air temperature, and thereby energy use [14].
Several studies have evaluated the effectiveness of ventilation in improving IAQ and thermal comfort in the kitchen. Saha et al.[3] found that increasing the number of openings significantly reduced CO and CO₂ concentrations. Similarly, Ruth et al. [15] observed that proper ventilation lowered CO and PM by nearly 50 . Grabow et al. [16] showed that open doors and windows reduced particulate matter by up to 98 and CO by up to 95 . Liu et al.[17] demonstrated that improved ventilation design enhanced IAQ and thermal comfort. Hamidur Rahman et al. [4] reported that adding suction hoods and chimneys reduced CO, CO₂, and PM₁₀ by 68 , 55 , and 80 , respectively.
Compared to a residential kitchen, cooking in commercial kitchens is more intense and generates higher pollutant concentrations, posing greater health risks [18]. Within the category of commercial kitchen workplaces, institutional kitchens represent a specific type that provides meals in settings such as colleges, universities, schools, hospitals, daycare centers, and senior homes [5]. The present study focuses specifically on the indoor environmental quality of institutional kitchens.
In developing countries such as India, many institutional kitchens lack adequate mechanical ventilation systems to extract heat and pollutants. Despite being critical occupational environments, such spaces have received limited research attention, with limited studies reported from India. Existing studies have reported high levels of indoor air pollution, thermal discomfort, and inadequate ventilation, posing a health risk to employees [3,5,14]. ASHRAE Standard 62.1 recommends a minimum outdoor air supply rate of 0.6 L/s · m2 for commercial kitchens for accepted indoor air quality, while ASHRAE Standard 55 limits the allowable vertical air temperature difference to 3°C for occupant thermal comfort [19,20]. In the Indian context, SP 41 [21] prescribes 6–9 air changes per hour (ACH) and a minimum fresh air provision of 1.2 m3/min per m2 of floor area for kitchen spaces.
Enhancing natural ventilation inside the institutional kitchen through appropriate building design can reduce the energy expense on mechanical ventilation. While most research has focused on mechanical ventilation, few studies have explored natural ventilation in commercial or institutional kitchens. Saha et al. [3] demonstrated that enhancing natural ventilation through architectural modifications can improve IAQ without additional investment in the institutional kitchen. Mathew and Subbaiyan [5] also demonstrated IAQ improvement through enhanced natural ventilation in institutional kitchens.
In naturally ventilated buildings, design factors such as form, aspect ratio, orientation, window configuration, and window-to-wall ratio (WWR) significantly influence ventilation performance [22-27]. Although these aspects have been widely studied in residential, office, and educational buildings, research on kitchen environments remains limited. Existing studies on kitchens highlight the role of parameters such as aspect ratio, room volume, and opening area in determining ventilation efficiency and ‘age of air’, which are key indicators of IAQ. Debnath et al. [28] examined the relationship between air age and built parameters, including opening-to-wall ratio (OWR), aspect ratio, volume, and slenderness ratio in residential kitchens. Mathew and Subbaiyan [5] reported similar findings for institutional kitchens, while Saha et al. [3] observed that increasing window area enhances IAQ by improving natural ventilation.
The World Health Organization (WHO) emphasizes optimizing building parameters such as opening-to-wall ratio, aspect ratio, airflow, and the use of improved cookstoves for healthy kitchen environments [29]. An integrated design approach that considers IAQ, thermal comfort, ventilation, and energy use can lead to a sustainable, energy-efficient, and healthy building design [30].
While natural ventilation is critical for indoor environmental quality, its application in institutional kitchens remains under-researched. However, no previous study has systematically examined the combined effect of opening configuration and building height (spatial volume) on ventilation performance and temperature distribution in institutional kitchens. Existing research has primarily addressed either ventilation effectiveness or thermal conditions independently. This research addresses this gap by adopting a multivariate approach to analyse the interaction between building height and window configuration on ventilation performance and temperature distribution. This approach enables designers to develop sustainable design strategies that enhance natural ventilation and thermal comfort in institutional kitchens. Accordingly, this study addresses the following research questions:
- How do different window opening configurations influence ventilation performance and temperature distribution in institutional kitchens?
- What is the role of building height (spatial volume) in enhancing airflow characteristics and thermal performance?
- Which combinations of building height and opening configuration provide optimal performance for naturally ventilated institutional kitchens?
To evaluate these questions, a total of 53 parametric design configurations were systematically analysed using a CFD model validated against full-scale experimental data. Unlike prior studies, this research integrates multiple performance indicators through a Principal Component Analysis (PCA)-based framework, enabling a comprehensive assessment of overall ventilation effectiveness and thermal performance.
The methodology identifies the most effective configurations for enhancing both airflow and temperature distribution, thereby providing a practical framework for sustainable institutional kitchen design.
2. Methodology
Based on the study aim, a combination of full-scale in-situ experimentation and Computational Fluid Dynamics (CFD) simulation was employed to assess ventilation performance and temperature distribution in institutional kitchens. The full-scale experiment was conducted to establish boundary conditions and validate the CFD model. The validated model was then used to develop a base institutional kitchen case, which served as the reference for generating and testing 53 design configurations.
The overall research framework adopted in this study is illustrated in Fig. 1. The methodology combines experimental measurements, CFD simulations, configuration analysis, and performance evaluation to assess ventilation and thermal behaviour in institutional kitchens.
Figure 1
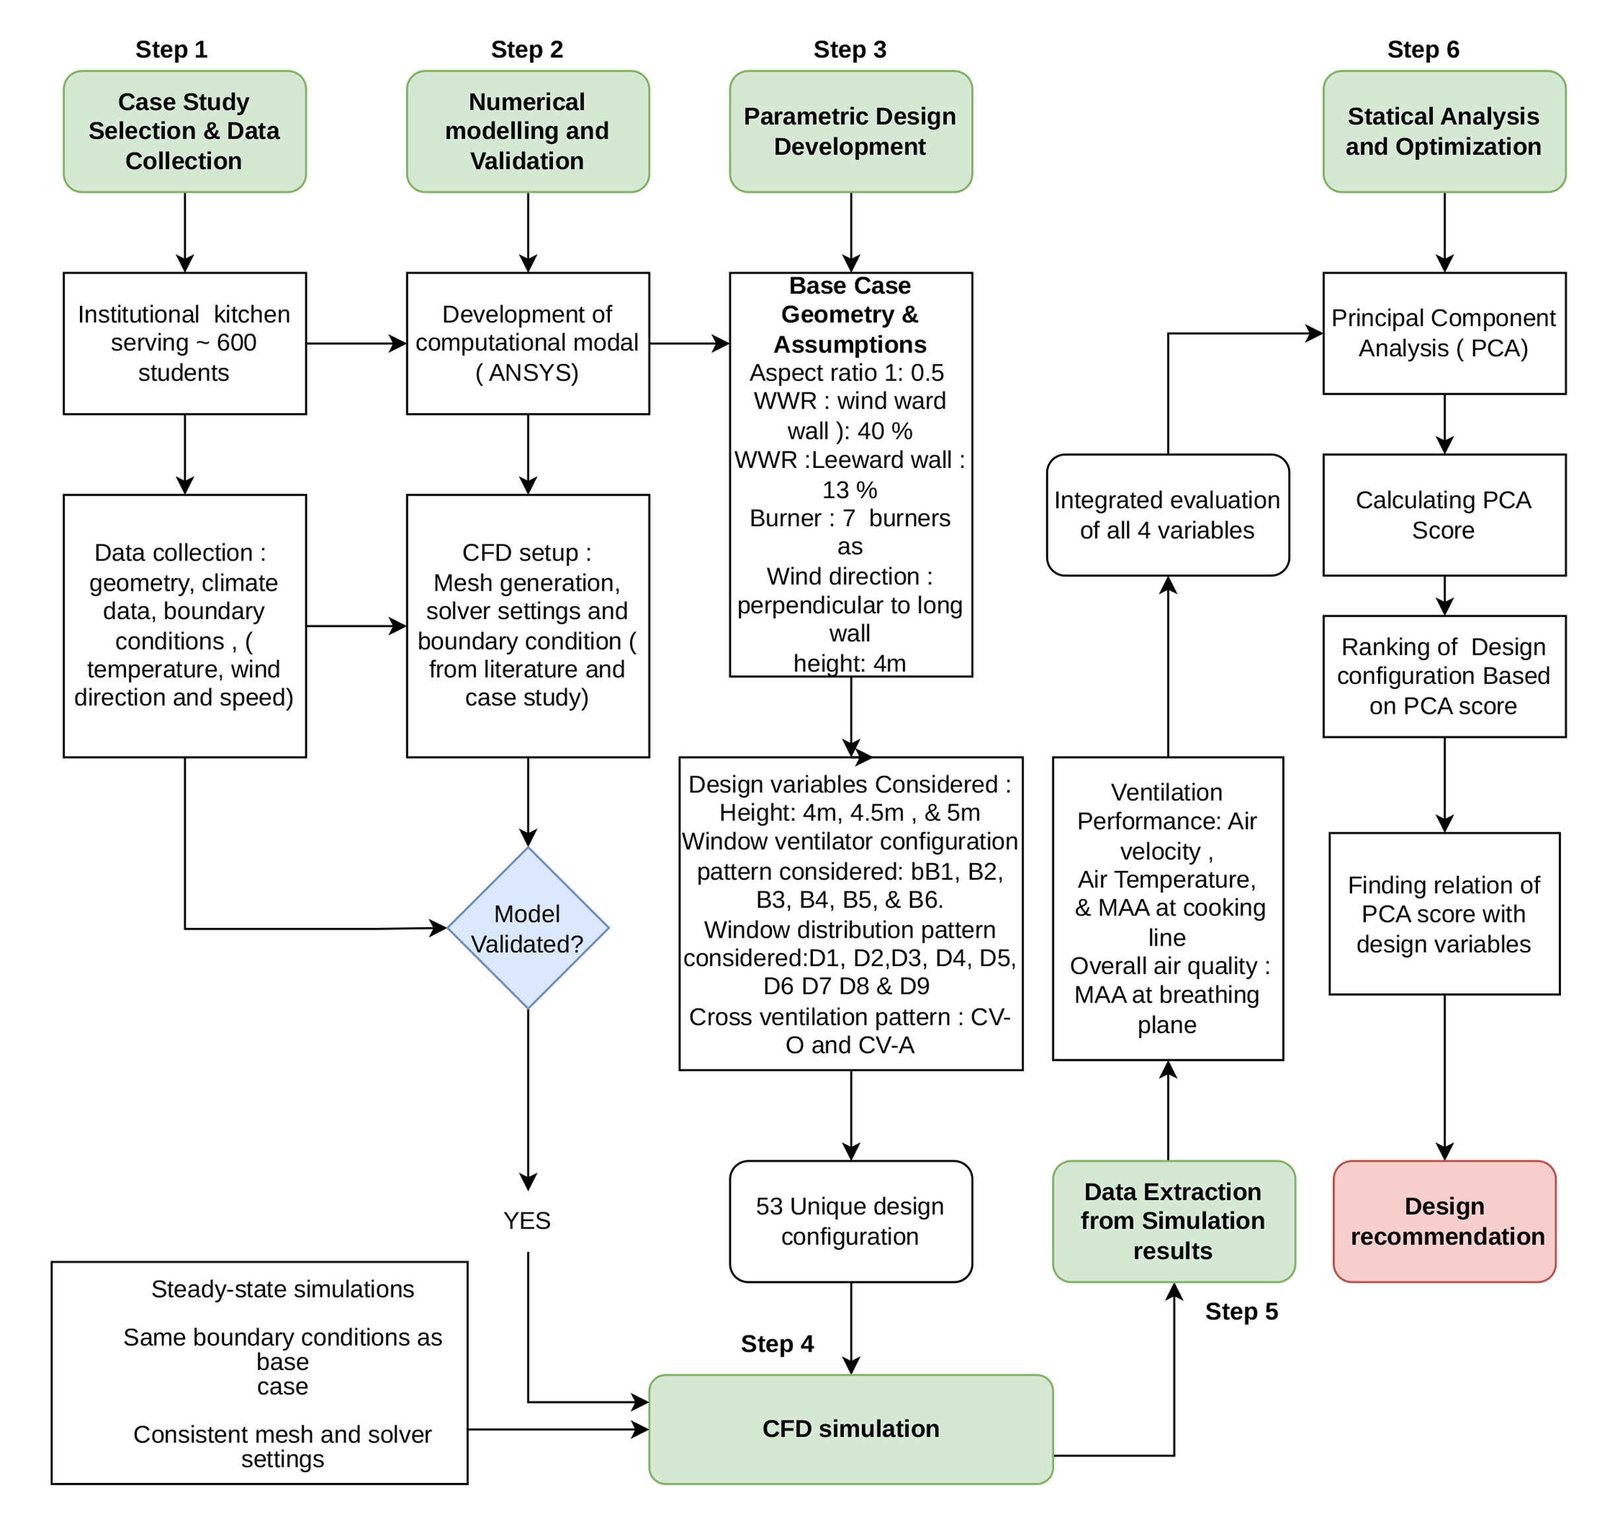
Fig. 1. Overall methodology framework.
2.1. Full-scale experimental study
An institutional kitchen (hostel mess kitchen) in a large university campus situated in Tiruchirappalli, Tamil Nadu, India (10.79050 N, 78.70470 E) is selected for the full-scale experimental study. Based on the National Building Code 2016, Tiruchirappalli has a warm and humid climate. The selected kitchen is an ergonomically designed facility, having a floor area of 148.8 m2, and serves meals to approximately 600 students. Among the nine mess kitchens on the university campus, this kitchen layout is one of the most used. Figure 2 shows the site plan and kitchen plan of the case study.
Figure 2
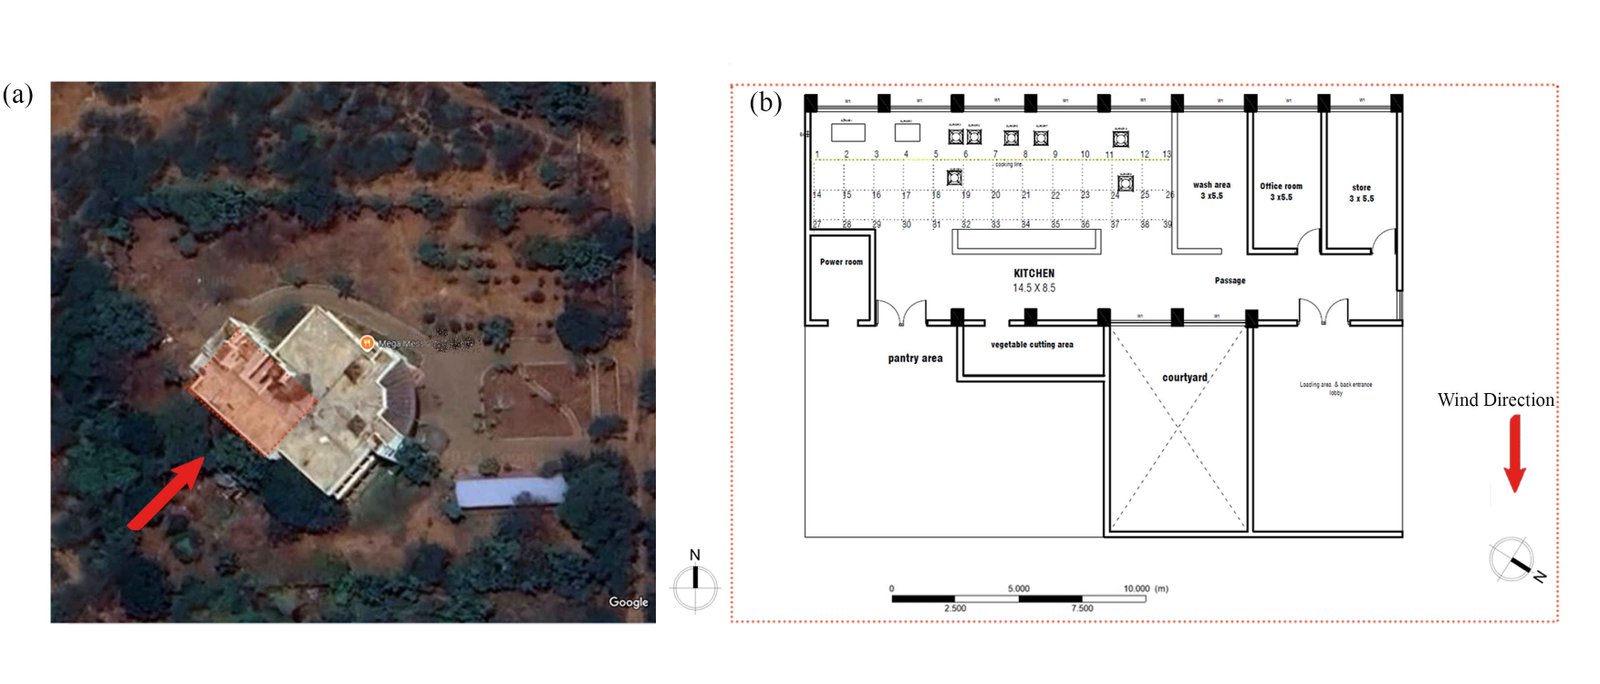
Fig. 2. (a) Site plan showing building orientation (Source: Google Earth, Imagery © Google, 2025). (b) Plan of the kitchen- experimental case study.
The kitchen has six windows of size 2.5 × 1.5 m each on the windward side and two windows of the same dimensions on the leeward side, along with two doors of size 1.5 × 2.1 m each. As observed during site measurements, the doors and leeward-side windows were found to be closed and are therefore they are considered as closed in this study. The selected kitchen primarily depends on natural ventilation and has limited mechanical support, such as four exhaust fans and two ceiling fans, which run only during peak hours. However, since the objective of the study was to assess the natural ventilation (NV) performance, all field measurements were conducted in NV mode, with all fans switched off. The measurements were carried out during peak summer conditions in Tiruchirappalli over three days (June 15-June 17). Air velocity and temperature were measured at multiple kitchen locations during lunch preparation (10:00 AM-12:30 PM) without interrupting cooking activities. Throughout this period, seven burners operated continuously. For validating the CFD model, the air velocity and temperature measurements were taken at grid points of spacing 1.2m, by moving the instruments at each point at an interval of 1 minute. Measurements were taken at 117 points, which consist of 39 points each at 0.1m, 1.1m and 1.6m levels from the floor plane (Fig. 2). The instruments used, along with their specifications, are presented in Table 1.
2.2. Numerical study- CFD simulation
Table 1
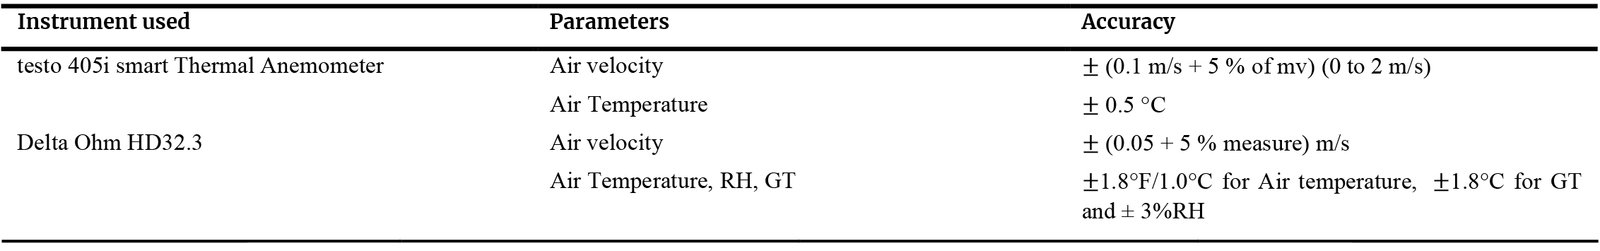
Table 1. Details of instruments used.
Numerical simulations were carried out using ANSYS Fluent 2023 R1, a widely used commercial CFD software. CFD modelling was employed to numerically determine airflow characteristics using the Reynolds-Averaged Navier–Stokes (RANS) model. RANS has been extensively applied in previous studies to simulate air movement in both indoor and outdoor spaces, as it calculates the flow-related parameters by solving the time-averaged governing equations [31-33]. A 3D steady-state RANS model with the standard turbulence closure was employed to simulate airflow and thermal fields. Enhanced wall treatment was applied in this study to improve the accuracy of results near the wall surfaces. The coupled algorithm was used for pressure-velocity coupling. To account for the buoyancy-driven stacking effect, the second-order upwind scheme was applied for pressure, momentum, turbulence, and energy equations. Convergence was considered as achieved when all residuals fell below .
2.2.1. Geometry and computational domain
A full-scale 3D model of the case-study building was developed using ANSYS SpaceClaim. However, the actual structure of the building is too complicated for meshing and simulation, after many trials, the authors decided to model only the kitchen space and nearby spaces where the airflow is affected, which also helped to reduce computational time. The computational fluid field consists of two regions, the large domain (surrounding the building space) and the small flow domain, which represents the kitchen indoor space. The size of the large computational domain was selected based on recommendations from the previous studies [31,34] using the building height (H 4 m) as a reference. The upstream, downstream, lateral, and height of the larger domain are 3H, 10H, 3H, 3H, and 6H, respectively, as shown in Fig. 3.
Figure 3
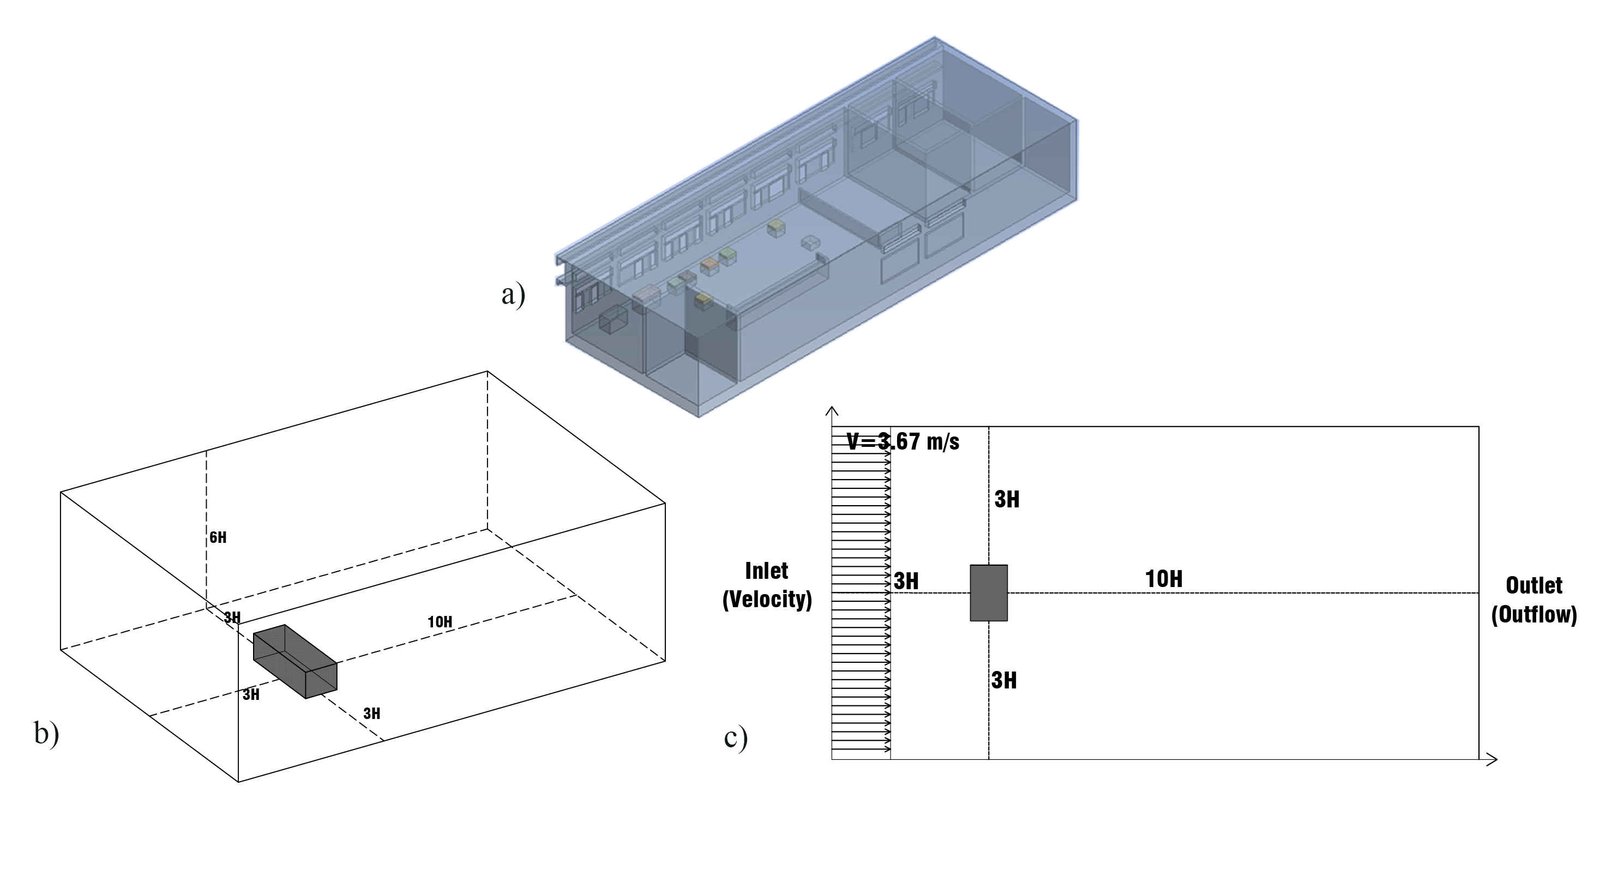
Fig. 3. (a) 3D model of the case-study building (b) CFD Outer domain size -3D view c) Top view.
2.2.2. Grid settings
The computational grid used for numerical calculations was generated using the ‘Meshing’ module in Ansys Workbench. An unstructured grid with tetrahedral volume was generated for numerical study.
A grid sensitivity analysis was carried out to ensure the independence from the chosen computational grid. Three grids comprising 1,789,037 (coarse), 2,716,112 (medium), and 5,654,589 (fine) elements were examined. Velocity distributions along a line in the cooking zone, measured in the Z-direction at 1.10 m above floor level, were compared (Fig. 4). The coarse grid exhibited deviations exceeding 30 relative to the finer meshes, while the medium and fine grids showed close agreement. The average velocity difference between the medium and fine meshes was limited to 3.01 , and the GCI analysis indicated less than 1% variation, thereby confirming mesh-independent solutions at approximately 2.7 million cells. Considering both accuracy and the significantly higher computational time required for the fine mesh, the medium mesh was selected for further study.
Figure 4
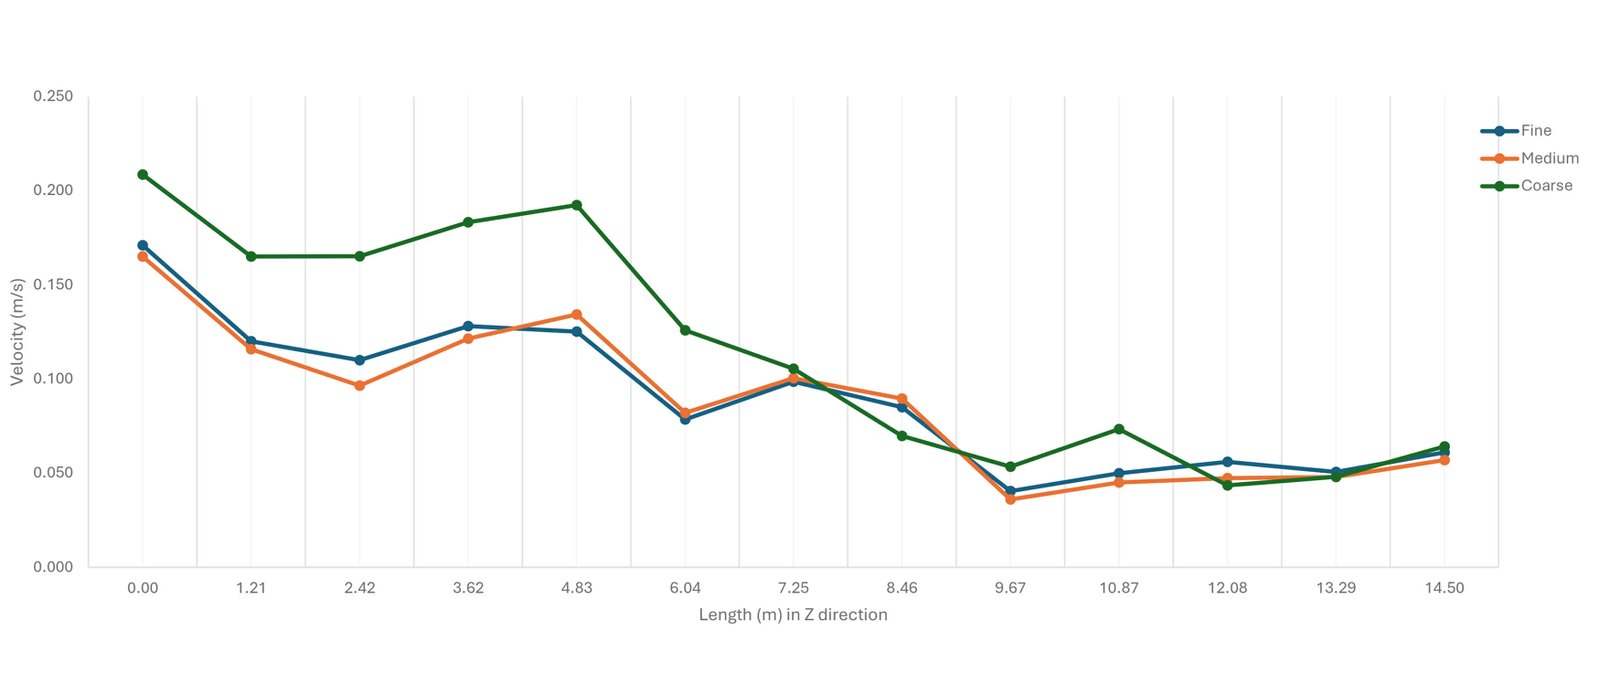
Fig. 4. Velocity at cooking line (at 1.1m above floor level).
A finer and more refined grid was used for the building surfaces and openings. The most refined grid was used for the burner surface and near openings, which is 0.01 m. Figure 5 shows the computational grid generated for the model. The mesh consisted of 2,716,112 elements and 1,055,750 nodes in the numerical simulation.
Figure 5
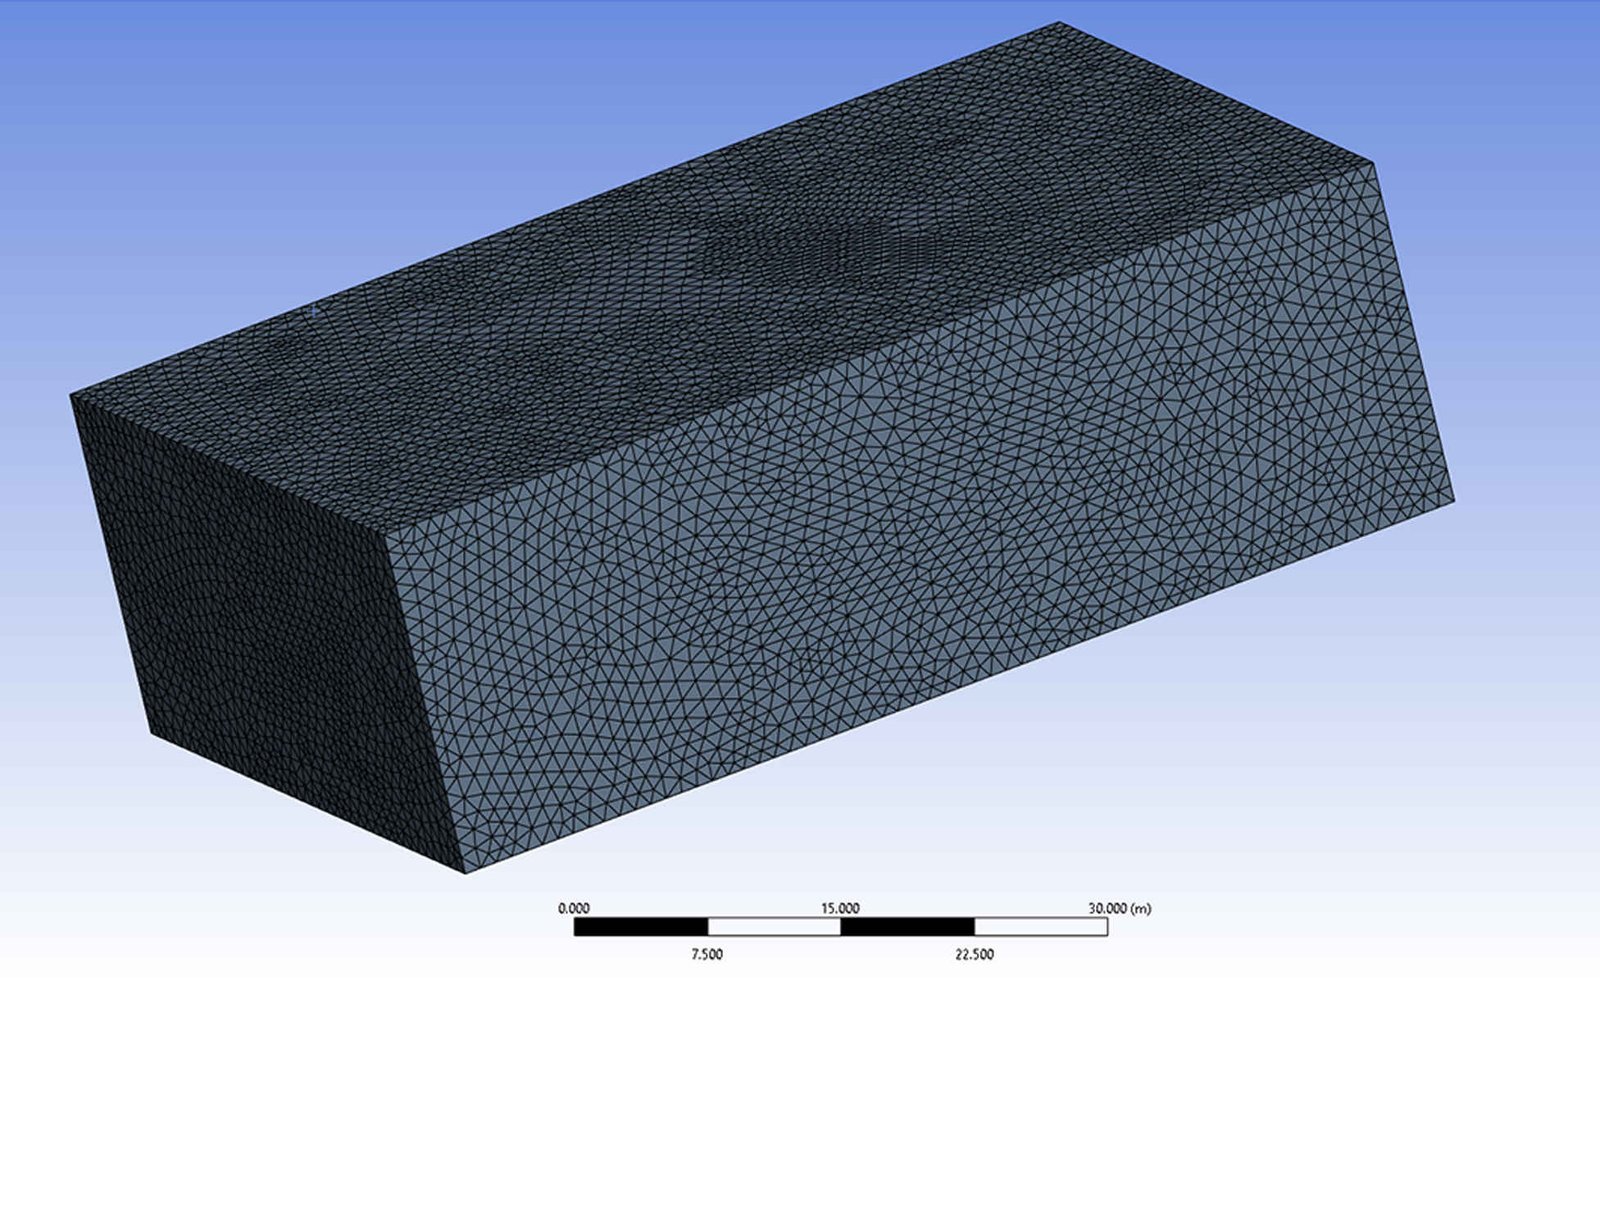
Fig. 5. Computational grid generated.
2.2.3. Boundary Conditions
The simulation boundary conditions were set as follows: a velocity inlet for the inflow boundary, outflow for the outlet, symmetry for the top and lateral boundaries of the outer domain, and wall conditions for the ground and all building surfaces. The inlet velocity was defined using the Weibull function (Equation 1) [31,34,35]. A wind velocity of 3.67 m/s measured by a local weather station is considered as the reference velocity for validation. A user-defined file (UDF) is used to define the velocity magnitude, turbulent kinetic energy, and turbulence dissipation rate at the inlet using the following equations 1, 2, and 3 [34,35].
where \(V_h\) is the velocity inlet profile related to a specific height h, and Vr and hr represent the velocity and height at the wind station, as the simulation reference.
The kinetic energy k [35],
where A₁, A₂, A₃ and A₄ are cubic polynomial constants from curve fitting of experimental data for 𝑘 calculation, and h is the height and b is the characteristic length.
The dissipation rate [35]
where \(\mu\) is the mean velocity, l is the characteristic length, and the constant \(C\mu\) is 0.09.
Zero pressure was applied for the outlet of the computational domain. The outdoor air temperature is specified as 35.2 , whereas the surface temperatures for the floor, sidewalls and ceiling are considered as 32°C, 33°C and 34°C, respectively, as per the measurements conducted on the experimental study. The burner was modelled as a temperature heat source with a temperature of 1240 K, based on values reported in similar CFD investigations [3], and convective heat transfer was considered with a heat transfer coefficient of 25 W/m²K. The boundary conditions applied in the CFD simulation are summarised in Table 2.
Table 2
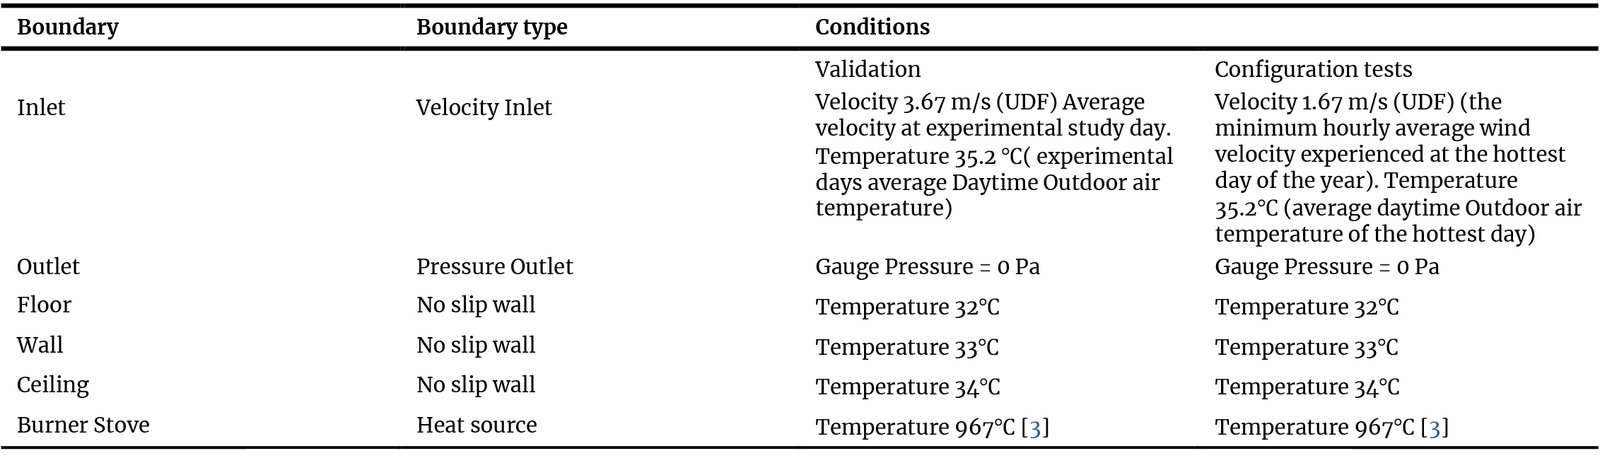
Table 2. Boundary Conditions.
2.2.4. Validation of CFD model
The results from CFD simulations were compared to the experimental data measured in the case study. The wind direction is considered perpendicular to openings, as observed in the experimental study.
Figure 6 shows the discrepancy between simulation results and measured data. RMSE (Root Mean Squared Error) is calculated for each plane by comparing measured and simulated results and is given in Table 3. The difference between the CFD results and the experimental data can be the result of the steady-state assumption used in the simulations. Natural ventilation exhibits an unsteady nature and involves wind fluctuation. Therefore, the steady state assumption may underpredict the wind fluctuation, leading to a discrepancy between the measured and simulation data [36]. RMSE % reported here is considered acceptable.
Figure 6
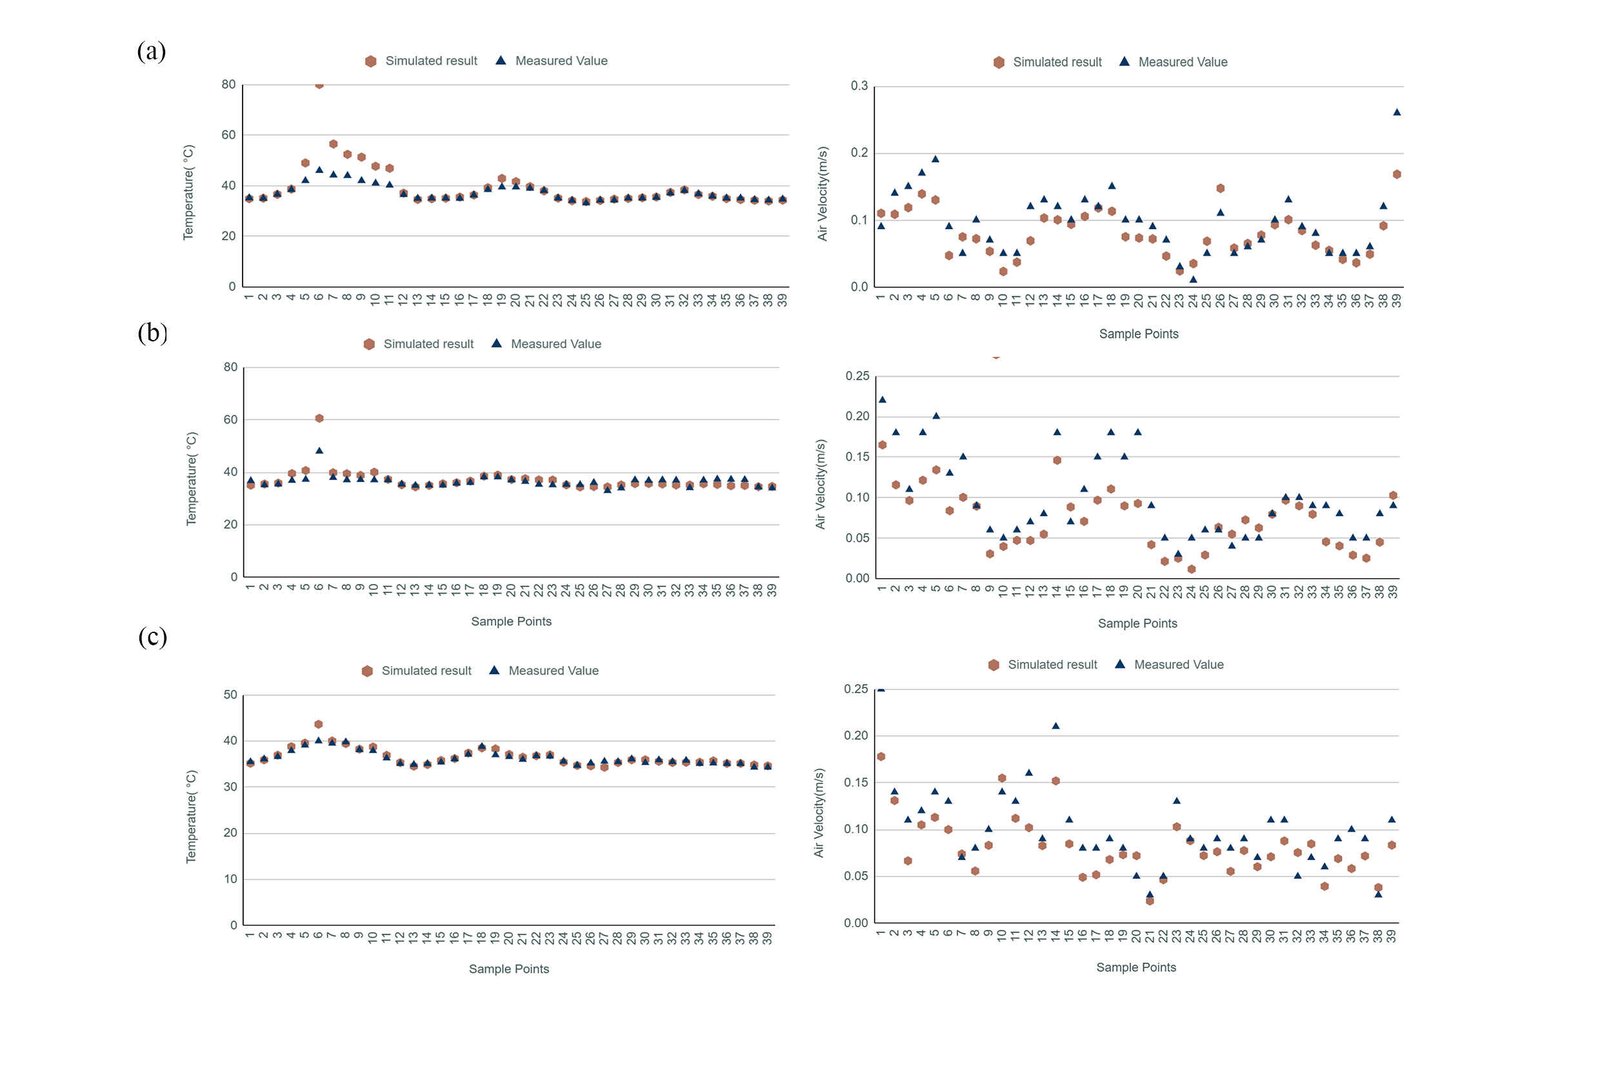
Fig. 6. Measured and simulated values for velocity and temperature for 39 points of (a)level 0.1m, (b) level 1.1m and (c) level 1.6m.
Table 3
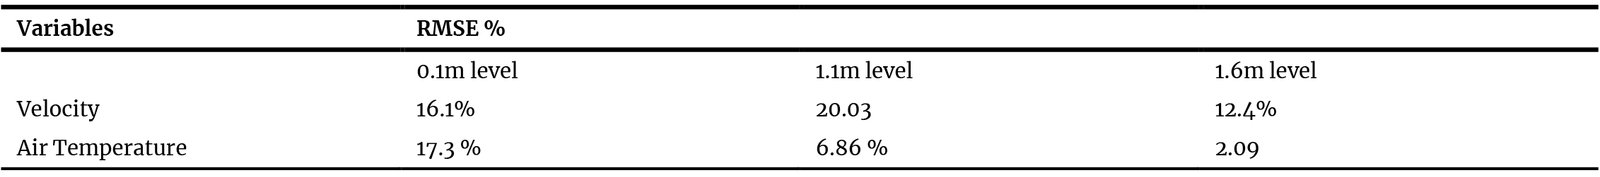
Table 3. RMSE % calculated for velocity and temperature.
2.3. Configuration tests
The case study kitchen model was simplified to a base case model for the configuration test, as shown in Fig. 7. The comparison of case study and base model parameters is shown in Table 4.
Figure 7
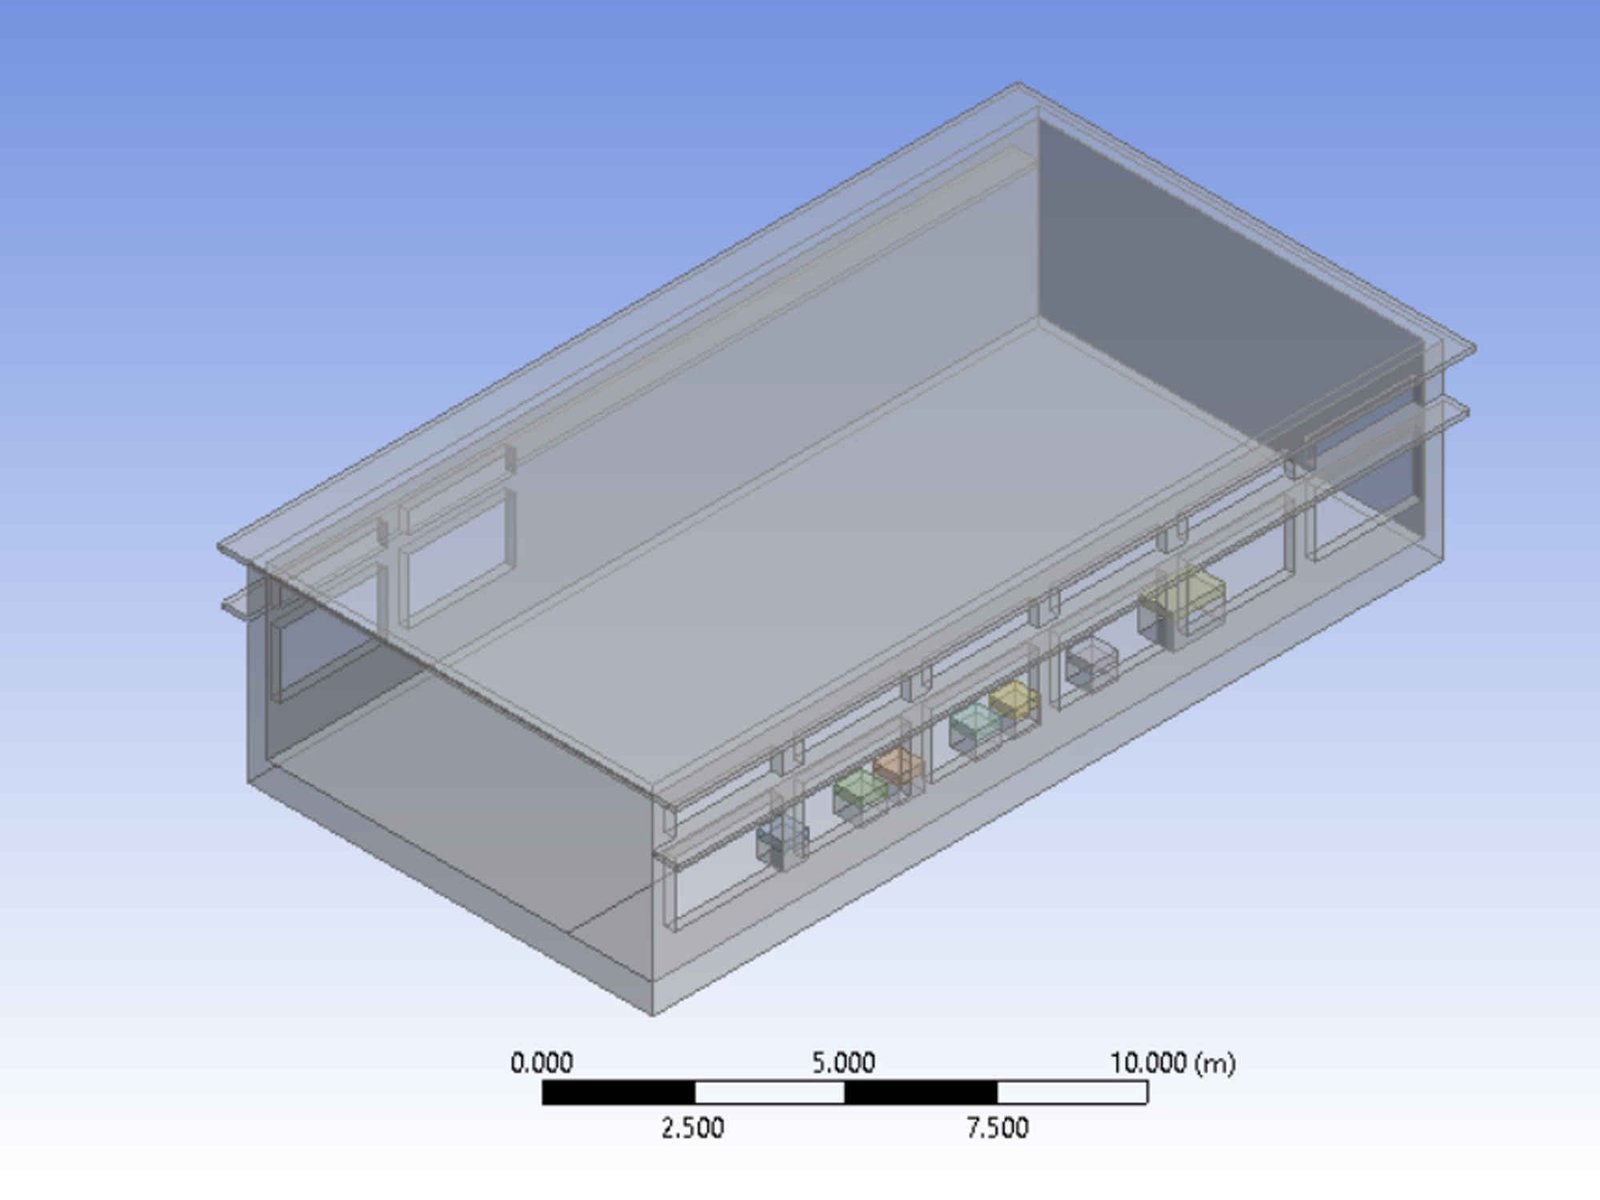
Fig. 7. Base case model.
Table 4
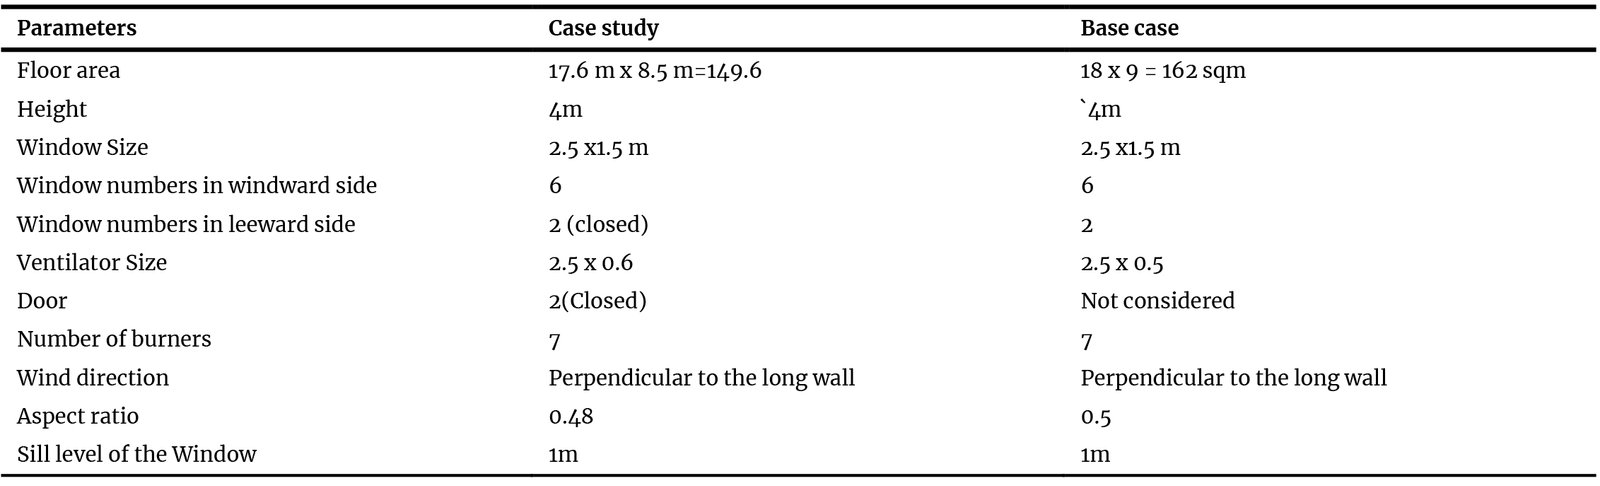
Table 4. Comparison of case study and base model parameters.
2.3.1 The design variables considered and configuration cases
The design variables considered are height, window & ventilator configuration, cross ventilation mode and window distribution pattern. The details of variables and the number of variations considered are shown in Table 5.
Table 5
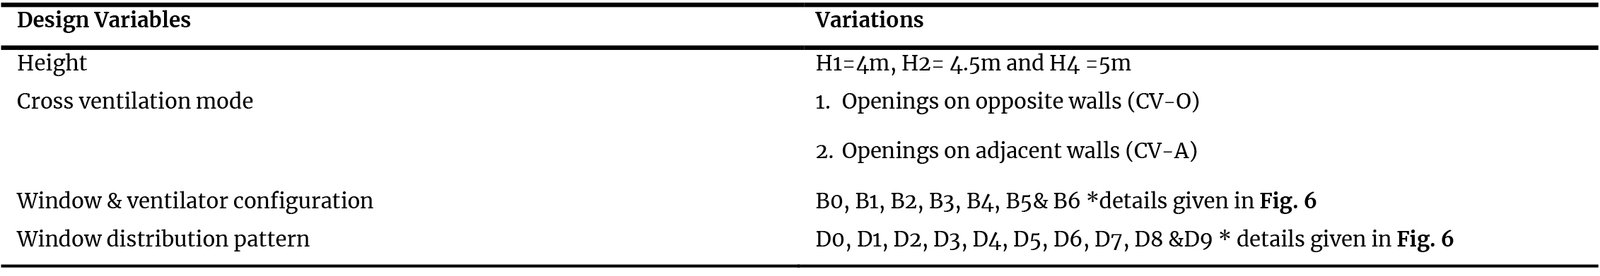
Table 5. Design variables considered.
The graphical representation of window configurations and distribution patterns is shown in Fig. 8. Each variable in the study is assigned a specific code as a name, and a configuration case represents a combination of these variables. For example, the case named CV-O-H1B1 refers to a cross-ventilation pattern ‘O’, with a height category H1 (4 m), and a window configuration B1. The details of the number of windows and ventilators, along with their opening percentages, for each configuration are given in Table 6. The selected window configurations in this study have a window wall ratio range of 10 to 40%, considering daylight availability, heat gain control, and the limits prescribed in previous studies and energy guidelines [37,38]. The upper limit of 40 is consistent with recommendations in ECBC and ASHRAE standards and was further considered appropriate for warm- humid climatic conditions, where higher glazing ratios may significantly increase solar heat gain and thermal load, particularly in institutional kitchen environments.
Figure 8
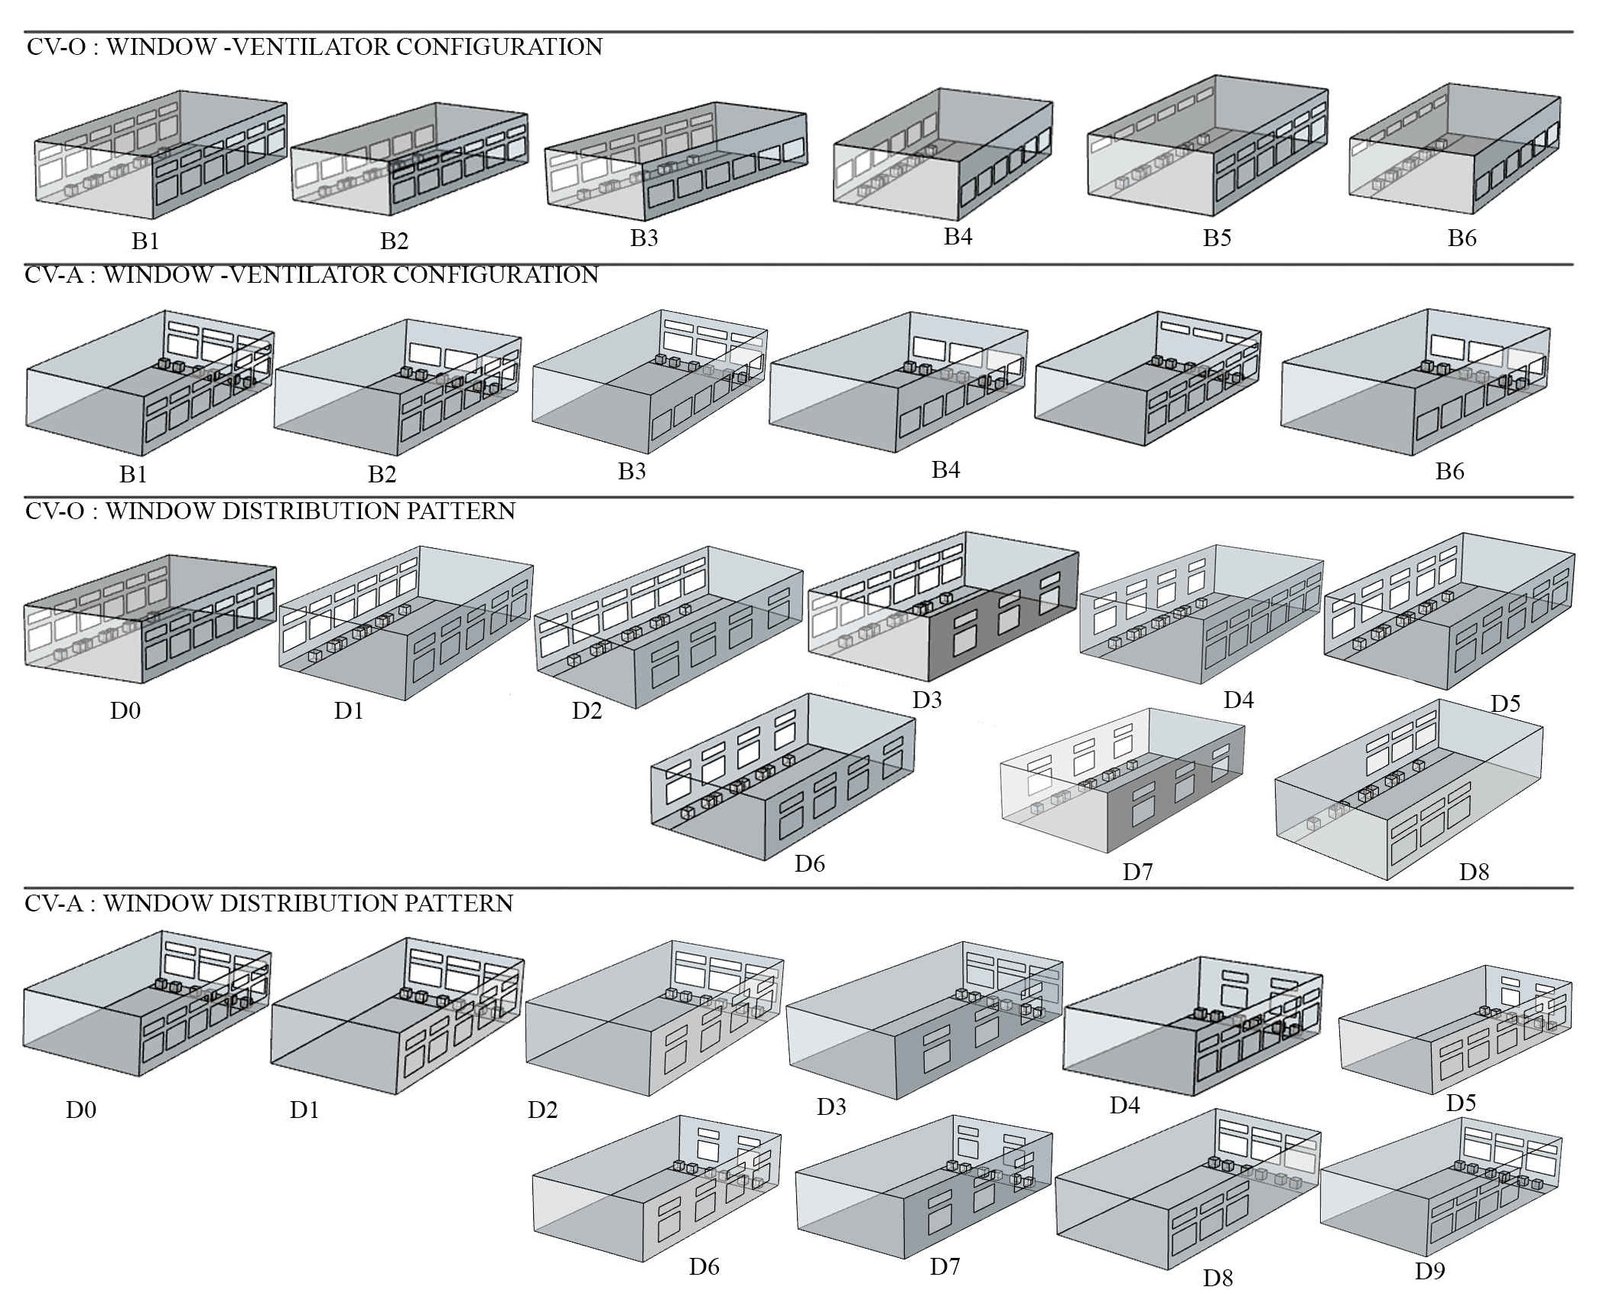
Fig. 8. Graphical representation of window configurations and distribution patterns.
Table 6
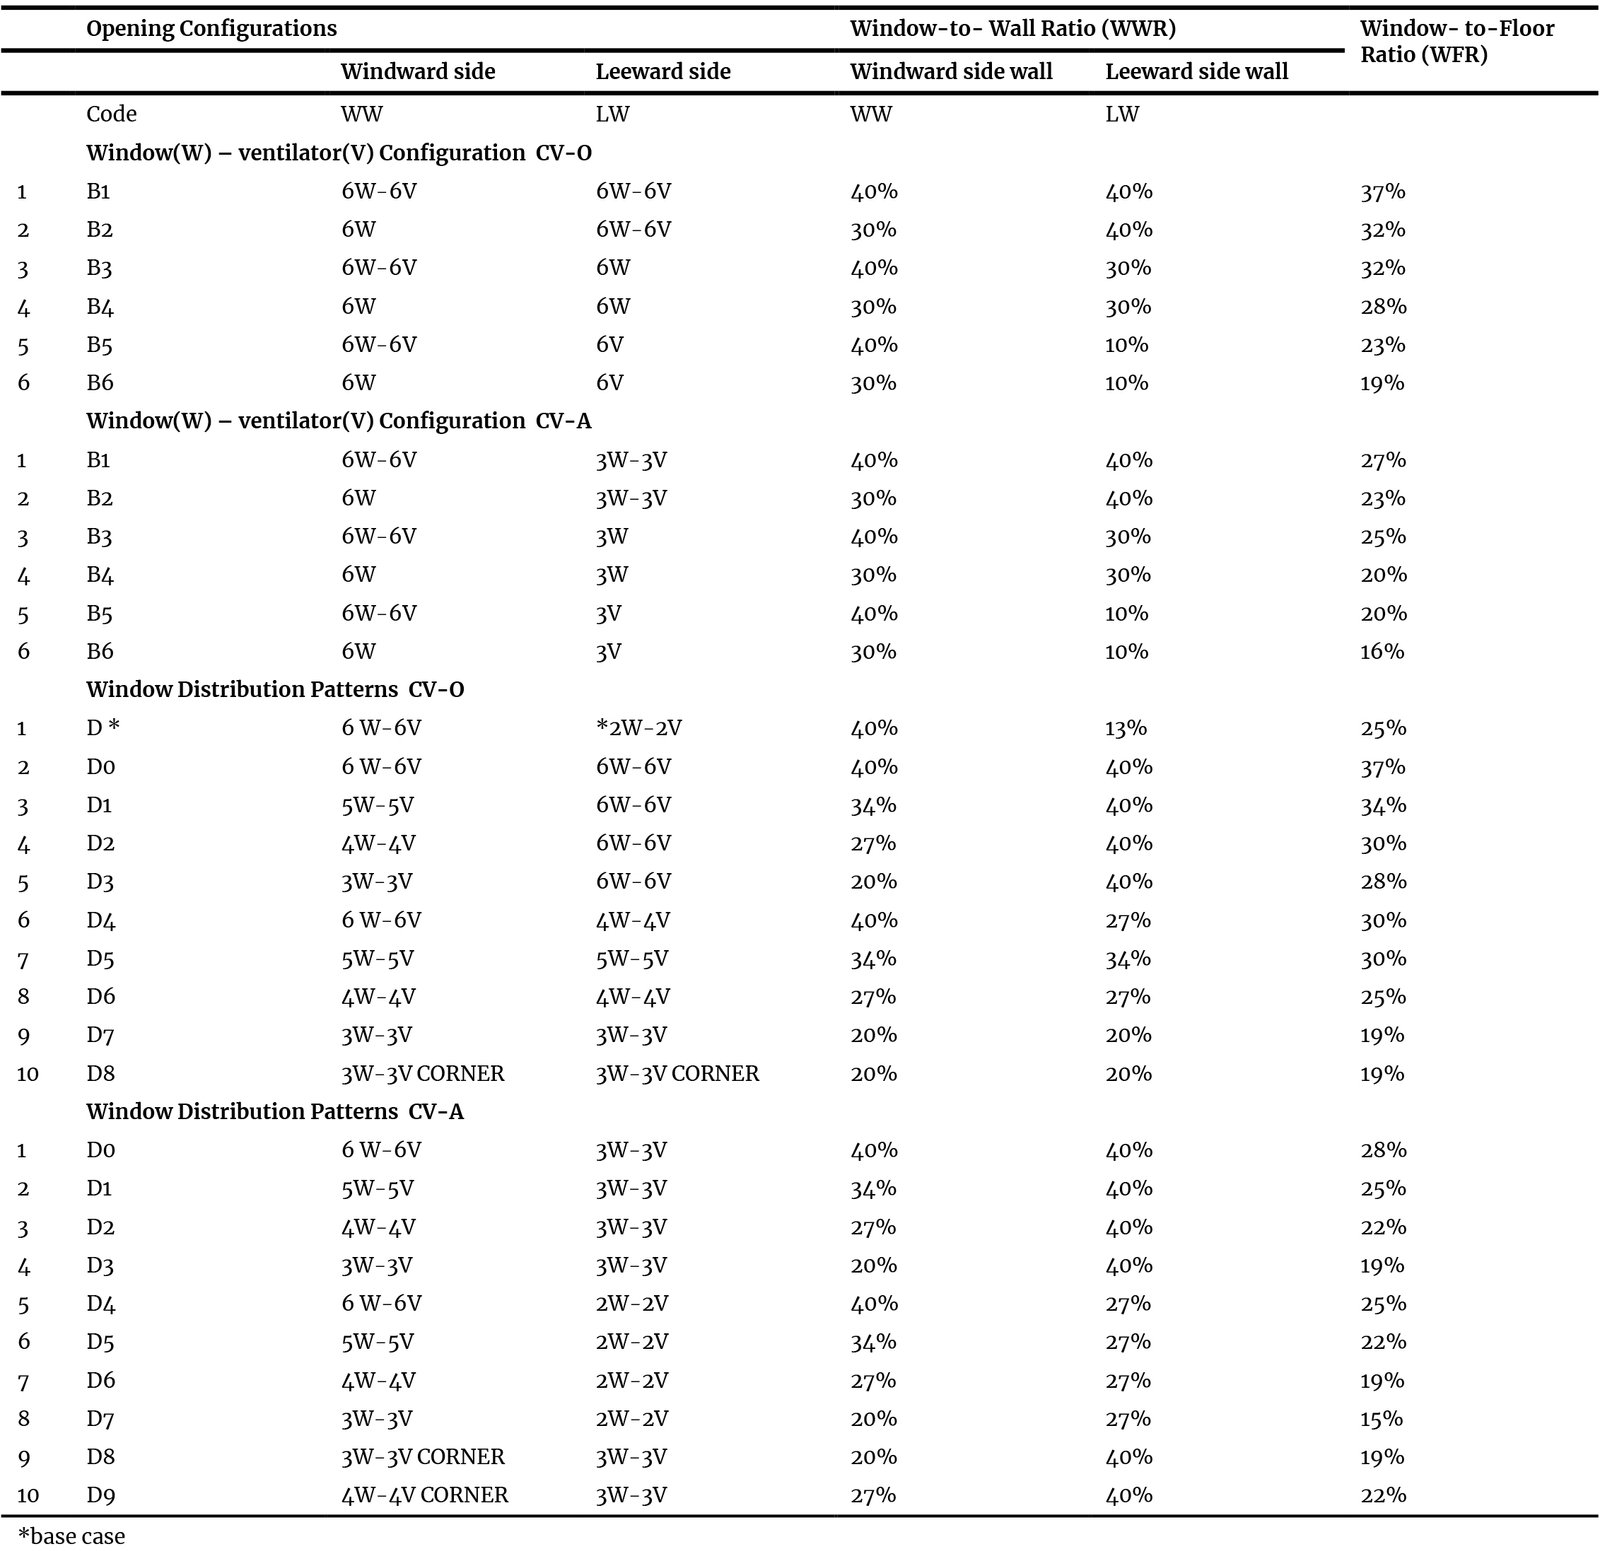
Table 6. Details of window & ventilator configuration and window distribution pattern.
A total of 53 cases were analysed, including 3 heights, 2 cross-ventilation modes, 6 window–ventilator configurations (36 cases), and 17 cases of window distribution patterns combined with H1 and the two cross-ventilation modes. In all configuration tests, the cooking line was positioned near the leeward wall. This placement was selected due to its improved performance in reducing temperature spread and facilitating pollutant dispersion when compared to the windward-side placement used in the experimental case study. The wind velocity considered as 1.67m/s represents the minimum hourly average wind velocity experienced at the hottest day of the year, and the direction considered is perpendicular to the longer wall.
2.4. Output variables
To evaluate the natural ventilation performance, indices such as average air velocity, air changes per hour and age of air are widely used [25,39,40]. ‘Age of air’ is defined as the average time required by fresh air from the point of entry to the room to reach a certain point in the room, and it is also referred to as Local Mean Age of Air (LMAA) [5,28]. The Mean Age of Air (MAA) represents the average duration that air resides within a specific region of space relative to the time it initially entered [41]. Age of air directly reflects the freshness of air and the efficiency of pollutant removal; therefore, it is considered as a significant indicator of IAQ. To evaluate the ventilation performance and temperature distribution of each configuration, the study considers average air velocity, age of air, and air temperature as key performance variables.
The cooking line, or cooking zone, is the critical workspace in institutional kitchens where chefs are directly exposed to high temperatures,[42,43] is the primary focus of this study. The cooking zone is defined as the linear area in front of the burners, where chefs typically work, based on observations from the case study site and similar institutional kitchen layouts. In this study, the cooking zone is defined as the volume extending 0.30 m from the front edge of the burners, spanning 1.0 m in width, 2.0 m in height, and 16 m along the entire length of the seven-burner range, representing the occupied working zone of chefs and helpers and is indicated in Fig. 9.
Figure 9
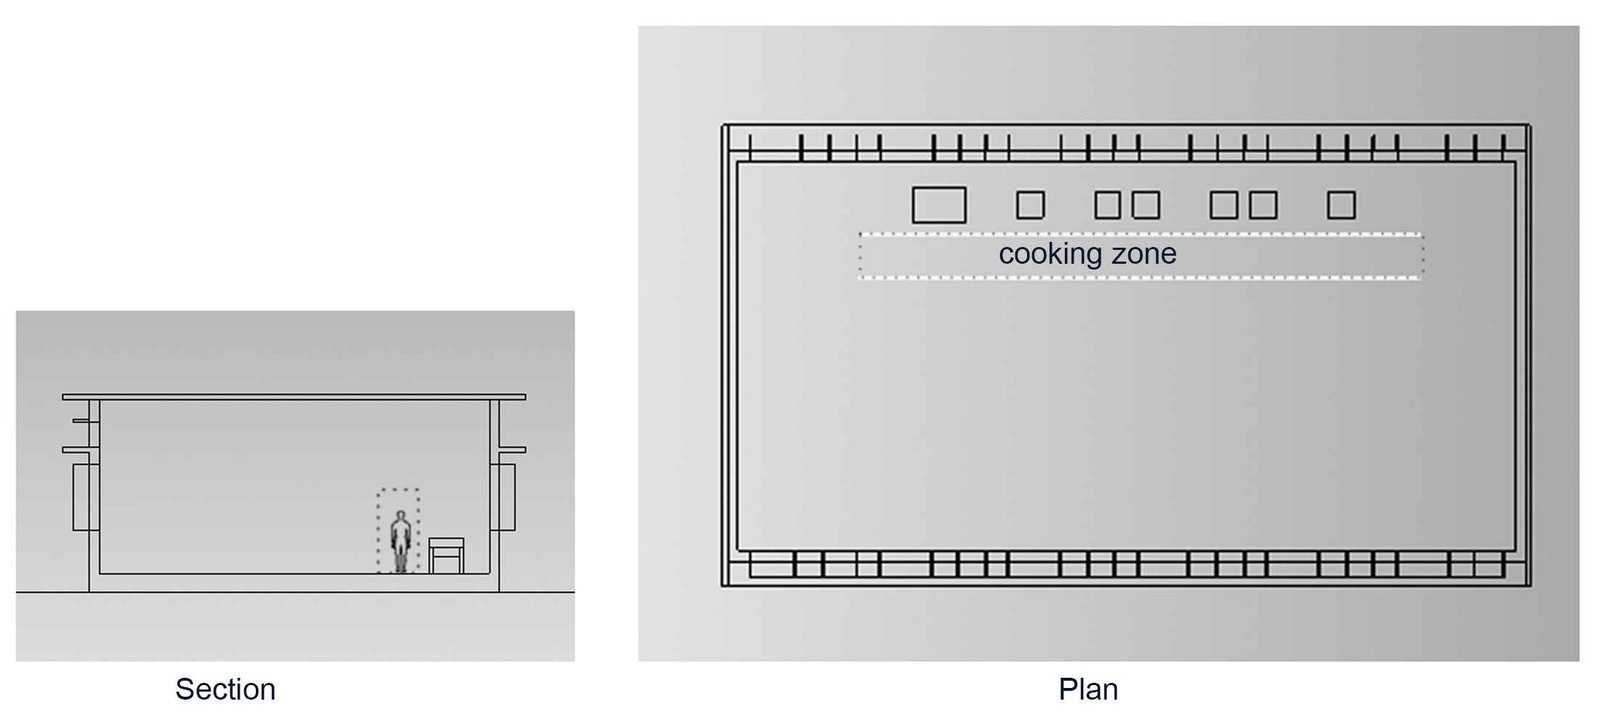
Fig. 9. Plan and section view of institutional kitchen showing the cooking zone.
Average air velocity, temperature, and age of air (at breathing height 1.6m) within the cooking zone are considered as primary output variables, while the age of air across the entire kitchen (MAA) is also evaluated to assess overall ventilation performance of the configuration model. Since this study simultaneously analyses ventilation performance and temperature distribution, a multivariate analysis approach, specifically principal component analysis (PCA), was employed to evaluate the combined effects of these four output variables. This will help to identify the best-performing cases with respect to all the variables considered.
2.5. Applicability and limitations of the framework
The proposed methodological framework can be extended to other kitchen typologies by modifying geometric dimensions, heat load characteristics, and opening configurations according to the specific design context. The structured workflow comprising experimental validation, CFD simulation, parametric evaluation, and PCA-based multivariate assessment enhances reproducibility and allows application to diverse natural ventilation scenarios. However, the present study assumes steady-state conditions and does not account for transient cooking loads or occupant movement, which may influence airflow patterns in real operational settings.
3. Results and discussion
3.1. Simulation results of air velocity, air temperature and age of air
The air velocity, temperature and age of air predicted by numerical simulation are plotted on horizontal and vertical planes and are shown in Figs 10-17.
Figure 10
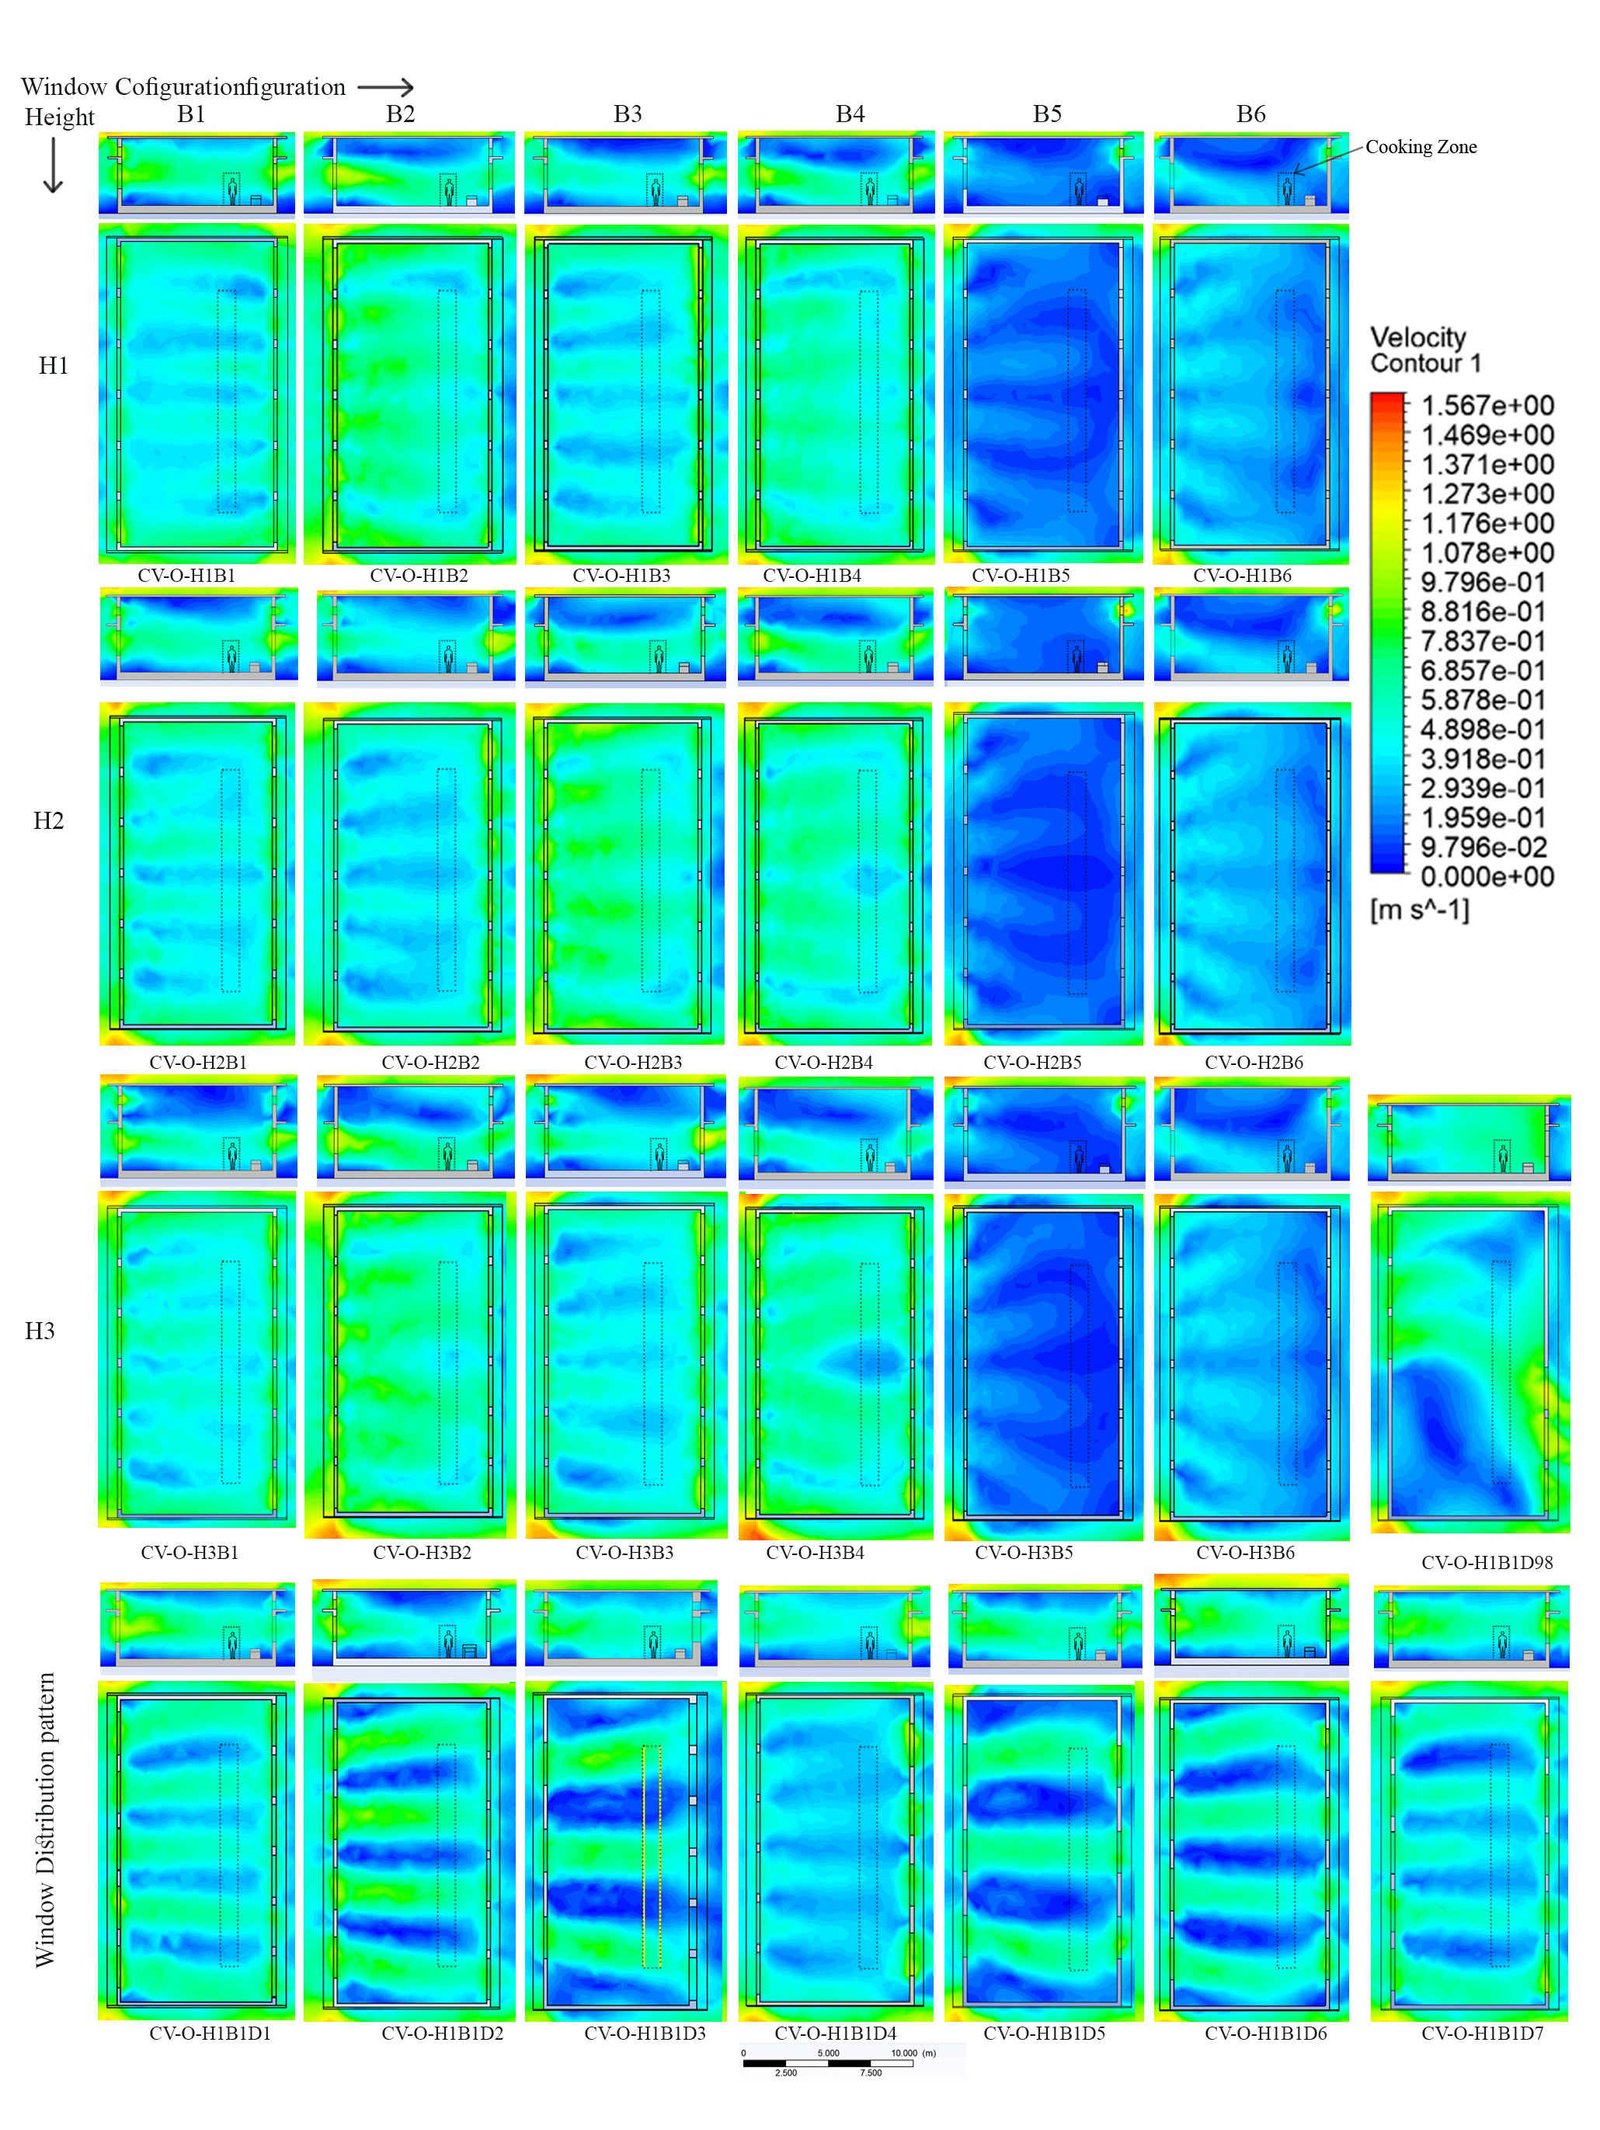
Fig. 10. Velocity contour plot for cases with Cross ventilation Pattern CV-O.
Figure 11
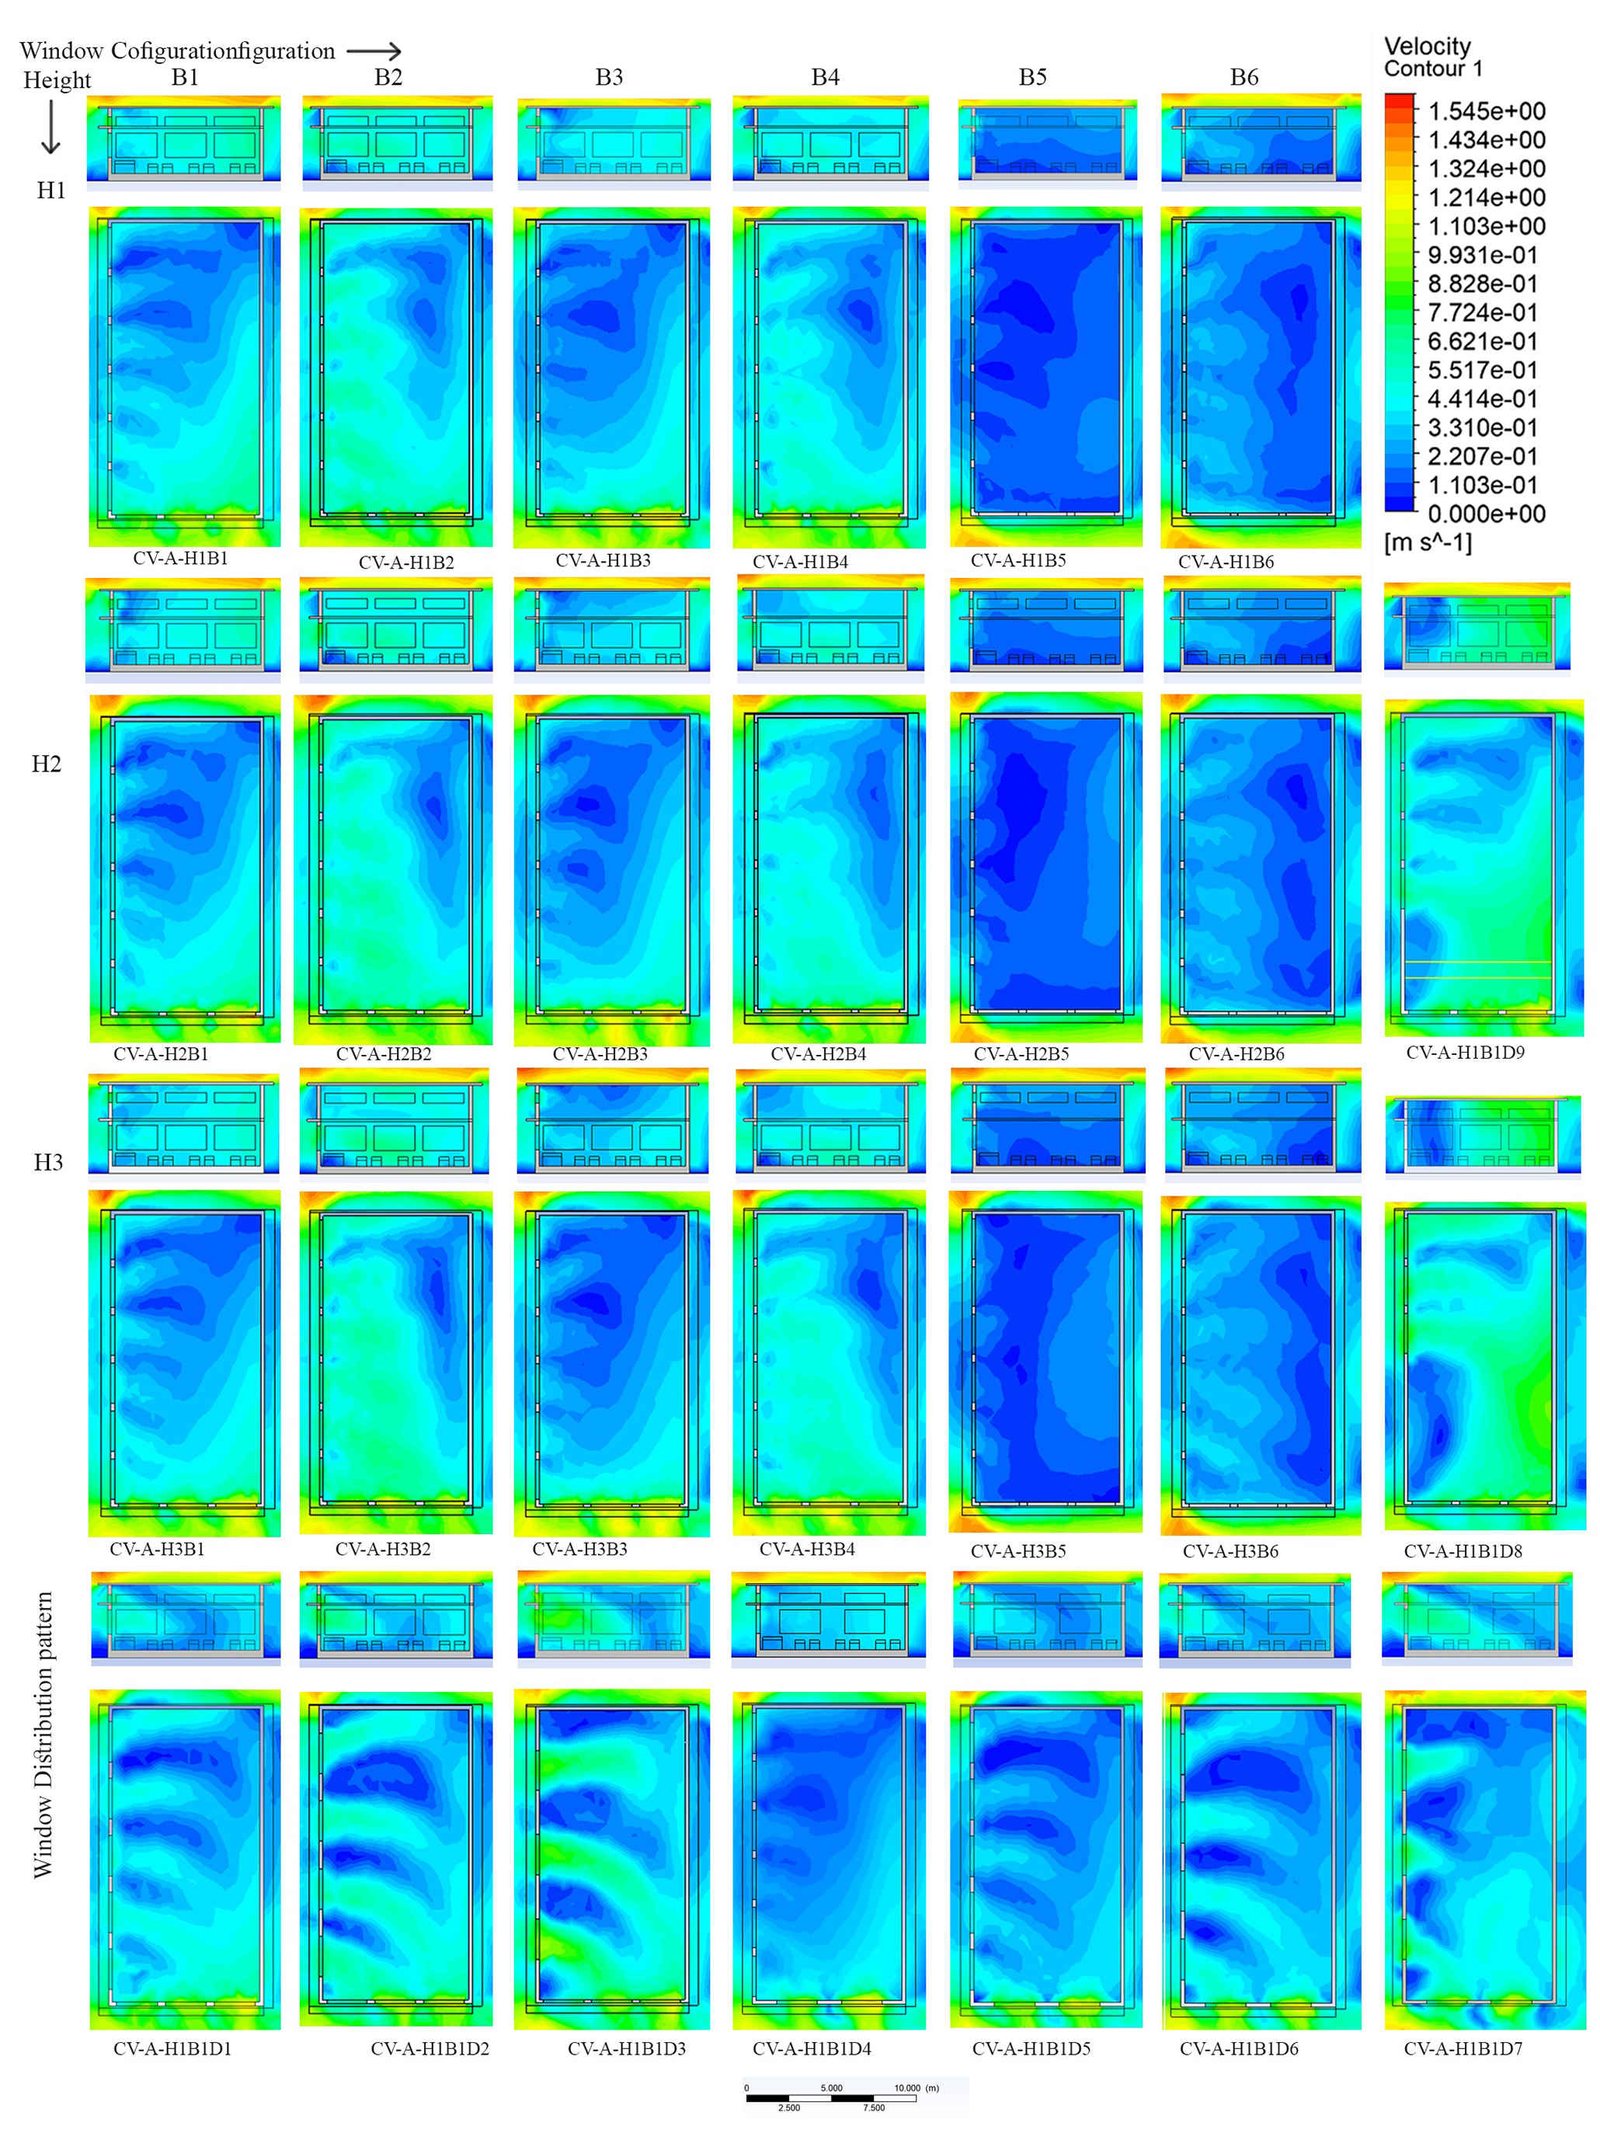
Fig. 11. Velocity contour plot for cases with Cross ventilation Pattern CV-A.
Figure 12
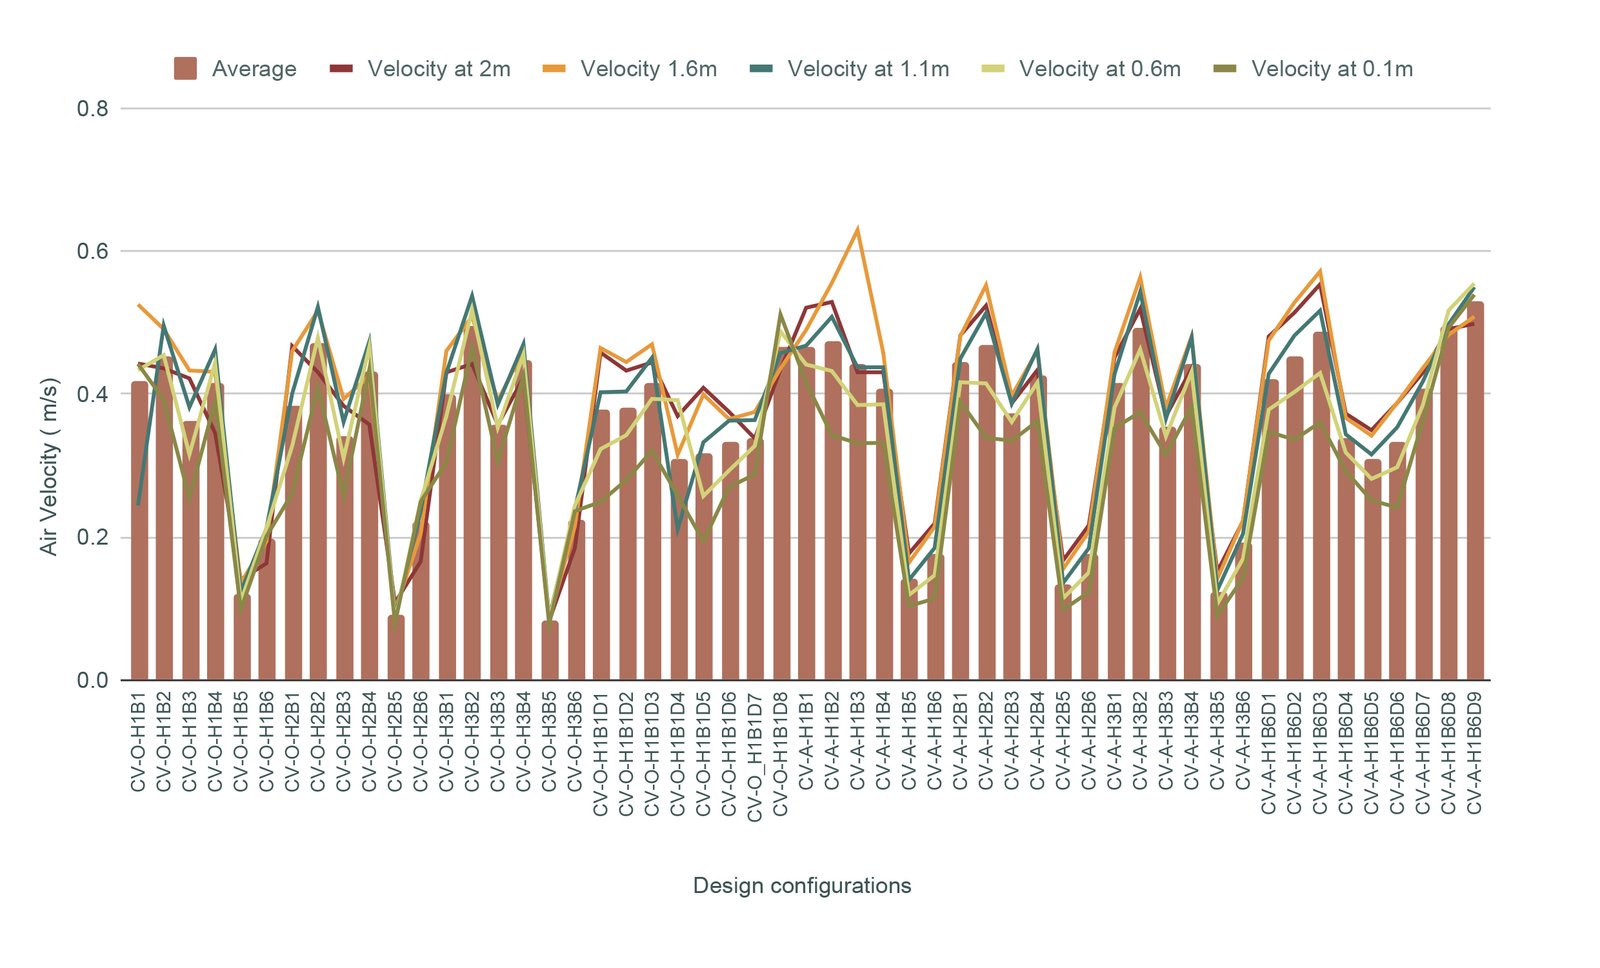
Fig. 12. Air velocity values at different heights within the cooking zone.
Figure 13
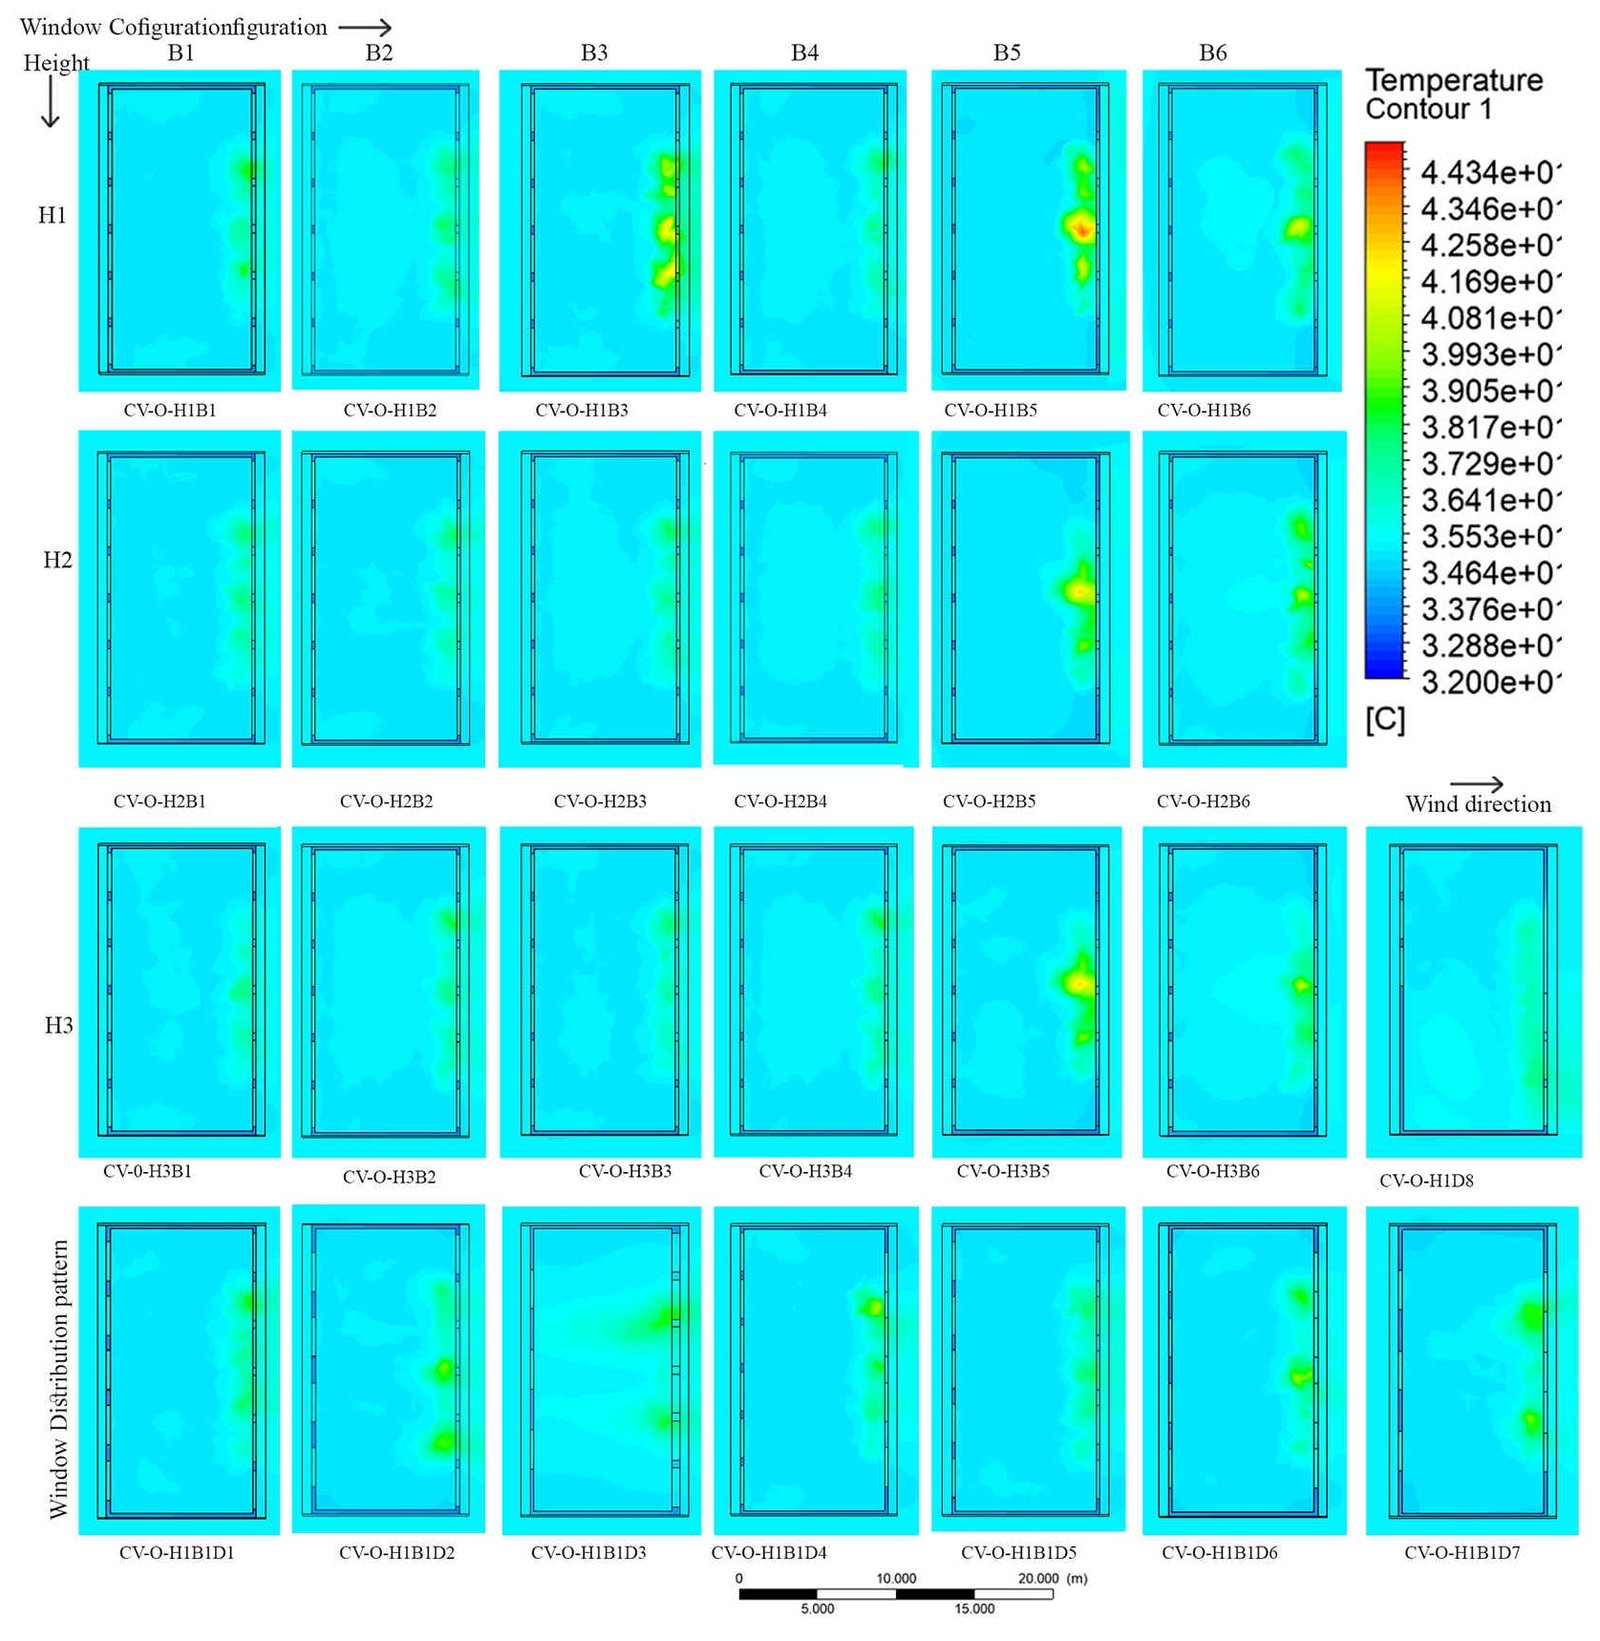
Fig. 13. Air Temperature contour plot for cases with Cross ventilation Pattern CV-O.
Figure 14
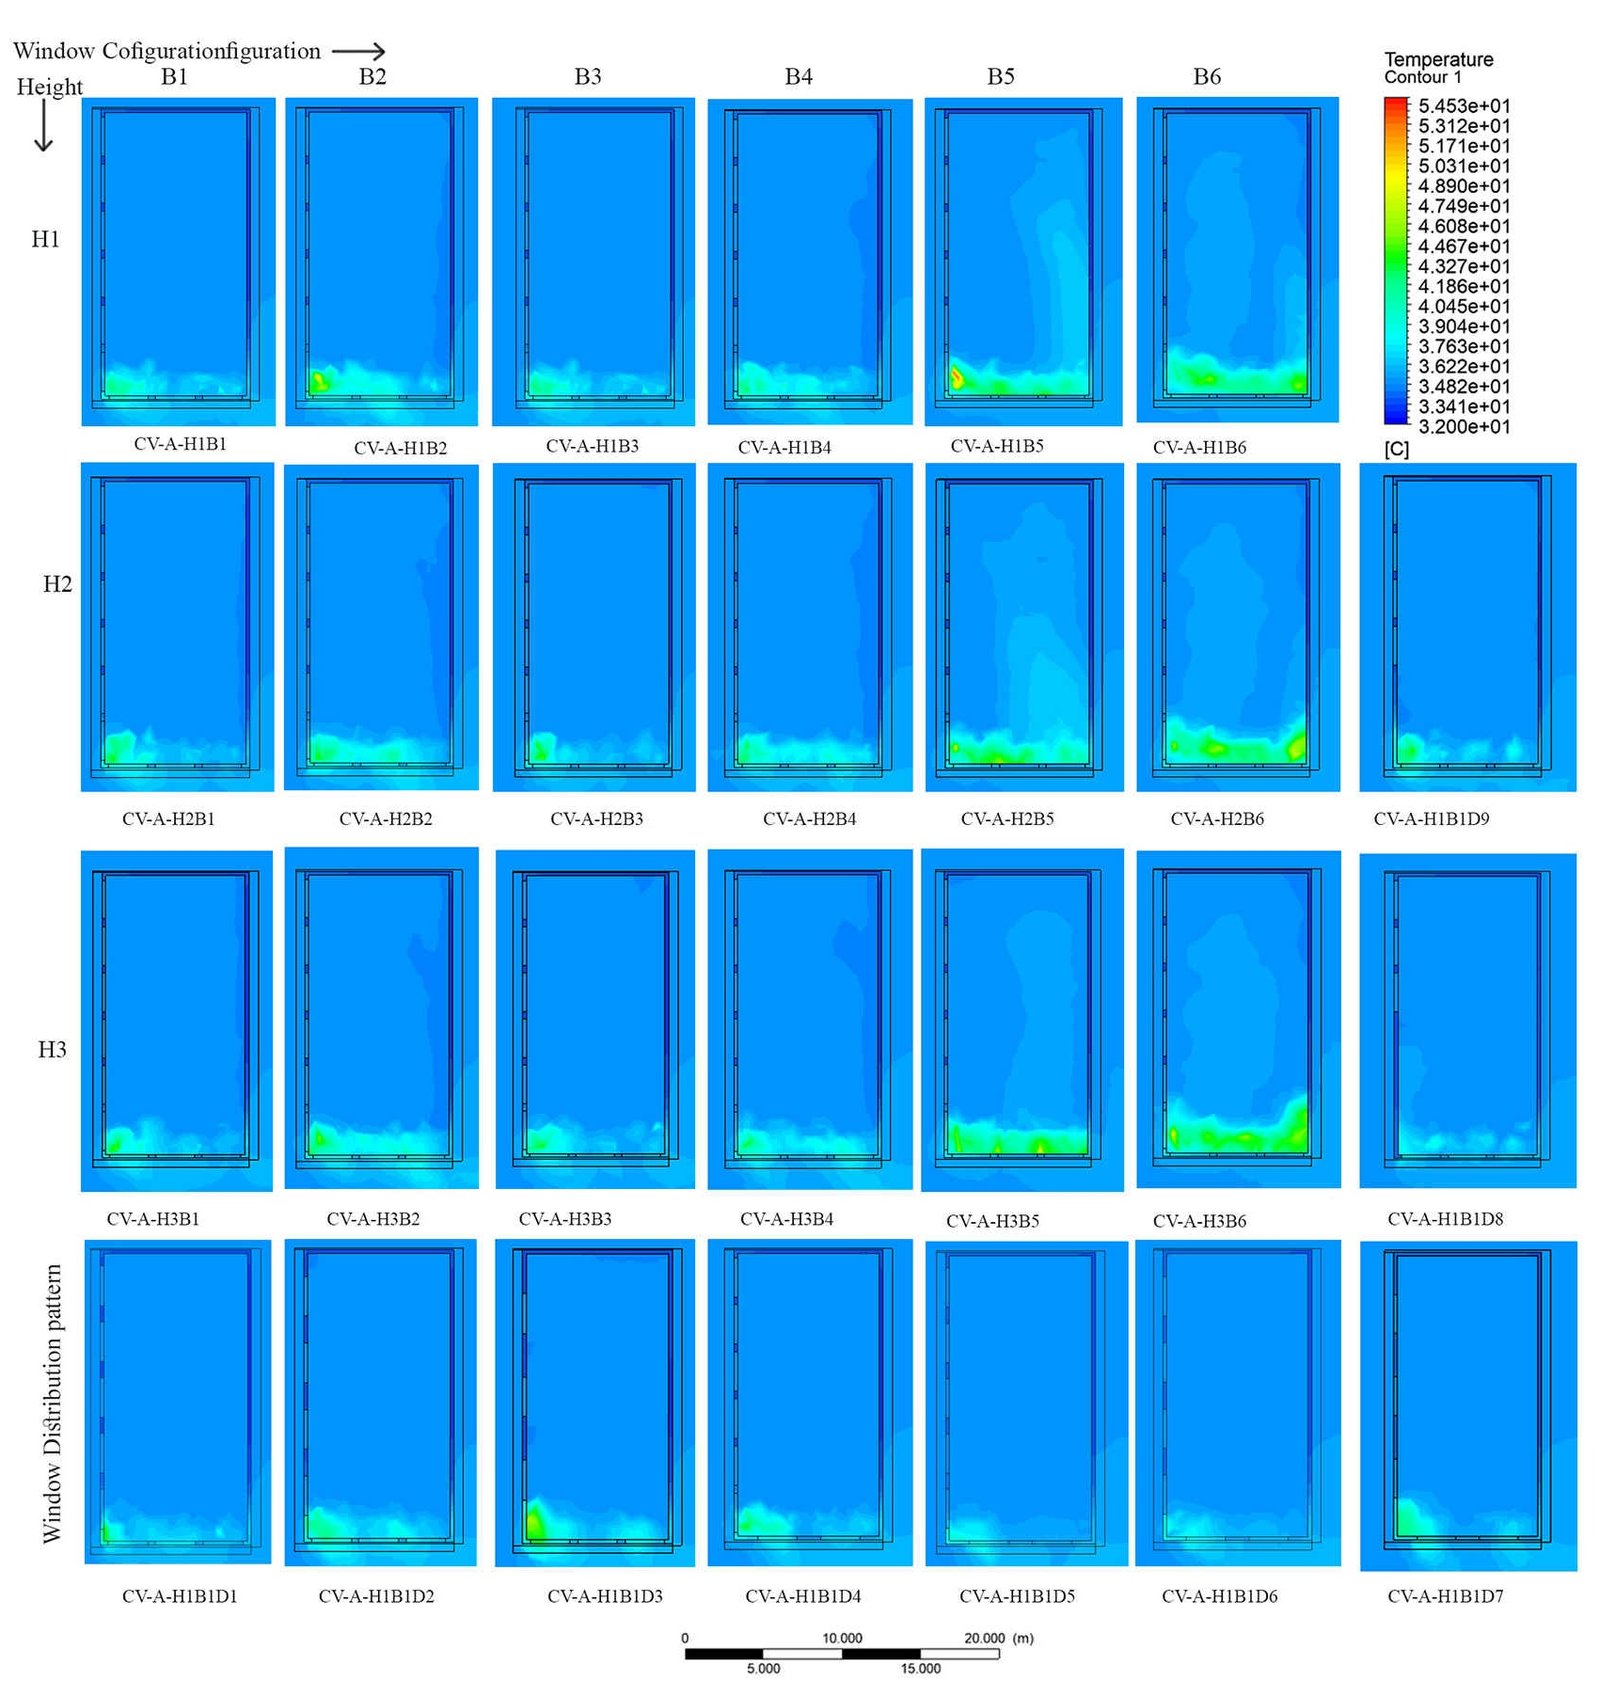
Fig. 14. Air Temperature contour plot for cases with Cross ventilation Pattern CV-A.
Figure 15
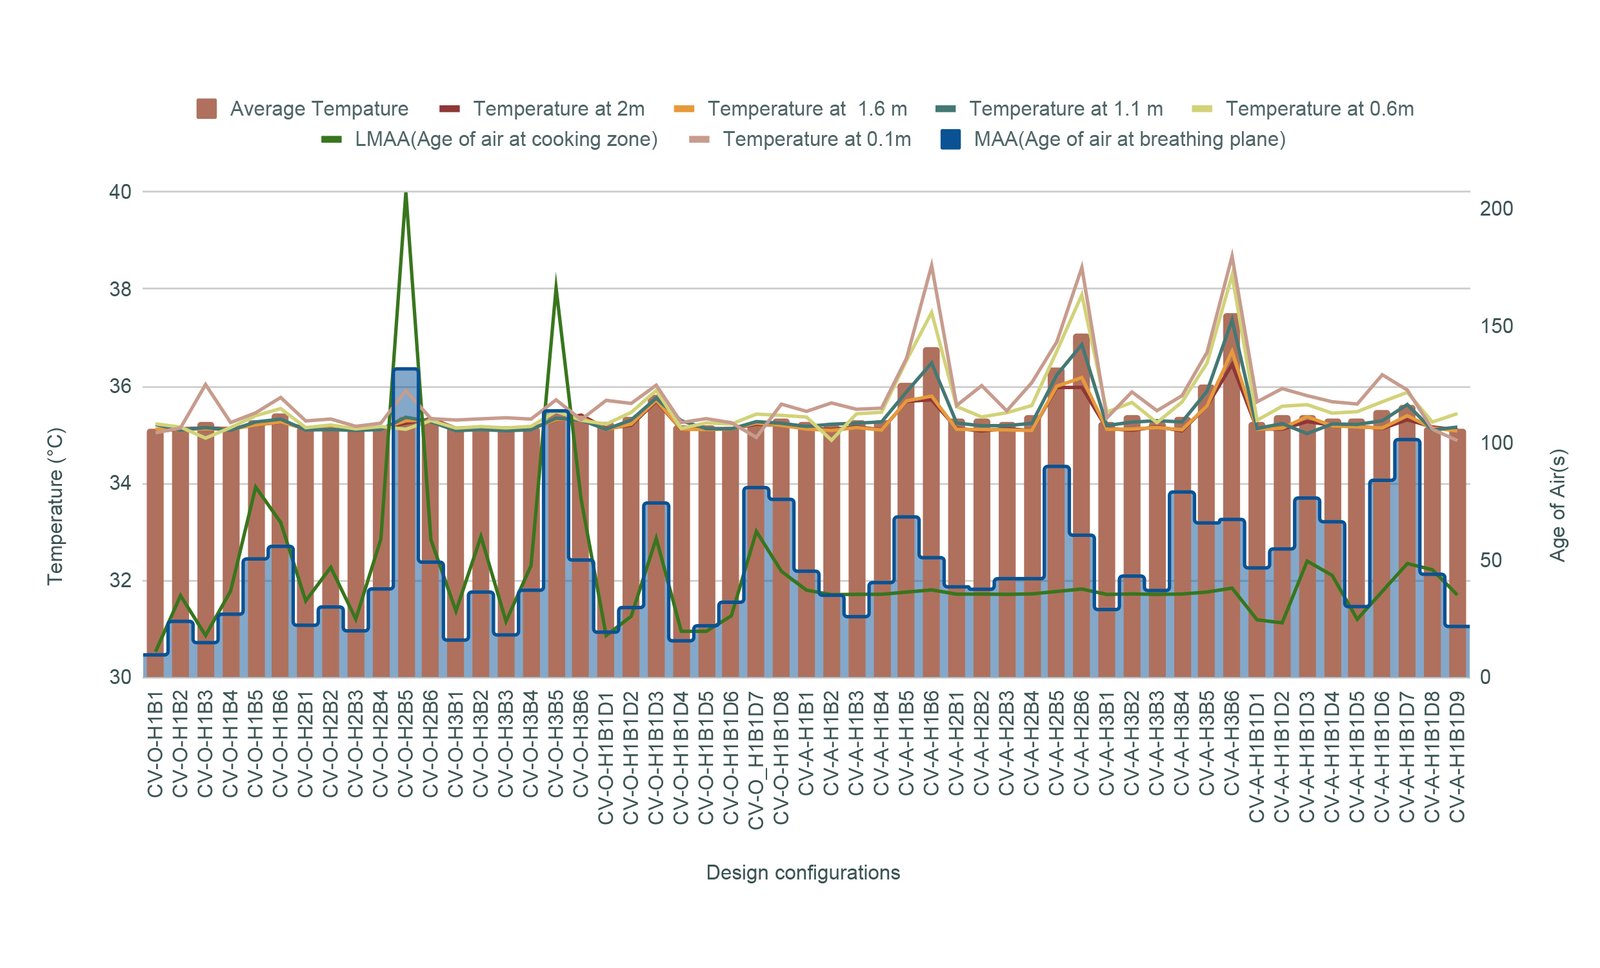
Fig. 15. Average Air temperature and Age of Air values at different heights within the cooking zone.
Figure 16
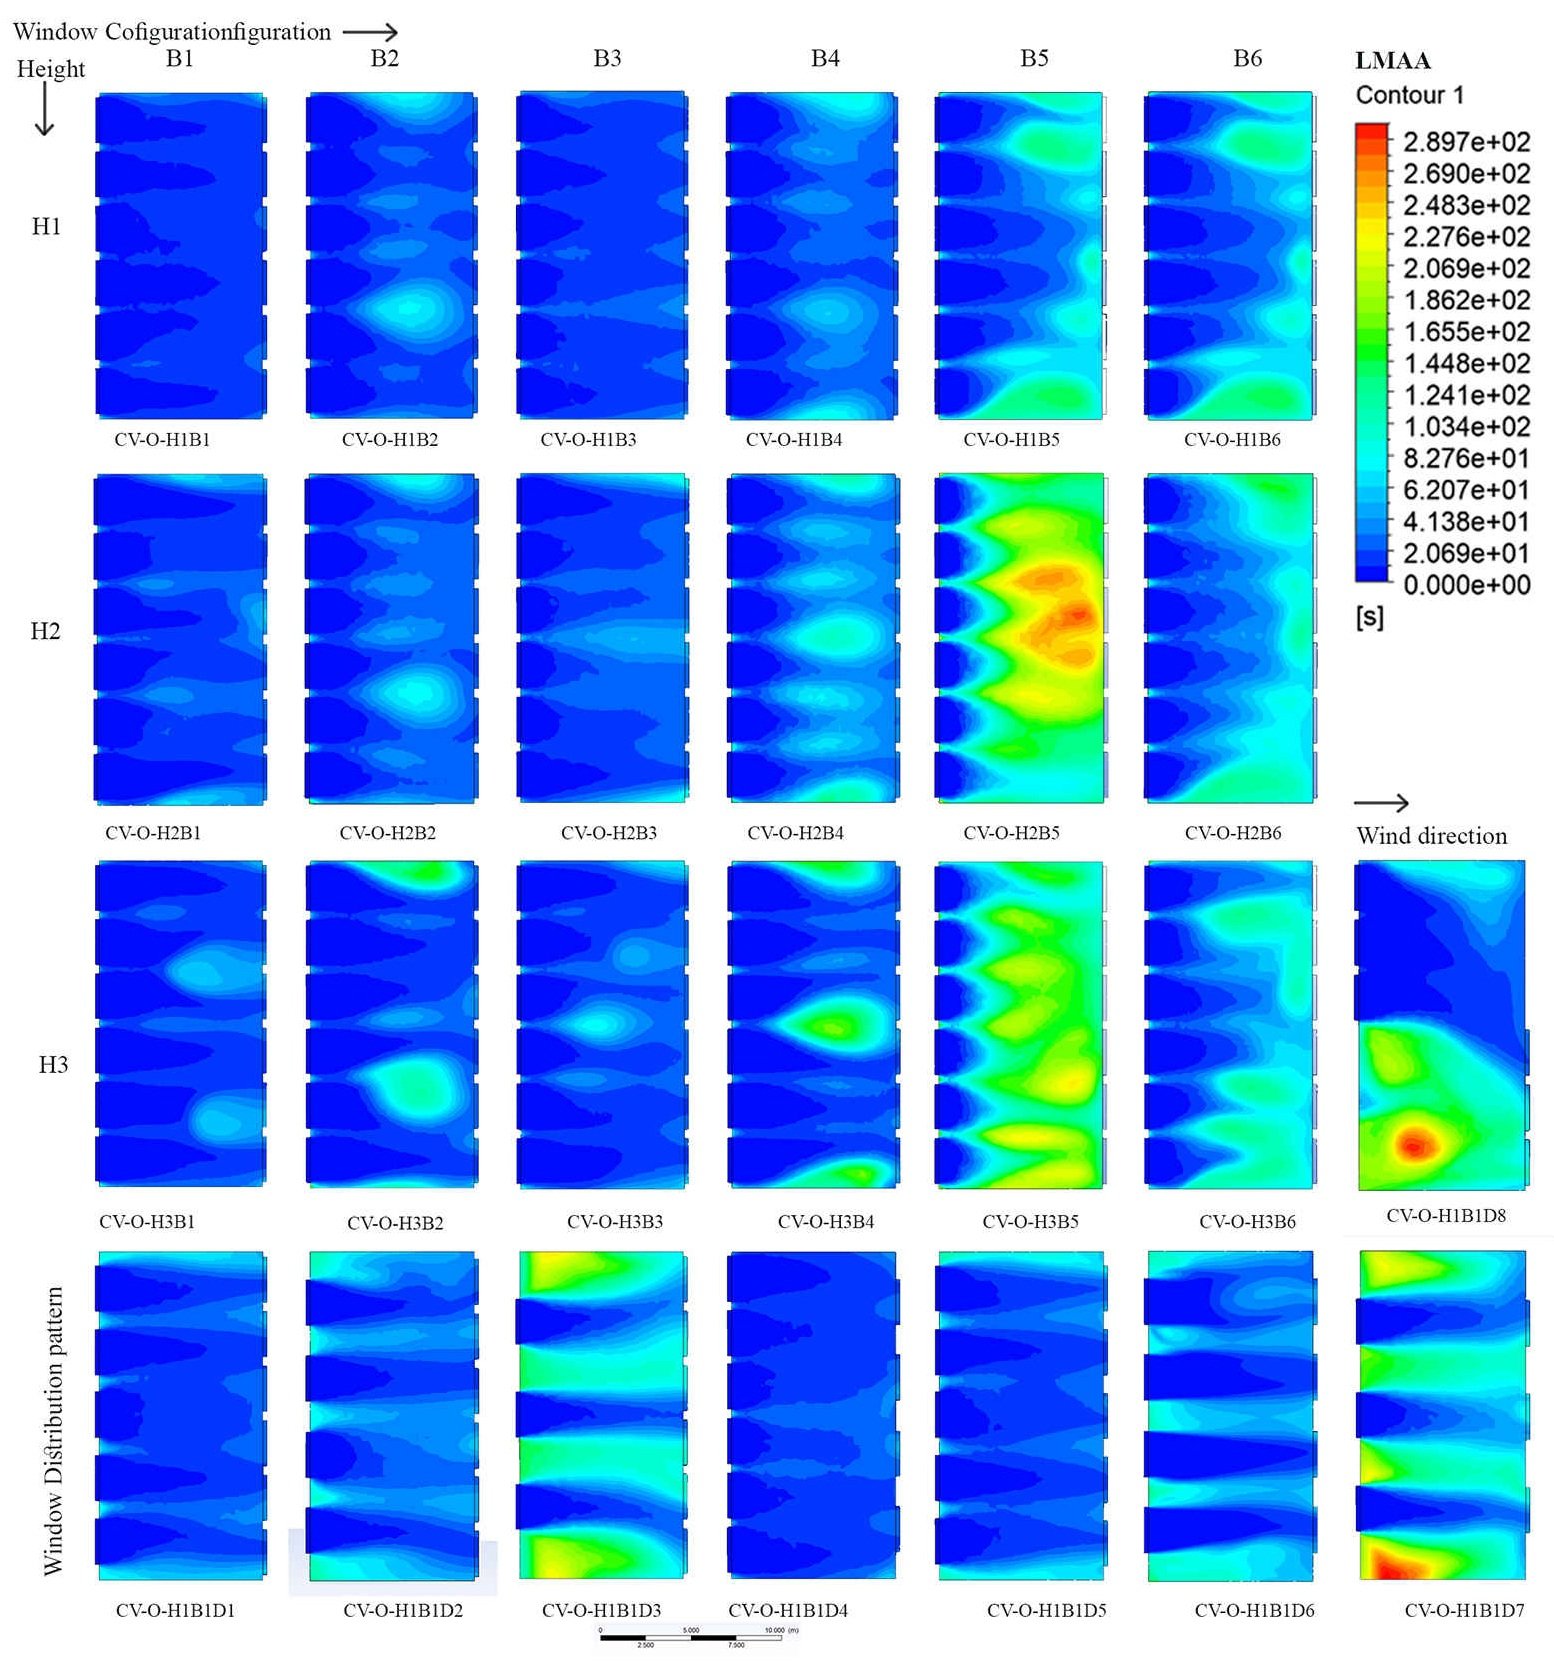
Fig. 16. LMAA contour plot for cases with Cross ventilation Pattern CV-O.
Figure 17
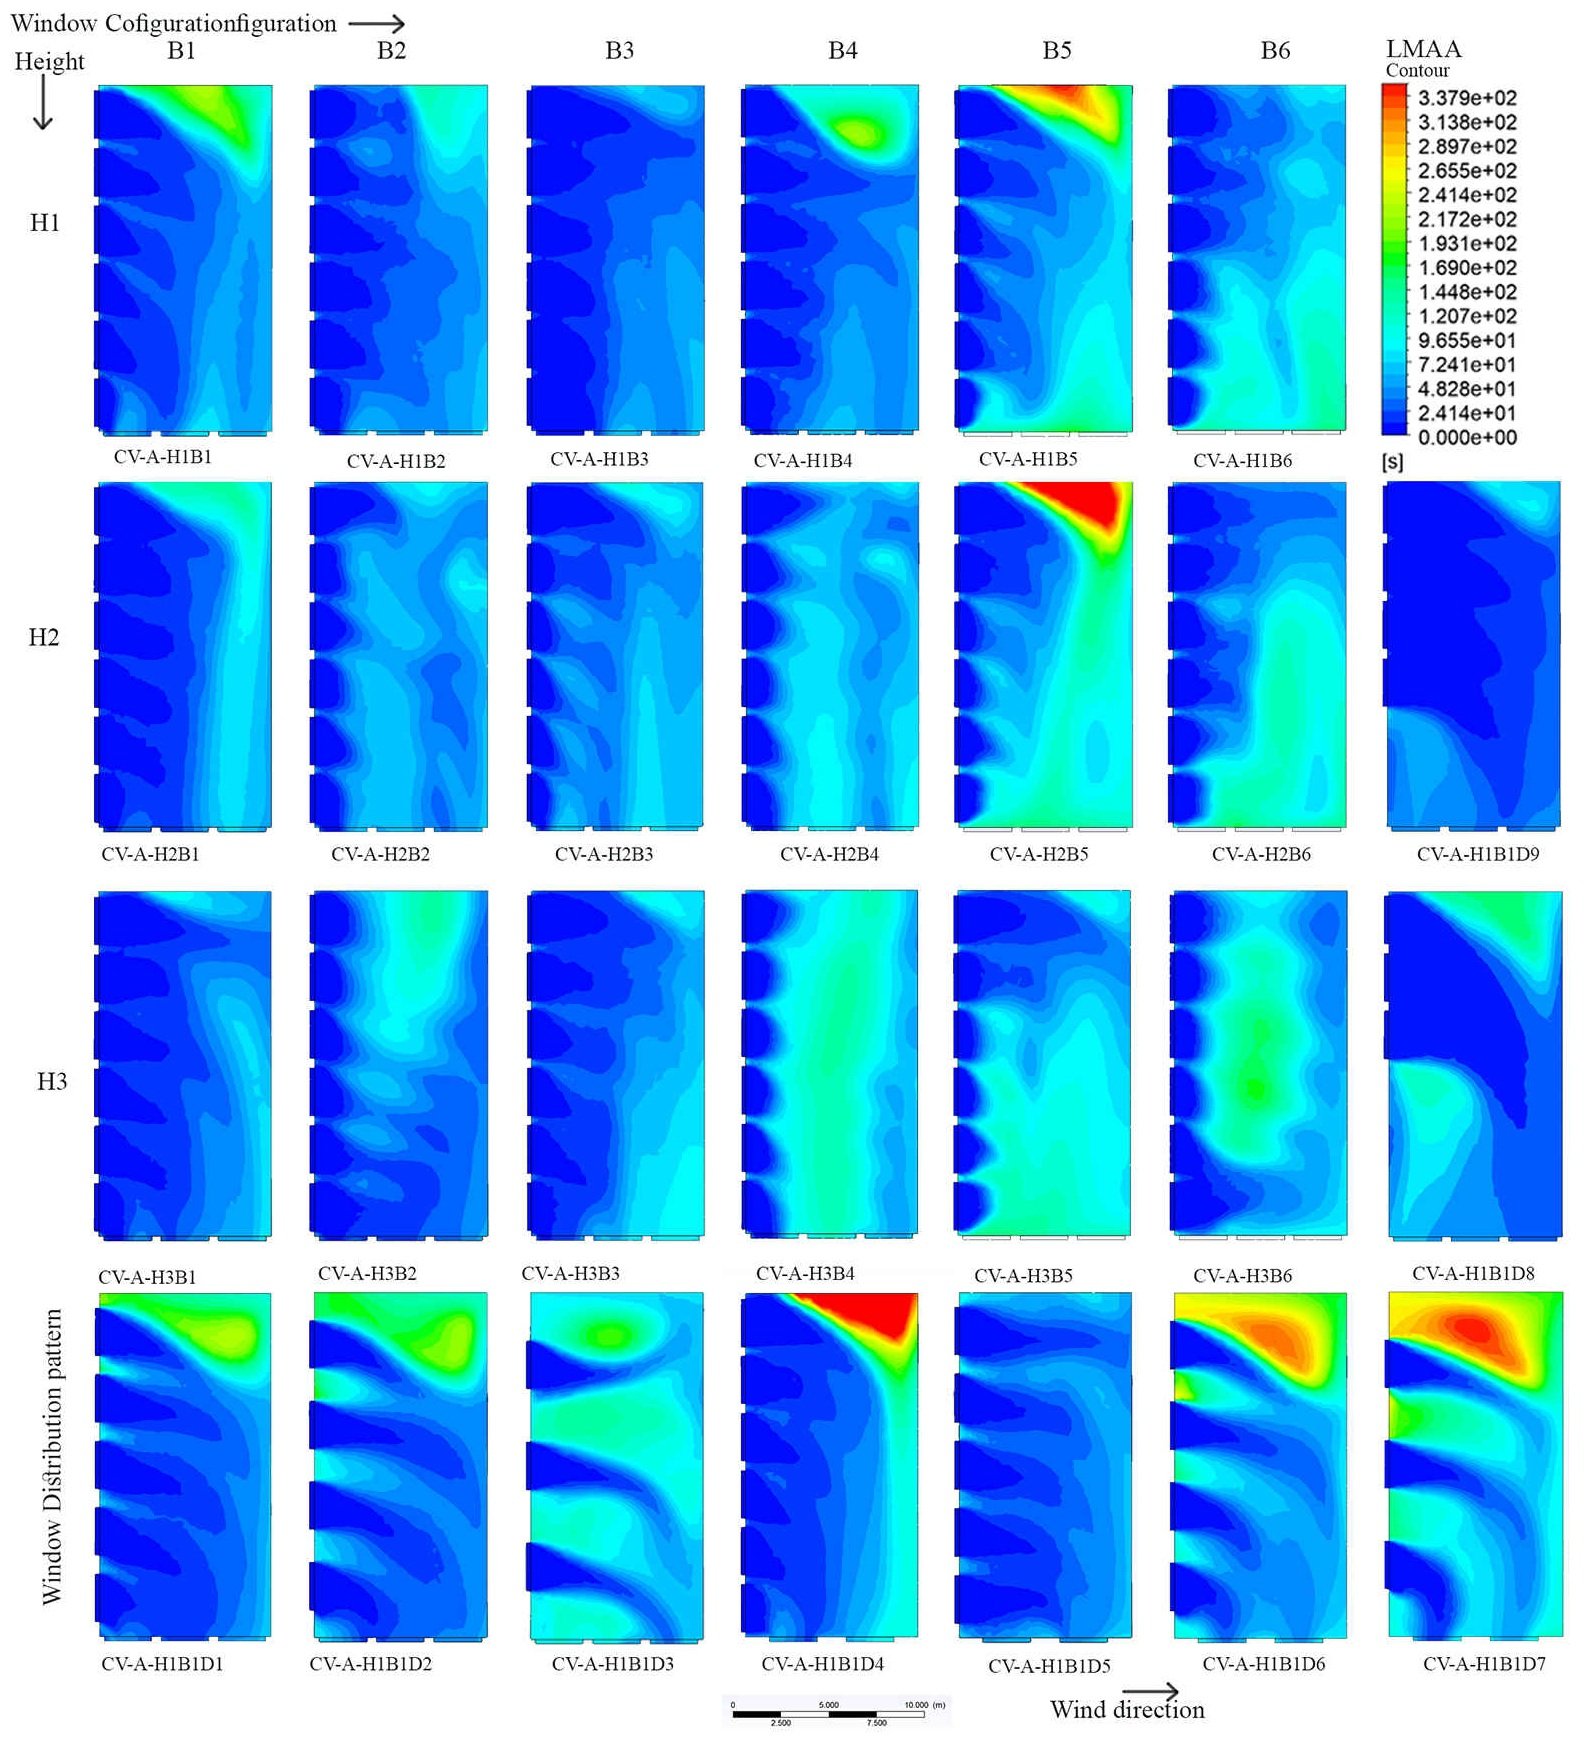
Fig. 17. LMAA contour plot for cases with Cross ventilation Pattern CV-A.
3.1.1. Air velocity
Air velocity contours were plotted on a horizontal plane at 1.1 m and a vertical plane at z = 7.5 m to evaluate the performance of each configuration, as shown in Fig. 10 and Fig. 11. Dark blue indicates regions of zero velocity magnitude, while red colour represents areas with the highest velocity (1.6 ). Fig. 10 illustrates the airflow under the opposite cross-ventilation pattern, whereas Fig. 11. shows the corresponding distribution for the adjacent cross-ventilation pattern.
Average air velocity at five heights, 0.1 m, 0.6 m, 1.1 m, 1.6 m, and 2 m, and total average velocity within the cooking zone was calculated from the simulation results and is illustrated in Fig. 12. The maximum average indoor air velocity of 0.58 m/s was recorded at the 1.1 m level for case CV-O-H3B2 for the considered outdoor air velocity of 1.67 m/s, while the minimum velocity of 0.086 m/s was observed at the same level for case CV-O-H3B5 (see Fig. 12). Figures 10 and 11 clearly show that case CV-O-H3B2 provides better airflow throughout the cooking zone, with an average velocity of 0.49 m/s, whereas CV-O-H3B5 exhibits the lowest airflow in that region, that is, 0.08 m/s. When the room height increases from 4 m to 5 m, a low-pressure zone tends to develop above the lintel level, which significantly influences the wind velocity within the cooking zone. This effect is evident in cases where ventilators are absent or present on only one side (see Fig. 10 and Fig. 11).
In the cooking zone, configuration B2, with only windows on the windward side, directs airflow more effectively than B1, which has both windows and ventilators. Similarly, B4 provides better airflow in the cooking zone than B3 and B1, despite having fewer openings. Among all configurations, B5 exhibits the poorest airflow across all heights and cross-ventilation patterns, whereas B6, with the same leeward openings but fewer windward openings than B5, still demonstrates better airflow performance than B5, highlighting the importance of window placement and window-ventilator configuration for optimal ventilation.
3.1.2. Air temperature
Air temperature contours were plotted on a horizontal plane at a height of 1.1 m for all cases, are shown in Fig. 13 and Fig. 14. These figures illustrate the temperature distribution within space, with particular focus on how heat from the burners spread into the cooking zone. Dark blue refers to a minimum temperature of 32 , and the red colour illustrates the highest temperature. The average temperatures at different heights in the cooking zone are plotted in Fig. 15.
The maximum average temperature in the cooking zone was observed for case CV-A-H3B6, while the minimum was observed for case CV-O-H1B2, as shown in Fig. 15. Similarly, when evaluating temperature specifically at the 1.1 m level, case CV-A-H3B6 exhibited the highest temperature in the cooking zone, whereas the lowest temperature at this level was observed for case CV-A-H1B6D3, as illustrated in Fig. 13 and Fig. 14.
The maximum vertical air temperature difference of 2.21 in the cooking zone, measured between 0.1 m and 1.6 m, was observed in configuration CV-A-H3B6 (Fig. 15).
As shown in Fig. 13 and Fig. 14, the temperature in the cooking zone remains close to the inlet air temperature (35.2 ) with minimal fluctuations. In configurations with restricted ventilation, however, greater heat dispersion from the burners results in noticeable temperature deviations. Overall, Figs. 10, 11, 13, and 14 indicate that effective airflow in the cooking zone is essential for maintaining temperatures near the inlet level and preventing heat accumulation or transfer to adjacent areas. Between the two cross-ventilation modes, the second mode (CV-A) exhibits a more uniform temperature distribution than CV-O.
3.1.3. Local mean age of air (LMAA)
LMAA contours were plotted on a horizontal plane at a height of 1.6 m, representing the typical breathing height of occupants, as shown in Fig. 16 and Fig. 17 for opposite and adjacent cross-ventilation patterns, respectively. Dark blue refers to a zero LMAA and indicates good air flow and more fresh air. The red colour indicates high LMAA, where stale air persists for longer periods before being replaced by fresh air. A greater flow of fresh air into space results in a lower age of air, thereby improving the ACH. Compared to the case study kitchen with single-sided ventilation, all other configurations considered in this study exhibit improved ACH and enhanced ventilation performance. The MAA, calculated as the area-averaged LMAA at the breathing plane across the entire kitchen, along with the LMAA in the cooking zone, is presented in Fig. 15.
The highest MAA at the breathing plane was observed for case CV-A-H1B5 (207.1 seconds), while the lowest was recorded for case CV-A-H1B1 (10.9 seconds). A similar pattern was observed in the cooking zone, where the same configurations exhibited the highest and lowest LMAA values, respectively.
3.2. Evaluation of ventilation performance and thermal environment
The results of air velocity, temperature, and age of air for each configuration were analysed to understand individual performance trends. An efficient kitchen design should ensure effective natural ventilation and temperature distribution; hence, assessing overall performance is essential. Principal Component Analysis (PCA) was employed to combine key output variables, including air velocity, temperature, and age of air at the cooking zone, as well as the mean age of air at the breathing plane, into a single composite performance index for evaluating overall performance.
As a first step, PCA was applied to reduce dimensionality and identify underlying performance patterns. PCA was conducted using the correlation matrix, ensuring that all variables were standardised (Z-score transformed) prior to analysis. The first principal component (PC1) is determined for the greatest variance among the variables. The component loadings (PC1) obtained from PCA were then used as weights to construct a linear equation for calculating the PC1 score for each case. This score was computed by multiplying each standardised variable by its corresponding PC1 loading, and the equation is shown below.
The first principal component (PC1) accounts for 57.63% of the total variance, indicating that it captures the dominant ventilation performance trend among the evaluated configurations. Temperature and age of air contribute positively to PC1, whereas air velocity exhibits a negative contribution, demonstrating an inverse association between airflow and thermal accumulation and age of air. This relationship is consistent with established ventilation behaviour, where increased airflow promotes heat dissipation and improved air renewal. Therefore, lower PC1 scores indicate enhanced ventilation effectiveness and improved indoor environmental performance.
Figure 18 presents the PC1 scores for all configurations, where a lower score indicates better ventilation performance (i.e., higher air velocity, lower temperature, and lower age of air). Based on the PC1 scores, the 53 simulation cases were ranked in ascending order, with rank 1 representing the best performance. Cases were further categorized as best, average, or poor using a ±0.5 standard deviation threshold (SD = 2.3) from the mean PC1 score. This data-driven classification provides a balanced evaluation compared to single-metric methods such as AEE or ACH, as it integrates airflow, temperature, and air freshness into a unified performance index. Among the 53 cases, 24 were identified as best performing, 14 as average, and 15 as poor. The configuration CV-O-H1B1 achieved the highest performance (rank 1), while CV-O-H2B5 ranked lowest (rank 53).
Figure 18
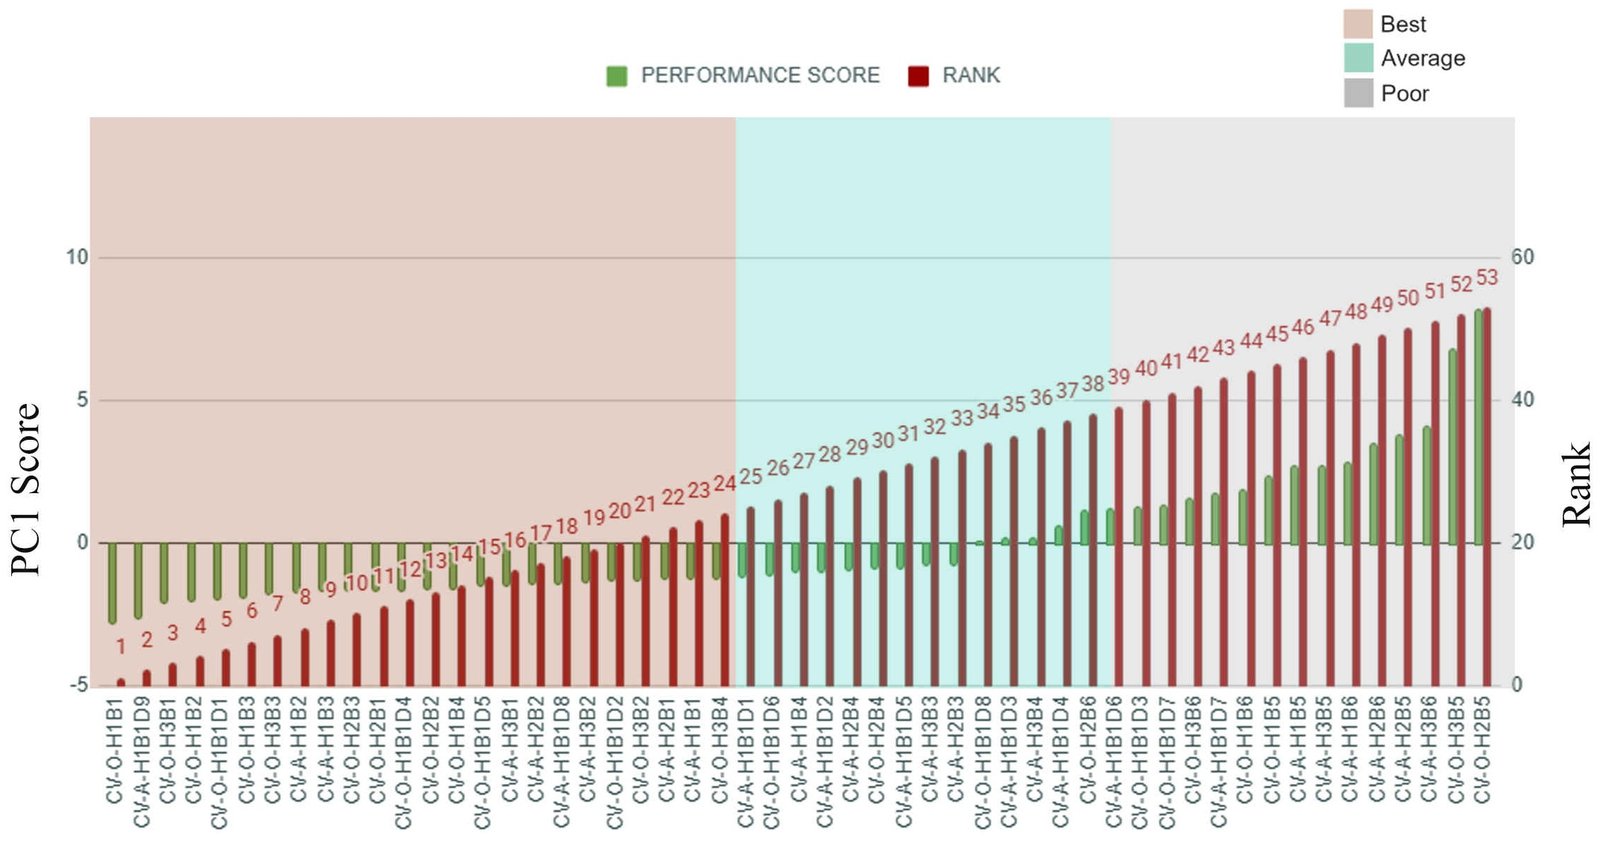
Fig. 18. PC1 scores, performance groups, and ranks of all configurations.
Table 7 presents the mean, standard deviation, maximum, and minimum values of air velocity, temperature, and age of air for each performance group. The best-performing group shows the highest velocity (0.424 m/s ± 0.06), the lowest temperature(35.29°C), and the lowest air age (27.59 s), indicating efficient airflow and rapid ventilation. The average-performing group exhibits slightly lower velocity (0.39 m/s ± 0.073), a small increase in temperature (35.31°C), and higher air age (50.76 s), suggesting reduced mixing. The poor-performing group has the lowest velocity (0.21 m/s ± 0.11), highest temperature (35.9°C), and longest air age (76.4 s), reflecting stagnation and insufficient ventilation. Overall, higher air flow clearly improves both thermal control and air freshness in the kitchen. Table 8 presents the classification of all configurations into best-, average-, and poor-performing groups based on their PC1 scores.
Table 7
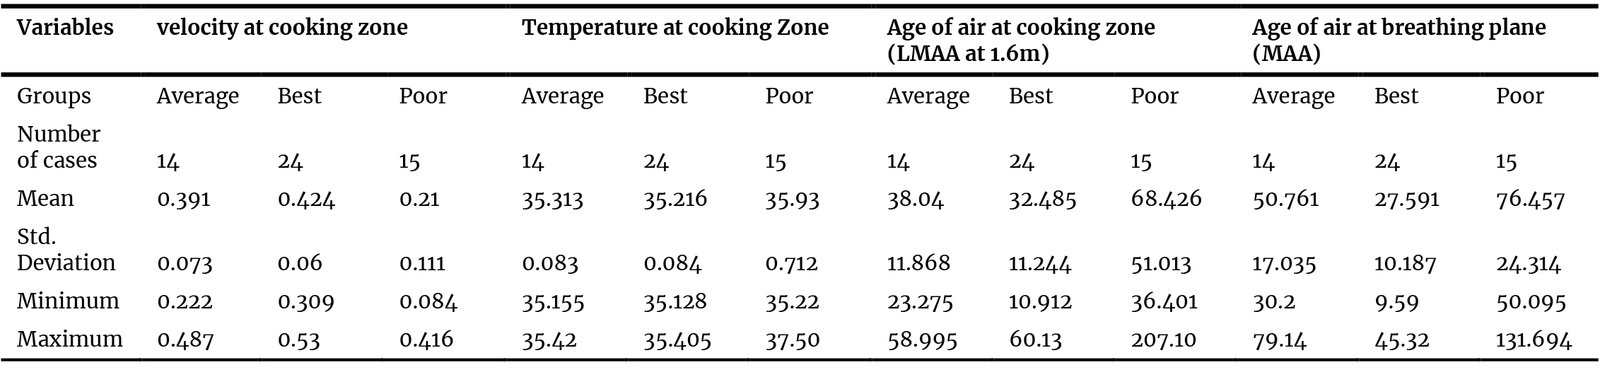
Table 7. Mean, standard deviation, maximum and minimum value for air velocity, air temperature and age of air for each performance group.
Table 8
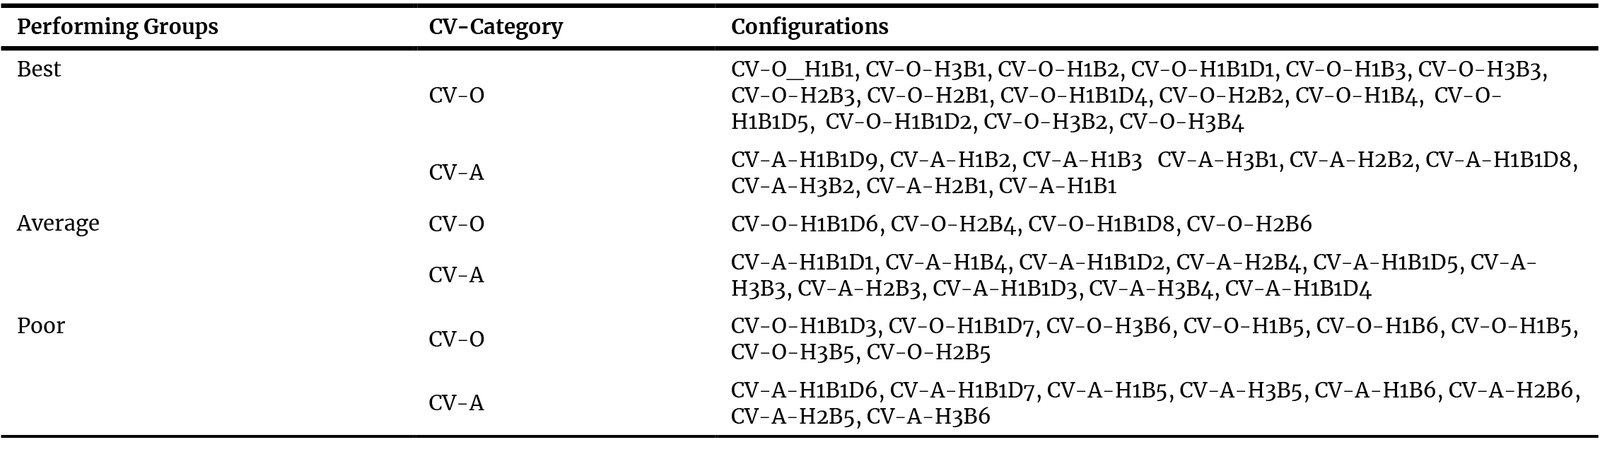
Table 8. Performance Classification of Configurations Based on PC1 Values.
The next step of the study investigates the effect of design variables, including building height and window configuration, on the PC1 score. The authors also examined how the window-to-floor ratio (WFR) and the window-to-wall ratios (WWR) on the windward and leeward sides relate to the PC1 score.
3.2.1. Effects of height and window configuration on PC1 score
The PC1 score was analysed based on the height of the built space for each window configuration, as shown in Fig. 19. Among the 36 cases (varying height), 18 belong to the cross-ventilation category ‘O’ and the remaining 18 to the second category ‘A’, as shown in Fig. 19.
Figure 19
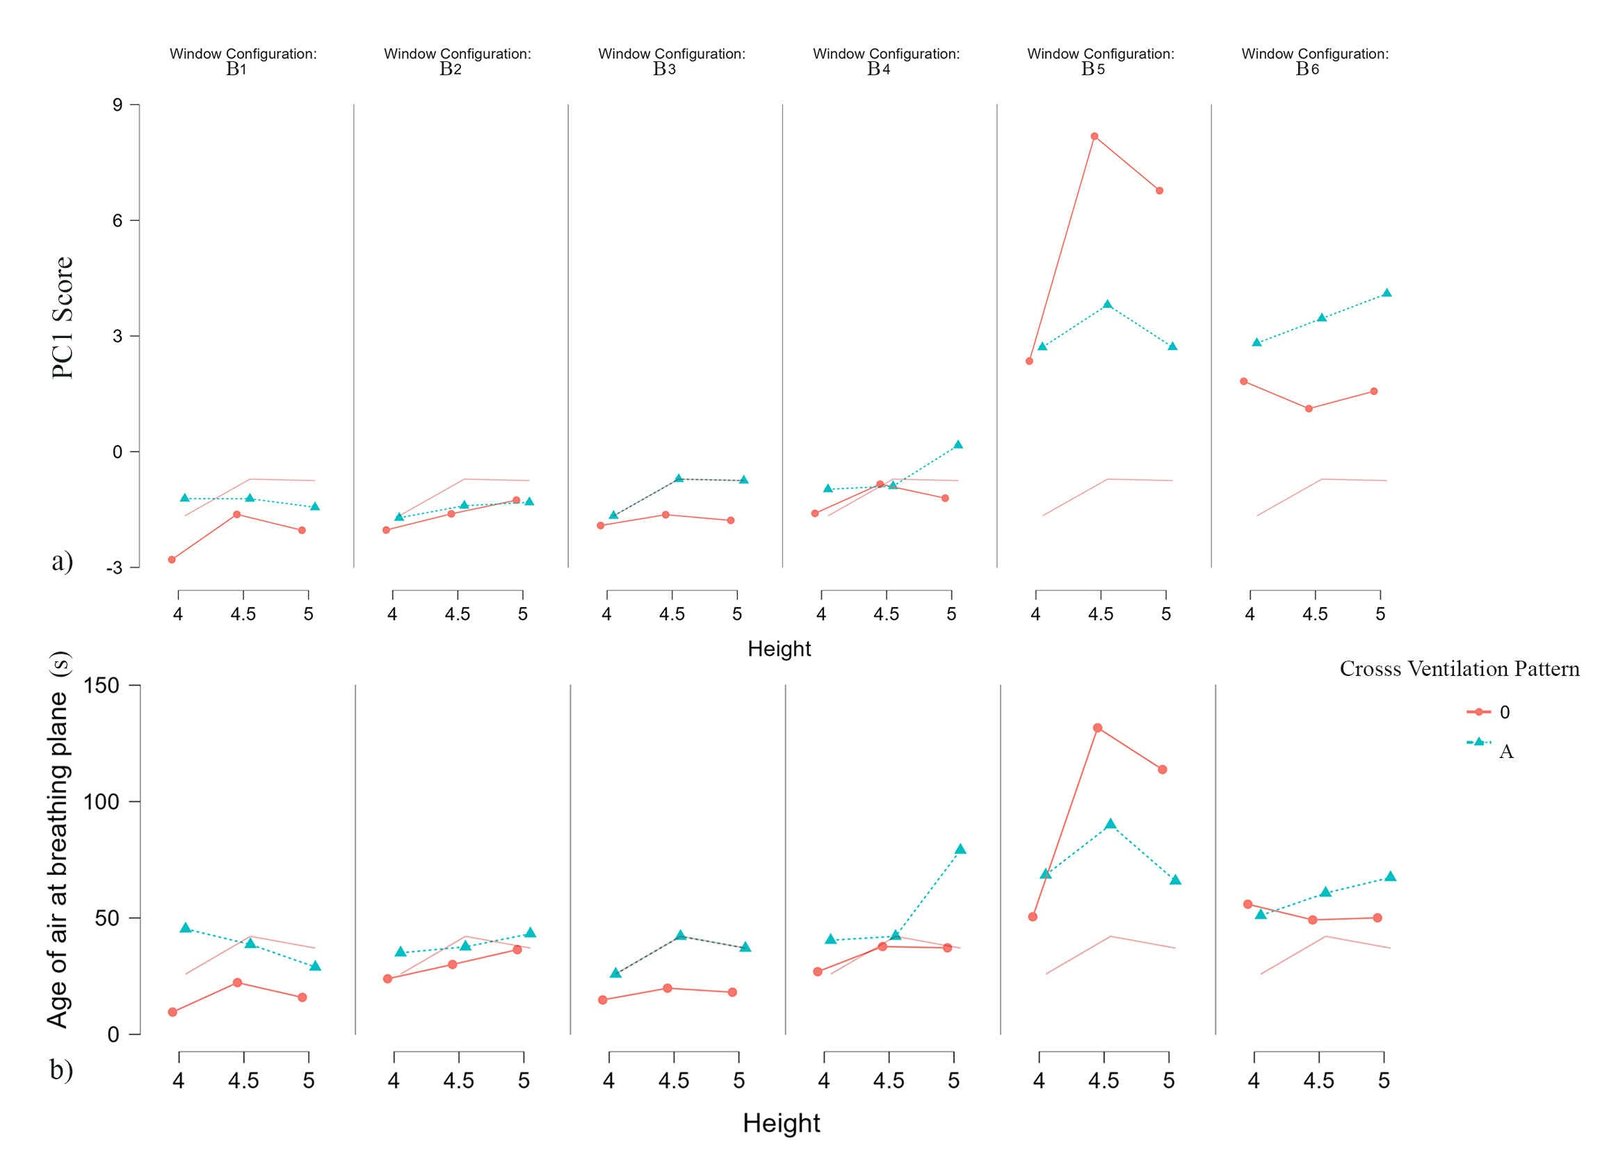
Fig. 19. (a) The effect of the height of the room on PC1 score. (b) The effect of the height of the room on the age of air at the breathing plane (MAA)for different window configurations.
Among all window configuration categories, except for CV-O-B6, configurations with a height of 4 m consistently demonstrate better performance. As the height increases to 4.5 m and 5 m, PC1 scores generally rise, indicating reduced performance, although the relative trend between 4.5 m and 5 m varies across configurations. Since window size and external wind conditions remain constant, the airflow rate does not increase with height. Consequently, the same quantity of fresh air must ventilate a larger volume, increase the age of air and reduce overall efficiency.
In most configurations, the performance trend follows H1 > H3 > H2, confirming that the 4 m height provides the most effective airflow distribution within the occupied zone.
The compact volume at this height allows the ceiling to redirect airflow toward the breathing zone and limits the formation of stagnant upper air layers. The marginal improvement observed at 5 m compared to 4.5 m may be attributed to changes in airflow distribution associated with increased vertical clearance.
However, the influence of height is also affected by outlet positioning. In configurations B2 and B6, where the outlet is positioned at a higher level, and airflow is directed upward, the height-performance relationship differs. In B2, performance declines progressively with increasing height (H1 > H2 > H3), while in B6, moderate additional clearance at 4.5 m improves upward exhaust flow before declining again at 5 m (H2 > H3 > H1). These variations indicate that the impact of height depends on vertical opening alignment and airflow path characteristics.
Additionally, the MAA of each configuration was analysed in relation to the height of the built space, and it followed the same pattern as the PC1 score (Fig. 19), further confirming that increasing ceiling height alone does not guarantee improved ventilation performance within the occupied space.
3.2.2. Effects of window opening percentage on PC1 score
All configurations were analysed for their window opening area relative to the PC1 score. As the floor area remained constant across cases, comparisons were first made using the window-to-floor ratio (WFR) (Fig. 20).
Figure 20
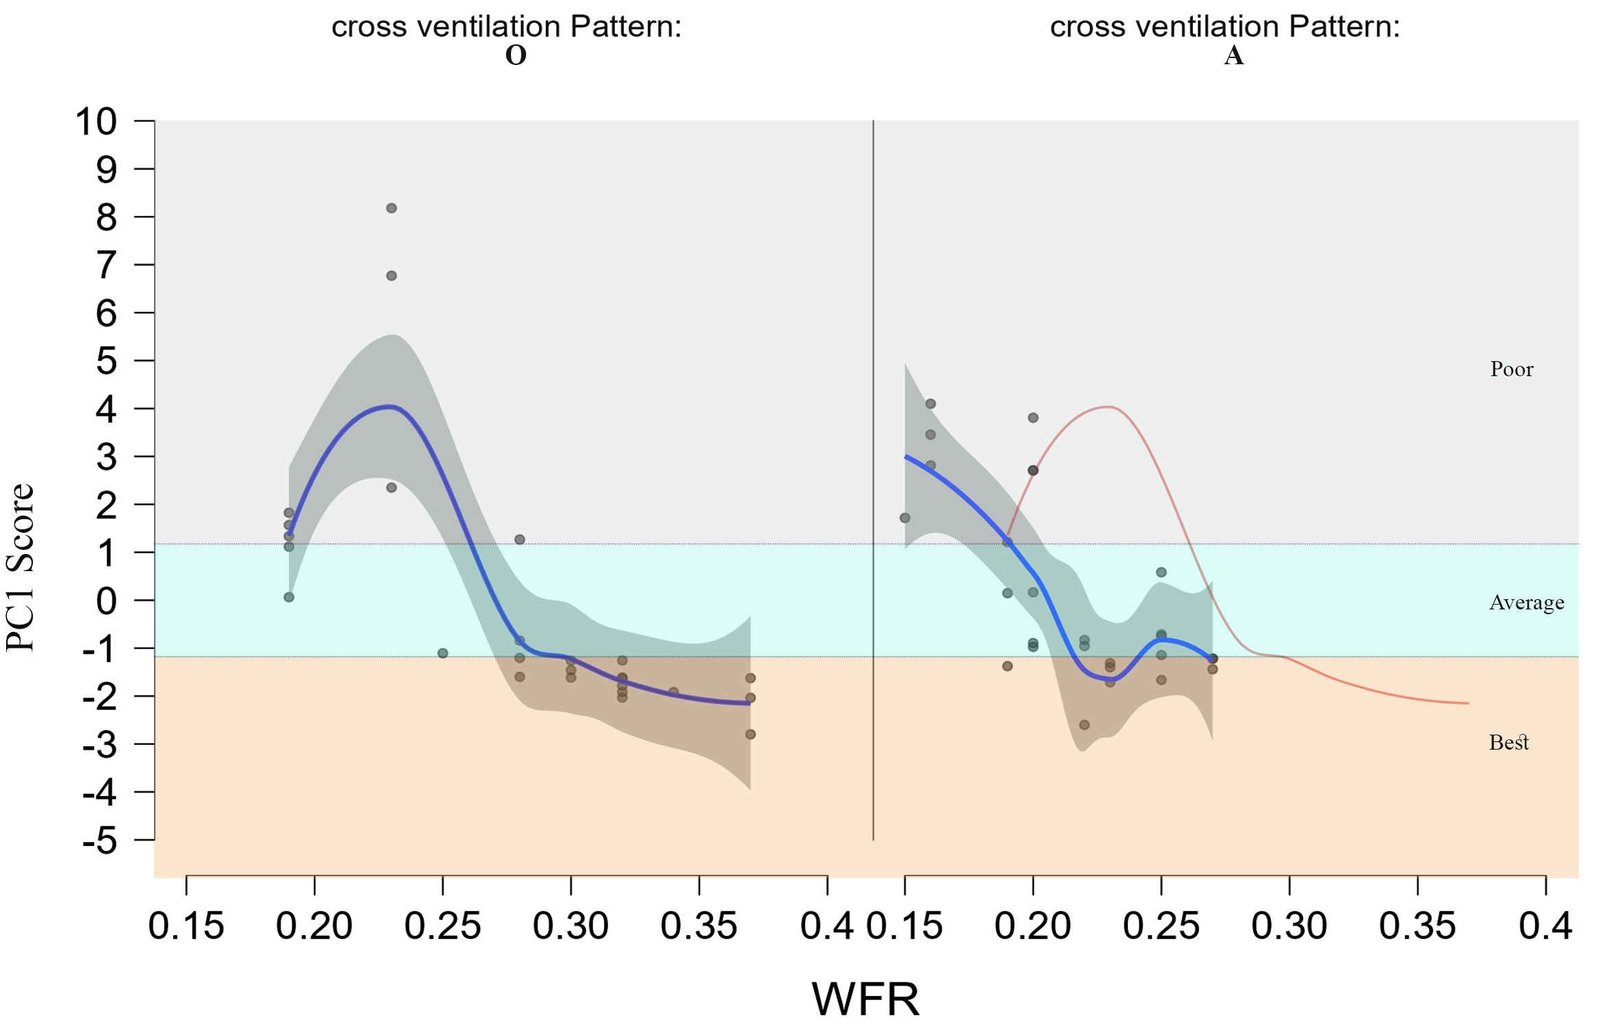
Fig. 20. The effect of WFR on PC1 score for different window configurations.
In the CV-O cross-ventilation pattern, configurations with higher WFRs (30–40%) exhibited lower PC1 scores, reflecting better overall performance. In contrast, within the CV-A category, cases with WFRs of 27% and 23% were among the best-performing groups, while those with 25%, 22%, and 19% were distributed across the best, average, and poor categories. Interestingly, configurations with a low WFR of 19% performed best in the CV-A pattern, whereas in CV-O, similar WFR values corresponded to average or poor performance. These results indicate that overall performance is influenced not solely by the total window opening area, but also by the arrangement and configuration of openings. The best-performing cases in the CV-O category had WFR values of 28% or higher, while those in the CV-A category achieved best performance with WFRs of 23% or higher. When the WFR was below these thresholds, adopting efficient layouts such as corner ventilation patterns helped maintain effective performance.
When comparing the WWR percentages with the PC1 scores (Fig. 21), the analysis reveals that all best-performing configurations exhibited WWR values on both the windward (WWR-WW) and leeward (WWR-LW) sides equal to or greater than 27%, except for one case in the CV-A category (CV-A-H1B1D8), which achieved high performance despite a lower WWR-WW of 20% due to its effective corner window placement. In the CV-O category, configurations with balanced WWRs between 27% and 40% on both sides generally achieved higher performance, while those with a WWR of 27% on one side required at least 40% on the other to fall within the best-performing group. The configuration with a 30%–30% WWR combination (CV-O-H3B4), even though within the 27–40% range, exhibited average performance at H3, while the same ratio achieved better results at heights H1 and H2. In the CV-A category, 30%–30% and 40%–30% combinations were classified as average at heights H2 and H3 but performed best at H1. Configurations with a 40% WWR-WW and only 10% WWR-LW exhibited higher PC1 scores, thereby falling into the poor-performing category. Overall, the results highlight that balanced openings on both windward and leeward walls are essential to ensure sufficient airflow into the space and effective exhaust of hot air from the burner-side windows, thereby enhancing ventilation efficiency.
Figure 21
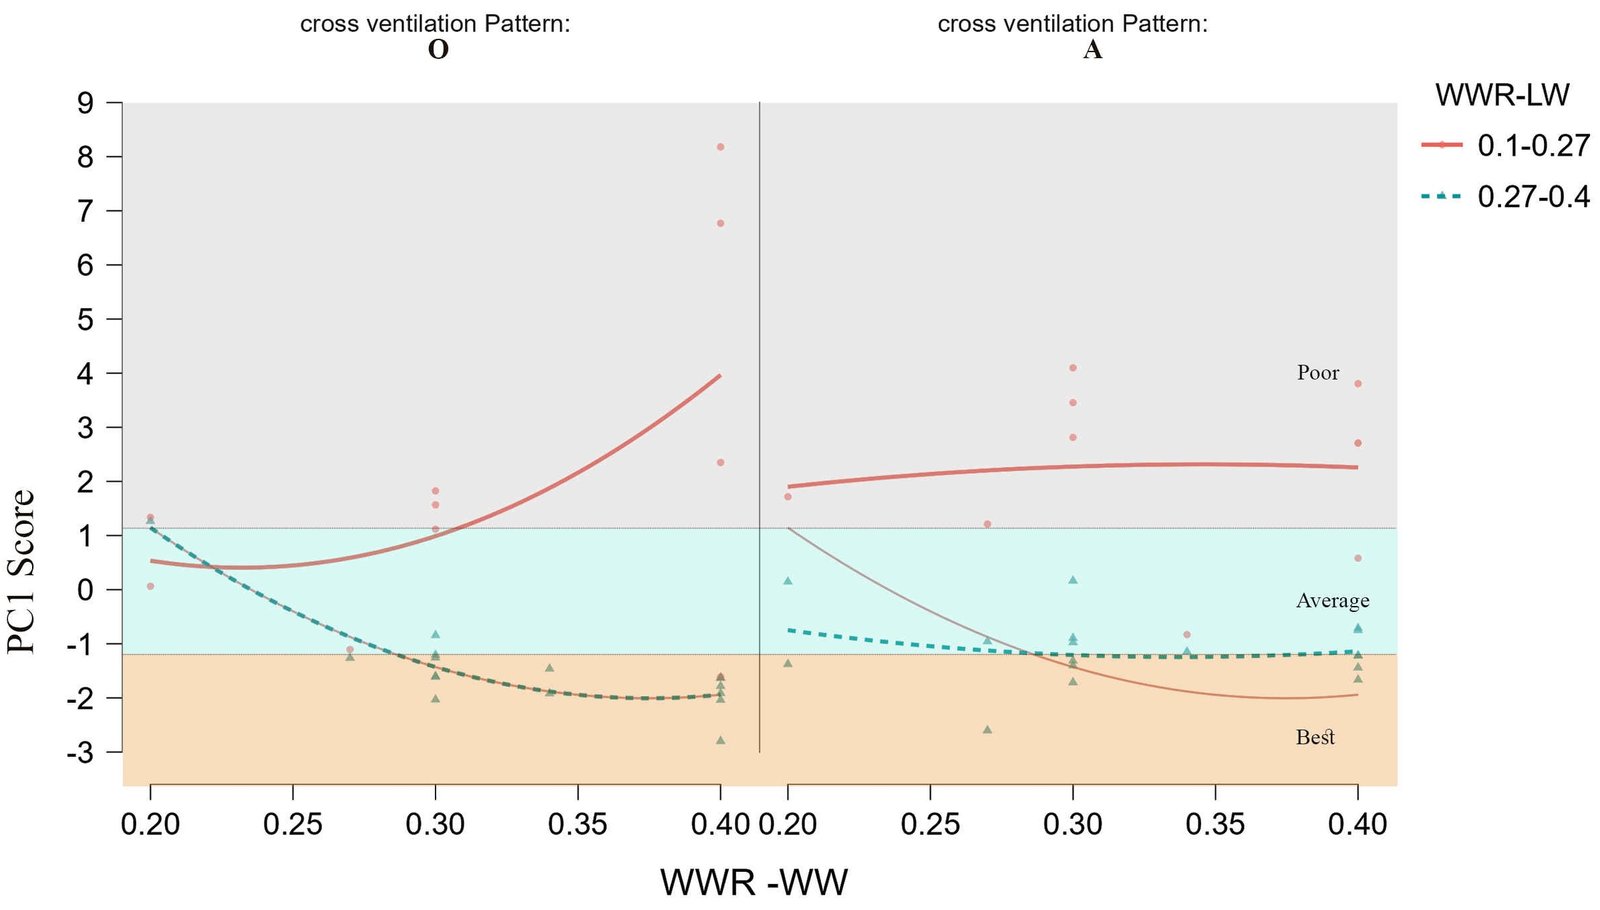
Fig. 21. The WWR vs PC1 score for different window configurations.
The study analysed the performance of each configuration based on ventilation effectiveness and thermal environment, with particular focus on the cooking zone. The results show that the lowest height (H1, 4 m) provides the best overall performance, while increasing the height to 4.5 m (H2) and 5 m (H3) leads to a gradual decline in performance. When considering only the age of air (Fig. 19), the results again show a weak relationship with room height, with lower values observed at H1. This finding does not align with previous studies,[5,28] which reported that higher slenderness ratios lead to decreased age of air and improved IAQ. The results further emphasise the importance of window placement and distribution in determining ventilation effectiveness within kitchen spaces. Properly arranged openings minimise heat accumulation from the burners in the cooking zone and promote effective airflow circulation. Therefore, balanced window configurations with 27-40% WWR on both sides exert a greater impact on ventilation effectiveness than variations in room height.
A comparative assessment of the results (Table 9 and 10) further substantiates these findings. Within the CV-O category (Table 9), 58% of the 26 configurations were classified as best-performing, compared to 33% of the 27 configurations in the CV-A category, indicating stronger overall performance under the opposite-side cross-ventilation pattern. Across height variations (Table 10), H1 (4 m) recorded the highest proportion of best-performing cases (58% of 12 cases), followed by H3 (5 m) at 50%, and H2 (4.5 m) at 41%. Furthermore, best-performing cases were generally associated with balanced windward and leeward WWRs of 30–40%, corresponding to Window-to-floor ratios of approximately 28–37% in CV-O configurations, while corner-optimised layouts in CV-A maintained acceptable performance at slightly lower ratios upto 19%.
Table 9
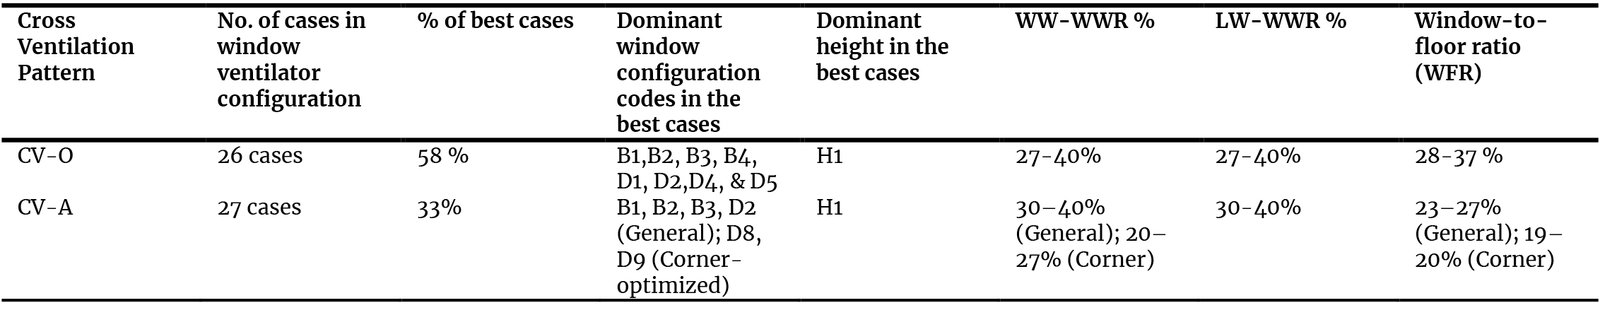
Table 9. Comparative performance summary for cross-ventilation patterns (CV-O and CV-A).
Table 10
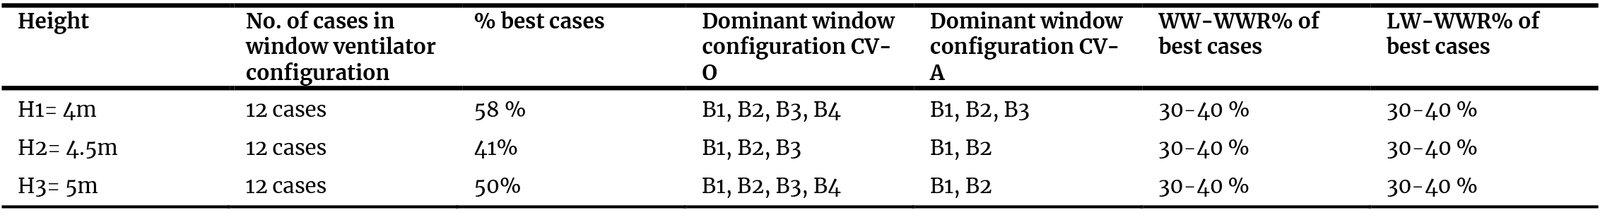
Table 10. Comparative performance summary across different room heights.
3.3. Research limitations and future scope
The study evaluated the model under natural ventilation conditions, considering only one wind direction and wind speed. However, the results can be overpredicted due to the reference wind speed and high inlet temperature that were chosen for the analysis. Certain simplifications in CFD modelling, such as excluding surrounding site features, façade details, and adjacent spaces, were adopted to reduce computational complexity, which may have idealised the airflow and ventilation rates. However, since the analysis focused on relative performance rather than absolute values, these simplifications are unlikely to significantly affect the findings.
Future research should consider a wider range of design and environmental parameters, including multiple wind directions, varied wind speeds, and additional window and ventilator configurations. The inclusion of other passive ventilation features, pollutant dispersion analysis, and transient outdoor conditions will further enhance understanding of airflow and pollutant transport mechanisms. Investigating hybrid ventilation systems that integrate natural and low-energy mechanical strategies could also help establish comprehensive, sustainable design guidelines for institutional kitchens, supporting the creation of healthier and more thermally comfortable cooking environments.
4. Conclusion
The study investigated the impact of key design variables, such as room height and window configuration on natural ventilation performance and temperature distribution in institutional kitchens. Using a validated CFD model, 53 design configurations were analysed to assess air velocity and temperature distribution under natural ventilation conditions. Performance was assessed using four dependent variables: average air velocity, average temperature, LMAA at the cooking zone, and MAA at the breathing plane. Principal Component Analysis (PCA) was conducted to derive a performance score (PC1) for each configuration, which was subsequently used to evaluate the influence of design variables, such as room height and window configuration, on overall ventilation performance and thermal conditions.
The key findings of the study are summarised as follows.
- The Principal Component Analysis-based performance score (PC1) effectively integrated ventilation and thermal performance parameters, allowing for a comprehensive evaluation of each configuration.
- Among the 53 configurations, 24 were identified as best-performing cases, exhibiting a mean air velocity of 0.424 m/s (±0.06), a mean temperature of 35.29°C, and a mean age of air of 27.59 s. Fourteen cases were categorised as average-performing, and fifteen as poor-performing.
- In the CV-O category, the best-performing case was B1 with a 4 m height, D0 distribution, and 40% WWR on both sides, while in the CV-A category, B1 with a 4 m height and D9 distribution, having 40% leeward and 27% windward WWR, achieved the highest performance.
- A ceiling height of 4 m consistently showed superior ventilation performance across all configurations. Increasing the height beyond this level (4.5 m and 5 m) did not improve ventilation effectiveness and often reduced overall performance, indicating that greater spatial volume alone does not ensure better natural ventilation.
- Optimal window distributions in the CV-O category included configurations B1, B2, B3, and B4, and distribution patterns D1, D2, D4, and D5, while in the CV-A category, distribution patterns D8 and D9, and configurations B1, B2, and B3, were identified as the best performing configurations.
- Comparative analysis revealed that the CV-O pattern demonstrated a higher proportion of best-performing cases (58%) compared to the CV-A pattern (33%), suggesting that opposing window configurations provide more stable and effective ventilation under the prevailing wind direction considered in this study.
- In the CV-O category, configurations with WWR values between 27% and 40% achieved the best performance, while in CV-A cases, balanced WWR values between 30% and 40% were generally associated with optimal results. When opening ratios dropped below these thresholds, corner-optimised distributions (D8 and D9) were effective in sustaining acceptable performance.
- Window-to-floor ratios (WFR) between 28% and 37% in CV-O cases were commonly associated with superior performance, whereas CV-A configurations maintained acceptable performance at slightly lower ratios through optimized corner ventilation strategies.
- Design Guideline:
- For institutional kitchens of a similar scale (catering to approximately 600 students) and aspect ratio (1:0.5), superior performance is attained by adopting a 4.0 m ceiling height with opposing window patterns (CV-O) and a balanced WWR of 27–40% on both windward and leeward sides (Window-to-floor ratio of 28–37%), resulting in improved ventilation performance and reduced air temperature across the cooking and breathing zones.
- Alternatively, for staggered configurations (CV-A), a higher balanced WWR of 30–40% or corner-optimized window distributions (D8 and D9) should be employed to enhance ventilation performance and improve thermal conditions across the cooking and breathing zones.
From a practical perspective, the findings provide evidence-based guidance for architects, kitchen designers, and institutional decision-makers involved in large-scale kitchen projects. The results support early-stage decisions related to room height selection, WWR, and opening distribution strategies under natural ventilation conditions. The identified performance thresholds offer practical direction for performance-oriented ventilation design in comparable climatic contexts. Although the analysis was based on a single prevailing wind direction representative of the case study location, the proposed multivariant framework can be applied to different wind orientations, climatic conditions, and other kitchen typologies, providing a basis for broader application and future research in high-heat work environments.
Acknowledgement
The authors gratefully acknowledge the Ministry of Education, Government of India, for providing research fellowship support through the Prime Minister’s Research Fellowship (PMRF) Scheme, May 2021 cycle.
Funding
The authors received no financial support for the research, authorship, and/or publication of this article.
Author Contributions
Jesna Mathew: Conceptualization, Methodology, Software, Validation, Formal analysis, Investigation, Resources, Writing- Original Draft, Writing – review & editing, visualization. Gnanasambandam Subbaiyan: Conceptualization, Methodology, Investigation, Project administration, Resources, Supervision, Writing - Review & Editing. Hareesh Krishnan H: Software, validation, Formal analysis, Resources, Writing – review & editing.
Declaration of competing interest
The authors declare no conflict of interest.
References
- K. Balakrishnan, P. Ramaswamy, S. Sambandam, G. Thangavel, S. Ghosh, P. Johnson, K. Mukhopadhyay, V. Venugopal, V. Thanasekaraan, Air Pollution from Household Solid Fuel Combustion in India: An Overview of Exposure and Health Related Information to Inform Health Research Priorities, Global Health Action 4:1 (2011) 5638. https://doi.org/10.3402/gha.v4i0.5638
- A. Singh, R. Kamal, M. K. R. Mudiam, M. K. Gupta, G. N. V. Satyanarayana, V. Bihari, N. Shukla, A. H. Khan, C. N. Kesavachandran, Heat and PAHs Emissions in Indoor Kitchen Air and Its Impact on Kidney Dysfunctions among Kitchen Workers in Lucknow, North India, PLOS One 11:2 (2016) e0148641. https://doi.org/10.1371/journal.pone.0148641
- S. Saha, A. Guha, S. Roy, Experimental and Computational Investigation of Indoor Air Quality Inside Several Community Kitchens in a Large Campus, Building and Environment 52 (2012) 177-190. https://doi.org/10.1016/j.buildenv.2011.10.015
- M. Hamidur Rahman, A. K. M. Sadrul Islam, M. Ruhul Amin, Numerical Study of Emission Control of Rural Kitchen for Healthy Environment, Journal of Thermal Science and Engineering Applications 12:2 (2019) 021002-10. https://doi.org/10.1115/1.4043914
- J. Mathew, G. Subbaiyan, Investigation of Ventilation Performance to Improve the Indoor Air Quality of Institutional Kitchens, Journal of Daylighting 11:1 (2024) 39-54. https://doi.org/10.15627/jd.2024.3
- S. Shi, J. Yang, Y. Liang, Indoor Distribution and Personal Exposure of Cooking-Generated PM2.5 in Rural Residences of China: A Multizone Model Study, Building Simulation 16:8 (2023) 1299-1315. https://doi.org/10.1007/s12273-023-0997-1
- B. C. Singer, R. Z. Pass, W. W. Delp, D. M. Lorenzetti, R. L. Maddalena, Pollutant Concentrations and Emission Rates from Natural Gas Cooking Burners Without and with Range Hood Exhaust in Nine California Homes, Building and Environment 122 (2017) 215-229. https://doi.org/10.1016/j.buildenv.2017.06.021
- M. Rahimi-Gorji, O. Pourmehran, M. Gorji-Bandpy, T. B. Gorji, CFD Simulation of Airflow Behavior and Particle Transport and Deposition in Different Breathing Conditions Through the Realistic Model of Human Airways, Journal of Molecular Liquids 209 (2015) 121-133. https://doi.org/10.1016/j.molliq.2015.05.031
- K. Svendsen, A. K. Sjaastad, Exposure to Cooking Fumes in Restaurant Kitchens in Norway, The Annals of Occupational Hygiene 46:4 (2002) 395-400. https://doi.org/10.1093/annhyg/mef045
- T. W. Wong, A. H. S. Wong, F. S. C. Lee, H. Qiu, Respiratory Health and Lung Function in Chinese Restaurant Kitchen Workers, Occupational and Environmental Medicine 68:10 (2011) 746-752. https://doi.org/10.1136/oem.2010.059378
- C. Melaku, G. Abere, Y. T. Zele, Y. Mamaye, T. Abebaw, A. E. Bezie, A. H. Tesfaye, E. A. Worede, Occupational Heat Exposure-related Symptoms Prevalence and Associated Factors Among Hospitality Industry Kitchen Workers in Ethiopia: Wet Bulb Globe Temperature, Safety and Health at Work 15:4 (2024) 472-480. https://doi.org/10.1016/j.shaw.2024.08.002
- T. W. Tsang, L. T. Wong, K. W. Mui, C. Y. Poon, Influences of Home Kitchen Designs on Indoor Air Quality, Indoor and Built Environment 32:7 (2023) 1429-1438. https://doi.org/10.1177/1420326X231164290
- Y. Wang, H. Li, G. Feng, Simulating the Influence of Exhaust Hood Position on Ultrafine Particles During a Cooking Process in the Residential Kitchen, Building Simulation 13:6 (2020) 1339-1352. https://doi.org/10.1007/s12273-020-0640-3
- M. S. Alam, M. Sharma, U. R. Salve, Assessment of Thermal Comfort in a Hot and Humid Indoor Built Environment of a Kitchen at a University Canteen, Work 72:1 (2022) 189-199. https://doi.org/10.3233/WOR-205174
- M. Ruth, J. Maggio, K. Whelan, M. DeYoung, J. May, A. Peterson, K. Paterson, Kitchen 2.0: Design Guidance for Healthier Cooking Environments, International Journal for Service Learning in Engineering, Humanitarian Engineering and Social Entrepreneurship (2014) 151-169. https://doi.org/10.24908/ijsle.v0i0.5147
- K. Grabow, D. Still, S. Bentson, Test Kitchen Studies of Indoor Air Pollution from Biomass Cookstoves, Energy for Sustainable Development 17:5 (2013) 458-462. https://doi.org/10.1016/j.esd.2013.05.003
- S. Liu, Q. Cao, X. Zhao, Z. Lu, Z. Deng, J. Dong, X. Lin, K. Qing, W. Zhang, Q. Chen, Improving Indoor Air Quality and Thermal Comfort in Residential Kitchens with a New Ventilation System, Building and Environment 180 (2020) 107016. https://doi.org/10.1016/j.buildenv.2020.107016
- S. G. Durban, A Review of Food Toxicity and Kitchen Air Pollution: Cooking Food in the Hospitality Industry, in: Proceedings of the Global Conference on Business and Social Sciences Proceeding, Kuala Lumpur, Malaysia, 17 June 2022, pp. 7-20.
- Ventilation and acceptable Indoor air quality, ASHARE: Atlanta, GA, 2022.
- Thermal Environmental Conditions for Human Occupancy, ASHRAE: Atlanta, GA, 2023.
- Handbook on Functional Requirements of Buildings (Other than Industrial Buildings), Bureau of Indian Standards: New Delhi, India, 1988.
- D. Prakash, P. Ravikumar, Analysis of Thermal Comfort and Indoor Air Flow Characteristics for a Residential Building Room Under Generalized Window Opening Position at the Adjacent Walls, International Journal of Sustainable Built Environment 4:1 (2015) 42-57. https://doi.org/10.1016/j.ijsbe.2015.02.003
- G. M. Stavrakakis, P. L. Zervas, H. Sarimveis, N. C. Markatos, Optimization of Window-Openings Design for Thermal Comfort in Naturally Ventilated Buildings, Applied Mathematical Modelling 36:1 (2012) 193-211. https://doi.org/10.1016/j.apm.2011.05.052
- M. Ferrucci, M. Brocato, F. Peron, Digital Tools for the Morphological Design of the Naturally Ventilated Buildings, Future Cities and Environment 4:1 (2018). https://doi.org/10.5334/fce.4
- Y. Wang, Y. Yu, T. Ye, Q. Bo, Ventilation Characteristics and Performance Evaluation of Different Window-Opening Forms in a Typical Office Room, Applied Sciences 11:19 (2021) 8966. https://doi.org/10.3390/app11198966
- Q. Li, V. C. Tai, L. K. Moey, T. F. Go, J. Safehian, M. H. Yazdi, Impact of Planar Area Ratio and Opening Positions on Natural Cross Ventilation Performance in Sheltered High-Rise Buildings: A Simulation Study, Building and Environment 245 (2023) 110889. https://doi.org/10.1016/j.buildenv.2023.110889
- S. Derakhshan, A. Shaker, Numerical Study of the Cross-Ventilation of an Isolated Building with Different Opening Aspect Ratios and Locations for Various Wind Directions, International Journal of Ventilation 16:1 (2017) 42-60. https://doi.org/10.1080/14733315.2016.1252146
- R. Debnath, R. Bardhan, R. Banerjee, Investigating the Age of Air in Rural Indian Kitchens for Sustainable Built-Environment Design, Journal of Building Engineering 7 (2016) 320-333. https://doi.org/10.1016/j.jobe.2016.07.011
- World Health Organization, ed., WHO Guidelines for Indoor Air Quality: Household Fuel Combustion, World Health Organization: Geneva, Switzerland, 2014.
- S. Emmerich, H. E. Burroughs, W. Fisk, C. Sekhar, S. Taylor, W. Thomann, ASHRAE Position Document on Indoor Air Quality, (2011).
- N. Izadyar, W. Miller, B. Rismanchi, V. Garcia-Hansen, Numerical Simulation of Single-Sided Natural Ventilation: Impacts of Balconies Opening and Depth Scale on Indoor Environment, in: Proceedings of the IOP Conference Series: Earth and Environmental Science, Prague, Czech Republic, 7 April 2020. https://doi.org/10.1088/1755-1315/463/1/012037
- M. K. Satheesan, T.-W. Tsang, K.-W. Mui, L.-T. Wong, Optimal Ventilation Strategy for Multi-Bed Hospital Inpatient Wards: CFD Simulations Using a Genetic Algorithm, Indoor and Built Environment 33:4 (2024) 658-674. https://doi.org/10.1177/1420326X231205139
- T. Yazarlou, E. Barzkar, Louver and Window Position Effect on Cross-Ventilation in a Generic Isolated Building: A CFD Approach, Indoor and Built Environment 31:6 (2022) 1511-1529. https://doi.org/10.1177/1420326X211061685
- N. Izadyar, W. Miller, B. Rismanchi, V. Garcia-Hansen, S. Matour, Balcony Design and Surrounding Constructions Effects on Natural Ventilation Performance and Thermal Comfort Using CFD Simulation: A Case Study, Journal of Building Performance Simulation 16:5 (2023) 537-556. https://doi.org/10.1080/19401493.2023.2185682
- J. Liu, J. Niu, CFD Simulation of the Wind Environment Around an Isolated High-Rise Building: An Evaluation of SRANS, LES and DES Models, Building and Environment 96 (2016) 91-106. https://doi.org/10.1016/j.buildenv.2015.11.007
- S. Omrani, V. Garcia-Hansen, B. R. Capra, R. Drogemuller, On the Effect of Provision of Balconies on Natural Ventilation and Thermal Comfort in High-rise Residential Buildings, Building and Environment 123 (2017) 504-516. https://doi.org/10.1016/j.buildenv.2017.07.016
- Energy Conservation Building Code, Bureau of Energy Efficiency: 2017.
- S. Sayadi, A. Hayati, M. Salmanzadeh, Optimization of Window-to-Wall Ratio for Buildings Located in Different Climates: An IDA-Indoor Climate and Energy Simulation Study, Energies 14:7 (2021) 1974. https://doi.org/10.3390/en14071974
- Y. He, Y. Chu, H. Zang, J. Zhao, Y. Song, Experimental and CFD study of Ventilation Performance Enhanced by Roof Window and Mechanical Ventilation System with Different Design Strategies, Building and Environment 224 (2022) 109566. https://doi.org/10.1016/j.buildenv.2022.109566
- S. Omrani, B. Capra, V. Garcia-Hansen, R. Drogemuller, Investigation of the Effect of Balconies on Natural Ventilation of Dwellings in High-Rise Residential Buildings in Subtropical Climate, in: Proceedings of the Living and learning: research for a better built environment: 49th International Conference of the Architectural Science Association, Melbourne, Australia, 2 December 2015, pp. 1-10.
- H. Hareesh Krishnan, K. K. Ashin, A. Adhil Muhammed, B. K. Ayalur, Experimental and Numerical Study of Wind Tower Integrated with Solar Heating Unit to Meet Thermal Comfort in Buildings During Cold and Sunny Climate Conditions, Journal of Building Engineering 68 (2023) 106048. https://doi.org/10.1016/j.jobe.2023.106048
- A. Simone, B. W. Olesen, J. L. Stoops, A. W. Watkins, Thermal Comfort in Commercial Kitchens (RP-1469): Procedure and Physical Measurements (Part 1), HVAC&R Research 19:8 (2013) 1001-1015. https://doi.org/10.1080/10789669.2013.840494
- P. Wei, B. Zhou, M. Tan, F. Li, J. Lu, Z. Dong, M. Xu, G. Wang, Y. Xiao, Study on Thermal Comfort under Non-uniform Thermal Environment Condition in Domestic Kitchen, Procedia Engineering 205 (2017) 2041-2048. https://doi.org/10.1016/j.proeng.2017.10.084
2383-8701/© 2026 The Author(s). Published by solarlits.com. This is an open access article distributed under the terms and conditions of the Creative Commons Attribution 4.0 License.

1301
Total views
Citations
SHARE ON


