Article | 10 January 2026
Volume 13 Issue 1 pp. 20-43 • doi: 10.15627/jd.2026.2
Comparative Analysis of Daylight and Visual Quality Across School Plan Typologies: A Spatial Layout Perspective
Seyed Hossein Neshat Safavi,1,* Elham Shokri,2 Behzad Vasigh,3 Saeed Banihashemi,4 Akram Esfandiari5,6
Author affiliations
1 Architectural Engineering Department, Architecture and Urbanism Faculty, Imam Khomeini International University, Qazvin, Iran
2 School of engineering, design and built environment, Western Sydney University, Sydney, NSW, Australia
3 Department of Architecture, Faculty of Architecture and Urban Planning, Jundi-Shapur University of Technology, Dezful, Iran
4 School of Built Environment, University of Technology Sydney, Sydney, NSW, Australia
5 Department of Architecture, Faculty of Architecture and Urban Planning, Jundi-Shapur University of Technology, Dezful, Iran
6 Department of Architecture and Urban Planning, Technical and Vocational University (TVU), Tehran, Iran
*Corresponding author.
hneshat.edu@gmail.com (S. H. N. Safavi)
e.shokri@westernsydney.edu.au (E. Shokri)
vasiq@jsu.ac.ir (B. Vasigh)
saeed.banihashemi@uts.edu.au (S. Banihashemi)
esfandiari.akram@yahoo.com (A. Esfandiari)
History: Received 25 September 2025 | Revised 17 November 2025 | Accepted 25 November 2025 | Published online 10 January 2026
2383-8701/© 2026 The Author(s). Published by solarlits.com. This is an open access article distributed under the terms and conditions of the Creative Commons Attribution 4.0 License.
Citation: Seyed Hossein Neshat Safavi, Elham Shokri, Behzad Vasigh, Saeed Banihashemi, Akram Esfandiari, Comparative Analysis of Daylight and Visual Quality Across School Plan Typologies: A Spatial Layout Perspective, Journal of Daylighting, 13:1 (2026) 20-43. doi: 10.15627/jd.2026.2
Figures and tables
Abstract
Designing daylight-based spaces has gained increasing attention due to its numerous benefits and alignment with global sustainability standards. However, limited research has focused on how architectural layouts affect daylight distribution and visual quality, particularly in educational environments. This research aims to address this gap by integrating spatial layout analysis with daylighting and visual quality metrics to enhance daylight benefits across seven school plan layouts as case studies. Using a systematic review and simulation-based methodology, daylight performance is evaluated with Useful Daylight Illuminance (UDI up, UDI, UDI low) and Daylight Autonomy (DA) using the Honeybee plugin and Radiance engine in Rhinoceros software. Visual quality is also explored through Isovist and Depth Map analysis, focusing on metrics including connectivity (C), Isovist area (A), drift angle (DA), Maximum radial line (RL(L)), Minimum radial line (RL(S)), and Visual Mean Depth. Simulation validation is conducted through a lux meter in a real classroom in Tehran, Iran, along with SPSS analysis to explore the accuracy and correlations between the results. Findings reveal that well-designed interior layouts significantly enhance both daylight distribution and visual quality. School with layout C, by higher Drift Angle (DA) and longer visual range (Max radial) can provide a dynamic and open environment, outperforming other layouts in both daylighting (DA = 52.93%, UDI = 68.17%) and visual quality metrics (Drift Angle ≈ 220, Connectivity ≈ 600). Layouts F and E also perform well, while Models D and G show less daylight performance (UDI-low ≈ 31–34%). The outcomes emphasize the importance of an integrated design approach including DA, UDI, Isovist metrics, and plan layouts, offering a new framework to enhance daylight benefits in educational spaces. It also provides valuable insights to improve architectural schools’ designs, contributing to more sustainable, visually enriched, and energy-efficient learning environments.
Keywords
Isovist tool, Daylight distribution, Visual quality, School design, Spatial layouts
Nomenclature
| UDI | Useful daylight illuminance in standard range |
| UDI_low | Useful daylight illuminance lower that standard range |
| UDI_up | Useful daylight illuminance upper than standard range |
| DA | Daylight autonomy |
| WWR | Window-to-wall-ratio |
| C | Connectivity |
| A | Isovist area |
| DA | Drift angle |
| RL(L) | Maximum radial line |
| RL(S) | Minimum radial line |
| CBDM | Climate based daylight metrics |
| ρ | Correlation coefficient / Reflection coefficient |
1. Introduction
Daylight plays a vital role in enhancing the environmental quality of educational spaces and directly contributes to students’ health, well-being, and learning outcomes [1-3]. Research indicates that access to natural light improves visual and thermal comfort, supports better Indoor Environmental Quality [4]. It also increases concentration levels and can even enhance academic performance by 20–26% through its positive effects on cognitive functioning and circadian rhythm regulation [5-7]. Moreover, daylight reduces visual fatigue, improves mental health by regulating circadian rhythms [8-11]. Given these substantial benefits, the enhancement of daylight availability in school buildings has become a critical design priority, particularly during early architectural stages, where facade configuration, glazing design, shading strategies, and smart window technologies can significantly influence daylight access and interior comfort [1,12-14]. Parallel to this, research has increasingly highlighted the importance of visual quality and its role in shaping users’ activities, comfort, and performance in interior spaces. Theories such as Kaplan’s restorative focus framework demonstrate that environments offering broader vistas, fascination, and opportunities for mental disengagement can alleviate cognitive fatigue and improve psychological well-being [15]. In educational settings, the quality of visual experience, including openness, connectivity, and spatial perception, can significantly affect students’ attention, engagement, and overall learning effectiveness. Isolation and private spaces have also been shown to facilitate mental restoration and effective task performance [16]. As a result, both daylight availability and visual quality have emerged as key determinants of high-performing learning environments. Despite extensive research on facade elements, daylighting strategies, interior surface reflectance, and occupant comfort across various building types, including hospitals and religious spaces [17-21], a noticeable gap exists in the literature regarding the combined influence of interior spatial layout, daylight distribution, and visual quality in school buildings. Moreover, while spatial configuration has been analyzed in other contexts using tools such as Space Syntax and Isovist metrics [22-26], its role in educational environments, particularly its impact on daylight performance and student-centered visual quality, has received limited scholarly attention. Moreover, no study to date has simultaneously examined daylight metrics, Isovist-based visual quality indicators, and interior plan layout patterns within most common school typologies, highlighting an unaddressed research gap.
Accordingly, the present research aims to explore how variations in interior spatial layout influence both daylight performance and visual quality in school spaces. Specifically, it seeks to explore the relationship between visual quality metrics (e.g., Isovist area, connectivity, average sight depth) and quantitative daylighting indicators (e.g., UDI and DA), determine whether a particular spatial layout pattern among commonly used school configurations can be considered preferred in balancing daylight access and visual quality. Through a combination of parametric simulations using Honeybee plugin in Grasshopper, Depth map analyses using Isovist-based evaluations, this research offers an integrated methodological framework that allows for quantitative assessment of how spatial geometry shapes both luminous performance and visual experience. The findings of this research contribute to the existing body of knowledge by bridging daylighting research with visual quality and spatial layout analysis. This integration not only advances theoretical understanding but also provides practical design insights that can inform national guidelines, educational facility standards, and architectural decision-making. By emphasizing the significance of interior space configuration in promoting student comfort, satisfaction, and learning performance, the research underscores the need to prioritize daylight distribution and visual openness when designing contemporary school environments. To achieve this, the paper first presents a comprehensive review of the literature on daylight performance and visual quality in relation to spatial layouts within educational environments. It then outlines the research methodology, detailing the simulation tools, case study characteristics, and selected metrics. Following this, the research provides a thorough analysis and discussion, including the examination of correlations between research metrics. Finally, the paper concludes by summarizing the key findings, highlighting design implications, and offering recommendations for future research.
1.1. Literature review
This research aims to bridge existing gaps in the literature by systematically reviewing and analyzing studies that investigate indoor daylighting and Isovist visual quality in relation to architectural design layouts in school environments. The literature search and selection process, conducted between 2020 and 2025, follows a structured approach, as outlined in Fig. 1. In the first phase, the research objectives and scope are defined, and relevant keywords are selected to identify the most related studies. The search is performed using the Scopus and Web of Science databases, utilizing a Boolean combination of keywords grouped into four thematic categories: (daylight* OR “natural light” OR “visual comfort” OR “visual performance” OR “visual environment” OR glare OR light*) AND (layout OR design OR “spatial configuration” OR “architectural layout” OR “floor plan”) AND (school OR “educational building” OR classroom OR “learning space”) AND (Isovist OR “visual depth” OR view OR “visual access” OR “visual quality” OR “spatial analysis” OR “depth map” OR “view field” OR “view access”). The initial search, conducted in November 2025, results in 556 documents. After removing duplicates using EndNote and performing inclusion, exclusion, and an initial relevance screening, the dataset is narrowed down to 173 unique records. The next phase involves reviewing titles, keywords, abstracts, and study quality, further reducing the selection to 85 papers. Finally, a full-text assessment is conducted, leading to the selection of 38 studies for in-depth analysis.
Figure 1
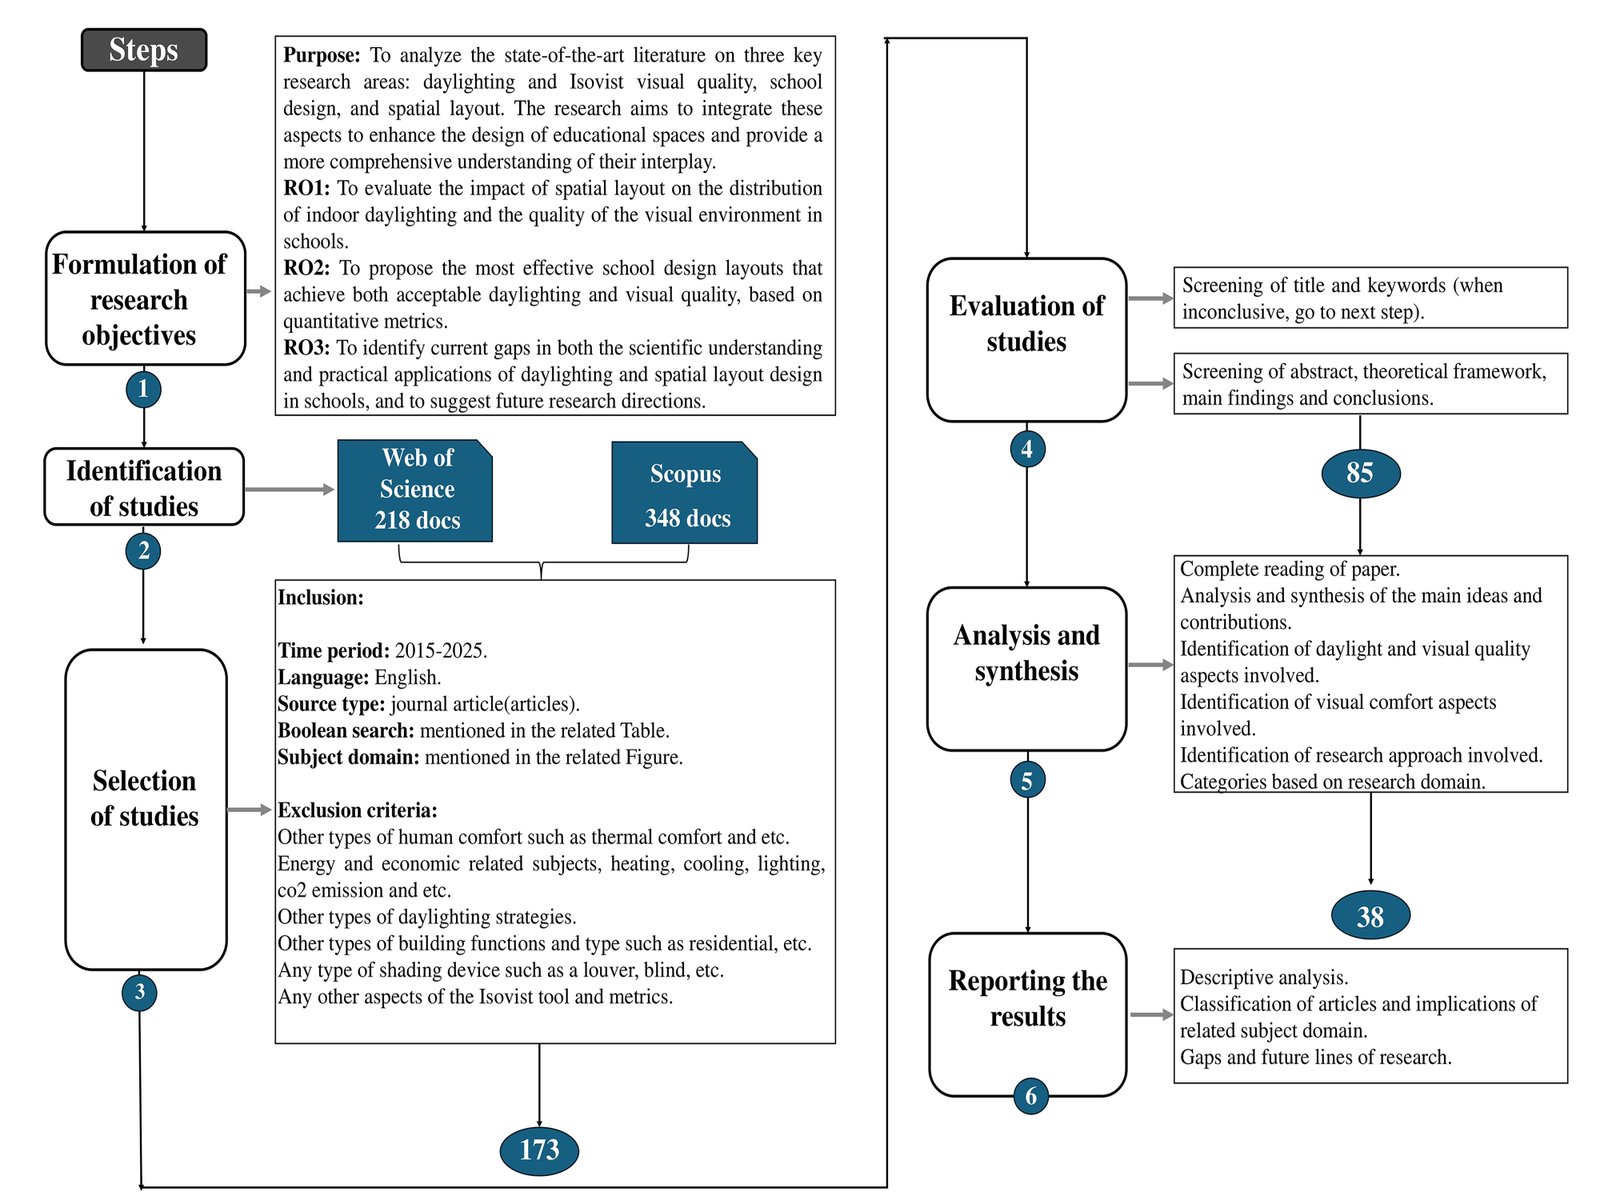
Fig. 1. Overview of the Review Process for Selected Studies (PRISMA chart).
Recent studies highlight the critical role of daylight in supporting students’ health, visual comfort, and learning performance. The design of educational spaces, particularly classrooms, plays a central role in enhancing natural light exposure, with direct implications for both energy efficiency and student well-being. Evidence shows that inadequate daylight distribution can lead to glare, visual fatigue, and reduced concentration among students [27] . Given the long hours spent by learners and teachers in classroom environments, the quality of task-plane illumination directly influences academic outcomes and visual health. In response, researchers have examined a wide range of architectural variables, including window placement and window-to-wall ratio, room depth, ceiling geometry, furniture arrangement, surface reflectance, and overall building form and orientation, to improve daylight availability and uniformity [17-20]. Within this context, desk orientation has emerged as a critical determinant of daylight quality. Wojtysiak recommends orienting desks perpendicular to the window so that daylight enters from the side, thereby minimizing direct glare, preventing shadowing and reflective glare on work surfaces, and ensuring adequate illumination for reading and writing tasks. Beyond desk arrangement, parameters such as classroom size, plan shape, window configuration, and interior furnishing layout significantly affect daylight distribution. Classroom width determines the volume of daylight entering a space, whereas room depth governs the extent of daylight penetration. Studies further indicate that wide and shallow classrooms perform better than deep and narrow ones, underscoring the combined importance of spatial geometry and interior layout in achieving effective daylighting [28]. A common pattern across daylighting literature is that illuminance decreases sharply with increasing distance from the window. In single-sided daylighted classrooms, near-window zones typically achieve higher Useful Daylight Illuminance (UDI) but also present greater glare risk, whereas deeper regions often fail to achieve sufficient illuminance [29]. Interior surface reflectance plays an essential compensatory role; light-colored walls and ceilings can redistribute daylight more effectively, reducing performance differences between near-window and deep zones. Supporting these findings, Al-Khatatbeh and Ma’bdeh report that rectangular classrooms with southern orientation provide good daylight availability, while north-facing rectangular rooms ensure the most uniform desk-level illuminance. Their results further indicate that shallow classrooms with northeast or southeast orientations deliver higher eye-level illuminance at deeper points, and that the overall best-performing layout is a rectangular plan with northeast-facing windows [30].
These findings collectively demonstrate that room geometry and spatial proportions substantially influence indoor daylight distribution in school environments consistent with patterns observed in healthcare facilities [21]. Although prior research has examined certain interior design factors affecting daylight and visual comfort in classrooms [31-33], the influence of interior spatial layout as a holistic configuration remains relatively underexplored, highlighting the need for research that systematically evaluates spatial configurations to enhance daylight performance. Parallel to advancements in daylighting research, Isovist theory has provided new insights into how spatial settings shape visual quality metrics for students. Early work established the concept of “visual contexts” (Tady [34]) and was later expanded by Benedikt and Davis through graphical representations of Isovist methodology [35]. More recent studies quantify spatial quality through metrics such as closure, field of view [12], continuity, private space boundaries, movement paths, and angles of view [36-38]. These approaches demonstrate that spatial configuration, captured through Isovist descriptors, directly influences visual connectivity and perceptual experience. To better illustrate the research scope and interconnections in the existing literature, Fig. 2 presents a keyword co-occurrence visualization generated using VOSviewer. The network maps co-occurring terms from titles, abstracts, and keywords, with node size representing frequency, links indicating co-occurrence strength, and colors identifying thematic clusters. The visualization highlights major trends in architecture, spatial analysis, and daylighting, with prominent clusters centered around “syntax” and “layout.” Closely linked keywords, such as “daylight autonomy” and “dynamic daylighting simulation,” point toward emerging areas of concurrent investigation, while the transition from blue (earlier years) to yellow (recent years) reflects the evolution of research topics, including the emergence of “deep learning Isovist”.
Figure 2
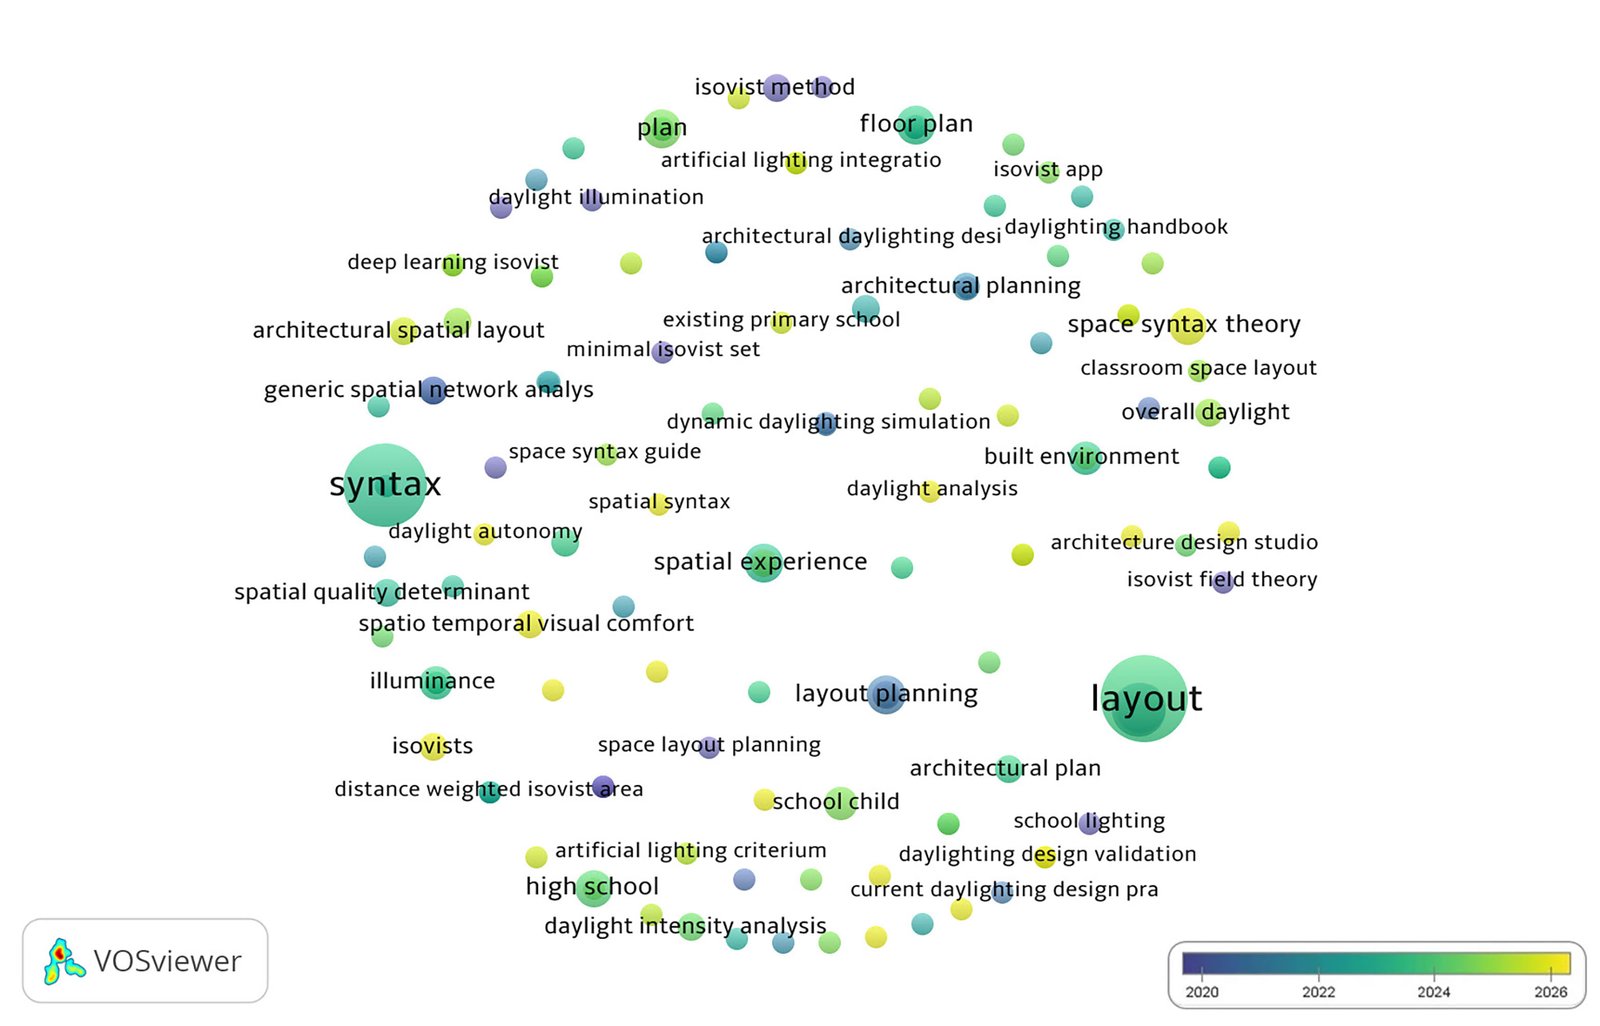
Fig. 2. Visualization of key term density and network in titles, abstracts, and keywords of all searched papers.
Based on these theoretical advancements, environmental performance studies further reinforce the connection between spatial configuration and perceptual outcomes. Frenz and Winer demonstrate how spatial features influence perceptual responses and energy consumption, using Isovist metrics to assess spatial quality and movement patterns [39,40]. In the educational context, Taher Sima and colleagues apply Space Syntax to compare open-space usage in traditional and contemporary schools, showing that teaching and learning practices shape the educational role of open and semi-open spaces [26]. Using the Space Syntax method, Mehrabian and colleagues conducted a morphological analysis of the Darolfonoon School to examine the building’s spatial arrangement. Their findings align with broader research indicating that larger vistas contribute to improved comfort and enhanced aesthetic perception, highlighting the relevance of metrics such as maximum radial sightline, sight connectivity, and average sight depth in spatial analysis. Extending this line of inquiry, another investigation explored the application of glazing within transitional spaces in college buildings using Space Syntax techniques. The study demonstrated that incorporating glazed barriers increases visual and psychological accessibility, thereby facilitating smoother movement flow and strengthening spatial connectivity.
While axial analysis provides valuable insights into certain spatial relationships, the authors point out its limitations in fully capturing the visual and functional performance of such environments [25].
Building on these foundations, researchers propose expanding Space Syntax methodologies to integrate natural daylight, artificial lighting, and glare. This broader analytical framework aims to enhance assessments of visual comfort, visibility, and spatial perception, ultimately offering a more comprehensive evaluation of environmental quality [24]. The significance of visual quality is further emphasized in classroom contexts, where empirical studies show that daylight can meaningfully influence student behavior. However, these effects are strongly moderated by individual perception and activity patterns, underscoring the need for larger sample sizes and more rigorous measurement techniques to obtain reliable and generalizable findings [23]. To support performance-based design during early architectural stages, new computational approaches have also emerged. For instance, machine learning models such as ResNet50 and FCN have been employed to simultaneously predict daylight and view quality, achieving R² values as high as 0.78. These methods offer designers rapid, data-driven feedback while allowing them to preserve creative freedom, ultimately improving the integration of evidence-based decision-making into design workflows [41]. Parallel advances in research on religious buildings further demonstrate the relationship between spatial morphology and visual comfort. By employing both 2D Isovist metrics (using depthmapX.10) and 3D volumetric Isovist analysis (via Grasshopper scripts in Rhinoceros 7), studies have quantitatively illustrated how spatial form and volumetric configuration shape visual comfort, spatial awareness, and perceived spaciousness. In particular, findings from barrier-free mosque designs reveal that creating a prominent spatial zone beneath the central dome can significantly enhance visual comfort by optimizing sightlines and improving spatial perception [22]. To further clarifies broader research developments, Fig. 3, generated using VOS viewer, visualizes relationships among keywords drawn from studies indexed in ScienceDirect between 2020 and late 2025. In the diagram, node size reflects keyword frequency and connecting lines denote co-occurrence strength. The northern cluster highlights expanding interest in the use of Space Syntax in architectural spatial design, built environments, and street network analysis. The eastern cluster contains emerging research themes, particularly visual comfort, 3D Isovist applications, and sensory-based analyses of spatial experience. A closer inspection of color gradients reveals that traditional applications of Space Syntax remain robust, while newer experience-oriented and perception-driven research directions are becoming increasingly prominent. The literature underscores the significant influence of interior spatial layouts on indoor daylight performance and visual quality, especially when evaluated through Isovist and Space Syntax methodologies. However, despite recognition of these factors, their combined role in shaping daylighting outcomes in school environments remains underexplored, particularly compared with more extensively studied building types such as hospitals and mosques. This highlights the need for research that integrates spatial configuration metrics with daylight and visual comfort analyses to advance evidence-based design in educational settings.
Figure 3
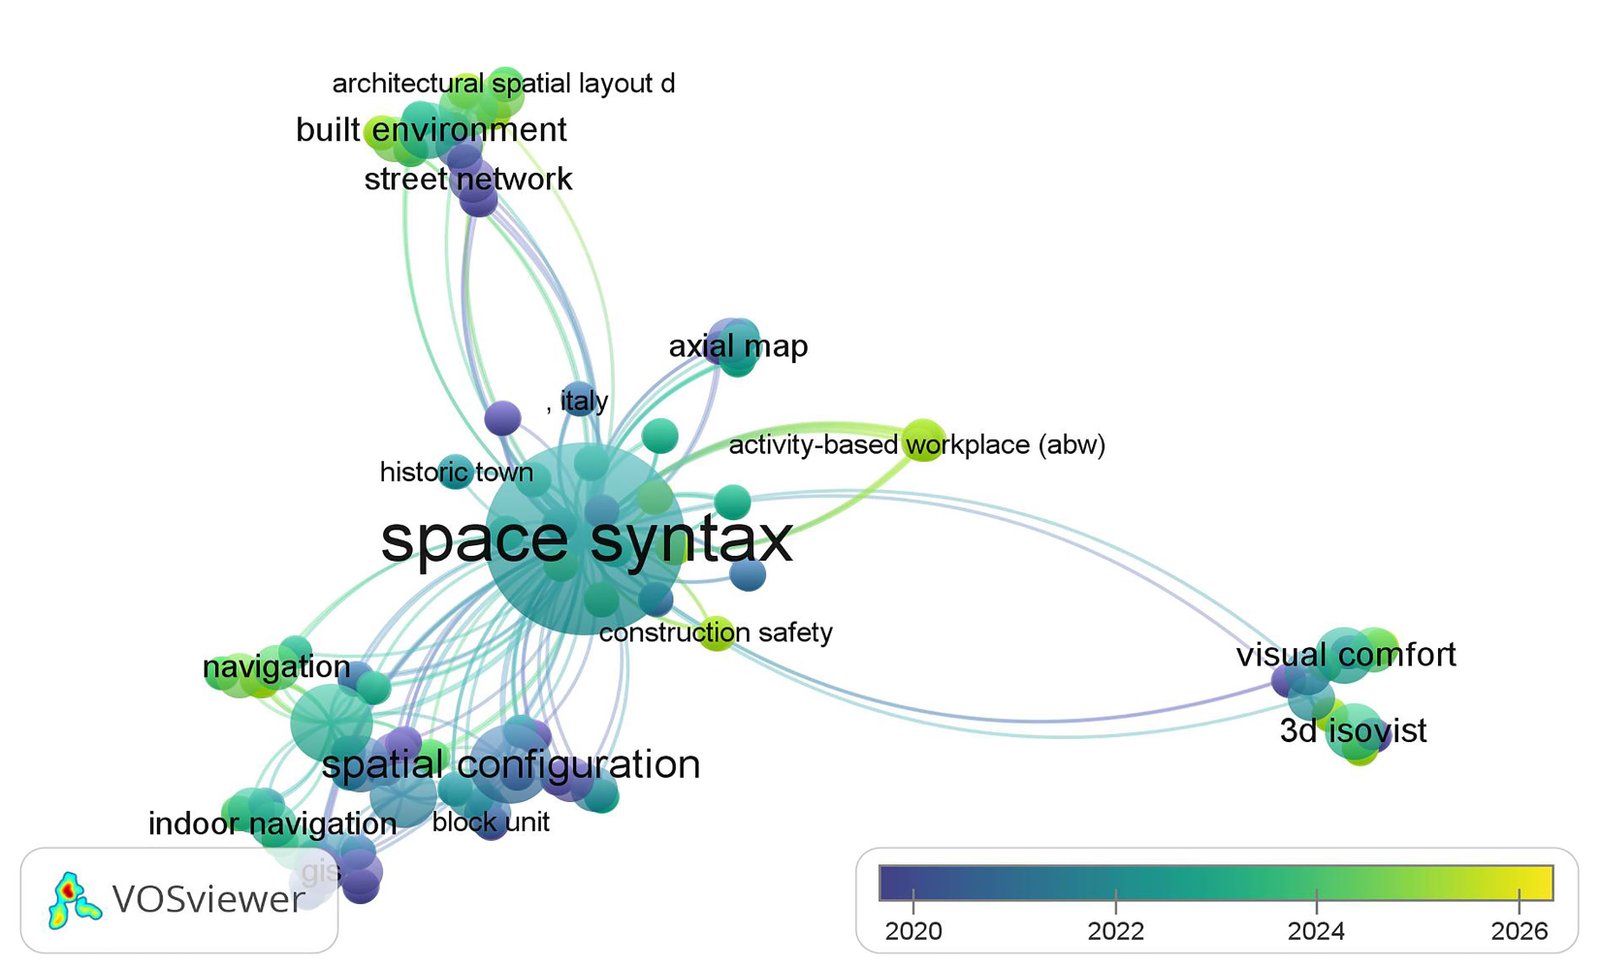
Fig. 3. Visualization of key term density and network in titles, abstracts, and keywords of selected papers on Space Syntax.
2. Materials and methods
As demonstrated in Fig. 4, this research first adopts a systematic review of key concepts in spatial layout, daylighting, and visual quality in architectural design to first identify relevant factors and metrics from existing literature. The research objectives are then established, highlighting critical gaps in the current body of work. A simulation-based methodology is employed to evaluate the impact of seven different school plan layouts, as case studies, on daylight and visual quality metrics. Daylight performance is explored using the Honeybee plugin with the Radiance engine in Grasshopper for Rhinoceros 2D and 3D software (version 7.34) [42]. Visual quality metrics are assessed using Depth Map software and the Isovist tool, with values measured at the central point of each grid [43]. The focus is to understand how variations in school plan layouts influence both daylight distribution and visual quality, ultimately recommending the most effective layout for maximizing daylight benefits and improving educational environments. Quantitative analysis is also performed using SPSS to determine correlations among the metrics, providing deeper insights into the field.
Figure 4
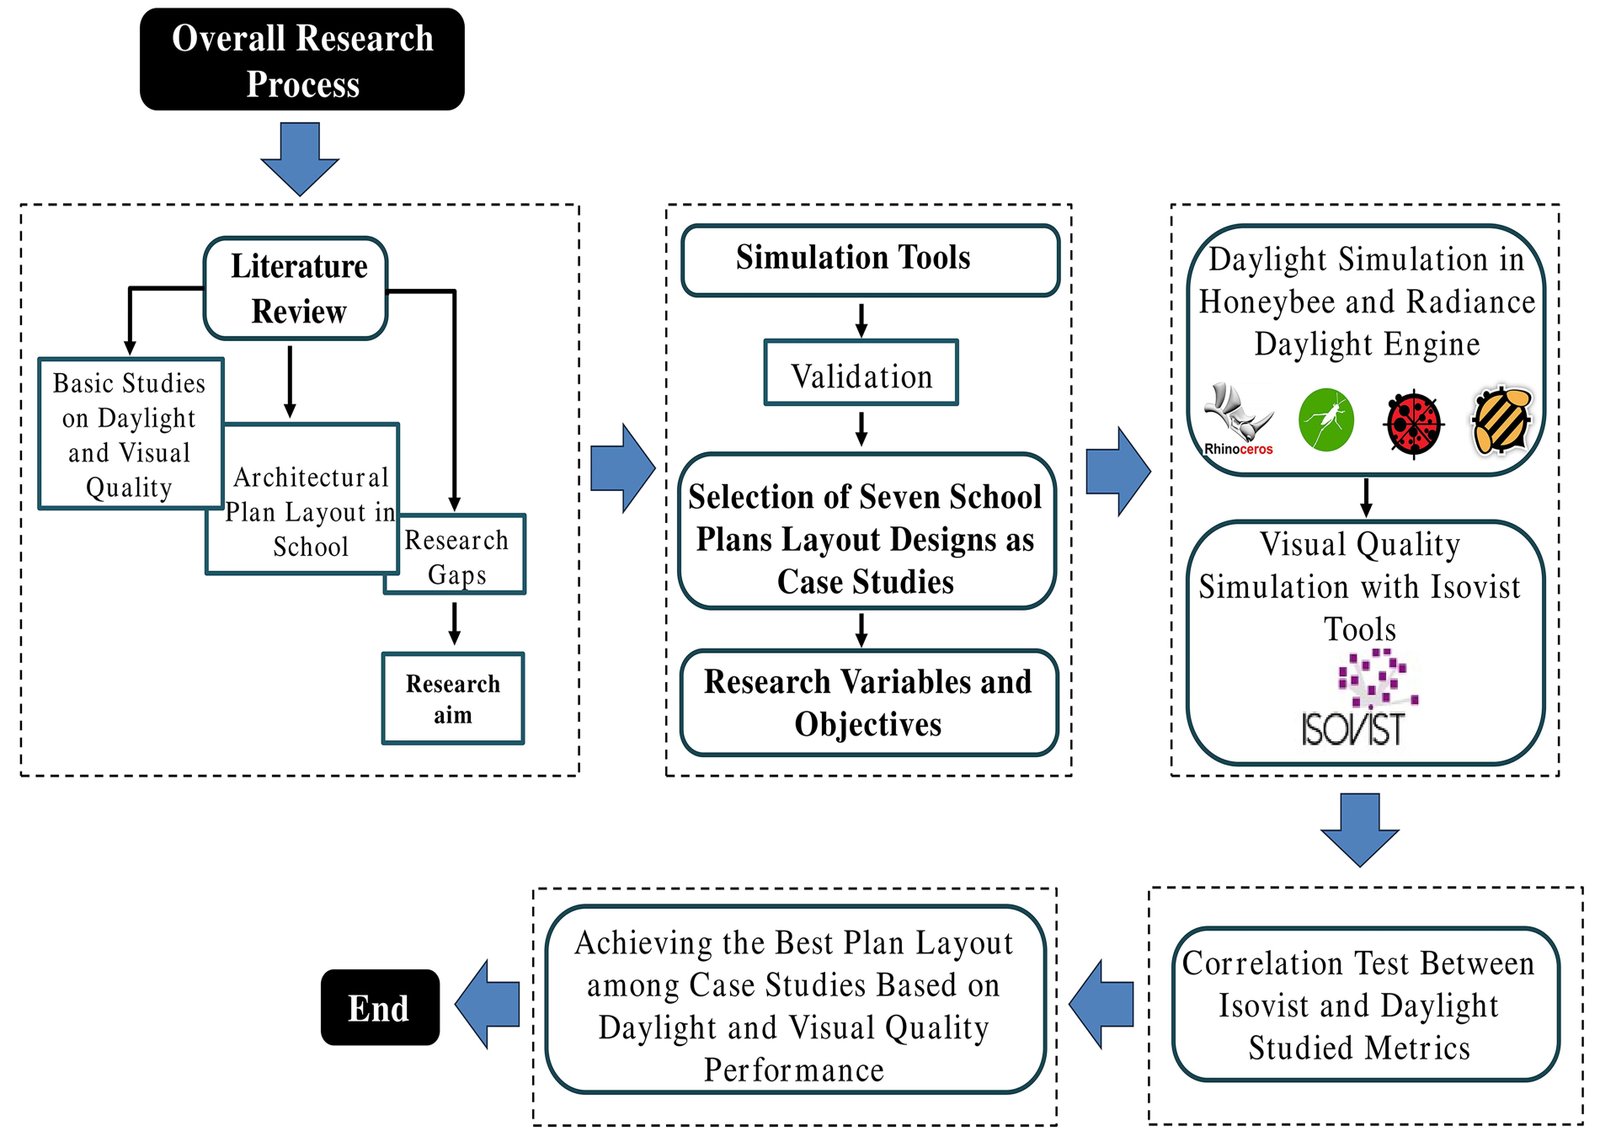
Fig. 4. Overall research methodology framework.
2.1. Simulation tools
The current research utilizes parametric daylight simulations conducted within Rhinoceros, utilizing the Grasshopper and Ladybug Tools (LBTs) plugins [44]. Rhinoceros, developed by Robert McNeel & Associates, is a NURBS-based CAD software that facilitates precise 2D and 3D modelling [45]. Grasshopper, a visual programming plugin for Rhinoceros, supports parametric design and algorithm development, offering extensive flexibility in simulation [46,47]. The Ladybug Tools suite, in combination with Honeybee, enables the importation of location-specific weather data (such as EPW files) for various climates, directly from Energy Plus website. Honeybee, which interfaces with Radiance a widely validated lighting simulation engine employs backward ray tracing for daylight and glare analysis [48,49]. The integration of Ladybug and Honeybee tools offers a comprehensive, unified parametric environment, providing a high degree of flexibility and accuracy, especially when compared to alternatives like Diva and Daysim, supporting early design-stage decision-making [50]. Validation against CIE Test Cases demonstrates that Ladybug and Honeybee tools achieve an accuracy within ±10%, underscoring their reliability for simulating daylight and glare across a range of conditions [51-55]. Moreover, Radiance's ability to model complex geometries, material reflectance, and environmental variables significantly enhances simulation precision, further supported by numerous studies [56-59].
This workflow aligns with the broader trend in daylight simulation research, where simulation-based approaches dominate the field. Moreover, reviews of previous studies highlight the prevalence of Radiance, Rhinoceros, and Grasshopper, along with plugins like Ladybug and Honeybee, as the most frequently used tools, in comparison to other available software solutions. As illustrated in Table 1, in the current research, the Radiance simulation parameters for validation and annual daylight simulations are adopted based on the medium level accuracy setting in the Honeybee plugin, providing a balance between computational efficiency and simulation reliability. In addition to daylight simulations, this research also employs the Isovist tool to evaluate visual quality metrics. Isovist is a visual analysis tool commonly used in architectural design to assess visibility and spatial perception from a specific point within a space. It calculates the observable area by considering obstructions and the geometry of the environment. By measuring the extent of the visible surroundings from a given location, Isovist helps analyze factors such as visual accessibility, sightlines, and spatial connectivity. This tool is particularly useful in visual quality studies, where understanding sightlines and spatial perception plays a critical role, as is the case in the present research [35].
Table 1
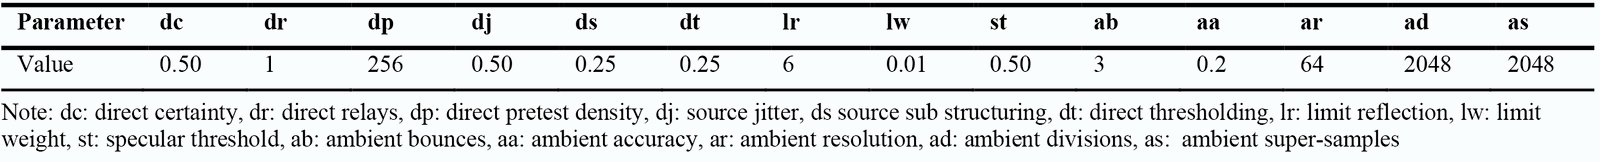
Table 1. Radiance simulation parameters in validation and annual simulation process.
2.1.1. Validation
The current research employs a methodology that validates daylight simulations by comparing simulation results of illuminance (lux) with field measurements taken with a lux meter in an actual school classroom in Tehran, Iran. For this purpose, a classroom measuring 4 × 16 × 15 m (height × length × width) is selected, as shown in Fig. 5 (c and d). The room has a south-facing window located 1.2 meters above the floor, aligned with the north-south axis. The walls are painted white, and the floor is cemented.
Figure 5
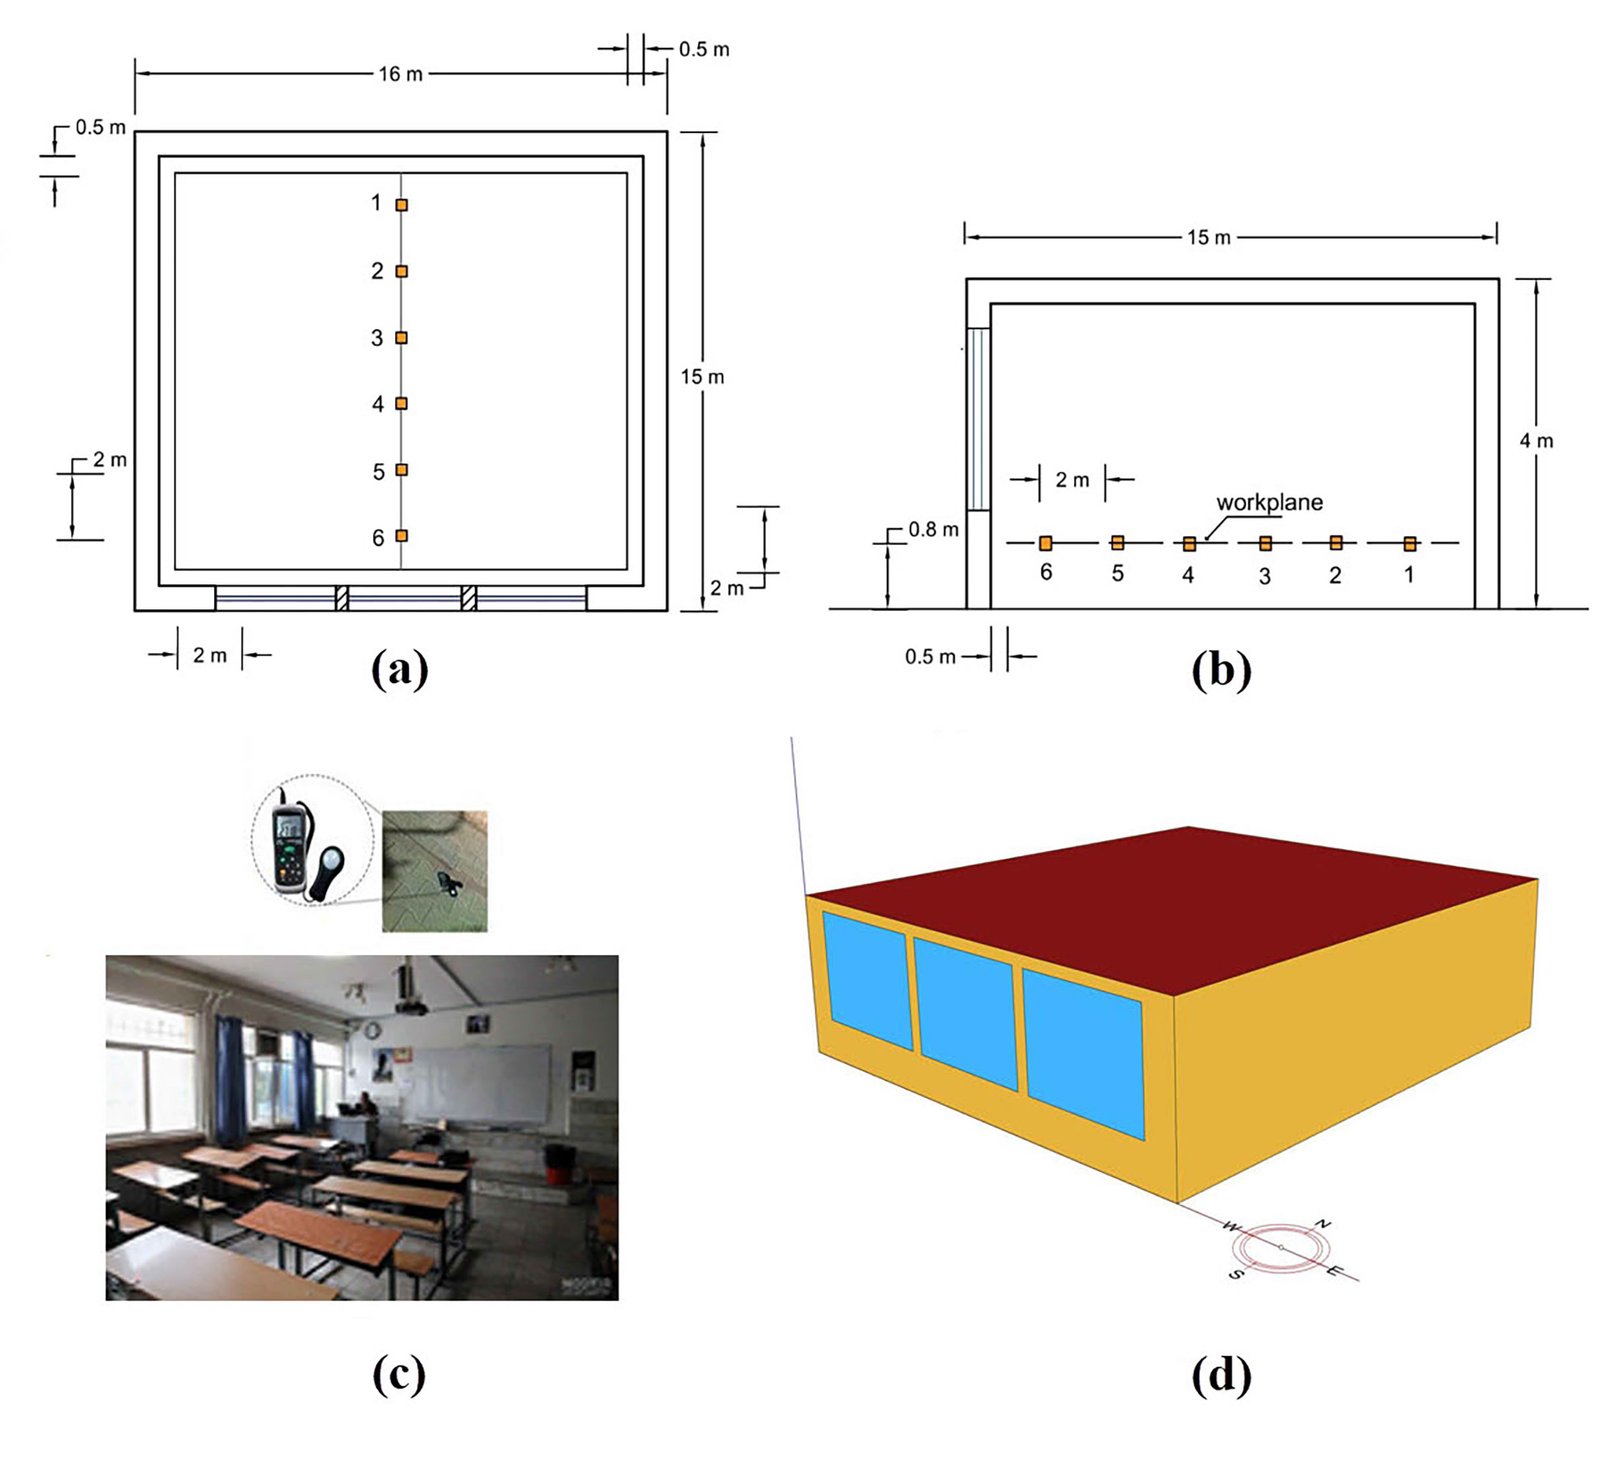
Fig. 5. (a) plan view of Illuminance points measured by Lux meter. (b) section view of measured Illuminance measuring. (c) a perspective view of the real classroom. (d) The model created in Honeybee for daylight simulation.
Illuminance (Ep) values are measured at six points across the room at 9:00 a.m, 12 p.m. and 3 p.m. on June 21st, September, December, and March, under natural daylight conditions (without artificial lighting). Efforts are made to eliminate any potential sources of error during both the measurement and simulation phases. Due to potential variations in natural light conditions during sequential measurements at different points with a single lux meter, which could affect the accuracy of comparing measured and simulated data, the measurements are taken at only six central points within the room (as shown in Fig. 5 (a and b)). These central locations are specifically chosen to minimize the impact of spatial variations in daylight distribution and reduce discrepancies caused by light intensity fluctuations at the room’s edges, ensuring more consistent and reliable measurements for accurate comparison with simulation results. Additional details of the experiments, simulations, and the test room are provided in Table 2, for further clarification. Finally, the measured data are compared with the simulation results, as shown in Figs. 6 and 7, illustrates the correlation between the results.
Figure 6
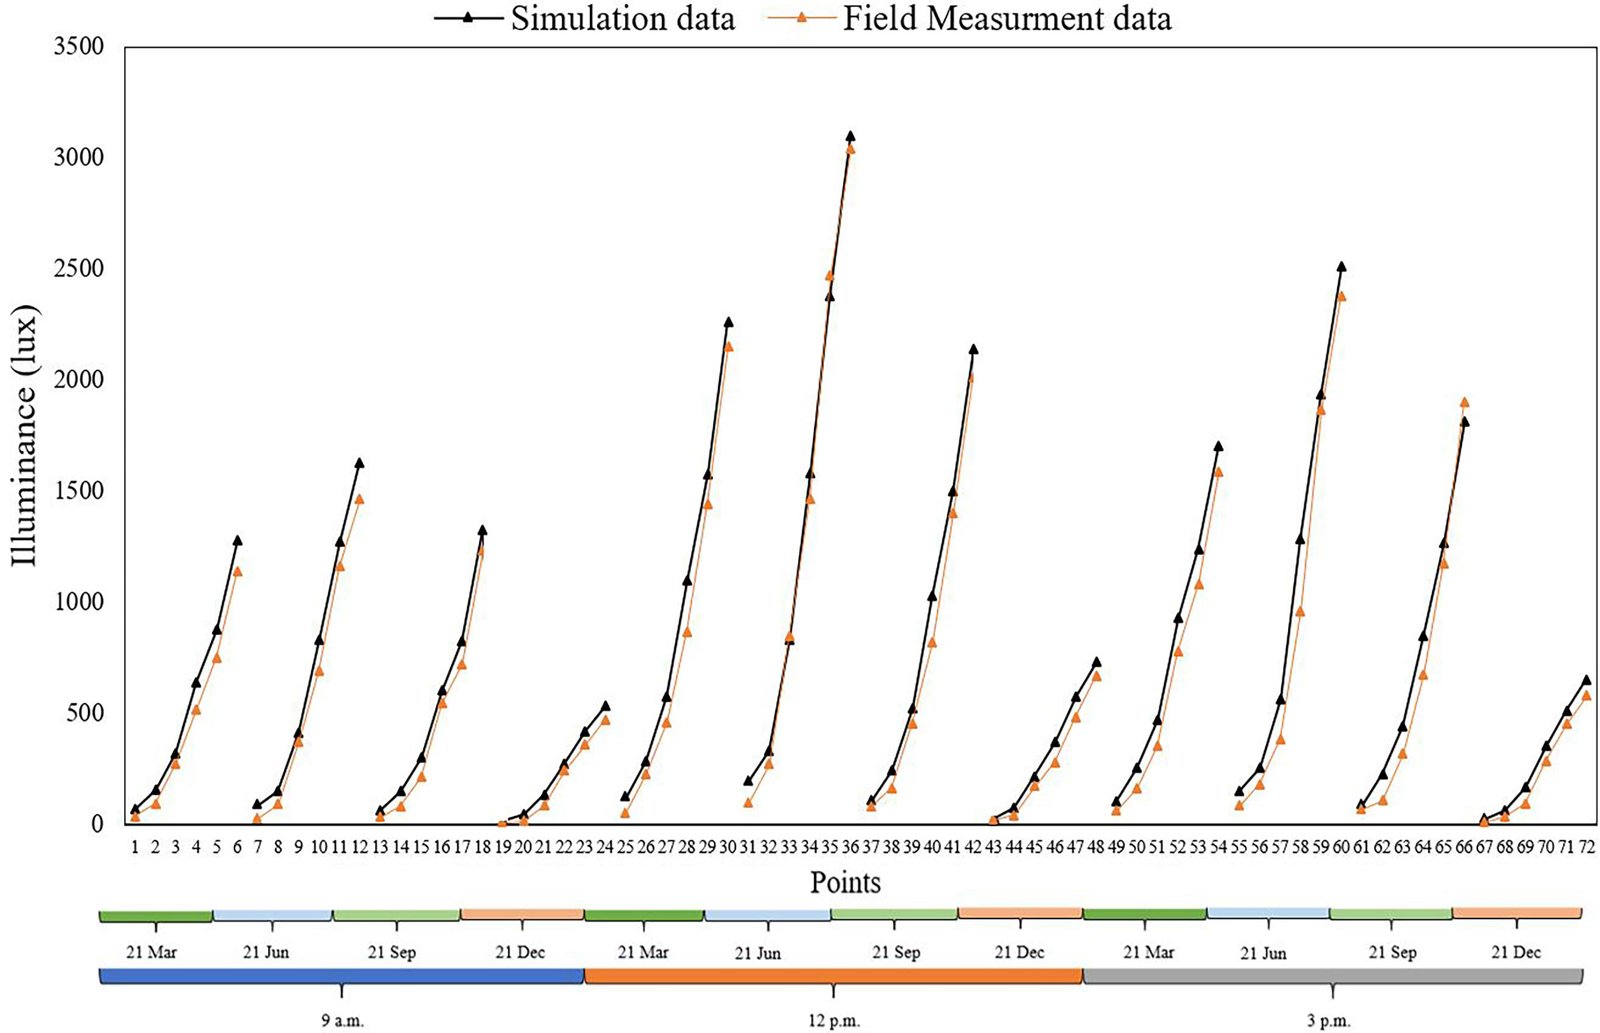
Fig. 6. The comparison between the measurement and simulation illuminance results for selected points in the real classroom on 21 Jun, September, December, March at 9 a.m. 12 p.m. 3 p.m.
Figure 7
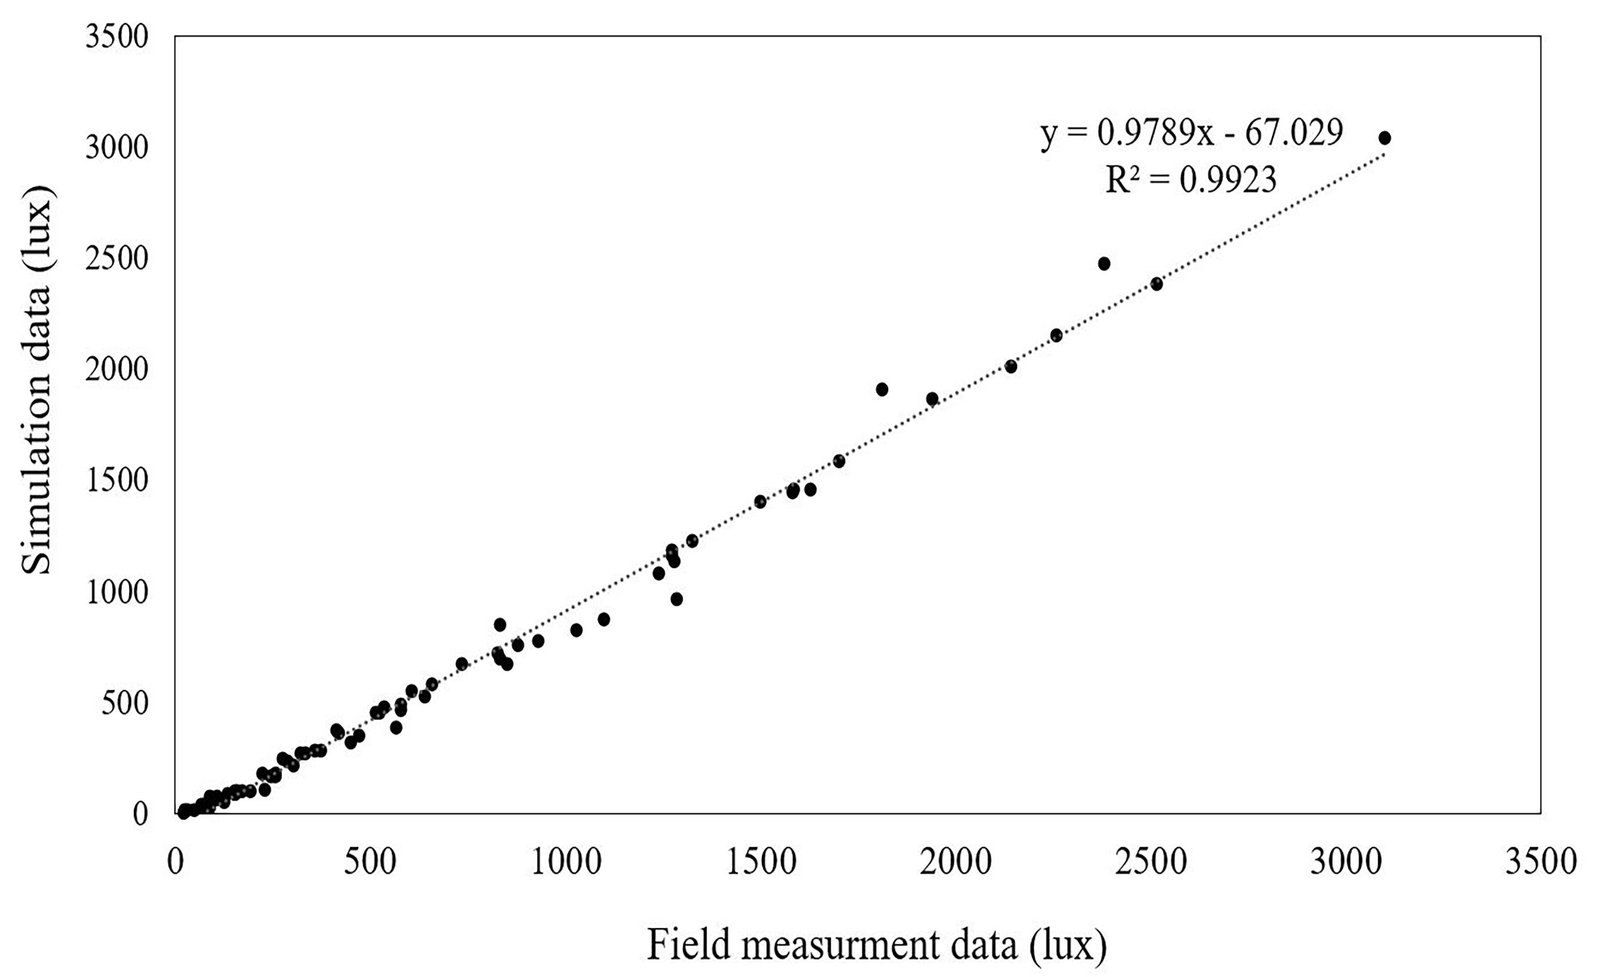
Fig. 7. The scatter diagram and correlation between the measurement and simulation illuminance data for selected points in the real classroom on 21 Jun, September, December, March at 9 a.m. 12 p.m. 3 p.m.
Table 2
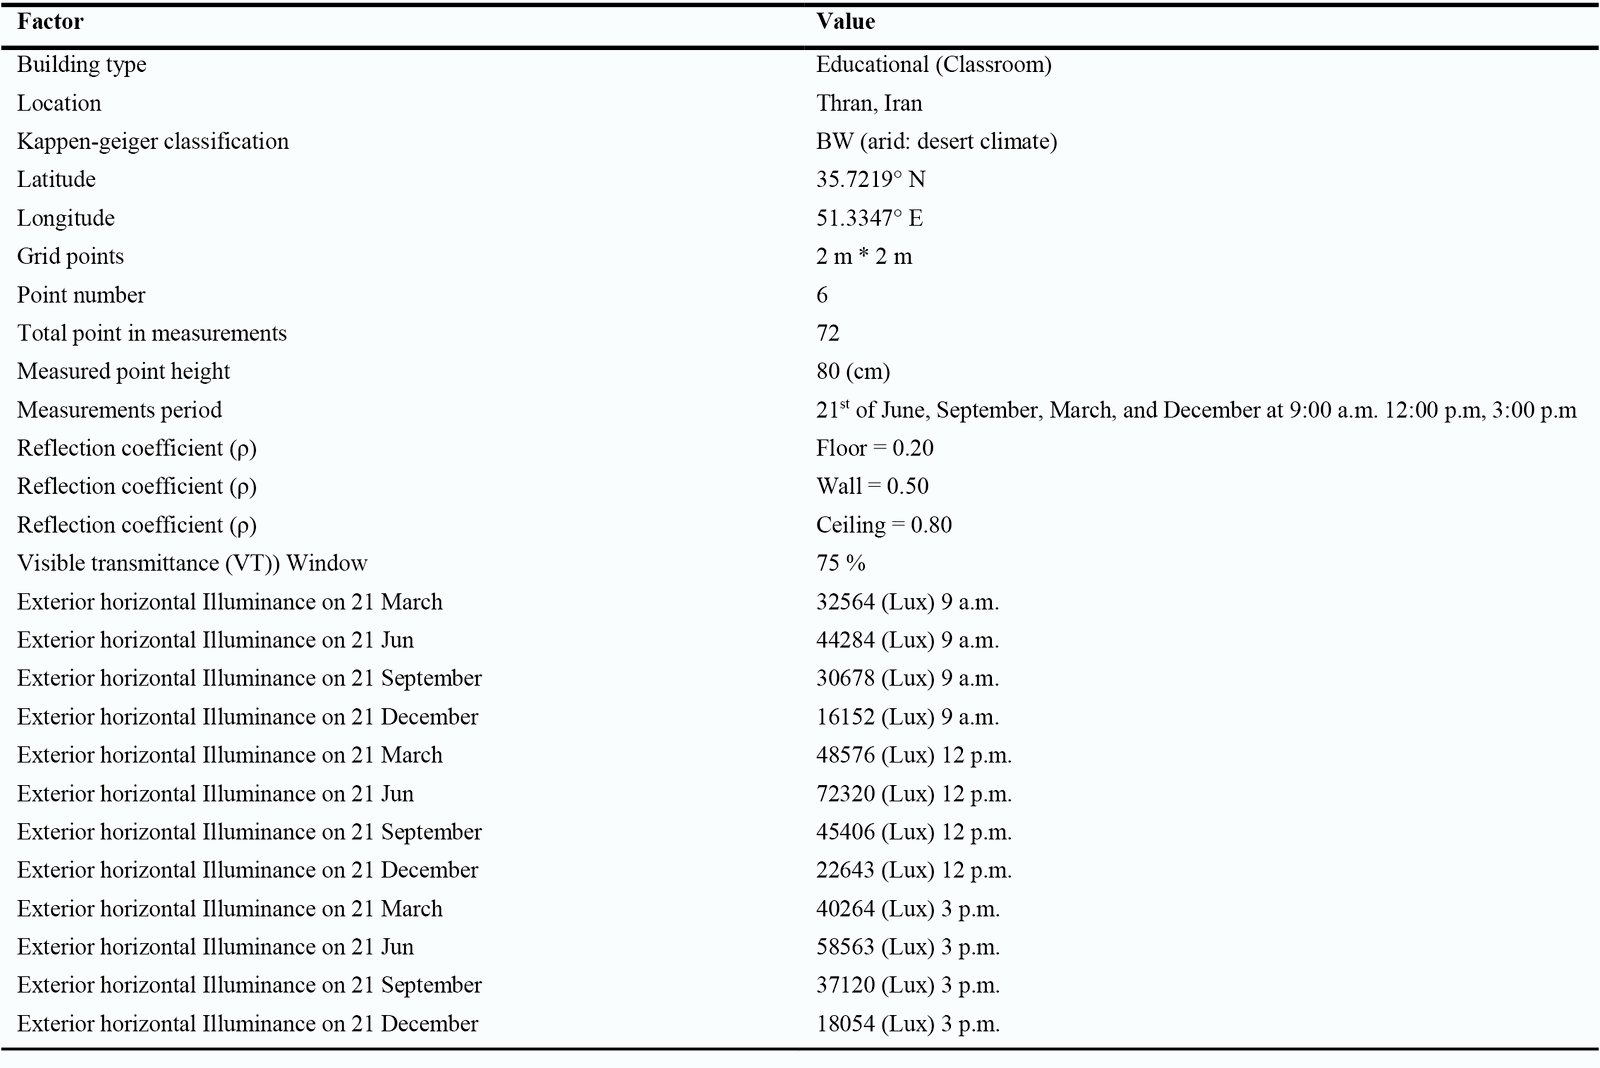
Table 2. Daylight simulation details in validation process for the real classroom.
The results presented in Fig. 6 reveal a close agreement between the simulation data (black line) and the field measurement data (orange line), with only minor discrepancies between corresponding values. Both datasets exhibit similar periodic patterns, reflecting the fluctuations in illuminance at various points in time. This close alignment validates the accuracy of the simulation model in forecasting real-world illuminance levels. The average illuminance for the simulation data is 726 lux, while the field measurement data shows an average of 644 lux, with a minimal average difference of just 1.12 lux. These findings underscore the simulation model's strong predictive capability. Additionally, Fig. 7 demonstrates a robust positive correlation between the field and simulation data, further supported by high R² value, which confirm the reliability of the simulation model in accurately replicating field measurements. Furthermore, regarding the Isovist tool, previous studies have confirmed correlations between Isovist indicators and both experiential and measured properties in spatial exploration. For example, Ostwald and Dawes used Isovist analysis to examine spatial and visual patterns in Frank Lloyd Wright’s Prairie houses, finding a significant correlation with the prospect-refuge theory [42]. Wiener et al. demonstrated the effectiveness of Isovist analysis in predicting experiential qualities and human movement within architectural spaces [40,60,61]. In a similar vein, Wiener and colleagues further validated the utility of Isovist analysis, showing it to be a promising tool for forecasting architectural experiences and user movement in space [42].
2.2. Case study
Building on the simulation workflow, the analysis is applied to the specific architectural case studies illustrated in Figure 8: seven school plan layouts. These case studies are adopted from the paper School Building Planning: Main Types of Systems (Plans) of School Buildings by E. Ivanova [62]. The study provides an in-depth exploration of various architectural typologies for school buildings, focusing on the main types of school building systems and their design principles. The selected layouts in this study correspond to high school, as the paper primarily addresses school buildings for students in these age groups. Each plan layouts include specific dimensions and window-to-wall-ratio (WWR) with certain factors, such as the position of windows and openings, are kept constant across all layouts to minimize external influences on the results. The main difference between the case studies is the interior arrangement and partitioning. The detailed simulation parameters, including surface materials, analysis period, work plane height, grid points, north orientation, and others, are presented in Table 3 and Fig. 9.
Figure 8
![The interior school plan layouts for seven specific case studies adapted from [62].](figures/13-20-8.jpg)
Fig. 8. The interior school plan layouts for seven specific case studies adapted from [62].
Table 3
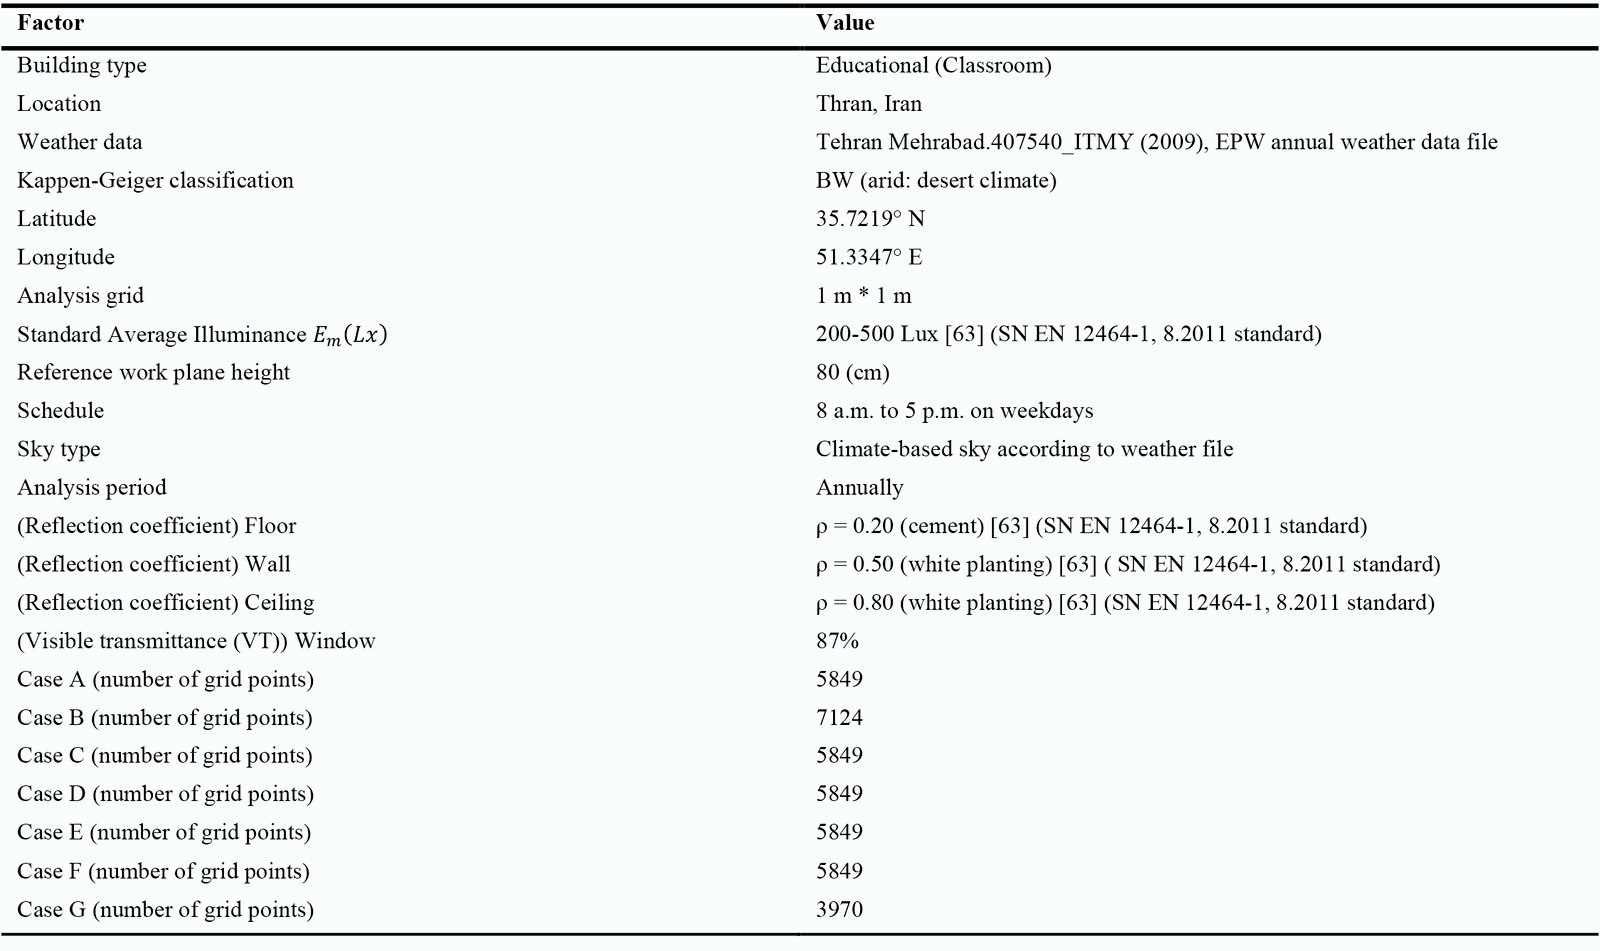
Table 3. Daylight simulation details in annual simulation process for the school plan layouts.
Figure 9
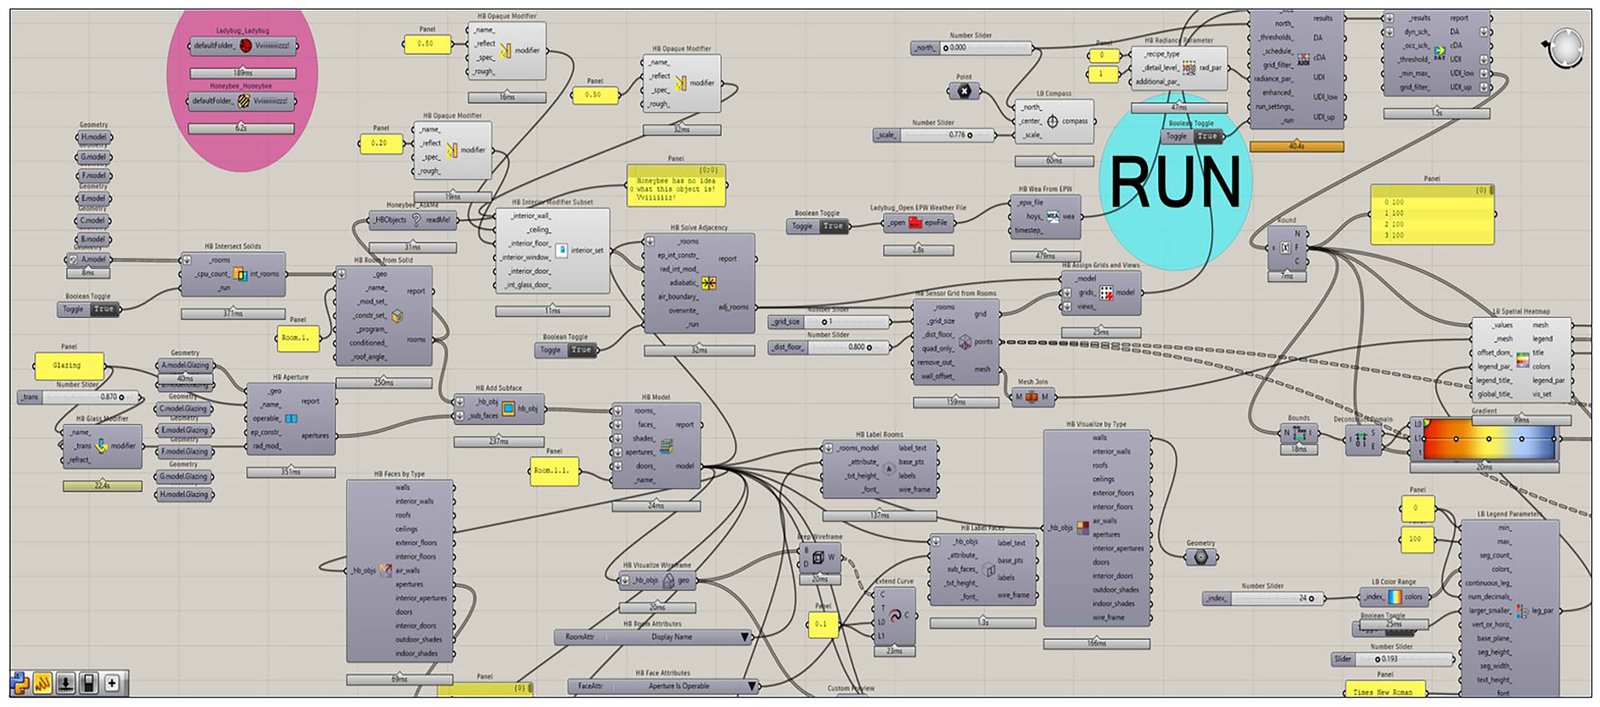
Fig. 9. Detailed daylight simulation algorithm developed in Grasshopper for the annual simulation process of the school plan layouts.
2.3. Research objectives
To measure daylight distribution in one space, climate-based daylight metrics (CBDM) are one kind of daylight measures that uses meteorological data from the area to produce quantitative performance forecasts. Daylight Autonomy (DA) and Usable Daylight Illumination (UDI) are the two most well-established techniques with this respect [65]. One alternative daylighting metric to DA is the Useful Daylight Index (UDI), a metric that measures how much (percentage (%) between 0 to 100) daylight is useful for occupants over the course of a year in each point, which has lower and higher limitations of 100 lux and 2000 lux, respectively. These two values divide the year into three bins. Periods with "too little" sunshine are indicated by the lower bin (UDI<100 lux), "useful" daylight is indicated by the middle bin (UDI 100–2000 lux), and times with an excess of daylight that could cause discomfort (visual or thermal) are indicated by the upper bin (UDI>2000 lux). For instance, Mardaljevic subsequently modified the upper limit to 3000 lux and the lower limit to 300 lux [66]. These metrics have alternative ranges. The current research employs UDI and DA, as these metrics are widely used in daylight simulation studies due to their diverse benefits and effectiveness in measuring daylight in space. Table 4, and equations 1, 2, and 3 present a more detailed breakdown of these daylight metrics, with illuminance serving as the primary daylight meter that these two are based upon. In regards to visual quality metrics, Isovist analysis is used to model visibility and spatial perception, and it depends on both the geometry of the space and the observer's location [64] . Furthermore, in this research, six Isovist indices, as described in Table 5 and Fig. 10, are considered for evaluating visual quality. Within the building, the Isovist generates a regular geometric grid. The center of each grid cell, typically at the observer’s eye level, defines an Isovist polygon. The mathematical properties of these polygons such as visibility, shape, and size are recorded and can be compared across different locations. These properties vary based on the spatial geometry and the observer's position, making each Isovist distinct in this analysis [42].
\( With\ wfi\ =\ \cases{ 1\ \ \ \ if\ Edaylight\geq Elimit \cr 0\ if\ Edaylight\ \lt Elimitimit } \)
or \( 100\% \times DA\ =\ \frac{working\ hours\ with\ daylight\ illuminance \gt threshold}{total\ working\ hours} \)
where ti is the each occupied hour in a year, wifi is the weighting factor depending on values of E Daylight and E limit, E Daylight is the horizontal illuminance at a given point due to the sole daylight, and E limit is the horizontal illuminance at a given point due to the illuminance limit value.
\( UDI\ overlit=\ With\ wfi\ \cases{ 1\ \ \ \ if\ Edaylight\gt Eupper\ limit \cr 0\ \ \ \ if\ Edaylight\ \le Eupper\ limit } \)
\( UDI\ useful\ =\ with\ wfi \cases{ 1\ \ \ \ \ if\ Elower\ limit\le Edaylight \le Eupper\ limit \cr 0\ \ \ \ if\ Edaylight\ \lt Elower\ limit\ V\ Edaylight \gt Eupper\ limit } \)
\( UDI\ underlit=\ with\ wfi\ \cases{ 1\ \ \ \ \ if\ Edaylight \gt Elower\ limit \cr 0\ \ \ \ if\ Edaylight\ \geq Eupper\ limit } \)
Table 4
![Daylight metrics to assess natural light quantity, distribution, and direct sunlight [65,66].](figures/13-20-21.jpg)
Table 4. Daylight metrics to assess natural light quantity, distribution, and direct sunlight [65,66].
Table 5
![Visual quality metrics related to spatial experience in current research [42].](figures/13-20-22.jpg)
Table 5. Visual quality metrics related to spatial experience in current research [42].
Figure 10
![Schematic description of Isovist metrics at an observer station point [42].](figures/13-20-10.jpg)
Fig. 10. Schematic description of Isovist metrics at an observer station point [42].
3. Results
Figure 11, show the daylight performance (accepted UDI) across seven school plan typologies, utilizing advanced simulations to evaluate both the quantity and quality of natural lighting. Annual simulations reveal substantial variations in daylight distribution across the seven school models, highlighting the impact of architectural configuration on indoor daylight distribution. According to this Figure, Model A offers strong daylight at the perimeter but suffers from under-illumination in interior zones due to its compact layout. Model B’s multiple pavilions provide high daylight in individual units but may challenge internal circulation.
Figure 11
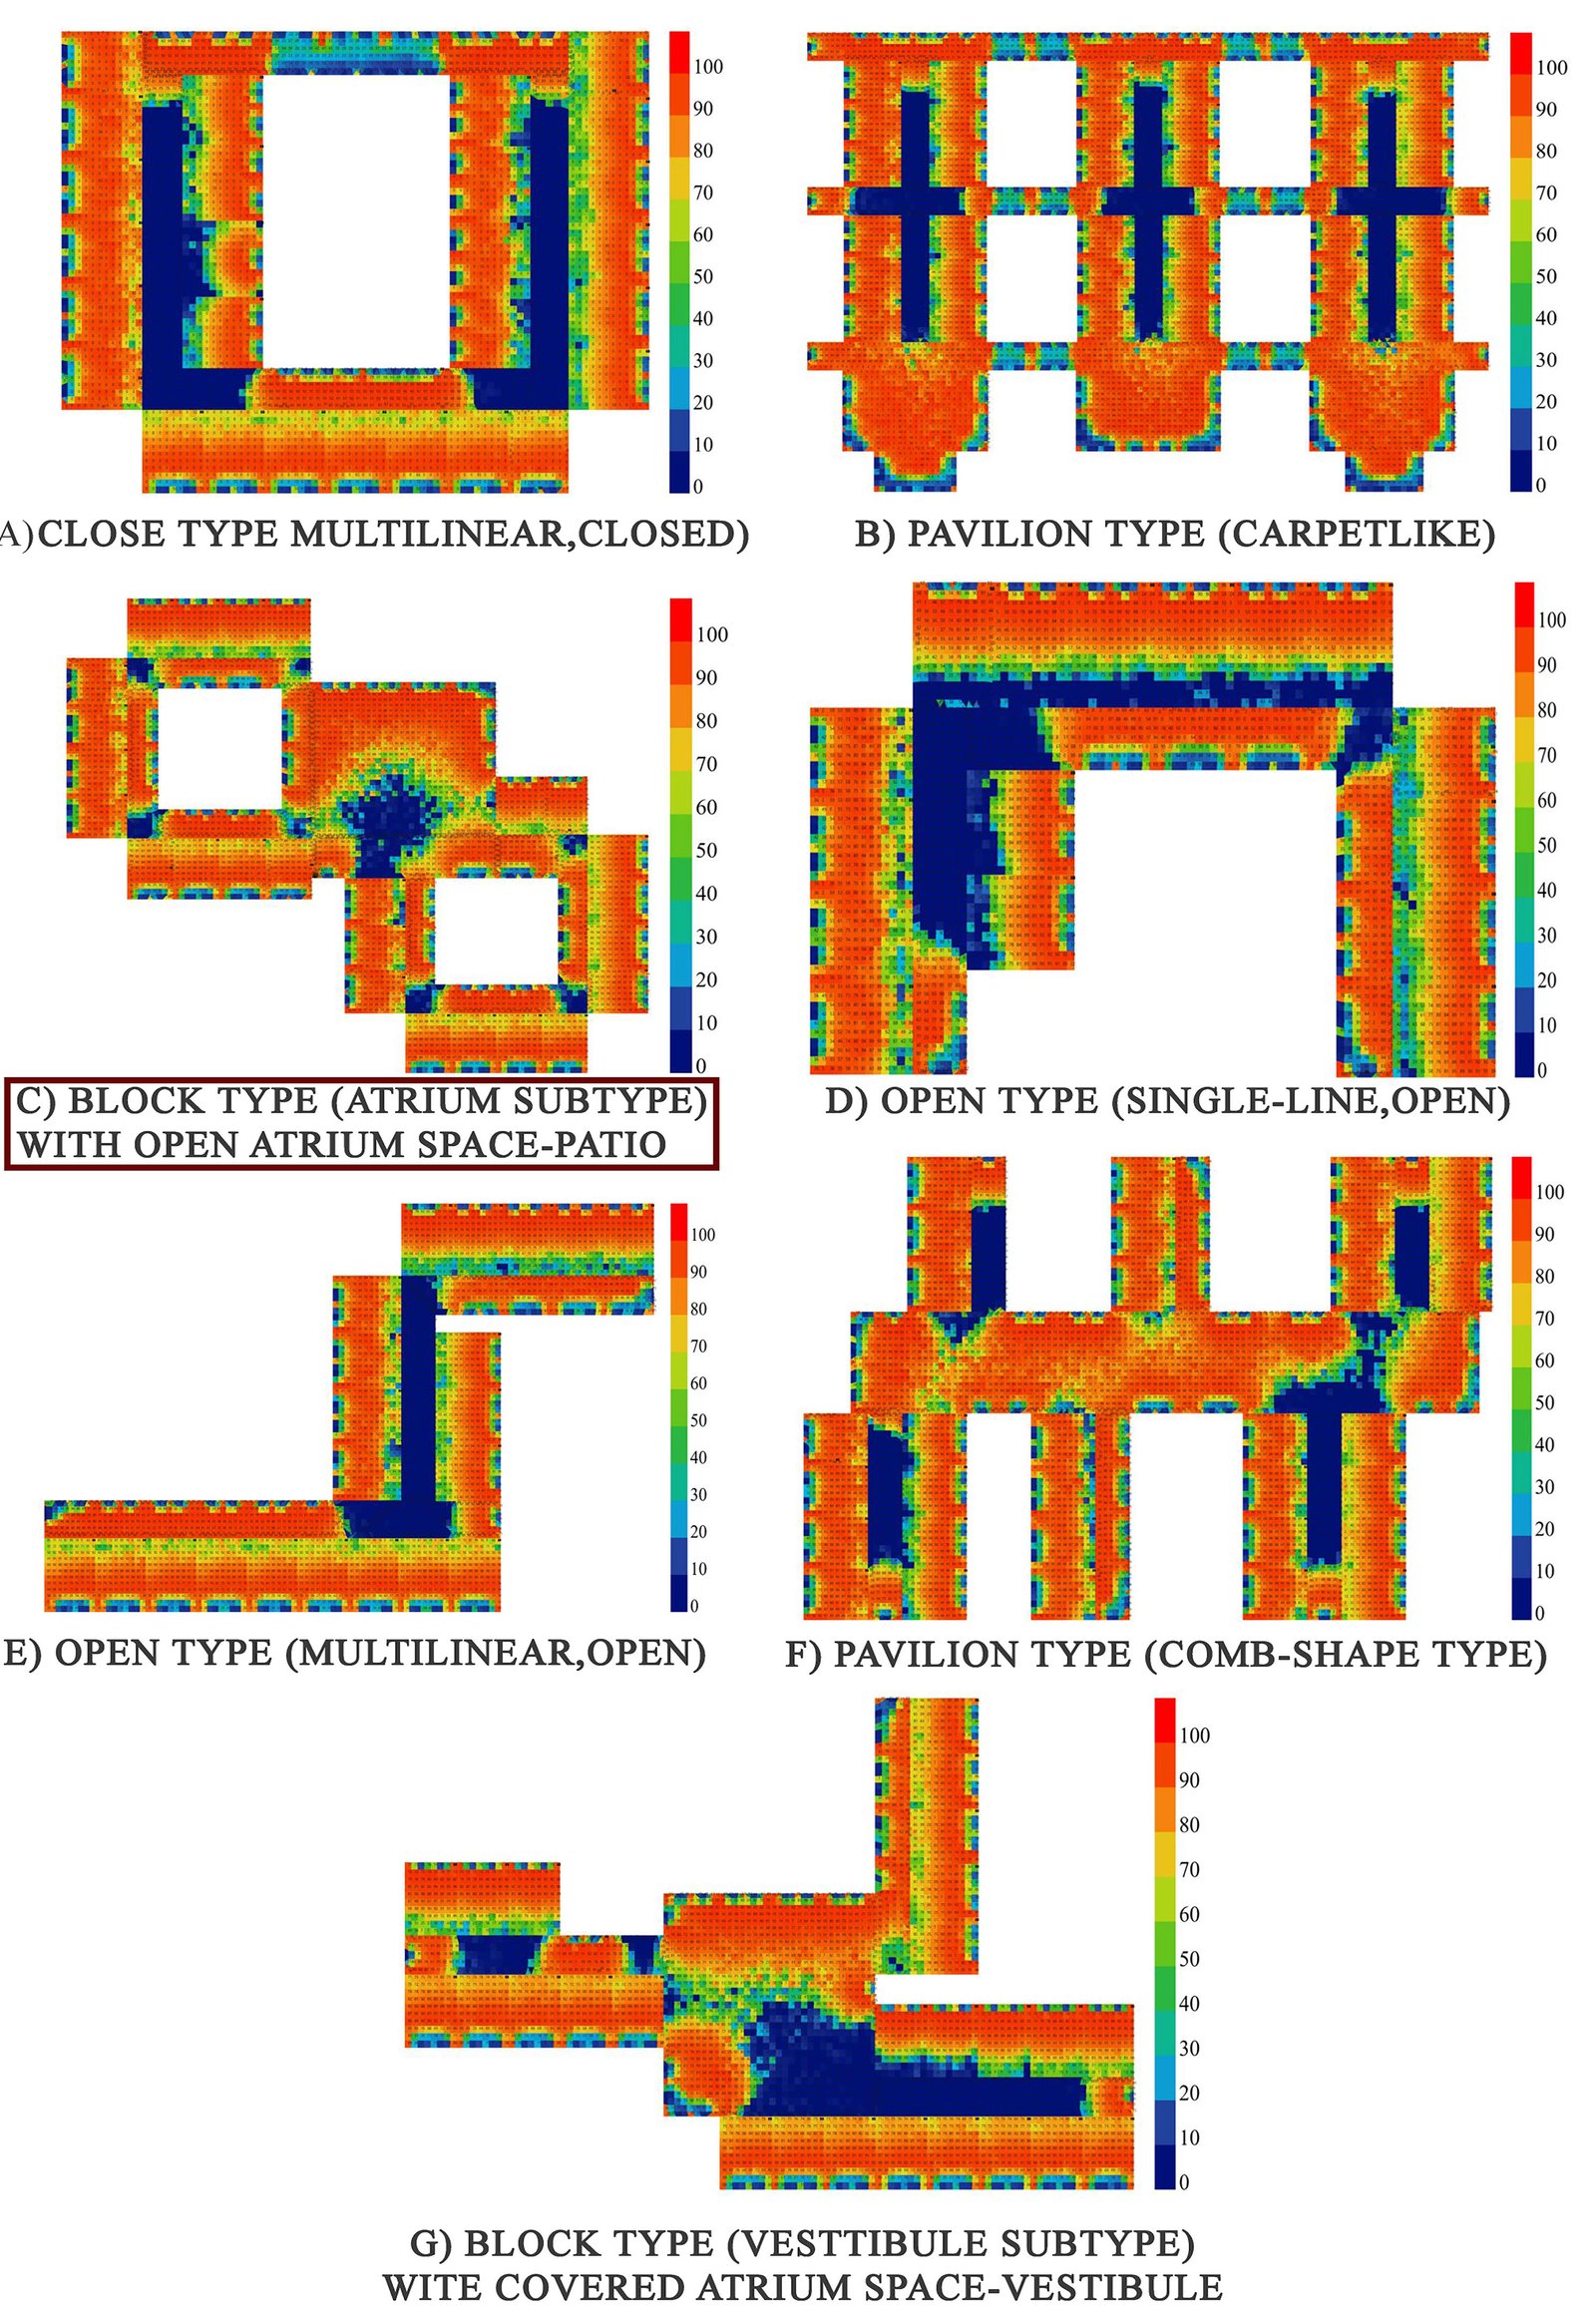
Fig. 11. The heatmaps results of UDI (100
Model C (shown in rectangular red mark), with a central courtyard and atrium, achieves balanced daylight penetration into deeper areas, combining perimeter daylight access with diffused interior lighting, though atrium effectiveness depends on its design. Model D ensures uniform daylight across classrooms due to its slender plan depth but requires a larger building envelope, increasing construction and thermal loads. Model E’s multi-wing layout allows daylight from both sides, though careful spacing is needed to avoid mutual shading. Model F shows strong daylight in extended linear elements, while the connecting spine experiences variation, requiring design attention. Model G’s central atrium provides perimeter daylight but relies heavily on other glazing and shading strategies for interior illumination.
Results reveal that Models with high perimeter-to-area ratios, such as Models D, E, and F, achieve uniform daylight distribution but require more extensive building envelopes, which may increase construction costs and thermal loads.
Conversely, more compact models like Model A and Model G struggle to deliver sufficient daylight to interior zones without additional design strategies. Models with courtyards or atriums, like Model C and Model G, extend daylight penetration into deeper areas, but the success of these features depends on their size, proportions, and how well they are integrated into the overall building design. Compared to all models, model C stands out as a strong performer due to its balanced approach, combining perimeter daylight access with deeper penetration through the atrium, offering a flexible and effective design layout for maximizing indoor daylight distribution and advantages. Furthermore, a detailed evaluation of the visual quality and spatial perception characteristics across seven school plan typologies through Isovist analysis is presented in Table 6. Isovist analysis quantifies the geometric properties of visible space from observer positions within the architectural environment, using six distinct metrics: Connectivity, Isovist Area, Drift Angle, Maximum Radial Line, Minimum Radial Line, and Visual Mean Depth. These metrics reveal critical aspects of spatial organization, visual accessibility, and navigational clarity that influence occupant experience and pedagogical quality. Connectivity values, which measure the number of distinct spatial zones visible from observation points, show substantial variation among the models. Model C (highlighted in green color) emerges as the most balanced design, offering high connectivity (586.05), expansive Isovist area (373.80 m²), moderate drift angle (181.95°), substantial maximum radial line (30.13 m), and generous minimum radial line (2.16 m).
Table 6
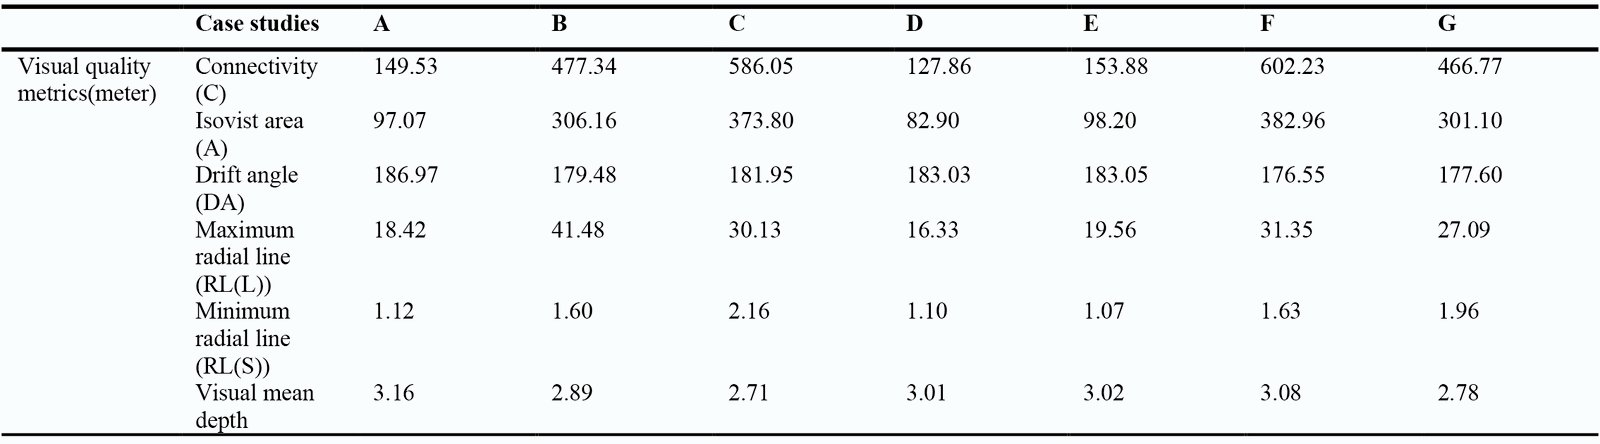
Table 6. Numerical results of visual quality metric in case studies.
This combination supports intuitive navigation, visual integration, and flexible learning environments without spatial restrictions. Model F achieves the highest connectivity (602.23) and Isovist area (382.96 m²), reflecting its comb-shaped layout that promotes multiple sightlines, social interaction, and passive supervision. Its drift angle (176.55°) indicates an intuitive spatial flow, though the high openness may pose challenges for acoustic control. Models B and G present moderate connectivity (≈500) and Isovist areas (301–306 m²), providing a balance between visual openness and functional adaptability. They maintain considerable sightlines while preserving spatial coherence. In contrast, Models A, D, and E exhibit lower connectivity (127.86–153.88) and smaller Isovist areas (82.90–98.20 m²), with higher drift angles (up to 186.97°) and shorter radial lines. The analysis highlights the importance of balancing visual openness, connectivity, and spatial organization to enhance the occupant experience. Compared to all models, model C emerges as the most well-rounded option, offering both visual accessibility and intuitive navigation while avoiding the spatial limitations found in more enclosed typologies like Models A, D, and E.
4. Discussions
4.1. daylight performance
The boxplots in Fig. 12 summarize the annual behavior of four key daylight metrics, DA, UDI, UDI-up, and UDI-low, across seven school layouts, providing a detailed view of daylight quantity, quality, and temporal stability. According to this Figure, DA values are generally high across most models (median ~80–95%), indicating that recommended illuminance levels are met for a substantial portion of occupied hours. Models C and F demonstrate the strongest performance, with consistent daylight sufficiency reflecting effective design layouts and well-organized spatial layouts. In contrast, Models D and G show lower DA values, pointing to limited daylight penetration. Furthermore, UDI analysis reinforces these distinctions: Median UDI values (≈75–90%) indicate overall adequate daylighting, with Model C achieving the highest conformity to the recommended 100–2000 lux range and low temporal variability, supporting stable visual comfort. Models F and E perform well, while Models D and G show larger fluctuations and higher underlit durations. UDI-up values remain below 10% for most models, though Models B and C occasionally exceed 2000 lux, which can be managed with other daylight strategies such as shading. UDI-low distributions highlight underlit conditions: Models D and G experience 30% to 50% of hours below minimum illuminance, whereas Models C and F remain within 10–20%, demonstrating robust daylighting reliability. These findings indicate a clear hierarchy: Model C provides the most balanced daylighting solution, combining high sufficiency, low underlit incidence, and manageable overexposure. Models F and E offer well-distributed and stable daylight, Models A and B are intermediate with some glare risk, and Models D and G are the lowest performers, suggesting the need for design interventions such as recalibrated window-to-wall ratios, enhanced aperture distribution, or adaptive shading.
Figure 12
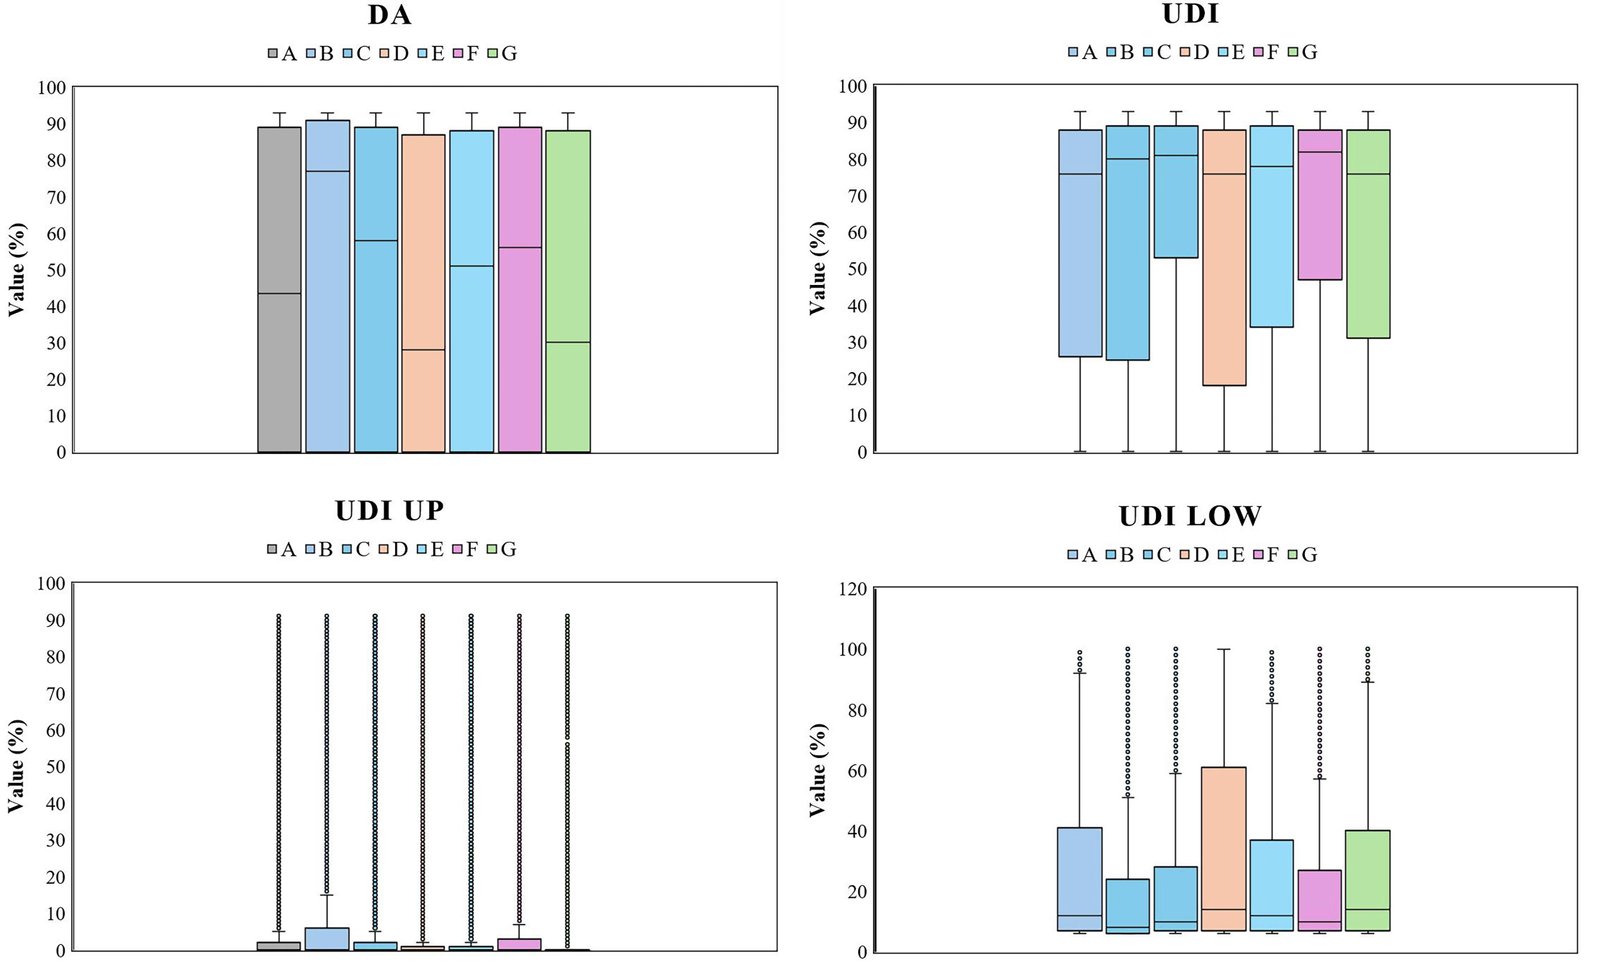
Fig. 12. All daylight metrics results including minimum, maximum, and mean for each school layout plan.
These results emphasize the critical role of spatial and architectural layout in achieving effective daylighting and supporting occupant well-being in schools. The clear differences between the models show that daylight-responsive design should be considered early in the architectural process to improve visual quality, daylight benefits, and support the well-being of building users in schools. Furthermore, Fig. 13 illustrates the average annual daylighting metrics across the seven school models, highlighting distinct differences in daylight performance. Based on this Figure, Model C consistently outperforms others, achieving the highest UDI (68.17%) and DA (52.93%), alongside the lowest UDI-low (22.89%), indicating minimal underlit conditions and reduced dependence on artificial lighting. Its UDI-up (7.15%), while not the lowest, remains within an acceptable range and can be mitigated with targeted other daylight strategies such as shading. These results reflect the effectiveness of internal plan layout for Model C in balancing daylight sufficiency, comfort, and stability. Models E and F also demonstrate strong performance, with UDI values of 62.41% and 64.7%, and DA of 46.85% and 46.26%, respectively. Their moderate UDI-low values (27.95% for E, 25.35% for F) indicate reliable daylight availability, while UDI-up values (8.53% and 8.78%) suggest manageable over-lit zones. These characteristics position them as robust alternatives to Model C (highlighted in green color), providing consistent and balanced daylighting conditions. Models A and B fall in an intermediate range. Their UDI (58.15% and 60.26%) and DA (43.71% and 46.98%) indicate generally adequate daylighting, though higher UDI-up (12.85%) in Model B signals greater sensitivity to over-illumination, whereas UDI-low (31.07%) in Model A reflects larger underlit areas due to spatial layout limitations. At the lower end, Models D and G consistently underperform. Despite moderate UDI averages (57.48% for D, 60.1% for G), their DA values (42.9% and 41.29%) and elevated UDI-low (33.82% and 31.03%) reveal substantial periods of inadequate daylight, indicating ineffective daylight capture. Their moderate UDI-up values result from insufficient daylight rather than controlled illumination.
Figure 13
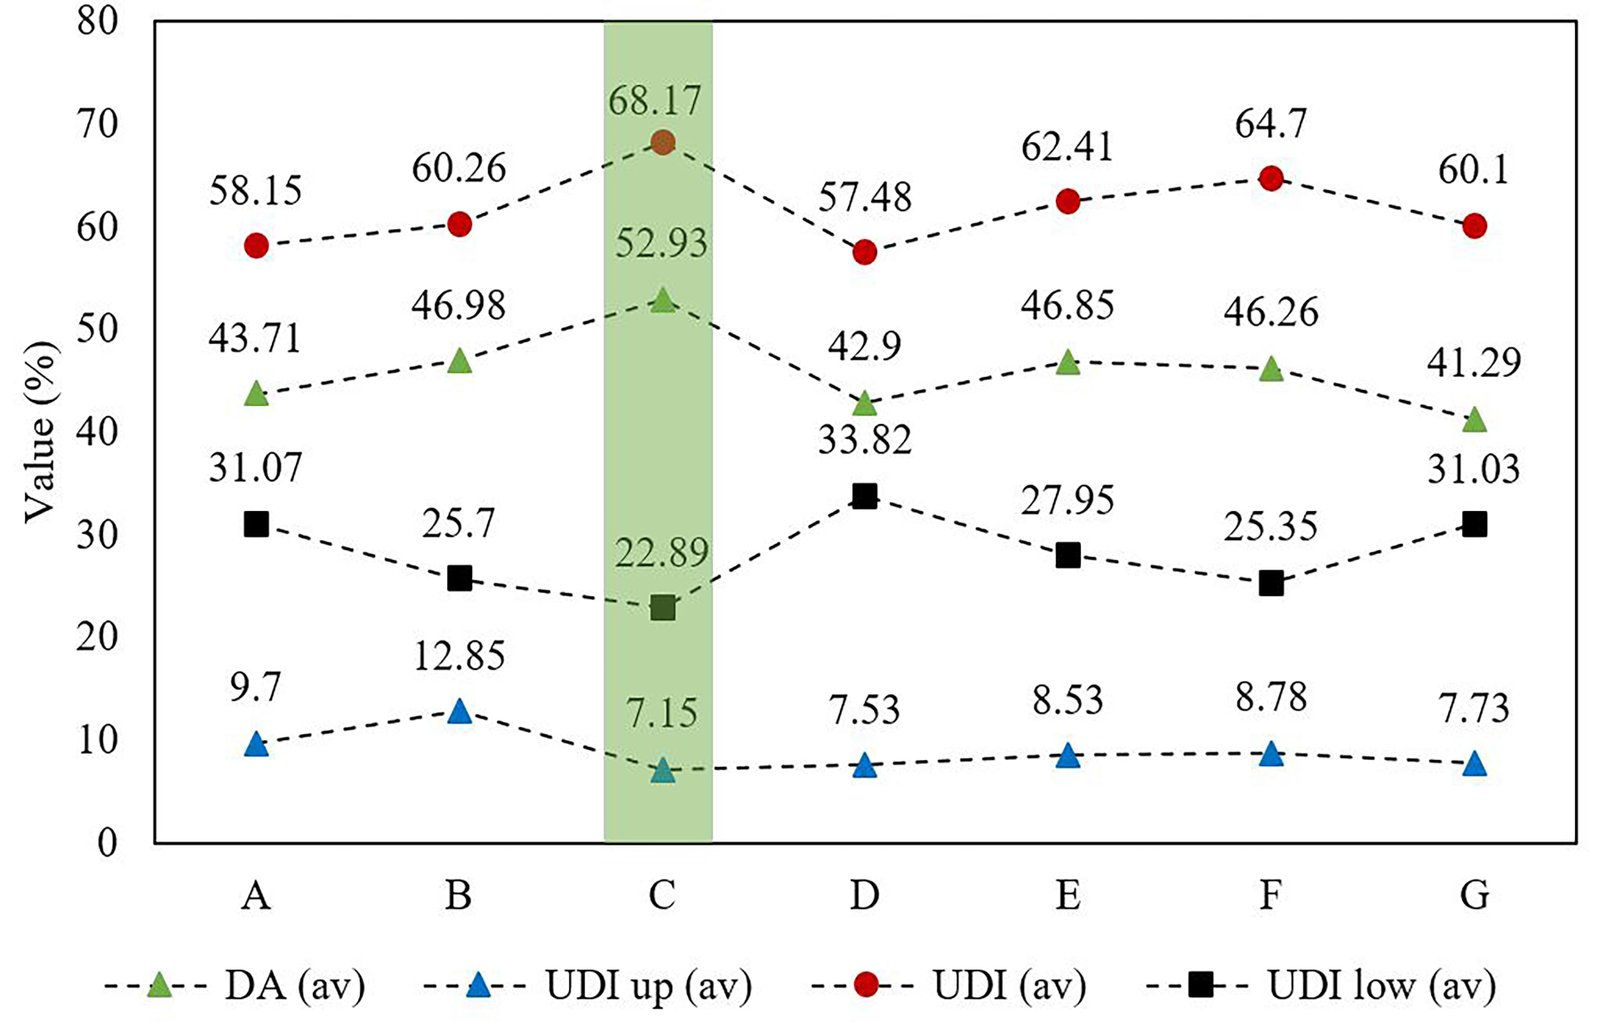
Fig. 13. The average value of annual daylight metrics across seven school plan layouts.
Finding reveals a clear hierarchy emerges: Model C delivers the most balanced and reliable daylighting, Models E and F follow closely, Models A and B show moderate performance with some limitations, and Models D and G exhibit the weakest daylight conditions.
For a more in-depth understanding, the seasonal daylight performance across the seven school models is presented in Fig. 14, revealing distinct patterns in daylight distribution and notable variations in daylight distribution throughout the year. This analysis provides deep insights into the relative performance of each school layout and the design trade-offs in daylighting performance in school design layouts. As shown in this Figure, during spring, Model C leads with DA = 58% and UDI average = 75%, indicating that three-quarters of occupied hours receive illuminance within the optimal 200–2000 lux range, minimizing both under- and over-illumination. Models B and F also perform well (DA = 52% and 53%), though UDI-low values (23–34%) reveal persistent underlit zones requiring supplementary lighting. UDI-up remains low across models (7–17%), indicating effective control of excessive daylight. In summer, Model C maintains leadership (DA = 61%, UDI = 77%), demonstrating effective management of abundant daylight, while Model F (DA = 54%, UDI = 73%) remains among the top performers. Models D and G show moderate DA (50% and 47%) and lower UDI averages (65% and 68%), reflecting more conservative daylighting that may mitigate overheating. UDI-low values stay at 22–33%, highlighting persistent underlit areas.
Figure 14
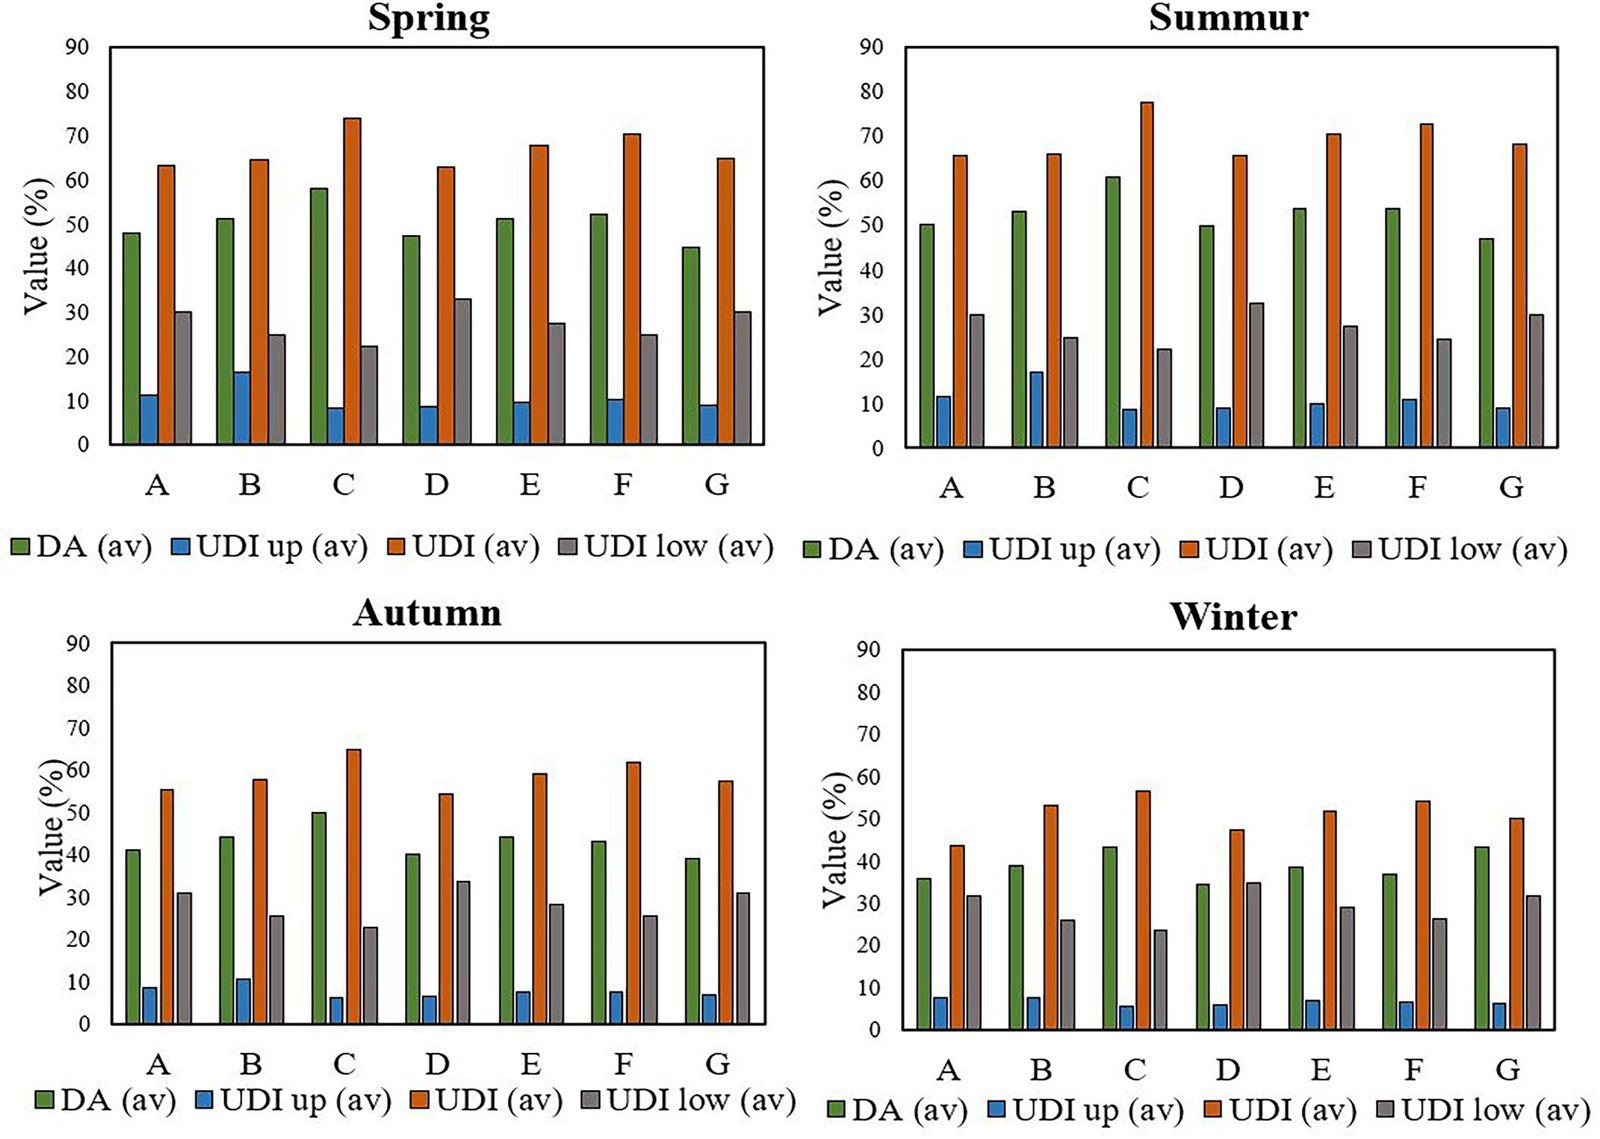
Fig. 14. Seasonal average daylight metrics for each school plan layouts.
Autumn sees a general decline in DA and UDI due to lower solar altitude and shorter days. Furthermore, Model C continues to outperform (DA = 50%, UDI = 65%), followed by Model E (DA = 44%, UDI = 60%) and Model B (DA = 49%, UDI = 58%). Winter presents the most demanding conditions, with DA and UDI averages dropping across all models. Model C achieves the highest DA = 40% and UDI = 57%, closely followed by Models B and G (DA 43%). UDI-up remains low (5–9%), suggesting minimal over-illumination, while UDI-low rises to 25–35%, reflecting substantial underlit areas.
Model F maintains competitive performance (DA = 38%, UDI = 53%), demonstrating design adaptability. Comparative investigation across seasons also highlights clear hierarchies: Models C, B, and F consistently achieve strong daylighting metrics, with Model C showing the highest UDI averages (75%, 77%, 65%, 57% from spring to winter). Model B provides balanced DA and UDI with only 12% seasonal variation, while Model F perform well in spring and summer. Models A, E, and G offer moderate performance, with E demonstrating consistent seasonal reliability and G improving in winter due to low-angle sun penetration. Model D shows a conservative strategy with lower DA (41–50%) and reduced UDI-up (8%). These findings indicate that even the best layouts cannot rely solely on passive daylighting year-round. Achieving optimal illuminance requires balancing high useful daylight (DA, UDI) with controlled over-illumination (UDI-up), often necessitating other daylight treatments such as adaptive shading. Implications for educational environments are significant, as daylight quality directly impacts student performance, visual comfort, and productivity. Seasonal performance patterns also suggest climate-specific suitability: high-performing models namely C and B are ideal for temperate climates (e.g., Tehran), whereas Model D’s conservative approach may suit hot, sunny regions prioritizing over-lit zones managements.
4.2. Visual quality
Figures 15 and 16 collectively illustrate the spatial and visual quality assessment across seven school plan typologies through a combination of quantitative Isovist indices and spatial visualization metrics. Together, these analyses provide a comprehensive understanding of how interior configuration affects visibility, accessibility, and perceptual experience within educational environments. Beside Table 6, for better understanding and visualization of the results, in Fig. 15, the Isovist Drift Angle (DA) (purple squares) quantifies the displacement between the observer’s viewpoint and the centroid of the visible field. Higher DA values indicate greater visual dispersion and a more dynamic spatial experience, reflecting environments that draw attention away from spatial congestion toward more distributed zones. Consistent DA values (around 200) across all school layouts suggest relatively stable visual orientation, while Model C (highlighted in green color) presents the highest value, implying stronger visual diversity and a more engaging interior experience. This observation corresponds well with the spatial patterns seen in Fig. 16, where layout C, with its open atrium layout, demonstrates expanded sightlines and an enhanced sense of spatial continuity. The Maximum Radial Line (Maxradial), represented by red circles in Fig. 15, defines the longest visible line from each observation point and thus the extent of the visual field. Most typologies show moderate values (ranging from 0–50), while Model C again achieves the highest value, denoting a broader field of vision and improved spatial legibility. The Maxradial maps in Fig. 16, visually confirm this, showing warmer colour zones in Model C, indicative of longer sightlines and visual openness. Typologies B and F also demonstrate favourable behavior, suggesting efficient and interconnected spatial grids that promote perceptual coherence. The Visual Mean Depth (blue triangles) describes how deeply one can visually penetrate a spatial system. This indicator remains relatively stable among typologies but reaches its maximum in case C, signifying a more intricate yet visually connected structure.
Figure 15
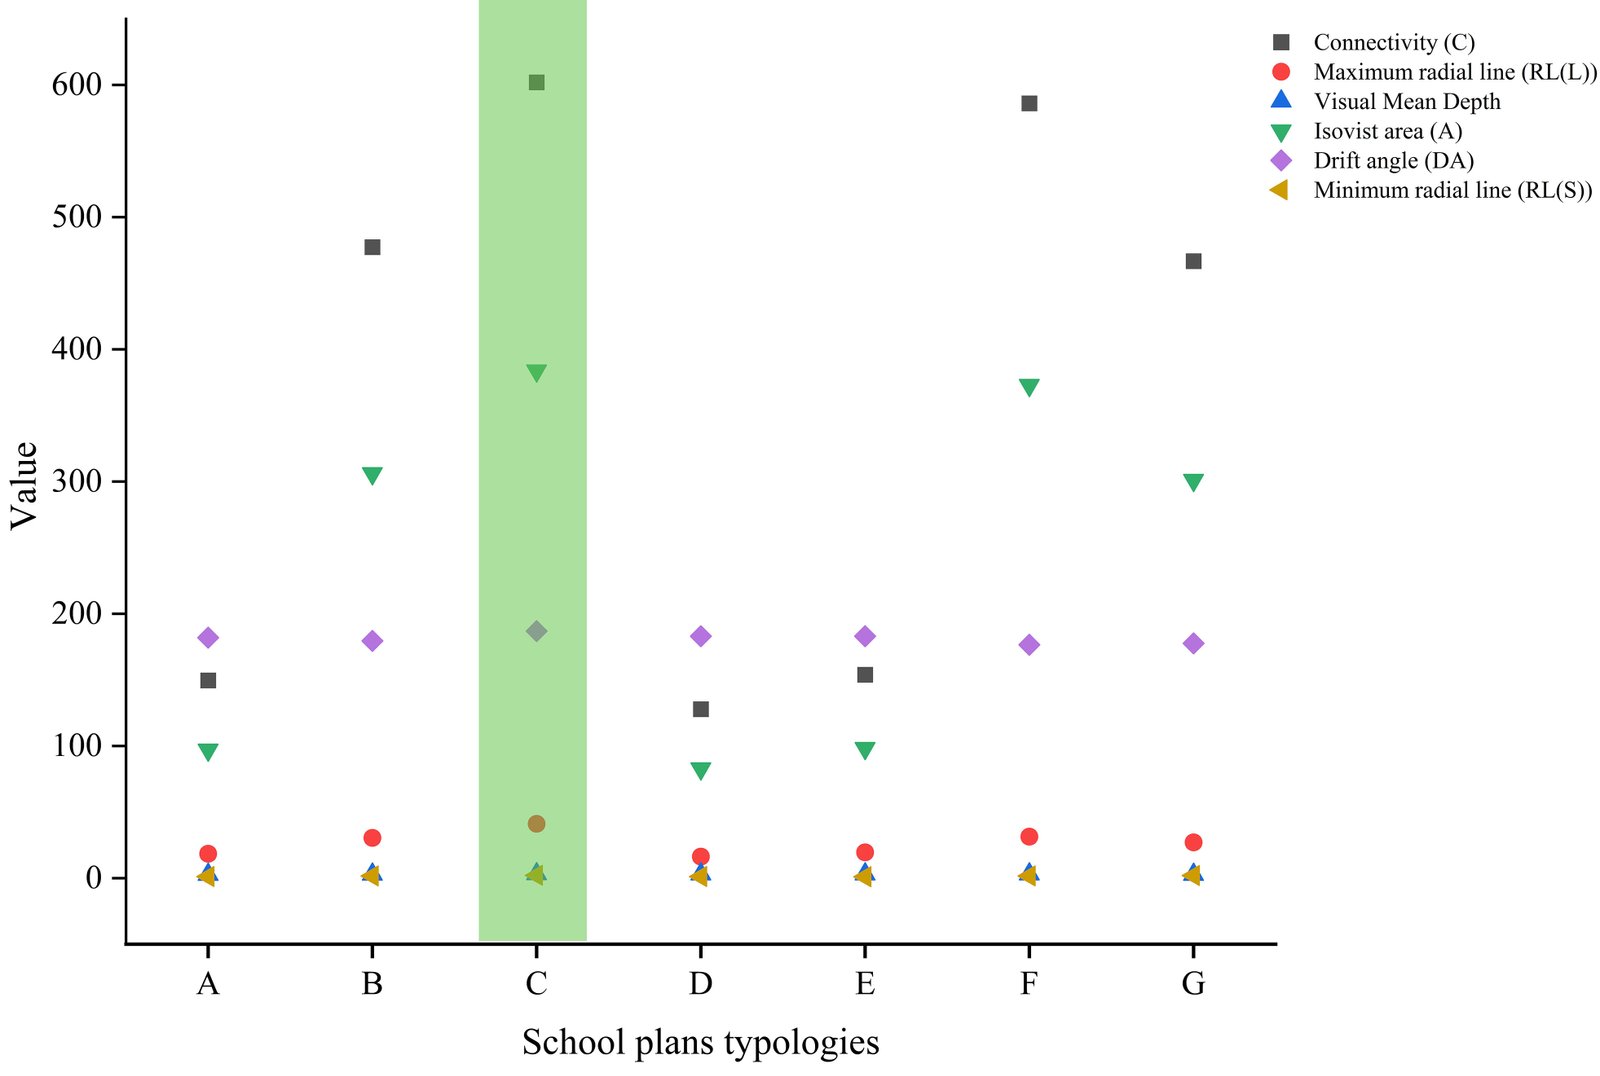
Fig. 15. The visual quality metrics values for seven different school plan syntax.
Figure 16
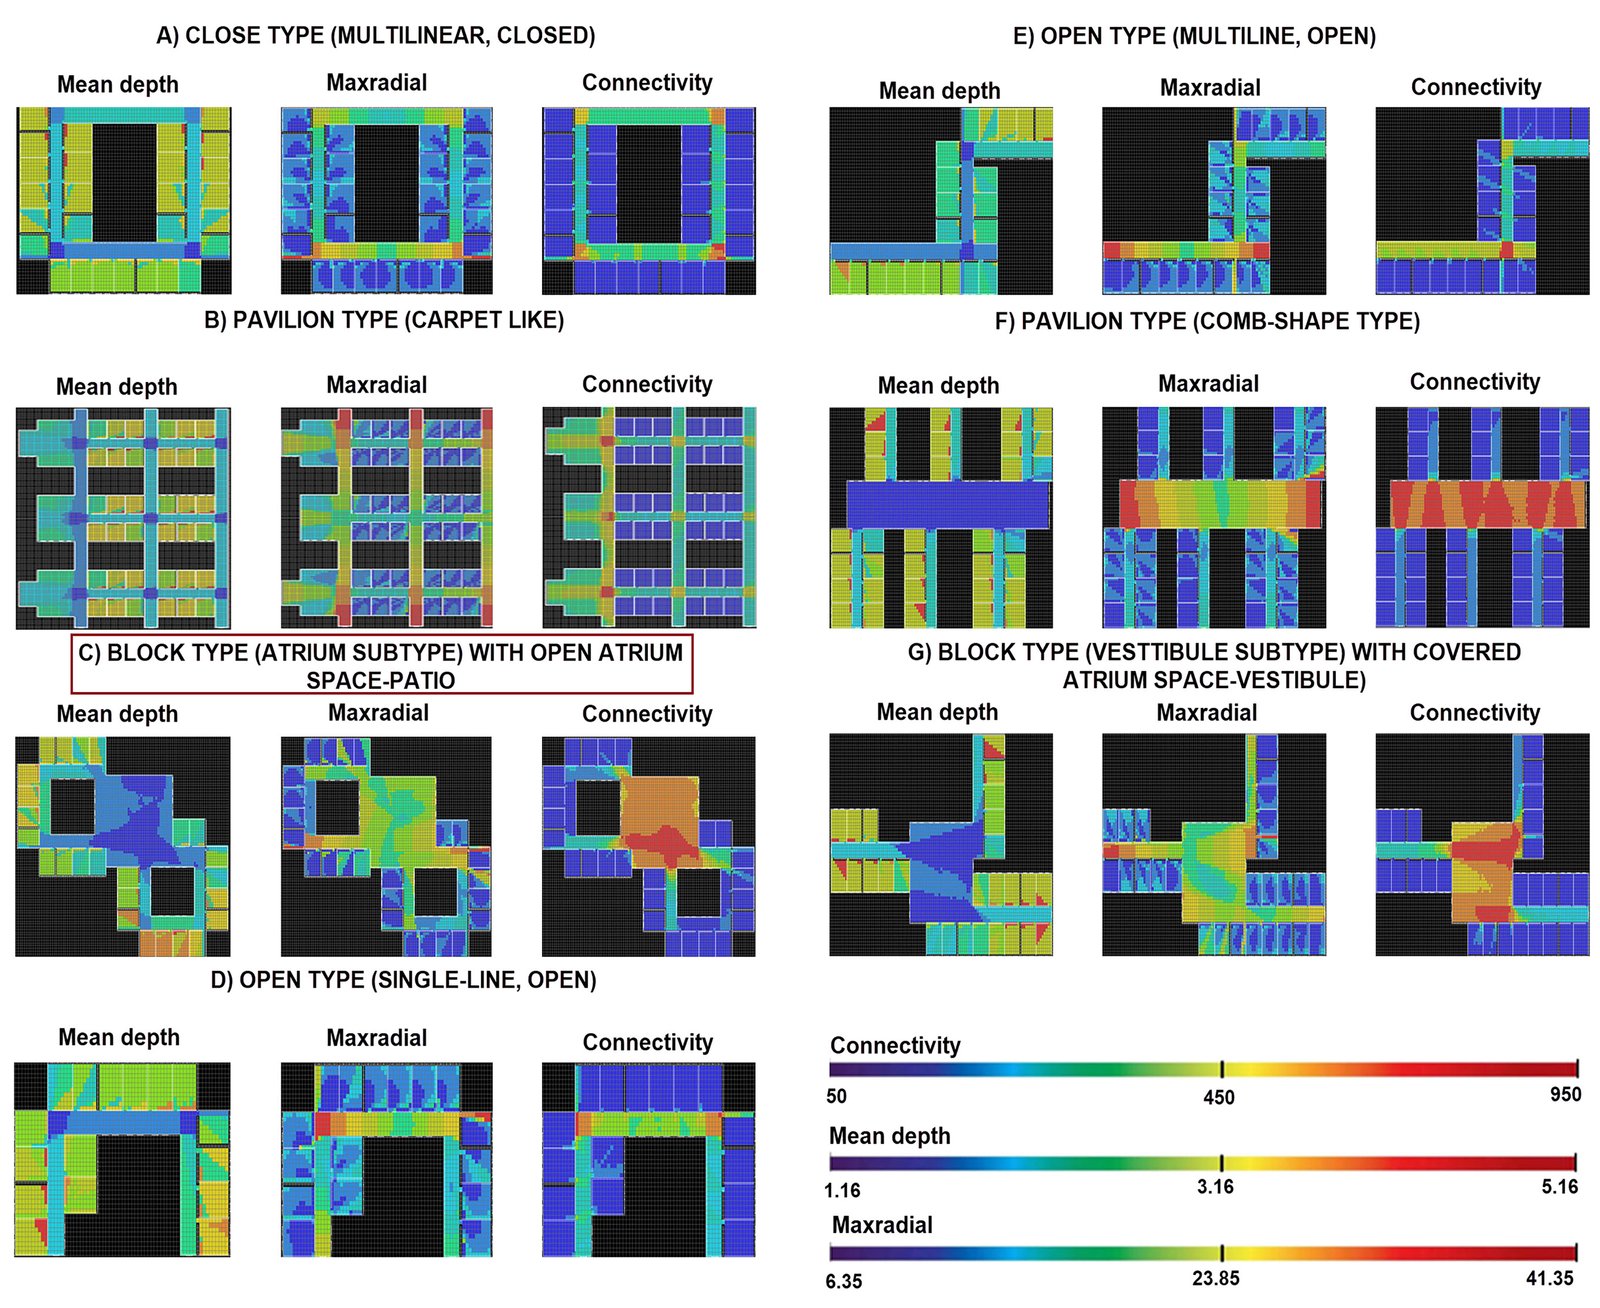
Fig. 16. Heatmaps of three visual quality metrics across seven different school plans.
As seen in Fig. 16, the Mean Depth maps for typologies C and F display a richer visual hierarchy with smoother transitions between near and far zones, features associated with improved orientation and spatial guidance potential. The Minimum Radial Line (yellow diamonds) maintains consistently low values (around 50) across all typologies, following a pattern similar to Maxradial and Mean Depth. This consistency implies a balanced relationship between proximity and distance within the visual field, supporting coherent spatial perception and reducing perceptual dissonance. The Connectivity index (black squares) in Fig. 15, highlights significant variation between typologies. Layouts C and F achieve the highest values (around 600), followed by B and G (around 500), suggesting highly integrated and user-friendly spatial layouts. These numerical trends are reinforced by the Connectivity maps in Fig. 16, where C and F exhibit large, continuous red zones, evidence of strong spatial interrelation and fluid circulation. In contrast, A, D, and E display lower connectivity, indicating fragmented spatial organization and weaker visual integration. Similarly, the Isovist Area (green inverted triangles), ranging from 200 to 300 across typologies, reflects the visible surface area from each point. Its trend parallels the connectivity index, showing that larger visual fields correlate with greater spatial openness and perceptual coherence. The spatial diagrams again substantiate this finding, particularly for cases C and F, where the atrium and comb-like configurations maximize both visual exposure and navigational clarity. The synthesis of quantitative results (Fig. 15) and spatial analyses (Fig. 16) reveals consistent patterns among typologies. The Block Type (C) (shown in red rectangular mark), featuring an open atrium, and the Pavilion Type (F), with its comb-like configuration, demonstrate the most balanced spatial compositions, combining high connectivity, rich visual depth, and extensive sightlines. Typologies B and G also perform well, offering coherent but moderately integrated layouts, while A, D, and E exhibit more limited visual reach and weaker connectivity. In conclusion, both figures confirm that spatial configuration strongly influences visual quality in school environments. Model C consistently achieves good visual quality performance across all metrics, providing a perceptually efficient, visually open, and well-connected layout. Its central atrium promotes orientation, visibility, and social interaction, key elements for creating comfortable and cognitively supportive educational spaces. These findings collectively emphasize that balanced centrality and openness are critical determinants in designing visually legible and pedagogically effective architectural layouts.
4.3. Correlation between research metrics
The research also employs SPSS software to perform Pearson’s correlation tests, as presented in Table 7 and Fig. 17, to examine the relationships between various visual quality and daylight metrics. Although correlations between some metrics are well-documented in the existing literature and do not represent novel findings, the presentation of these correlations is intended not to claim originality, but to demonstrate that the simulation results obtained in the research are consistent with established theoretical trends. Including these correlations serves two purposes: first, to validate the robustness and reliability of the simulation model and methodology; and second, to provide a reference framework for interpreting variations observed under the different design layouts. The correlation and decorrelation coefficients are examined at a significance level of = 0.05. According to Pearson correlation, the correlation between two variables is higher in a straight line when the correlation coefficient (ρ) is closer to 1. In contrast, there is a stronger inverse relationship between two variables when the correlation coefficient ( ) is nearer −1. When the correlation coefficient is zero ( = 0), there is no correlation between the two variables. Table 7, displays Pearson's test results, with a significance level of 0.01 and a correlation coefficient ( ) between the six Isovist indicators and the four daylight indexes. Accordingly, there are strong positive correlations between the maximum radial dimensions and the Isovist area, suggesting that larger areas correspond to greater maximum radial dimensions. Besides, there is a substantial positive association between the Isovist area and the minimum radial dimension, suggesting that bigger areas correspond to higher minimum radial dimensions. The Isovist measure for area and connectedness also shows a strong positive connection; a perfect correlation indicates a straight proportionality between the two variables. This phenomenon also holds true for minimum radial and maximum radial dimensions, indicating that greater maximum radial dimensions align with higher minimum radial dimensions. Additionally, it is observed that greater maximum radial dimensions are linked to higher connectivity metrics.
Table 7
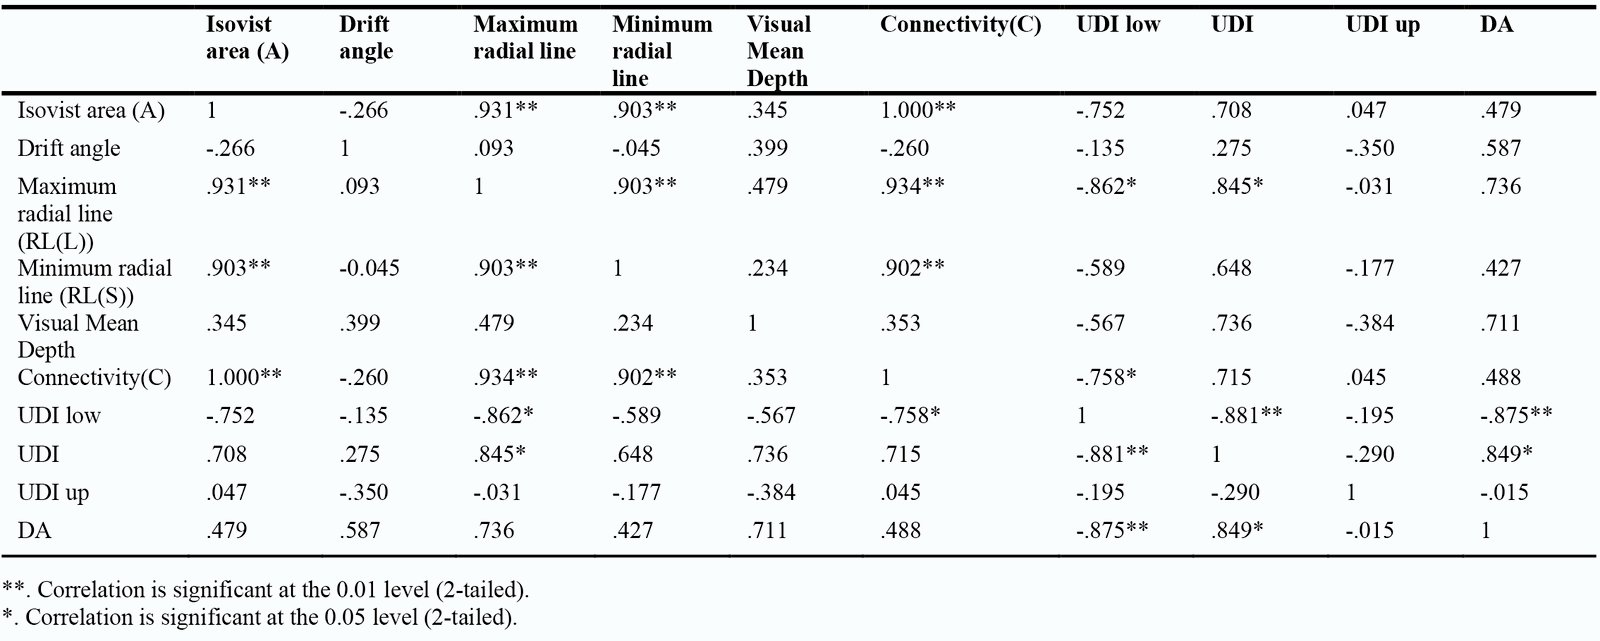
Table 7. Demonstration of the correlations between daylight and visual comfort metrics of the research.
Figure 17
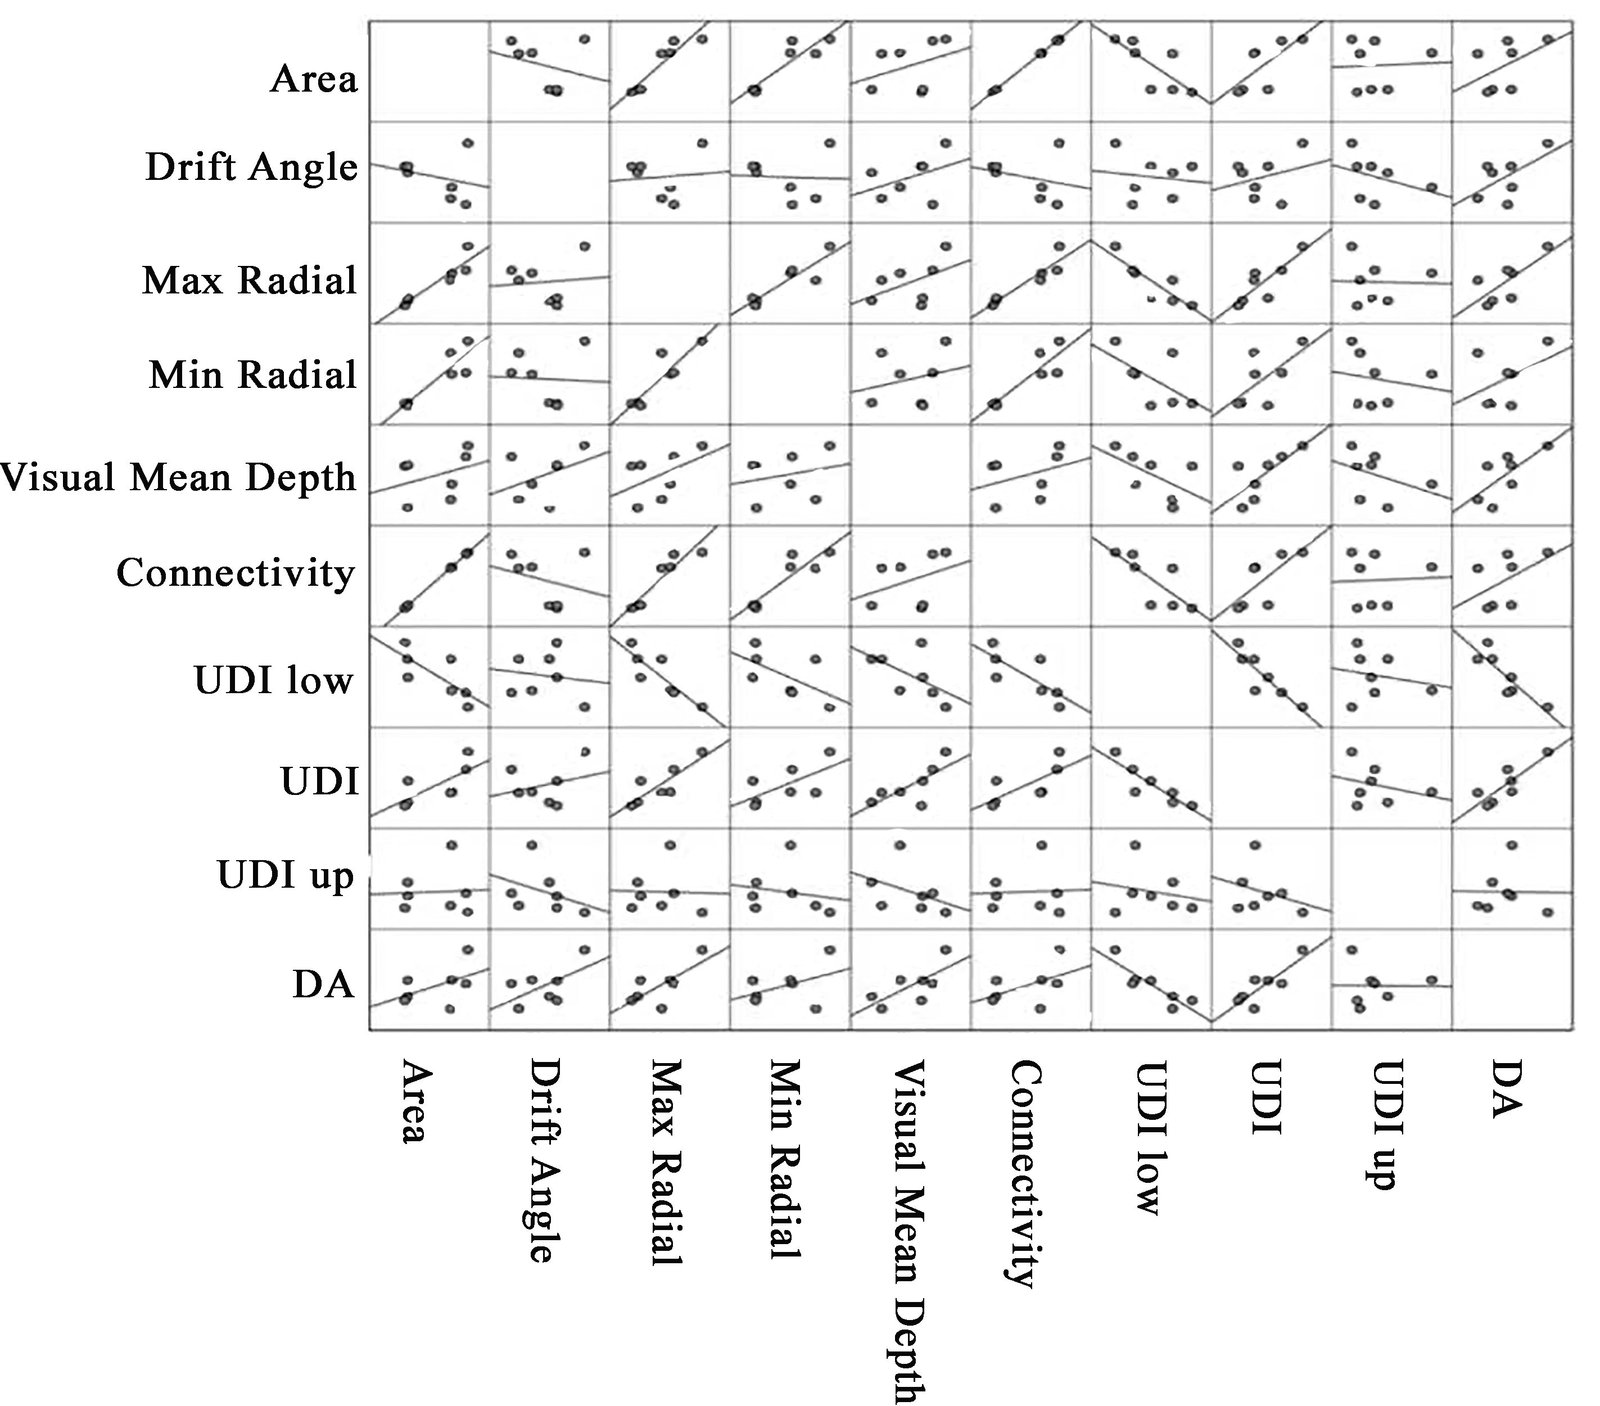
Fig. 17. Scatter diagram along with the best fitting line for daylight and visual quality metrics in seven different school plan layouts according to Table 7.
In the context of daylight measures, there is a strong positive correlation between UDI and DA, which indicates that greater UDI values are associated with higher DA values. A similar correlation exists between maximum radial and UDI. Conversely, a significant negative association was found between UDI_low and UDI, meaning that lower UDI_low values are correlated with greater UDI values. Both UDI_low and DA demonstrate a correlation between lower UDI_low values and greater DA values. There is also a correlation between UDI_low and connectivity, suggesting that higher connectivity correlates with lower UDI_low values. Similarly, the relationship between maximum radial and UDI_low suggests that higher maximum radial dimensions correlate with lower UDI low values. There are modest and somewhat favourable connections with the other parameters, as Table 7 illustrates. In general, there is a substantial correlation between large areas, high max and min radial dimensions, and connectivity. Significant relationships exist between high and low UDI, DA and UDI, respectively. Moderate relationships exist between visual mean depth, DA, and UDI. Except for DA, drift angle often exhibits minimal associations. These correlations clarify the significant relationships between daylight and visual quality research metrics that confirm doing such research. For more clarified observations, the scatter plot matrix in Fig. 17, graphically corroborates these correlations by displaying trends and patterns that align with the numerical correlation values. Every little plot in the matrix represents the relationship between two variables using a scatter plot. The diagonal displays the distribution of each variable as density plots or histograms, but in this instance, it appears to display straightforward scatter plots with a line of best fit. Each off-diagonal scatter plot demonstrates the relationship between two variables.
There is a correlation between those variables where there is a linear trend, either positive or negative. The degree to which the points closely cluster around the line of greatest fit indicates the strength of the correlation. These insights can help to understand how these variables interact in the study and potentially guide future research or focus areas. If the points form an upward-sloping pattern, there is a positive correlation between the two variables. For instance, an upward-sloping pattern between "area" and "daylight" links greater areas to more daylight. The points form a downward-sloping pattern, indicating a negative association. Randomly dispersing the dots results in little to no linear association between the variables. The diagonal plots show the perfect correlation between each variable and itself, typically represented by a straight line. Given their consistent display of a perfect linear relationship, these plots may not be as informative as others. The stronger the association, the closer the points are to the line of best fit. Conversely, more dispersed spots indicate weaker relationships. The first row and first column display scatter plots that illustrate the association between 'area' and all other variables. In this case, any linear trend shows the correlation between each of those factors and 'area'. The second row and column similarly display the association between 'daylight' and the other variables. Therefore, the other variables like 'DA', 'Visual Mean Depth', 'Connectivity', 'UDI_low ', 'UDI', and 'UDI_up ', exhibit a positive correlation. Hence, it is inferred that there are remarkable correlations between research variables so that evaluating one metric can affect others and it is necessary to consider all of them simultaneously when it comes to examining one plan layout for daylight and visual quality indexes.
5. Conclusion
This research explores the impact of interior architectural layout on the distribution of daylight and visual quality metrics through an analytic-descriptive and simulation-based approach with statistical analysis across seven school plan layouts in Tehran, Iran. The findings underscore the crucial role those interior spatial arrangements in improving both daylight distribution and visual quality in educational environments. Using simulation-based analysis, the research demonstrated that well-designed layouts could enhance daylight performance and visual quality, resulting in more sustainable and effective learning environments. Daylight simulations are performed using the Radiance engine and the Honeybee plugin within Grasshopper, while visual quality metrics are evaluated using the Isovist tool in Depth Map software. Annual daylight metrics include Useful Daylight Illuminance (UDI up, UDI, UDI low) and Daylight Autonomy (DA), along with visual quality indicators, including connectivity (C), Isovist area (A), drift angle (DA), maximum radial line (RL(L)), minimum radial line (RL(S)), and visual mean depth.
The analysis of daylight performance across the seven school layouts reveals a clear hierarchy, with Model C consistently outperforming the others, achieving the highest DA (52.93%) and UDI (68.17%), the lowest UDI-low (22.89%), and a manageable UDI-up (7.15%), indicating frequent attainment of recommended illuminance levels and stable daylight conditions throughout the year. Models F and E also perform well, with DA values ranging from 46% to 47% and UDI values between 62% and 65%, while Models A and B show moderate daylight performance. Models D and G, on the other hand, have the lowest daylight performance, with UDI-low values ranging from 31% to 34%, indicating significant underlit hours. Seasonal evaluation confirmed strong performance, in Model C with high DA and UDI maintained during the spring and summer months, and resilient performance during the winter (DA = 40%, UDI = 57%). These results emphasize the importance of carefully considering spatial planning to achieve effective daylighting in school buildings. The integration of DA and UDI metrics offers a robust framework for enhancing daylight performance, reducing reliance on artificial lighting, and supporting the well-being and productivity of students across various layouts. Furthermore, spatial and visual quality evaluation of the seven school typologies using Isovist metrics and spatial visualization reveal significant differences in perceptual performance. Model C consistently achieves the highest performance, with a Drift Angle (DA) of approximately 220, a Maximum Radial Line (Maxradial) of 50, a Visual Mean Depth of 35, Connectivity of 600, and an Isovist Area of 300, signifying a visually open, well-connected, and perceptually engaging layout. Model F also performed strongly, with a Drift Angle of 210, Maxradial of 48, Visual Mean Depth of 33, and Connectivity of 600, indicating a well-organized pavilion configuration that promotes rich visual hierarchy and smooth circulation. Models B and G showed moderate visual quality, with Connectivity around 500 and Maxradial values between 40 and 45, providing a coherent but less integrated spatial experience. In contrast, Models A, D, and E exhibited lower connectivity (around 400-450), limited visual reach (Maxradial of 35-40), and less coherent visual fields, indicating more fragmented layouts.
These findings indicate that balanced centrality, expansive sightlines, and high spatial connectivity are key factors in determining the visual quality of school environments. The results emphasize that a careful spatial configuration can significantly enhance visibility, social interaction, and cognitive support within educational spaces. Furthermore, correlation analysis using SPSS revealed significant relationships between daylight and visual quality metrics, confirming the validity of the research. It demonstrated strong correlations between daylight availability and spatial visibility, reinforcing the need for integrated design approaches that address both visual quality and daylight performance. The results highlight the importance of considering all relevant metrics simultaneously when assessing a single layout for daylight and visual quality, as changes in one metric can influence others. The main conclusion of this research is that the spatial arrangement of school layouts plays a significant role in the distribution of natural light and overall visual quality. The simultaneous evaluation of natural lighting metrics (such as UDI and DA) and visual quality indicators (such connectivity and Isovist area) reveals complex interrelationships that significantly impact user comfort and functionality. This underscores the necessity of an integrated design approach to enhance environmental performance in schools. For achieving well-balanced daylight distribution and high visual quality, it is critical to design interior layouts with precision and to select the appropriate spatial arrangements that support both natural lighting and visual accessibility. These insights would help refine daylighting strategies to enhance both the environmental quality and educational outcomes in schools, fostering more adaptable, efficient, and user-centered learning environments.
6. Research limitations
This research acknowledges several limitations that should be considered when interpreting the findings and suggests potential directions for future works. First, the research assumes uniform user behavior and lighting needs across all layouts, which may not fully capture the diversity of activities, seating arrangements, and individual preferences in real-world educational environments. Given the dynamic nature of educational spaces, this assumption could limit the accuracy of the findings for varied classroom settings. Another limitation is the geographical scope of the study, which is confined to case studies in Tehran, Iran. While the findings provide valuable insights into the specific climatic and architectural context of the region, the results may not be directly applicable to other regions with different climates, daylighting characteristics, and building regulations. The generalizability of the conclusions to areas with distinct environmental conditions remains uncertain, highlighting the need for further validation across a broader range of geographical contexts. Additionally, the research relies on Honeybee-Radiance for daylight simulations and Isovist analysis for visual quality assessments. While these tools are effective and widely used in architectural studies, there is potential for incorporating alternative simulation methods such as DIVA, Daysim, or even machine learning-based approaches. These could provide complementary perspectives on daylight performance and enhance the robustness of the analysis, particularly in more complex or diverse design scenarios. The research also presents its findings based on a range of few school layouts without accounting for potential variations in more design layouts, user needs, cultural preferences, or adaptive design strategies. Real-world educational environments often require flexible and adaptable layouts that can accommodate various teaching styles, activities, and preferences. A more dynamic approach to school design, considering the diverse needs of students and educators, would likely improve the effectiveness of daylighting solutions. Other architectural aspects, such as WWR, glare risk, thermal and energy performance, building dimensions and shape, and facade design, are additional limitations of the current research.
Funding
This research received no external funding.
Acknowledgments
The authors would like to express their gratitude to everyone who contributed to discussions and provided support during the development of this research.
Author Contributions
Conceptualization, Methodology, Data Analysis, Validation, Formal Analysis, Data Curation, Resources, and Writing & Original Draft, S.H.N.S.; Methodology, Software (daylight simulations and analysis), Validation, and Writing & Original Draft, E.S.; Writing & Review and Editing, and Supervision, B.V.; Writing & Review and Editing, Supervision, and Project Administration, S.B.; Software (Isovist simulation and analysis), Visualization, and Methodology, A.E. All authors have read and approved the final version of the manuscript.
Declaration of competing interest
The authors declare no conflict of interest.
References
- Irnawaty, Daylight intensity analysis of secondary school buildings for environmental development, IOP Conference Series: Earth and Environmental Science, 364:1 (2019) 1-8. https://doi.org/10.1088/1755-1315/382/1/012022
- M. Eilers, J. Reed, and T. Works, Behavioral aspects of lighting and occupancy sensors in private offices: a case study of a university office building, Summer Study on Energy Efficiency in Buildings, 1:1 (1996) 1-10.
- R.A. Baron, M.S. Rea, and S.G. Daniels, Effects of indoor lighting (illuminance and spectral distribution) on the performance of cognitive tasks and interpersonal behaviors: the potential mediating role of positive affect, Motivation and Emotion, 16:1 (1992) 1-33. https://doi.org/10.1007/BF00996485
- A. J. Kim, R. De Dear, Nonlinear relationships between individual IEQ factors and overall workspace satisfaction, Building and Environment, 49:2012 33-40. https://doi.org/10.1016/j.buildenv.2011.09.022
- B. M. Winterbottom, A. Wilkins, Lighting and discomfort in the classroom, Journal of Environmental Psychology, 29:1 (2009) 63-75. https://doi.org/10.1016/j.jenvp.2008.11.007
- C. Y. Wang, W. Yang, Q. Wang, Multi-objective parametric optimization of the composite external shading for the classroom based on lighting, energy consumption, and visual comfort, Energy and Buildings, 275:2022 112441. https://doi.org/10.1016/j.enbuild.2022.112441
- D. Y. Fang, X. Luo, J. Lu, A review of research on the impact of the classroom physical environment on schoolchildren's health, Journal of Building Engineering, 65:2023 105430. https://doi.org/10.1016/j.jobe.2022.105430
- E. R. Küller, et al., The impact of light and colour on psychological mood: a cross-cultural study of indoor work environments, Ergonomics, 49:14 (2006) 1496-1507. https://doi.org/10.1080/00140130600858142
- F. M. Boubekri, et al., Impact of windows and daylight exposure on overall health and sleep quality of office workers: a case-control pilot study, Journal of Clinical Sleep Medicine, 10:6 (2014) 603-611. https://doi.org/10.5664/jcsm.3780
- G. S.W. Lockley, Circadian rhythms: Influence of light in humans, in Encyclopedia of Neuroscience, Elsevier, 2010 971-988. https://doi.org/10.1016/B978-008045046-9.01619-3
- H. S. Altomonte, Daylight for energy savings and psycho-physiological well-being in sustainable built environments, Journal of Sustainable Development, 1:3 (2008) 3-16. https://doi.org/10.5539/jsd.v1n3p3
- I. C.F. Reinhart, J. Wienold, The daylighting dashboard-A simulation-based design analysis for daylit spaces, Building and Environment, 46:2 (2011) 386-396. https://doi.org/10.1016/j.buildenv.2010.08.001
- J. N. Lechner, Heating, cooling, lighting: metode desain untuk arsitektur, Jakarta: Rajagrafindo Persada, 2007.
- K. C. Mediastika, Hemat Energi Dan Lestari Lingkungan, Yogyakarta: CV Andi Offset, 2013.
- L. S. Kaplan, R. Kaplan, Health, supportive environments, and the reasonable person model, American Journal of Public Health, 93:9 (2003) 1484-1489. https://doi.org/10.2105/AJPH.93.9.1484
- M. G.W. Evans, J.M. McCoy, When buildings don't work: The role of architecture in human health, Journal of Environmental Psychology, 18:1 (1998) 85-94. https://doi.org/10.1006/jevp.1998.0089
- N. W.N.H.W. Abdullah, et al., Identifying optimal window-to-wall ratio (WWR) and window-to-floor ratio (WFR) for typical higher educational classrooms to address deficiencies in daylighting design, Malaysian Journal of Sustainable Environment, 12:2 (2025) 81-102. https://doi.org/10.24191/myse.v12i2.7059
- O. Y. Liu, et al., Optimizing classroom modularity and combinations to enhance daylighting performance and outdoor platform through ANN acceleration in the post-epidemic era, Heliyon, 9:11 (2023) https://doi.org/10.1016/j.heliyon.2023.e21598
- P. L. Starkey, et al., The use of furniture in a student-centred primary school learning environment, New Zealand Journal of Educational Studies, 56:Suppl 1 (2021) 61-79. https://doi.org/10.1007/s40841-020-00187-9
- Q. S.M. Mousavi, T.H. Khan, Y.-W. Lim, Impact of furniture layout on indoor daylighting performance in existing residential buildings in Malaysia, Journal of Daylighting, 5:1 (2018) 1-13. https://doi.org/10.15627/jd.2018.1
- R. S.R. Mousavi Asl, H. Safari, Evaluation of daylight distribution and space visual quality at medical centers through spatial layout, Journal of Asian Architecture and Building Engineering, 20:5 (2021) 512-519. https://doi.org/10.1080/13467581.2020.1800476
- S. L.A. Ali, F.A. Mustafa, Mosque Morphological Analysis: The Impact of Indoor Spatial-Volumetric Visibility on Worshipers' Visual Comfort, Sustainability, 15:13 (2023) 10376. https://doi.org/10.3390/su151310376
- T. B. Mercan, G.I. Tunahan, The influence of daylight availability on thermal comfort in classroom environments, Journal of Architectural Sciences and Applications, 9:2 (2024) 844-864. https://doi.org/10.30785/mbud.1495366
- U. K. Tarabieh, et al., Statics of space syntax: Analysis of daylighting, Frontiers of Architectural Research, 8:3 (2019) 311-318. https://doi.org/10.1016/j.foar.2019.05.004
- V. H.S. El Samaty, J.Z. Feidi, A.M. Refaat, The impact of glazed barriers on the visual and functional performance of transition spaces in college buildings using space syntax, Ain Shams Engineering Journal, 14:9 (2023) 102119. https://doi.org/10.1016/j.asej.2023.102119
- W. S. Sima Taher, H. Behbahani, K. Bazrafkan, Explaining the educational role of open space in Iranian schools with a comparative study of traditional to contemporary schools (case study: Chaharbagh, Dar Alfonun and Alborz schools), Quarterly Scientific Research Journal of Islamic Architecture Research, 2015.
- X. Z. Zomorodian, S. Korsavi, M. Tahsildoost, The effect of window configuration on daylight performance in classrooms: A field and simulation study, International Journal of Architectural Engineering and Urban Planning, 26:1 (2016) 15-24.
- Y. Y. Jia, et al., Effect of interior space and window geometry on daylighting performance for terrace classrooms of universities in severe cold regions: A case study of Shenyang, China, Buildings, 13:3 (2023) 603. https://doi.org/10.3390/buildings13030603
- Z. A. Azodo, Illuminance and Daylight Distribution Assessment for Learners' Comfort and Safety in One-side-window Oriented Classroom Building, Arid Zone Journal of Engineering, Technology and Environment, 13:5 (2017) 567.
- AA. B.J. Alkhatatbeh, Y. Kurdi, S. Asadi, Multi-objective optimization of classrooms' daylight performance and energy use in US Climate Zones, Energy and Buildings, 297:2023 113468. https://doi.org/10.1016/j.enbuild.2023.113468
- AB. F. Diker, İ. Erkan, The fuzzy logic method in assessing window design for the visual comfort of classrooms at the early design stage, Journal of Architectural Engineering, 28:2 (2022) 04022013. https://doi.org/10.1061/(ASCE)AE.1943-5568.0000544
- AC. Y. Bian, et al., Simulation of daylight availability, visual comfort and view clarity for a novel window system with switchable blinds in classrooms, Building and Environment, 235:2023 110243. https://doi.org/10.1016/j.buildenv.2023.110243
- AD. E. Fakıbaba Dedeoğlu, M. Yalçın, A Proposal for the Improvement of Daylight Integration and Distribution in the Educational Interior Space Through a (Pro-Sun) Ceiling Design with Curved Surfaces, Sustainability, 17:3 (2025) 1096. https://doi.org/10.3390/su17031096
- AE. C. Tandy, The isovist method of landscape survey, Methods of Landscape Analysis, 10:1967 9-10.
- AF. M.L. Benedikt, To take hold of space: isovists and isovist fields, Environment and Planning B: Planning and Design, 6:1 (1979) 47-65. https://doi.org/10.1068/b060047
- AG. Y. Lu, H. Cai, S.J. Bosch, Key spatial factors influencing the perceived privacy in nursing units: An exploration study with eight nursing units in Hong Kong, HERD: Health Environments Research & Design Journal, 10:4 (2017) 37-48. https://doi.org/10.1177/1937586716672857
- AH. A. Indraprastha, M. Shinozaki, Computational models for measuring spatial quality of interior design in virtual environment, Building and Environment, 49:2012 67-85. https://doi.org/10.1016/j.buildenv.2011.09.017
- AI. K. Koile, The Architect's Collaborator: Toward Intelligent Design Tools for Conceptual Design, PhD Dissertation, MIT, 2001.
- AJ. G. Franz, M. von der Heyde, H.H. Bülthoff, Predicting experiential qualities of architecture by its spatial properties, in 18th International Association for People-Environment Studies (IAPS 2004), Hogrefe, 2005.
- AK. J.M. Wiener, G. Franz, Isovists as a means to predict spatial experience and behavior, in International Conference on Spatial Cognition, Springer, 2004. https://doi.org/10.1007/978-3-540-32255-9_3
- AL. C.J. Kat, et al., Application of multimodal learning in daylight provision and view quality assessment of residential building layouts, International Journal of Architectural Computing, 22:4 (2024) 605-627. https://doi.org/10.1177/14780771241286614
- AM. S. Mehrabian, H. Safari, J.-E. Soheili, Morphological Analysis of Dar Al-Fonun School Using the Space Syntax Method, Quarterly Journal of Architectural Thought, 5:9 (2019) 263-276.
- AN. V. Dzebic, Isovist analysis as a tool for capturing responses towards the Built Environment, M.Sc. Thesis, University of Waterloo, 2013.
- AO. Rhinoceros, Rhinoceros, 2021.
- K. Lagios, J. Niemasz, C.F. Reinhart, Animated building performance simulation (ABPS)-linking Rhinoceros/Grasshopper with Radiance/Daysim, in: Proceedings of SimBuild, New York, USA, 4-6 August 2010, pp. 321-327.
- AQ. Y. Meraihi, et al., Grasshopper optimization algorithm: theory, variants, and applications, IEEE Access, 9:2021 50001-50024. https://doi.org/10.1109/ACCESS.2021.3067597
- AR. M. Roudsari, S. Subramaniam, Automating radiance workflows using Python, in 15th International Radiance Workshop, Padova, Italy, 2016.
- AP. EnergyPlus, "EnergyPlus Weather Data", EnergyPlus.net, 2024.
- AS. M.S. Roudsari, M. Pak, Ladybug: a parametric environmental plugin for Grasshopper to help designers create an environmentally-conscious design, 2013.
- AT. L. López Ponce de Leon, Shading design workflow for architectural designers, 2016.
- AU. C.F. Reinhart, O. Walkenhorst, Validation of dynamic RADIANCE-based daylight simulations for a test office with external blinds, Energy and Buildings, 33:7 (2001) 683-697. https://doi.org/10.1016/S0378-7788(01)00058-5
- AV. A. Iversen, T.R. Nielsen, S.H. Svendsen, Illuminance level in the urban fabric and in the room, Indoor and Built Environment, 20:4 (2011) 456-463. https://doi.org/10.1177/1420326X11409460
- AW. S. Motamedi, P. Liedl, Integrative algorithm to optimize skylights considering fully impacts of daylight on energy, Energy and Buildings, 138:2017 655-665. https://doi.org/10.1016/j.enbuild.2016.12.045
- AX. M. Sadeghipour Roudsari, M. Pak, A. Viola, Ladybug: a parametric environmental plugin for Grasshopper to help designers create an environmentally-conscious design, in Building Simulation 2013, IBPSA, 2013. https://doi.org/10.26868/25222708.2013.2499
- AY. C. Reinhart, Daylight performance predictions, in Building Performance Simulation for Design and Operation, Routledge, 2019 221-269. https://doi.org/10.1201/9780429402296-7
- AZ. R.G. Mistrick, Desktop Radiance Overview, The Pennsylvania State University, USA, Pacific Gas and Electric, 2000.
- BA. C. Reinhart, A. Fitz, Findings from a survey on the current use of daylight simulations in building design, Energy and Buildings, 38:7 (2006) 824-835. https://doi.org/10.1016/j.enbuild.2006.03.012
- BB. Y. Fang, S. Cho, Design optimization of building geometry and fenestration for daylighting and energy performance, Solar Energy, 191:2019 7-18. https://doi.org/10.1016/j.solener.2019.08.039
- BC. A.A. Bahdad, S.S. Fadzil, N. Taib, Evaluating the effects of light-shelves to daylight distribution at south facing window using physical scaled-model method, International Journal of Sustainable Building Technology and Urban Development, 11:1 (2020) 2-15.
- BD. J.M. Wiener, et al., Isovist analysis captures properties of space relevant for locomotion and experience, Perception, 36:7 (2007) 1066-1083. https://doi.org/10.1068/p5587
- BE. G. Franz, J.M. Wiener, From space syntax to space semantics
- BF. E. Ivanova, School Building Planning. Main Types Of Systems (Plans) Of School Buildings, World Science, 1:7(47) (2019) 18-31. https://doi.org/10.31435/rsglobal_ws/31072019/6586
- B.G. Standard, Light and lighting: Lighting of workplaces: Part 1: Indoor workplaces, 1st ed., NS-EN 12464-1:2011, Norwegian Standard: Oslo, Norway, 2011, pp. 1-20.
- H.A. Turner, Depthmap: a program to perform visibility graph analysis, in: Proceedings of the 3rd International Symposium on Space Syntax, London, UK, 2001, pp. 100-115.
- BI. S. Tabadkani, et al., Daylight in buildings and visual comfort evaluation: The advantages and limitations, 2021.
- BJ. S. Carlucci, et al., A review of indices for assessing visual comfort with a view to their use in optimization processes to support building integrated design, Renewable and Sustainable Energy Reviews, 47:2015 1016-1033. https://doi.org/10.1016/j.rser.2015.03.062
2383-8701/© 2026 The Author(s). Published by solarlits.com. This is an open access article distributed under the terms and conditions of the Creative Commons Attribution 4.0 License.

2734
Total views
Citations
SHARE ON


