Volume 2 Issue 1 pp. 1-11 • doi: 10.15627/jd.2015.1
Simulation of Daylighting Conditions in a Virtual Underground City
Author affiliations
a Freelance Engineer, Perugia 06125, Italy.
b CIRIAF, University of Perugia, via G. Duranti 67, Perugia 06125, Italy.
c Department of Engineering, University of Perugia, via G. Duranti 67, Perugia 06125, Italy.
* Corresponding author. Tel: +39-75-5853716
cma.d@icloud.com (C. Merli Alcini)
schiavoni.unig@ciriaf.it (S. Schiavoni)
francesco.asdrubali@unipg.it (F. Asdrubali)
History: Received 04 November 2014 | Revised 10 December 2014 | Accepted 31 December 2014 | Published online 06 January 2015
Copyright: © 2015 The Author(s). Published by solarlits.com. This is an open access article under the CC BY license (http://creativecommons.org/licenses/by/3.0/).
Citation: Cristiano Merli Alcini, Samuele Schiavoni, and Francesco Asdrubali, Simulation of Daylighting Conditions in a Virtual Underground City, Journal of Daylighting 2 (2015) 1-11. http://dx.doi.org/10.15627/jd.2015.1
Figures and tables
Abstract
From the Piranesi fantastic architectures to the animation movies and video games of the last thirty years, a new design approach has been introduced and developed: the design of the virtual space. Designing the "virtual" means experiencing a multidisciplinary approach where architecture, engineering, and urban planning meet the new horizons of information and communication technology. This study is focused on virtual space, which is an underground city. Mankind have always made and used underground environments: the possibilities of unlimited spaces to potential development, the reduced needs for raw materials for the construction and the protection from outdoor weather are some of the reasons that prompted humans to the realization of underground spaces in the past. These reasons and the availability of innovative technologies could encourage a breakthrough in the realization of new underground environments. A recent example is represented by the Underground City of Montreal (RÉSO). We present the architectural design of a virtual underground city, which is called Arch[ane], and its evaluation. The underground city is modular and the studied module is composed of eight floors with a total depth of 400 m and dimensions of 800 m × 800 m. The study comprises the evaluation of the effect of sunlight on each eight floors of the city. Daylighting simulations were performed considering different cities at different latitudes, days, and hours. The results have shown that the particular design of the underground city with skylights gives significant values of illuminance at a certain depth. Furthermore, the simulation results show how huge can be the potentialities of software to simulate extremely big environments.
Keywords
Skylight; Illuminance level; Virtual space; Underground city
1. Introduction
Virtuality can be considered more real than reality because it includes not only the object shape but also the added knowledge given by the representation processes. MIT created the first virtual reality system, the Aspen Movie Map, in 1977. The system aimed at reproducing the experience of a walk in the town of Aspen, Colorado during the winter and the summer season using some videos of the place mounted to cover every possible path through the streets of the city. Moreover, the system included a raw polygonal reconstruction of the city that was quite unrealistic due to the instruments available in 1977 [1]. This system can be considered an ancestor of Google Street view.
Nevertheless, the first significant experiences of virtual reality were probably made by the architect and engraver Giovanni Battista Piranesi (1720-1778) through his illusory and fabulous architectures: in the tables (Carceri d'invenzione), the artist represented huge vaulted underground spaces with stairs and mighty machines [2].
The paper is focused on the daylighting analysis performed on Arch[ane], which is the virtual eight floor underground city created by us within a research project developed at the University of Perugia [3]. Both architectural and city planning and daylight and indoor climate analysis were performed. The city was mainly created to evaluate the challenges in the daylighting design of underground cities. The examples of similar projects were analyzed to design the solutions.
Throughout history, mankind has built underground cities. There are about 200 underground cities in Turkey where the most famous and preserved is Derinkuiyu [4]. In Italy, other examples were discovered below the ground of Rome, Naples, Orvieto, and Narni. Some parts of these cities were damaged, either by natural disasters or by fire, but their ruins were built over and over again [5].
During the twentieth Century, cities authorities planned urban development without considering underground solutions. This approach caused excessive land consumption because of increasing urbanization processes. Currently, there is a need for three-dimensional urban planning, which can allow us to fully exploit the underground spaces. These spaces are now used for various functions such as the storage (e.g. food, water, oil, industrial products, and waste), industry (e.g., power plants), transport (e.g., railways, roads, and pedestrian tunnels), public networks (e.g., water, sewer, gas, and electric cables), public facilities (e.g., shopping centers and hospitals), and civil structures (e.g., garage for cars). The United Nations estimated that above the two third of population will live in urban areas in 2050; therefore, the underground solutions could represent a valid approach to avoid further problematic land consumptions. The opportunities given by underground spaces and their contributions aimed at improving cities’ sustainability have been recently reported in the scientific literature [6,7]. Currently, underground environments are realized in the most developed urban areas affected by adverse climate giving the possibility to the citizens to perform their activities regardless of weather.
One of these is the Underground City of Montreal (RÉSO) Canada. It is also known as the indoor city (ville intérieure), and is one of the largest underground complex in the world. It includes 32 km of tunnels, most with shops on both sides of the passage, more than twelve square miles of shopping centers, apartment buildings, hotels, banks, offices, museums, universities, seven metro stations, two train stations, one terminal regional bus, and the Bell Centre arena [8,9]. Another example is PATH, a network of 28 km underground pedestrian roads, realized under the ground of Toronto, Canada, connected with residential and office buildings, that houses an overall commercial area of above 371.600 m2 [10]. Similar projects were designed for Amsterdam (Amfora Project [11]), Chicago, and Shanghai [12].
The scientific literature does not provide strong support for the daylighting design of underground spaces. The most relevant studies in this topic were carried out by Bouchet [13] and Gugliermetti [14]. The aim of the first study was to propose rules to size and arrange skylights for underground spaces. The second study was referred to the daylighting design of a multilevel underground area using an approach based on the daylighting Factors (DFs) distribution. Nowadays, the importance of lighting from skylights and other vertical systems is crucial, and the advantages of their application on common and irregular-shaped roof buildings are proven [15]. A recent study performed by the University of Tehran reports the outcomes of a retrofitting project based on solar passive lighting, which has allowed to reduce the energy consumptions of above 20% [16]. Other relevant and innovative contributions in the field of skylight design are reported in [17,18]. Furthermore, light guides and other daylighting enhancement systems were analyzed but not considered at this preliminary stage of the research [19,20,21].
The paper is managed in the following manner. Section 2 describes the concept and the architectural design of Arch[ane], which is an eight-level underground city conceived and characterized by us. The city was placed at different latitudes to evaluate how its position affects the daylighting performance. The outcomes of this analysis are reported in Section 3. In Section 4, a comparative analysis of the illuminance values for eight-levels is reported, using the city of Rome as reference. Finally, a critical analysis of the work is performed in Section 5.
2. Description of Arch[ane]
While common cities fill empty spaces above ground, Arch[ane] maintains itself under the ground (Fig. 1). At a first glance, it seems that the city enters inside the terrain in a chaotic way. A deeper analysis of the empty spaces (Fig. 2) and of each one of its 8 levels indeed reveals a well-defined modularity (Fig. 3).
As a matter of fact, Arch[ane] is made by modular elements. The fundamental unit is a parallelepiped having a 100 m × 100 m base and a height of 50 m. This module is composed of 8 square pillars having a side of 10 m. The pillar is partially hollow to house the vertical connections among the floors, chimneys for forced ventilation and water, sewage, and electrical systems. An approximate estimation of the maximum load borne by the slab was performed (500 KN/m2).
The city Arch[ane] is composed of 8 overlapping levels and the maximum dimensions of the city are 1600 m × 1600 m × 400 m. Level 1 is the deepest and Level 8 is the closest to the ground surface. In Fig. 4, we show the map of the second level where white areas represent the void spaces allowing to transmitting the light from the surface to the deeper levels (skylights). Three sample sections of the city are shown in Fig. 5.
Two kinds of buildings were designed: stations and mixed-use buildings. The 512 stations (64 for each level) allow the mobility in the underground city where any place could be reached through 3 shifts along X, Y, and Z axis (Fig. 6). This conception of mobility requires a functional design of a regular grid for each level of streets and avenues, exchange stations, and big lifts to move between floors.
The advantages of an underground city like Arch[ane] are numerous:
- whether on the surface is 57.8°C such as in Al'Aziziyah (Libya) or -89.2 such as in Vostok (Antarctica). If there is raining, snowing, or shining, underground temperature remains almost constant;
- the insulation from the surface also results in the reduction of noise usually affecting common cities such as internal combustion engines, horns, sirens, airplanes etc. The city is a "box" and everything entering or leaving is controlled and checked;
- the city is separated by the external environment by screens opaque to the UVs, nevertheless the projects foresees skylights able to transmit light in the several floors of the underground city;
- the average temperature in the city will be about 17-18°C because of thermal gradient of the soil;
- electricity and thermal energy will be obtained by geothermal and concentrated solar power plants.
Some constraints of this solution are the costs and the potential vulnerability to flood events and to the Radon radio activity [22].
The transmission of daylight to the various floors is mainly obtained using 4 square skylights having a side of 200 m. Under each one of them, on the 1st level, a cone coated with high reflective and diffusive material is placed in order to improve the daylight illuminance in deeper floors. The cone has a height and a base diameter of 150 m. Moreover, to further foster the transmission of light, each Arch[ane] fundamental unit is provided of little square skylights, having a side of 35 m. The placement of all the skylights is reported in Figs. 2–4. The design and the placement of skylight were performed considering the outcomes of research in [12,13].
3. Daylighting analysis
Daylighting simulations were performed using DIALuxTM, which was used to evaluate the illuminance level on a grid of points inside the building taking into account:
- building latitude and longitude;
- optical characteristics (reflection and transmission coefficient, scattering, etc.);
- day and hour when the optical simulation is performed.
In order to reduce the calculation time, the analysis was limited to a scaled model 1:10 of a fourth of the whole city (400 m × 400 m × 400 m) considering the reflection cone under the biggest skylight, but without buildings and stations. Simulations of non-scaled model were not carried out due to computational errors and to high time consuming procedures.
The approach used in the study leads to an overestimation of the daylighting level, but it allows to evaluate and to make comparison about spreading of daylight on the eight levels of the city. The inclusion of buildings in daylighting simulations would result in a limitation of the analysis to a smaller area and/or to few levels. The daylight transmission is due to only square skylights. In addition to the large one over the reflecting cone (surface of 40000 m2), 60 little square skylights (1225 m2 each) were designed for each level. The positions of the skylights are the same in the eight levels (Fig. 7).
The illuminance level was calculated in 8 square grids, one per floor, and each grid had 16 points per side with a range of 50 m.
Concerning the optical properties, the following assumptions were made:
- skylights were considered that were made of a glass having a coefficient of transmission equal to 90% and roughness 0%;
- walls, pillars, and pavement were supposed to be light grey color with a coefficient of reflection equal to 90% and roughness 40%;
- ceilings were supposed to have the same optical properties of walls, pillar, and pavements with light cyan color.
These high reflection values for walls, pavements, and ceilings were chosen to maximize the quantity of daylight on each level. The roughness of the surfaces can limit glare issues.
The daylighting analysis was performed by positioning Arch[ane] in 7 different cities, representative of different latitudes and climates: Singapore (Latitude 1°N), Bangkok (13°N), Honk Kong (22°N), Houston (29°N), Rome (41°N), London (51°N), and Helsinki 60°N). Moreover, the simulations were carried out by considering four different days (2 equinoxes and 2 solstices) and, for each day, three different hours (2 hours after the sunrise, noon, and 2 hours before the sunrise). The yearly average illuminance value for each level of the cities modeled is reported in Table 1. Obviously, the average value of the illuminance decreases with the increase of the Latitude; therefore, the highest values were observed by positioning Arch[ane] nearby the city of Singapore. By analyzing data in Table 1 and Fig. 8, it should be considered that the first level is the deepest. The results of the simulations could be a little overestimated also because the screening effect of clouds was not taken into account; nevertheless, the main goal of the paper is not to estimate the effective yearly average value of illuminance due to daylighting, but rather to evaluate how the latitude of the city and the depth of their levels influences the illuminance. For the same reasons, glare issues were not analyzed in detail. The trends of the average value of the illuminance in each case study can be also analyzed through Fig. 8.
Table 1
Table 1. Yearly average value of the daylighting illuminance (lux) for each floor of the modeled cities.
Figure 8
Fig. 8. Yearly average value of the daylighting illuminance for each level of the examined cities.
Figure 8 reports the relationship between the yearly daylight average value of the illuminance in the various cities and the level in which the value was estimated. The performed simulations show that the relative differences between the yearly average values of the daylighting illuminance of the same two consecutive levels are quite similar in each one of the various cities. The trends of the average illuminance curves of each city are also comparable. To evaluate these aspects in Fig. 9, the maximum, average, and minimum percentage value of the illuminance estimated in each one of the modeled cities are reported, considering in each city that the 100% value is the one observed in its 8th floor. Analyzing the behavior using percentages and not the absolute value, little differences from the average were observed. Moreover, from the 1st to 5th level, the illuminance is approximately between the 20% and 40% from the value observed in the 8th level in each city (Fig. 9). The absence of an important decrease of the illuminance in deeper levels is mainly due to the effect of the reflective cone positioned under the biggest skylight.
Figure 9
Fig. 9. Comparison of maximum, average, and minimum illuminance value in each level of the various cities and illuminance observed in the 8th floor.
Generally, the absolute differences between estimated illuminance in two consecutive levels decrease with the increase of the depth of the levels. In the following section, the results of the daylight simulations that are performed considering Arch[ane] located nearby Rome are reported in detail.
4. Arch[ane] Rome model
The estimated yearly daylight average value of the Arch[ane] model placed in Rome (41°N Latitude) ranged from 9700 lux of the 8th level to the 1900 lux of the 1st level (Table 1). A detailed evaluation was also performed, and the average illuminance value for the 1st and 8th level was obtained considering the sun at noon for 12 days. The days chosen for the evaluation were between the 20th and 22nd day of each month; thus, equinoxes and solstices were comprised in the analysis. The results are summarized in Table 2 and Figs. 10 and 11. Both Figures report the absolute value in terms of klux estimated in each one of the considered 8 levels and 12 days; nevertheless, the first approximates the trend of the illuminance in each level during the year while the other one highlights the effect of the depth of the level.
Table 2
Table 2. Absolute values of the daylighting illuminance (lux) of the twelve analyzed days in Rome.
Figure 10
Fig. 10. Trend of the average iluminance values for eight levels of the Arch[ane], which is placed in Rome, considering the sun at noon for each one of the considered days where Level 1 is the deepest and Level 8 is the closest to the ground.
Figure 11
Fig. 11. Analysis of depth of the level on the average value of the illuminance for each one of the considered days in Rome where Level 1 is the deepest and Level 8 is the closest to the ground.
Table 3, which reports the percentage ratios between the illuminance value of the analyzed day and its maximum evaluated value for the same floor in the twelve considered periods, shows that the effect of daylighting on the level 8 is quite different from the others.
Table 3
Table 3. Percentage ratios between the illuminance value of the analyzed day and its maximum value evaluated for the same floor.
4.1 Results: levels 1-7
In levels 1-7, the average illuminance values estimated from October to February were quite similar. These differences decreased with the depth of the level. In particular, these values ranged on Level 1 from 1750 to 2200 lux. The illuminance raised after the spring equinox until May and decreased from July to the autumn equinox with a similar trend in opposite direction. Concerning the summer solstice, the values estimated in this day were similar to the ones observed in May and July. Moreover, in these levels, the analysis of Fig. 11 highlights that there are some similarities between the estimated daylighting effects in the selected days of:
- January (the lowest) and November;
- February, October, and December;
- March and September (the two equinoxes);
- April and August;
- May, June (the highest), and July.
4.2 Results: level 8
The average illuminance value presents a strong increase from January to May and a strong decrease from July to December. Two exceptions were observed in April and August because of geometry and the position of the skylights. In these months, the quote of direct light that passed to the deepest levels was higher than the one observed in March and September, respectively. In Fig. 12, a comparison is conducted of the same city area, which is illuminated in March and April. As observed in the other levels, the effect of daylighting for the level 8 in analyzed days of May, June, and July were similar.
Figure 12
Fig. 12. Extract of the project rendering considering the daylighting condition of (a) 20th March and (b) 20th April of the Arch[ane], which is placed in Rome.
4.3 Render
The estimated illuminance level in the grid knots of the level 1 of the underground city was used to draw contour lines. Each contour line was made of points characterized by the same value of illuminance. The highest values were not nearby the projection of the bigger skylight to the floor. Under this skylight, there were some missed values due to the presence of the light reflection cone. Figure 13 shows the positive effects of the reflection cone that allows to spread light in a wider surface. In Fig. 14, two pseudocolor images are shown that represent the effect of daylighting at the summer solstice, considering the sun at noon.
Figure 13
Fig. 13. (a) average value per floor illuminance and (b) Isolux contour lines of the 1st level in Rome.
Figure 14
Fig. 14. Pseudocolor image of the Arch[ane] placed in Rome, considering the sun at noon of the summer solstice (a) top view (b) side view.
5. Critical analysis, conclusions, and future developments
The overall study constitutes a first attempt of a structural, logistic, thermo-fluid dynamics, and daylighting characterization of the city. In particular, the paper reports the results and some rendering of the daylighting simulations by considering a scale model 1:10 of a forth part of the city without considering buildings and stations. Furthermore, the effect of clouds or fog was not considered. This approach can cause an overestimation of the illuminance values and allows to make useful comparison between the 7 examined cities and between the 8 levels. For each one of the 7 examined cities, the estimated yearly average values of the illuminance between levels 1-5 are quite similar, and they are approximately between the 20% and the 40% of the values observed on the level closest to the ground (level 8). These results were obtained because reflective cone allows to obtain higher values in the areas placed in the deeper levels and more distant from the bigger skylight. A detailed analysis was also performed in order to evaluate the difference of illuminance during the year in the deepest level and in the one closest to the ground. The effect of the indirect diffused light in the deeper level causes a smoother trend of the illuminance during the year. On the contrary, the level 8, being closer to the ground, is mainly affected by direct lighting; thus, the differences between the illuminance levels during the year are higher. An exception is represented by the period between the summer solstice when the illuminance value is quite constant. This effect was observed also on the other levels. In the Arch[ane] city placed in Singapore (longitude close to 0°). The illuminance ranges from 13800 lux to 3611 lux on the estimated Level 8 and Level 1, respectively. For the city in Helsinki, the values range from 4731 lux to 946 lux.
A detailed analysis was performed evaluating the daylighting effect in 12 different days belonging to different months (equinoxes and solstices included), and each one of them characterized by the sun at noon, positioning Arch[ane] at Rome coordinates. The outcome of the study proves that the effect of daylighting on the level closer to the ground is quite different from the others for the 12 analyzed days. Generally, the highest and the lowest values were observed in January (1754 and 7734 lux on level 1 and level 8, respectively) and in June (8410 and 28123 lux), respectively. These illuminance values were estimated by considering a scaled-model, the sun at noon, without buildings, and the absence of clouds. A realistic estimation of the illuminance value should take into account these effects. Further analysis should be performed to evaluate glare in detail, even if the high roughness of walls, pavement, ceilings, and of the reflective cone limits this phenomenon. However, the results cannot be considered as representative of the real values. The simulations allowed to determine the relationships between the illuminance values of the eight levels and the latitude influence on Arch[ane] daylighting.
The lack of illuminance can be covered by innovative and efficient systems of artificial light sources that should be able to reproduce the effect of a night-time sky. The installation of technical solutions such as light guides and innovative artificial systems will be considered to increase the illuminance values in the deeper levels and in the night-time.
The daylighting simulation software has shown all its computational strength and the good quality of the rendering processes (realized through the ray tracing program POV-Ray).
Acknowledgments
The authors are indebted with Prof. Arch. Franco Purini and with Prof. Arch. Enrico Ansaloni for their fruitful contributions and suggestions in the absence of which this research project would lose its innovative component from the architectural point of view.
Contributions
C. Merli Alcini conceived the architectural design of the underground city. F. Asdrubali and S. Schiavoni defined the boundaries of the daylighting analysis. C. Merli Alcini built the 3-D model of the city in DIALux and assigned the optical characteristics of the materials considering the suggestions of F. Asdrubali and S. Schiavoni. S. Schiavoni defined the light scenes to be considered and carried out the daylighting analysis. S. Schiavoni wrote the paper considering the first draft of C. Merli Alcini and the reviews of F. Asdrubali. F. Asdrubali supervised all the activities reported in the paper. F. Asdrubali and S. Schiavoni modified the paper after receiving reviewers’ comments.
References
- M. Naimark, Aspen the Verb: Musings on Heritage and Virtuality, Teleoperators and Virtual Environments, 15 (2006) 330–335. http://dx.doi.org/10.1162/pres.15.3.330
- F. Purini, Attualità di Giovanni Battista Piranesi, Librìa, Foggia, 2008.
- C. Merli Alcini, Arch[ane] virtual underground city, M.Sc. Thesis, University of Perugia, 2014.
- Ö. Aydan, R. Ulusay, Geotechnical and geoenvironmental characteristics of man-made underground structures in Cappadocia, Turkey, Engineering Geology 69 (2003) 245–272. http://dx.doi.org/10.1016/S0013-7952(02)00285-5
- F. Ardito, Viaggio nell’Italia sotterranea, Giunti Editore, Firenze, 2010.
- N. Bobylev, Mainstreaming sustainable development into a city's Master plan: A case of Urban Underground Space use, Land Use Policy 26 (2009) 1128–1137. http://dx.doi.org/10.1016/j.landusepol.2009.02.003
- C. Zhang, Z. Chen, and X. Yang, The Study About the Integrated Planning Theory of Surface and Underground Urban Space, Procedia Engineering 21 (2011) 16–23. http://dx.doi.org/10.1016/j.proeng.2011.11.1982
- J. Besner, Underground Cities for Peoples: The “Humanization” of the Montreal Underground City and its Metro, in: 13th World Conference of ACUUS, Singapore, 2012.
- S. Durmisevic, The future of the underground space, Cities 16 (1999) 233–245. http://dx.doi.org/10.1016/S0264-2751(99)00022-0
- P. Bélanger, Underground landscape: The urbanism and infrastructure of Toronto’s downtown pedestrian network, Tunnelling and Underground Space Technology 22 (2007) 272–292. http://dx.doi.org/10.1016/j.tust.2006.07.005
- R. Jansma, Amfora Amsterdam, Alternative Multifunctional Subterranean Development Amsterdam, in: 45th ISOCARP congress, Porto, Portugal, 2009.
- L. He, Y. Song, S. Dai, and K. Durbak, Quantitative research on the capacity of urban underground space – The case of Shanghai, China, Tunnelling and Underground Space Technology 32 (2012) 168–179. http://dx.doi.org/10.1016/j.tust.2012.06.008
- B. Bouchet and M. Fontoynont, Day-lighting of underground spaces: design rules, Energy and Buildings 23 (1996) 293–298. http://dx.doi.org/10.1016/0378-7788(95)00954-X
- F. Gugliermetti and S Grignaffini, Shafts for daylighting underground spaces: sizing guidelines, Lightining Research and Technology 33(2001) 183–194. http://dx.doi.org/10.1016/j.rser.2011.03.031
- F. Asdrubali, Daylighting performance of sawtooth roofs of industrial building, Lighting Research and Technology 35 (2003) 343–359. http://dx.doi.org/10.1364/OE.20.009004
- Y. Nasersharifi and M.K. Assadi, Skylight application for natural lighting in a Building; The University of Tehran Branch of Melli Bank case study, in: 4th International Conference on Production, Energy and Reliability, Kuala Lumpur, Malaysia, 2014.
- J.M. Almodóvar and I. Domínguez, Scientific design of skylights: The case of an office building in Gelves, Seville, in: 28th International PLEA Conference, Opportunities, Limits & Needs Towards an environmentally responsible architecture, Lima, France, 2012.
- L. Ghobad, W. Place, and S. Cho, Design optimization of square skylights in office buildings, in: 13th Conference of the International Building Performance Simulation Association, Chambery, France, 2013.
- S. C. Molteni, G. Courret, B. Paule, L. Michel, and J.L. Scartezzini, Design of anidolic zenithal lightguides for daylighting of underground spaces, Solar Energy 69 (2001) 117–129. http://dx.doi.org/10.1016/S0038-092X(01)00065-2
- M.G. Nair, K. Ramamurthy, and A.R. Ganesan, Classification of indoor daylight enhancement systems, Lighting Research and Technology 46 (2014) 245–267. http://dx.doi.org/10.1177/1477153513483299
- V. R.M. Lo Verso, E. Fregonara, F. Caffaro, C. Morisanov, and G. Maria Peiretti, Daylighting as the Driving Force of the Design Process: from the Results of a Survey to the Implementation into an Advanced Daylighting Project, Journal of Daylighting 1 (2014) 36–55. http://dx.doi.org/10.15627/jd.2014.5
- X. Li, B. Zheng, Y. Wang, and X. Wang, A study of daily and seasonal variations of radon concentrations in underground buildings, Journal of Environmental Radioactivity 87 (2006) 101–106. http://dx.doi.org/10.1016/j.jenvrad.2005.11.002
Copyright © 2015 The Author(s). Published by solarlits.com.
 HOME
HOME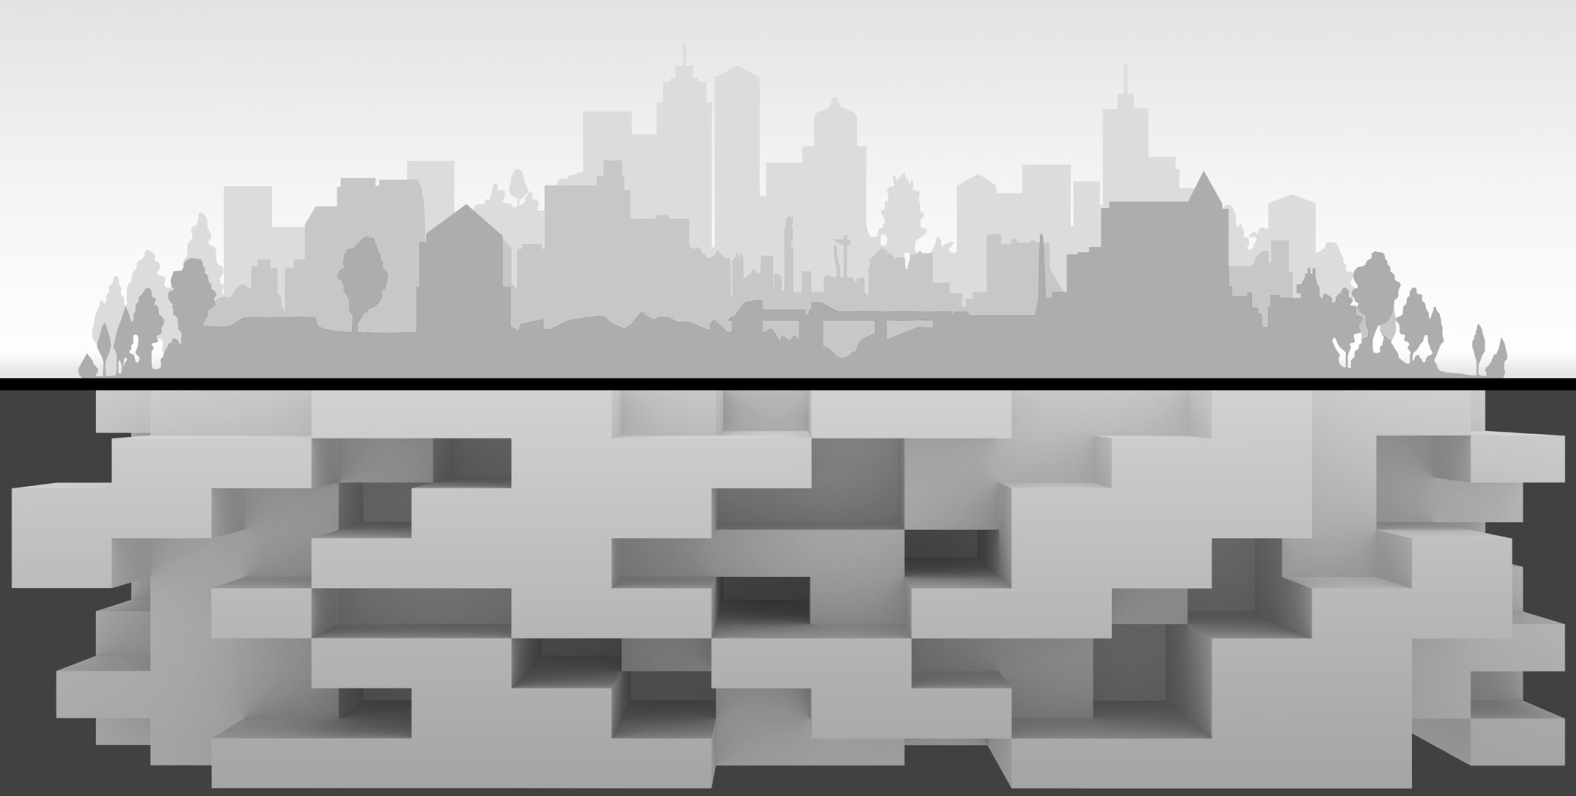 Figure 1
 Figure 2
 Figure 3
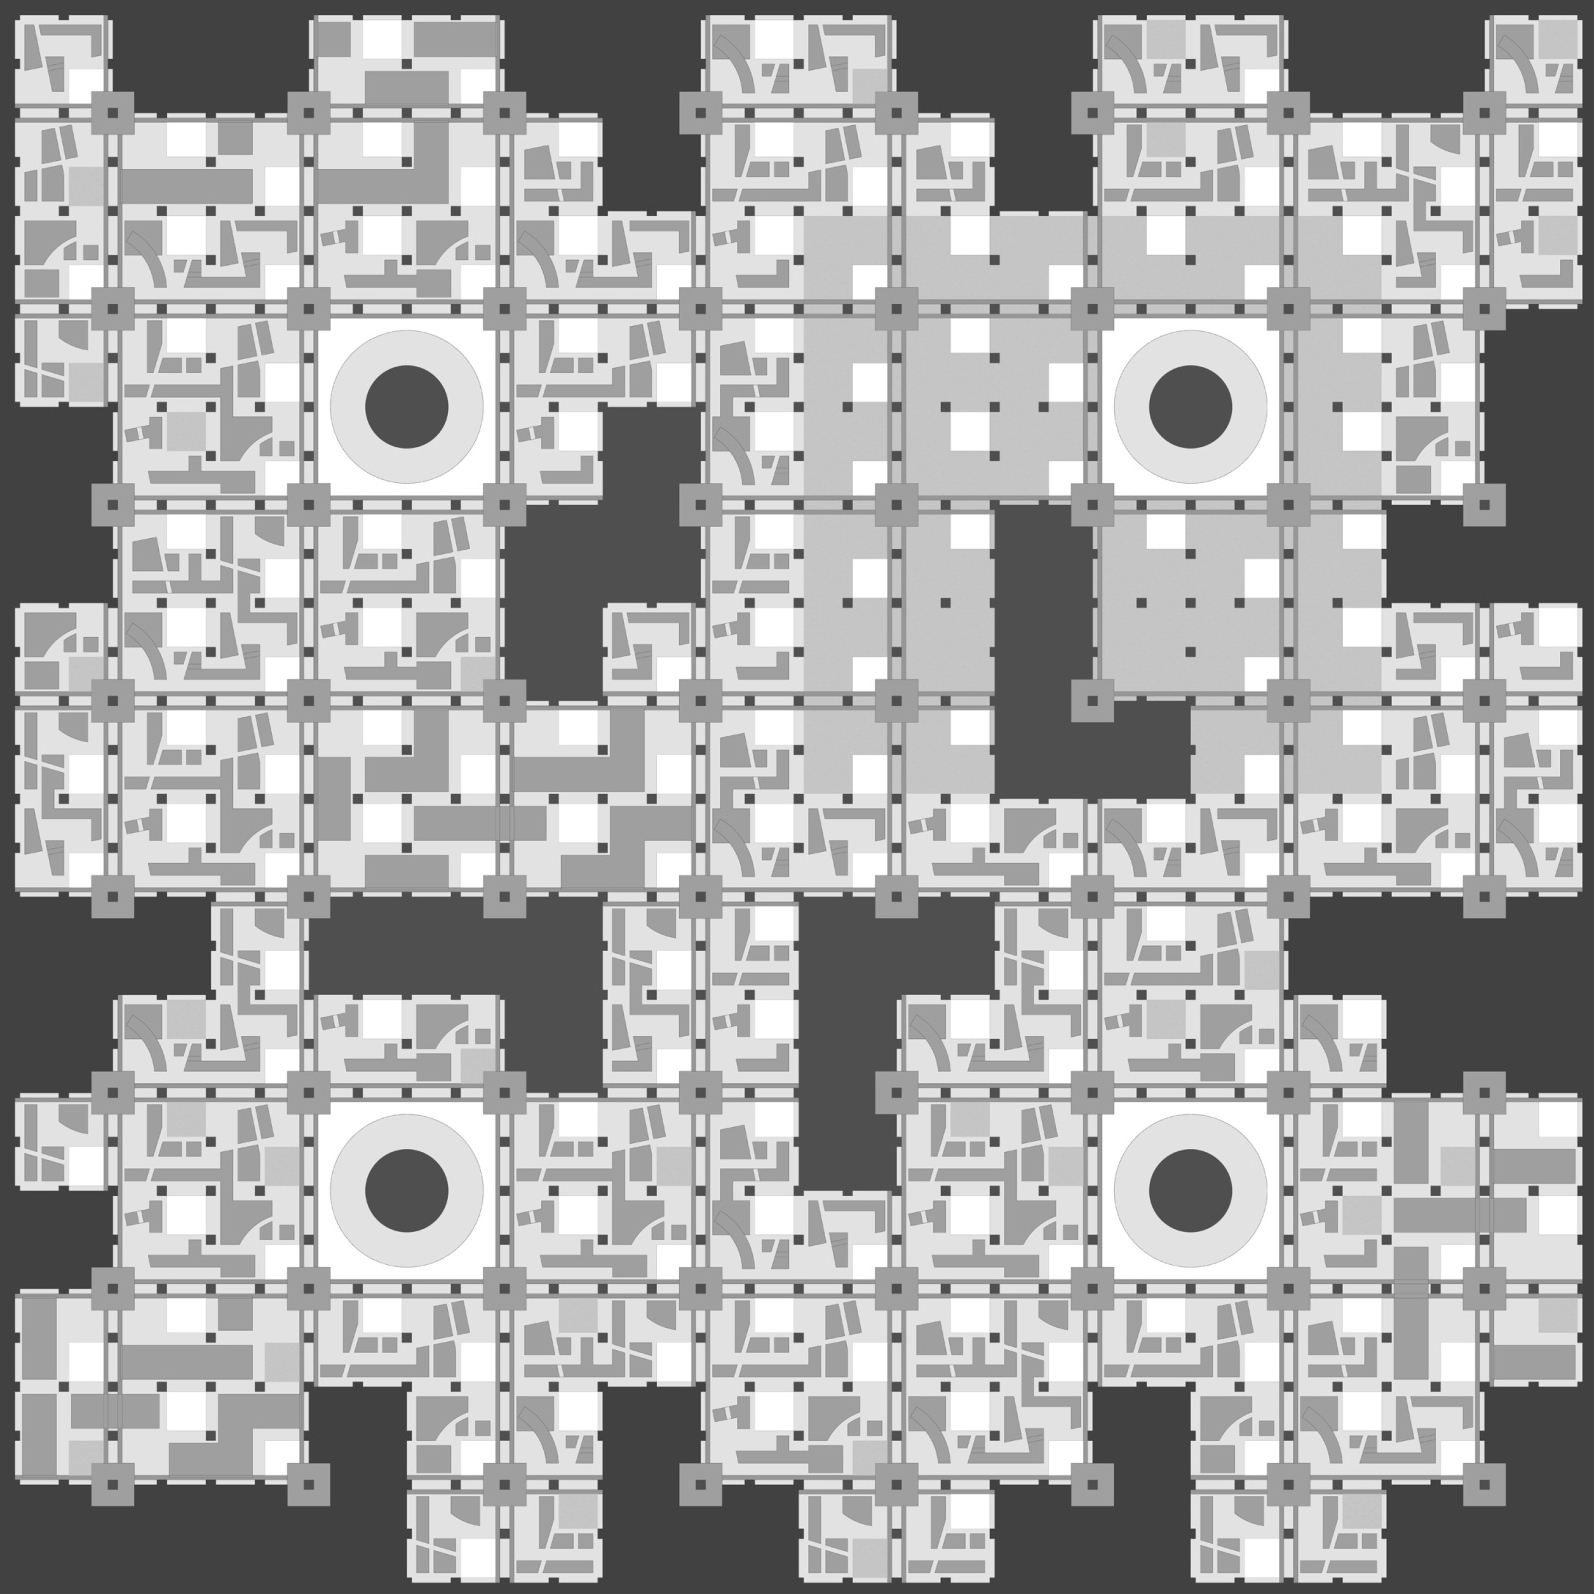 Figure 4
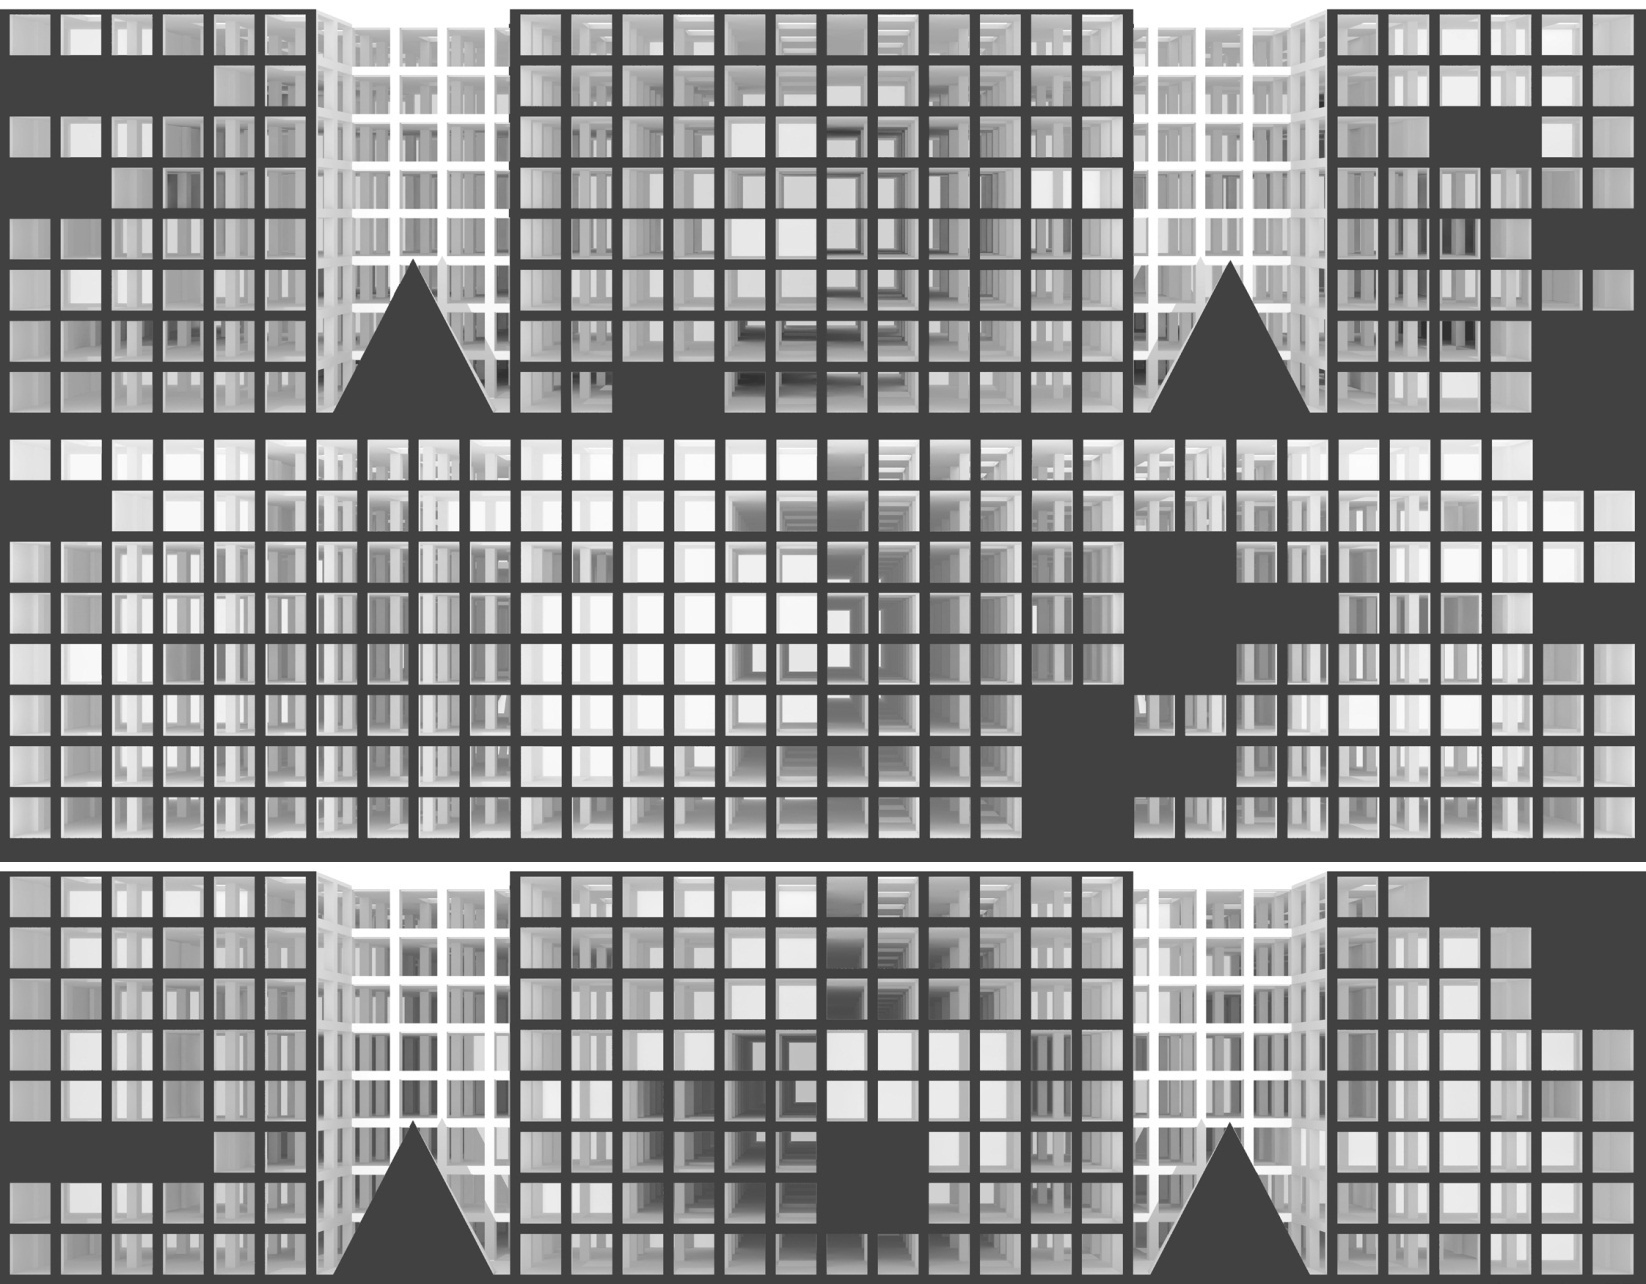 Figure 5
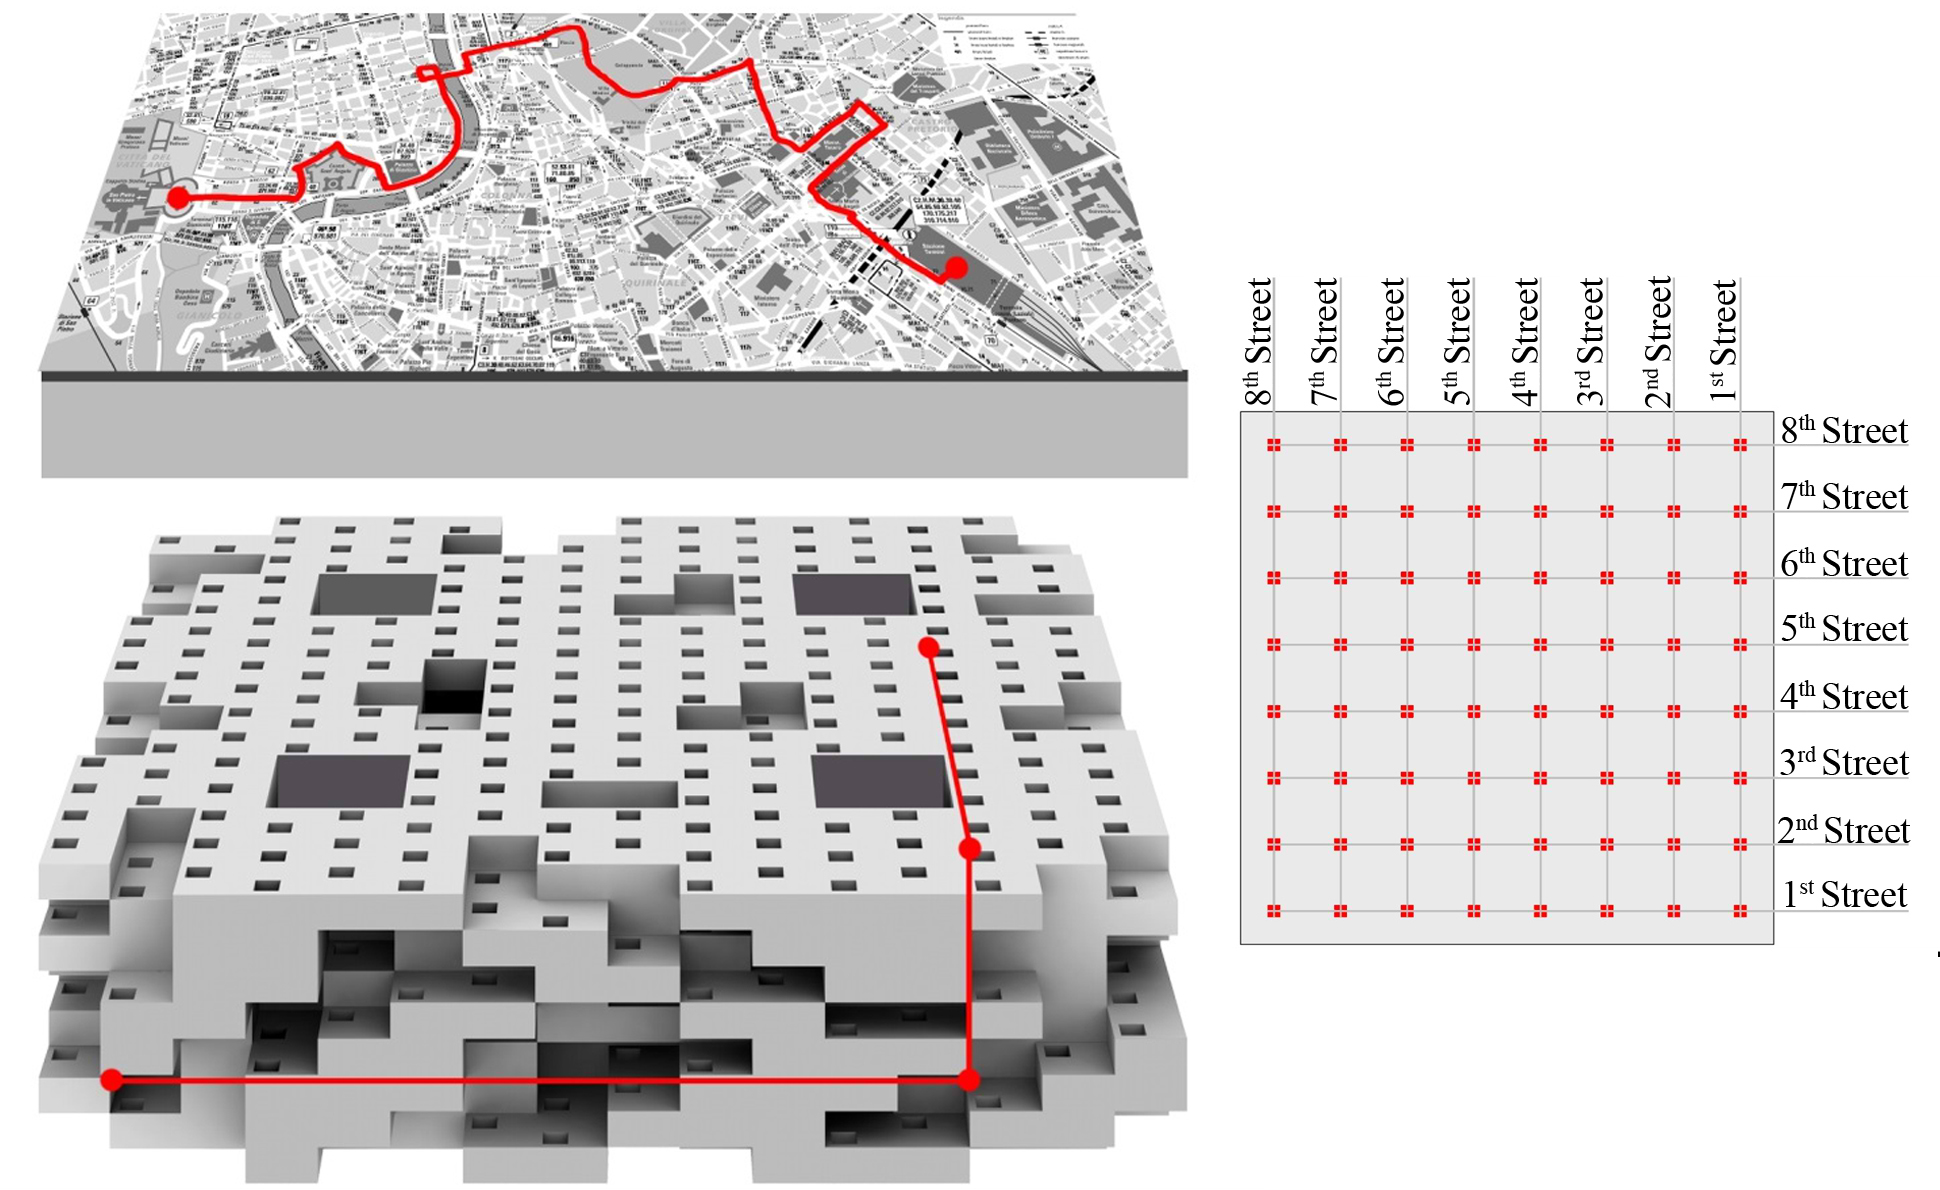 Figure 6
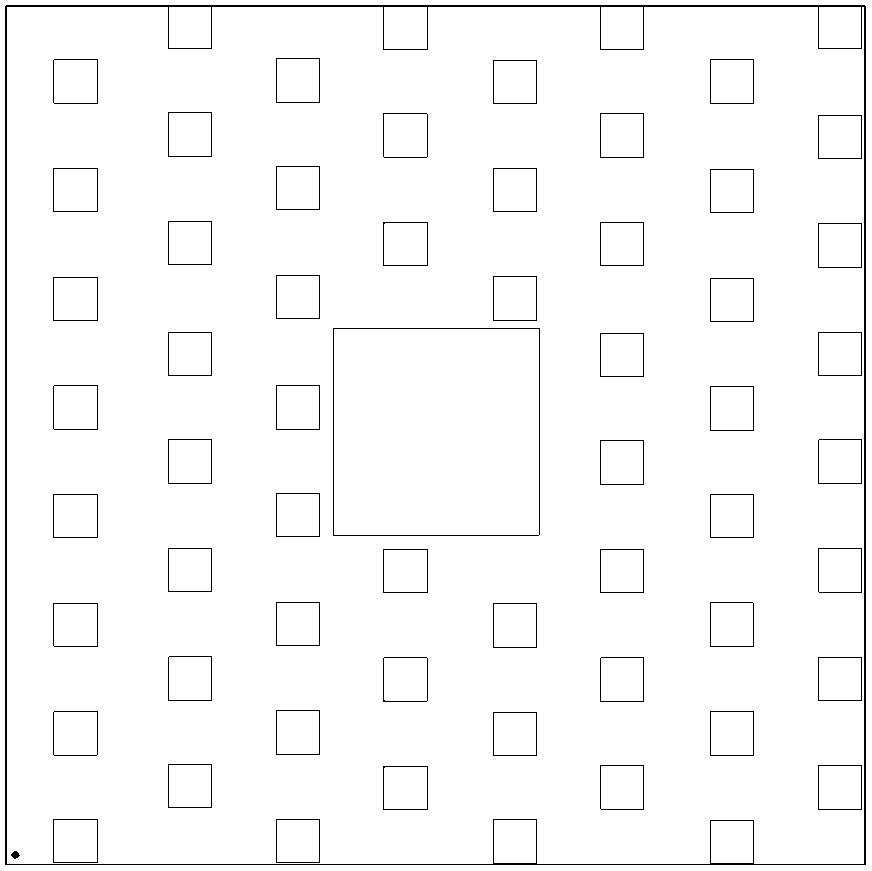 Figure 7
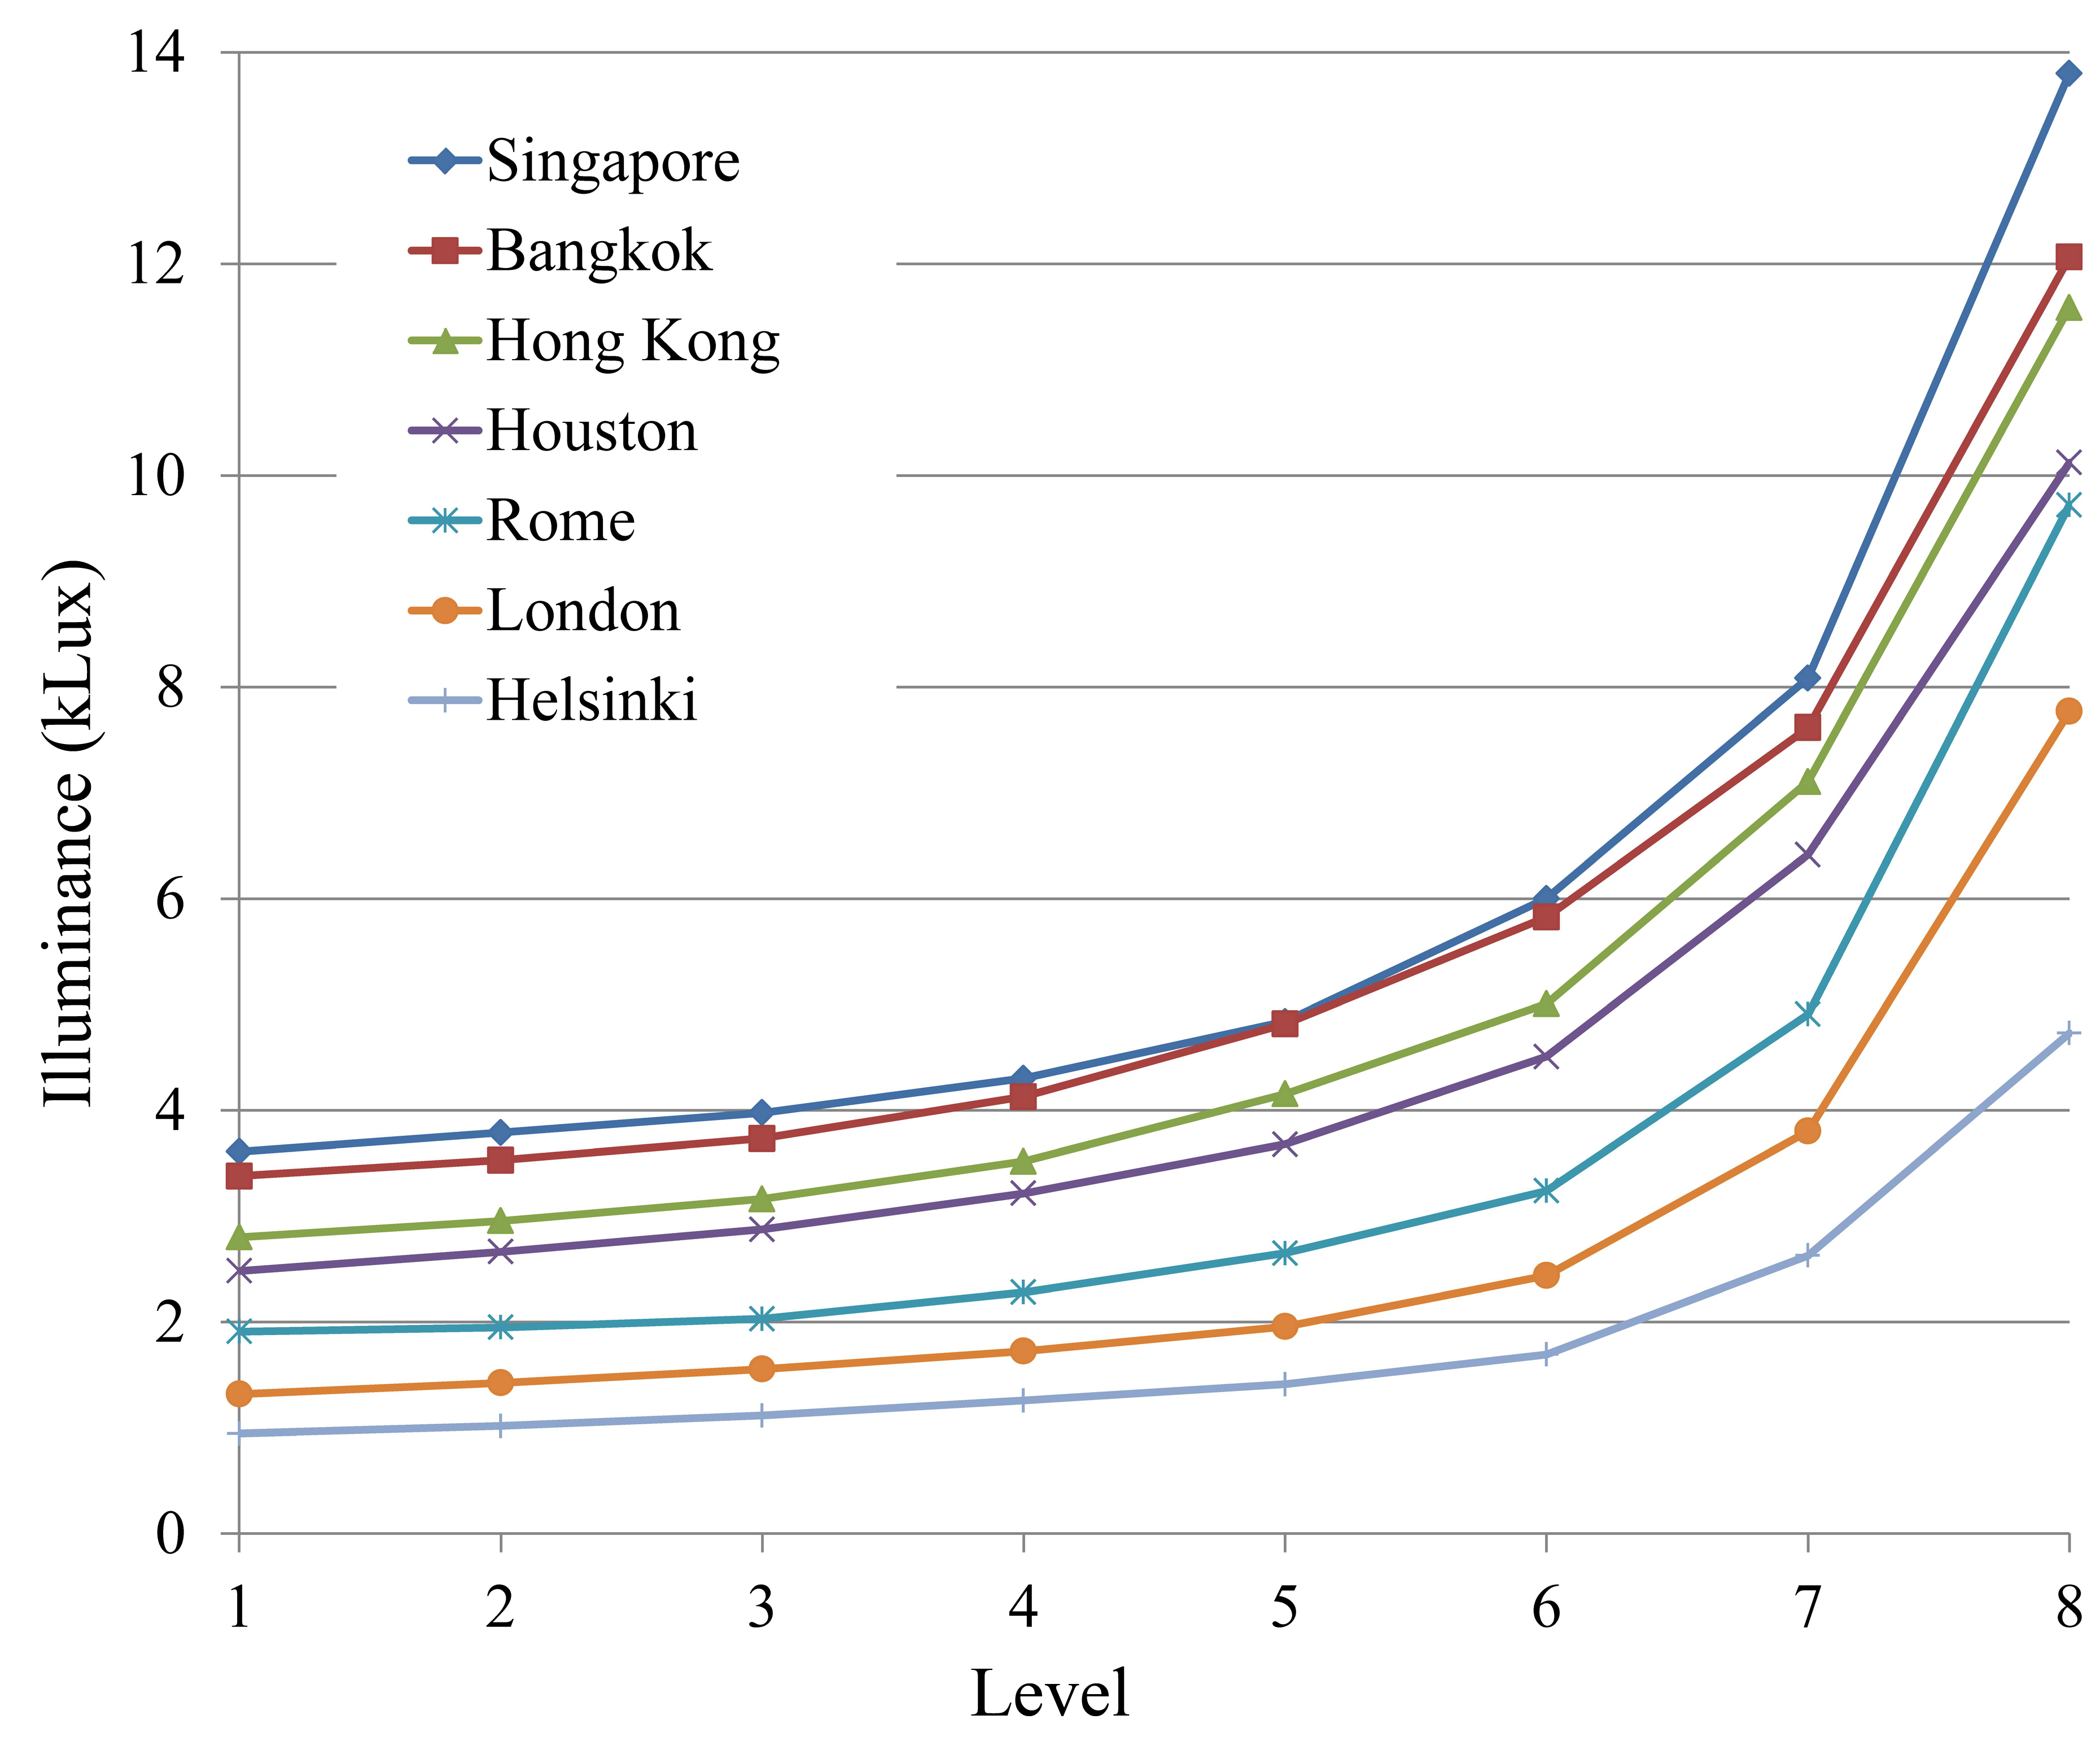 Figure 8
 Table 1
 Table 2
 Table 3
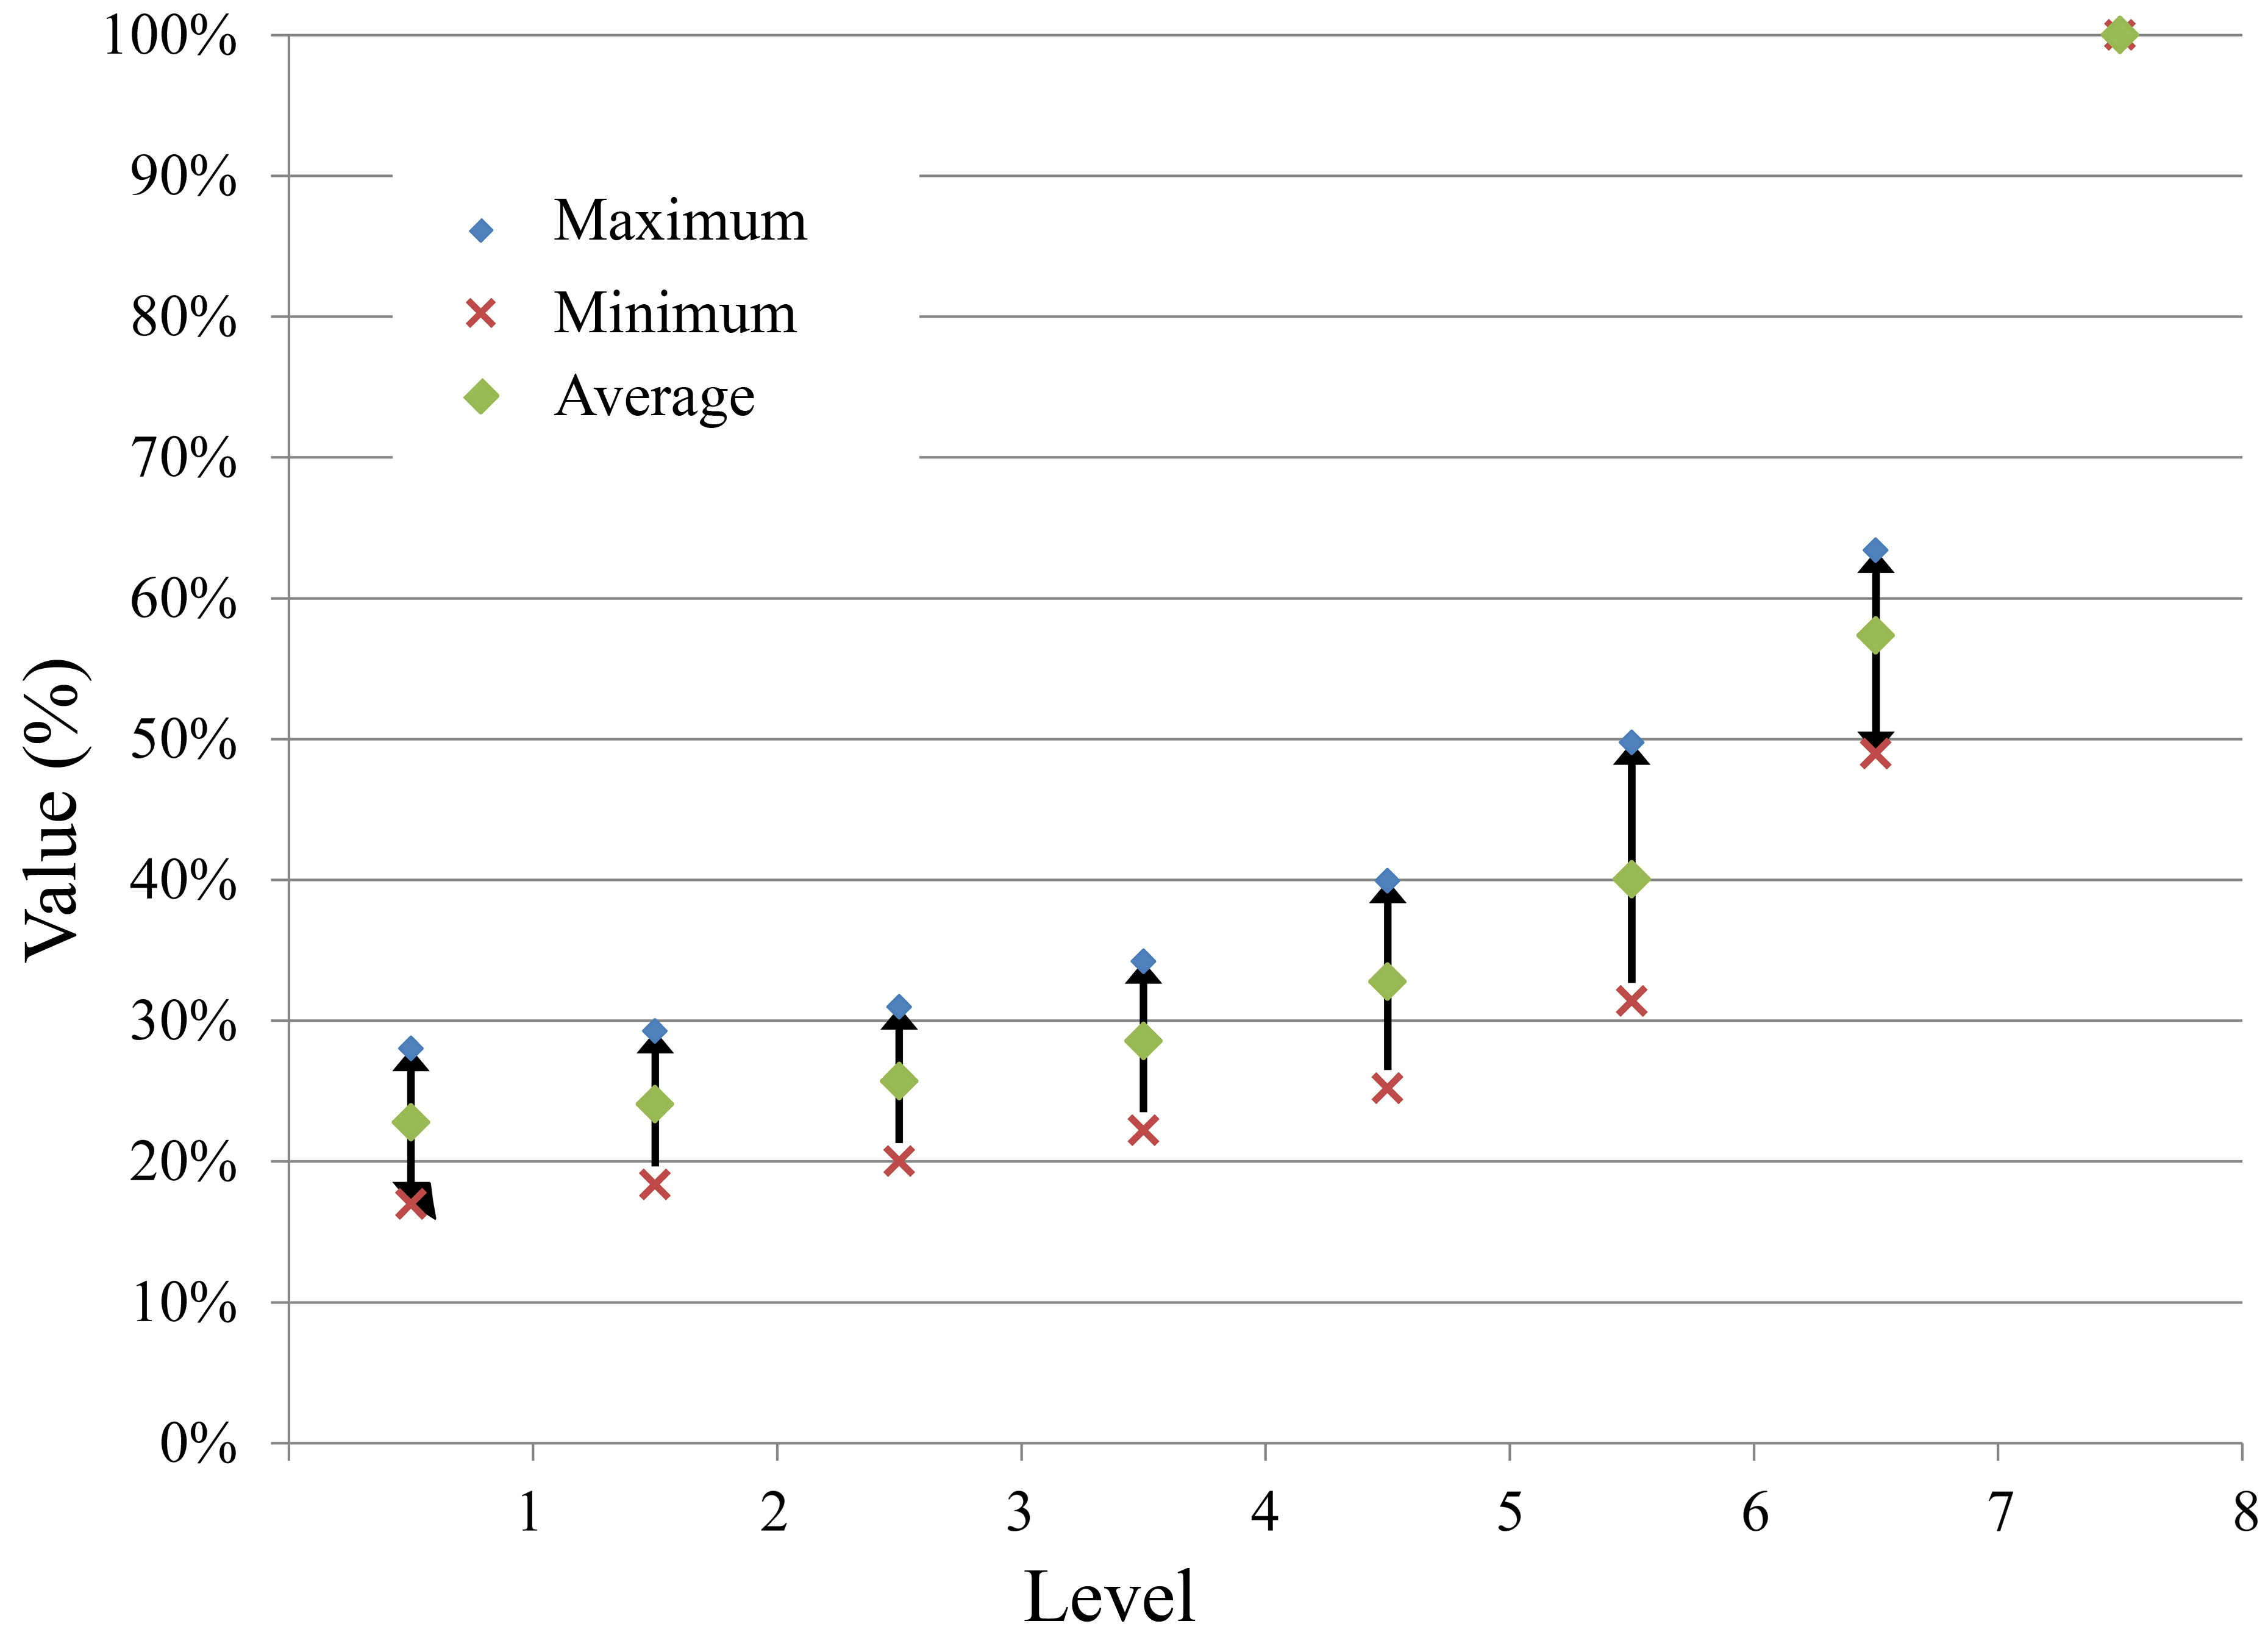 Figure 9
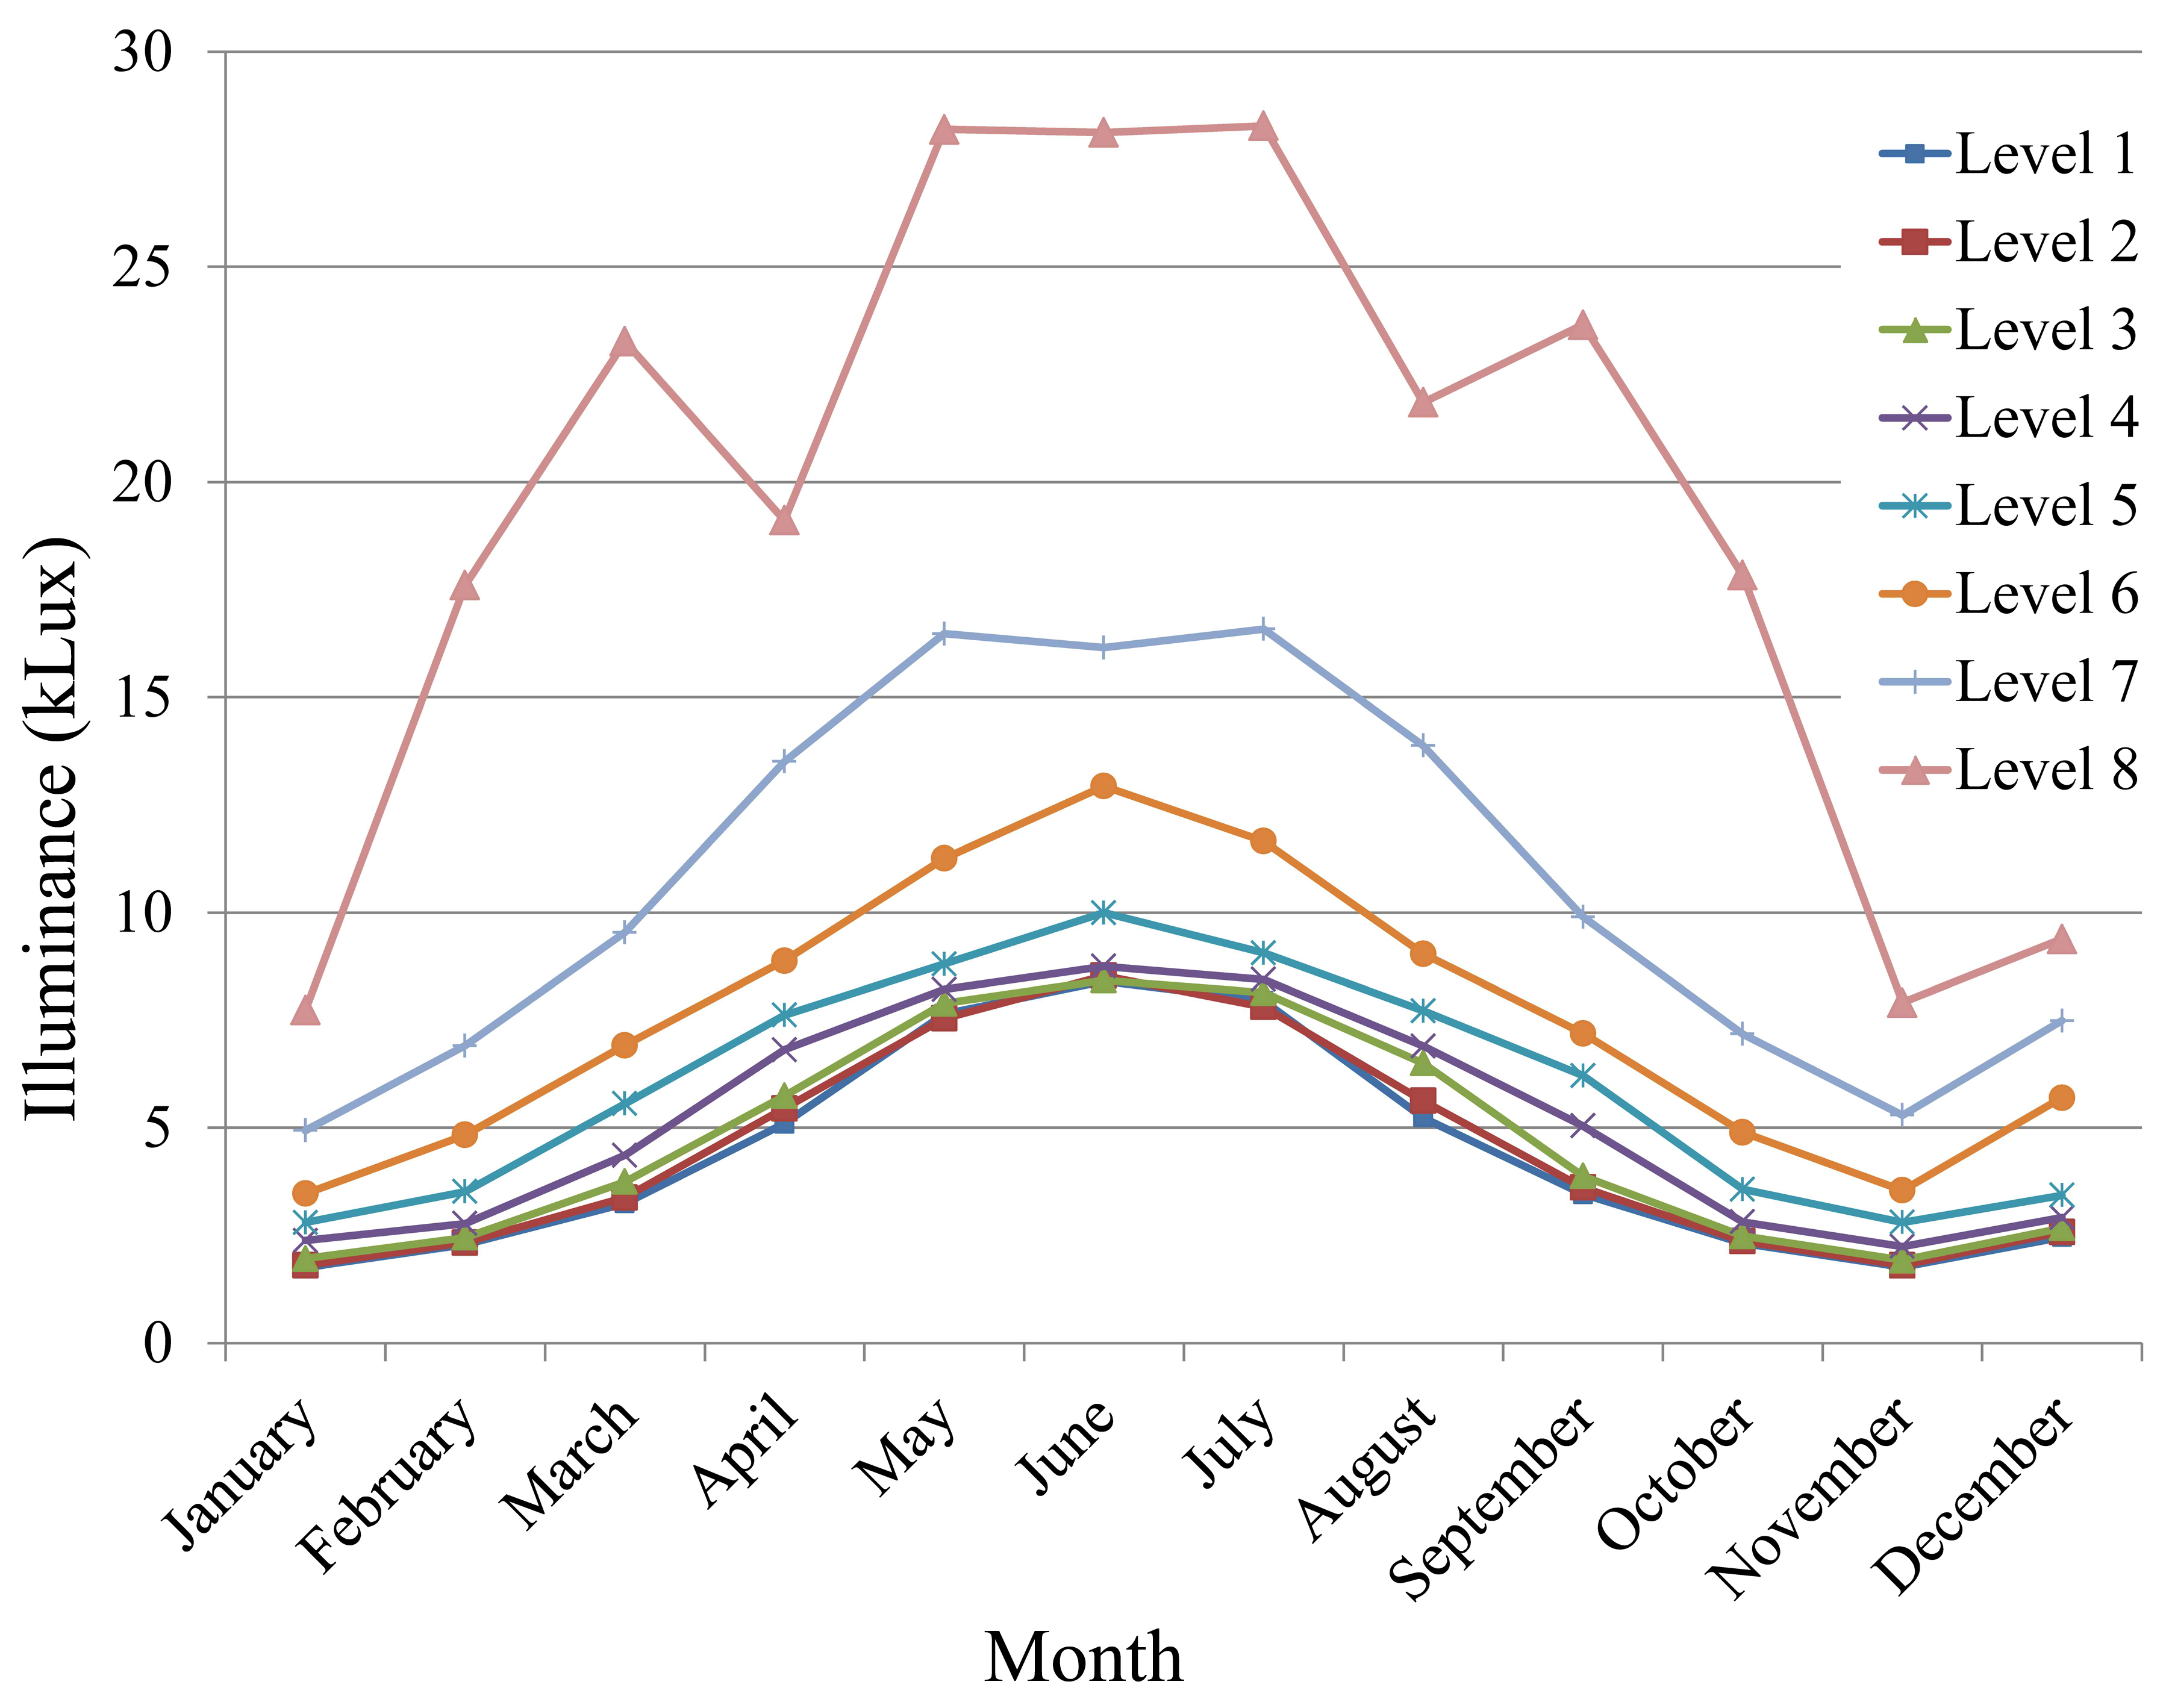 Figure 10
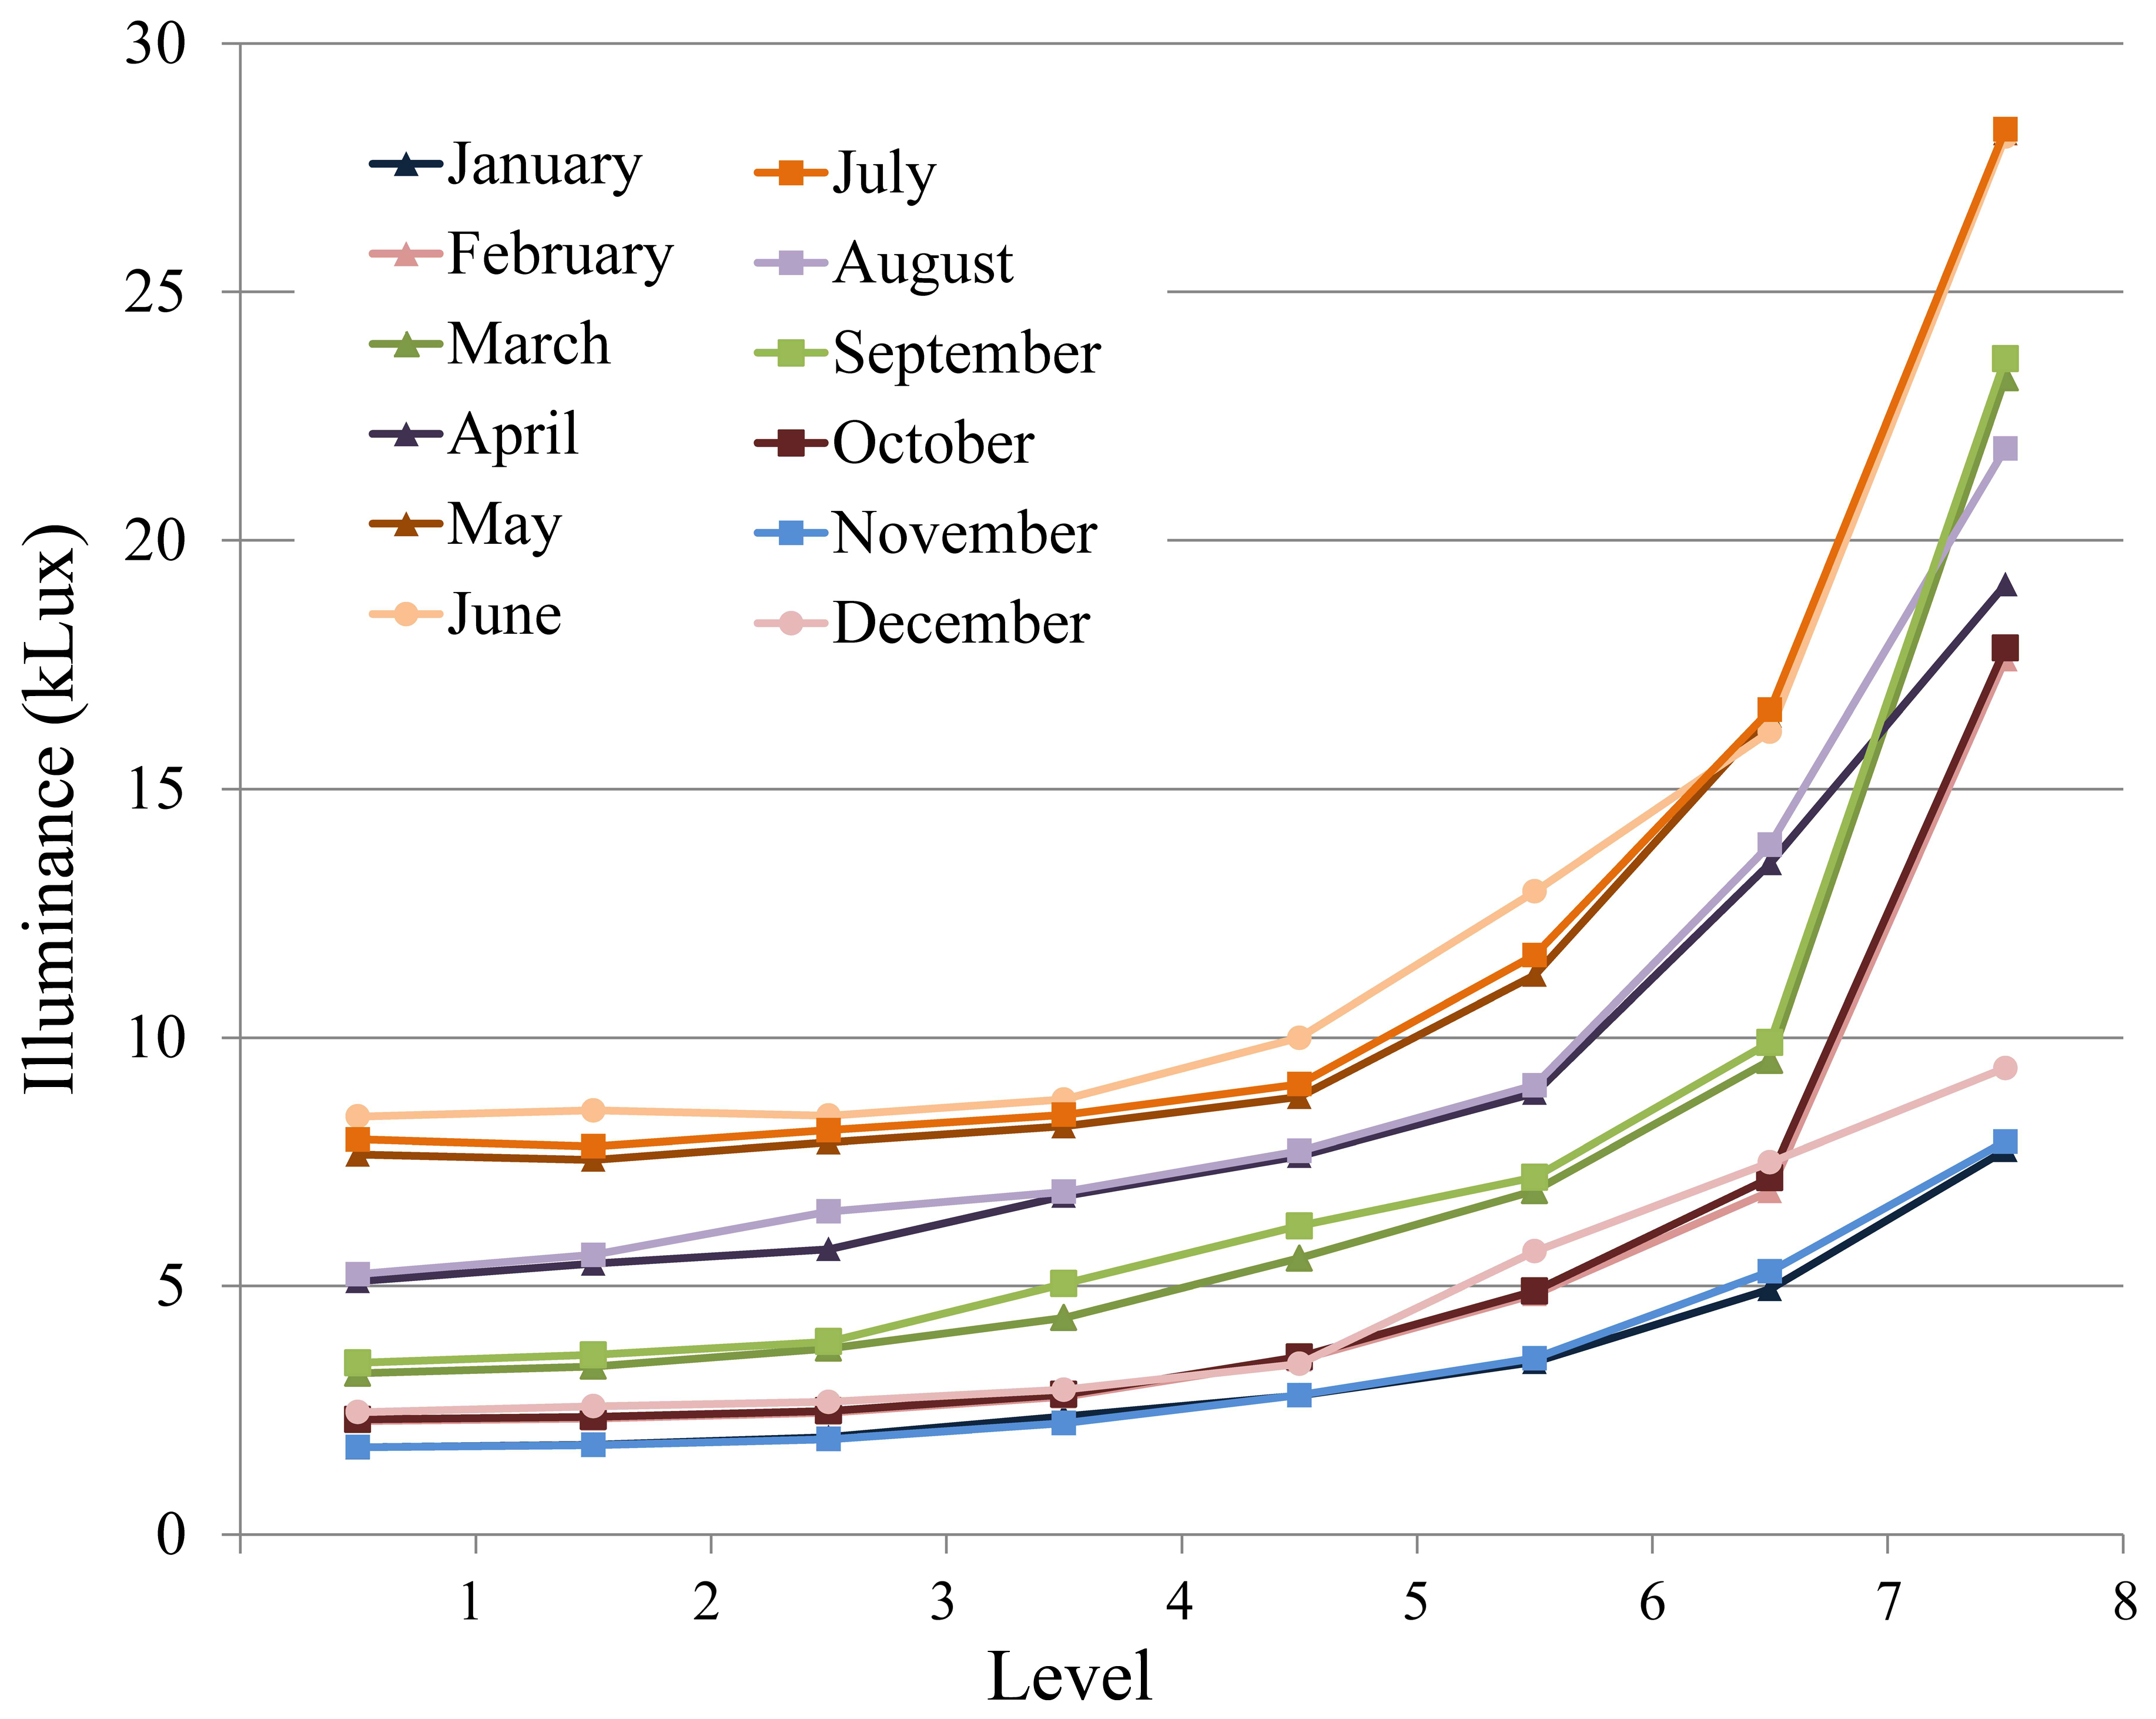 Figure 11
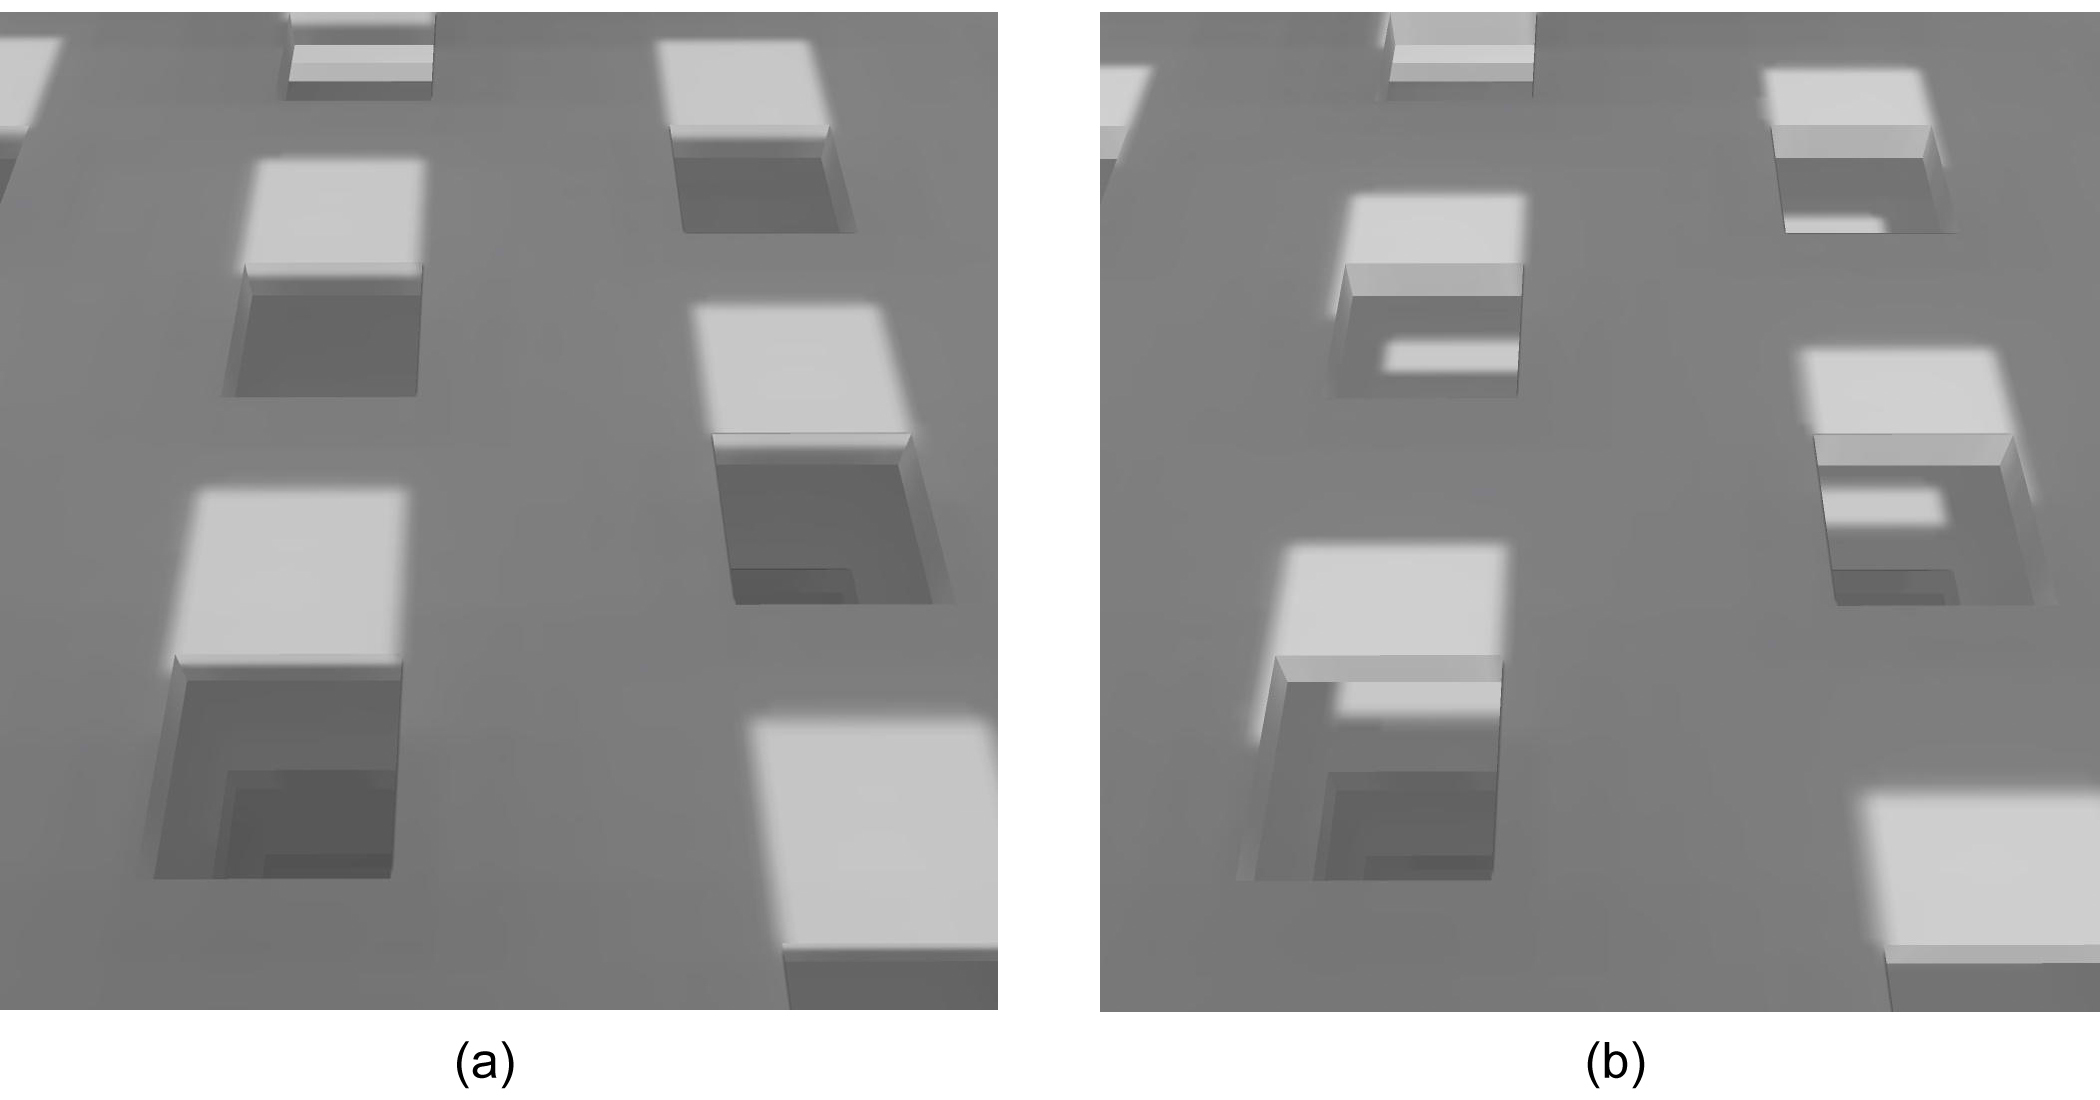 Figure 12
 Figure 13
 Figure 14


