Volume 2 Issue 2 pp. 32-43 • doi: 10.15627/jd.2015.6
Annual Performance Assessment of Complex Fenestration Systems in Sunny Climates Using Advanced Computer Simulations
Author affiliations
Solar Energy and Building Physics Laboratory, École Polytechnique Fédérale de Lausanne, CH-1015 Lausanne, Switzerland
* Corresponding author. Tel: +41 79 4713177
chantal.basurto@epfl.ch, chantal.basurto@gmail.com (C. Basurto)
jerome.kaempf@epfl.ch (J. H. Kämpf)
jean-louis.scartezzini@epfl.ch (J.-L. Scartezzini)
History: Received 10 August 2015 | Revised 2 October 2015 | Accepted 6 October 2015 | Published online 9 October 2015
Copyright: © 2015 The Author(s). Published by solarlits.com. This is an open access article under the CC BY license (http://creativecommons.org/licenses/by/4.0/).
Citation: Chantal Basurto, Jérôme H. Kämpf, and Jean-Louis Scartezzini, Annual Performance Assessment of Complex Fenestration Systems in Sunny Climates Using Advanced Computer Simulations, Journal of Daylighting 2 (2015) 32-43. http://dx.doi.org/10.15627/jd.2015.6
Figures and tables
 Figure 10
 Figure 11
 Figure 12
 Table 5
Abstract
Complex Fenestration Systems (CFS) are advanced daylighting systems that are placed on the upper part of a window to improve the indoor daylight distribution within rooms. Due to their double function of daylight redirection and solar protection, they are considered as a solution to mitigate the unfavorable effects due to the admission of direct sunlight in buildings located in prevailing sunny climates (risk of glare and overheating). Accordingly, an adequate assessment of their performance should include an annual evaluation of the main aspects relevant to the use of daylight in such regions: the indoor illuminance distribution, thermal comfort, and visual comfort of the occupant’s. Such evaluation is possible with the use of computer simulations combined with the bi-directional scattering distribution function (BSDF) data of these systems. This study explores the use of available methods to assess the visible and thermal annual performance of five different CFS using advanced computer simulations. To achieve results, an on-site daylight monitoring was carried out in a building located in a predominantly sunny climate location, and the collected data was used to create and calibrate a virtual model used to carry-out the simulations. The results can be employed to select the CFS, which improves visual and thermal interior environment for the occupants.
Keywords
Daylight; Visual comfort; Bi-directional scattering distribution function (BSDF); Complex Fenestration Systems (CFS)
1. Introduction
Daylighting is used to reduce the energy consumption in buildings by mitigating the demands for electric lighting. However, in locations of prevailing clear sky conditions, capturing daylight on buildings implies the admission of direct rays that signify a higher risk of glare and overheating for the occupants. It is, therefore, well-known that achieving an optimal indoor daylighting environment without compromising the visual and thermal comfort of the occupants represents a real challenge in such regions. Due to its double function (lighting redirection and sun shading), the use of Complex Fenestration Systems (CFS) offers an opportunity to improve the daylight distribution within a building without compromising the occupant’s comfort. Accordingly, its use would contribute to an overall reduction of the building’s energy consumption through artificial light compensation, as well as to cooling energy reductions due to their shading effect. Nevertheless, in regions of prevailing clear sky conditions, the CFS contribution to an improved indoor daylighting environment must be determined by performing an integral performance assessment. The latter takes into account the main aspects relevant to the admission of daylight in such regions, such as the indoor daylight illuminance distribution and the visual and thermal comfort of the occupants. In addition, unlike the regions of predominantly overcast sky conditions, an annual assessment of the aforementioned relevant aspects must be considered in prevailing sunny climates, being daily and seasonal variations of daylighting more tangible in this case due to the reduced cloud obstructions. The most practical procedure for the performance assessment of CFS in buildings implies the use of computer simulations based on virtual models. This can be facilitated using their Bi-directional Scattering Distribution Function (BSDF), which describes the light reflectance and transmission properties of glazing systems. To do this, the CFS are monitored using a bidirectional gonio-photometer and can be generated using the genBSDF RADIANCE function; these data are then attributed to a polygon representing the CFS in the virtual model of a building.
This study adopts as main premise that the use of a CFS can contribute to improve the interior daylight distribution in buildings located in sunny climates, assuming that the latter can be achieved without increasing the risk of glare and overheating for the occupants. The purpose of this study is to examine the use of available simulation methods for the integrated performance assessment of CFS in annual basis. Its pertinence lies in the limited computer simulation alternatives that allow the optical and thermal assessment of CFS using the BSDF data, especially concerning the implementation of annual evaluations. On this regard, research on the topic has resulted in the development of few tools that by incorporating relevant software for daylight and thermal analysis allow an integrated evaluation of CFS. However, due to their characteristics (e.g. use of standard-defined geometry) or the fact that they were developed simultaneously to this study (~2014), a non-unified use of the relative software (RADIANCE and Energy Plus) was required in this examination. An additional advantage is that the independent use of the software allows the calculation of the five-phase method, which is explained in Section 2.1. The above named tools allow the use of BSDF data using the RADIANCE three-phase method as a constituent simulation mean. For instance, Mkschedule includes in the integration assessment also the artificial lighting using control algorithms [1]. Additionally, Fener is a building energy model, which can be used when assessing the performance of simple-geometry buildings [2], while a most recent alternative performs the dynamic simulations by an information exchange between TNSYS and RADIANCE [3]. Concisely, the use of BSDF data in integrated simulation tools is an ongoing development process whose availability may be consolidated in the near future.
This study may serve as an outline of the simulation process involved in the annual integrated assessment of CFS in buildings. It could be used to assist in the CFS performance assessment in existing or new buildings with special characteristics, while it could also contribute to appoint incorporated simulation difficulties and to allude to alternative emerging options. Thus, to prove the proposed premise, the Bi-Directional Transmission Distribution Function (BTDF) data of five different CFS were used to carry-out computer simulations using the virtual model of an office room located in a low latitude region (e.g. Mexico). The simulations were carried-out using BTDF data monitored using the bi-directional gonio-photometer, which is equipped in the Laboratory of Solar Energy and Building Physics (LESO-PB) of Swiss Federal Institute of Technology in Lausanne (EPFL) and accounts only for the front transmitted light flux of the CFS (no reflected components considered) [4].
The CFS integrated performance consists on the assessment of the annual interior daylight distribution, the visual and thermal comfort of the building’s occupants. The results obtained would allow the comparison of the CFS performance, which may lead to determine the one that better contributes to improve the interior visual and thermal environment for the buildings located in prevailing sunny climates. Thereby, the original RADIANCE version was chosen as a simulation engine to assess the indoor daylight illuminance distribution due to its accurate prediction of lighting environments; first, ‘static’ simulations of a given moment over the year were carried-out using RADIANCE specific procedures (such as mkillum or bsdf). However, the latter cannot be used to describe the CFS long-term impact over a year round; this was carried-out using the RADIANCE ‘Five Phase Method’ (see Section 2.1). The assessment of the solar heat gains, which were associated to the daylight flux transmitted through the CFS, were evaluated using the Energy Plus simulation program, as described in Section 2.2. Since the present study is focused on evaluating the effects of the inclusion of daylight in buildings, the thermal implications relative to occupant’s activity, artificial light, or mechanical equipment are not included. Annual evaluation of glare risks is feasible using Open Studio (a cross platform for the energy modeling of Energy Plus), which uses RADIANCE for performing daylight calculations. The assessment is done by the calculation of the daylight glare probability simplified (DGPs), which is based only on the vertical eye illuminance and accounts for dynamic simulations [5]. However, such evaluation is not yet attainable for the comparison performed in this study, as explained in Section 2.3.
The following manuscript is divided in four sections. Section 2 includes a state of the art review of the present methods employed for the computer-based assessment of the CFS annual performance, including daylight distribution and thermal and visual comfort. Section 3 describes the methodology for the on-site building monitoring, the virtual model calibration, and performing the computer simulations. The results are given in Section 4, while the conclusions are presented in section 5.
2. CFS annual performance assessment using advanced computer simulations
2.1. Annual simulation of the indoor daylight distribution
The easiest way of assessing daylight performance in buildings is by calculating the daylight factor (DF), a metric that by definition is derived from illuminance measurements carried-out for overcast sky conditions.
The DF approach is a fundamental way of predicting the daylight distribution in a room, given that it represents an interior daylight condition resulting from the lowest outdoor illuminance levels. However, daylight potential for building energy savings depends on the variable weather conditions, as well as on the design and the orientation of the building. Therefore, assessing daylighting performance by considering only a constant DF value leads to an inaccurate interpretation. Thus, to obtain a realistic daylight evaluation in a building, it is also important to consider the daily and seasonal variations of the sky luminance distribution. The two RADIANCE procedures mentioned in Section 1 (mkilllum and bsdf) cannot directly be used to carry-out annual simulations using CFS, even if they allow simulating specific outdoor conditions [6]; in the case of mkillum, the CPU time required to perform a simulation for a certain outdoor lighting environment and the related inter-reflections are prohibitive. A solution to the problem can be found using the Daylight Coefficient (DC) approach. Peter Tregenza and M. Waters introduced the DC approach in 1983 [7]. It assumes that daylight illuminance on a given location depends on two independent factors: 1) the sky luminance distribution and 2) the geometry and material of the indoor room surfaces [7]. This method represents an effective way to speed-up the simulation process for the calculation of the indoor daylighting illuminance when considering several different outdoor daylighting conditions (e.g. different sky types). An attempt to apply the DC method to innovative daylighting systems with the aid of computer programming can be already found in 1992 [8]; in this study the calculation was split in two parts: 1) the daylight flux issued from the sky (sky component) and 2) the daylight reflected by the interior surfaces of the room (indoor reflected component). The DC method has also been used for computer simulations with Test Reference Years (TRY) [9]; other authors suggested the use of new standard daylighting coefficient models supposed to be independent from the building location and orientation [10].
The use of RADIANCE with the DC Method was successfully tested by several authors; however, its capabilities are compromised when simulating CFS due to its backwards ray-tracing techniques [6]. The CFS annual daylighting simulations require being able to model the solar gains captured through CFS. Klems introduced this method in 1993 [11]; it relies on the use of the measured bidirectional transmittance and reflectance properties of each layer of the CFS obtained with a gonio-radiometer, scanning the whole solar radiation wavelengths (0.3 to 3.0 μm). It employs a matrix calculation method to determine the solar heat gain coefficient (SHGC) of the CFS, and the monitoring result comprises also the directional-hemispherical transmittance of the CFS as well as the layer-by-layer absorption. It is designated by BSDF [11].
The use of BSDF monitored data to simulate the CFS annual daylighting performance in a room using RADIANCE was made possible using the rtcontrib function, which associates the transfer of the light flux from the sources to their final destinations (a window or a given point in the room for illuminance calculation ) [6]. Based on this procedure, the DC method was implemented because of the introduction of an additional RADIANCE function, genklemsamp, and of the klems_int.cal procedure was used, which assisted the daylight coefficient calculation by sampling rays according to the sky vault subdivision suggested by Klems. This RADIANCE method is designated by “The Three-phase method” [12]. The method performs the daylighting calculation by dividing the transfer of the daylighting flux from the sky vault to a given point (similar to a monitoring sensor) in the room into three phases: 1) from the sky vault to the exterior of the window, 2) through the fenestration system, and 3) from the fenestration to the interior space. A matrix describing the light flux conveyed between the layers represents each phase of the method. The final result is obtained by multiplying the three matrices with the input, which corresponds to a given sky condition (sky luminance distribution) [6,13]. An evolution of the three-phase method is the five-phase method in which the calculation is performed by separating the direct sun component from the diffuse sky component as well as of the internal reflections to calculate in a more accurate way the distribution of the solar component in the room [14]. First, the simulations according to the three-phase method must be carried-out. Then, the direct solar contribution is calculated and subtracted from the results obtained in the first instance. Subsequently, a more accurate direct solar contribution is calculated and added to the results in the final stage [14]. On this regard, other daylighting software that are able to perform annual evaluations, such as DAYSIM or DIVA for Rhino, are not yet supportive to use BSDF data of CFS, while presently Open Studio performs annual simulations using the three-phase method. It does not yet allow the use of user-defined BSDF data (see also Section 2.3).
2.2. Building thermal analysis
A brief review of relevant software that can be used to simulate the solar gains in a room when accounting for innovative glazing systems pointed out three main candidates: DIVA for Rhino, DIAL+, and Energy Plus with Open Studio.
For this study, Energy Plus was selected to carry-out the CFS simulations, given that the DIVA plug-in and DIAL+ present certain disadvantages related to the difficulties of modelling the CFS impact using BSDF data. In the case of DIVA for Rhino, the use of BSDF files is not currently available to perform climate-based simulations; a step required before carrying-out thermal calculations. The software DIAL+ performs the calculation of solar gains according to the glazing properties and shading devices. It allows the use of fenestration systems, such as external or internal blinds; however, sharp light redirecting by the system cannot be modelled, and thereby the use of BSDF data of CFS in DIAL+ is not possible. Energy Plus is building energy simulation software created to assist architects and designers in the building optimization assessment to mitigate the energy and water demands. It models heating, cooling, lighting, and ventilation services as well as the water use in buildings. The software allows the calculation of passive solar gains offered by advanced fenestrations systems, such as movable solar blinds and electro chromic glazing [15]. The daylighting performance evaluation of CFS as well as their thermal impact in a room can be made using BSDF data monitored using a gonio-photometer [4,16] or generated by the Window 7 software [17].
2.3. Annual glare analysis
The annual glare assessment is feasible with the use of Open Studio for which the view point direction for each designed working space is defined by placing a glare sensor in the virtual model, and the DGPs [5] is calculated as of the vertical illuminance. However, annual glare prediction is still not an available option for the scope of this study, which compares the performance of CFS using their BSDF data to precisely describe their visual and thermal effects inside of the room. In the current Open Studio (version 1.9.0) only non-user-defined BSDF data (e.g. venetian blinds and light redirecting louvres) can be used, while the option of assigning distinct BSDF (generated by Window 7 or genBSDF) is expected to be implemented in a further version of the software [18]. A similar comparison could be carried-out using Open Studio by creating glazing materials using the glazing properties obtained from the Window 7 software (visible transmittance, visible front and back reflectance, solar front and back reflectance, and front and back emissivity); however, in that way, the lighting redirecting effects of the CFS would not be taken into account, leading to inaccurate glare predictions. The Enhanced Simplified DGPs was proposed as a prospective alternative for annual glare predictions, which was advanced to overcome the central disadvantage of the DGPs method (it is only valid when no direct sunlight hits the occupant’s eye [19]). With this method, the calculation of the two terms of the DGP formula are taken into account: vertical illuminance and the image evaluation (using simplified images), which might allow the use of BSDF data. However, its implementation would still require fair amount of computing time and resources that represent a limitation for this study.
In brief, the annual prediction of glare is possible using Open Studio through the DGPs method; however, performing such assessment for testing the performance of CFS is still unavailable due to the non-yet implemented use of user-defined BSDF data. Likewise, the use of the non-interfaced RADIANCE remains an unfavourable option due to the considerable computing time required to generate the suitable images. Nevertheless, other options that might allow the use of BSDF for annual glare predictions are also being explored, such as the relation between the UDI’s and DGPs, which initial result have encouraged further investigations. [20].
3. Methodology
3.1. Building selection and virtual model calibration
To assess the CFS performance regarding the indoor daylighting distribution as well as the thermal comfort of the occupants, two office rooms located in the centre-north of México (Zacatecas 22° 783' N., 102° 583' W, and altitude of 2543 m) were selected for this study. The selection took into account the interior working environments that require high working plane illuminance to perform difficult visual tasks, such as reading/writing and drawing, with regular occupancy patterns and constant activities during the day. Due to time constrains, the annual evaluation of only one of the two considered offices rooms (building B2) was carried-out in this study, and thus is presented in this article. The investigated office room is a private office located in a building’s complex belonging to the main public university in the city, which is devoted to research in humanities and social sciences. Its orientation is due southeast; its dimensions are 4.17 m × 5.25 m × 2.6 m. The external façade is fully glazed (Window to wall ratio of 90%); the window panes are slightly tilted around the z-axis with two main sections divided by a column (Figs. 1 and 2). An external overhang of 0.8 m width is part of the architectural building design and intended for sun protection. Nonetheless, the transmission of sunrays from the morning until the late afternoon forces the occupants to use internal solar blinds to avoid glare, as shown in Fig. 1 (December 20th at 10h00 LT).
Figure 1
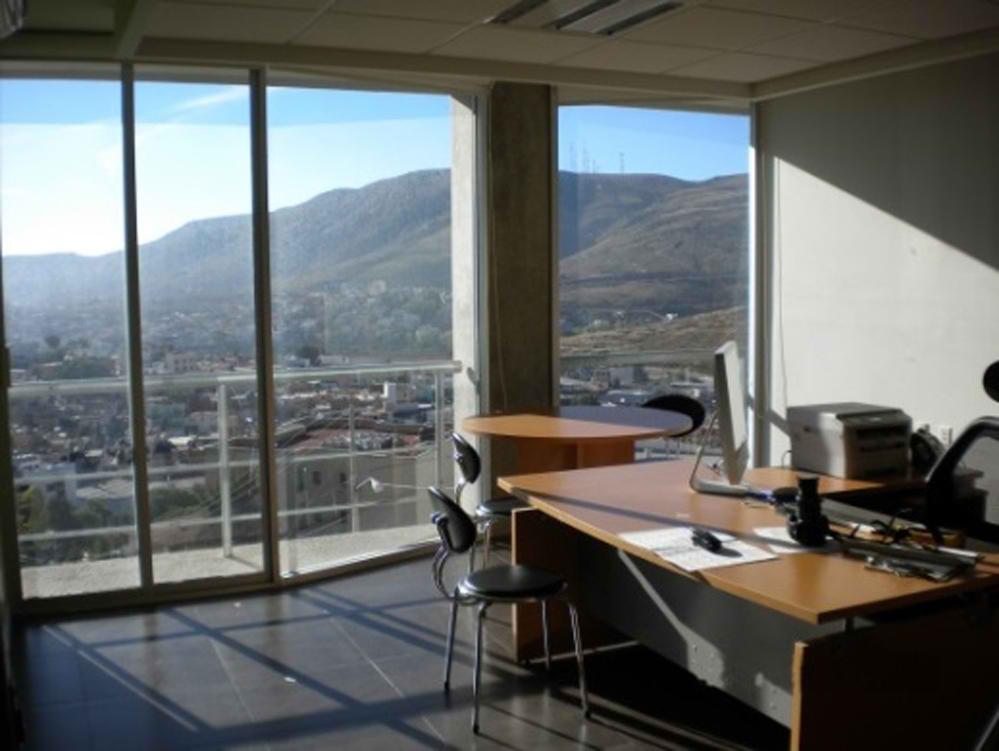
Fig. 1. Interior view of the private office located in building B2 (winter solstice at 10h00 LT).
Figure 2
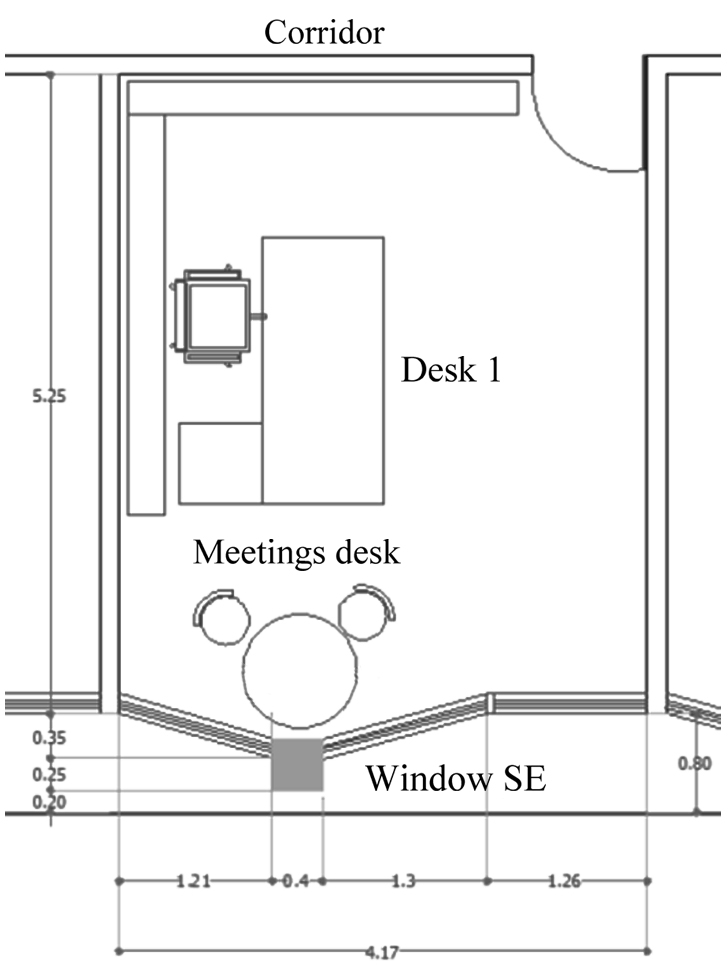
Fig. 2. Floor plan view of the office room.
The on-site daylight monitoring was carried out at different periods of the year from 2011 to 2013: spring equinox, winter, and summer solstices from 9h00 to 18h00, a time frame when daylight is usually available. Indoor illuminance was monitored at the standard height of the working surface (0.75 m) at points separated by 0.2 m distance on a profile centered in the room, starting at 0.2 m from the window. A description of the illuminance-monitoring layout is shown in Fig. 3 where the cross-mark indicates the measurement point placed at every 1.0 m position.
Figure 3
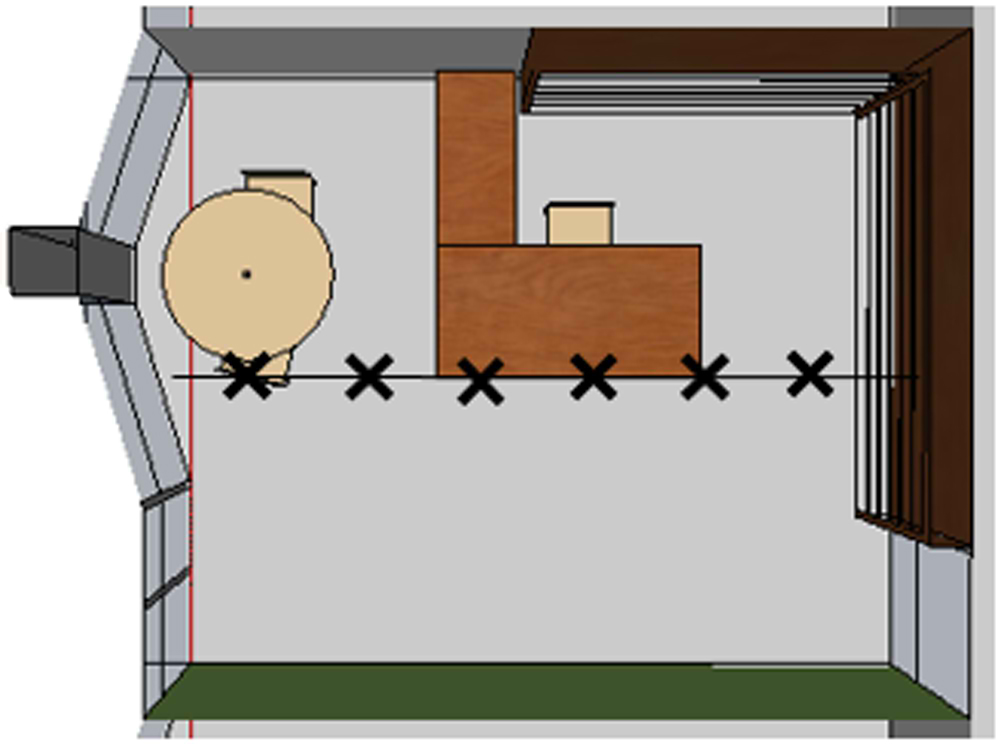
Fig. 3. Aerial view of the office room indicating the monitoring positions starting from a distance of 0.2 m from window.
Workplane illuminance and room surface luminance were used to set-up and calibrate a virtual model according to the room dimensions and photometric properties. On this regard, the use of the glazing transmittance data was converted to transmissivity, as required to perform the RADIANCE simulations, and that accounts for the interreflections in the virtual model [21] (Table 1). The sky luminance distribution was simulated using hourly global horizontal irradiance obtained from a local meteorological station located at approximate 5 km from the building site, and then the sky was generated using gendaylit.
Table 1
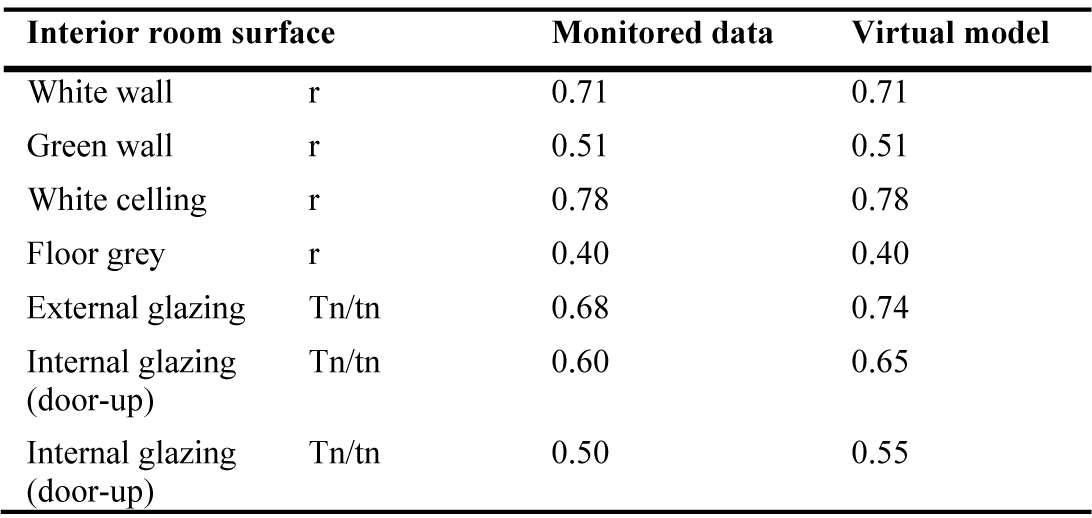
Table 1. Transmittance/transmissivity (Tn/tn) and reflectance (r) properties of the interior surfaces in the office room for the building B2.
The monitored workplane illuminance was used to calculate the corresponding DF and illuminance ratio (IR) profiles that were compared with those obtained by simulation. Then, computer runs were carried-out for the same days and hours when the on-site monitoring was performed. The RADIANCE simulation parameters were adjusted to large values to achieve an optimal quality of results, as shown in Table 2.
Table 2
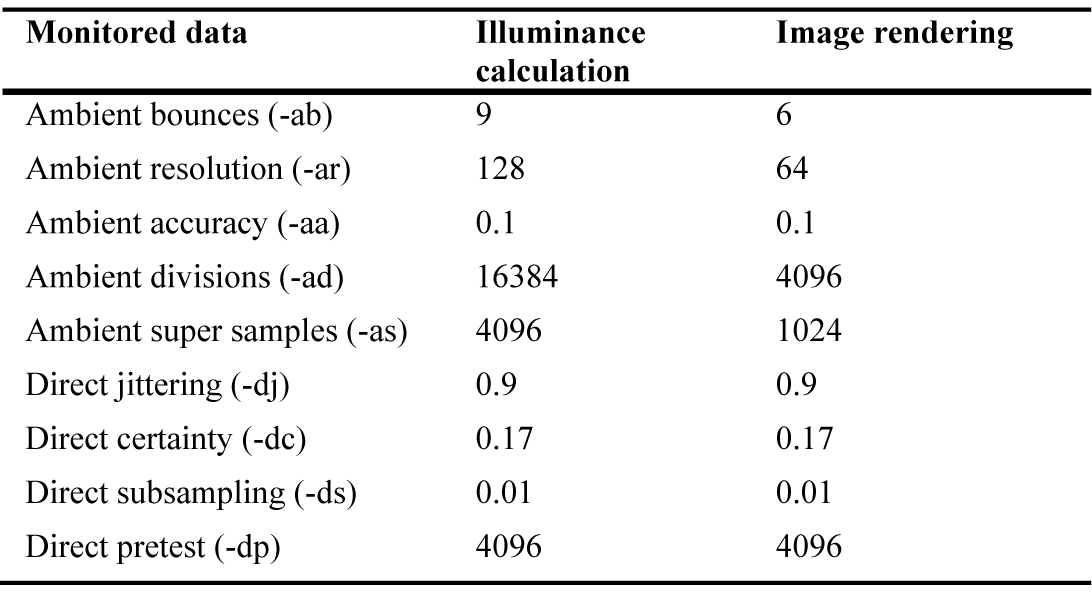
Table 2. RADIANCE simulation parameters for the virtual models calibration used for illuminance calculation and image renderings.
The correspondence between the on-site monitored data and the simulations was examined to confirm the faithfulness of the virtual model regarding reality. The obtained agreement justified the use of RADIANCE to assess the daylighting performance of fenestration systems in a comparative way, as shown in Fig. 4.
Figure 4
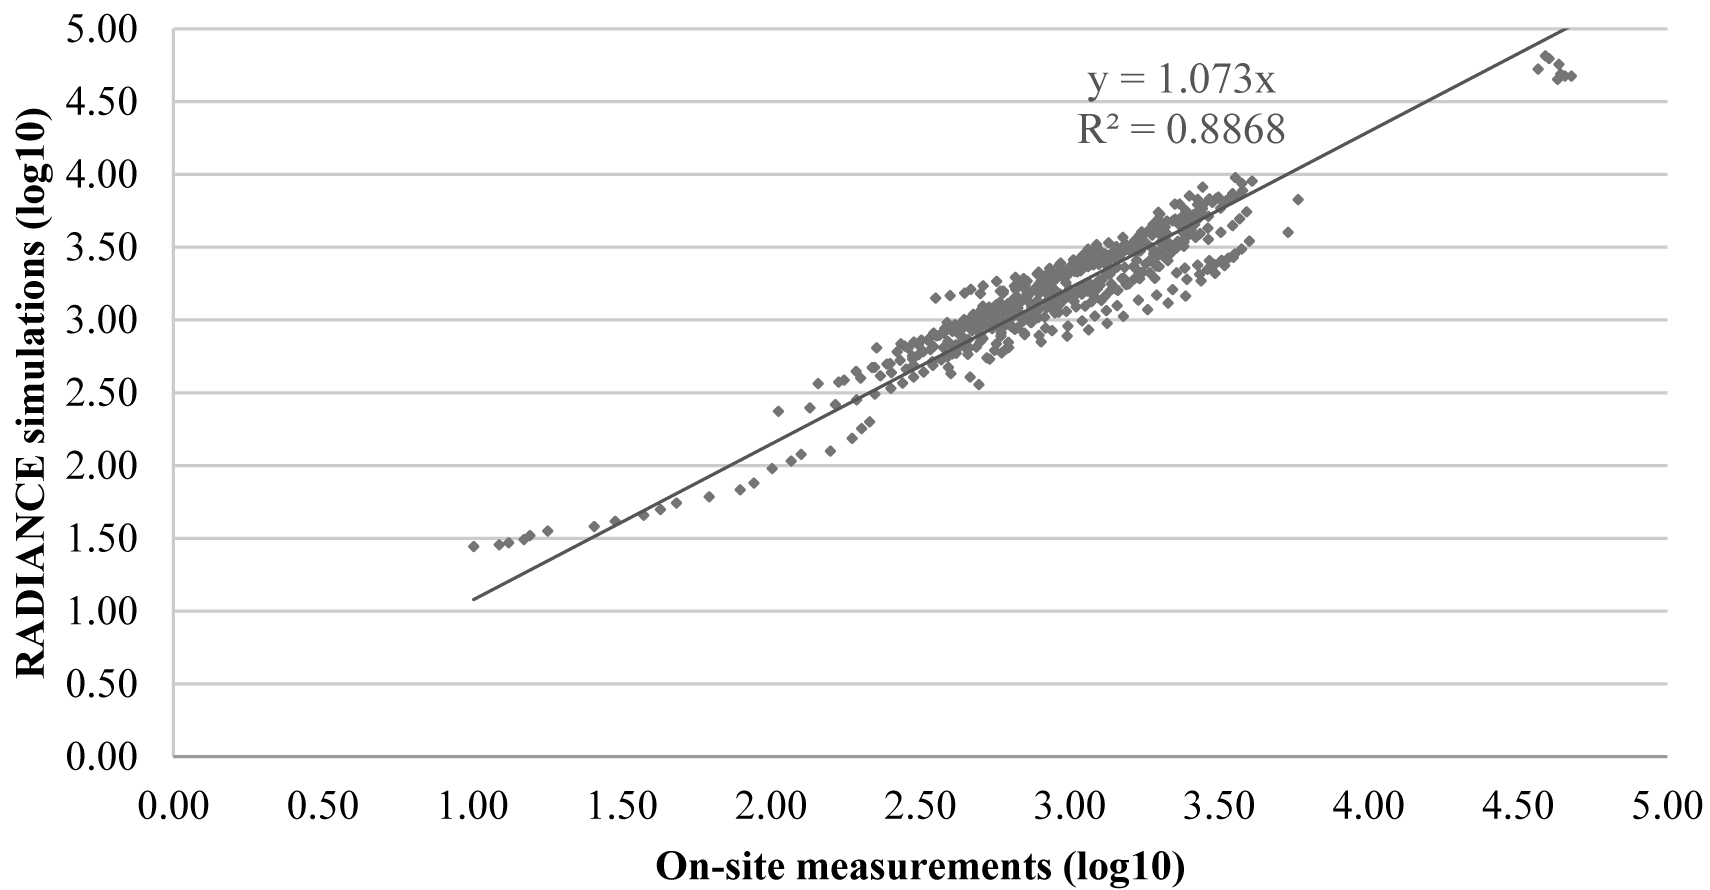
Fig. 4. Correlation observed between the interior monitored illuminances and the simulations in the building B2.
3.2. CFS annual performance assessment
The annual performance simulation of the fenestration systems was carried-out using the BSDF data file for standard glazing created by the way of the Window 7 software. The BTDF data of five selected CFS available at EPFL at that time was used, including a laser cut panel (LCP), a microstructure daylight redirecting film (3MTM film), and three versions of a microstructure daylighting system (CFS1, CFS2, and CFS3). To characterize their particularities, a brief description of the selected CFS is presented below, while optical and thermal properties obtained with the use of the Window 7 software are shown in Table 3. Different views of CFS are shown in Fig. 5.
Table 3
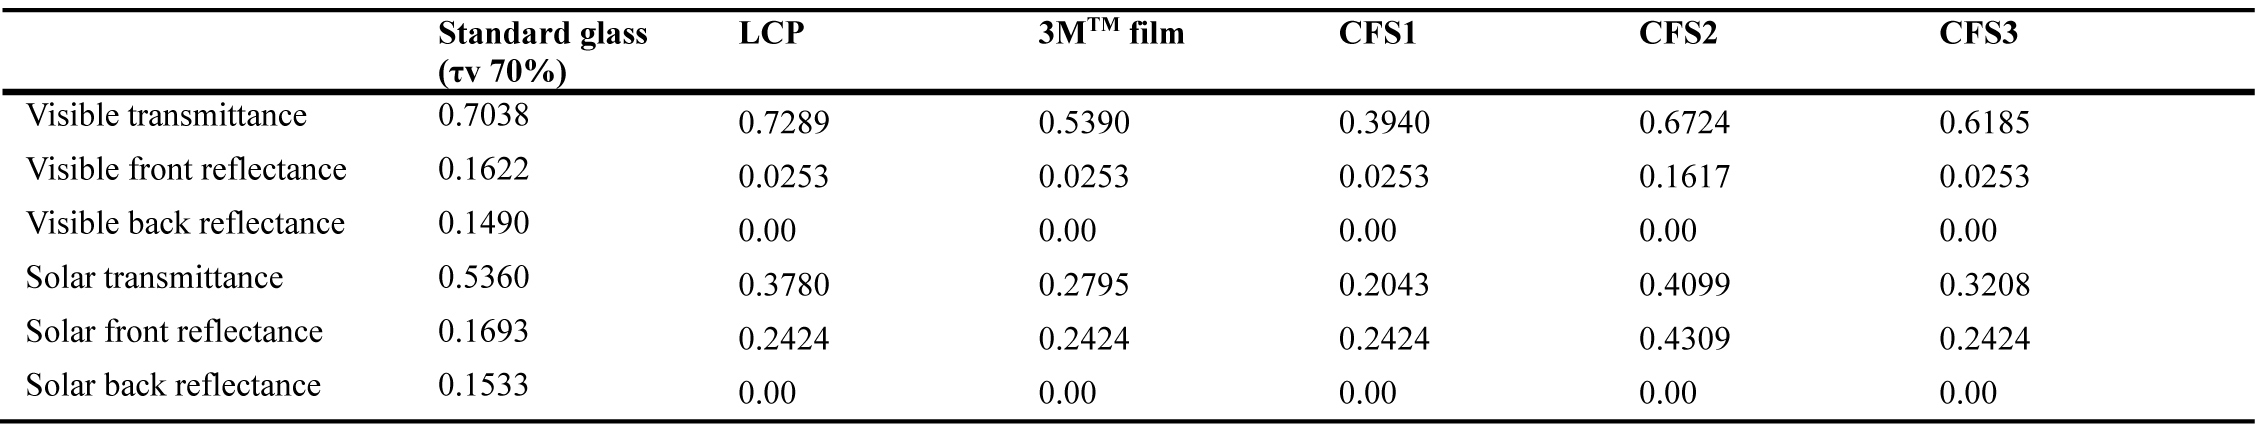
Table 3. Optical and thermal properties of the assembled glazing systems using Window 7 (simulation software).
Figure 5
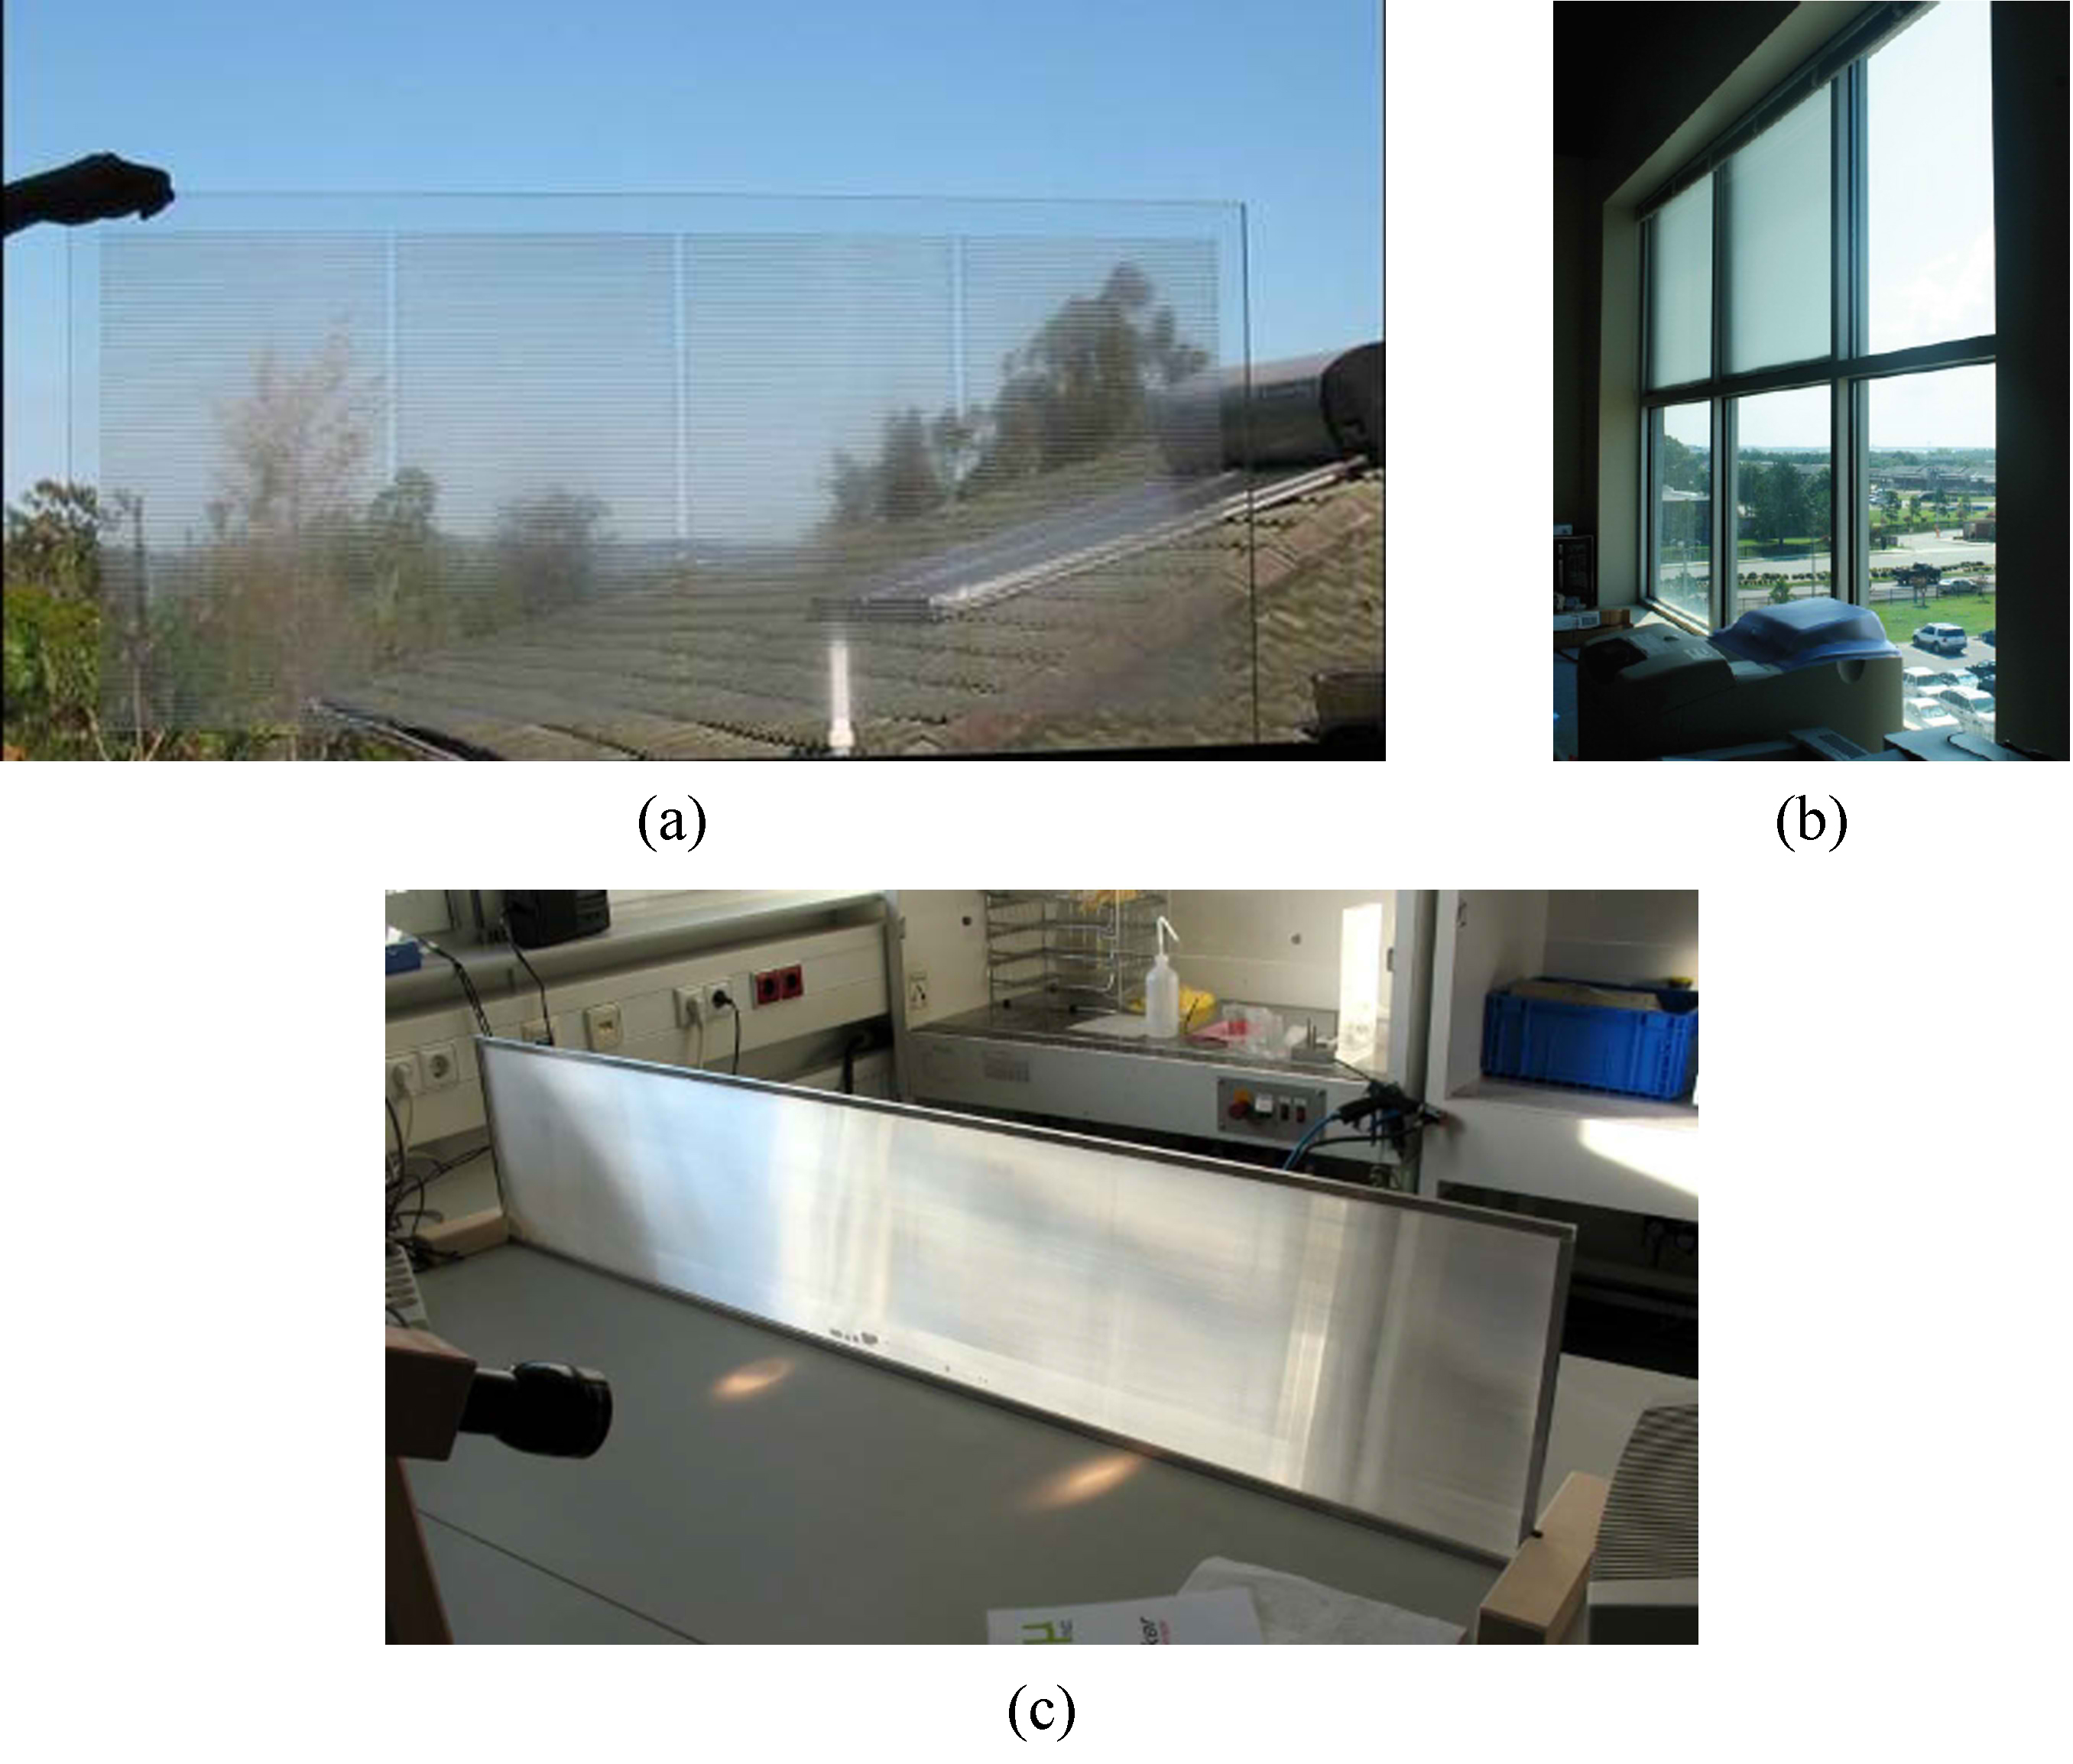
Fig. 5. Views of the investigated CFS: (a) LCP, (b) microstructure light redirecting film (3MTM film), (c) a sample of one of the three versions of the microstructure daylighting system (CFS1, CFS2, and CFS3).
The LCP system is produced from a plastic or acrylic sheet divided into arrays of laser-cuts that produce internal reflecting interfaces in the material acting as mirrors (Fig. 5(a)). The system is based on the principles of light deflection and internal reflection. When direct sunlight passes through the system, the larger portion of light is deflected upwards while a portion of the light is deflected to the exterior. Its installation would require the use of one or two glass sheets for protection, and is considered convenient due to its transparency, which contributes to the outside-view [22,23].
The daylight redirecting film uses microstructure prisms to redirect the light towards the ceiling. They were formed in an arrangement of asymmetrical multisided refractive prisms that were carried out by an optical film, which served also as a sun-shading device. Thus, it is suitable for buildings that are exposed to overheating or might present problems of glare, as it reduces the view to the exterior environment, as shown in Fig. 5(b) [24].
The microstructure daylighting systems, as shown in Fig. 5(c), were produced by the University of Dortmund in Germany as an evolution of the non-tracked light directing glasses named Lumitop that are extruded polymethylmethacrylate (PMMA) profiles used as light conductors to redirect light for angles of incidence between 15° and 65°. The system was improved to broaden the range of solar altitude angles that can efficiently redirect light and to simplify the element while reducing its cost. With the new system, the quality of the daylight distribution was improved as well as an increased lighting transmittance compared with the previous Lumitop [25,26].
3.2.1 Optimization of the interior daylight distribution
The luminous contribution of each CFS over one year was simulated using the RADIANCE five phase method. Weather data representative of the local climatic conditions was obtained using the Meteonorm software, which generates meteo data for any location [27]. For each monitoring point located at the center of the room, a total of 8760 hourly illuminance values were obtained, representing a whole year. However, time steps that are not belonging to the usual working time in México (9h00-14h00 and 16h00-20h00) as well as night hours were removed from the results.
The analysis of the numerical results was performed using the Useful Daylight Illuminance (UDI), which is a daylighting metric introduced in 2005 that takes into account workplane illuminance within a given range as well as the frequency of occurrence over the year [28,29]. The results were classified in six categories that describe the usefulness of the daylighting conditions. First, it was made according to the illuminance recommendations for office environments [30–33], and then to the delineation of UDI’s ranges according to previous studies [29]. The categories applied in this study are shown in Table 4.
Table 4
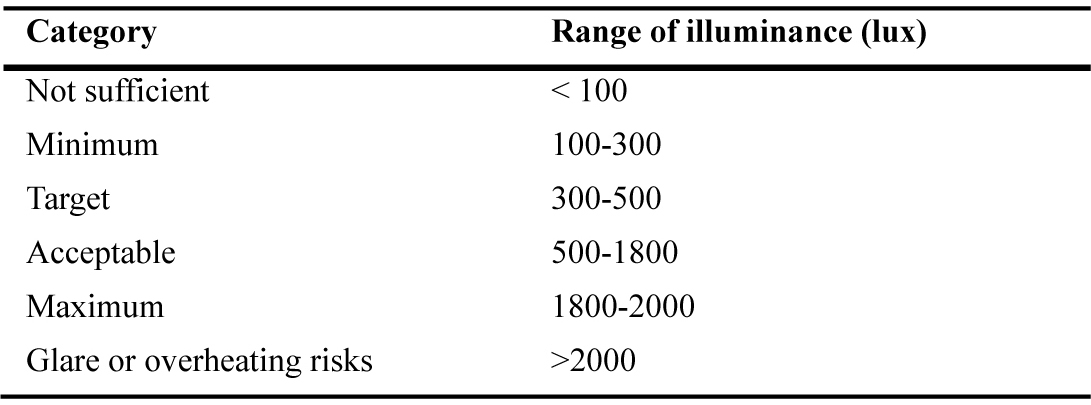
Table 4. UDI categories distinguishing the illuminance results obtained using the five-phase method.
The ‘target category’ corresponds to illuminance values lying within the recommended range for reading or writing tasks; the ‘risk category’ indicates the illuminance range representing glare and overheating risks; the ‘minimum’ or the ‘not sufficient’ categories correspond to the illuminance values below the recommendations, but still contributing to offset the use of electric lighting; finally, the ‘acceptable’ and the ‘maximum’ categories are useful to identify illuminance ranges that lead to a substitution of electric lighting by daylight as well; they might preferred by some users or are adequate to perform visual tasks and activities requiring larger work plane illuminance.
A plot representing the Annual Frequency of Illuminance (AFI) was generated, which is a count of the frequency in which certain ranges of illuminance occur during a certain period. This plot reflects the spatial distribution of daylight through the room when using the five CFS as well as the standard glazing. Using the five phase method, rendering images were also produced for each hourly time steps; they were generated for each terms of the five-phase method and combined at the end to obtain a final image, which can be useful to visually describe the interior daylight situation achieved by the CFS.
3.2.2 Annual assessment of thermal comfort
As mentioned in Section 2.2, Energy Plus allows to determine the solar gains using BSDF data due to the solar radiation transmitted by a CFS. However, for the BTDF data employed in this study, an additional conversion was necessary. To assess the solar heat gains entering through a standard glazing as well as through the five CFS, virtual models were built using Google Sketchup (version 7.1). Then, the thermal zones and the thermo-physical properties of the interior surface materials were defined and assigned to the model; the desired numerical output was set using the Open Studio plug-in for Google Sketchup. Given that the solar gains were of main interest, not the metabolic or electric appliances heat contributions, then no luminaires or occupants were accounted in the computer model. The office room was considered as a separated room by assuming the partition walls to be ‘adiabatic’ (no transmitted heat flux) to avoid additional heat loads from adjacent ‘thermal zones’ and from outdoor; moreover, time was saved in the construction of the building model. The model was then converted into the Energy Plus input format (idf file), which was used to perform simulations. The weather file of the city of Zacatecas was obtained from the Meteonorm software; it was used as an input to perform the thermal dynamic simulations of the office room. To use the BSDF files of the CFS in Energy Plus, ‘adhoc’ fenestration systems were created using Window 7, and then it was converted to the Energy plus format (idf files).
However, the Window 7 calculation of the CFS luminous transmission and reflection is based on the sky vault subdivision suggested by Klems [34]; it does not support the Tregenza sky subdivision [35], which is the standard format used in this study [16,35]. Therefore, a preliminary conversion from the Tregenza angular system to the Klems system was necessary to be able to convert the BSDF data of the five pre-selected CFS into an Energy Plus compatible format; this was carried-out using the bsdf2klems RADIANCE programme. The CFS-Klems converted files of LCP, 3MTM film, CFS1, CFS2, and CFS3 were employed to create an XML file, using Window 7. Then, an additional glass layer was added to the fenestration system to model the glass panes to which the CFS was attached. For the standard glass, a resulting visible transmittance (τv) of 70% was attributed to the assembled fenestration system. The 3MTM film available at EPFL does not require to be attached to a glass pane since it is already fixed between two glass panes; however, since Window 7 requires at least one glass layer to create a fenestration system, a glass layer with the largest possible visible transmittance was added to the Film3M-Klems file to create the corresponding idf Energy Plus input file.
When creating the glazing system using Window 7, temperatures of the outer and inner surfaces of the glazing layers, the transmittance, and reflectance within the visible range, as well as the transmitted, reflected, and absorbed solar radiation are generated as output. Thus, the calculation of the passive solar gains into the room takes both, the direct component of solar radiation and the re-emitted part of the absorbed heat into account. As mentioned in Section 1, the BTDF data of the five CFS assessed in this study were measured using a gonio-photometer which takes into account only the front transmission data; thus, back transmission and front and back reflectance’s attributable to the CFS are not considered in the assembly of the glazing system using Window 7 (see also Section 4.2).
Then, the BSDF-idf converted files of the CFS are imported into the Open Studio database and assigned to the window’s upper part of the office room in the virtual model. The computer simulations were perfromed taking only the upper part of the window with the corresponding CFS into account or with a standard glazing material; a glass of zero visible transmittance was assigned to the lowest window to isolate the effects of the glazing material (CFS or standard glass) assigned in the upper window. The assessment was performed for an entire year. A flow chart describing the simulation procedure is given in Fig. 6.
Figure 6
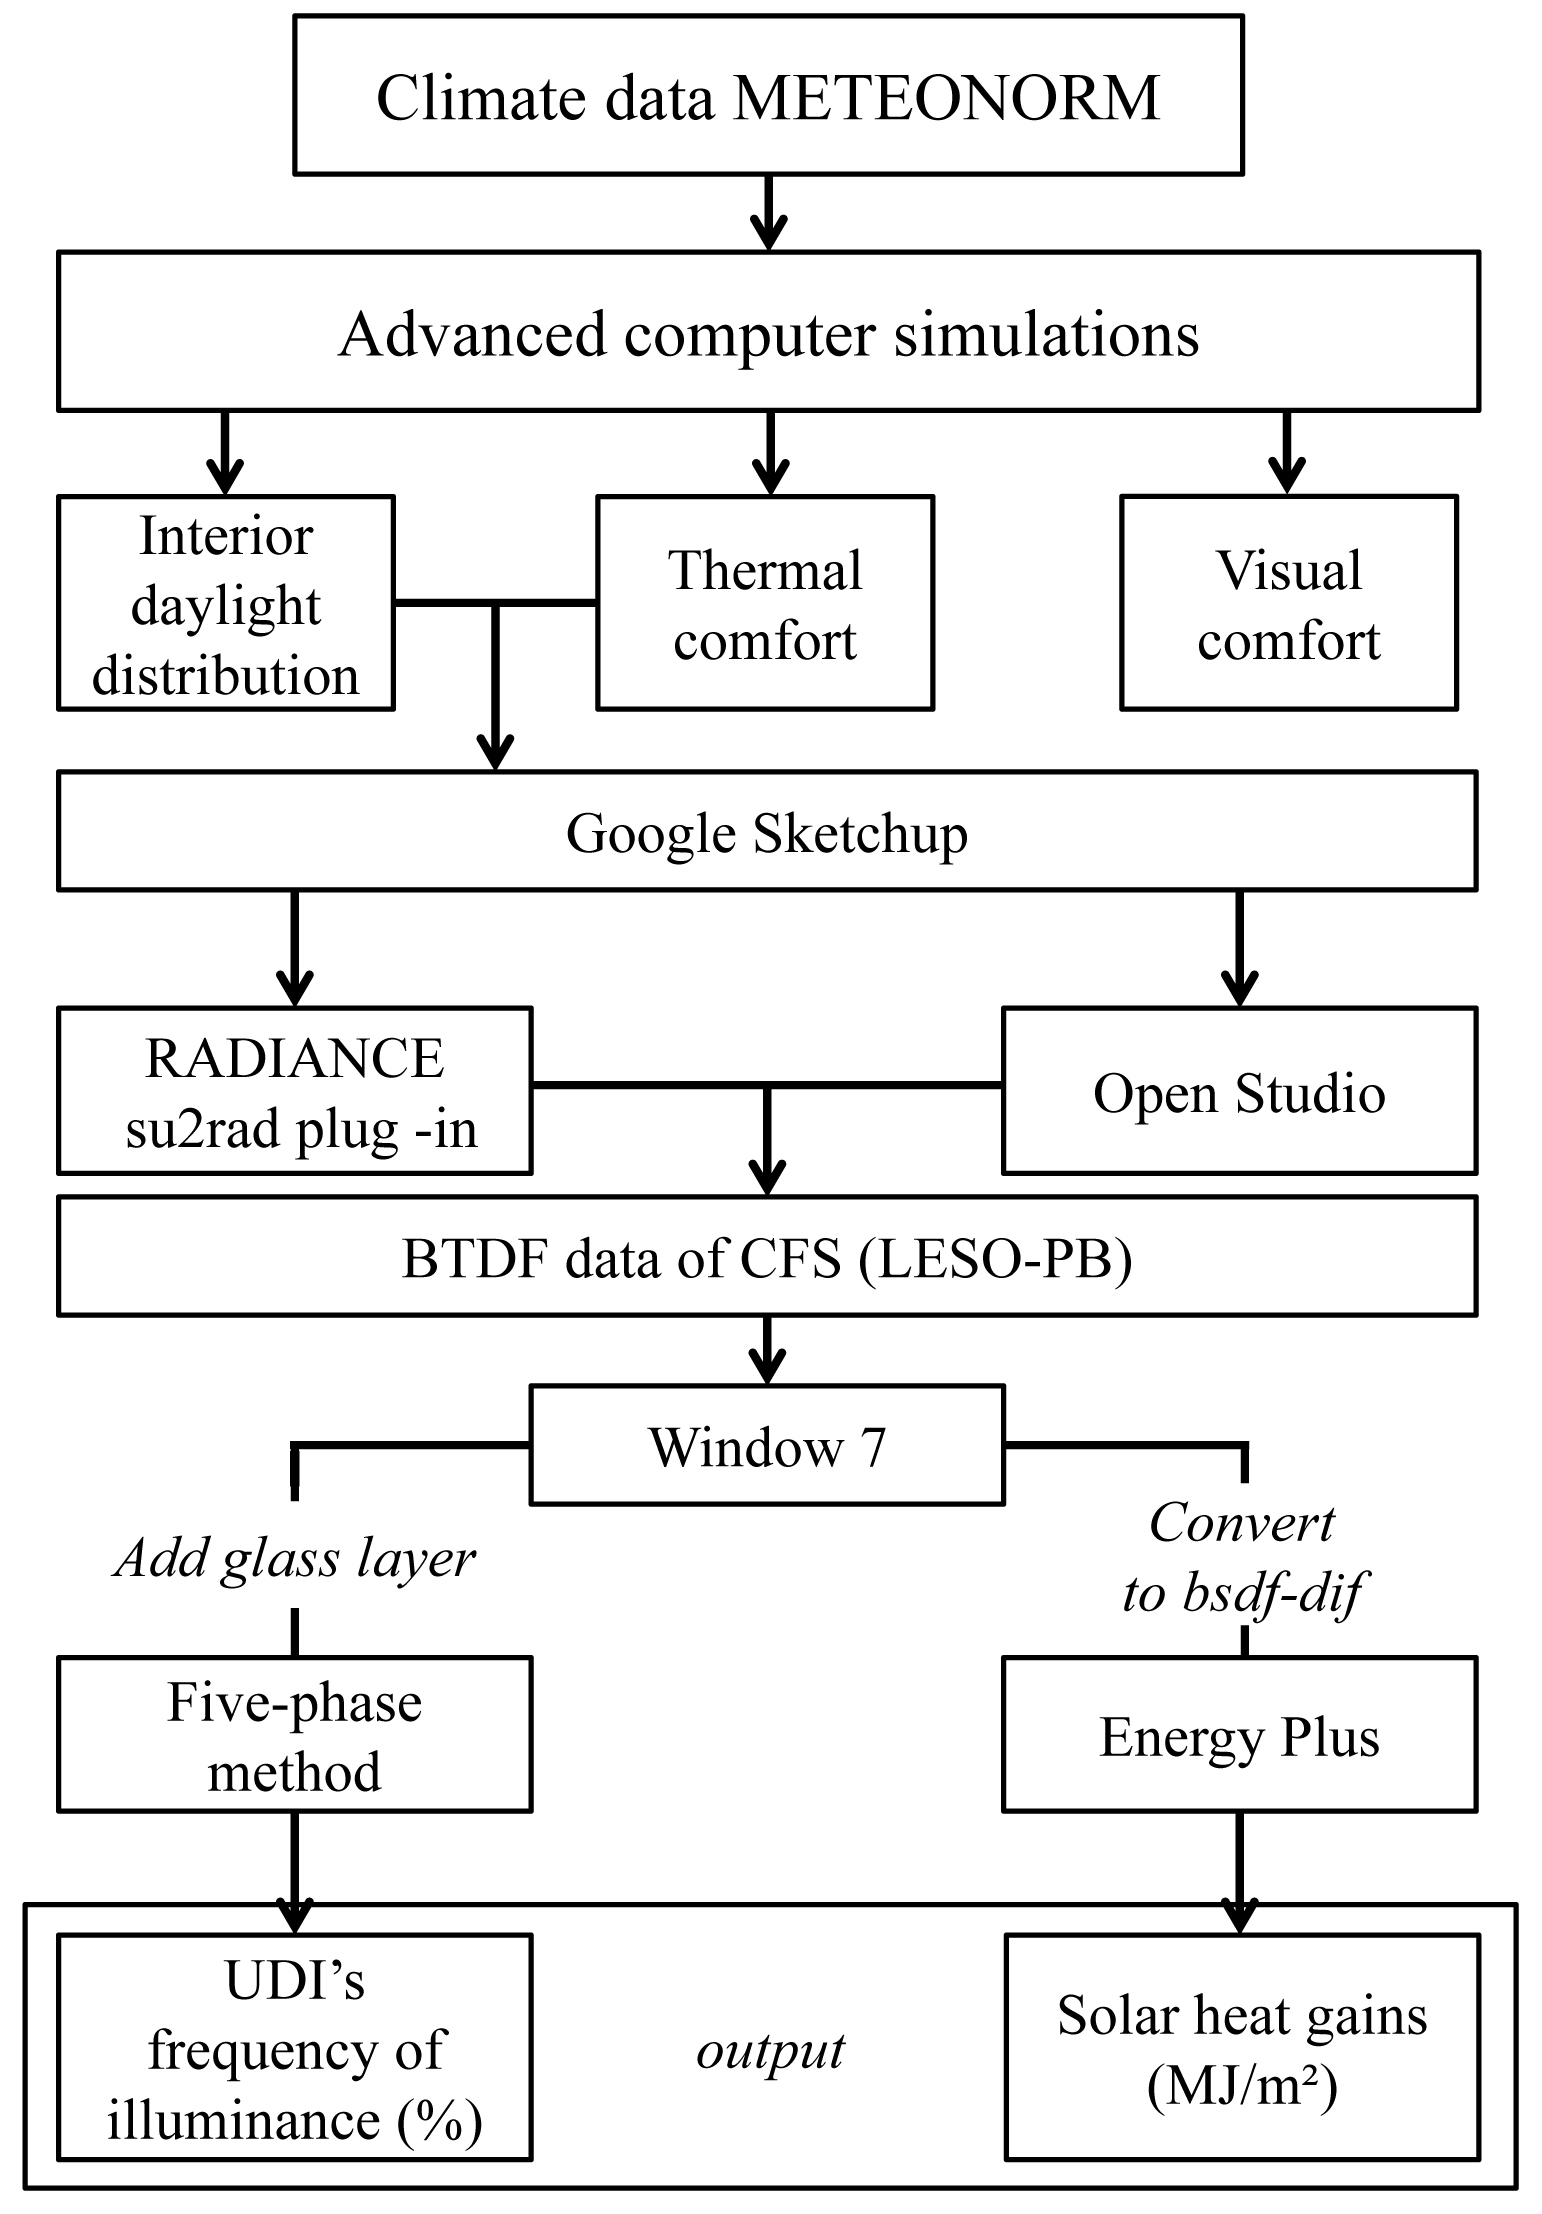
Fig. 6. Flowchart describing the overall simulation procedure.
4. Results
4.1. Annual interior daylight distribution
To validate the illuminance results obtained using the five-phase method, a comparison was made between the obtained results using the five-phase method and the simulations results obtained using the bsdf procedure. The sky luminance distribution was simulated on March 20th 12h00 corresponding to the spring equinox on-site monitoring date, and then it was generated using gendaylit with the direct and diffuse irradiance data (Ibn and Idh) contained in the weather file obtained by Meteonorm. The illuminance results using both means, as well as those of the monitored data are compared for that particular time-date. As observed in Fig. 7, a close correspondence is achieved between the two simulation methods. The MBE graph relative to the distance from the window was computed taking as a reference the bsdf results, and it showed a maximum difference of 24% at the back of the room, while the maximum positive difference of 13.5% was found at a distance of 0.8 m. The MBE of the correlation was 2.5%.
Figure 7
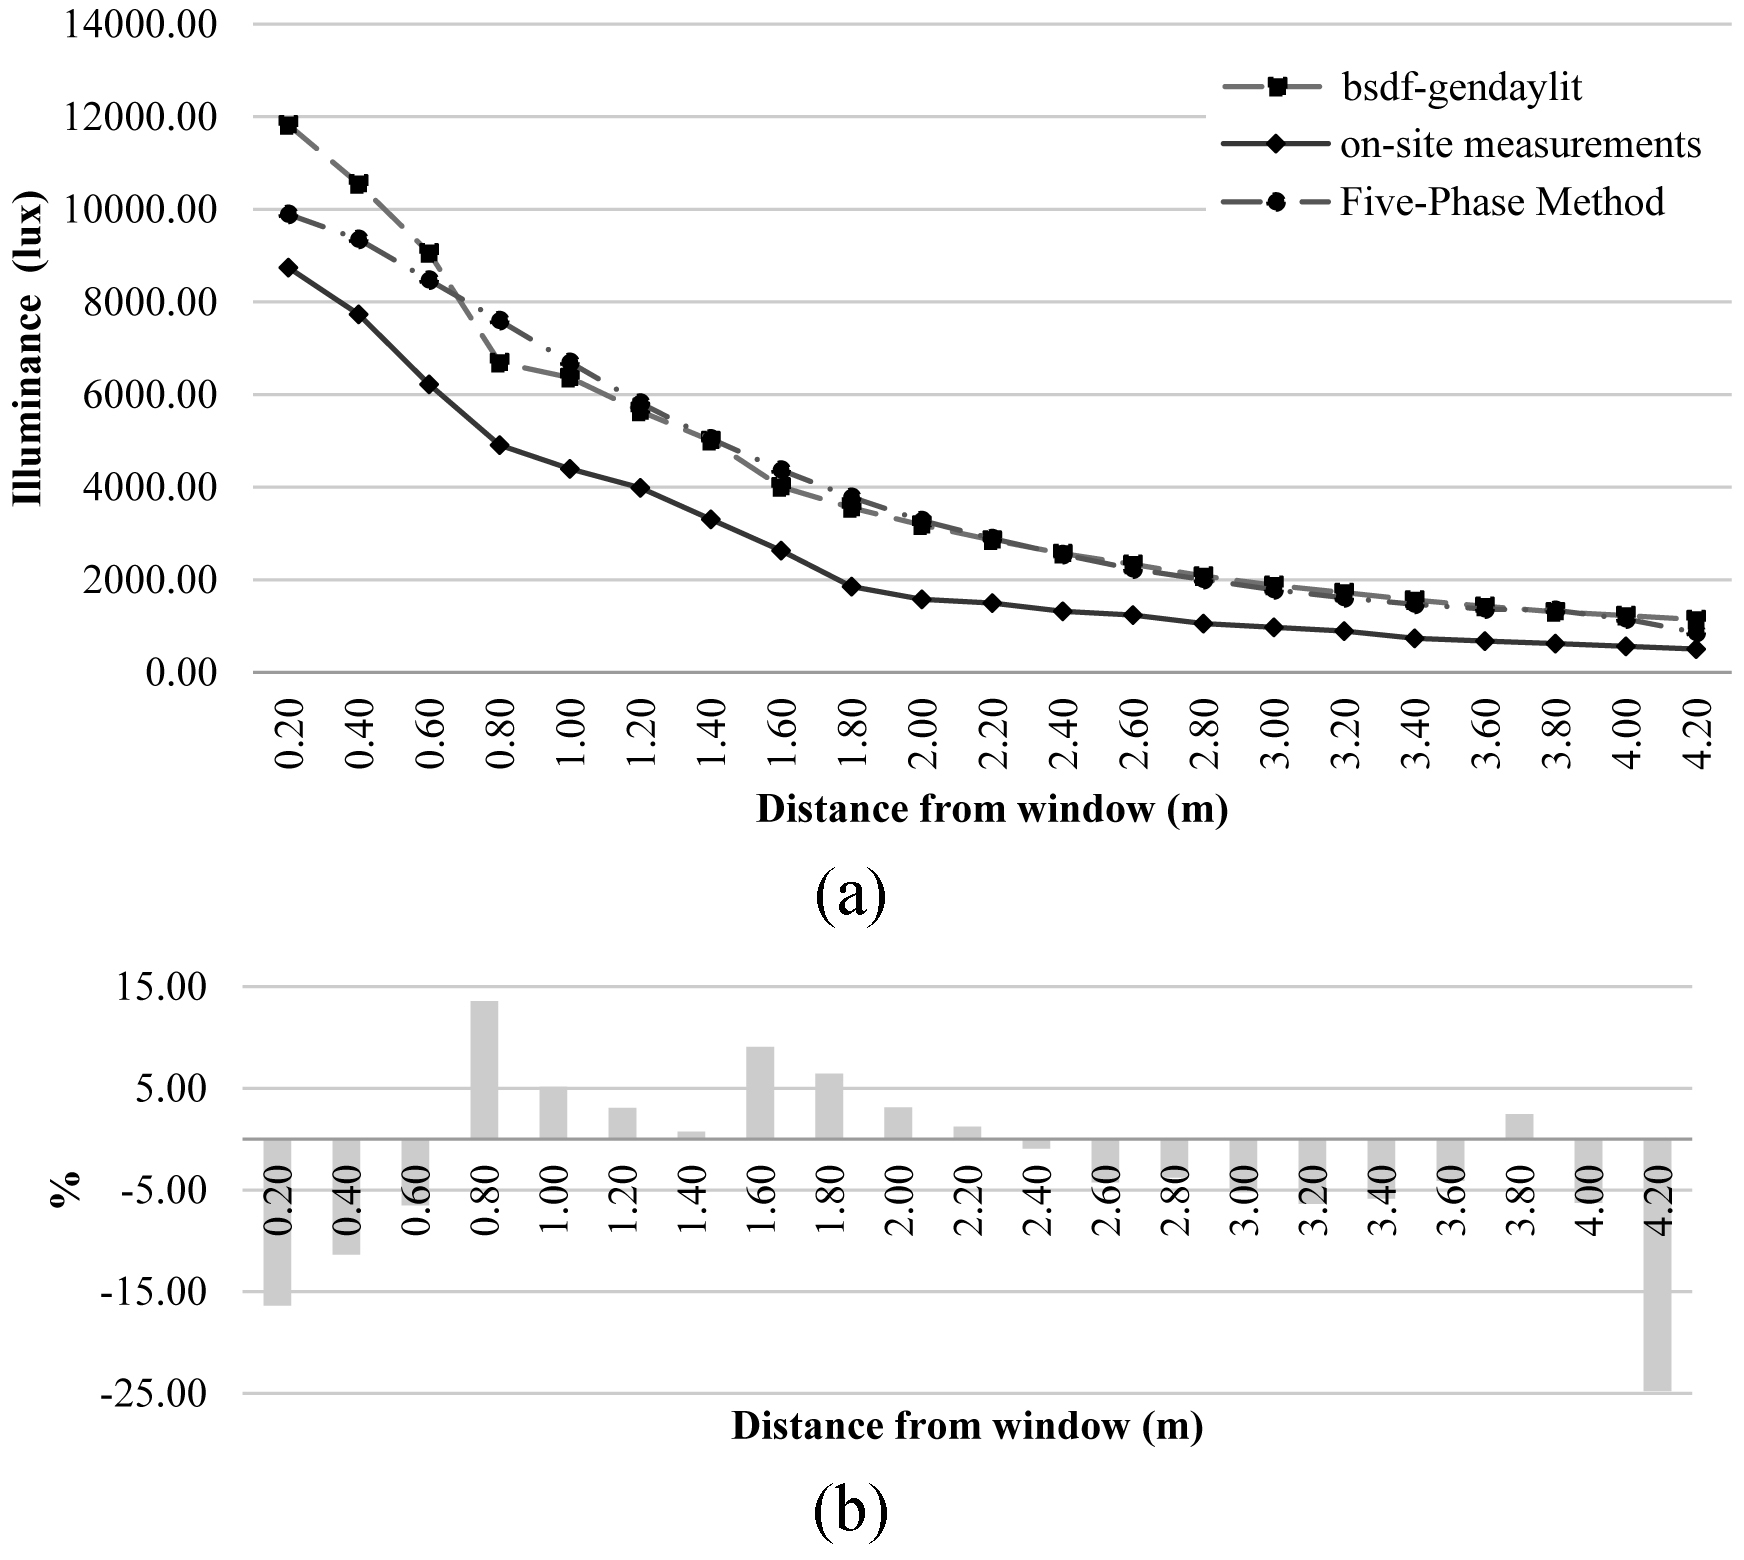
Fig. 7. (a) Comparison of the illuminance profiles obtained using the bsdf procedure and the five-phase method, and compared with the monitored data obtained on the 20th March 12h00. (b) shows the MBE between the simulations (bsdf procedure and the five-phase method).
Then, the assessment of the interior daylight distribution was performed by comparing the results of the AFI obtained with the six fenestration systems (standard glazing and CFS) that were represented in a plot to feature their performance in the interior of the office room during a year.
4.1.1 Frequency of illuminance
Figure 8 shows the annual frequency in which the illuminance of 300-500 lux (target illuminance) occurs during the working hours. It can be observed that a better performance is achieved using CFS1, which provides daylighting in the room during a larger portion of the yearly working hours; while the standard glazing (τv 70%) provides a corresponding lower fraction of working hours for the particular illuminance range. The illuminance larger than 2000 lux would represent risks of glare and overheating for the office occupants, as shown in Fig. 9. It shows that such range would be present during a longer portion of the yearly working hours for the 3MTM film (close to the window) and the standard glazing (in the center of the room). The latter confirms the inconvenience of using fully glazed facades in locations with prevailing clear sky conditions.
Figure 8
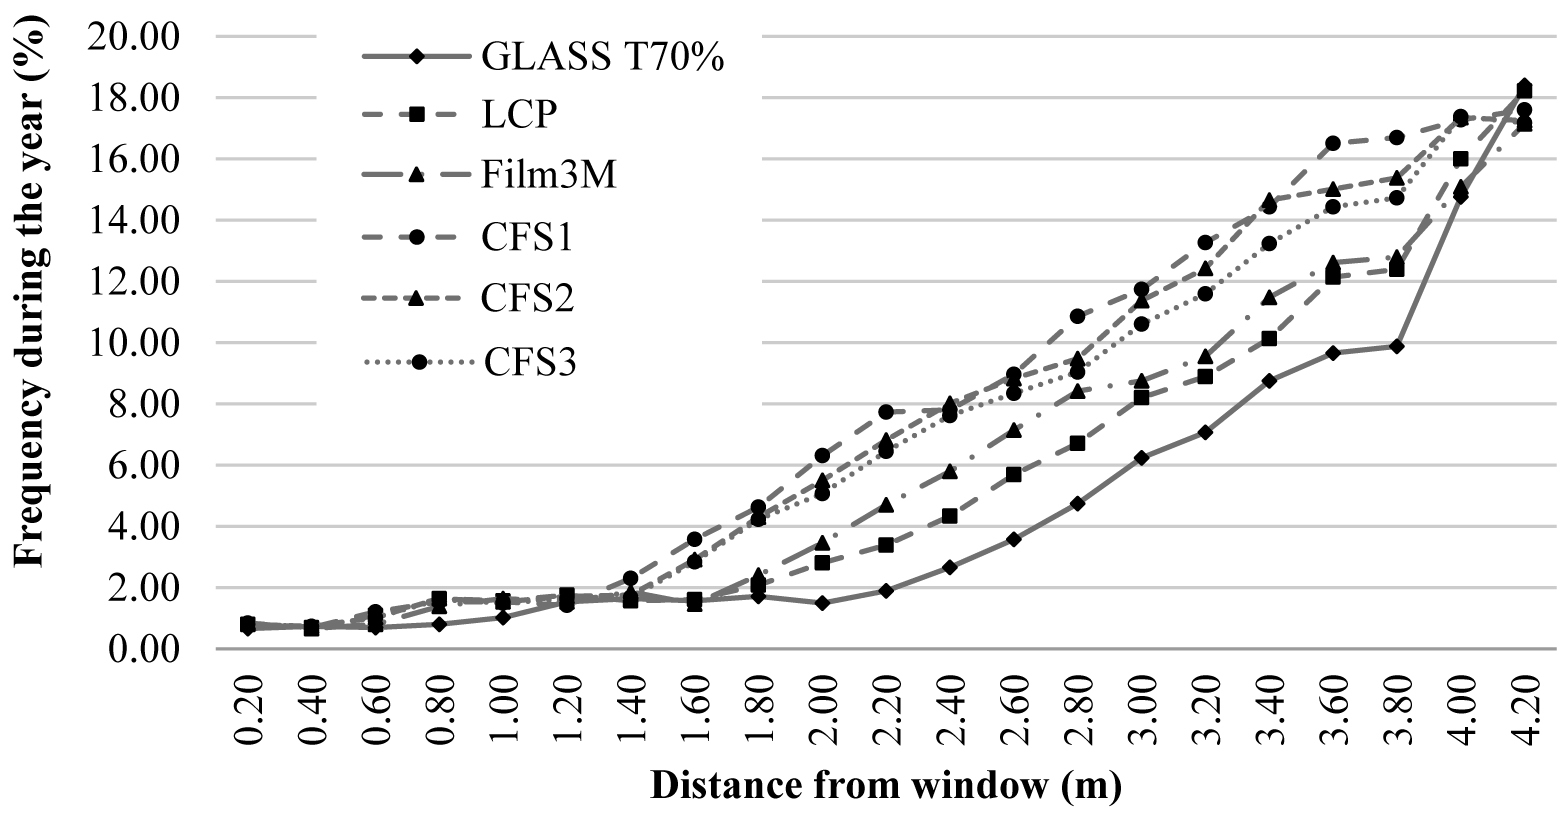
Fig. 8. Annual frequency of daylight illuminance between 300 and 500 lux occurring in the office room of building B2.
Figure 9
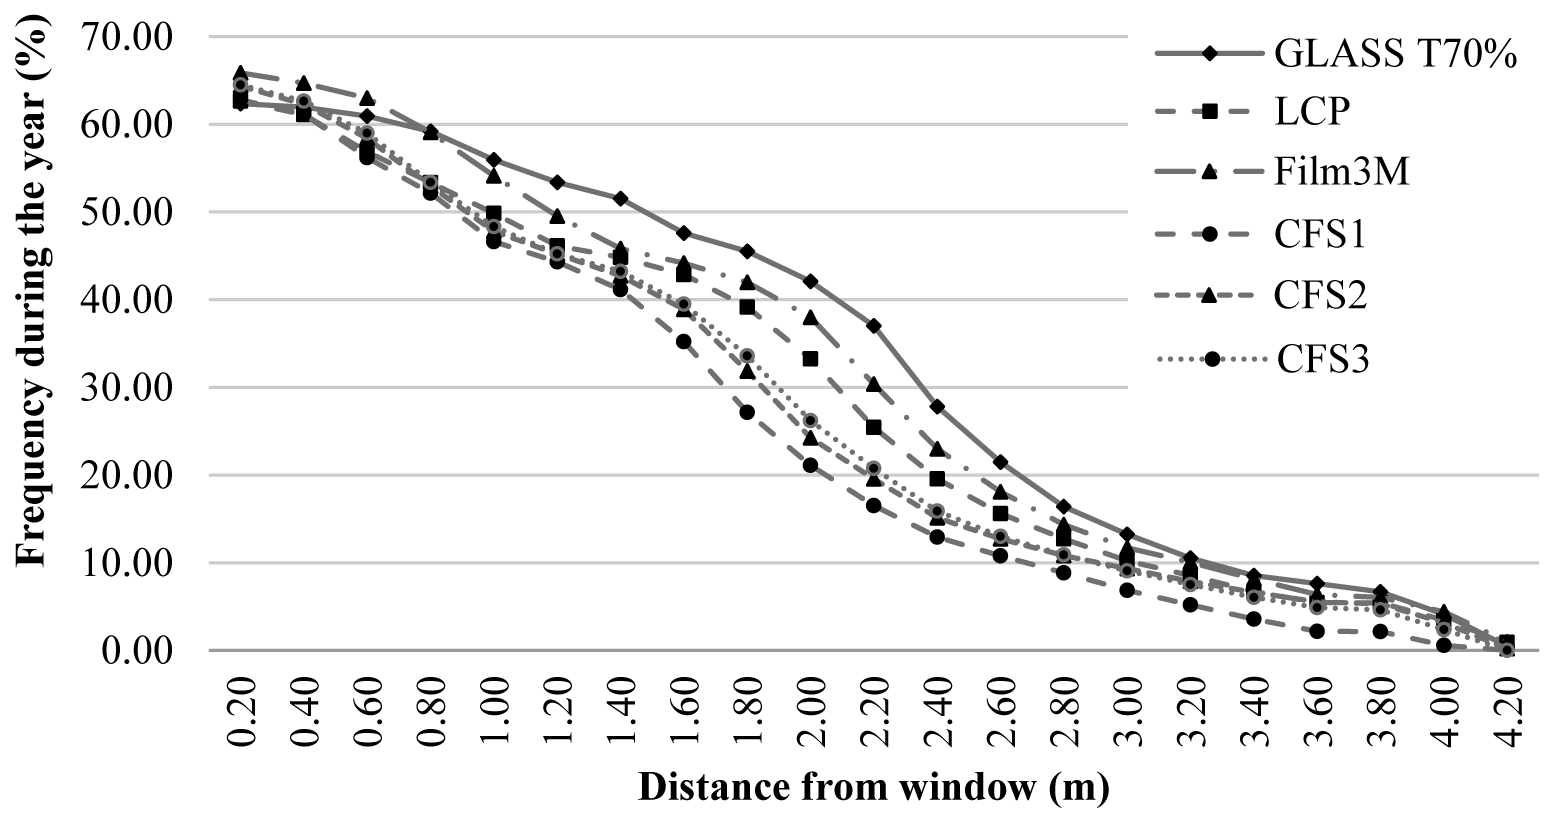
Fig. 9. Annual frequency of illuminance for above 2000 lux occurring in the office room in building B2.
To visualize and compare the light redirection effects of the glazing systems, renderings were produced using the five-phase method for each of the three steps of the simulation process. First, using this method, a rendering was generated to determine the indoor daylight distribution. Then, a second term was produced after subtracting the direct solar contribution. Subsequently, a third rendering was generated to obtain a more accurate simulation of the direct solar component. The three terms were combined in a final image, which produced a relatively accurate daylighting simulation. Using this process, a total of 8760 images for each hourly time-step were generated for each term of the five-phase method, including dark images corresponding to night time. A sample of renderings, which represents the daylighting situations occurring during the winter solstice at 12h00 LT using the LCP, is shown in Fig. 10.
Figure 10
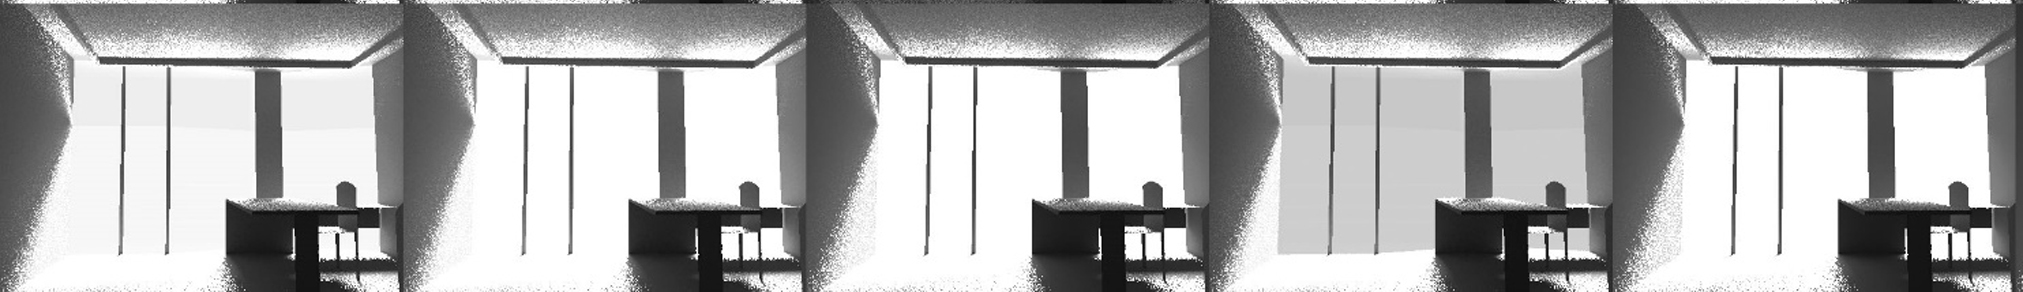
Fig. 10. Example of renderings obtained using the five-phase method in building B2 during winter time at 12h00 LT using the LCP.
4.1.2 Overall assessment
As an overall assessment of the CFS performance regarding the workplane illuminance, the results obtained using the five-phase method were compared using the annual frequency of illuminance classified by ranges. Due to space restriction, this study presents only a single example of the latter assessment. The frequency of occurrence of the target illuminance (300-500 lux) observed during the year for the whole room is presented in Fig. 11, as well as the ‘risky’ illuminance range (> 2000 lux) observed for summer time. It can be seen that the target illuminance is more frequent in the room for CFS1, CFS2, and CFS3, reaching a fraction close to 8%. For illuminance above 2000 lux, the standard glazing (τv 70%) and the 3MTM film offer more frequently those illuminance levels in the room during summer time. Thus, as indicated in such evaluation, the use of 3MTM film and the standard glazing might represent a higher risk of glare and overheating for the occupants. While, CFS1, CFS2, and CFS3 would contribute to distribute the daylight within the recommended range (300-500 lux) more than the others glazing systems.
Figure 11
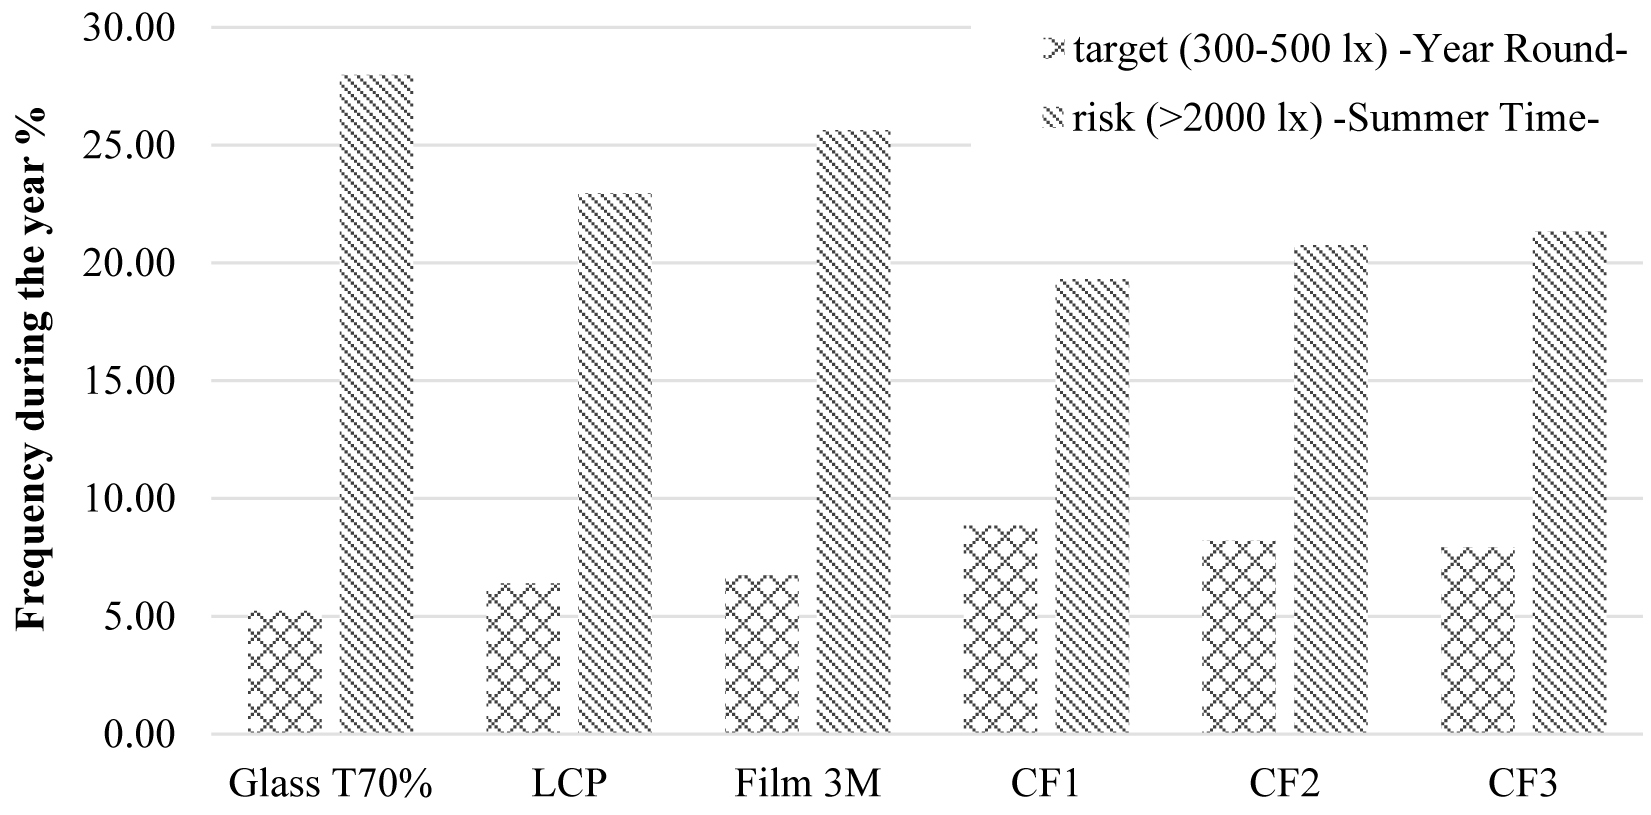
Fig. 11. Average frequency of illuminance achieved using five CFS in the office room according to the 'target' and 'risk' ranges of illuminance.
4.2. Thermal analysis
In the thermal assessment evaluation, the largest solar gains are observed for the standard glazing (τv 70%), as shown in Fig. 12. As expected, the use of CFS allows a reduced transmission of solar gains that are reduced for at least 27% (LCP), and the latter reinforces the well-known function of the CFS as solar protection. Then, the LCP and CFS3 are those allowing the larger amounts of solar radiation among the CFS, while CFS2 and CFS1 transmits less solar gain into the room. The annual average air temperature is shown in Table 5, as an indicator of the interior thermal conditions, showing a similar trend. Those are shown when simulating the full window using standard glass (τv 70%) in the lower part and the glazing systems in the upper part (a), and considering only the upper part of the window (b), as explained in Section 3.2.2.
Table 5

Table 5. The compared average indoor air temperature (ºC) for the standard glazing and the five CFS.
Figure 12
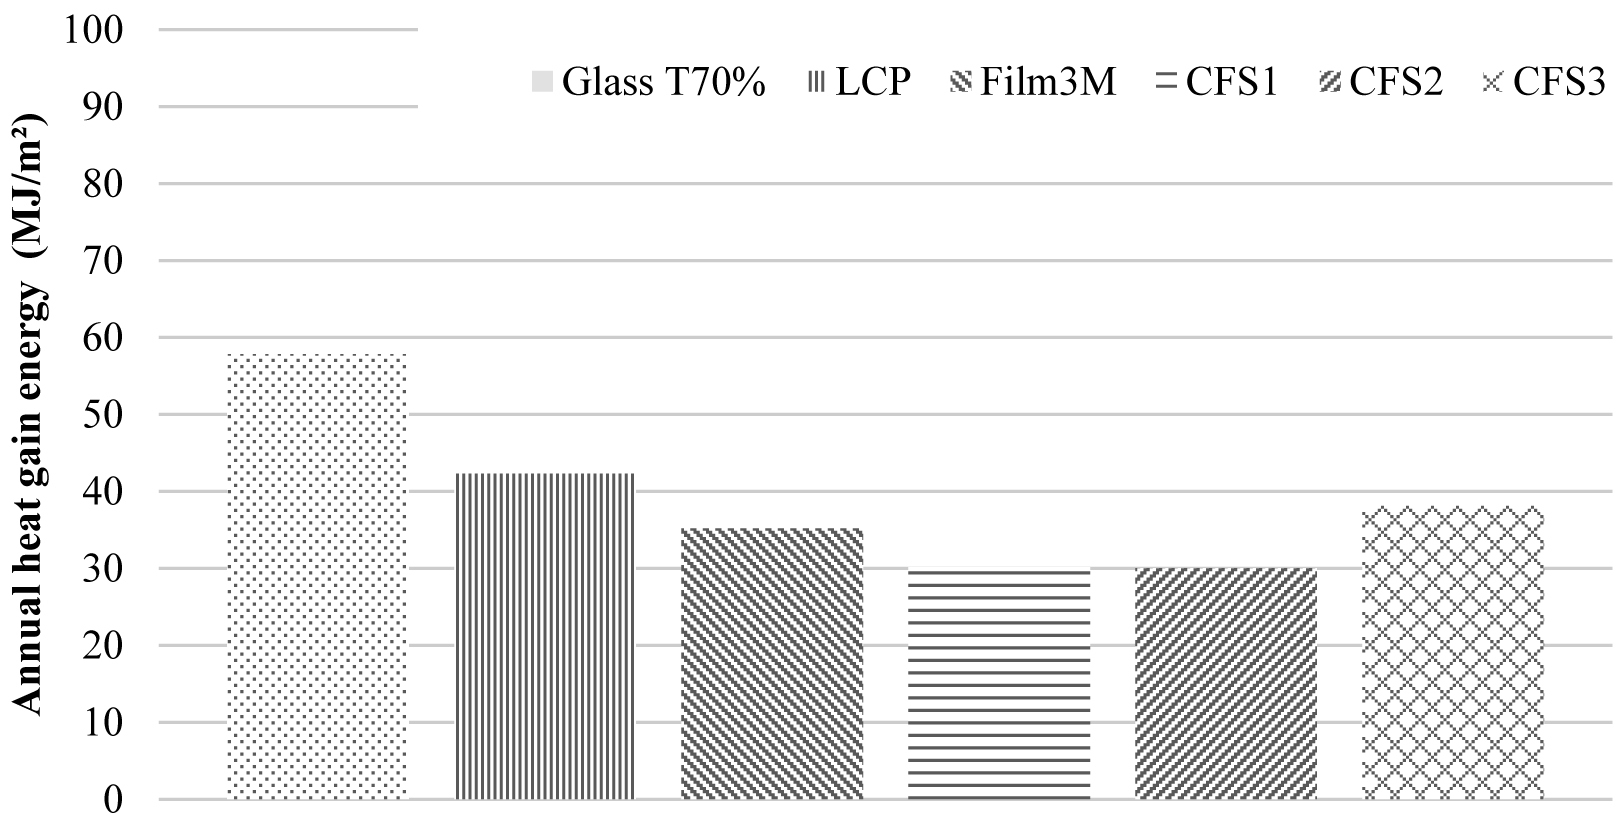
Fig. 12. Annual total solar heat gain transmitted during a whole year in the office room.
However, it is noteworthy that such simulation results present certain inaccuracies, since the BTDF data of the five considered CFS used to create the idf input-file for the Energy Plus software was generated taking into account only the front light transmission data (a monitoring characteristic of the bidirectional gonio-phometer available in the EPFL), as explained in Section 1. To create the BSDF-idf file using the Window 7 software and use it in Energy Plus, ‘zero’ data accounting for the missing, back transmission and front and back reflectance, were added at the original file. The latter would signify an underestimation of the front transmission of the assembled system, as such values would account for the inter-reflections calculation.
5. Conclusions
A method to assess and compare the annual daylighting performance of CFS in sunny climates using advanced computer simulations has been presented. The BSDF data of six fenestration systems (five different CFS and standard glazing) was used to evaluate the interior daylight distribution as well as the overheating risk. The presented approach is advantageous because it offers the possibility of assessing the performance of CFS using the corresponding BSDF data, which is a feature that is not available with the use of other annual daylighting simulation software, such as DAYSIM or DIVA for Rhino. Nevertheless, research on the topic points to the development of integrated simulation tools that allow the use of BSDF data; while its use was not applied to this study, further evaluations could benefit of the recently introduced tools. For this study, a BSDF conversion from Tregenza to Klems angular basis was performed, representing also a novelty in the field. The performance assessment of CFS in prevailing sunny climates requires an integral assessment, which takes into account additional to the interior daylight distribution, also the thermal and visual comfort of the occupants. For the former, Energy Plus is the recommended software since allows the use of BSDF data of CFS to assess the interior thermal conditions in buildings. In the case of the annual risk of glare, few emerging options that would allow such evaluation for CFS such as those used in this study are mentioned in Section 2.3. However, while the annual prediction of glare is currently possible in Open Studio using the BSDF data of specific glazing systems, still the employed calculation method (DGPs) remains disadvantageous when direct sun hits the observer’s eye.
This study shows that the assessment of the annual performance of CFS can be predicted using their BSDF data. According to the results, the use of CFS contributed to improve the interior daylight distribution inside the room since a better distribution of daylight within the recommended range (300-500 lux) was achieved using CFS1 and CFS2 compared with the use of standard glazing. The use of CFS also represented an opportunity to reduce the risk of overheating, as lower solar heat gains were allowed into the room when using the five CFS. While a complete annual integrated assessment of the CFS performance could not be achieved due to the impossibility of assessing the annual risk of glare for the CFS compared in this study. The results obtained from the interior daylight distribution and the thermal comfort analysis would allow to identify the CFS that better contributes to an improved interior visual and thermal environment in the room, taking into account that the potential risk of glare might also be predicted by the presence of high illuminance levels. Furthermore, to identify the outstanding performance of any of the considered systems, an overall evaluation, which takes into account the results obtained from the performed assessments, is required. A multi-criteria analysis was applied for that purpose, and it will be presented in a future article.
Acknowledgements
This work was supported by the National Center of Science and Technology of México (CONACYT), the Swiss Federal Office of Energy (SFOE), and the Velux Foundation Switzerland. The authors thank: in Switzerland, Julien Tharin for his work with the gonio-photometer and Pierre Loesch for his help regarding mechanical devices; in México, Dr. Raúl Delgado Wise for providing the authorization to use the office room located in the Unity for Development Studies, Autonomous University of Zacatecas (UAZ). Additional thanks to Dr. German Molina and Dr. Andy McNeil from the RADIANCE community for their long-distance help regarding the BSDF files.
Contributions
C. Basurto performed the dynamic daylight simulations as well as the visual and thermal comfort assessments, processed the results, and wrote the manuscript with the input from all the authors. J.-H. Kämpf provided guidance relative to the use of the RADIANCE software. Both J. H. Kämpf and J.-L. Scartezzini provided advice with the study’s conception and development and the interpretation of the results.
References
- G. Molina, S. Vera, W. Bustamante, A tool for integrated thermal and lighting analysis of spaces with controlled Complex Fenestration Systems and artificial lighting, in: eSim 2014, 2014, Ottawa, Canada.
- B. Bueno, E. Guidolin, J. Wienold, and T. E. Kuhn, A Radiance-based building energy model to evaluate the performance of complex fenestration systems, in: ASHRAE/IBPSA-USA Building Simulation Conference, 2014, Atlanta, GA.
- G. D. Michele, U. F. Oberegger, and L. Baglivo, Integrated dynamic thermal and daylighting simulation for complex fenestration systems, in: Building Simulation Applications, 2015, Italy.
- M. Andersen, J.-L. Scartezzini, l. Michel, C. Roecker, H. –P. Baumann, R. Brunkhorst, and H. Coldewey, Bi-directional photogoniometer for the assessment of the luminous properties of fenestration systems, CTI Project-Scientific Report, LESO-PB, EPFL, Lausanne, 2000.
- J. Wienold, Dynamic simulation of blind control strategies for visual comfort and energy balance analysis. In: Building Simulation, 2007, Beijing, China.
- G. Ward, R. Mistrick, E. S. Lee, A. McNeil, and J. Jonsson, Simulating the Daylight Performance of Complex Fenestration Systems Using Bidirectional Scattering Distribution Functions within Radiance, LEUKOS 7 (2011) 241–261. http://dx.doi.org/10.1080/15502724.2011.10732150
- P. R. Tregenza, Daylight Coefficients, in: CIBS National Lighting Conference, 1982, pp. 65–71, Warwick, UK.
- P. J. Littlefair, Daylight coefficients for practical computation of internal illuminances. Lighting Research and Technology 24 (1992) 127–135. http://dx.doi.org/10.1177/096032719202400302
- J. Mardaljevic, Simulation of annual daylighting profiles for internal illuminance, Lighting Research and Technology 32 (2000) 111–118. http://dx.doi.org/10.1177/096032710003200302
- D. Bourgeois, C. F. Reinhart, and G. Ward, Standard daylight coefficient model for dynamic daylighting simulations, Building Research & Information 36 (2008) 68–82. http://dx.doi.org/10.1080/09613210701446325
- J. H. Klems, A New Method for Predicting the Solar Heat Gain of Complex Fenestration Systems–2. Detailed Description of the Matrix Layer Calculation, ASHRAE Transactions 100 (1994) 1073–1086.
- A. McNeil and E. S. Lee, A validation of the Radiance three-phase simulation method for modelling annual daylight performance of optically complex fenestration systems, Journal of Building Performance Simulation 6 (2013) 24–37. http://dx.doi.org/10.1080/19401493.2012.671852
- A. McNeil, The Three-Phase Method for Simulating Complex Fenestration with Radiance, Lawrence Berkeley National Laboratory, Berkeley, CA, USA, pp. 1–35, 2010.
- A. McNeil, The Five-Phase Method for Simulating Complex Fenestration with Radiance, Lawrence Berkeley National Laboratory, Berkeley, CA, USA, 2013.
- U.S. Department of Energy, EnergyPlus, Available online: http://apps1.eere.energy.gov/buildings/energyplus (accessed on 29 August 2014).
- M. Andersen and J. d. Boer, Goniophotometry and assessment of bidirectional photometric properties of complex fenestration systems, Energy and Buildings 38 (2006) 836–848. http://dx.doi.org/10.1016/j.enbuild.2006.03.009
- LBNL, Window 7, CA, USA, 2014, Available online: https://windows.lbl.gov/software/window/6/ (accessed on 10 September 2014).
- Open Studio, Version 1.9.0, 2015, Available online: http://nrel.github.io/OpenStudio-user-documentation/getting_started/features/ (accessed on 10 January 2015).
- J. Wienold, Dynamic Daylight Glare Evaluation, in: 11th International IBPSA Conference, 2009, Glasgow, Scotland.
- J. Mardaljevic, A. Marilyne, R. Nicolas, and J. Christoffersen, Daylighting Metrics: Is there a relation between useful daylight illuminance and daylight glare probability, in: Proceedings of the Building Simulation and Optimization Conference BSO12, 2012, Loughborough, UK.
- G. Ward and R. Shakespeare, Rendering with Radiance, The Art and Science of Lighting Visualization, Morgan Kaufmann, 1997.
- Solartran, Available online: www.solartran.com.au (accessed on 29 August 2014).
- N. Ruck, Ø. Aschehoug, S. Aydinli, J. Christoffersen, G. Courret, I. Edmonds, R. Jakobiak, M. Kischkoweit-Lopin, M. Klinger, E. Lee, L. Michel, J. –L. Scartezzini, and S. Selkowitz, Daylight in Buildings, International Energy Agency, Washington, DC, USA, 2000.
- R. Padiyath, Daylight Redirecting Window Films, 3M Company, pp. 217, 2013.
- S. Klammt, A. Neyer, and H. F. O. Müller, Microoptics for Efficient Redirection of Sunlight, 2012, TUD University, Dortmund, Germany.
- S. Klammt, A. Neyer, and H. F. O. Müller, Redirection of Sunlight by Microstructured Components - Simulation, Fabrication and Experimental Results, 2012, TUD Dortmund University, Dortmund, Germany.
- Meteonorm, Version 7.0, 2014, Bern, Switzerland, Available online: http://www.meteonorm.com/ (accessed on 30 August 2014).
- A. Nabil and J. Mardaljevic, Useful daylight illuminance: a new paradigm for assessing daylight in buildings, Lighting Research and Technology 37 (2005) 41–59. http://dx.doi.org/10.1191/1365782805li128oa
- A. Nabil and J. Mardaljevic, Useful daylight illuminances: A replacement for daylight factors, Energy and Buildings 38 (2006) 905–913. http://dx.doi.org/10.1016/j.enbuild.2006.03.013
- IESNA, IES Lighting Handbook, Illuminating Engineering Society of North America (IESNA), 1984.
- IESNA, IESNA Lighting Handbook, Illuminating Engineering Society of North America (IESNA), New York, 2000.
- CIBSE, Lighting Handbook, The Chartered Institution of Building Services Engineers, London, UK, 1994.
- J.-L. Scartezzini, and B. Paule, Eclairage des Bureau, Programme d'action RAVEL, ed. RAVEL, Societé Suisse des Ingenieurs et des Architectes, 1994.
- J. H. Klems, J. L. Warner, and G. O. Kelley. A Comparison Between Calculated and Measured SHGC for Complex Fenestration Systems, in: ASHRAE Winter Meeting, 1995, Atlanta, GA.
- P. R. Tregenza, Subdivision of the sky hemisphere for luminance measurements, Lighting Research and Technology 19 (1987) 13–14. http://dx.doi.org/10.1177/096032718701900103
Copyright © 2015 The Author(s). Published by solarlits.com.

2091
Total views
Citations
SHARE ON


