Article Outline
Figures and tables
Volume 3 Issue 2 pp. 12-26 • doi: 10.15627/jd.2016.4
Appraisal of the Visual Environment in an Industrial Factory: a Case Study in Subtropical Climates
Author affiliations
School of Design, Creative Industries, Queensland University of Technology, Australia
* Corresponding author. Tel: +61 73138 1623
kieumien.pham@outlook.com (K. Pham)
v.garciahansen@qut.edu.au (V. Garcia-Hansen)
g.isoardi@qut.edu.au (G. Isoardi)
History: Received 28 June 2016 | Revised 1 August 2016 | Accepted 8 August 2016 | Published online 10 September 2016
Copyright: © 2016 The Author(s). Published by solarlits.com. This is an open access article under the CC BY license (http://creativecommons.org/licenses/by/4.0/).
Citation: Kieu Pham, Veronica Garcia-Hansen, and Gillian Isoardic, Appraisal of the Visual Environment in an Industrial Factory: a Case Study in Subtropical Climates, Journal of Daylighting 3 (2016) 12-26. http://dx.doi.org/10.15627/jd.2016.4
Figures and tables
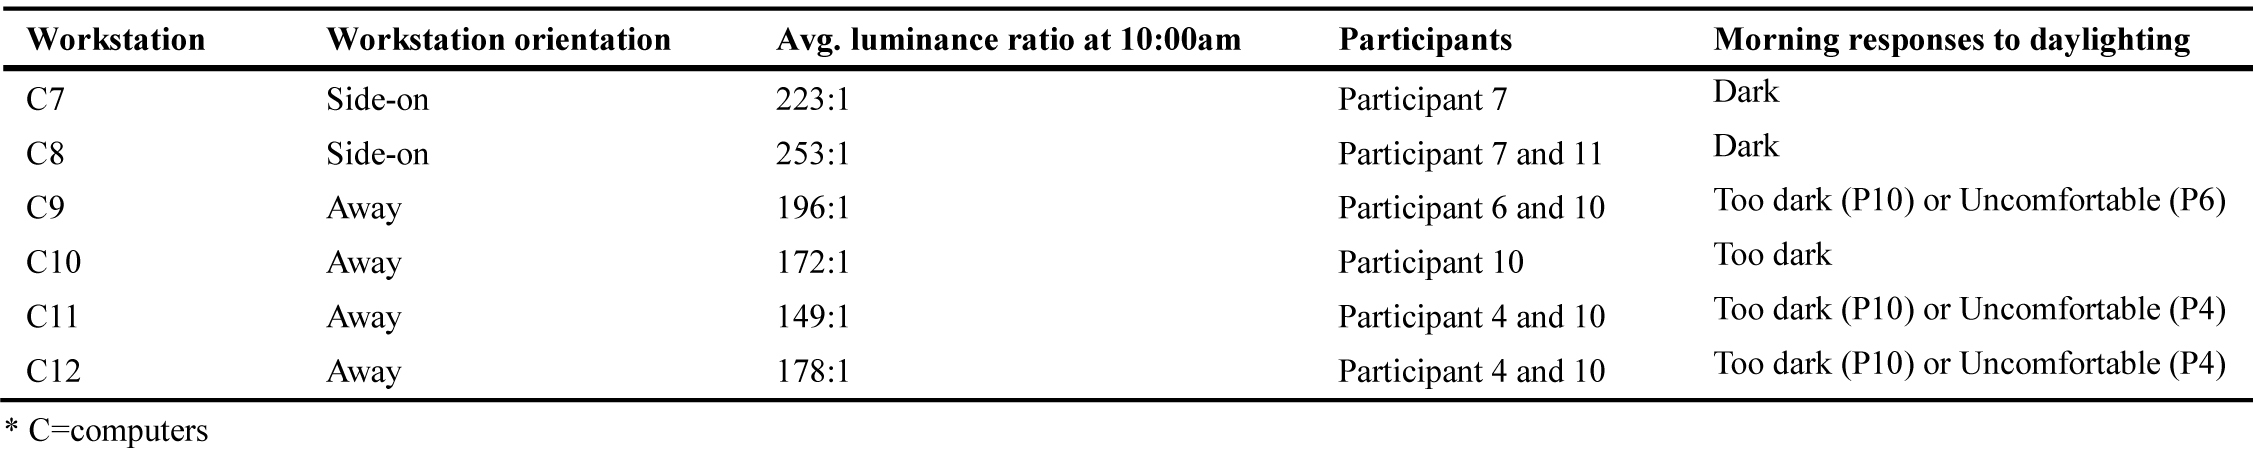 Table 15
Abstract
The physiological and psychological benefits of daylighting for office occupants have been well explored. Current research usually focuses on visual comfort in office buildings. However, there is limited knowledge about daylight quality in industrial work environments. In Australia, most industrial buildings are built from standard factory structures that employ daylight from skylights and large door openings, with little consideration to daylighting design strategies and visual comfort. In bright sky conditions as those present in Australia, large openings can become a source of visual discomfort. It is important to understand how workers perceive the luminous environment in this type of work setting. This research explored the perception of daylighting in an industrial work environment. Qualitative measures (questionnaires, interviews, and observational mapping) and quantitative measures (physical data) were collected over a four week period to examine the type of visual comfort perceived by industrial workers. The results suggests that the desirability to have windows and to have access to a view were important features in this work setting. Access for task lighting and reports of uneven daylighting were indicative to the varying levels of illuminance under intermediate sky conditions. This was reflected in the daylight glare index results and comparisons to the background luminance and glare source luminance, indicating that adaptation may be the cause of responses to daylighting being uneven. The results suggests a need for further research into the quality of the luminous environment in industrial work settings.
Keywords
Daylighting, Visual comfort, Luminance mapping, Illuminance
Nomenclature
| Lb | luminance background (cd/m2) |
| Ls | luminance of the glare sources (cd/m2) |
1. Introduction
Extensive research has demonstrated the critical role of daylighting to the visual, emotional, and physiological well-being and comfort of building occupants in work environments [1–5]. Providing quality daylighting is desirable to support long hours spent in working spaces to ensure optimum productivity, task visibility, alertness, and positive health outcomes [6]. Research has shown that daylighting effects visual performance, biological rhythms, visual stimulation, mood, safety and, the perceived quality of the work environment [7–10]. For instance, the amount of daylight penetrating from windows into interior offices can have a positive influence on job satisfaction, support well-being, and relaxation [11–13]. This in turn is influenced by the proximity of workstations to windows, size, and the view type to connect to the outside world [14–16]. In addition, lighting controllability where occupants prefer to have individual control to adjust electrical and daylighting also plays another factor in satisfaction and comfort [17,18].
Lighting research has often focused on offices, schools, healthcare, and laboratory building typologies. This is due to the increase number of people working in the service sector where new technologies have changed the nature of the visual task to visual display terminals. Due to the nature and activities performed, research in industrial buildings has focused more on providing safe environments, specifically on thermal quality, hearing loss, job strain, health, and psychosocial environments of industrial workers [19–22]. Research on how daylighting affects workers in industrial settings is lacking.
Normally, industrial buildings present very good opportunities for daylighting harvesting. These buildings are typically one-story, with high ceilings and have little to no building obstructions [23–25]. Therefore, top lighting strategies through skylights are common. The intentions of using this type of lighting strategy are to provide uniform daylighting along with electrical lighting for visual comfort and visual acuity when carrying out various manufacturing productions. This is even more so, now that computer screens are also present thanks to the automation of light industry activities [26].
Most factories in Australia are built from standard factory structures that provide basic layouts and openings to suit various batch and assembly production. This includes allowing enough space for industrial workers to travel to multiple workstations. These factories are typically portal frame with an open plan layout, high windows, and large roller doors [23,27]. Thus, they become economic and flexible to a diverse manufacturing industry sector. Although electrical lighting design is usually provided through standard requirements, daylighting guidelines are not provided and are thus left more to chance. The problem is that factories that rely exclusively on natural lighting use roller doors as large windows. Even with the use of top lighting, this can affect visual comfort and achieving uniformity; especially in climates with bright skies as those present in Australia.
Visual comfort is often identified by factors of visual discomfort. However, this is not easily assessed. Visual discomfort has contributing factors such as subjectivity, environment, non-uniformity of illuminance, and the quality of the luminous environment within the field of vision [28–30]. One area of focus in the research in luminance is glare. Glare is produced from a non-uniform luminance distribution of brightness and can be experienced as a psychophysical sensation [31]. This can result in constant annoyance and distraction from veiling reflections, excessive brightness, and environmental discomfort [32]. Long-term visual discomfort can affect performance and productivity [33].
Industrial workers spend on average 46 hours per week in industrial factories and providing a productive and healthy working environment is paramount [34]. There is limited research that has investigated visual comfort in industrial settings that rely exclusively on natural lighting. The complex nature of industrial settings often poses a great challenge in data collection, therefore a case study was chosen to examine an industrial building to describe the type of visual comfort perceived by industrial workers in a subtropical climate (Brisbane, Australia) [35]. The aim is to relate user impressions and attitudes to daylighting and physical data in order to describe the type of visual comfort experienced in this type of industrial setting. By using a Post Occupancy Evaluation (POE) [36] within person study approach [37] physical data (illuminance, luminance, and high dynamic range images), observational data (observation of participants and behavioral mapping), and self-reported surveys were collected over a four week period. The next section of this paper describes lighting assessments available, followed by research design, methods, results, and discussion on the implications of the findings.
1.1. Assessment of the visual environment
Providing quality daylight is to ensure an even distribution of illumination, prevent visual discomfort, provide views to satisfy occupant needs, and avoid direct glare and lighting contrast surrounding work tasks [38–40]. Lighting quality can be defined as the degree to which lighting fulfils the visual needs and visual comfort to carry out tasks [40]. Assessing lighting quality in industrial work environments is normally performed by illuminance measurements, where electrical lighting is present.
These measurements have been graded into standards and guidelines such as the CIBSE [41], the CIE [42], and the Australian Standards [39 ]. This has traditionally provided quality lighting for industrial work environments that have electrical lighting [24]. Currently, there are no illuminance standards to provide recommendations for industrial settings that solely use daylighting. The current standards for electrical lighting for industrial activities are between 200–500 lxfor rough saw work and medium quality bench work [39,42]. Currently, there are no clear guidelines indicating illuminance levels for computer workstations. Providing quality daylighting is more challenging than electrical lighting; since it is subjected to variable sky and whether conditions. It also presents issues with avoiding glare, particularly in subtropical climates where bright skies can cause discomfort glare [43–45].
Considering that the nature of tasks have also included viewing vertical display terminals, other studies have used high dynamic range (HDR) imaging in daylighting research to assess visual comfort to the surrounding luminous environment. Luminance is the physical quantity that measures a given light source as seen within the visual field of view (FOV). The detection of glare is calculated through HDR imaging using radiance software, such as Evalglare. General outputs for metric indices are given, such as the Daylight Glare Probability (DGP) and Daylight Glare Index (DGI) to indicate whether glare scenes are detected [46]. Wienold and Christoffersen [46] examined discomfort glare in simulated office environments and have found the DGP useful in finding positive correlation to user responses. On the other hand, Tuaycharoen and Tregenza conducted two experiments in simulated test rooms using the DGI to find correlation between discomfort glare and user responses [44]. They found that the DGI useful in showing the relationship between the glare source type and user responses in different view types.
However, visual comfort is also associated with adaptation, which has been highlighted by various studies [47–51]. Adaptation occurs when the visual system is required to adjust to different levels of the surrounding luminances within the visual field. The surrounding luminance can affect the type of glare sensations experienced based on the luminance contrast between the background luminance () and the glare source luminance (). As such, the surrounding luminance can often be perceived as glaringly bright or as black shadows [29]. Osterhaus [52] recommends a ratio of 1:40 between tasks and the surrounding surface in the field of view as a maximum before this can affect visual acuity and visual comfort. However, there are no standard guidelines to recommend thresholds for adaptation due to the complexity of subjective responses of individuals. This case study will use qualitative measures to assess visual comfort (questionnaires and observational mapping) and quantitative measures of daylighting (HDR imaging, DGI assessment, luminance ratios, and horizontal illuminance) to describe the type of visual comfort experienced in an industrial work setting.
2. Methods
2.1. Design
A case study was carried out in an existing industrial factory in Carole Park, Brisbane. The study was consented by the company to collect data for only four weeks in the period of April 2015. The factory featured an open plan layout with two spaces: a fabrication and production area (using only natural lighting), and a painting and detailing area (using electrical lighting and natural daylighting) (Fig. 1). The fabrication and production space, which was the focus of this study, featured large heavy machinery, skylights (Fig. 2), LED high bay industrial light fixtures, and three West-facing large roller doors. There were no windows or openings along the East and South facing walls but one large roller door on the North-facing wall that was permanently shut. Daylighting was exclusively used in this space to reduce running costs.
Figure 1
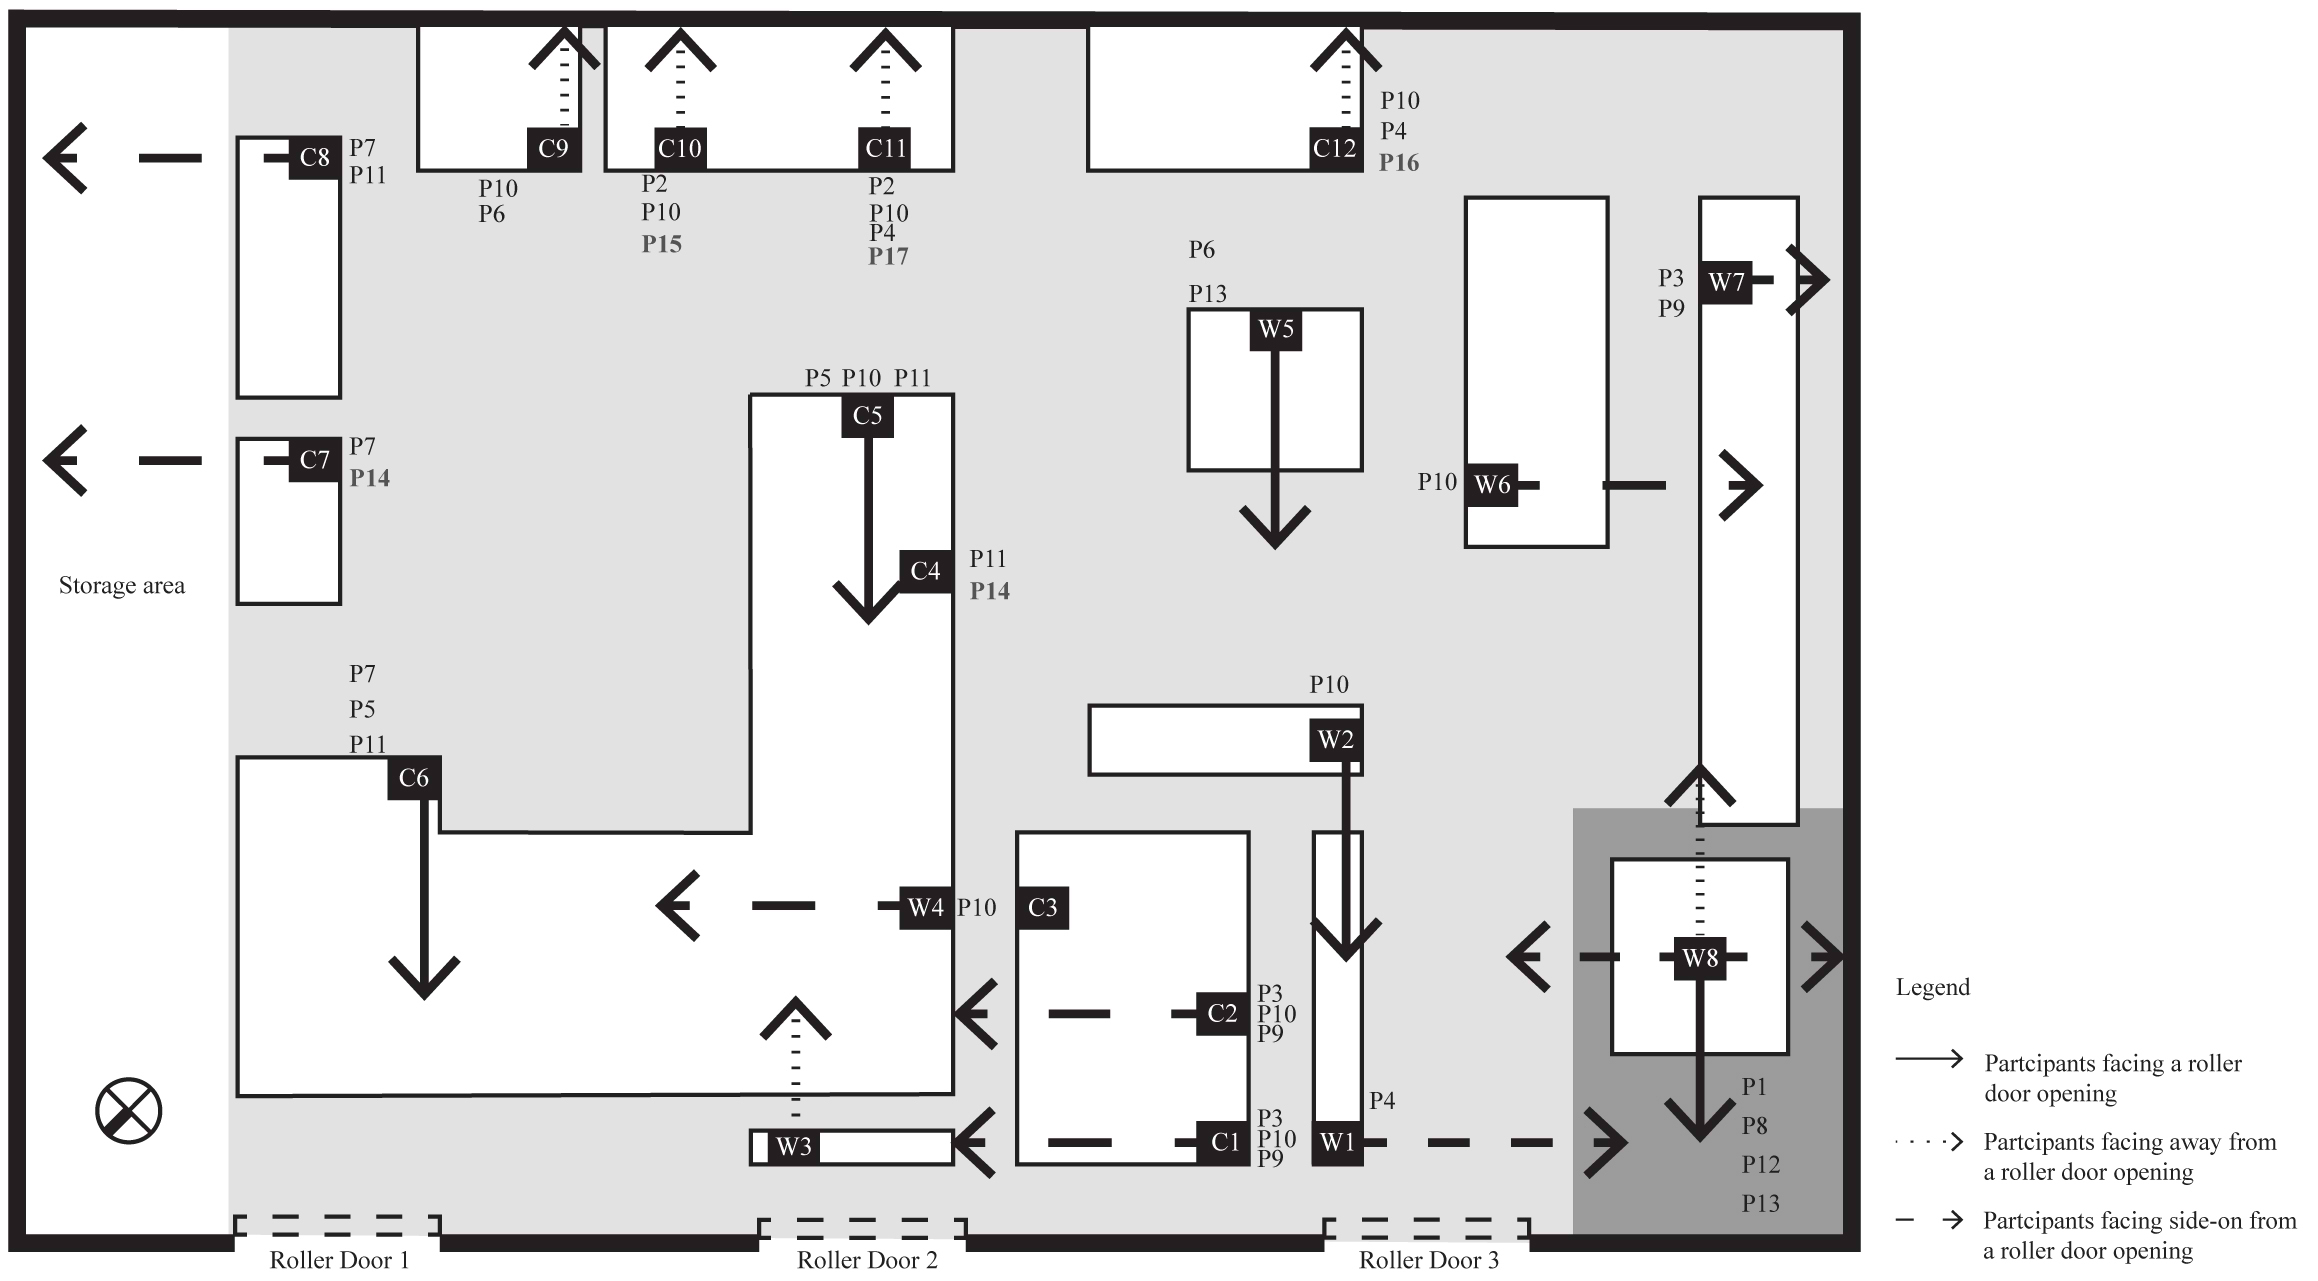
Fig. 1. Floor plan showing the fabrication and production space and the location of participants that uses only daylighting through the large roller doors and skylights, and the painting and detailing space that uses electrical lighting (highlighted in dark grey).
Figure 2
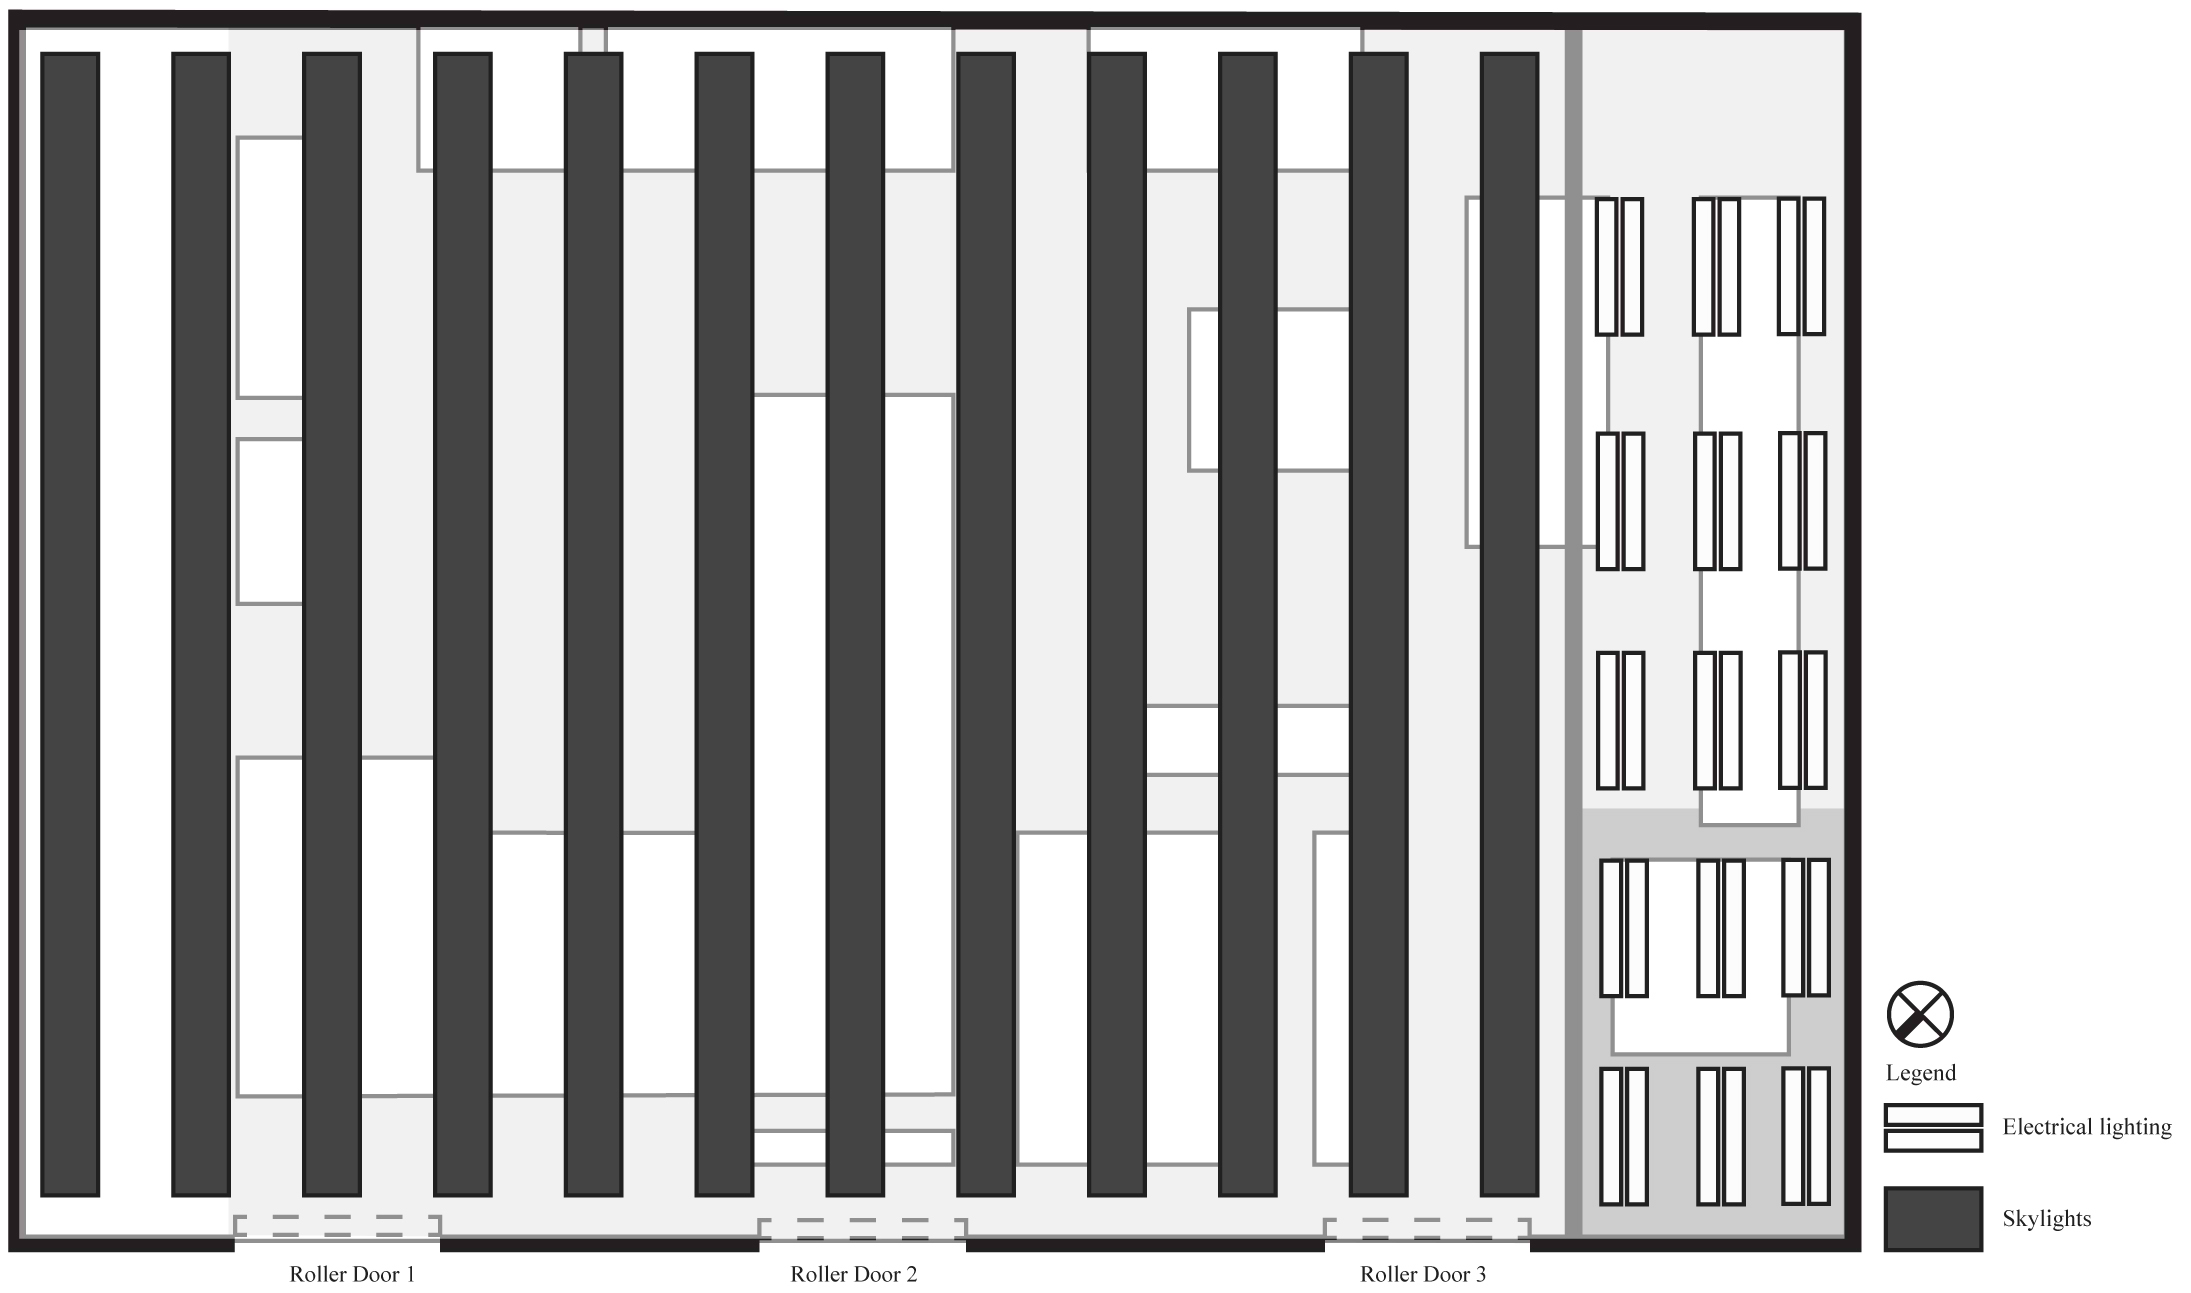
Fig. 2. Reflected ceiling plan showing skylights used as part of top lighting strategy. This was the only source for daylight penetration along with the three large roller doors.
The study used a within-subject framework, where subjects were involved in two assessment periods. First, thirteen full-time male workers participated in an 8-item POE questionnaire while illuminance measurements were recorded at participant workstations. Second, an interview was conducted on another day with the same participants with the addition of four more (total 17) at each of their workstation while HDR images were captured and observational mapping of participants locations was recorded. Only full-time male workers participated aged 19-56 (mean age 34), reflecting the population of employees in this factory. All workers available on both days participated in this study.
2.2. Questionnaires and observational mapping
The questionnaires were formulated for participants to report how daylighting affected their visual comfort. These questions were adapted from the Post Occupancy Evaluation Daylighting Manual [43] and were modified to suit the work type (Table 1). These questions were formulated to gauge any patterns in responses and attitudes about visual comfort among the participants to compare to physical data. This qualitative approach provided a deeper analysis to understand each participant’s report on visual comfort. Topics covered in the questionnaire were: preferences for lighting type, desirability of windows, and how participants perceived daylighting at different times of the day in their work environment (Table 1). The questionnaires were distributed to 13 participants in total with 3 participants who only worked in the painting and detailing area. This was used to provide a basis to compare the difference between workers in the fabrication and production area (natural lighting), and the painting and detailing area (electrical and natural lighting).
Table 1
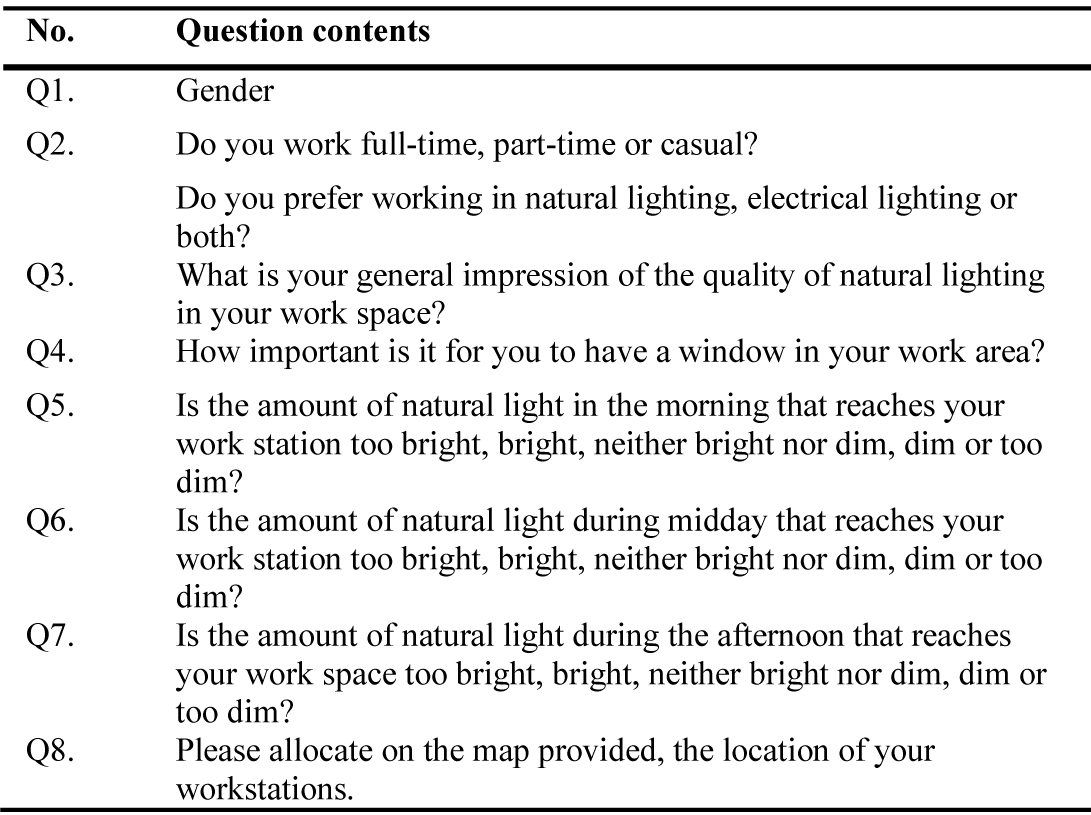
Table 1. Participant questionnaire.
Interviews were conducted verbally with 17 (four more male participants were included as they were working that day) participants at their workstations a week later. Yes or no questions were used that covered desirability of views, attitude towards having the large roller doors being additional lighting and the desire to have windows in close proximity to their workstation (Table 2). Each response was recorded on a floor plan to locate responses based on the location of each participant workstation.
Table 2
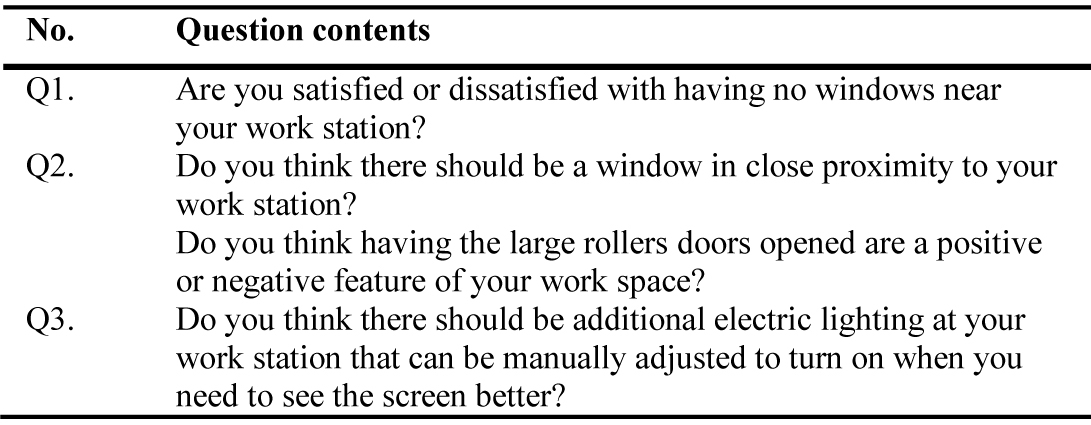
Table 2. Interview questions (conducted at each workstation).
2.3. Physical data
Illuminance measurements were recorded throughout the day. These measurements were recorded on the first survey day at 9:00 am, 11:00 am, 12:00 pm, 1:00 pm, 2:00 pm, and 3:00 pm. A calibrated illuminance meter (Konica Minolta T.10) was placed on the surface of each workstation followed by recording the external illuminance at each hour. Weather conditions were intermediate. These measurements captured only daylighting in the fabrication and production space. The mean and standard deviation were calculated for the horizontal illuminance for each workstation.
To relate the luminous environment surrounding these workstations to participant’s visual comfort, HDR images were captured at available workstations when interviews were conducted. During this time, some workstations were unable to be captured, and times of capturing photos were restricted to 10 am, 12 pm, and 3 pm to prevent obstruction from work activities. A calibrated Nikon E8400 digital camera with a fisheye lens and tripod was used to capture luminance maps through multiple exposure sequences at six different exposures at each hour (Fig. 3). The exposure values (EV) were =14, =13, =9, =10, =11, =12, and =13. This was captured under intermediate sky conditions. Photographs were combined to create a complete HDR image of each workstation in Photosphere and was spot calibrated using a Konica Minolta LS-110 Luminance Meter. The images were then post-processed in Evalglare version 1.0 (Fig. 4). Evalglare then provided general outputs of the DGI, the average and the average from each scene, which was used to describe and relate to participant’s responses to visual comfort. During the collection of physical data, there were strict instructions to prevent physical obstruction from work productivity and safety incidents.
Figure 3
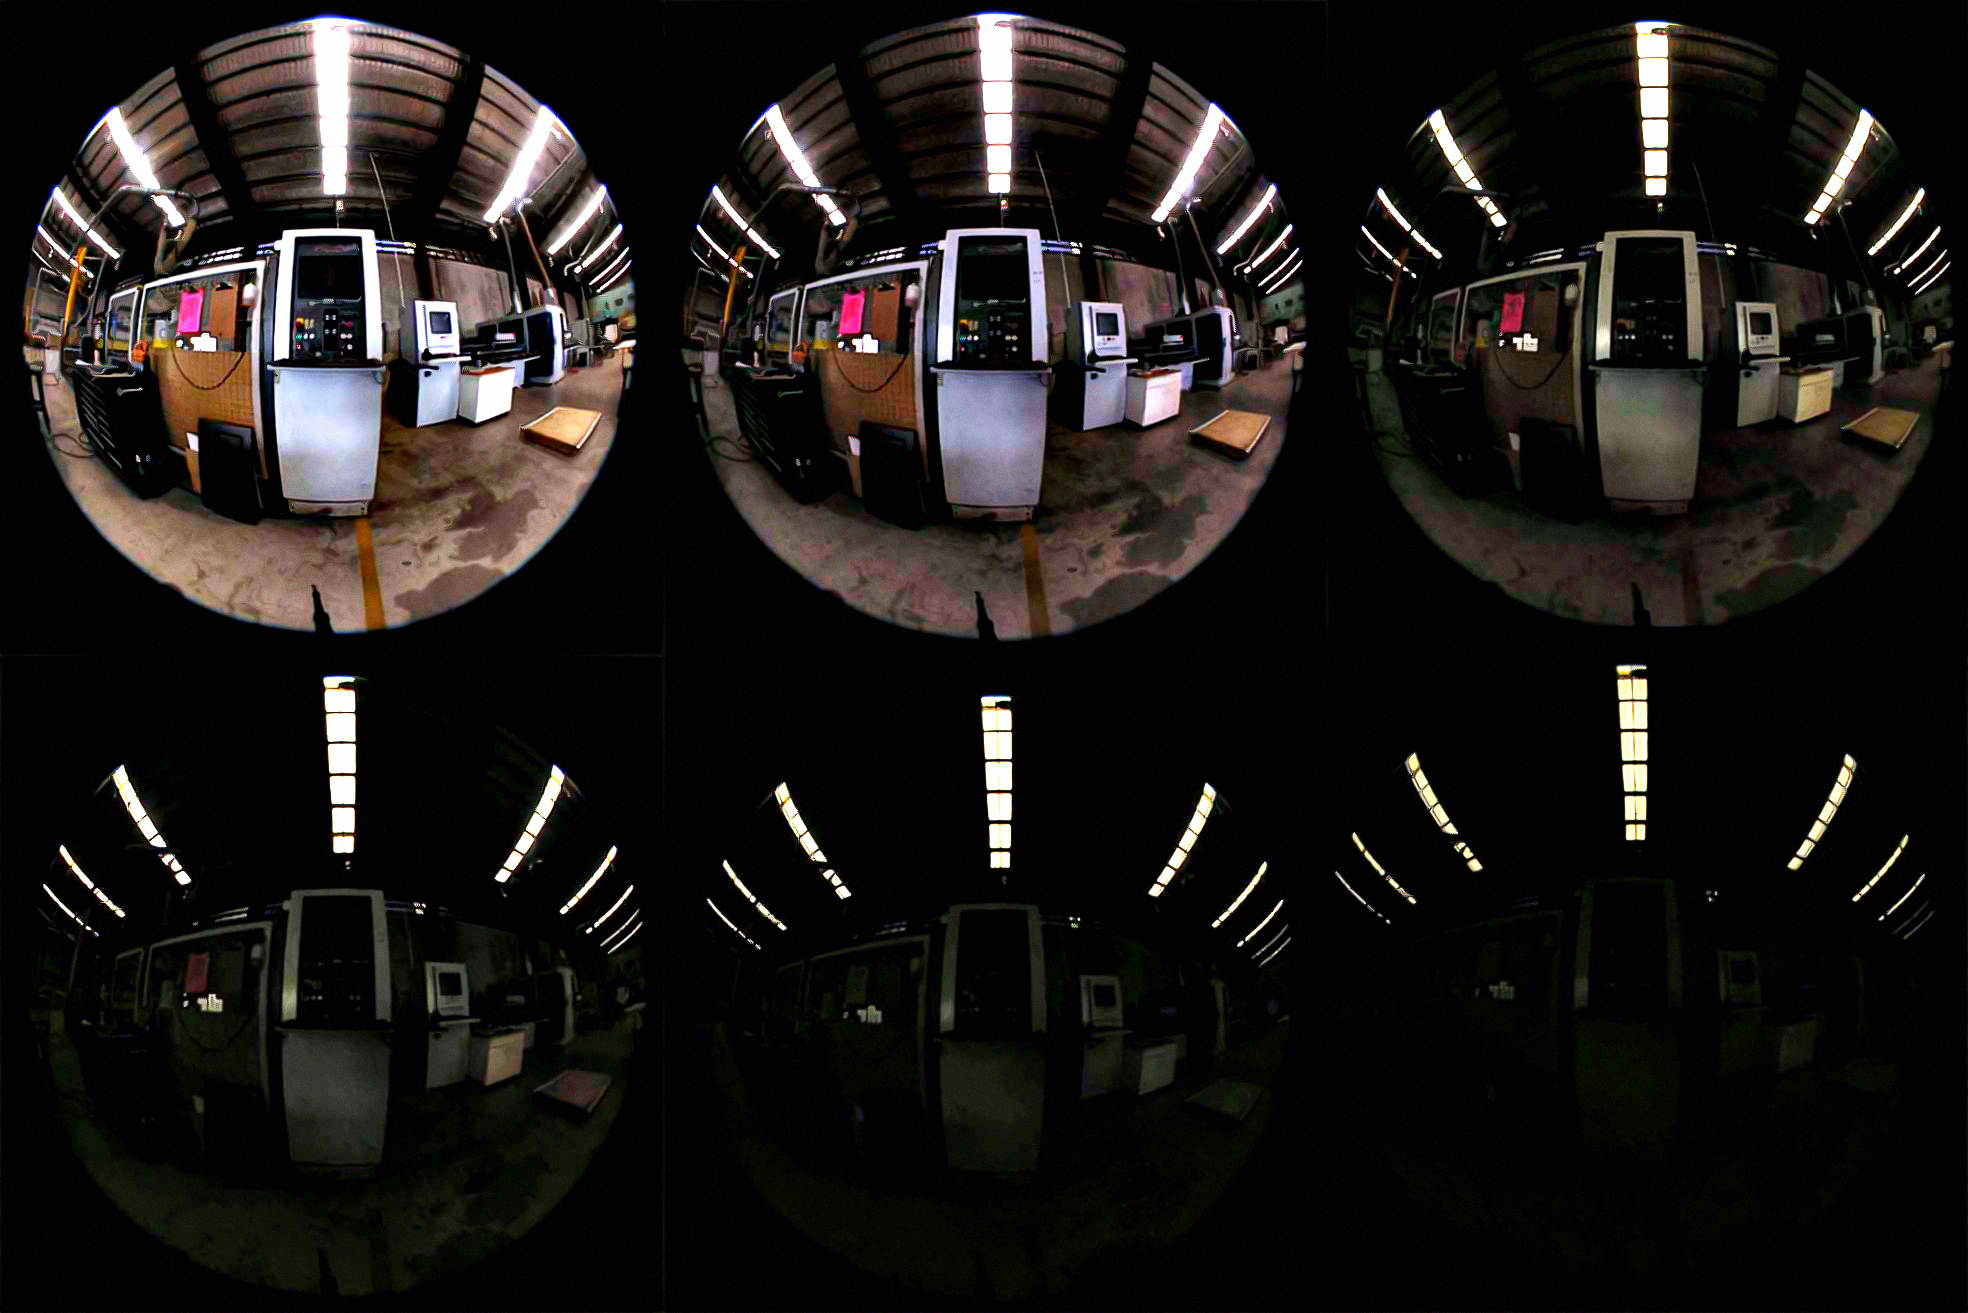
Fig. 3. Example of captured workstations at six different exposures: EV100=14, EV100=13, EV100=9, EV100=10, EV100=11, EV100=12, and EV100=13.
Figure 4
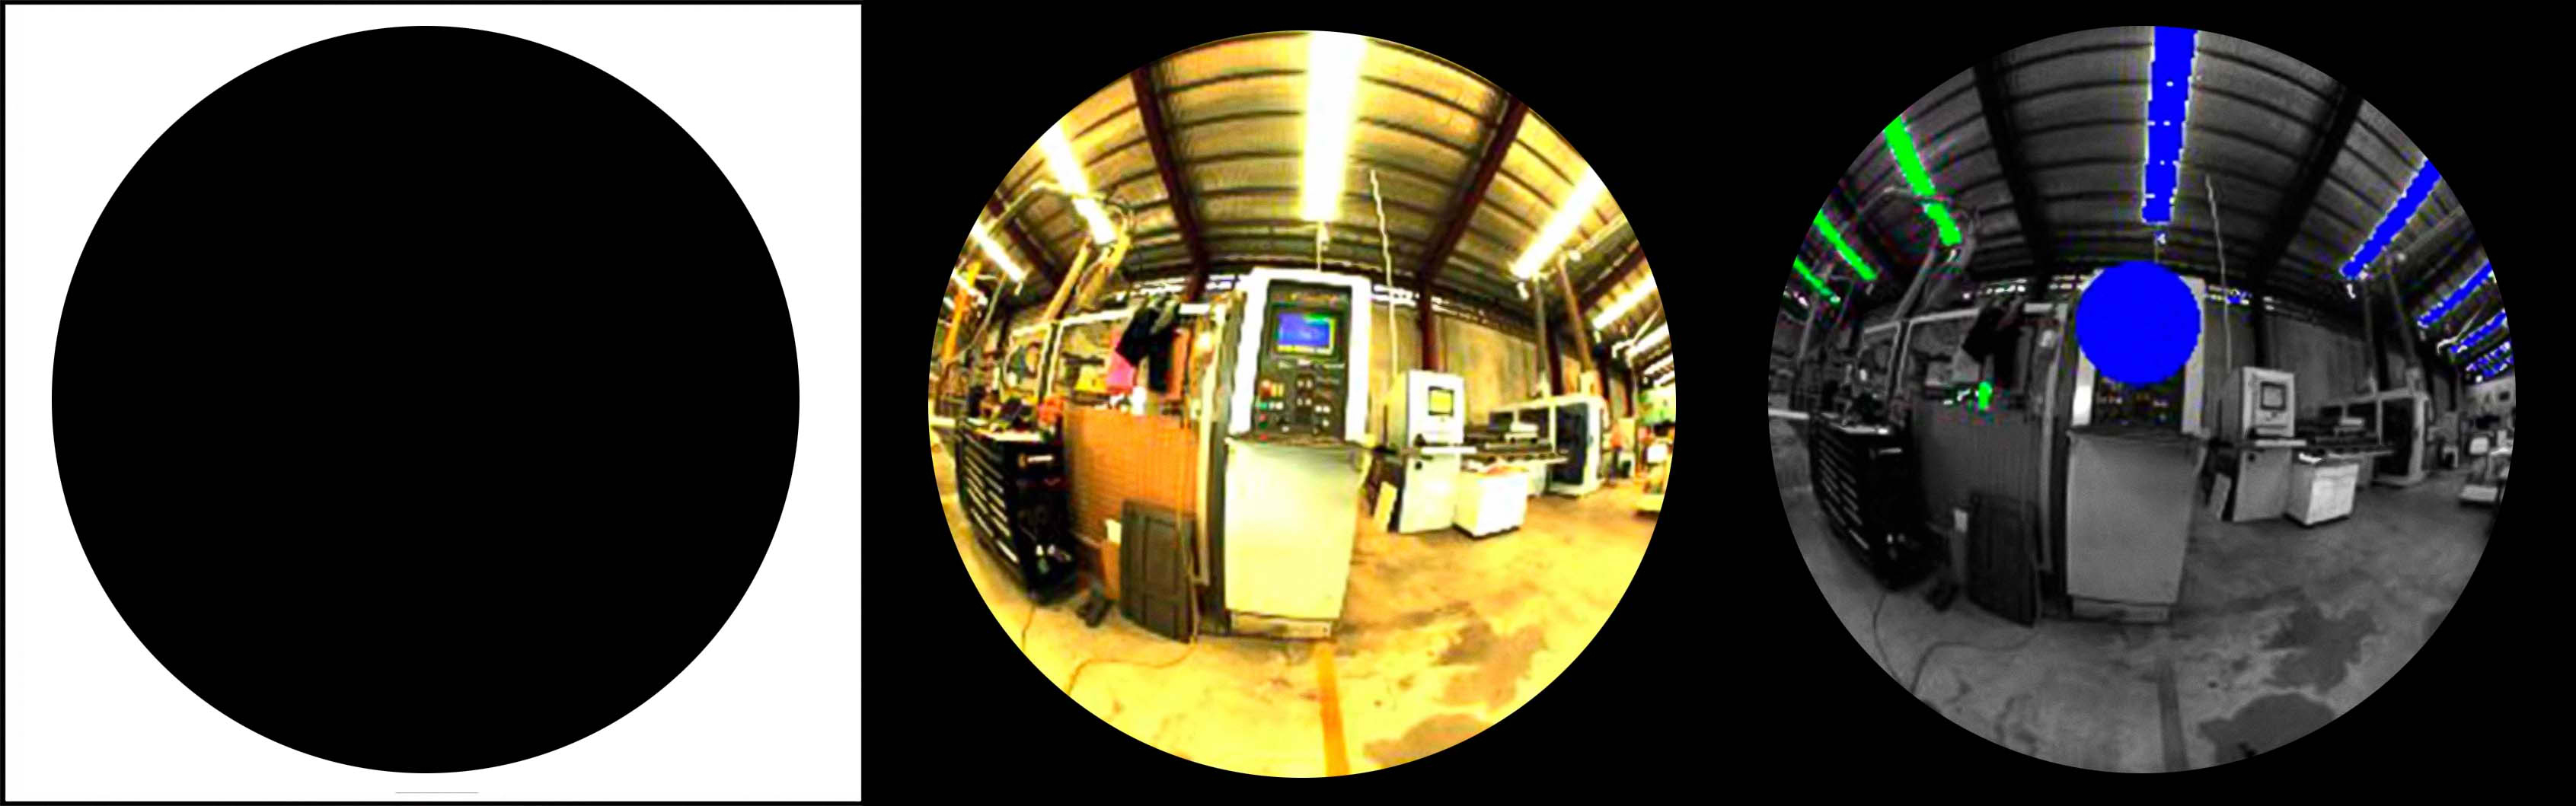
Fig. 4. Post-processing of each HDR image that was calibrated on-site and recalibrated again in Evalglare to calculate the DGI and obtain general outputs of the average Lb and the average Ls for analysis.
3. Results
Overall, there was a distinct difference between the participants who worked in the fabrication and production area (natural lighting), and the participants who worked in the painting and detailing area (electrical lighting and natural lighting). All participants who worked under electrical and natural lighting (painting and detailing area) reported that they were undisturbed by daylighting, which was in contrast to all the participants working under only natural lighting; who reported different responses from daylighting being overall ‘unevenly lit’, ‘bright’, or ‘dark’ (Table 3).
Table 3
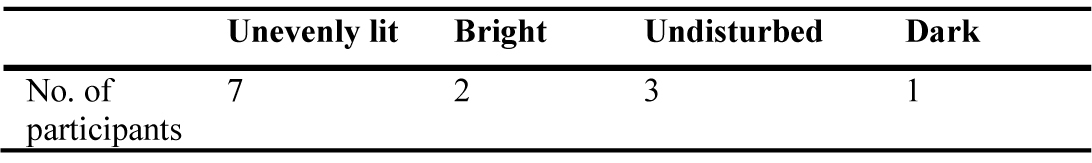
Table 3. Results from questionnaires: participant responses to overall daylight quality. Majority of participants working in the fabrication and production space report daylight quality as uneven and bright.
However, the responses to daylighting during morning, midday, and afternoon was notably different to the overall responses to daylighting. There was a consistent pattern of responses of being ‘undisturbed’ by daylighting from some participants who worked in the fabrication and production area (this includes the participants working in the painting and detailing area also who reported as being ‘undisturbed’ during the morning, midday and afternoon). For morning reports, most participants had impressions of daylighting as being either ‘dark/too dark’ or bright (Table 4). The responses then shifted in the afternoon, where most participants had impressions of daylighting as being ‘bright’ (Table 5). This again changed for afternoon reports, where a few participants reported daylighting as being ‘bright’ and ‘dark/too dark’, leaving the majority reporting as being ‘undisturbed’ (Table 6).
Table 4
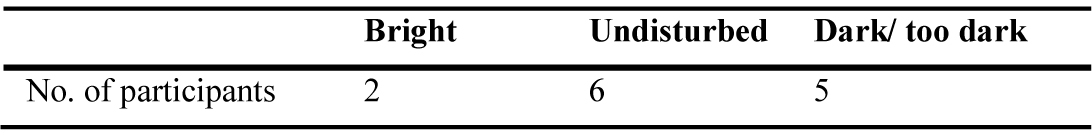
Table 4. Results from questionnaires: varied participant responses to morning daylight quality. Consistent response from participants who work in the painting and detailing area where electrical and natural lighting was present.
Table 5
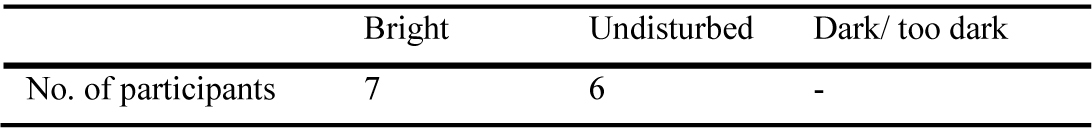
Table 5. Results from questionnaire: responses to midday daylight quality. Majority of participants reported visual comfort during midday as ‘bright’. Participants working in the painting and detailing area were consistent to their responses in the morning as being ‘undisturbed’.
Table 6

Table 6. Results from questionnaire: participant responses to afternoon daylight quality. Majority of the participants reported being ‘undisturbed’ while a few reported it being ‘bright’ or ‘dark/too dark’.
The second assessment (interviews at workstations) asked about two different features of the work environment. This included mapping out the location of each of their workstation to find patterns and relationships. During this time, 4 additional participants were working on this day and participated in the interview. The results in Table 7 describe participant’s preferences for lighting type and the importance for having a window in close proximity to their workstations. Almost all participants preferred to have both electrical and natural lighting present in their workspace. Regarding participant attitudes towards the importance of windows, the majority of participants have stated that having windows in proximity to their workstation and in line of sight was either ‘very important’ or ‘moderately important’, while only two participants have said that windows are ‘not important’ (Participants 13 and 5).
Table 7
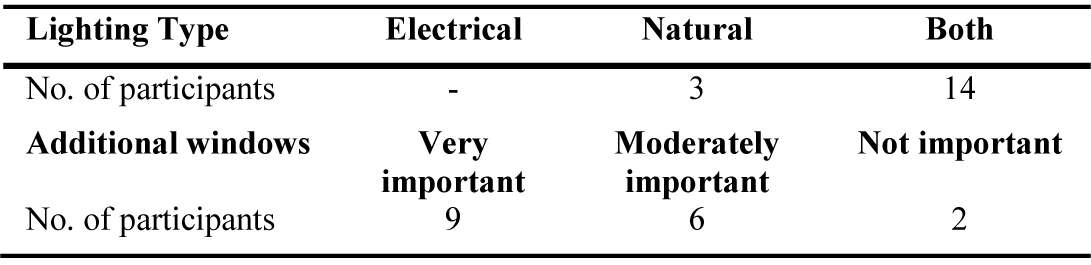
Table 7. Results from questionnaire: preferences for lighting type and importance of windows. The majority of participants preferred both electrical and natural lighting. This was consistent with desiring additional electrical lighting shown in Table 8. The majority of participants state that windows were an important feature of their work environment.
Table 8
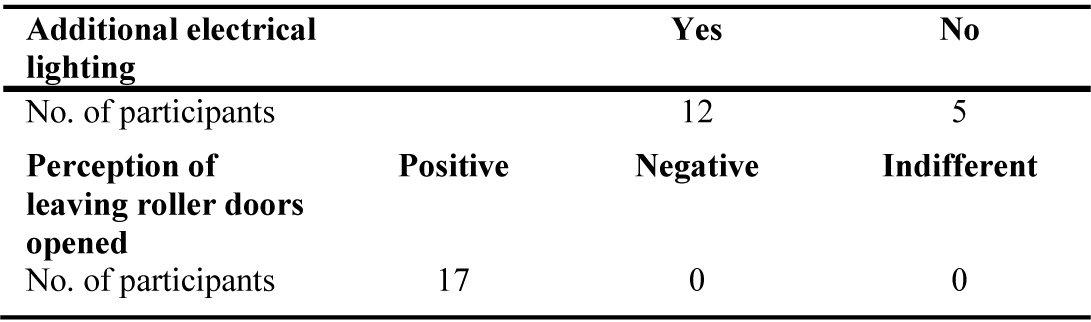
Table 8. All participants with computer workstations preferred to have additional electrical lighting to control light settings to adjust visibility and all participants had a positive perception of leaving the three large roller doors opened during work hours.
Additional questions were asked to whether participants would desire additional electrical lightings at their workstations to control light settings to adjust visibility and, whether they had a positive or negative perception towards leaving the three large roller doors opened during work hours. The results are shown in Table 8. All participants with computer workstations preferred additional electrical lighting at their workstation to control light settings to adjust visibility. Participants with bench-top workstations all stated that they did not require additional electrical lighting. Overall, all participants had a positive perception of leaving the large roller doors opened during work hours rather than leaving it shut in order to “…get a direct view of the sky” (Participant 10).
The next part of the analysis was to examine participant responses (regarding features of their work environment), to their location and workstation orientation (Fig. 5). Generally, participants who had preference for both electrical and natural lighting had workstations with different orientations; where some workstations would be facing a large roller door front on, side-on, or facing away (facing the East wall with no openings). There were only three participants who preferred natural lighting, two had workstations where natural and electrical lighting was present (Participant 1 and 12), while one participant who worked where only natural lighting was present, had two workstations: one was facing the East-wall (with no openings) and the other was facing front-on a large roller door (Participant 6 at workstations W5 and C9).
Figure 5

Fig. 5. The majority of the participants viewed windows as either ‘very important’ or ‘moderately important’ feature of their work space. Almost all participants preferred to have both electrical and natural lighting present, while only a few preferred to work under natural lighting (two working in the painting and detailing area, and one working in the fabrication and production area).
Participants who have stated that windows were either ‘very important’ or ‘moderately important’, had workstations facing various orientations to the three large roller doors. The only participant working under natural lighting who stated that windows were ‘not important’ had only two workstations which was facing only in the direction of two of the large roller doors (workstation C5 and C6). The other participant (Participant 13) who stated that windows were ‘not important’, worked under electrical and natural lighting in the painting and detailing area (workstation W8).
As shown in Fig. 6, participants who had workstations with computers desired additional electrical lighting. For instance, Participant 10 had various workstations some with computers and others with only bench-top workstations (workstations W2, W6, C1, C2, C9, C10, C11, and 12), when asked if this participant required additional lighting at workstations W2 and W6, the participant stated that these workstations required no additional electrical lighting. These two workstations were both positioned in clear view of roller door 1. This was the same for Participant 3 and 9 who both shared the same workstations, who stated that at workstations C1 and C2 additional electrical lighting was desired however, no additional electrical lighting was required at workstation W7. Overall, all participants no matter where their workstations were located, had a positive perception towards leaving the three large roller doors opened during work hours.
Figure 6
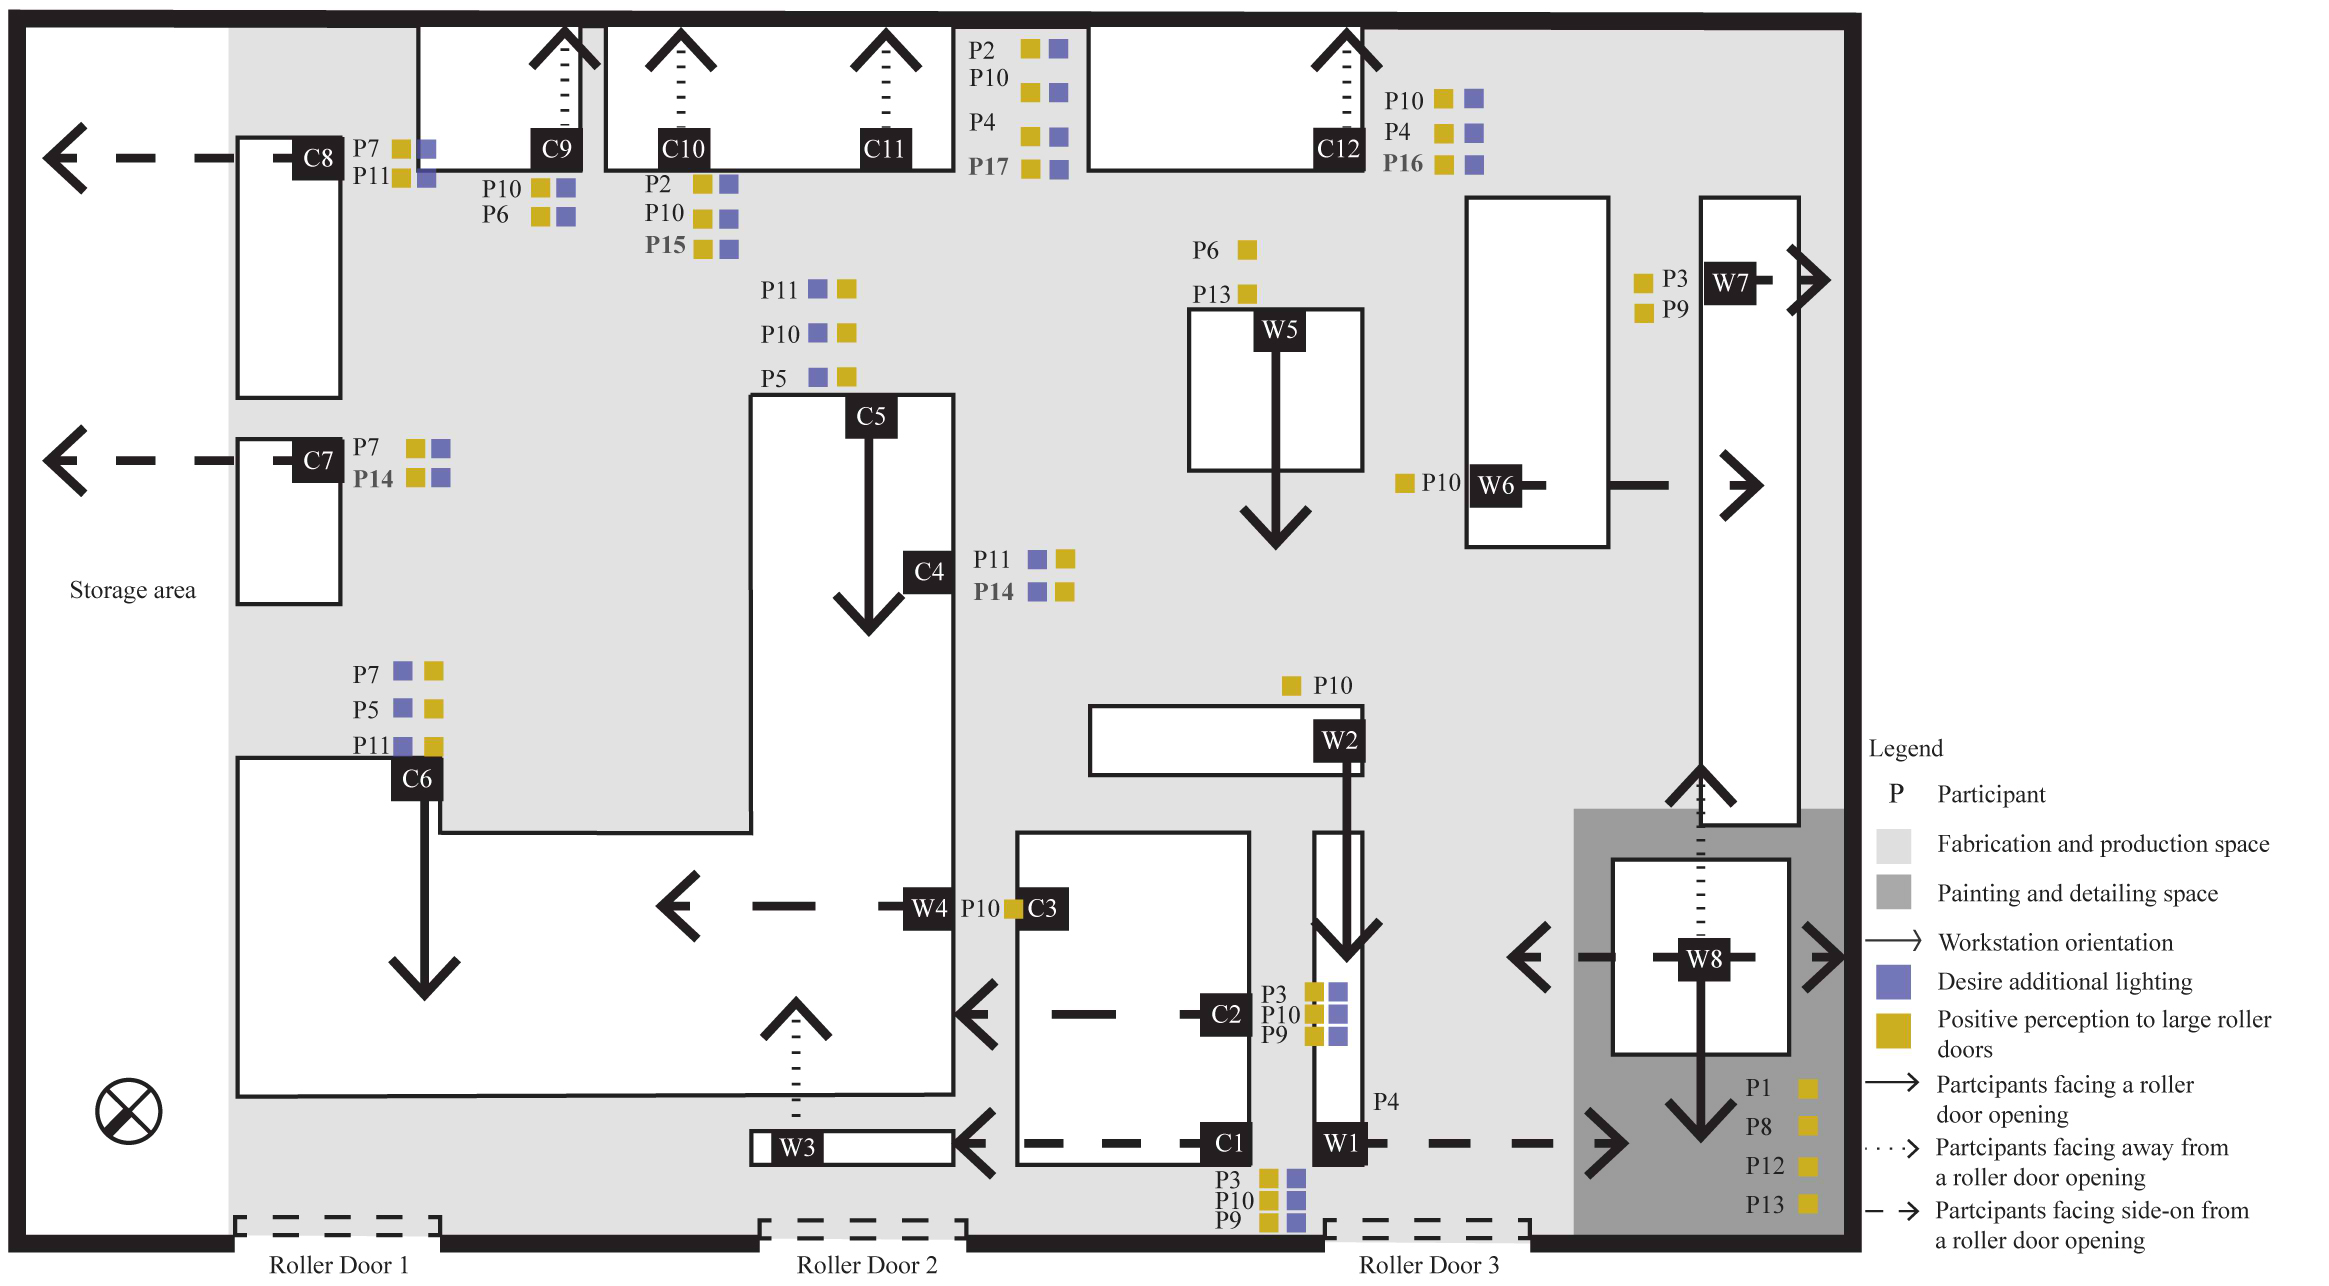
Fig. 6. Generally, all participants no matter where they were located had a positive perception to leaving the three large roller doors opened and all participants with computer workstations have stated additional electrical lighting for visibility adjustment.
3.1 Questionnaires and observational mapping
The results of the illuminance measurements taken at each workstations are presented in Table 3. These measurements were used to relate the levels of illuminance achieved at each workstation throughout the day. Although there were intermittent clouds, clear sky conditions were mostly present. This reflected the varying fluctuations of illuminance ( that ranged as low as 164 lx to as high as 69600 lx.
The varying fluctuation of illuminances indicated that some workstations would experience direct sunlight. The spatial uniformity was calculated across all workstations in the fabrication and production space (only natural lighting was present) based on the minimum to average illuminance. Low illuminance uniformity of 0.1 was found at 9:00 am, 11:00 am, 2:00 pm and 3:00 pm and high illuminance uniformity of 0.5 was found at 12:00 pm and 1:00 pm. The external illuminance was also recorded during this time (Table 9), which reflected the CIE intermediate sky definition of hazy variant clear sky conditions.
Table 9
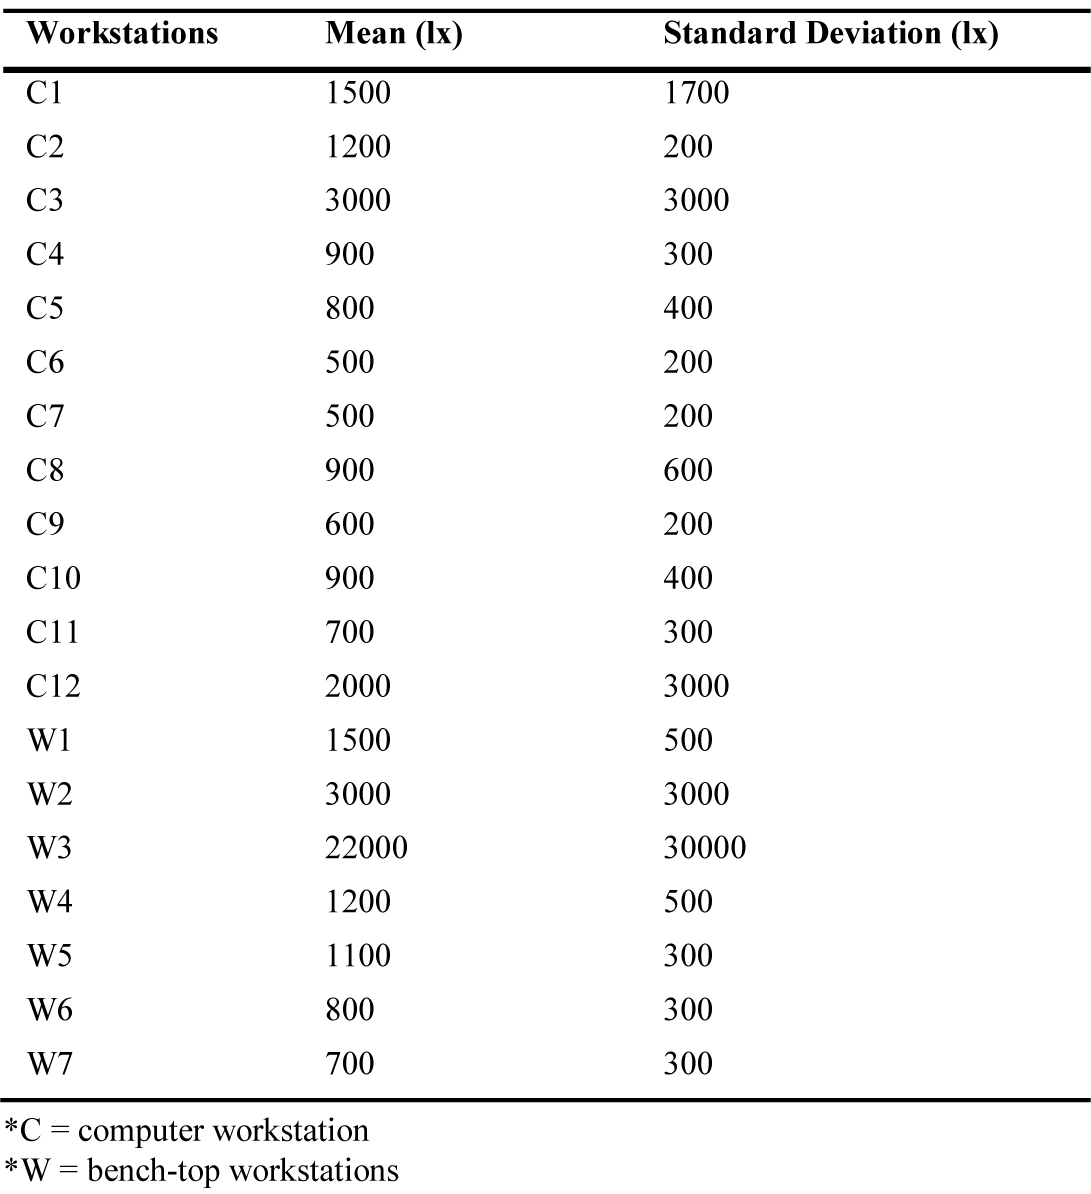
Table 9. Illuminance measurements taken of each workstation at work plane level, the mean and standard deviation reflect the varying fluctuations of illuminance within the fabrication and production area, indicating that on intermediate sky conditions, uniformity is not achieved.
These measurements were then used to examine the relationship between levels of illuminance at each workstation and the participants who had multiple workstations (Table 10). The results indicate that the participants with multiple workstations would experience levels of illuminance when switching from one workstation to another (changing time was observed to be around 5-15 minutes). In one instance, Participant 7 worked at three workstations (C6, C7, and C8) where illuminance would range from 164 lx to 2178 lx at 11 am. This indicated a factor of 13x difference between experiencing the brightest and dimmest levels of illuminance. Similar situations occurred for Participant 6 (195 lx to 1366 lx), Participant 9 (248 lx to 1196 lx at 11:00 am), Participant 11 (164 lx to 2178 lx) and Participant 11 (195 lx to 5761 lx). It seemed that the greatest contrast in illuminance levels for all these participants was at 11:00 am. As shown in Fig. 7, the observational mapping illustrates the intervals of switching over to each workstation and the illuminance levels experienced by the participants when switching over. All of these participants have reported daylighting to be overall ‘unevenly lit’ with only Participant 10 reporting daylighting to be overall ‘bright’.
Table 10
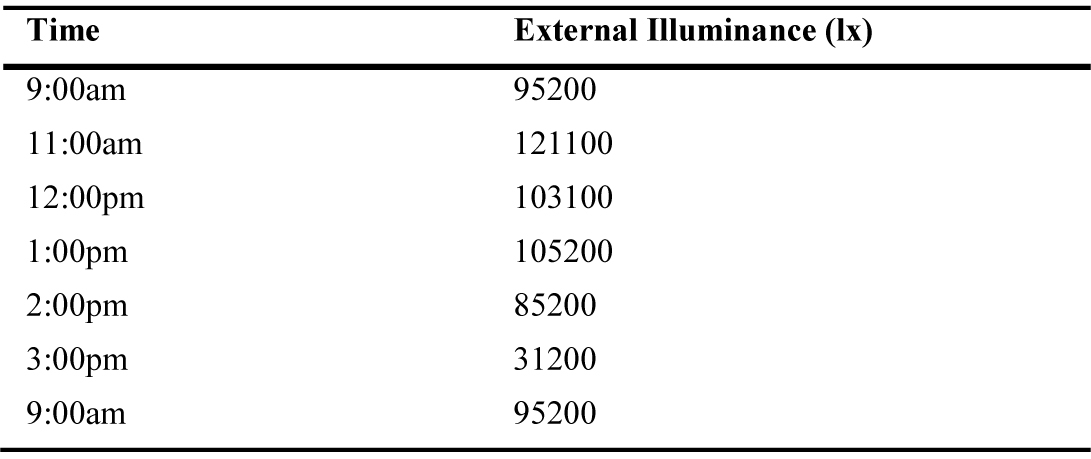
Table 10. Outdoor Illuminance measured at each hour reflecting a typical CIE intermediate sky condition of hazy variant to clear sky conditions.
Figure 7
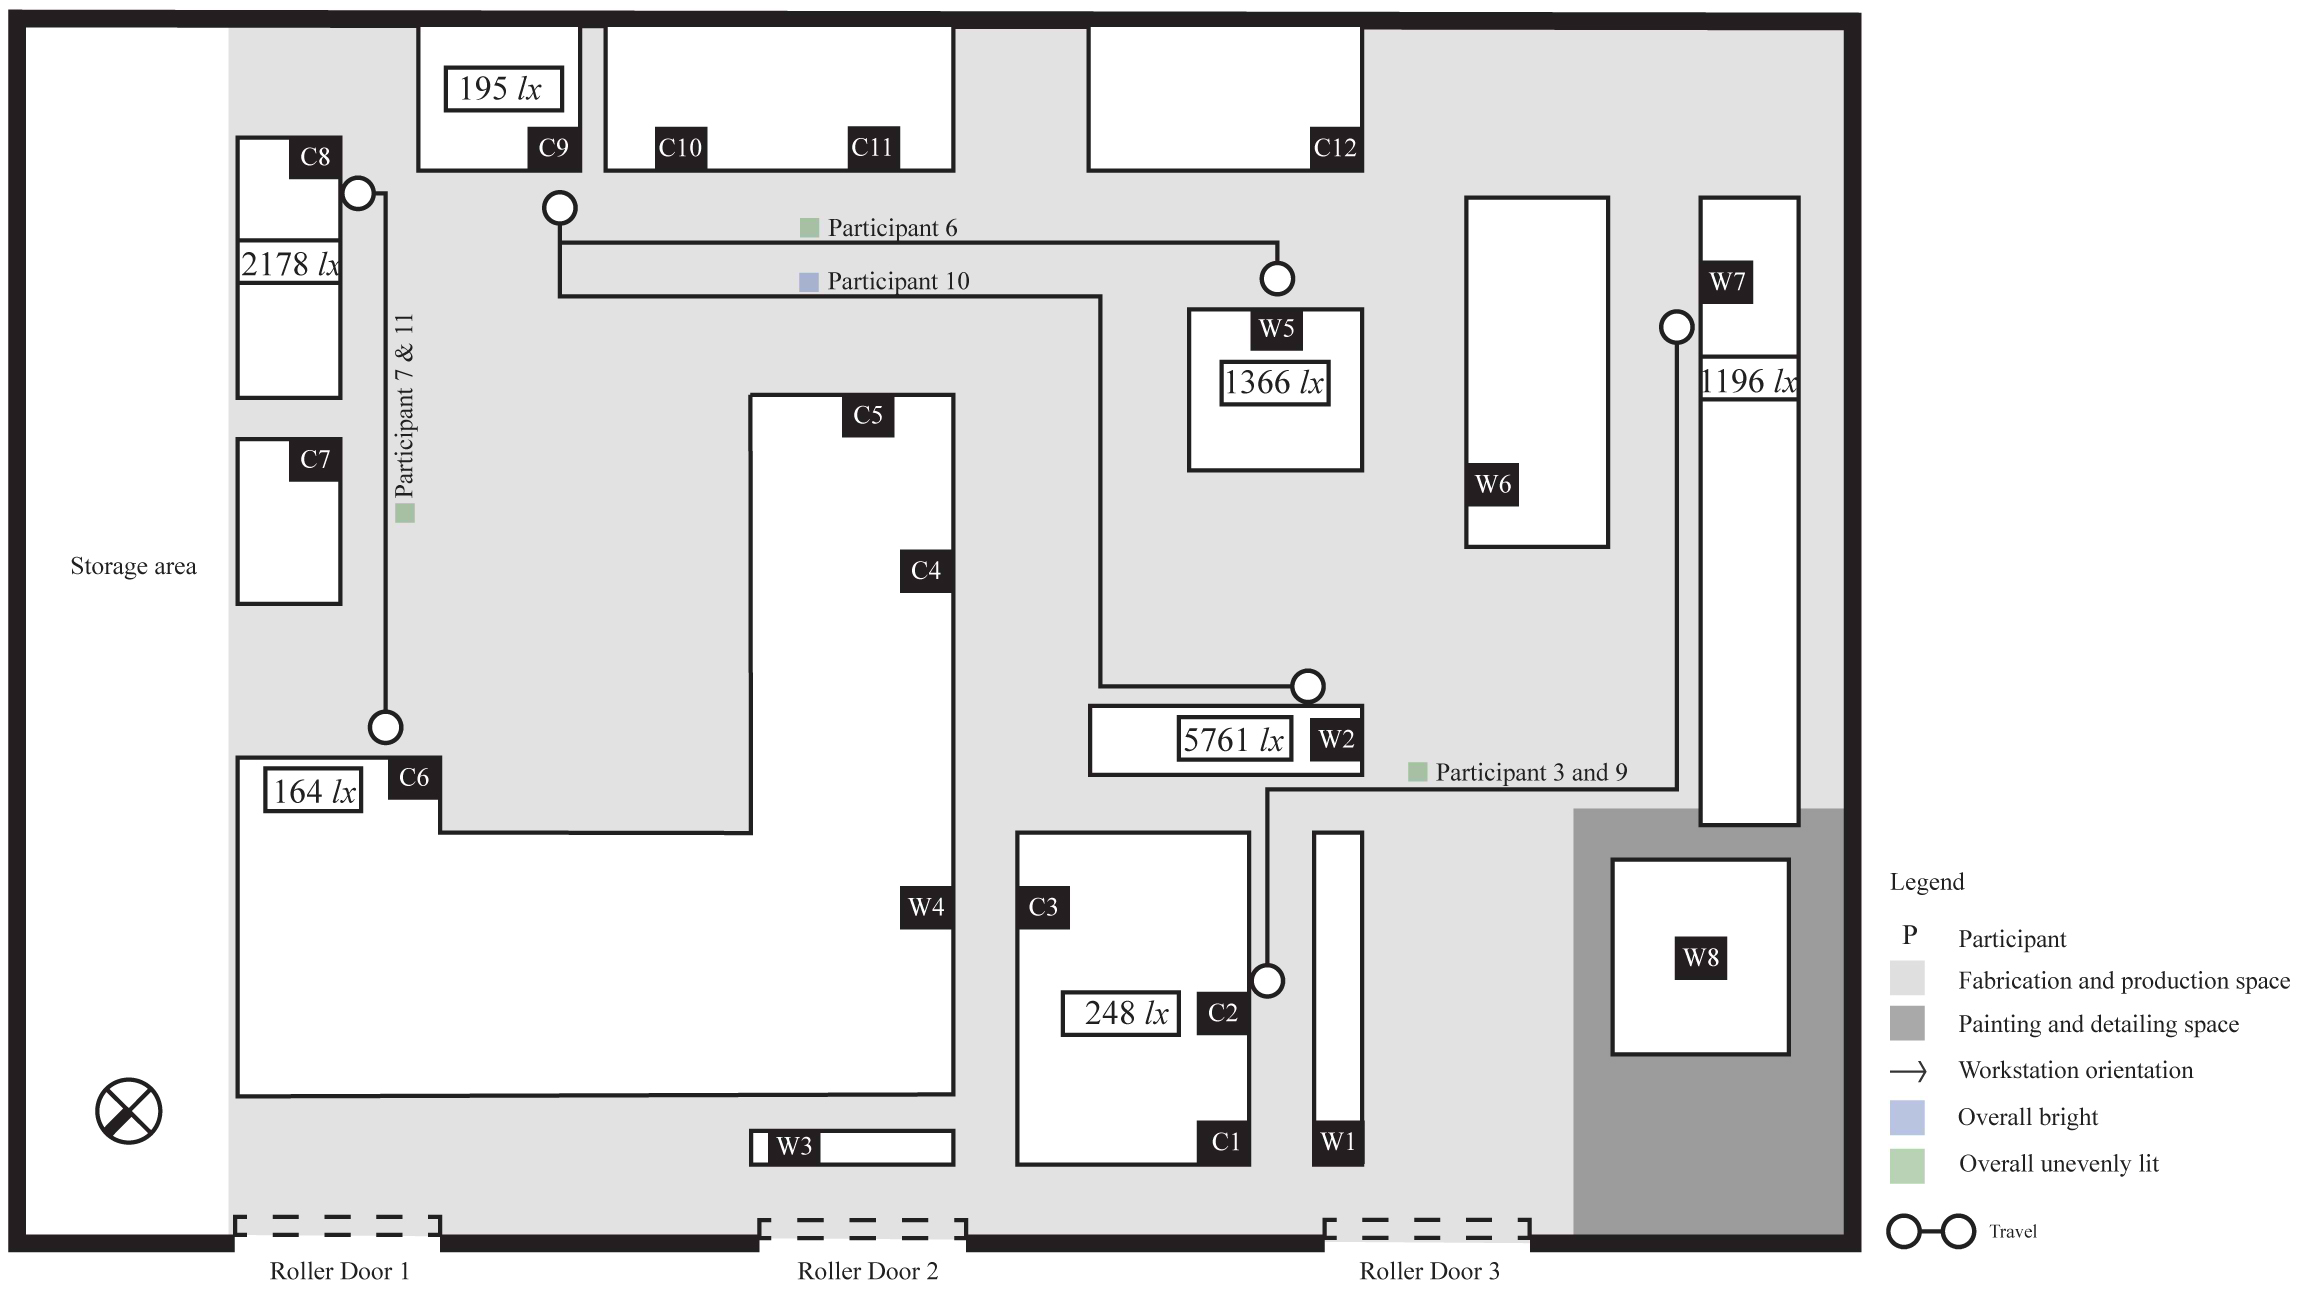
Fig. 7. Participants with multiple workstations who would experience high contrast of illuminance levels.
The results of the DGI are shown in Table 11. These results were used to explore the type of luminous environment that were surrounding each workstation in order to relate back to each participant responses to their overall visual comfort to daylighting. However, it is important to note that due to the work type being transient, the HDR photographs were taken under strict instructions to not obstruct work flow and production. As such, it was agreed that photographs were to be only taken at 10:00 am, 12:00 pm, and 3:00 pm. Due to this, workstations that were excluded from the analysis were workstations W1, W2, W3, W5, and W6; since participants created an obstructed view of these workstations. The results are shown in Table 12.
Table 11
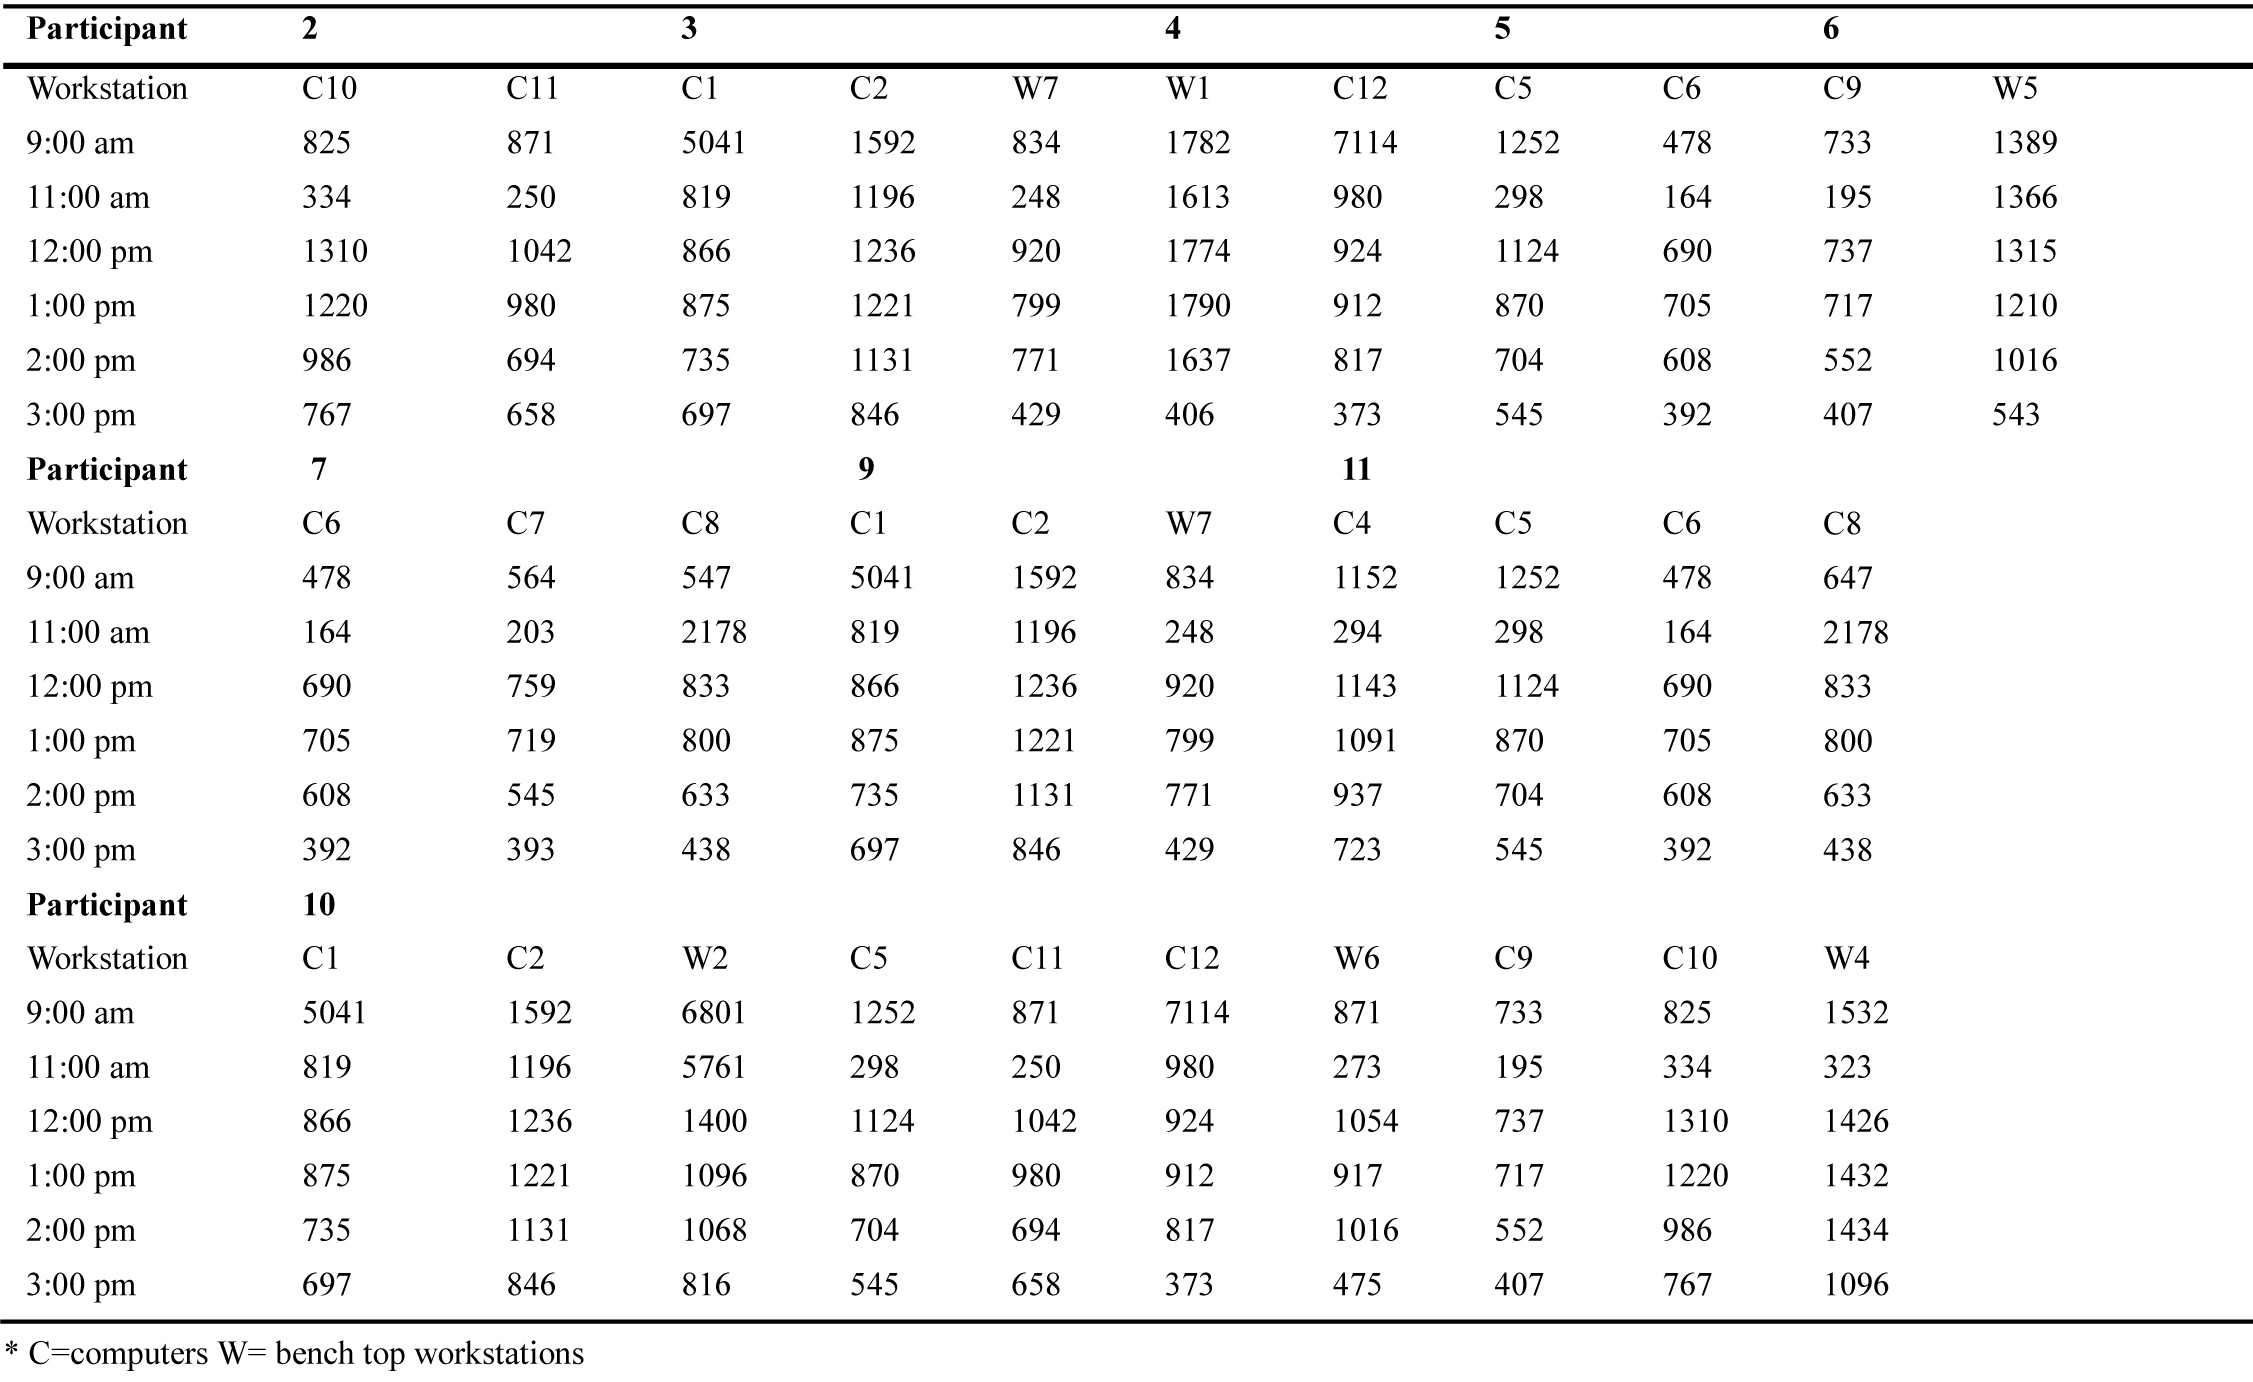
Table 11. Participants with multiple workstations in the fabrication and production space who have reported daylighting as uneven or bright. All values reported in lux. Bolded numbers indicate the high contrast of illuminance for each participant when travelling to different workstations.
Table 12
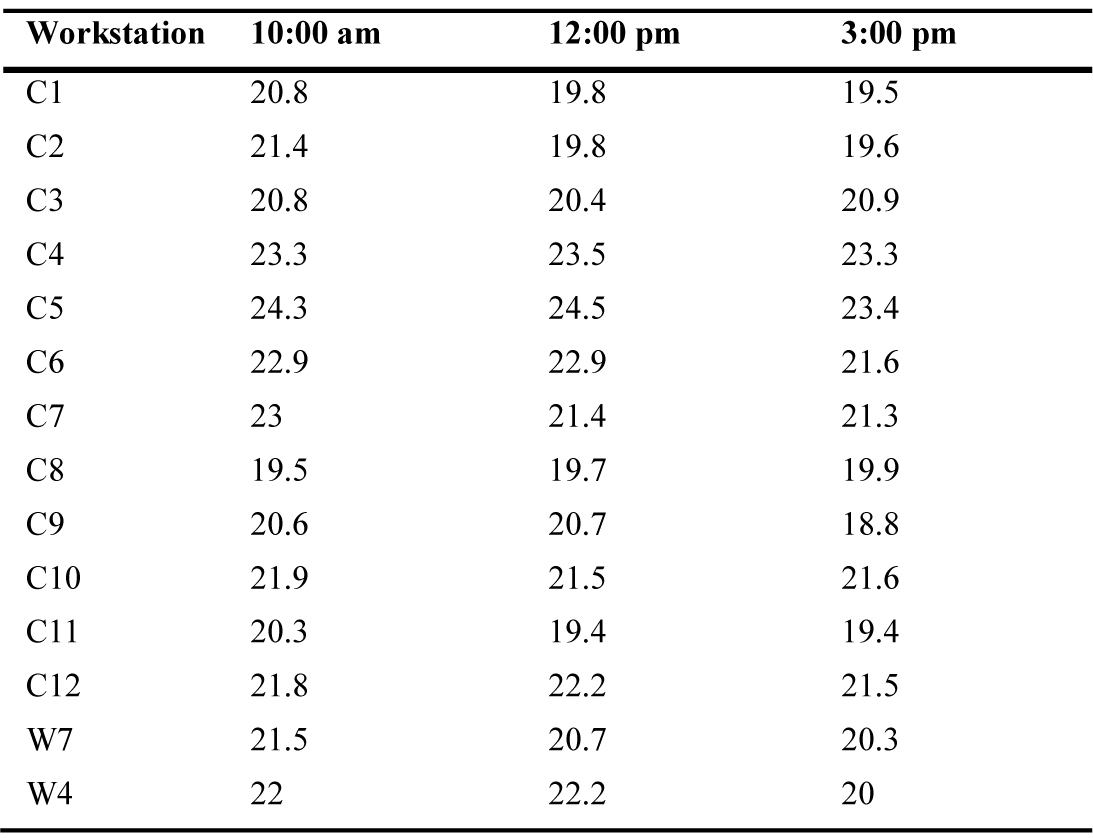
Table 12. DGI results provided by the general outputs in Evalglare predicting ‘acceptable’ to ‘just uncomfortable’ scenes.
The DGI shows that the values generally ranged above 19 (noticeable to just acceptable) to > 26 (uncomfortable) across all workstations. These values were used to measure potential glare scenes with the DGI glare rating scale in Table 13. The workstation where the DGI detected a disturbing scene was C5, which was located and orientated to face one of the three large roller doors. In comparison to a similar workstation with the same orientation as C5 was workstation C6, which had slightly lower values ranging of 22 (acceptable). However, upon observing these two workstations, it seemed that workstation C6 had more overhead obstructions surrounding its workstation, which could potentially have affected the DGI results as shown in Fig. 8.
Table 13
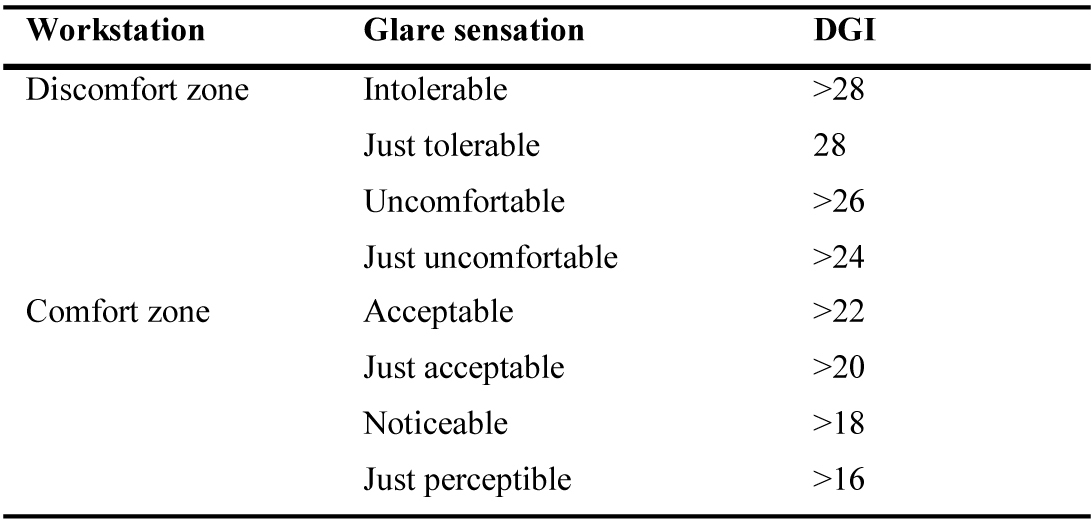
Table 13. DGI glare rating scale.
Figure 8
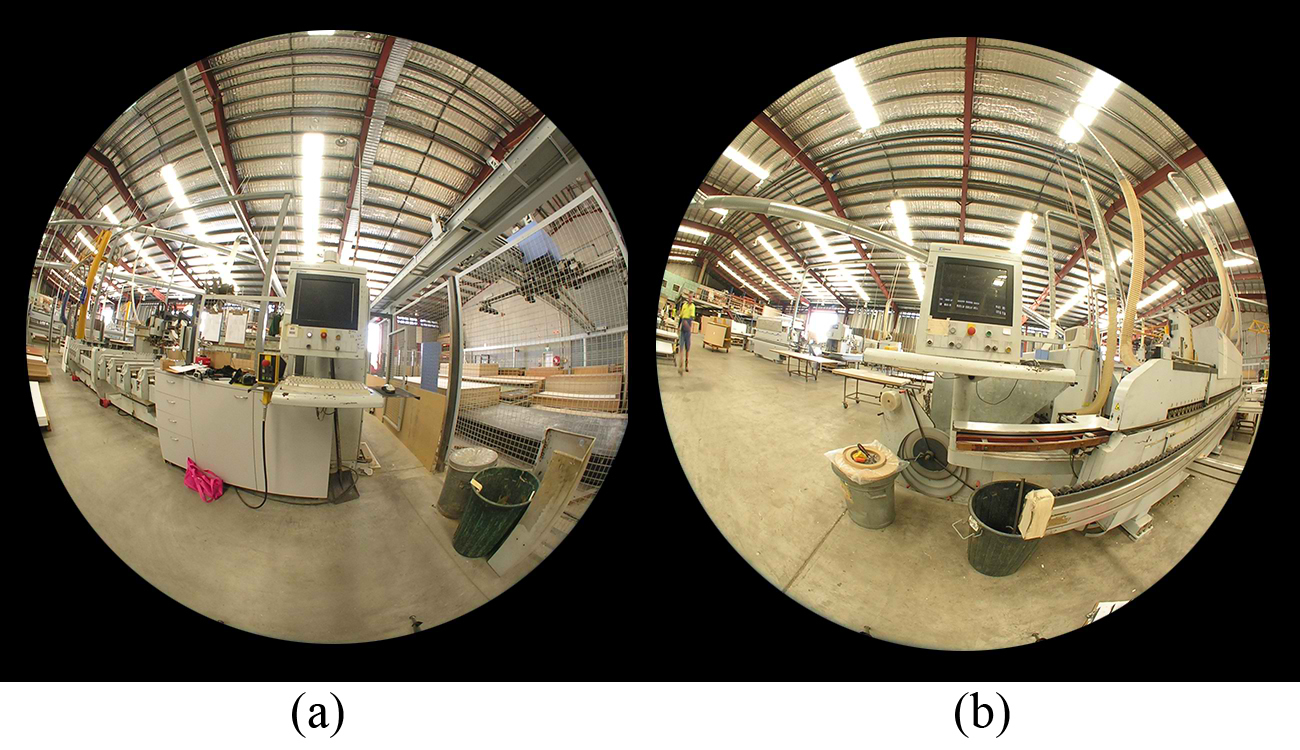
Fig. 8. (a) Workstation C5 with higher DGI results compared to (b) workstation C6. This could be due to the amount of overhead obstructions, which could have affected the DGI results.
However, the participant’s responses to visual comfort in the morning, midday, and afternoon was different to the results of the DGI. Where the DGI predicted a disturbing scene at workstation C5, Participant P11 and P10 generally reported that they perceived daylighting to be either ‘too dark’ (Participant 10) or ‘dark’ (Participant 11) (Fig. 9). This workstation was also orientated to face directly in front of roller door 2. Further, Participant 6 and Participant 4 perceived daylighting to be ‘bright’ which was different to Participant 10 who shared the same workstations with each of these participants where all three workstations faced away from the three large roller doors.
Figure 9
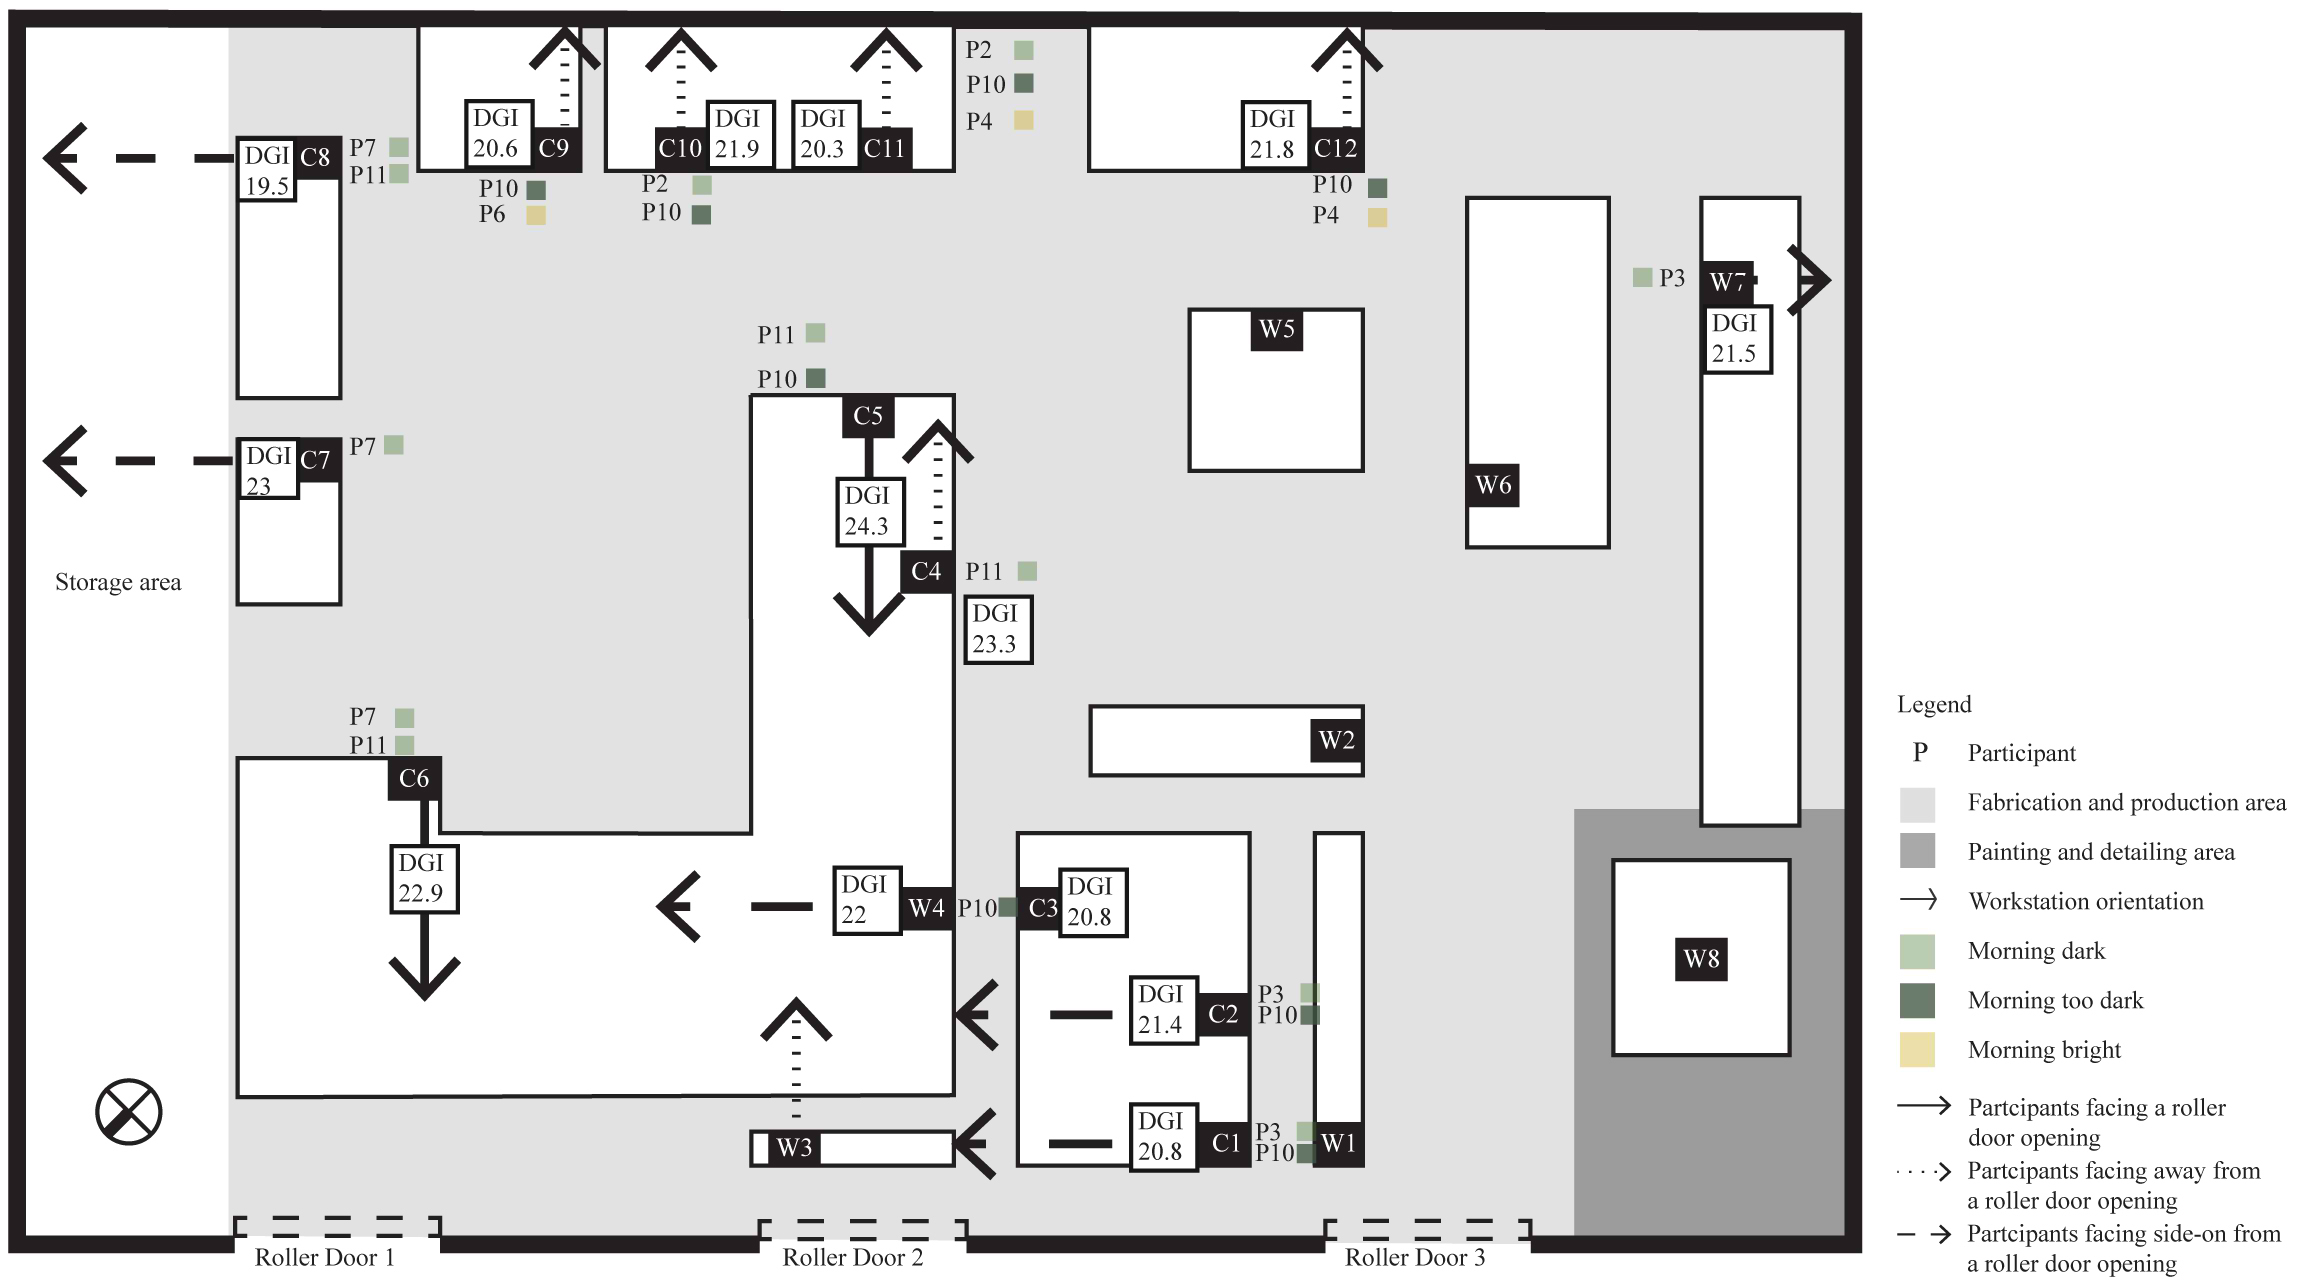
Fig. 9. Participant’s responses to morning daylight and comparisons to the results of the DGI.
In comparison, the majority of the participants reported midday afternoon as ‘bright’ which seemed to relate back to the results of the DGI calculating daylighting to being acceptable to uncomfortable (Fig. 10). This was the case for Participants 3, 9, and 10 who had the same responses and shared the same workstations, which was the case for Participants 5, 7, and 11 and participants 5, 10, and 11. However, Participants 4 and 6 had different responses (bright) to Participant 10 where they reported midday daylighting as bring ‘undisturbed’. The comparisons to the DGI results to reports to afternoon daylighting were similar to the morning analysis (Fig. 11). The DGI consistently showed acceptable to just uncomfortable glare at each workstation, which seemed to relate to with the responses for Participants 5, 6, and 9 who perceived daylighting to be ‘dark’ with the DGI fell marginally lower compared to the DGI values in the morning. Only three participants (Participants 4, 10, and 11) reported daylighting as being ‘bright’ with Participants 4 and 10 sharing the same workstations at C11 and C12. The majority of the participants have reported that they were undisturbed by afternoon daylighting.
Figure 10

Fig. 10. Participant’s responses to midday daylighting and comparisons to the DGI.
Figure 11
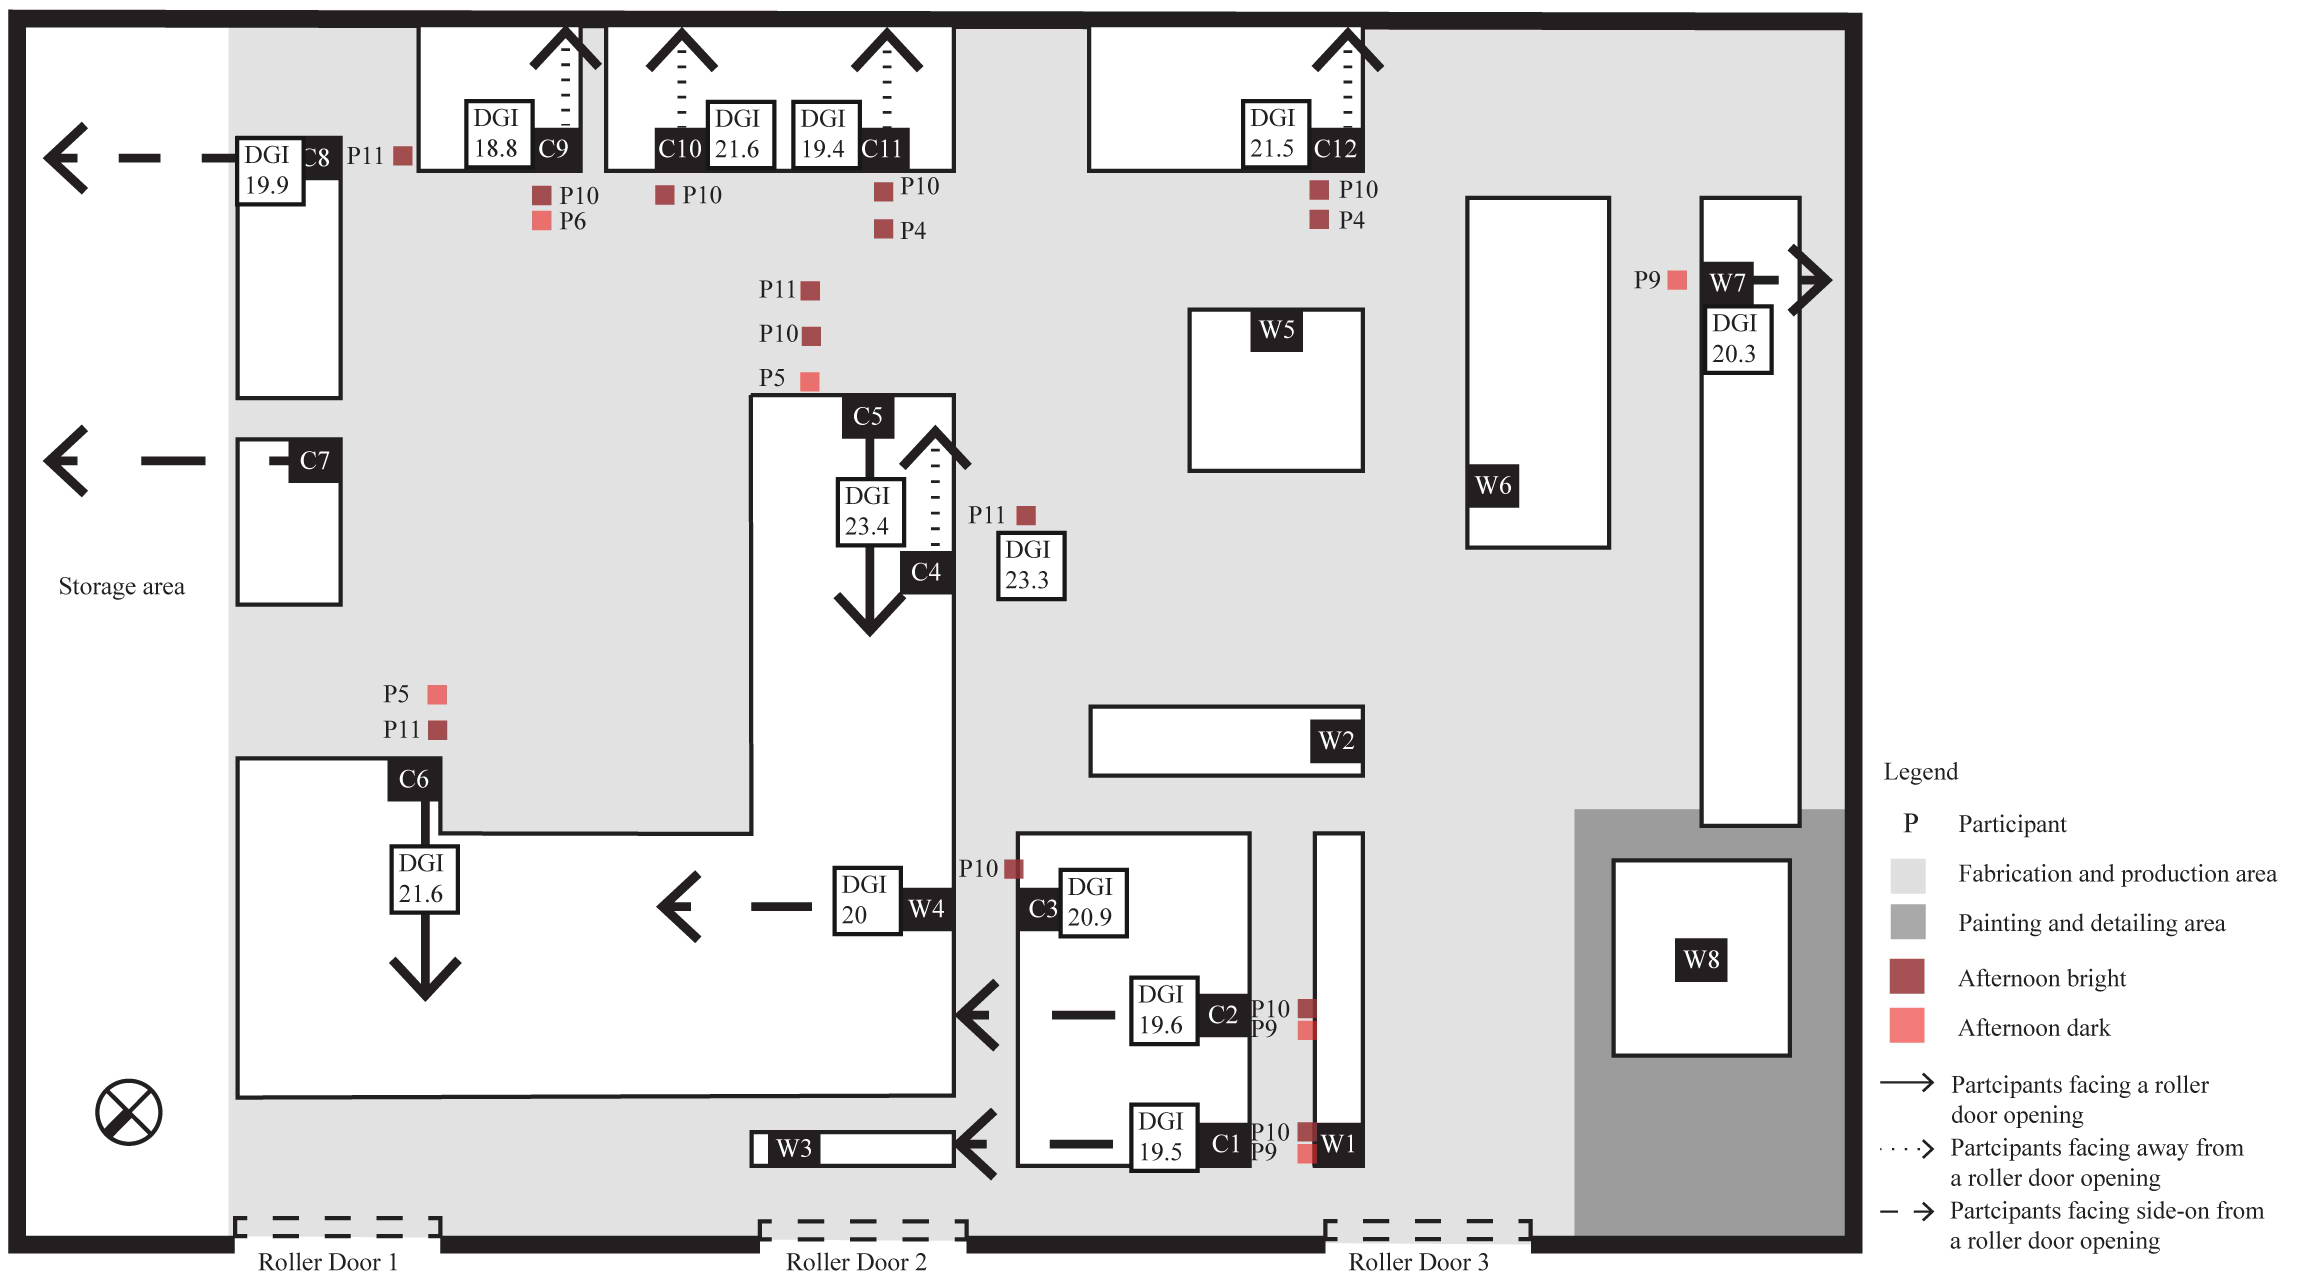
Fig. 11. Participant’s responses to midday daylighting and comparisons to the DGI.
The reports of daylighting being overall ‘unevenly’ lit may potentially indicate why responses are varied to morning, midday and afternoon. As shown in Table 12, the average background luminance, , and the glare source luminance, , illustrate luminance contrast at each of these workstations which was provided by the general outputs in Evalglare. The difference between these values were significant across all workstations where in one instance the contrast can be 253x greater than the average (Table 14). Figure 12 shows the contrast of luminance found across all workstations at different times of the day with workstations C7, C8, C9, C10, C11, and C12 having the highest luminance contrast.
Table 14
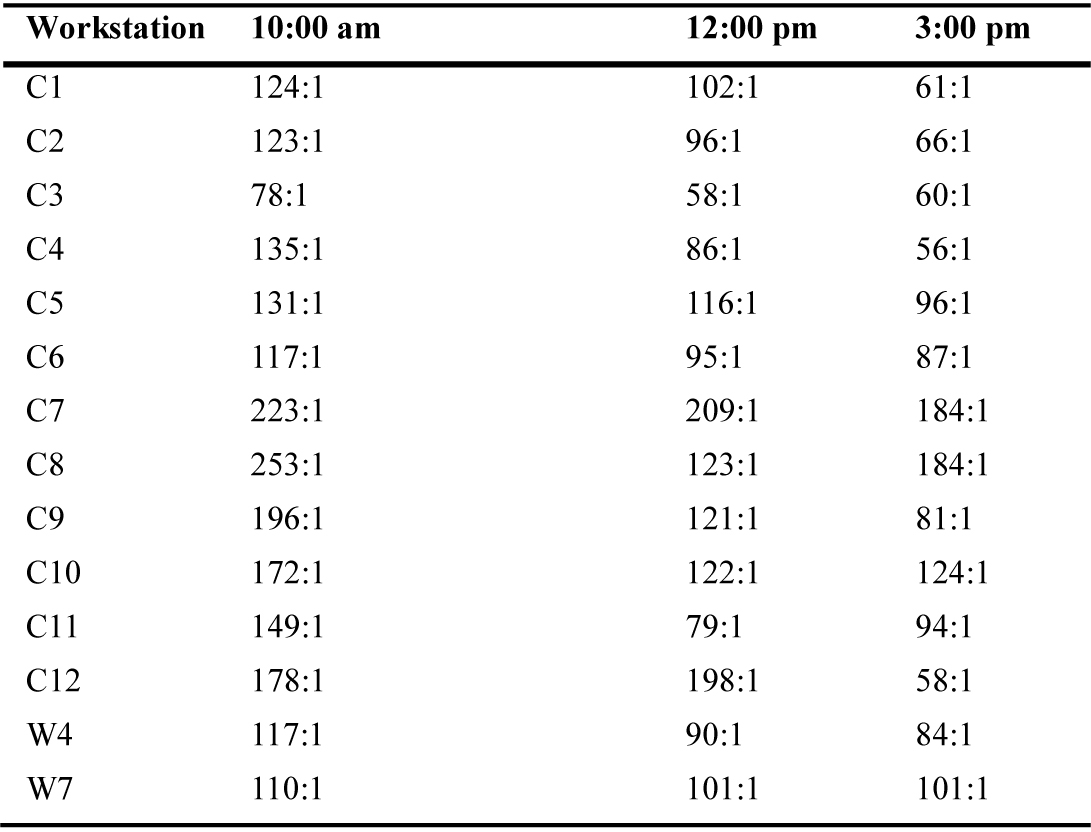
Table 14. Ratio of the average background luminance and glare source luminance at each workstation.
Figure 12
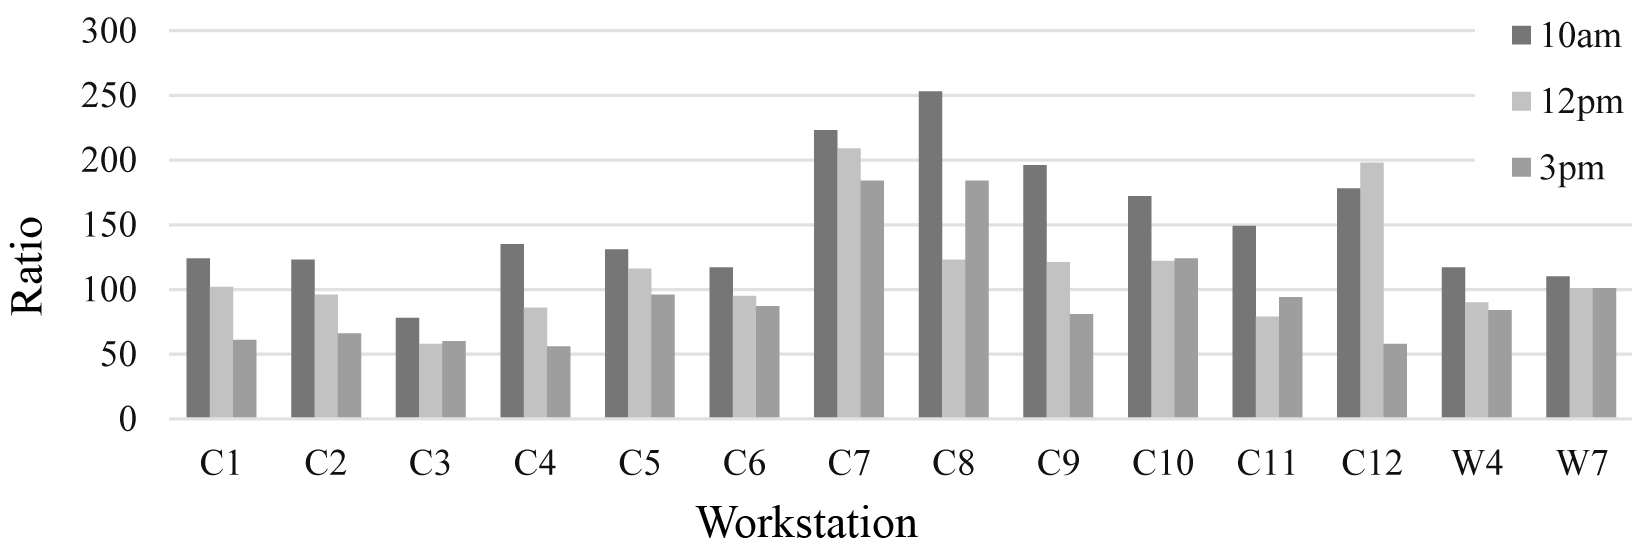
Fig. 12. Ratio between the average background luminance and average luminance of glare sources at each workstation at 10 am, 12 pm, and 3 pm.
The highest contrast ratios that were found at 10:00 am were compared to the participant responses who worked at these workstations in Table 15. The results showed that at 10:00 am these workstations were perceived to be either dark, too dark or uncomfortable by the participants. Notably, these workstations also shared similar orientations to the large roller doors, where C7 and C8 faced side-on and C9 to C12 were faced away. These results indicate that generally, the ratio between the average and the across all workstations were greater than the recommended ratios of 1:40, which would be experienced by all participants working in the fabrication and production area (Fig. 13).
Table 15
Table 15. Comparison of the average luminance ratio to participant responses at workstations with the most significant average luminance contrast.
Figure 13
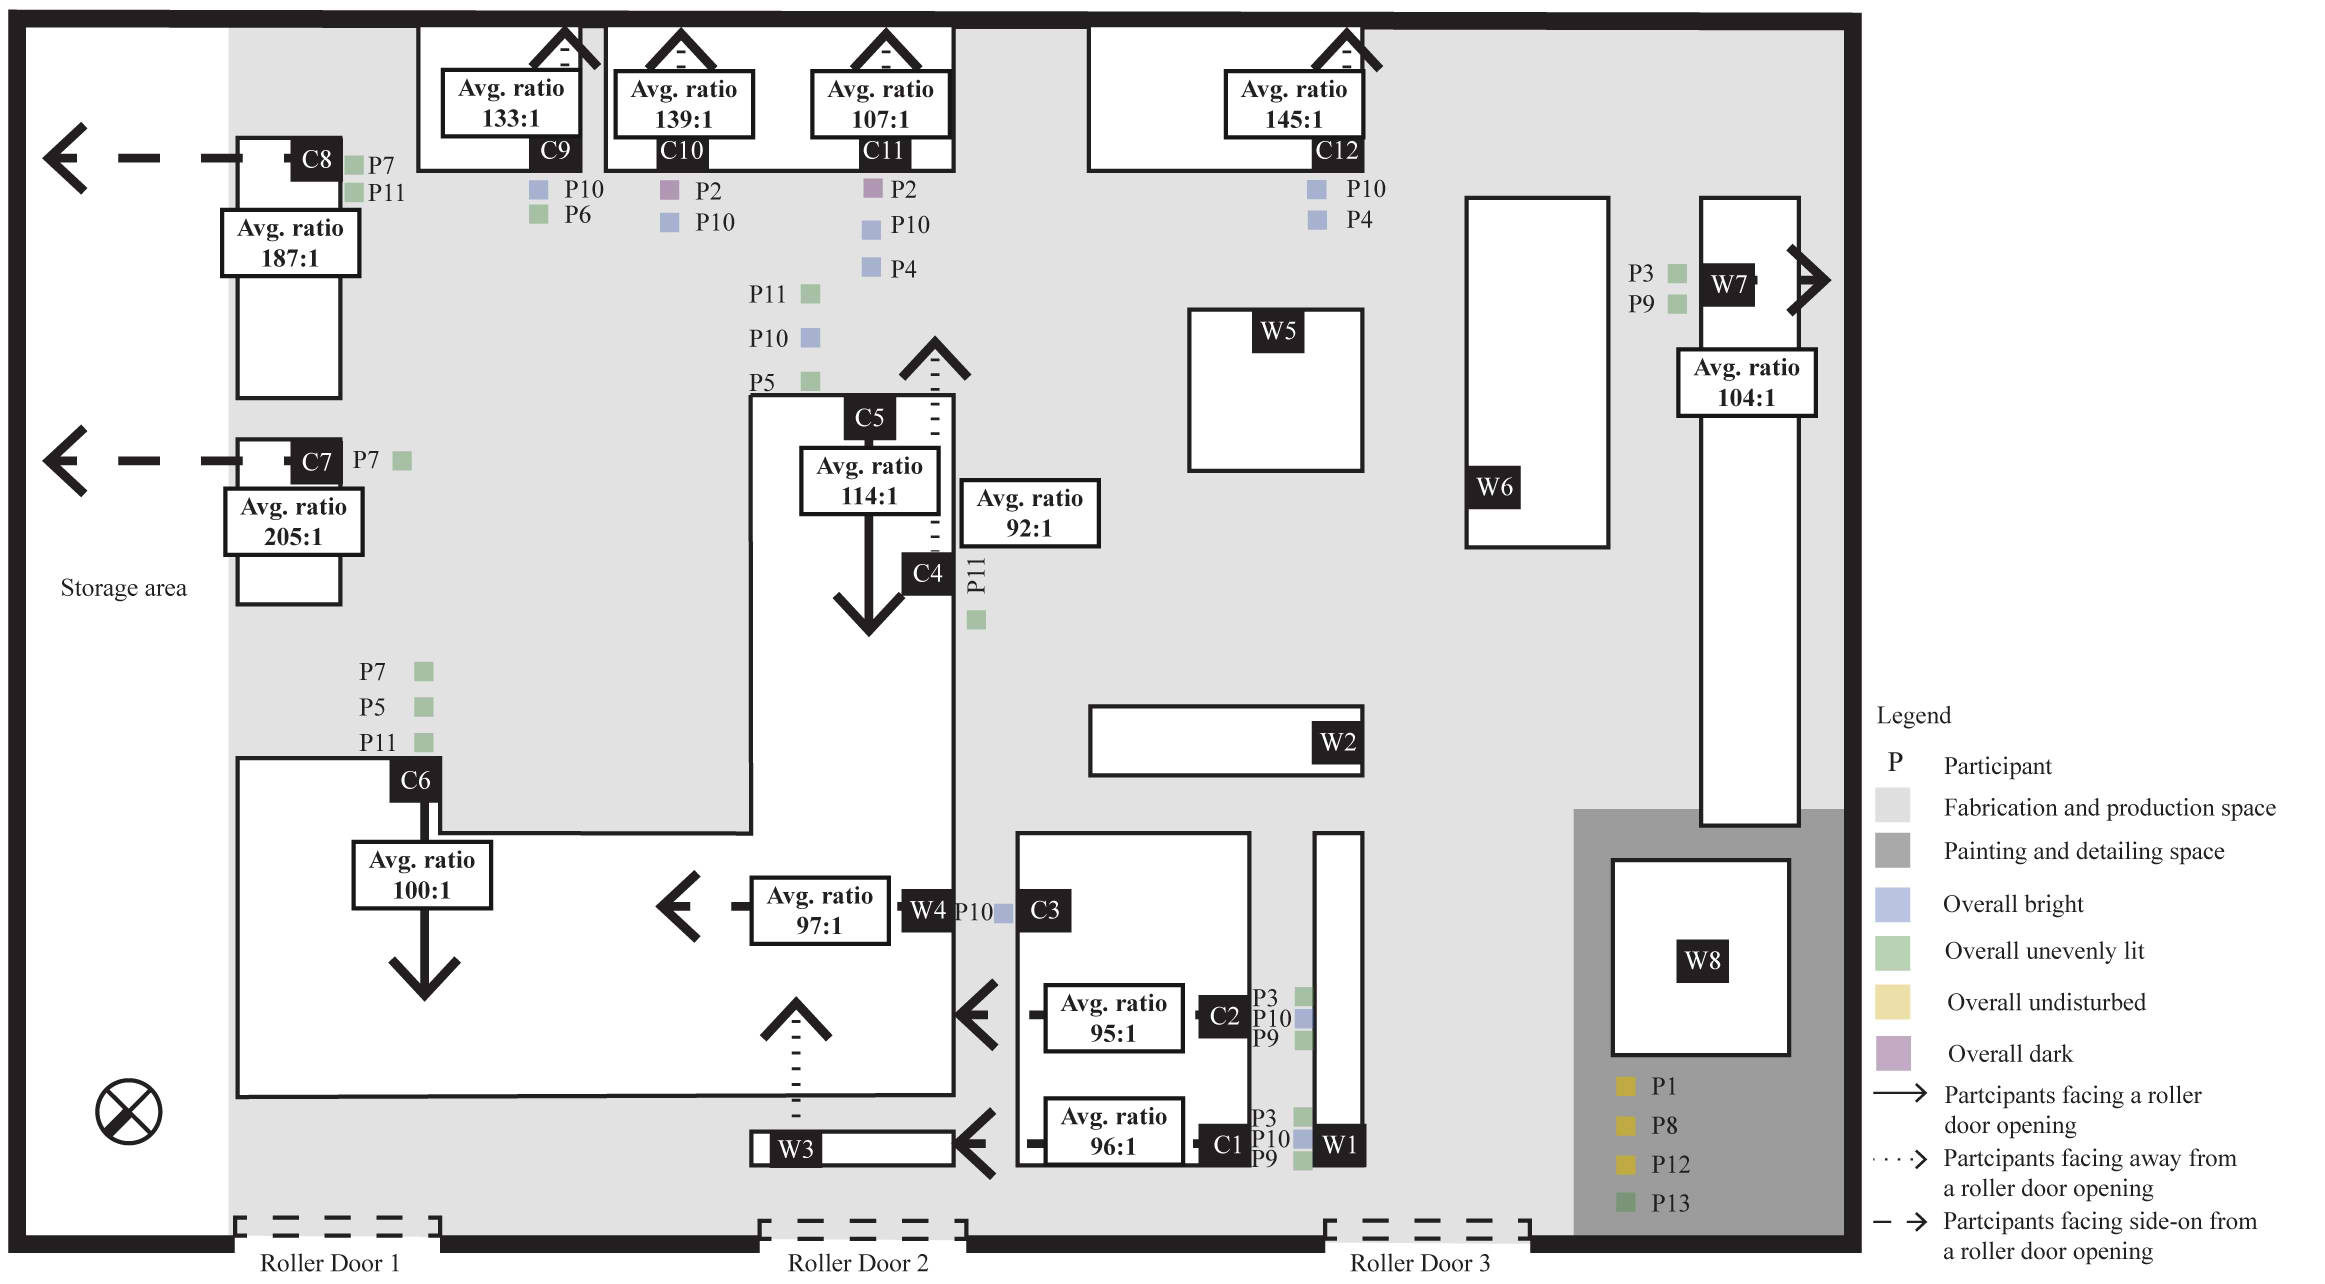
Fig. 13. Participant’s responses to daylighting overall and comparing responses to the luminance ratio values.
4. Discussion
The results illustrate a highly complex work environment, where various levels of visual comfort was reported. This was due to participants having multiple workstations in different locations to travel. While factory workers enjoyed views provided from the three large roller doors, providing openings for daylight penetration to only one side of the work space (West) created non-uniformity around the work environment. Almost all participants reported daylighting to be overall ‘unevenly lit’, regardless of their workstation orientation and location. This was notably different for the participants working under electrical and natural lighting, who all consistently reported that their visual comfort was ‘undisturbed’.
Features of the work environment were also asked to examine whether more attention to lighting design was required. The majority of participants considered windows as an important feature. Almost all preferred to have a window at their workstation in close proximity and in line of side to their workstation, most particularly for the participants with workstations that had no direct access to views, which consistent with the findings by Christoffersenn, Johnson, Petersen, Valbjorn, and Hygge [53]. This may explain why all participants unanimously had a positive perception towards leaving the three large roller doors opened even though it presented a polarising scenario with their visual comfort, which was found in other studies [49,44]. Furthermore, there was a consistent pattern for all the participants with computer workstations who desired additional electrical lighting to control light levels which was a similar attitude found in the study conducted by Escuyer and Fontoynont [17].
Relating participant’s reports of visual comfort to physical data was more complex due to the limitations of existing methods to account for participants having more than one type of workstation. It seemed that the varying responses may be a human factor that the physical data could not account for as noted earlier in this study [28]. Overall, the varying levels and lack of consistency in horizontal illuminance and luminance values between workstations were reflected in the different degrees of visual comfort experienced by all participants who moved between workstation in their normal day. In contrast, all the participants who only had one workstation and workers under electrical and natural lighting consistently reported that their visual comfort was ‘undisturbed’. In general, the illuminance results notably exceeded the general standards for lighting for industrial activities of 200-500 lx, which is an interesting result as it appears that meeting the standard for horizontal illuminance in these spaces does not eliminate the need to supply additional task lighting to alleviate visual comfort issues associated with the uneven distribution of daylight.
At most surveyed workstations, the DGI and ratios of the background to glare source luminances indicated some presence of glare. Interestingly this most often related with participant’s reports of ‘dark’ or ‘very dark’ conditions. This indicates that the most significant issue for users at these workstations is the relative darkness of the task and immediate surface and not the brightness of the (relatively) remote daylight glare sources. This was reflected in the high luminance contrast, which indicated issues of adaptation (all ratios exceeding recommended ratio of 1:40 between task and any surface). Adaptation is much more complex to asses; however, the values serve as a proxy for adaptation. Again, this is an issue that needs to be addressed with more careful lighting design, perhaps through the provision of user-controlled task lighting options.
Future work can explore the potential benefits of supplementary lighting systems for improving the immediate visual conditions at workstations with similar industrial contexts. It should also explore the impacts of user-controlled systems where occupants travel between multiple workstations, and the role of adaptation in visual comfort for workers moving between workstations. The study presented here does indicate the potential for variation in levels of adaptation that can be experienced when travelling to multiple workstations. However, this dimension adds another layer of complexity to measuring visual comfort, since there are no current standardize methods to accurately assess adaptation. Therefore, to fully understand the complexity of how daylighting effects the visual comfort of workers in this work setting, future research should aim at developing a model that can best account for workers with more than one workstation.
5. Conclusions
A common industrial building design with skylights for daylight illumination was selected as a case study to examine visual comfort as perceived by industrial workers. The study used a within persons approached and related self-reported data about the luminous environment with objective measures (illuminance, luminance and HDR imaging) and observational mapping to better understand lighting design and visual comfort. Data was collected over a period of 4 weeks. The study found that the typical design of the industrial building with large door openings created significant luminance and illuminance contrast, even though skylights were present. The luminance contrast present in the field of view affected the reports of visual comfort by industrial workers who overall perceived their work environment to be ‘unevenly lit’ even though all participants had a positive
perception towards leaving the large roller doors opened to have access to a view. The varying reports of visual comfort were consistent throughout the day. Other features of the work environment such as having windows, preferring both electrical and natural lighting, and requiring additional electrical lighting at computer workstations were preferred by the majority of the workers.
A high number of participant responses indicated dark workstations and uneven lighting that corresponded to the objective measures of high luminance ratios and the DGI values indicating that daylighting of this space should be enhanced by additional task lighting systems. This case study highlights the need for consideration of a new model of post occupancy assessment of the visual conditions in spaces where workers travel between multiple workstations through the day. Such a method should attempt to consider the impact that transitions through the workspace, and changes in view direction have on workers in this type of industrial work environment.
Acknowledgements
This research was supported by Dr Mirko Guaraldo the Senior Lecturer in Architecture from the Queensland University of Technology, who provided insight and expertise that greatly assisted the research.
Contributions
K. Pham initiated and conceived the research along with acquisition of data, analysis and interpretation of data. V. Garcia-Hansen and G. Isoardi provided expertise in interpretation of data, development of design and drafting. All authors contributed to the refinement of the study and approved the final manuscript.
References
- Z. Gou, S. S.-Y. Lau, and F. Qian, Comparison of mood and task performance in naturally-lit and artificially-lit environments, Indoor and Built Environment 24 (2013) 2013. http://dx.doi.org/10.1177/1420326x13507792
- A. R. Webb, Considerations for lighting in the built environment: Non-visual effects of light, Energy and Buildings 38 (2006) 721–727. http://dx.doi.org/10.1016/j.enbuild.2006.03.004
- N. Wang and M. Boubekri, Design recommendations based on cognitive, mood and preference assessments in a sunlit workspace, Lighting Research and Technology 43 (2010) 55–72. http://dx.doi.org/10.1177/1477153510370807
- T. Hwang and J. Tai Kim, Effects of Indoor Lighting on Occupants’ Visual Comfort and Eye Health in a Green Building, Indoor and Built Environment 20 (2011) 75-90. http://dx.doi.org/10.1177/1420326X10392017
- M. Fontoynont, Perceived performance of daylighting systems: lighting efficacy and agreeableness, Solar Energy 73 (2002) 83–94. http://dx.doi.org/10.1016/s0038-092x(02)00035-x
- W. van Bommel and G. van den Beld, Lighting for work: a review of visual and biological effects, Lighting Research and Technology 36 (2004) 255–269. http://dx.doi.org/10.1191/1365782804li122oa
- J.B. de Boer and D. Fischer, Interior lighting, Kluwer, London, Deventer, 1978.
- C. Meek and K. V. D. Wymelenberg, Daylighting and Integrated Lighting Design, Routledge, Hoboken, 2014.
- I. Knez and C. Kers, Effects of Indoor Lighting, Gender, and Age on Mood and Cognitive Performance, Environment and Behavior 32 (2000) 817–831. http://dx.doi.org/10.1177/0013916500326005
- R. Küller, S. Ballal, T. Laike, B. Mikellides, and G. Tonello, The impact of light and colour on psychological mood: a cross-cultural study of indoor work environments, Ergonomics 49 (2006) 1496–1507. http://dx.doi.org/10.1080/00140130600858142
- M. Boubekri, R. B. Hull, and L. L. Boyer, Impact of Window Size and Sunlight Penetration on Office Workers' Mood and Satisfaction: A Novel Way of Assessing Sunlight, Environment and Behavior 23 (1991) 474-493. http://dx.doi.org/10.1177/0013916591234004
- P. Leather, M. Pyrgas, D. Beale, and C. Lawrence, Windows in the Workplace: Sunlight, View, and Occupational Stress, Environment and Behavior 30 (1998) 739–762. http://dx.doi.org/10.1177/001391659803000601
- M. B. C. Aries, J. A. Veitch, and G. R. Newsham, Windows, view, and office characteristics predict physical and psychological discomfort, Journal of Environmental Psychology 30 (2010) 533–541. http://dx.doi.org/10.1016/j.jenvp.2009.12.004
- E. Ne’Eman and R. G. Hopkinson, Critical minimum acceptable window size: a study of window design and provision of a view, Lighting Research and Technology 2 (1970) 17–27. http://dx.doi.org/10.1177/14771535700020010701
- E. Wotton and B. Barkow, An investigation of the effects of windows and lighting in offices, in: Proceedings of the International Daylighting Conference, 1983, 405-11, Phoenix, Washington, DC.
- D. L. Butler and P. M. Biner, Preferred Lighting Levels: Variability among Settings, Behaviors, and Individuals, Environment and Behavior 19 (1987) 695–721.
- S. Escuyer and M. Fontoynont, Testing in situ of automatic ambient lighting plus manually controlled task lighting: office occupant reactions, in: Proceedings of the 9th European Lighting Conference, 2001, 70-75, Reykjavik, Iceland.
- J. A. Veitch, M. G. M. Stokkermans, and G. R. Newsham, Linking Lighting Appraisals to Work Behaviors, Environment and Behavior 45 (2011) 198–214. http://dx.doi.org/10.1177/0013916511420560
- R. NIELSEN and J.-P. MEYER, Evaluation of metabolism from heart rate in industrial work, Ergonomics 30 (1987) 563–572. http://dx.doi.org/10.1080/00140138708969745
- R. Hétu, Mismatches between Auditory Demands and Capacities in the Industrial Work Environment, International Journal of Audiology 33 (1994) 1–14. http://dx.doi.org/10.3109/00206099409072950
- M. Kivimäki, P. Leino-Arjas, R. Luukkonen, H. Riihimäki, J. Vahtera, and J. Kirjonen, Work Stress And Risk Of Cardiovascular Mortality: Prospective Cohort Study Of Industrial Employees, British Medical Journal 325 (2002) 857–60. http://dx.doi.org/10.1136/bmj.325.7377.1386
- O. Hammig and G. F. Bauer, Work, work-life conflict and health in an industrial work environment, Occupational Medicine 64 (2013) 34–38. http://dx.doi.org/10.1093/occmed/kqt127
- J. Drury, Factories: planning, design and modernisation, Architectural Press, London, 1981.
- S. L. Lyons, Handbook of industrial lighting, Butterworths, London, 1981.
- M. J. Kuchta. Daylighting in American industrial architecture: Three investigations: UMI Dissertations; 1994.
- J. Lee, Smart Factory Systems, Informatik Spektrum 38 (2015) 230–235. http://dx.doi.org/10.1007/s00287-015-0891-z
- J.S.Skinner, Form and Fancy: factories and factory buildings by Wallis, Gilbert & Partners 1916-1939, Liverpool University Press, Liverpool, 1997.
- C. L. Robbins, Daylighting: design and analysis, Van Nostrand Reinhold, New York, 1986.
- P. R. Boyce, Human factors in lighting, Taylor & Francis, New York, 2003.
- R. Clear, Discomfort glare: What do we actually know?, Lighting Research and Technology 45 (2012) 141–158. http://dx.doi.org/10.1177/1477153512444527
- Department of Productivity, Daylight at Work, Canberra, Australia, 1983.
- R. G. Rodriguez and A. Pattini, Effects of a Large Area Glare Source in Cognitive Efficiency and Effectiveness in Visual Display Terminal Work, LEUKOS 8 (2012) 283-299.
- K. W. Houser, LED Troffers: A Glaring Omission, LEUKOS 9 (2012) 5–7. http://dx.doi.org/10.1080/15502724.2012.10732173
- B. Van Wanrooy., S. Oxenbridge., J. Buchanan., M. Jakubauskas, The Benchmark Report Workplace Research Centre: Sydney University Workplace Research Centre, 2007.
- D. Wang., L. N. Groat., I. ebrary, Architectural research methods, Wiley, Hoboken, 2013.
- S. Hugge., H. A. Lofberg, Post occupancy evaluation of daylight in buildings: a report of IEA SHC Task 21 / ECBCS Annex 29 International Energy Agency (IEA), 1999.
- International Energy Agency, Post occupancy evaulation of daylight in buildings, Gävle, Sweden: International Energy Agency, 1999.
- K. Steemers., N. Baker., A. Fanchiotti, Daylighting in architecture: a European reference book, James & James, London, 1993.
- Standards Australia. Interior Lighting Part 2.4: Industrial tasks and processes. 1997; AS/NZS 1680.2.4-1997.
- G. Newsham and J. Veitch, Lighting quality recommendations for VDT offices: a new method of derivation, Lighting Research and Technology 33 (2001) 97–113. http://dx.doi.org/10.1177/136578280103300205
- Chartered Institution of Building Services Engineers, Lighting guide the industrial environment, Chartered Institution of Building Services Engineers, London, 1989.
- International Commission on Illumination, Guide on interior lighting, 2nd ed., The Commission, Paris, 1986.
- V. Garcia Hansen, G. Isoardi, M. Hirning, and J. M. Bell, An assessment tool for selection of appropriate daylighting solutions for buildings in tropical and subtropical regions: validation using radiance simulation, in: Paper presented at: World Renewable Energy Forum (WREF), 3600-3608, Denver Convention Centre, Denver, Colarado.
- N. Tuaycharoen and P. R. Tregenza, View and discomfort glare from windows, Lighting Research and Technology 39 (2007) 185–200. http://dx.doi.org/10.1177/1365782807077193
- M. B. Hirning, G. L. Isoardi, and I. Cowling, Discomfort glare in open plan green buildings, Energy and Buildings 70 (2014) 427–440. http://dx.doi.org/10.1016/j.enbuild.2013.11.053
- J. Wienold and J. Christoffersen, Evaluation methods and development of a new glare prediction model for daylight environments with the use of CCD cameras, Energy and Buildings 38 (2006) 743–757. http://dx.doi.org/10.1016/j.enbuild.2006.03.017
- J. M. Waldram, The Design of the Visual Field, National Illumination Committee of Great Britain, London, 1953.
- J. Ferwerda, S. Pattanaik, P. Shirley, and D. Greenberg, editors. A model of visual adaptation for realistic image synthesis, 1996, ACM.
- W. K. E. Osterhaus, and I. L. Bailey, Large area glare sources and their effect on visual discomfort and visual performance at computer workstations, in: Industry Applications Society Annual Meeting, 1992, 1825-9, Houston, TX.
- K. Parpairi, N. Baker, K. Steemers, and R. Compagnon, The Luminance Differences index: a new indicator of user preferences in daylit spaces, Lighting Research and Technology 34 (2002) 53–68. http://dx.doi.org/10.1191/1365782802li030oa
- R. Speed, The Effect of Adaptation Levels and Daylight Glare on Office Workers' Perception of Lighting Quality in Open Plan Offices, Architectural Science Review 48 (2005) 229-237. http://dx.doi.org/10.3763/asre.2005.4829
- W. Osterhaus, Design Guidelines for Glare-Free Daylit Work Environments, 2009.
- J. Christoffersenn., K. Johnson., E. Petersen., O. Valbjorn., S. Hygge, Windows and daylight: a post-occupancy evaluation of Danish offices, in: Lighting 2000 Proceedings of the CIBSE/ILE Joint Conference, 2000, pp. 112-20, United Kingdom.
Copyright © 2016 The Author(s). Published by solarlits.com.

1922
Total views
Citations
SHARE ON


