Article Outline
Figures and tables
Volume 4 Issue 1 pp. 1-14 • doi: 10.15627/jd.2017.1
Solar Shading in Low Energy Office Buildings - Design Strategy and User Perception
Author affiliations
a Department of Architecture, Materials and Structures, SINTEF Building and Infrastructure, NO-7465 Trondheim, Norway
b ZEB (Zero emission buildings), Faculty of Architecture and Fine Art, Norwegian University of Science and Technology (NTNU), NO-7491 Trondheim, Norway
* Corresponding author. Tel: +47 73 593377, Fax +47 73 593380
steinar.grynning@sintef.no (S. Grynning)
nicola.lollli@sintef.no (N. Lolli)
solvar.wago@sintef.no (S. Wågø)
birgit.risholt@sintef.no (B. Risholt)
History: Received 14 October 2016 | Revised 14 December 2016 | Accepted 21 December 2016 | Published online 2 February 2017
Copyright: © 2017 The Author(s). Published by solarlits.com. This is an open access article under the CC BY license (http://creativecommons.org/licenses/by/4.0/).
Citation: Steinar Grynning, Nicola Lolli, Solvår Wågø, and Birgit Risholt, Solar shading in low energy office buildings - design strategy and user perception, Journal of Daylighting 4 (2017) 1-14. http://dx.doi.org/10.15627/jd.2017.1
Figures and tables
Abstract
The objective of this paper is to investigate the visual comfort and quality of daylight in modern office buildings in the Nordic climate. A study of various daylight-related aspects and qualities was carried out for three different office buildings, using a combination of quantitative and qualitative methods. The focus was on a combination of user perception of daylight quality and assessment of the daylight amount and quality, by using the daylight factor (DF) and useful daylight illuminance parameters. Previous studies and experiences from construction examples indicate that users, in general, complain about lack of manual control of systems and too low daylight levels, even if the requirements in the building codes are satisfied. Furthermore, they complain about control algorithms of the shading devices, which cause undesired automatic opening and closure of such devices. Thus, causing disturbances and irritation amongst the users. Hence, interviews with key personnel in a modern and architecturally acclaimed office building were carried out in addition to an in-depth analysis of previous surveys of a zero-energy office building. It was found that automatic moveable shading can be regarded as a source of discomfort. This is due to the lack of manual-control override possibilities, which causes disturbances due to the system moving up and down. In one of the offices, the users disabled the exterior shading system. However, the external fixed shading and the internal manually operated roller blinds were found to be satisfactory. The results from a previous study showed that the users in the Marche building are in general satisfied with the daylight. One of the main reasons for this, according to the users, is that they have manual control of the shading system. Manual control of the shading systems is preferred by users in the office buildings studied. Daylight simulations showed that the external fixed shading system combined with internal shading give satisfactory DFs and an even distribution of the daylight levels in a south-facing office. According to the users, the external fixed shading is a good system for south facing offices, when local glare issues can be solved by interior roller shades. The DF gives information of the daylight distribution, which in certain cases might be adequate. However, this is not enough as a descriptor for user comfort, as other factors such as manual control possibilities and glare discomfort are not included.
Keywords
Glazing, Solar heat gain coefficient, Solar factor, Heating demand
1. Introduction
Moving towards passive house-level envelopes [1], zero-energy buildings or zero-emission buildings, as defined by the Research Centre on Zero Emission Buildings (ZEB) [2-4], where the carbon footprints of the buildings have been reduced vastly, the performance of the transparent parts of the envelope is vital in order to ensure a low energy demand and a desirable indoor environment [5,6]. Previous studies explored and confirmed that the energy performance of buildings is highly dependent on the design, functionality, and area of the transparent façades in office buildings [7-9].
In order to assess the energy performance of windows, several factors must be addressed. The most important issues to consider are energy losses due to heat transmission through windows, energy gains from solar radiation, as well as transmitted visible light and the influence this has on artificial lighting demands. Factors like the thermal and visual comfort in buildings also need to be assessed and addressed.
When optimizing the glazed area, complex interactions must be taken into account as pointed out in several publications [5,6,8,10,11]. As Ochoa et al. point out, a set of clearly defined evaluation criteria must be set prior to any energy and/or daylight optimization tasks [12]. Their study looks at the optimization of the window size in a sample office cubicle, where the authors propose using glare and illuminance uniformity as the criteria for visual comfort, whereas total energy consumption and illuminance should be considered when meeting legal requirements, for example.
L. Karlsen et al. assessed occupant comfort in office cubicles as function of different shading strategies [13 ]. The authors found that the most important factor for the occupants to be satisfied was to maintain a view to the outdoors. So much that the occupants could endure a certain level of glare as long as the view was maintained. Furthermore, the authors recommend that cut-of strategies for positions of blinds are used, rather than a strategy with fully closed slats when shading was activated. Other studies found that office users prefer manually-operated shading systems to automatic systems [14 ]. Users can tolerate short periods in which they experience glare and overheating, and glare due to daylighting is tolerated more than that originating from other light sources [15 ]. A study from Reinhart and Voss showed that office users are more willing to accept an automatic blind system when this operates by raising the blinds. The authors found that office users rose back the blinds in 88% of the occasions when these descended due to the increased incoming solar radiation [16 ]. Vine et al studied the user’s preferences for different blind systems (from automatic to manual). They found that users largely preferred the manual systems and complained about the too dim lit environment caused by the automatic blind system [17 ].
Artificial lighting can contribute to between 20% and 60% of a buildings total electricity consumption [18,19]. The use of naturally available daylight may save considerable amount of energy and greenhouse gas emissions. Moreover, there is an undoubtedly clear preference for daylight from interviewed office workers [18]. Several studies confirm that access to daylight and view are crucial for humans` well-being and health [20-25], and there is clear evidence that daylight regulate circadian cycles [9,26-28]. Moreover, several respondents believed that daylight and view are alleviating stress and showed a clear preference for offices with windows, due to the possibility of having an outside view [9]. The presence of windows allows occupants to get information on the time of the day and the weather, can limit eye fatigue by providing a distant horizon to focus on, and limit the feeling of claustrophobia [24]. Daylight harvesting strategies need to consider the comfort for the building users' in relation to their visual task. Window shading systems are crucial for controlling glare, illuminance levels, and incoming solar radiation, all of which are sources of discomfort and affect the building energy use. In buildings with limited daylight availability, daylight redistribution systems like light shelves could be considered to heighten daylight levels in areas far from the facade [29,30]. This is however, outside the scope of this study.
The scope of this study is limited to buildings situated in the Nordic climate. For a cold climate like this, one of the aims for the future should be to develop solutions for the transparent component with minimal heat losses. This could be achieved by using highly insulating multi-pane glazing. At the same time, the potential energy and illuminance from solar radiation should be harvested and utilized for heating and lighting.
2. Background
2.1 Solar shading – types and functionality
When it comes to controlling or altering the thermal- as well as the light transmission properties and performance of a facade, several ways of controlling this performance are possible. The traditional way of altering the amount and distribution of incident solar radiation is done by using solar shading systems. In this context, this could be easily considered as a low-tech alternative, but it might nevertheless be an effective alternative. In the field of solar shading, there exist primarily three main types of shading: internal-, external- and in-between-pane shading systems, as described in Table 1.
Table 1
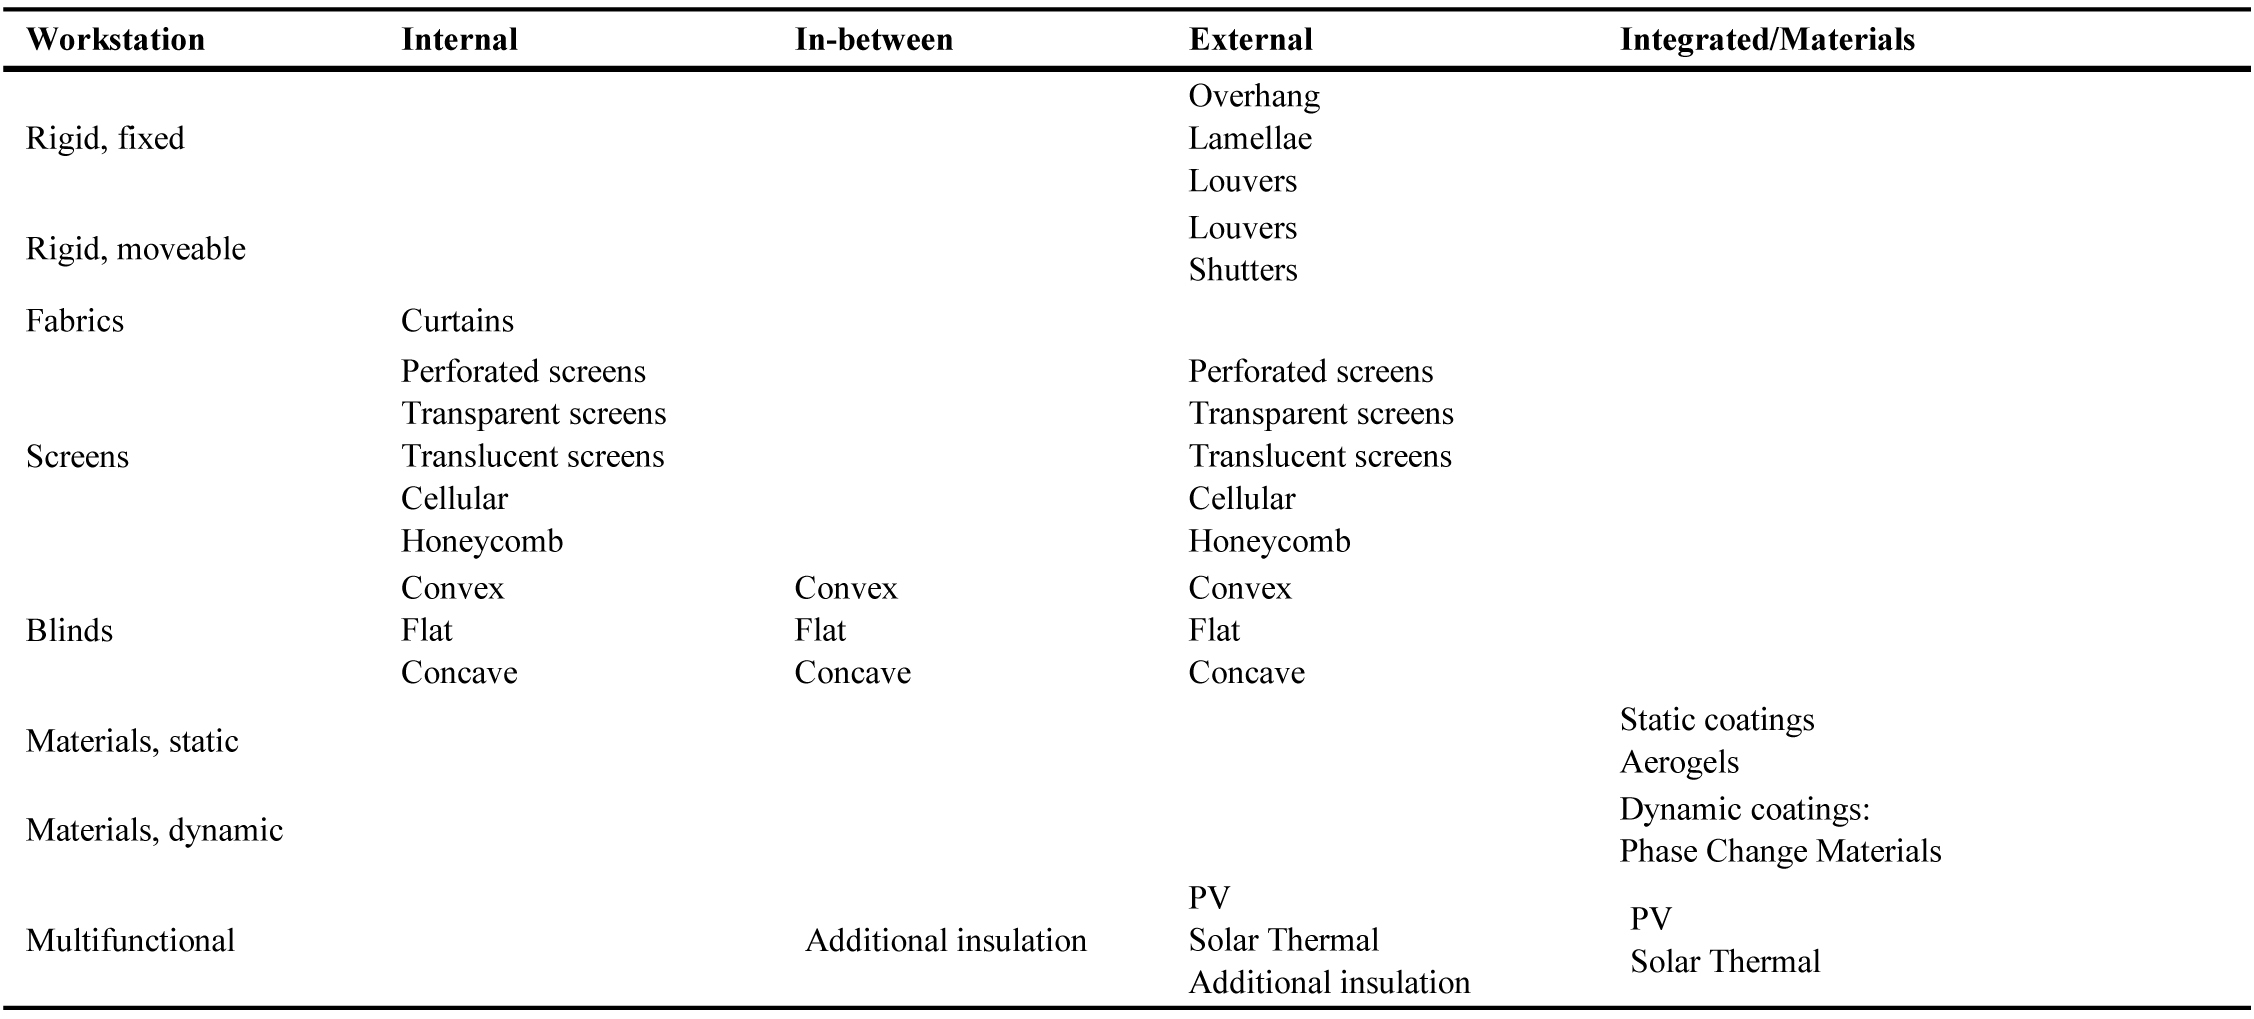
Table 1. Solar shading types and classification with some picture examples.
The main reason for using internal solar shading should be to control glare, provide privacy, and regulate the visible light transmission through the glazed area. Depending on the properties of the shading system, superfluous heat may be radiated back through the glazing, thus giving a potential for a reduced cooling demand [31]. However, in this regard, this solution is less effective than that given by placing exterior shading devices.
One of the benefits of in-between-pane shading systems is that the shading device is protected from wind and rain, making it more durable than exterior devices. However, this leads to a more cumbersome maintenance of the systems due to limited access. An additional advantage is that the shading screen may act as an additional layer in the glazing system, thus improving the thermal performance [32,33].
As for the internal shadings, screen shadings and roller blinds are also suited for external shading systems. The architectural qualities of external shading systems can vary to a large extent, as shown in Table 2. This solution is the most efficient when it comes to control the incoming solar radiation [10], but, from an architectural point of view, the integration is challenging. The shading system is also exposed directly to the climatic loads, so their use in windy places or in high-rise buildings can be challenging.
Table 2
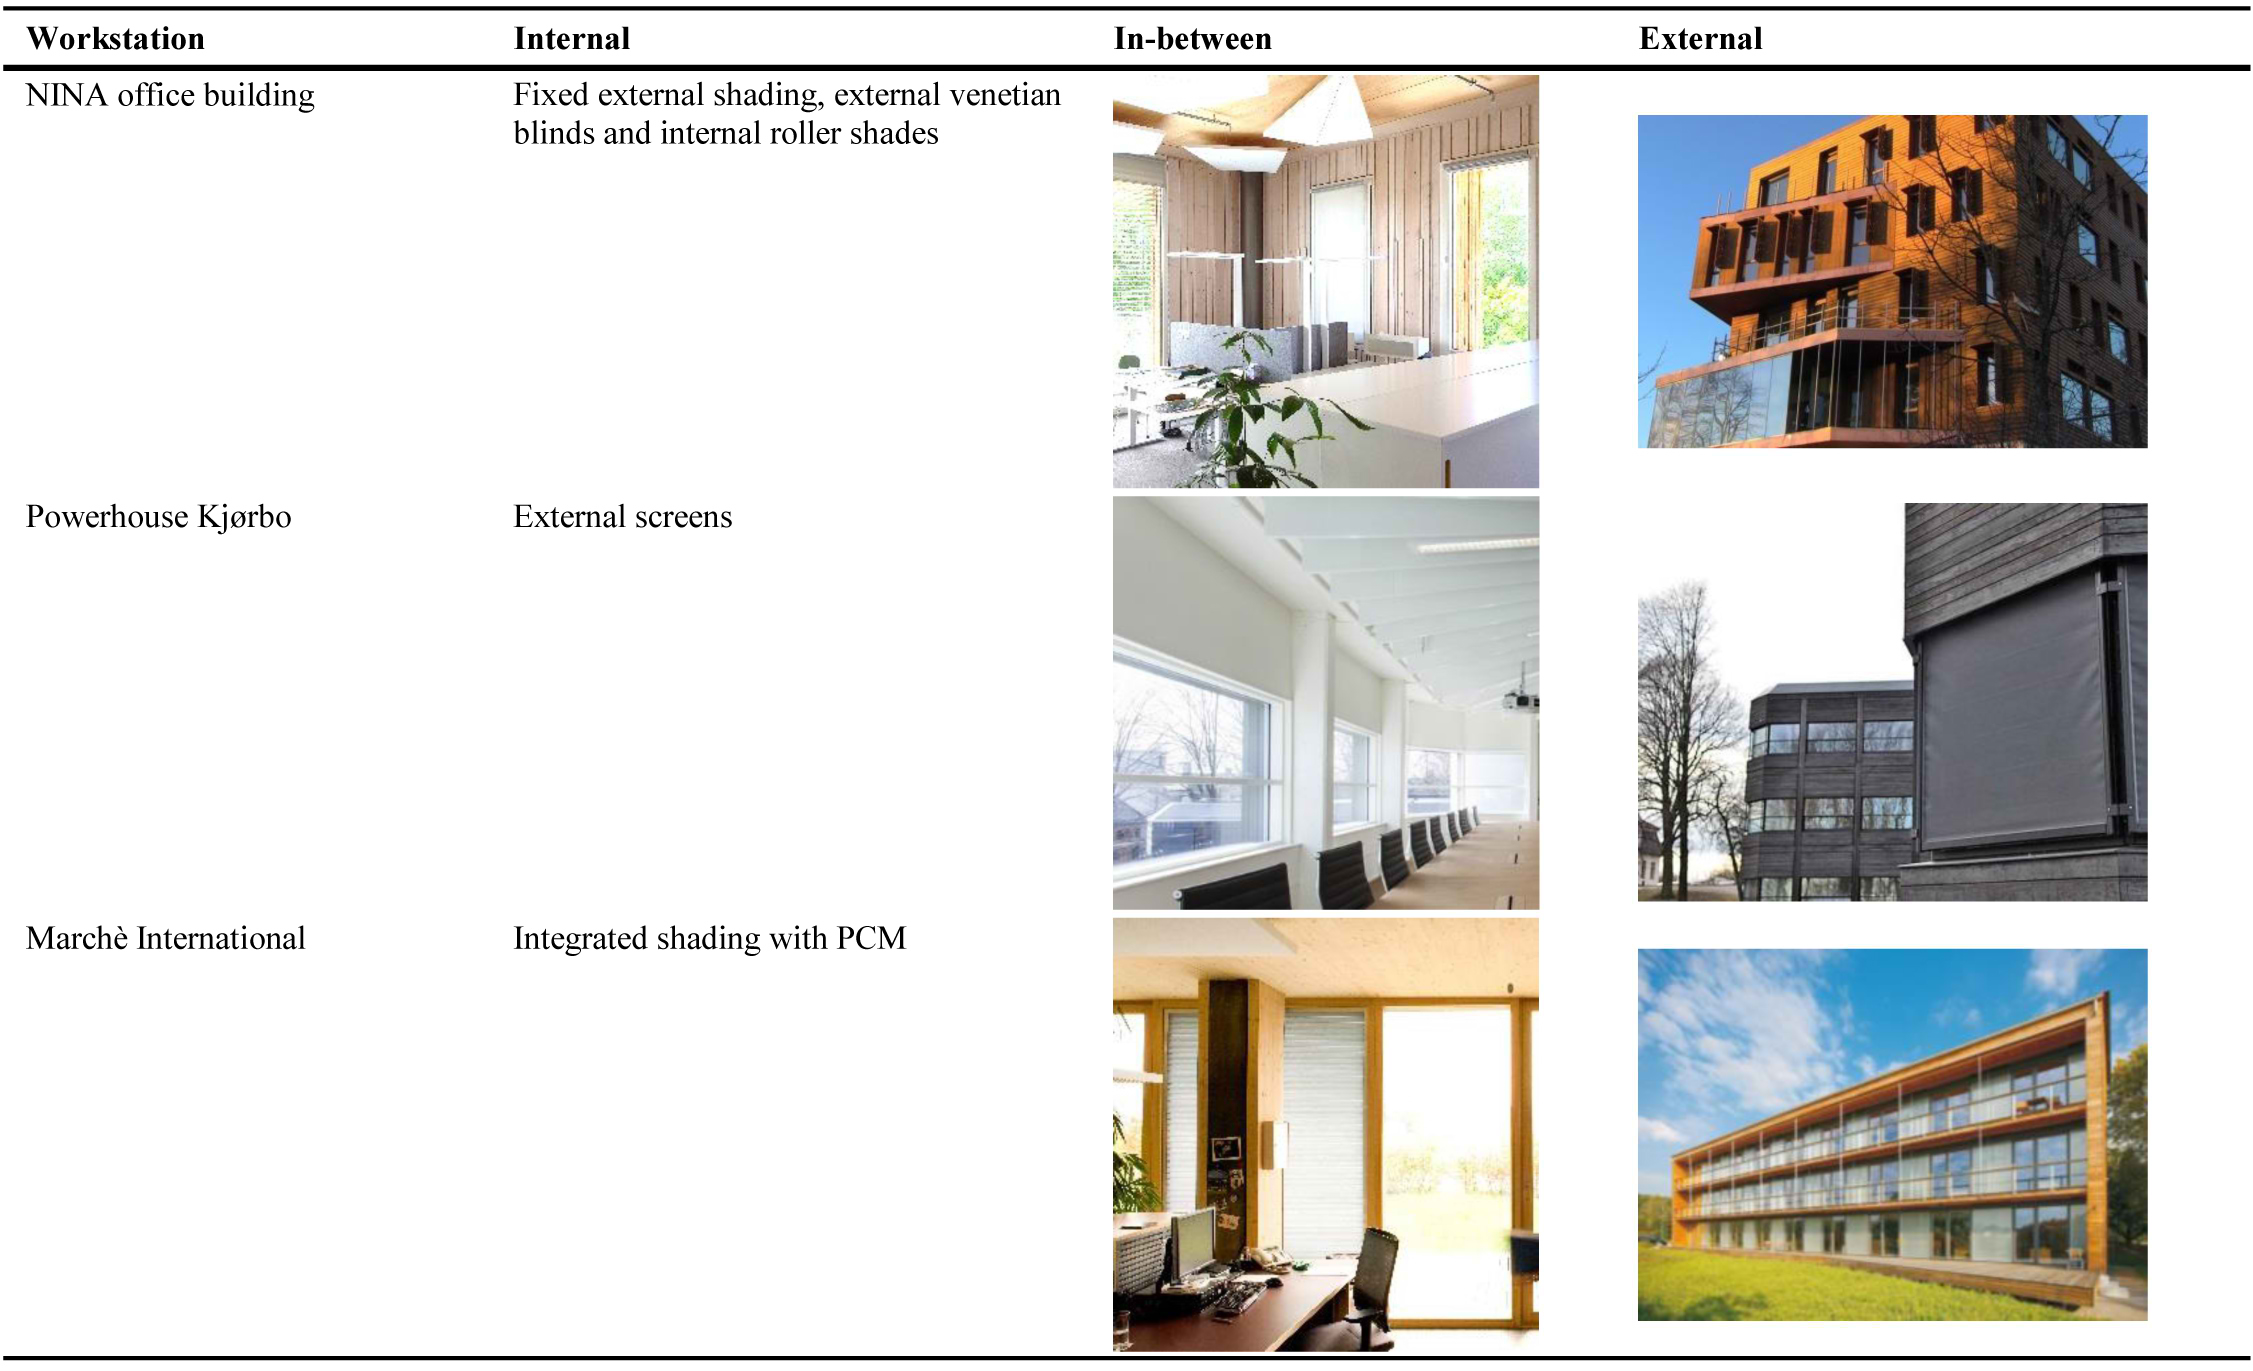
Table 2. Office case descriptions.
For these systems, the shading is integrated in the glazing itself. Typical examples are smart windows in which the glass changes colour, visible, and solar transmissivity, such as in thermo-chromic, photo-chromic or electro-chromic windows, where the latter is considered the most commercially and practically viable solution [34].
Another solution on the market is the use of phase change materials (PCM) in translucent facade components. The aim of including a PCM layer in a transparent system is to improve the thermal comfort by reducing the diurnal temperature-peaks during the warm and cold periods of the day, and to collect solar energy by latent energy storage for thermal mass utilization purposes. Some studies about PCMs in combination with glazed and double skin facades have previously been investigated [35-39].
2.2 Assessing shading system performance
In the existing literature one can find long lists of different parameters used to assess the performance of shading systems which could or should be considered [31,40]. Carrying out a holistic characterisation of systems based on all of these factors is time-consuming, and choices are often dependent on which parameters are selected and used for the respective analyses. However, a widely used design parameter amongst architects and daylight-consultants is the Daylight Factor (DF) [41]. This express the ratio of daylight present in a room compared to the exterior daylight level under an overcast sky [42,43]. It is usually expressed as an average value for an entire room or as DF-maps where the DF is plotted for a given number of coordinates in the room. This is also the only explicit value with a set level of demand in the Norwegian building code regulation TEK10 [44]. The demand is that the average DF in a room must be higher than 2%. However, the DF is not adequate in describing the daylight quality in a room. In addition, it is critical to understand where in the room the users may experience glare or too low illuminance levels. In such a perspective, the useful daylight illuminance (UDI) helps in understanding the different levels of daylight illuminance in a room and their occurrence during the occupied time. The UDI was proposed by Nabil and Mardaljevic [45,46] and gives values for each point in the space. It relates to defined levels and intervals in which comfort or discomfort occurs. Levels falling below 100 lux are considered too dark (for office tasks), giving rise to discomfort. The interval between 100 lux and 2000 lux is considered as comfortable and useful for lighting the space. Levels above 2000 lux are considered to give too high light levels, leading to visual discomfort and possibility of glare. It is worth noting that the UDI is not enough for assessing the glare discomfort, which depends on the user's observation point and luminance levels of observed surfaces. Glare needs to be evaluated through specifically designed metrics, such as the Discomfort Glare Index, or the Discomfort Glare Probability. Carlucci et al. give a comprehensive description of the different discomfort glare indices [47].
Based on this, a choice was made to use both the DF and the UDI as the quantitative descriptors of the daylight quality for three simulation cases. By doing this, these simulations give an indication on how the shading systems are performing "on paper" if they were part of a design-stage in a real building project.
In general, it is clear that both qualitative and quantitative assessment methods should be used. Previous studies focusing on energy-aspects found that the automatic control of shading is a key to realize the energy saving potential and daylight benefits of the shading systems, and that the control methods must include both lighting as well as heating- and cooling energy simultaneously [48]. Manual control should be avoided, seen from an energy-saving point of view, as users of the buildings tend to leave the blinds in either open or closed positions, regardless of what is optimal with respect to the cooling/heating need and or daylight levels [16,49]. Daylight levels inside the buildings are not always sufficiently addressed through these types of analyses. This emphasize the need for investigations along the borders of energy, visual quality, daylight levels and thermal comfort as perceived by the users.
In the literature, several user surveys have been carried out in modern office buildings. In a publication by Thomsen et al. [50], an office building in Switzerland was studied. This is an office where a combination of a conventional shading and an integrated shading system with integrated polycarbonate reflector and translucent PCM is part of the facade. The users are mostly satisfied with the daylight situation. The shading is automatically controlled but the user can also overrun it to have an individual control at their respective workspaces. Natural daylight was perceived as an important element of comfort. Glare was not named as a problem and blinds can be lowered in case of sunshine on screens. Users say that big windows are an advantage and that the blinds can be used in case of glare. The employees said they had received information on how to use the office and its` technological devices when they moved in. It was for instance explained how to control the solar shading.
Another study of a modern office building was carried out by Throndsen et al. [51]. They evaluated the construction process and early use phase in Powerhouse Kjørbo, which is an old office building rehabilitated and upgraded to reach a zero-energy standard. They found that there were several complaints about the visual comfort in the office spaces. The main complaint is regarding the lack of manual control possibilities of the solar shading. This results in discomfort from glare and other visual discomfort. Some quotes from the users are:
"Solar shading going up and down is sometimes disturbing, when alternating weather (office facing southeast)"
"Too bad light in the working place. Hope it will be fixed soon! (Office facing southwest)"
"The biggest problem is automatically blending of windows at specific times each day. This is not necessary with windows facing northwest!"
"Solar shading. Shading goes too often and we have to override the control to get them up again (Office facing northwest)"
"...sunlight has improved with the adjustments made, but there have been very dark to the landscape in the evenings when there are few supervising onsite (office facing southwest)"
As part of another study on the same building, interviews were carried out to investigate comfort levels in a zero-energy office building in Oslo Norway [52]. The preliminary findings from this was that daylight levels were poor, glare was found to be troublesome and the users felt the lack of individual control as negative. The results from these work, strengthens the hypothesis that this intersecting field of topics needs further studies. More in-depth analysis of these interviews are presented here, in the results chapter.
3. Objective
The overall objective of this paper has been to investigate the visual comfort and quality of daylight in modern office buildings in a Nordic, cold climate using interdisciplinary methods. The main research goals of this study was two-fold. One part was dedicated to the development of knowledge on the human perception of daylight in buildings versus two commonly used quantifiable assessment parameters. The DF and UDI are common parameters used for building design and planning. However, do they describe the visual comfort in office spaces in a good way? To answer this question, an inter-disciplinary study using interviews and surveys to assess the level of user comfort coupled with simulations of DF and UDI distributions for conceptual offices have been carried out. Results from a previous study [50], regarding one of the case-buildings presented here, indicate that users are complaining about lack of manual control of systems, too low daylight levels and control algorithms of the shading devices which cause undesired automatic opening and closure of the shading devices.. Thus, causing disturbances and irritation amongst the users.
The second part was to assess user satisfaction and calculated daylight levels in buildings with modern shading systems and calculated daylight levels in offices. The work has been structured along three main research questions:
- Are users in modern office buildings satisfied with the visual comfort in the buildings
- In what way and how much does solar shading system performance influence the perceived comfort?
- Does assessment of daylight quality using standardized, and much used, daylight assessment metrics correspond to actual user satisfaction in case office buildings?
4. Method
4.1 Case building descriptions
A study of various daylight-related qualities has been carried out for three different office buildings. The first is situated in Trondheim, Norway (Norwegian institute for nature research (NINA) office) and the second in Oslo, Norway (Powerhouse Kjørbo office). The third is situated in Kempttal, Austria (Marche International Support Office). A summary of shading system and pictures of the buildings are shown in Table 2. These buildings were selected in order to represent buildings with different solar shading solutions. A description of the characteristics of each buildings is given here.
The NINA office building has a heated floor area of 8200 m². The load bearing construction is made of steel using massive wood elements as floor-dividers [53]. It is constructed according to Passive-house level for energy standards [1]. The office spaces are distributed between open-office landscapes and individual office cubicles. The properties of windows and solar shading devices are shown in Tables 3 and 4. The building has a mechanical balanced ventilation system coupled with the possibility for utilization of natural ventilation using automated controls for opening/closing of vents. The set point for cooling is 26 °C. The NINA building is characterized by a complex façade design in which several abutting volumes pattern the South and West façade. The solar shading solution in the NINA-building is based on three systems:
Table 3
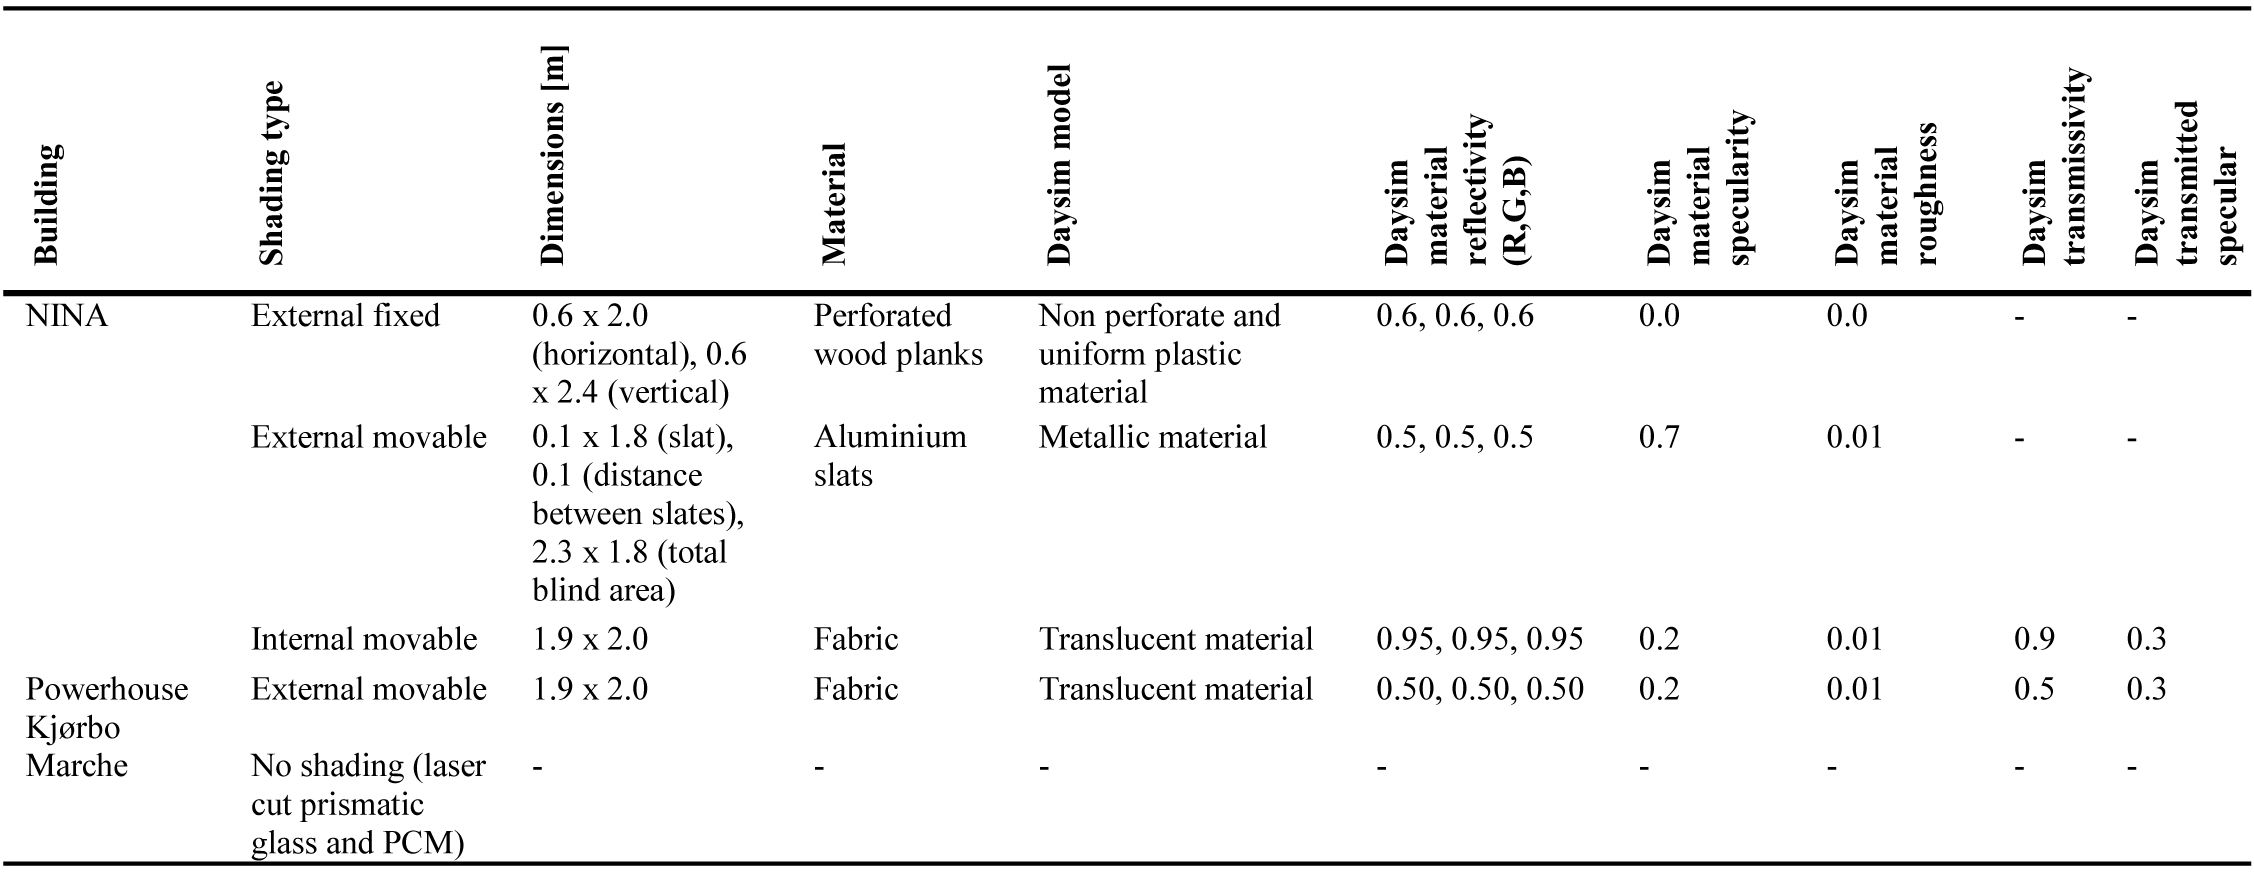
Table 3. Dimensions and description of the material properties of the three different shading systems in the buildings.
Table 4
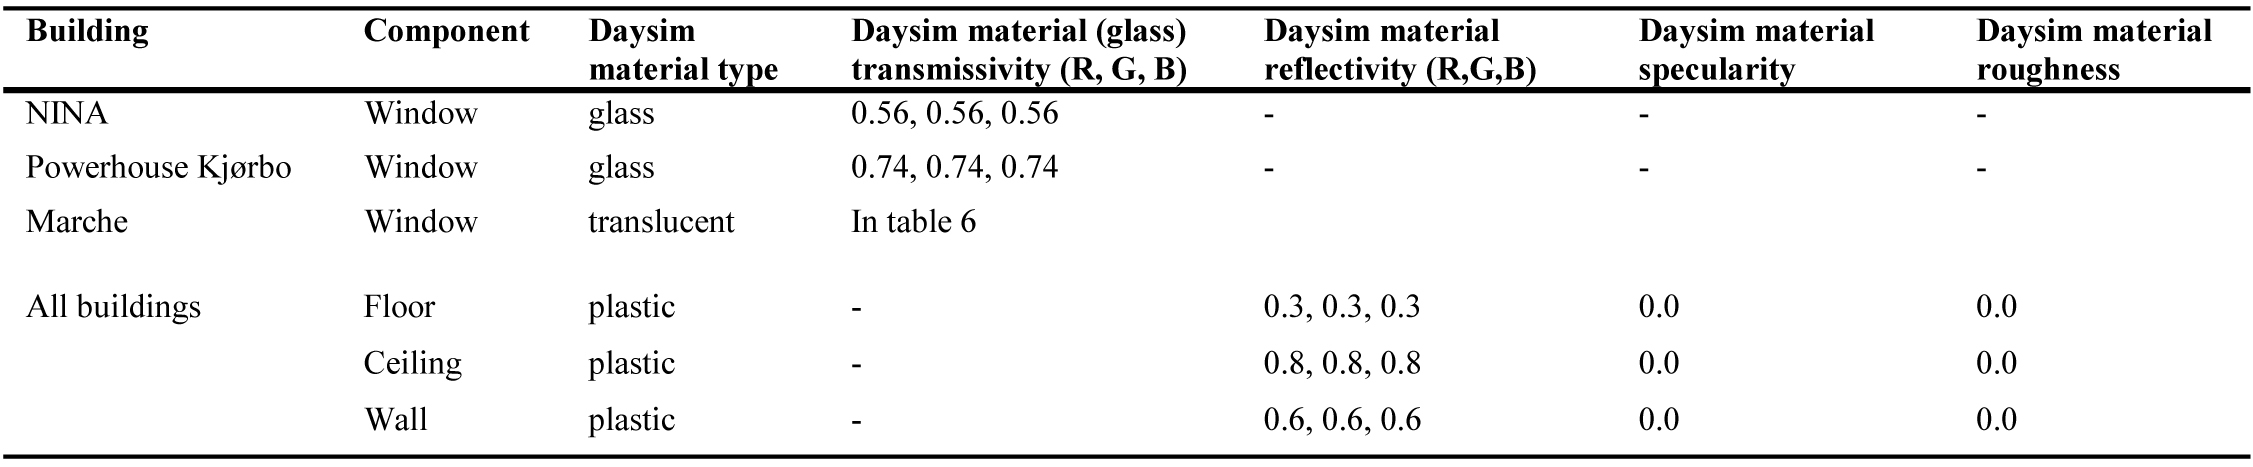
Table 4. Characteristics of the materials for the office windows and internal surfaces.
- Fixed exterior shading towards south and west
- External venetian blinds towards south and west with automatic control
- Internal, semi-transparent roller-blinds made in a metallic-like fabric
As the abutting volumes of the facades shade the glazed surfaces of the offices that are placed below, the daylight analysis is focused on the worst case scenario in terms of penetrating solar radiation. This was chosen as a single office located on the south façade with no overhangs, in order to discard the shading effect of such volumes. The window used in the NINA building consists of a three-layers-glazing unit with two low-emissivity coated 8 mm glass panes and an internal 6 mm uncoated float-glass. The cavities are 18 mm wide and filled with argon. The window is produced by Energate [54].
The second case is Powerhouse Kjørbo [55] in Sandvika west of Oslo. This is a pilot project for so-called plus-energy buildings. The office building is a renovated part of an office complex from the 1980s. The size of the retrofitted building is around 5200 m². The total energy used in operating the building is estimated to around 20 kWh/m² ABRA. It has been designed to be classified as "Outstanding", according to the BREEAM-NOR environmental certification system [56]. Each office is equipped with an external roller-screen made of fabric.
The Marche International Support Office building in Kemptthal, Switzerland, has 3‐storeys with flexible, open‐plan offices. The basic plan can be divided into smaller areas if necessary and is the same for all three stories. The offices face south, while other functions including the cafeteria face north and north‐west. It has 50 workspaces and a total heated floor area of approximately 1300 m². The building is constructed using prefabricated wood elements. Half of the southern facade is glazed with translucent GLASSXcrystal [57] elements that utilizes latent heat mainly to store and give off delayed heat into the room [36,37]. A prismatic glass has been incorporated to allow solar radiation to pass through only when the angle of radiation is low. The window produced by GlassX [57] consists of an external clear glass layer, a cavity with argon gas and a laser cut prismatic glass, a low-emissivity glass layer, a cavity with argon gas, a low-emissivity glass layer, a cavity with PCM, and an internal clear glass layer. Due to the prismatic glass in the outermost cavity and the PCM in the innermost cavity, the total visible transmittance of the window varies depending on the solar altitude angle, and if the PCM in the cavity is in solid or liquid phase. As reported by the manufacturer, when the PCM is in crystalline (solid) phase, the light transmission varies between 0.08 and 0.28. When the PCM is in liquid phase, this varies between 0.12 and 0.44. The diffuse transmission is 0.29. The total thickness of the glazing system is 86 mm. Each office in the Marche building has a glazed area, which is vertically divided by GlassX windows and triple-glazed windows.
4.2 Case building descriptions
As discussed in the background chapter, the DF and the UDI were chosen as the quantitative assessment parameter in this study. The legislative requirement for commercial buildings, like the ones studied here, is that the average DF must be higher or equal to 2%.[44] This requirement is valid for all zones used for permanent occupancy. According to [45,46] a lux level below 100 lux is not sufficing for lighting in offices, between 100 and 2000 lux gives useful and adequate daylight illuminance, and levels above 2000 lux may lead to glare and illuminance discomfort.
The daylight analysis of a representative office cell in each building have been carried out using the software DaySim 3.1e [58], which was developed by Reinhart et al. to perform annual daylight analyses of buildings [59,60]. DF distribution maps are calculated for several shading settings [40]. The external fixed shading systems are modelled by estimating their dimensions through pictures, as summarized in Table 3. The fixed external shading system is present in all the scenarios. The different scenarios of the position of the internal and external shading systems are summarized in Table 5.
Table 5
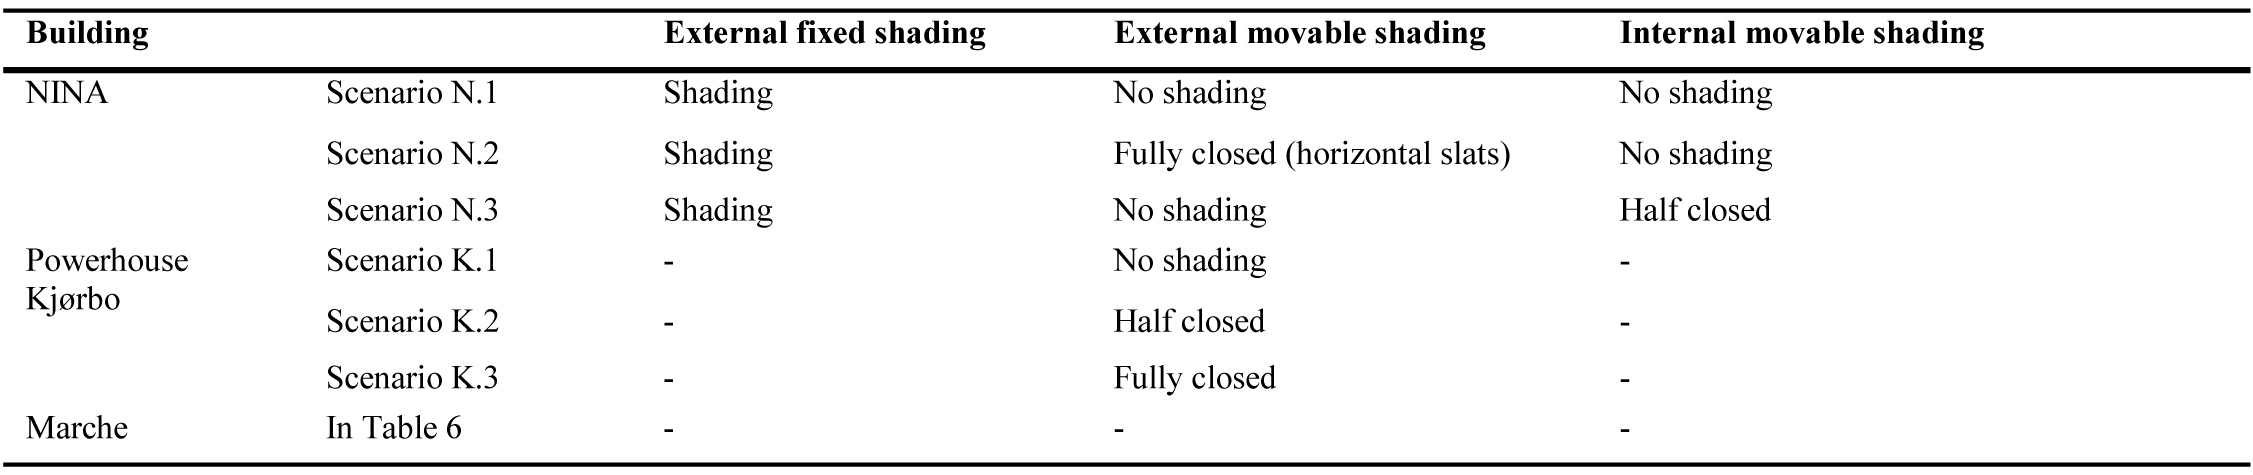
Table 5. Characteristics of the materials for the office windows and internal surfaces.
Since the complexity of the GlassX window technology and the variables (solar radiation, temperature, solar altitude) that influence its final visible transmittance, which cannot be fully described in Daysim, different scenarios were set in order to represent the different possible light transmissivities, as shown in Table 6. This resulted in the use of three scenarios. Scenario M1; the lowest light transmission of the GlassX. Scenario M2; the highest light transmission of the GlassX. Scenario 3; the average value of light transmission of scenario M1 and M2. In order to represent the diffused light transmission due to the PCM, a translucent material was used in Daysim. The column named Daysim material (translucent) transmissivity in Table 6 gives the fraction of light that pass through the material, and the column named Daysim material (translucent) transmitted specular gives the fraction of the transmitted light that is not diffused. Therefore, Scenario 1 in Table 6 is the case when the PCM is in crystalline form (max-diffused light), Scenario 2 is the case when the PCM is in liquid form (min diffused light).
Table 6
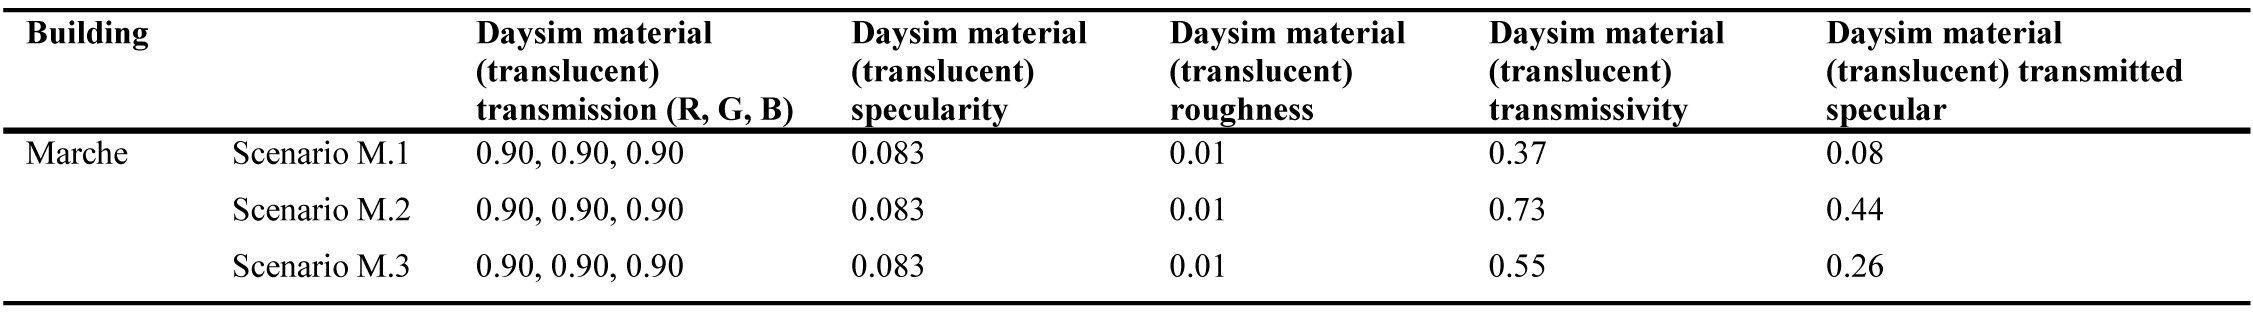
Table 6. Description of the scenarios of the visible transmittance of window in office in Marche.
The daylight analyses were performed on different office buildings where the office layout and configurations vary. Hence, the authors made the choice to model two standard office sizes to be used for the simulations in the three buildings for ease of comparison. This exclude the office geometry as a variable that influence the indoor daylight distribution and allows for a better comparison of the performance of the different glazing and shading systems. The standard office geometry is simplified as two single cubicles of the same width (3 meters) and same depths (3.5 meters). The chosen office dimensions are based on a study by Grynning et al. [40]. The optical properties of the windows are modelled using the WINDOW software [61]. The window size for all the office types is 1.9 m by 2.0 m. The properties of the modelled windows are summarized in Tables 3 and 4. The characteristics of the materials used as internal surfaces in the office models are simplified by using the default values given in Daysim (Table 2). Office furniture is not modelled. The daylight analysis was performed on a grid of sensors placed at a distance of 0.75 m from the office walls with 0.5 m spacing. The grid is placed at height 0.8 m from the floor to simulate the daylight conditions at a typical office desk height. The controllers of the shading systems, which are currently installed in the NINA office building and in the Kjørbo Powerhouse, are not modelled in Daysim, due to limitations in the software. To overcome this limitations, different scenarios of the positions of the shading systems are simulated by producing different models, which are separately simulated with the same daylight conditions. This is done to represent the different indoor daylight conditions when the shading systems are operated at different positions, as summarized in Table 5. The combinations in which both the internal and external movable shading systems are operative (only in the case of the NINA office building) are not considered, as it is assumed that when the external shading is in operation there is no need of operating the internal shading system, as shown in Table 6.
4.3 Qualitative assessments
For the NiNA-building, qualitative interviews with users of the building were conducted to capture a variety of opinions on working in this energy efficient office building. Interviews with three users of the building and one of the operating personnel were carried out. A semi‐structured interview guide was used to ensure a comparability of results. To recruit respondents, a representative for the employees, were contacted. The interviews were conducted in the office building. The building operator and three office workers and researchers participated in a group interview, lasting for about 1.5 hour. Typical questions included in the interview with the employees were related to usability and control, whether the daylight level were perceived satisfactory, and how the office workers experienced visual and thermal comfort at their work-place. Related to visual comfort the interviewees were asked how they experienced the solar shadings` influence on the view, glare and daylight level. Related to thermal comfort, questions related to the effect of the solar shading were asked. The architectural impact was also discussed.
In addition to the interviews, site inspections were conducted and available written information was reviewed. The building operator and one of the researchers guided the interviewer around in the building and explained how the systems worked, what they appreciated the most and what they disliked. During this "tour", we also met other office workers and researchers (approximately 6-7) who commented on the building, its` architecture and solar shading systems, and how this influenced their well-being and work-environment. Finally, we summed up with follow-up questions to the operator. This part of the interview included more general questions about NINA. This included the employees` and especially the building operators` involvement in the planning- and building process. Facts and details about the solar shading systems, its` pros and cons in use and operation, management and maintenance were also elaborated. How the solar shading and the adaptation to employees` comfort requirements (the disassembly of the automatic system) have influenced the energy use in the building, were also requested. Because of the relatively small number of informants, the study is exploratory rather than representative. We still claim that the multi‐method approach of interviews, site visits and document study allows for careful generalizations.
For Powerhouse Kjørbo, a questionnaire asking general questions about the perceived indoor environment in Powerhouse Kjørbo was distributed to, and answered by 104 persons as described by Guan et al. [62]. In this paper, more in-depth analyses of data related to visual comfort is analysed. Similar questions to the ones asked in the NiNA-building interview were asked. In the questionnaire, the users were asked if they were satisfied or dissatisfied with the daylight level in the office and furthermore if they were satisfied or dissatisfied with the general visual comfort in the office. They were also encouraged to give their general comments to the daylight, solar shading and visual comfort in the building to provide more anecdotal remarks useable for comparison with the NiNA-building interviews. Some corresponding results are also extracted from the master thesis of De Simone [52] for comparison. The results in the thesis are based on interviews with users of the building as described in the thesis [52].
5. Results
5.1 Results from user surveys in the NiNa building
The building owner had representatives from both operating personnel and researchers (e.g. the users of the building) partaking in the design-phase of the building already in the pre-project stage. The shading design was an integrated part of the decision-process in the pre-project stage between the architect, the energy consultant and NINA. The external shutters were deactivated already after roughly one month of operation, by adjusting the set points of the controllers so that they never engage the shading. The interviewees all said that it became too gloomy and dark and the view out are blocked as soon as the external shutters were closed. Operating personnel contribute to this apprehension by saying that they should have manual control of the external shading in order for it to be used. The building operator also says that slat-angle control would have been desirable. Today, the solution only accommodates a fully-closed or fully-open configuration. Furthermore, they are asking for more local control of shading and the possibility to fine-tune set-points for different zones of the building. As a consequence of the external shading not functioning as desired, the building owner (NINA) installed an interior roller-shade to handle glare-issues.
Shading design were (according to interviews) designed based on energy demand-reductions (e.g. lowering cooling demand) due to solar gains. Artificial light is controlled as function of available daylight.
5.1.1 Experiences from operational phase – user and operator evaluations
Interviews have been carried out with four users (e.g. office workers and researchers) as well as one representative from the operating personnel in the building. Through the interviews, daylight usability, comfort and control have been qualitatively assessed alongside a mapping of thermal comfort in the office spaces of the building.
5.1.2 General experiences
All of the interviewees said that they, in general, are quite happy with the building itself as well as the solar shading solutions used. When asked to rate them, they all gave a score between 8 and 10 on a scale from 1-10 (10 being most satisfied). Their general perception is that the offices are light, roomy and pleasant. Some even said that they get happy when going into the offices and that the physical environment have meant a lot for the improvement of the social work-environment. This opinion is acknowledged by operating personnel, who describe the building as open, light, with large rooms, architectural qualities strengthening their professional identity, as well as having a nice and welcoming atmosphere to visitors.
5.1.3 Usability and control of shading and lighting
They all have positive associations to the external fixed shading and point out that it is a vital part of the architectural expression of the building, even being part of the signature of the building. Furthermore, they all think the shading solutions are easy to use and that it works better than they had anticipated from the start (they are mentioning that the external blinds which are deactivated is not part of this view).
All users appreciate the fact that they have individual, manual control of the internal shades. However, the users point out that a solution using two internal shades (with one being sun-proof and the other being more translucent) would have been optimal. They also point out that they would have liked to have manually (individually) controllable exterior shades.
5.1.4 Visual comfort – daylight levels, glare and artificial lighting demands
The users point out that glare issues are easily handled by use of the internal roller-shades. The roller-shades were mounted after construction, initiated by the users of the building. In spite of this, one of the interviewees said that he needs to wear a cap in order to block out glare. Others say they have applied tape to the parts were there are gaps, letting in direct sun, between two shading devices. However, they all express that there are no big problems with the quality of the daylight. The visual comfort when the shading is activated is said to be good (they are basing this on the fact that they are controlling the shading themselves).
The artificial lighting is automatically controlled with daylight-level controls. The artificial lighting system is constructed in three levels; Ceiling-mounted light "buckets" for general lighting, fluorescent tubes for general and individual desk-space lighting as well as individual stand-lamps with personal control. The interviewed office-workers are all quite satisfied with both the control system of and the artificial lighting systems itself. Only operating personnel have the possibility to overrun the set-points of illuminance of artificial lighting system. The interviewees are complacent with the general quality of the visual comfort in the building.
5.1.5 Thermal comfort
The interviewees assess the external fixed shading to be sufficient to block out solar thermal radiation. One of the workers sitting close to the glazed parts of the south-facing facade points out that it can actually be too cold, even on sunny days. They all stress the fact that people have different preferences regarding which temperature levels they perceive comfortable. It must be noted that the actual energy demand for cooling of the offices are not available for comparison with the designed demand.
5.2 Thermal comfort
The interviewees assess the external fixed shading to be sufficient to block out solar thermal radiation. One of the workers sitting close to the glazed parts of the south-facing facade points out that it can actually be too cold, even on sunny days. They all stress the fact that people have different preferences regarding which temperature levels they perceive comfortable. It must be noted that the actual energy demand for cooling of the offices are not available for comparison with the designed demand.
Furthermore, it should be pointed out that users are able to open/close windows at their own well-being, and that this does not conflict with the remaining ventilation or the shading devices on the exterior. This does, however, come with a price, as the opening a window when a heating demand is present, will lead to an increased energy consumption [51].
Achieving a balance between the technical aspects of the building and the energy performance goal (no small task in itself) will necessarily be based on a number of measurements achieved by the extensive employment of sensors. However, the only real sensor for the limits of comfort is the user itself. Like the sensors to measure air quality and temperature and levels of activity within the building, the values of which command everything from when ventilation scales up or down to when lights go on and off, how can the information collected by the user-as-sensor be processed by the running-in team? PH Kjørbo provided an illustration of this. Although the solution could be considered time consuming, it is quite simple.
The general appreciation of the interviewees is that approximately 55% is satisfied to very satisfied with the visual comfort, 23% say it is acceptable, whereas 9% answer that the visual comfort is bad. About 5% answer that daylight levels are too high and correspondingly, 5% answer that daylight levels are too low. The remaining 18% did not answer. 29% of the answers indicate that the general lighting levels in the offices are too low, whereas 12% complain that the general lighting levels are too high. The interviewees were asked to answer about the general visual comfort. If that was dissatisfactory, they were asked to note when in the day that dissatisfaction was occurring; morning, mid-day, afternoon or evening. This is shown in Table 7. Some of these answers relates to the same person reporting discomfort during more than one-time interval. More people reported dissatisfaction for the specified time intervals (morning, mid-day, etc.) than who reported that they were dissatisfied with the general visual comfort in the office. Thus, it may be assumed that this perceived comfort comes from other sources than the purely visual related discomfort.
From the results of the survey, it was found that the automatic shading was used even in north-facing offices. This was, however, not necessary seen from the users’ perspective. The users complained about disturbances from the automatically operated shading. 7% (3 of 42 complain) about too much daylight, similarly 3 of 42 complain about too little daylight, as shown in Table 7. This means that the majority of the users are satisfied. Correspondingly, three persons complain about a bad visual comfort. Five persons explicitly mention the solar shading as an element they would like to be able to control manually when asked. Thirteen persons facing northeast are complaining about visual discomfort in the morning, which is probably due to the automatic shading system moving. Three persons facing north-west are complaining about visual discomfort in the afternoon, which is probably due to the automatic shading system moving. Several persons complain about glare issues. Specific comments related to the solar shading was e.g.:
"The biggest problem is automatically blending of windows at specific times each day. This is not necessary with windows facing North West!".
Table 7
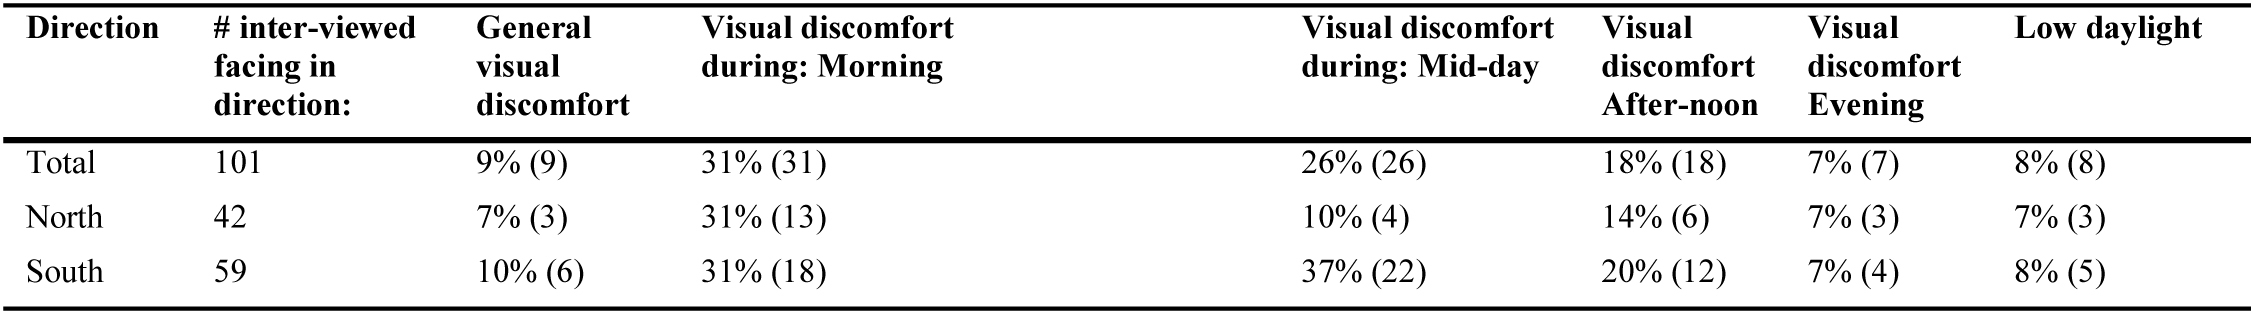
Table 7. Summary of key results of the survey at Powerhouse Kjørbo.
For the south-facing offices, 53% are saying that they are satisfied to very satisfied, 22% say it is acceptable, and approximately 10% answer that visual comfort is bad. The remaining 15% did not answer. More results are shown in Table 7. In the south facing offices, no correlation between the quality assessments of the visual comfort could be found between the ability to control the shading device and assessment level. Some are complaining about too high daylight levels (8 out of 59 in total), even though they are amongst the people who are able to adjust solar shading individually. Others are complaining about too low daylight levels (5 of 59 in total). This could be an indication of other sources of discomfort, which are not directly coupled to the visual task. This was not further investigated. Six persons are complaining about general visual discomfort. The majority are complaining about visual discomfort during morning and mid-day. This is likely due to the automatic shading system moving. Less people were complaining about too low- or high daylight levels. But several persons complain about glare issues here as well. Specific comments related to the solar shading was e.g.:
"Solar shading going up and down is sometimes disturbing, when alternating weather (sun and sky)".
Interviews carried out with some of the users in a previous publication, point out that the users generally are dissatisfied with the lighting levels in the office spaces when the shading devices are deployed [52]. The users also complain about glare and veiling-reflection issues for spaces close to the facades and that they are more prone to moving/shifting positions rather than manually activating the shading screens. Lack of manual-control of the artificial lighting alongside erroneous sensor set-up is also regarded as negative from the perspective of the users.
5.3 Results from the daylight analysis – three simulation cases
5.3.1 NiNA Daylight simulations
Figure 1 shows the calculated average DF and UDI for the office cubicle using the NiNA-building facade solution. The DF in the unshaded configuration is shown in Fig. 1(a). As one can see from the graph, the DF is at adequate levels, and the DF is close to 2% even at the far back of the room. If the exterior shading is deployed, the DF drops to close to 2% even for the area close to the façade (Fig. 1(b)). It can also be seen that approximately half of the room gets a DF lower than 2%. However, if the interior roller blind is used, higher DF were obtained even when deployed (Fig. 1(c)). The DF remains close to and slightly above 4% for the areas closest to the windows. If the interior roller is used for glare-reducing purposes and rolled half-way down, the DF stays close to 6% for the area closest to the window and is kept above 2% for a depth of approximately 0.8 m from the facade. Even so, it can be seen that the DF is lower than 2% for all scenarios using shading use from approximately 1.5 m and further back in the room. The main difference between the three scenarios with shading is that the zone adjacent to the facade has higher DF's for the ones with interior shading.
Figure 1
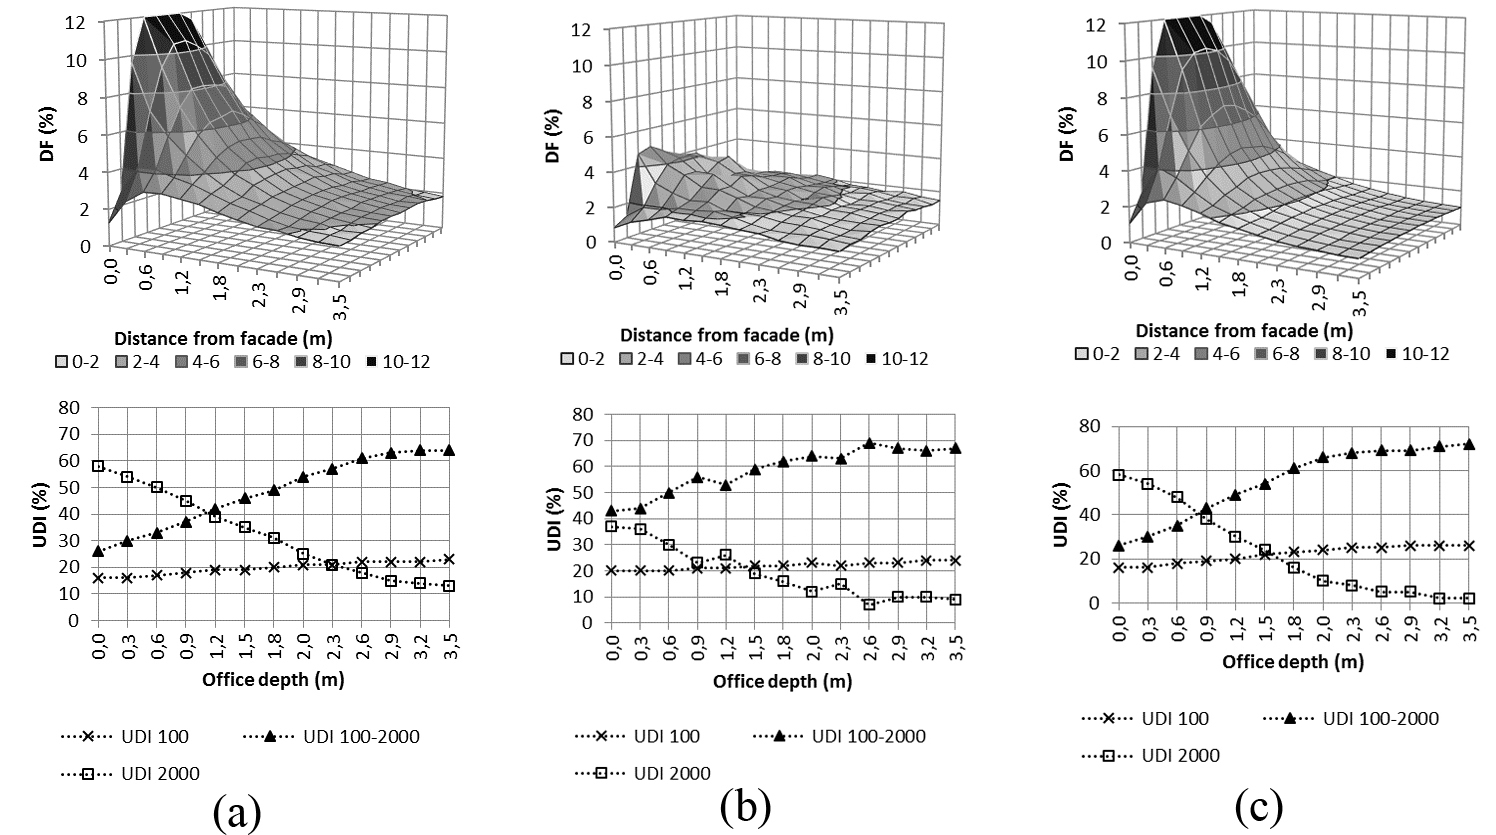
Fig. 1. DF and UDI for the simulated office cubicle with the NiNa-office shading solution. (a) Unshaded, (b) with exterior shading deployed, and (c) interior roller shade covering 50% of area.
In addition to the DF-simulations results, UDI values are shown for the central part (the centre-line running from facade to the back of the office), as shown in Fig. 1. A value of the UDI in the 100-2000 lux interval is desirable. It can be seen that the percent of the time over a whole working year when the UDI is in the 100-2000 lux interval is indeed highest in the area furthest away from the facade for the no-shading situation. Furthermore, the area closer to the facade than 1 and 2 m has UDI above 2000 lux for a longer period than between 100-2000 lux (Fig. 1(a)). For the case with the shading deployed (Fig. 1(b)) the share of time of the year with a UDI in the desirable range of 100-2000 lux is kept at between 40–70% for the entire depth of the office. The interior blind (Fig. 1(c)) gives a distribution of UDI levels which is similar to that given in scenario N1, with the difference that the internal blind allows for higher useful UDI levels in the back side of the office. Furthermore, the area in which the UDI above 2000 lux is limited to a depth of one meter from the facade.
5.3.2 Kjørbo Daylight simulations
Figure 2 shows the simulated DF for the office cubicle using the Kjørbo facade solution. As one can see from the three graphs, the DF varies greatly. The unshaded scenario has DF's well above 12% (the maximum value is 20%) close to the facade and even in the far back of the room, the DF are higher than 2%. This is also the case for the scenario with the shading half-deployed. The levels systematically drop with approximately 2% compared to the unshaded scenario. Hence the DF in the back of the room lies slightly under 2%. For the shaded scenario one can see, from the right graph, that the DF-levels drops significantly and that only a very small part close to the facade has DF's above 2%.
Figure 2
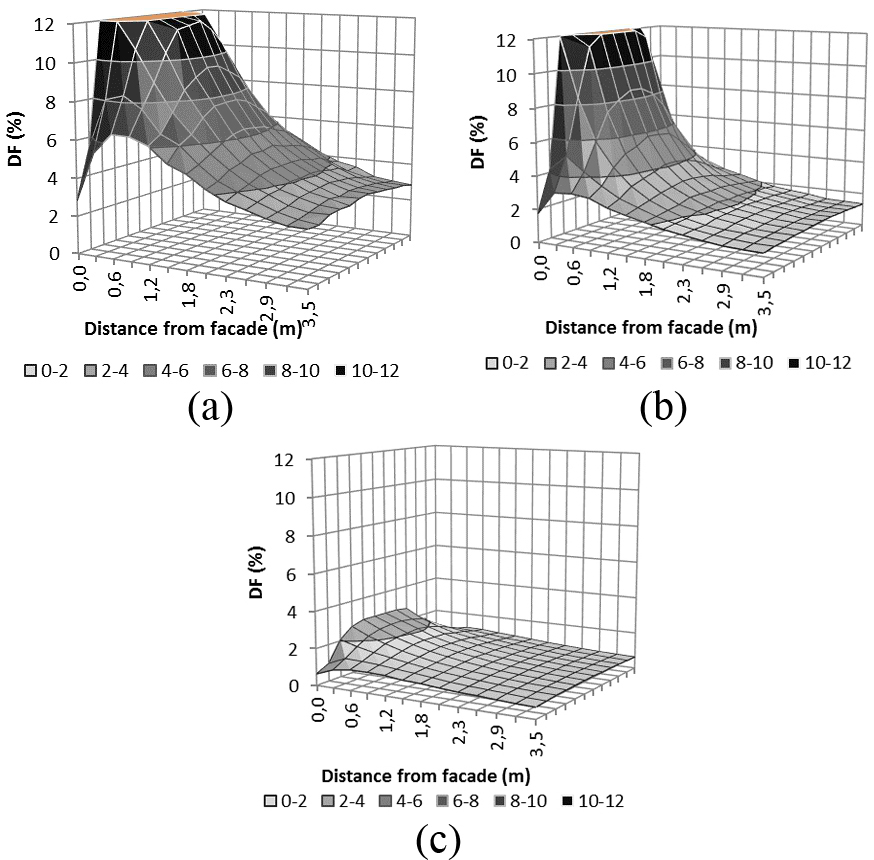
Fig. 2. Daylight Factor for the simulated office cubicle with the Kjørbo-office shading solution: (a) unshaded, (b) with exterior screen halfway-deployed, and (c) with the exterior screen completely deployed.
In addition to the DF-simulations results showed in Fig. 2, UDI values are shown for the central part (the centre-line running from facade to the back of the office), as shown in Fig. 3. A value of the UDI in the 100-2000 lux interval is desirable. The percent of the time over a whole working year when the UDI is in the 100-2000 lux interval is indeed highest in the area furthest away from the facade for the no-shading situation. Furthermore, one can see that the area closer to the facade than 1,5 m, has UDI above 2000 lux for a longer period of time than between 100-2000 lux. For the case with the shading deployed the share of time of the year with a UDI in the desirable range of 100-2000 lux is kept at between 60–70% for the entire depth of the office.
Correspondingly, one sees that the calculated UDI is in the unfavourable interval (above 2000 lux) for a longer period of time than the favourable (100–2000 lux) interval, at 1.5 m or less than that from the facade. This indicates that glare issues are likely to be present. For the scenario with the shading deployed, the period-of-time with UDI in the favourable interval is approximately 60% for the entire depth of the office.
Figure 3
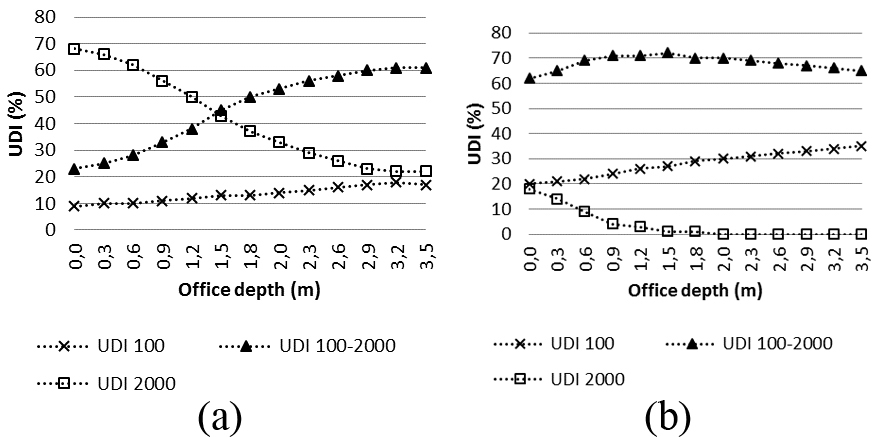
Fig. 3. UDI for the simulated office cubicle with the Kjørbo-office shading solution: (a) unshaded and (b) with the exterior screen completely deployed.
Calculating the UDI-values during different periods of day for a south facing facade, yielded results, as shown in Fig. 4. One can observe that the time with the highest amount of time in the favourable range (100–2000 lux) is before 11:00. The most unfavourable conditions, with too high UDI-levels (above 2000 lux) are found to be between 11:00-14:00 closely followed by the period after 14:00. Most of the complaints from the users were centred in the morning and mid-afternoon of the day.
Figure 4
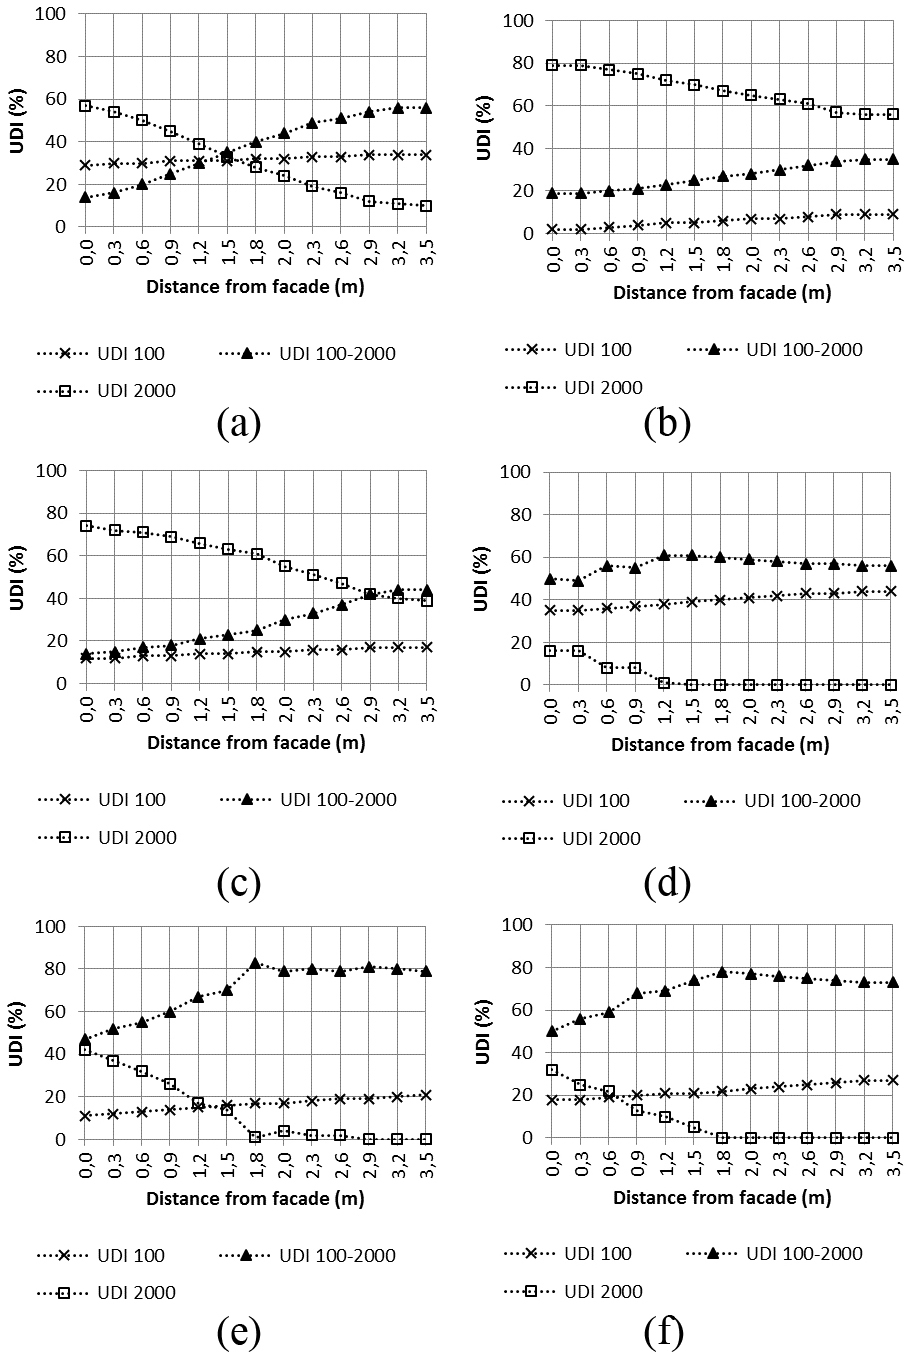
Fig. 4. UDI for the simulated south-facing office cubicle with the Kjørbo-office shading solution for (a) morning (8:00-11:00), (b) mid-day (11:00-14:00), and (c) afternoon (14:00-17:00). (a-c) Unshaded and (d-f) with the exterior screen completely deployed.
5.3.2 Marchè Daylight simulations
Figure 5 shows the simulated DF for the office cubicle using the Marche facade solution. From Figs. 5(a) and (c), it can be seen that the DF is highly dependent as to which phase the PCM is in. The M1 scenario (Figs. 5(a) and (d)) shows that DF values for the PCM in liquid state are substantially higher than those for the scenario M2 (Figs. 5(b) and (e)) with the PCM in solid state. If one includes the glazed (e.g. the normal 3-pane window) part of the facade in the assessment, as in the scenario M3 (Figs. 5(c) and (f)), one sees that the DF increase in the areas close to the facade compared to a situation with only the GlassX system. The difference gets less pronounced the further back in the room one moves.
Figure 5
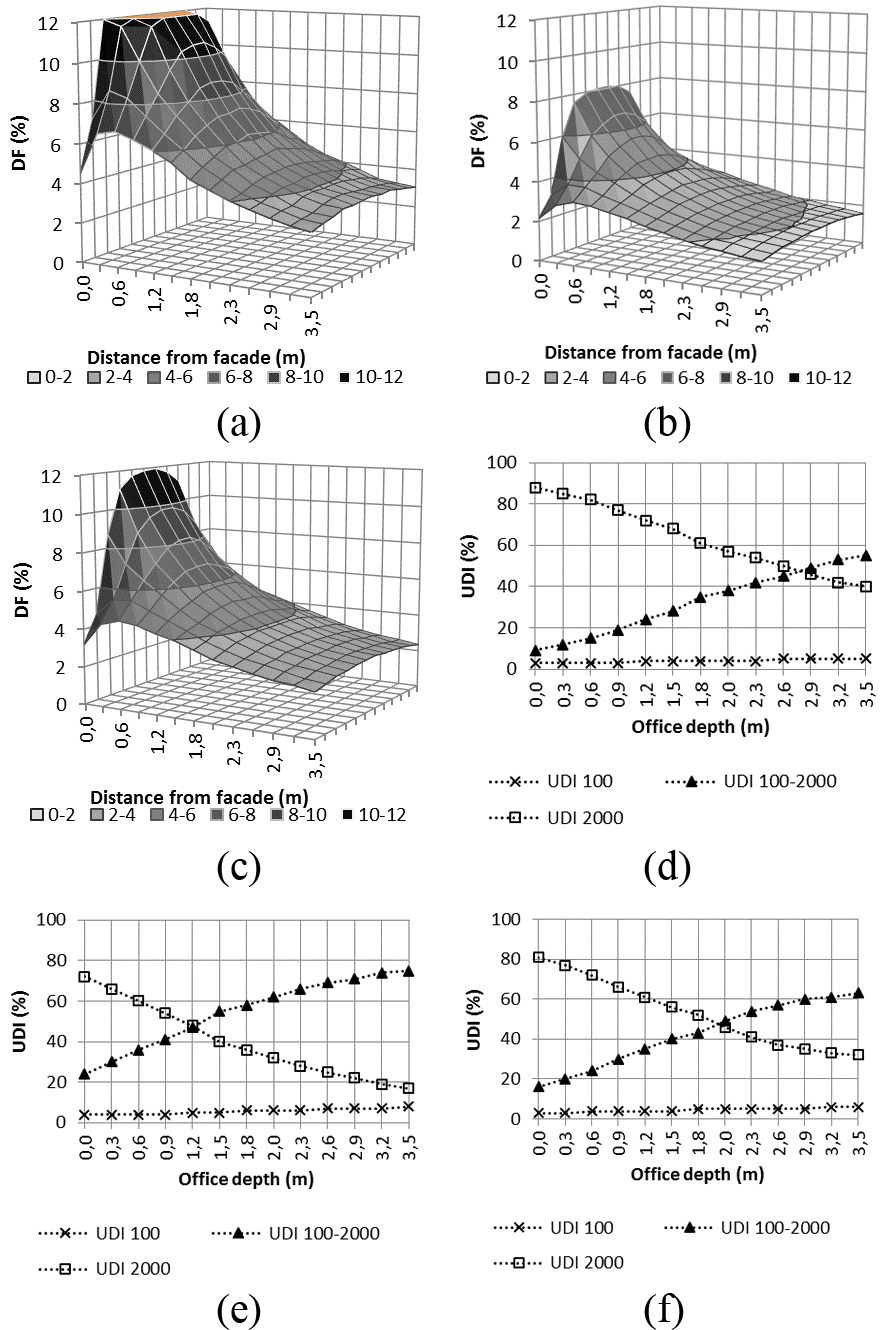
Fig. 5. (a-c) DF and (d-f) UDI for the simulated office cubicle with the Marchè shading solution; (a,d) maximum DF of the GlassX system, (b,e) the minimum DF of the GlassX system, and (c,f) the average of the (a,d) and (b,e) cases for the GlassX system.
In addition to the DF-simulations results showed in Fig. 5, UDI values are also shown for the central part (the centre-line running from facade to the back of the office). A value of the UDI in the 100-2000 lux interval is desirable. The percent of the time during a whole working year when the UDI is in the 100-2000 lux interval is indeed highest in the area furthest away from the facade for all configurations. Furthermore, the area at a distance from the facade less than 2,9 m (M1), 1,2 m (M2), 2,0 m (M3), and 1,8 m has UDI values above 2000 lux for a larger period of time than those falling between 100-2000 lux.
6. Discussion
Possibly the first observation one makes when looking at the simulation results for the three cases, is that the maximum DF of the NiNA building is much lower than for the other two cases. This is mainly caused by the non-moveable building integrated shading units used in the NiNA building which blocks some of the visible sky from the facades. However, the calculated average DF in the simulated room shows that the absolute values are high enough to satisfy regulations and what is commonly appreciated to be a sufficient daylight level. From Figs. 1, 2, and 5, the difference between maximum and minimum values are much smaller for the NiNA office, thus giving a more homogeneous daylight-distribution in the office than the other two cases. Large differences in daylight levels can have a negative impact on the perceived visual comfort in a room. This correlates to the answers from the users of the office spaces in the actual buildings. In general, the NiNA-users are showing a higher degree of satisfaction with the daylight availability and quality than in the other buildings.
For the NiNA building system, it was found that all shading systems/positions give satisfactory DFs in the simulated office spaces. However, users complain about blocked view and disturbances from the exterior automated shading system. This is problems not directly linked to the DF, but relates to the design of the shading devices. The UDI results showed that the useful illuminance is adequate for large part of the office depth by either using the external shading or the internal blind. In this last solution, the area of the office closest to the facade (up to 1 m depth) showed high illuminance levels (above 2000 lux). It may be concluded, therefore, that in the NINA building is the lack of manual control of the shading system and the blocked view that lead the users to opt for an alternative solution. It must be noted that the external fixed shading system is helpful in avoiding high illuminance levels next to the window.
For the Kjørbo case, simulations show that there are satisfactory DF's in the simulated office space. This is confirmed by the user survey, where there are very few complaints about too low daylight levels. The UDI results showed that in the back side of the office the illuminance level may be too low when the shading is deployed, as shown in Fig. 3. However, the simulations have shown that there is large difference in daylight distribution (varying DF) which might lead to contrast-issues and visual discomfort, as shown in Fig. 2. This is confirmed by the answers from the user survey where there are several complaints about glare and visual discomfort. Furthermore, the UDI-values show that daylight levels are too high (above 2000 lux) during large parts of the day if the shading is not properly running, as shown in Fig. 4, and this confirms the interviewees statements. Specifically, in the Kjørbo case, the UDI levels are too high in the middle and second part of the working day, if the shading is not deployed. By fully deploying the shading device, the useful illuminance levels (100-2000 lux) are at least 40% of the occupied working time for the full depth of the office. However, in the first part of the day (between 8 and 11), the fraction of UDI below 100 lux is also high (almost 40% constant for the full depth of the office), suggesting a too dim daylight condition in the office. Therefore, the only satisfactory daylight illuminance is reached if the shading is fully deployed in the middle and second part of the working day, as shown in Fig. 4. The high illuminance levels reached when the shading system is up, suggest that the lack of a fixed external shading device, allow too much solar radiation entering the office space. Therefore, the solution for getting satisfactory daylight illuminance levels is to deploy the shading system, which leads to discomfort issues due to lack of view and automatic control. The implementation of a shading solution similar to the one installed in the NINA office building (external fixed shading and internal manually controlled blinds) may produce a higher level of satisfaction in this building users.
Simulations carried out for the the Marchè-system show similar results for the distribution of daylight and the lack of manual and individual control of shading devices.
7. Conclusions
It was found that automatic moveable shading is regarded as a source of discomfort by users in modern office buildings. This is due to the lack of manual override possibilities and disturbances due to the system moving up and down (survey in Kjørbo). In one of the offices, the users disabled the exterior shading system. It was disabled due to the same issues as in Kjørbo and because of the users lack of view outside. However, the external fixed shading and the internal manually operated roller blinds were found to be satisfactory. Further, large differences in daylight level distribution can lead to perceived visual discomfort by users.
The results from a previous study show that the users in the Marche building are in general satisfied with the daylight. One of the main reasons for this is, according to the users, that they to a large degree have manual control of the shading system. Manual control of the shading systems is preferred by users of the modern office buildings studied. Daylight simulations show that the external fixed shading system combined with internal shading gives satisfactory DFs and an even distribution of the daylight levels in a south-facing office. According to the users, external fixed shading is a good system for south facing offices when local glare issues can be solved by interior roller shades.
The DF gives information of the daylight distribution which in certain cases might be adequate. However, it is not enough as a descriptor for user comfort. This is caused by the fact that other factors such as manual control possibilities and glare discomfort is not included. High DFs alone, does not ensure a good visual environment. Simulations of UDI show that this often are associated with too high daylight levels (more than 2000 lux) in areas close to the facades in the offices studied.
The results of the study should be compared to measured and designed cooling and heating demand to get a better understanding of how the user behaviour and user perception are correlated. In addition, there are limitations in the study that should be expanded with detailed glare assessments in order to get a better understanding about this coupling in assessment techniques. Further assessments coupling surveys and detailed glare analyses should also be carried out to investigate this correspondence.
Acknowledgements
This work has been supported by the Research Council of Norway and several partners through the SINTEF and NTNU research project “The Research Centre on Zero Emission Buildings” (www.ZEB.no). We also like to acknowledge the informants working at NiNA, Powerhouse Kjørbo and Marché International for sharing their user experiences.
Contributions
All authors contributed equally.
References
- NS, NS 3701:2012 Criteria for passive houses and low energy houses - Non-residential buildings. 2012, Norsk Standard.
- T. Kristjansdottir, H. Fjeldheim, E. Selvig, B. Risholt, B. Time, L. Georges, T.H. Dokka, J.S. Bourelle, R. Bohne, and Z. Cervenka, A Norwegian ZEB-definition embodied emission. 2014.
- A.J. Marszal, P. Heiselberg, J.S. Bourrelle, E. Musall, K. Voss, I. Sartori, and A. Napolitano, Zero Energy Building – A review of definitions and calculation methodologies, Energy and Buildings 43 (2011) 971-979. http://dx.doi.org/10.1016/j.enbuild.2010.12.022
- Igor Sartori, Assunta Napolitano, Karsten Voss, Net zero energy buildings: A consistent definition framework, Energy and Buildings 48 (2012) 220-232. http://dx.doi.org/10.1016/j.enbuild.2012.01.032
- F. Goia, Dynamic Building Envelope Components and nearly Zero Energy Buildings - Theroetical and experimental analysis of concepts, systems and technologies for an adaptive building skin - PhD thesis, in Faculty of Architecture and Fine Art, Department of Energy. 2013, Norwegian Univeristy of Science and Technolgy, Polytechnic University Turin.
- F.V. Winther, Intelligent Glazed Facades - PhD thesis, in Department of Civil Engineering. 2012, Aalborg University.
- H. Poirazis, Å. Blomsterberg, and M. Wall, Energy simulations for glazed office buildings in Sweden, Energy and Buildings 40 (2008) 1161-1170. http://dx.doi.org/10.1016/j.enbuild.2007.10.011
- H. Bülow-Hübe, Energy-Efficient Window Systems - Effects on Energy Use and Daylight in Buildings - PhD-thesis, in Department of Construction and Architecture. 2001, Lund, Stockholm.
- M.-C. Dubois and Å. Blomsterberg, Energy saving potential and strategies for electric lighting in future North European, low energy office buildings: A literature review, Energy and Buildings 43 (2011) 2572-2582. http://dx.doi.org/10.1016/j.enbuild.2011.07.001
- S. Grynning, Transparent facades in low energy office buildings - Numerical simulations and experimental studies, in Faculty of Architecture and Fine Art 2015, Norwegian University of Science and Technology: Trondheim.
- H. Poirazis, Single Skin Glazed Office Buildings Energy Use and Indoor Climate Simulations, in Report EBD-T--05/4, Lund Institute of Technology, 2005, Lund.
- C. E. Ochoa, M. B.C. Aries, E. J. van Loenen, and J. L.M. Hensen, Considerations on design optimization criteria for windows providing low energy consumption and high visual comfort, Applied Energy 95 (2012) 238-245. http://dx.doi.org/10.1016/j.apenergy.2012.02.042
- L. Karlsen, P. Heiselberg, and I. Bryn, Occupant satisfaction with two blind control strategies: Slats closed and slats in cut-off position, Solar Energy 115 (2015) 166-179. http://dx.doi.org/10.1016/j.solener.2015.02.031
- A. R. Webb, Considerations for lighting in the built environment: Non-visual effects of light, Energy and Buildings 38 (2006) 721-727. http://dx.doi.org/10.1016/j.enbuild.2006.03.004
- Y. Sutter, D. Dumortier, and M. Fontoynont, The use of shading systems in VDU task offices: A pilot study, Energy and Buildings 38 (2006) 780-789. http://dx.doi.org/10.1016/j.enbuild.2006.03.010
- C.F. Reinhart and K. Voss, Monitoring manual control of electric lighting and blinds, NRC-CNRC, Editor. 2003, National Research Council Canada.
- E. Vine, E. Lee, R. Clear, D. DiBartolomeo, S. Selkowitz, Office worker response to an automated Venetian blind and electric lighting system: a pilot study, Energy and Buildings 28 (1998) 205-218. http://dx.doi.org/10.1016/S0378-7788(98)00023-1
- A. D. Galasiu and J. A. Veitch, Occupant preferences and satisfaction with the luminous environment and control systems in daylit offices: a literature review, Energy and Buildings 38 (2006) 728-742. http://dx.doi.org/10.1016/j.enbuild.2006.03.001
- A. D. Galasiu and J. A. Veitch, Occupant preferences and satisfaction with the luminous environment and control systems in daylit offices: a literature review, Energy and Buildings 38 (2006) 728-742. http://dx.doi.org/10.1016/j.enbuild.2006.03.001
- R. Hobday, The Light Revolution. Findhorn Press, ed. Architecture and the Sun Health. 2006.
- B. Matusiak, What daylight factor do not tell. 2012.
- C.M. Paredes, Daylighting and Architectural Quality: Aesthetic Perception of Daylit Indoor Environments. 2016: NTNU.
- S.T. Rassia and P.M. Pardalos, Sustainable Environmental Design in Architecture: Impacts on Health. 2012, New York, NY: Springer New York.
- S. Wågø, B. Hauge, and E. Støa, Between indoor and outdoor. Norwegian perceptions of well-being in energy efficient housing. Journal of Architectural and Planning Research (accepted for publication), 2016.
- B. Cold, A. Kolstad, and S. Larssæther, Aesthetics, well-being and health : abstracts on theoretical and empirical research within environmental aesthetics. 1998, Oslo: Norsk form.
- G. Böhme, Architektur und Atmosphäre. 2006, München: Fink Verlag.
- C. A. Charles, Perspective: Casting light on sleep deficiency. Nature 497 (2013) S13. http://dx.doi.org/10.1038/497S13a
- M. Smolensky and L. Lamberg, The body clock guide to better health : how to use your bodys natural clock to fight illness and achieve maximum health. 2000, New York: H. Holt.
- U. Berardi and H. Khademi Anaraki, The benefits of light shelves over the daylight illuminance in office buildings in Toronto, Indoor and Built Environment, 2016.
- H. Arnesen, T. Kolås, and B. Matusiak, A guide to dayligthting and solar shading systems at high latitude, in ZEB Project report. 2011.
- A. Laouadi, Guidelines for Effective Residential Solar Shading Devices, in IRC-RR-300. 2010.
- J.L.J Rosenfeld, W.J Platzer, H van Dijk, A Maccari, Modelling the optical and thermal properties of complex glazing: overview of recent developments, Solar Energy 69 (2001) 1-13. http://dx.doi.org/10.1016/S0038-092X(01)00028-7
- S. Grynning, C. Misiopecki, S. Uvsløkk, B. Time, and A. Gustavsen, Thermal performance of in-between shading systems in multilayer glazing units: Hot-box measurements and numerical simulations. Journal of Building Physics 39 (2015) 147-169. http://dx.doi.org/10.1177%2F1744259114559924
- R. Baetens, B. Petter Jelle, and A. Gustavsen, Properties, requirements and possibilities of smart windows for dynamic daylight and solar energy control in buildings: A state-of-the-art review, Solar Energy Materials and Solar Cells 94 (2010) 87-105. http://dx.doi.org/10.1016/j.solmat.2009.08.021
- H Manz, P.W Egolf, P Suter, A Goetzberger, TIM–PCM external wall system for solar space heating and daylighting, Solar Energy 61 (1997) 369-379. http://dx.doi.org/10.1016/S0038-092X(97)00086-8
- S. Grynning, F. Goia, E. Rognvik, and B. Time, Possibilities for characterization of a PCM window system using large scale measurements, International Journal of Sustainable Built Environment 2 (2013) 56-64. http://dx.doi.org/10.1016/j.ijsbe.2013.09.003
- S. Grynning, F. Goia, and B. Time, Dynamic Thermal Performance of a PCM Window System: Characterization Using Large Scale Measurements, Energy Procedia 78 (2015) 85-90. http://dx.doi.org/10.1016/j.egypro.2015.11.119
- F. Guarino, A. Athienitis, M. Cellura, and D. Bastien, PCM thermal storage design in buildings: Experimental studies and applications to solaria in cold climates, Applied Energy 185 (2017) 95-106. http://dx.doi.org/10.1016/j.apenergy.2016.10.046
- A. de Gracia, L. Navarro, A. Castell, Á. Ruiz-Pardo, S. Alvárez, and L.F. Cabeza, Experimental study of a ventilated facade with PCM during winter period, Energy and Buildings, 58 (2013) 324-332. http://dx.doi.org/10.1016/j.enbuild.2012.10.026
- S. Grynning, B. Time, and B. Matusiak, Solar shading control strategies in cold climates – Heating, cooling demand and daylight availability in office spaces, Solar Energy 107 (2014) 182-194. http://dx.doi.org/10.1016/j.solener.2014.06.007
- I. Acosta, C. Munoz, M.A. Campano, and J. Navarro, Analysis of daylight factors and energy saving allowed by windows under overcast sky conditions, Renewable Energy 77 (2015) 194-207. http://dx.doi.org/10.1016/j.renene.2014.12.017
- J.V. Thue, Bygningsfysikk - grunnlag. 2014: Norges teknisk-naturvitenskapelige universitet, Akademika forlag.
- D. H.W. Li, A review of daylight illuminance determinations and energy implications, Applied Energy 87 (2010) 2109-2118. http://dx.doi.org/10.1016/j.apenergy.2010.03.004
- TEK, Technical Regulations to the Norwegian Building Regulations, "Forskrift om tekniske krav til byggverk (Byggteknisk forskrift)". 2010.
- A. Nabil and J. Mardaljevic, Useful daylight illuminance: a new paradigm for assessing daylight in buildings. Lighting Research and Technology 37 (2005) 41-57. http://dx.doi.org/10.1191%2F1365782805li128oa
- A. Nabil and J. Mardaljevic, Useful daylight illuminances: A replacement for daylight factors, Energy and Buildings 38 (2006) 905-913. http://dx.doi.org/10.1016/j.enbuild.2006.03.013
- S. Carlucci, F. Causone, F. De Rosa, and L. Pagliano, A review of indices for assessing visual comfort with a view to their use in optimization processes to support building integrated design, Renewable and Sustainable Energy Reviews 47 (2015) 1016-1033. http://dx.doi.org/10.1016/j.rser.2015.03.062
- J.-H. Kim, K.-W. Yang, Y.-J. Park, K.-H. Lee, M.-S. Yeo, and K.-W. Kim. An Experimental Study for the evaluation of the environmental performance by the application of the autamoated venetian blind. in Clima 2007 WellBeing Indoors. 2007.
- M. V. Nielsen, S. Svendsen, and L. B. Jensen, Quantifying the potential of automated dynamic solar shading in office buildings through integrated simulations of energy and daylight, Solar Energy 85 (2011) 757-768. http://dx.doi.org/10.1016/j.solener.2011.01.010
- J. Thomsen, Å.L. Hauge, K. Denizou, Sidsel Jerkø, S. Wågø, and T. Berker, User evaluations of energy efficient buildings - The interplay of buildings and users in seven European case studies, in ZEB Report. 2011.
- W. Throndsen, T. Berker, and E.B. Knol, Powerhouse Kjørbo. Evaluation of construction process and early use phase, in ZEB Project report, SINTEF, Editor. 2015.
- S.D. Simone, Daylight in Zero Energy Office Buildings. 2015, Politecnico Di Torino.
- WAN-awards. Wood in architecture winner 2013. Viewed: 07 December 2015. Available at: http://backstage.worldarchitecturenews.com/wanawards/project/nina-norwegian-institute-for-nature-research/?source=sector&selection=all.
- Energate. Viewed: 09 December 2015, Available at: www.energate.com.
- M. Tyholt, T.H. Dokka, and B. Jenssen. Powerhouse Kjørbo: a plus-energy renovation office building project in Norway. in Passivhus Norden 2013. 2013. Gøteborg, Sweden.
- N.G.B. Council. BREEAM Green Certification. Viewed: 2016, Available at: http://ngbc.no/breeam-nor.
- GlassX. GlassX homepage. Viewed: 07 May 2012, Available at: http://glassx.ch/fileadmin/pdf/Broschuere_komplett_online.pdf.
- Daysim. [cited 2015 09.12]; Available from: www.daysim.ning.com.
- D. Bourgeois, C.F. Reinhart, and G. Ward, Standard daylight coefficient model for dynamic daylighting simulations, Building Research & Information 36 (2008) 68-82. http://dx.doi.org/10.1080/09613210701446325
- C.F. Reinhart, Tutorial on the Use of Daysim Simulations for Sustainable Design in April 28, 2010, Harvard University, Editor. 2010.
- LBNL. WINDOW 7.1 beta. Viewed: 06 August 2013, Available at: http://windows.lbl.gov/software/window/window.html.
- J. Guan, M.J. Alonso, and H.M. Mathisen. Questionnaire study of indoor environment in two office buildings in Norway: one ordinary renovated and the other highly energy efficient renovated. in Indoor Air 2016. Ghent, Belgium.
Copyright © 2017 The Author(s). Published by solarlits.com.

2685
Total views
Citations
SHARE ON


