Article Outline
Figures and tables
Volume 5 Issue 1 > pp. 1-14 • doi: 10.15627/jd.2018.1
Impact of Furniture Layout on Indoor Daylighting Performance in Existing Residential Buildings in Malaysia
Author affiliations
a Department of Architecture, Faculty of Built Environment, Universiti Teknologi Malaysia, Skudai, 81300, Johor, Malaysia
b Pusat Kajian Alam Bina Melayu (KALAM), Institute for Smart Infrastructure and Innovative Construction (ISIIC), Faculty of Built Environment (FAB), Universiti Teknologi Malaysia (UTM)
* Corresponding author. Tel.: +60 183550570
malitak87@gmail.com (S. M. Mousavi)
tareef@utm.my (T. H. Khan)
limyaikwah@gmail.com (L. Y. Wah)
History: Received 18 October 2017 | Revised 22 December 2017 | Accepted 27 December 2017 | Published online 8 January 2018
Copyright: © 2018 The Author(s). Published by solarlits.com. This is an open access article under the CC BY license (http://creativecommons.org/licenses/by/4.0/).
Citation: Seyed Mohammad Mousavi, Tareef Hayat Khan, Yaik-Wah Lim, Impact of Furniture Layout on Indoor Daylighting Performance in Existing Residential Buildings in Malaysia, Journal of Daylighting 5 (2018) 1-13. http://dx.doi.org/10.15627/jd.2018.1
Figures and tables
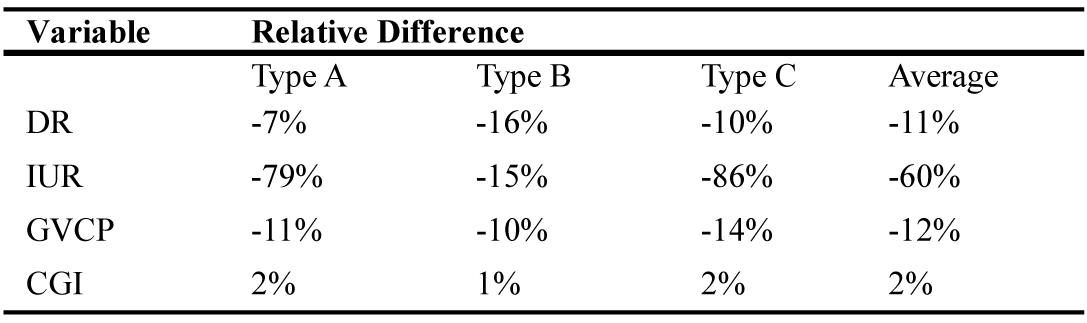 Table 6
Abstract
Currently, home-based computing workspaces have developed substantially all over the world, especially in Malaysia. This growing trend attracts computer workers to run a business from their residential units. Hence, visual comfort needs to be considered in addition to thermal comfort for home workers in their residential working rooms. While such rooms are always occupied with furniture, the layout of the furniture may influence the indoor daylighting distribution. Several various furniture layouts can be arranged in a residential working room. However, to have better generalisation, this study focused on the impacts of mostly-used-furniture-layouts (MUFLs) on indoor daylighting performance in residential working rooms. The field measurement was conducted in a typically furnished room under a tropical sky to validate the results of the simulation software under different sky conditions. Then, daylight ratio (DR), as a quantitative daylighting variable, and the illuminance uniformity ratio (IUR), CIE glare index (CGI), and Guth visual comfort probability (GVCP), as qualitative daylighting variables, were analysed through simulation experiments. In conclusion, by changing the furniture layout, daylight uniformity recorded the highest fluctuations in the case room among all variables. While various furniture layouts, in a residential working room in the tropics, may even slightly reduce the extreme indoor daylight quantity, they can worsen the indoor daylight quality compared to an unfurnished space. The paper shows that furniture as an interior design parameter cannot help to improve tropical daylighting performance in a building.
Keywords
Illuminance, Glare, Tropical climate, Visual comfort
1. Introduction
In recent years, people prefer to work from their home for many reasons, such as saving time, increasing productivity and flexibility, reducing commuting and facilities costs, independence, etc. Hence, the prospect of residential offices has obtained a reputation over the years [1,2]. The fast development of communications technology and computer capabilities was the main reason for the increase of home-based offices. Hence, this trend has increased in parallel with the rapid development of technology [3]. Home-based office has been recently focused by the government in Malaysia to encourage the citizens to work from their residential units [4]. A recent survey in several residential buildings in Malaysia [5] shows that most of the occupants (approximately 70%) carried out computer-related tasks in addition to other household tasks in their residential units during the daytime (9 am to 5 pm). Overall, desk-related tasks (reading, writing, and computing) are frequently done by workers in their residential working rooms during the daytime. Based on the Green Building Index (GBI) for residential buildings, daylighting is a major criterion under the category of indoor environmental quality since a quarter of the total points is devoted to daylighting [6]. Thus, considering visual comfort in residential buildings is as significant as providing visual comfort for workers in office buildings. While previous daylighting studies in Malaysia merely focused on office buildings, this study investigates daylight distribution in existing residential buildings.
Daylighting is a significant passive design strategy, especially for reducing energy consumption in buildings [7-10]. Based on previous studies [11-16], efficient design of daylighting can substantially provide a healthy indoor environment, energy savings in terms of lighting, and preferable visual comfort for the residents. In the tropics, daylight always brings more heat compared to electric lighting. Daylighting is a major design strategy that needs to be implemented in buildings by architects at the beginning design stages [17]. Daylighting is essential to be utilized for building design in tropical areas due to severe sunlight penetration, changeable formation of clouds within a minute, and high external illuminance [18-20]. Previous research studies in tropical climates argue that external illuminance under the tropical skies could be as big as 140000 lux [21,22]. Zain-Ahmed, Sopian [12] indicates that minimum 10% energy could be saved through implementing daylighting strategies in buildings under tropical skies. Recent studies investigated passive design parameters that can influence daylight distribution in a building, such as the colour of the external façade [23], window-to-wall ratio [24], window glazing [25], external obstructions [26], window orientation [27], atrium [28,29], self-shading strategy [30], automated solar shading [31,32], light pipe [33,34], etc. These strategies should be implemented in buildings at the preliminary stages of design. However, end users are unable to retrofit those fixed parameters after occupancy in their houses, but they can alter interior design parameters, such as the internal shading device, furniture, etc. Previous studies [35-37] explain different internal shading devices that can considerably influence indoor daylight performance. This study focused on the impacts of furniture - as a typical interior design element- on indoor daylighting performance in residential buildings.
Furniture has a great influence on daylighting efficiency in buildings through reflecting or shading solar light [11]. Indoor environmental qualities, in terms of thermal and visual comfort, may be changed through different arrangements of furniture in buildings [38]. A study by Dubois [11] shows that by inserting furniture in a room in temperate climates, the difference of illuminance levels between a furnished and an unfurnished room can remarkably fluctuate by 35%. Every arrangement of furniture makes a specific light distribution; therefore, furniture can obviously influence indoor illuminance level [39]. Thus, it is essential to investigate the impact of furniture on daylighting as the physical surfaces and masses may considerably affect indoor daylight distribution. In order to accurately simulate daylighting condition in a residential working room, it is important to consider suitable furniture arrangements. Since a wide range of various furniture arrangements can be existed, it is improper to consider a casual layout as the representative for all the others. On the other hand, it is infeasible to consider all the available furniture layouts in a residential working room for analysis of indoor daylight level. For this reason, furniture has been mostly overlooked in previous studies on daylight simulation experiments in buildings under a tropical sky. Thus, in this paper, typologies of mostly used furniture layout (MUFL) in residential working rooms should be employed to have better generalization on furniture.
A questionnaire survey on furniture arrangements in working rooms was conducted by Mousavi, Khan [5] in 11 residential buildings in Johor Bahru, Malaysia. As desk-related tasks had the highest usage among home workers and the focus of this research is on such activities in a working room, typologies of MUFL were determined based on different locations of a desk in a typical working room (Fig. 1). Accordingly, three locations were frequently selected by home workers to place a desk in their working room (along a wall at the window, along a wall opposite the window, and along sidewalls). Among the typologies of furniture layout, plan A had the highest usage by respondents. The location of other possible furniture was determined based on their most selected position in the working room. For example, as shown in Fig. 1(a), when the location of a desk is near the sidewalls, a bed was frequently positioned near the window wall; a drawer was mostly positioned near the rear wall, while a bookshelf and a storage cabinet were often located near the sidewalls. For the remainder of the study, these three typologies of MUFL were considered for daylight simulation experiments in the case room.
Figure 1
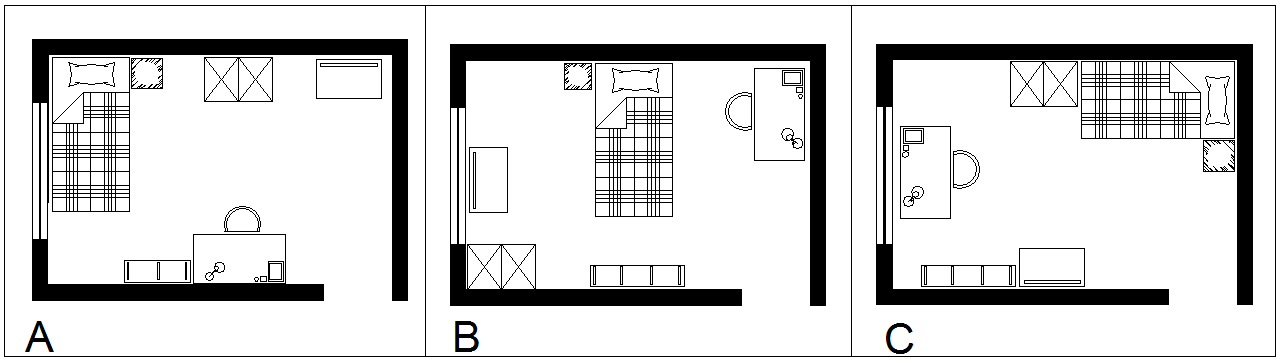
Fig. 1. Typologies of MUFL in the residential buildings in Johor Bahru.
In summary, due to the rapid development of home-based computing workspaces in Malaysia, it was essential to improve indoor visual comfort in existing residential buildings, which constituted a vast majority of building types in main urban regions in Malaysia. Beside office buildings, visual comfort and daylighting design should be considered in existing residential buildings. Although the furniture was overlooked in previous daylighting studies in tropical areas, this study focused on furniture as an important interior design element affecting indoor daylight distribution. Thus, this paper aimed to show the impact of the furniture layout on the qualitative and quantitative performance of tropical daylight in the existing residential buildings in Malaysia.
2. Materials and methods
This paper employed the Radiance simulation program in the IES-VE software (Integrated Environmental Solution-Virtual Environment) to investigate daylight performance in a typical residential working room with different furniture layouts. IES-VE is a multi-functional simulation software that can be applied to energy analysis and green buildings from the beginning design stages [40]. IES-VE can efficiently simulate daylight conditions in a building through the Radiance-IES simulation engine. Previous research showed that the Radiance-IES is the most comprehensive daylight simulation engine, compared with several daylight simulation programs, to measure quantitative and also qualitative performances of daylight in buildings [41]. Several studies on daylighting for tropical regions also used the Radiance-IES program [24,40,42,43].
2.1. Empirical validation of radiance-IES under a tropical sky through field measurement
According to previous studies, the condition of tropical skies is substantially different from the CIE (International Commission on Illumination) sky used by the Radiance-IES program. Hence, the validity of using static CIE sky models for daylight simulation analysis under a dynamic tropical sky is arguable [21,44]. Thus, before running the daylight simulation tests, an actual field measurement of daylight should be taken under the Malaysian tropical sky in order to validate the simulated results. Field measurement as a most reliable method can be conducted to accurately evaluate the indoor daylight condition [45].
2.1.1. Specifications of the test room
As this study focused on furniture, a furnished room was selected for the daylight measurement. The test room was located at UTM (Universiti Teknologi Malaysia), Johor, Malaysia. Through ‘ModelIT’ and ‘Components’ programs in IES-VE 2014, the furnished test room was modelled with the same specifications, as shown in Fig. 2(a). Figure 2(b-c) illustrates the room’s geometry.
To model the furnished test room accurately in the simulation software, it was essential to regenerate different real conditions [46]. Hence, before doing simulation experiments, the reflectance values of interior surfaces and furniture in the test room were required to be accurately determined. Due to the lack of a luminance metre, there was a limitation in measuring the surfaces reflectance precisely. However, a digital lux metre was employed to estimate reflectance values of all the physical surfaces in the test room. Hence, the lux metre measured the incident light moving to a surface (E1) and the reflected light coming from that surface (E2). It should be noted that the distance of illuminance sensors from all the studied surfaces was approximately 2.3” in both conditions [47]. Equation (1) demonstrates the value of the surface reflectance. Table 1 represents the colour and measured reflectance values of various surfaces in the test room.
Figure 2
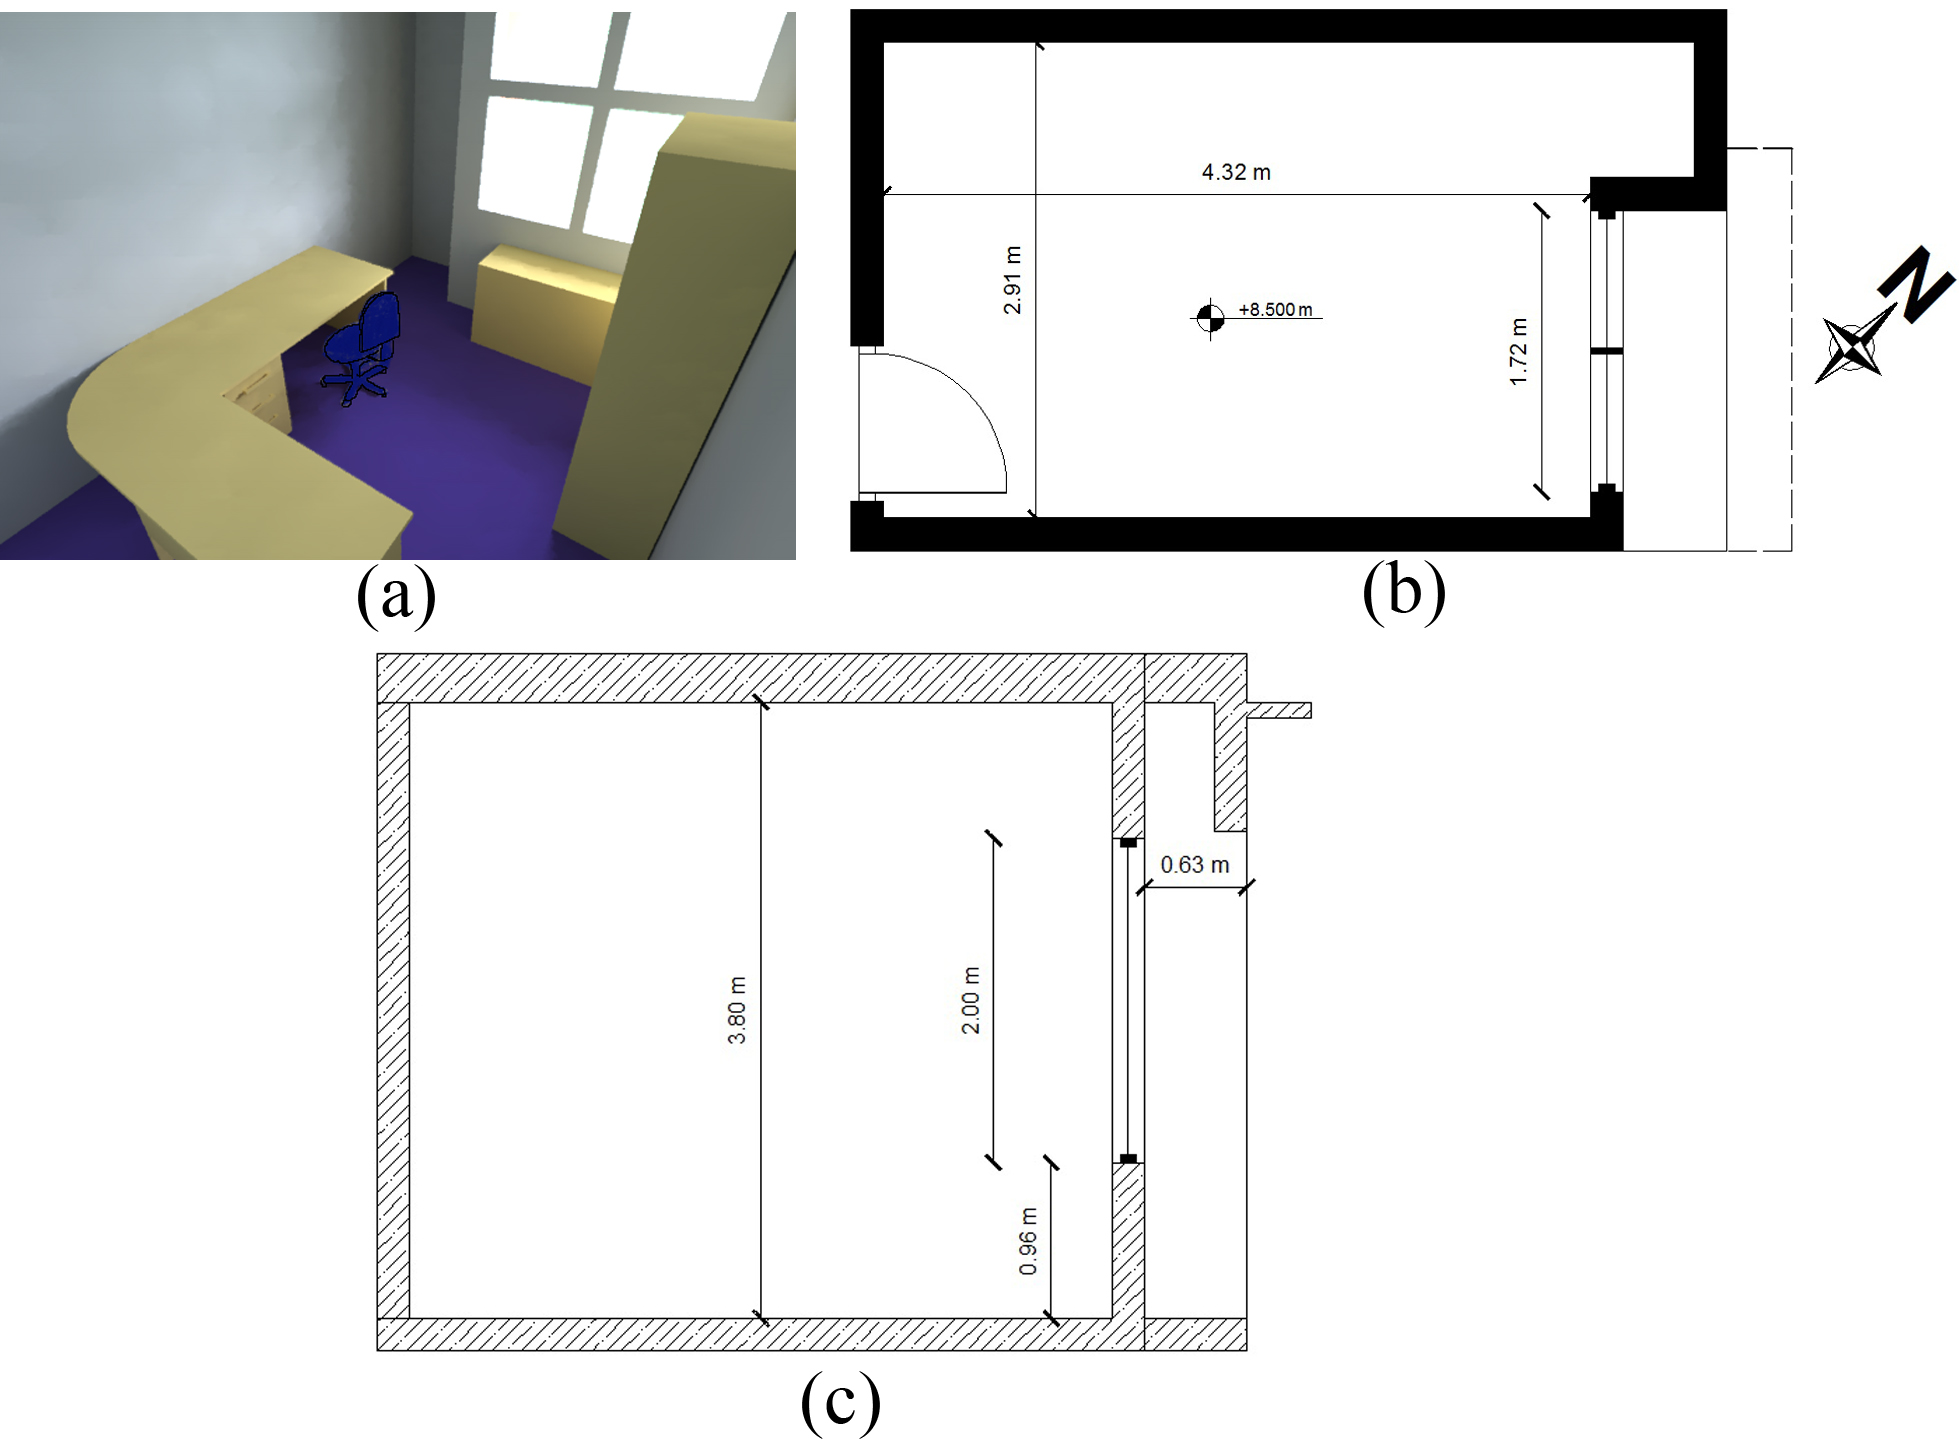
Fig. 2. (a) Simulated model of the furnished test room by IES-VE-2014, (b) section, and (c) plan of test room configuration.
Table 1
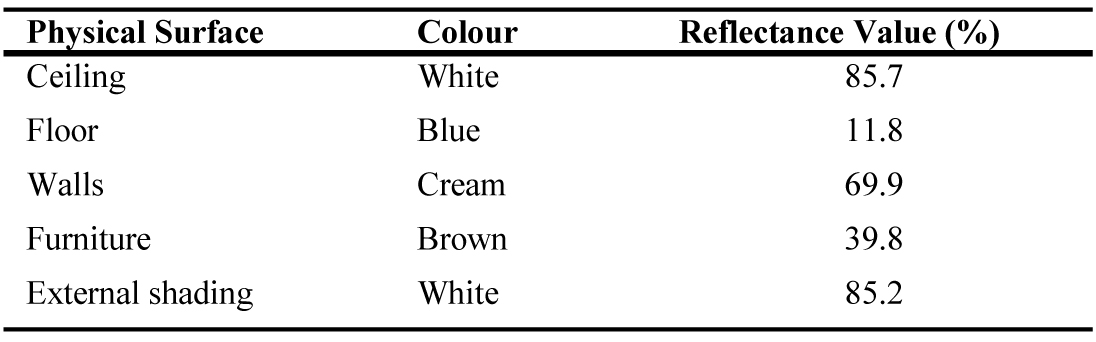
Table 1. Specifications of the studied surfaces in the room.
2.1.2. Experiment setting
As shown in Fig. 3, three positions, P1, P2, and P3, were determined at the work plane height (75 cm) in the test room to calculate work plane illuminance (WPI), and a position was specified on the building’s roof to measure outdoor illuminance (E0). An LP-471-PHOT Probe was employed to calculate the WPI values, a Photo-Radiometer Delta-OHM-HD-2012.2 was applied as the data logger, a Delta-OHM-HD35EDL as the wireless data logger, and a Delta-OHM-LP-PHOT 02 lux metre was employed to measure outdoor illuminance values. Prior to measuring daylight in the test room, calibration test of the instruments was done on the day before performing the field measurement to assess the accuracy and error of all the required equipment compared with one another (Fig. 4).
Figure 3
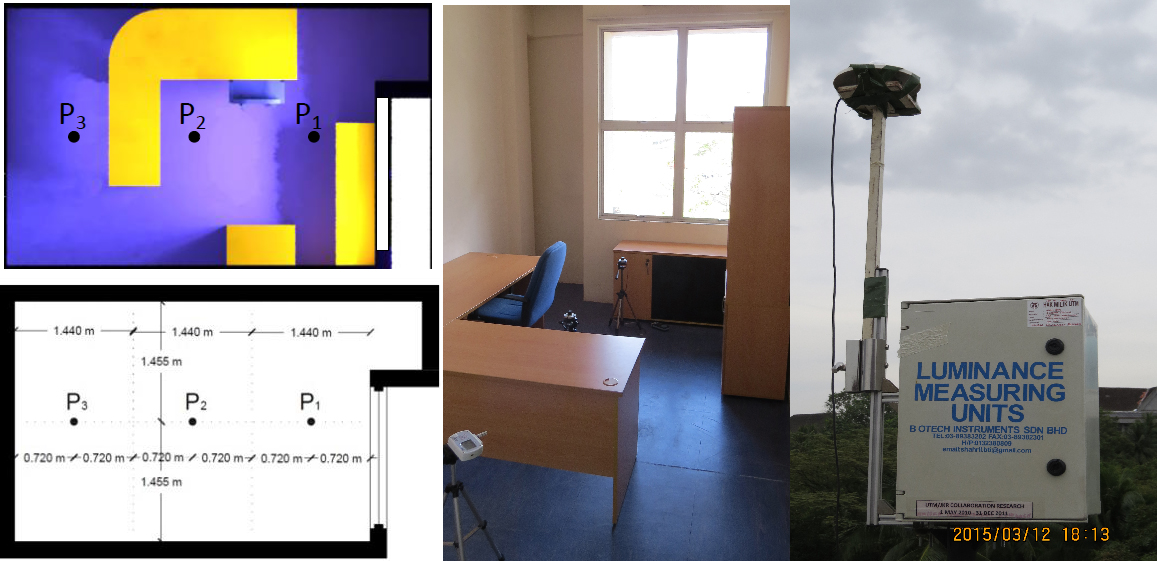
Fig. 3. Position of internal and external illuminance sensors in the furnished test room.
Figure 4
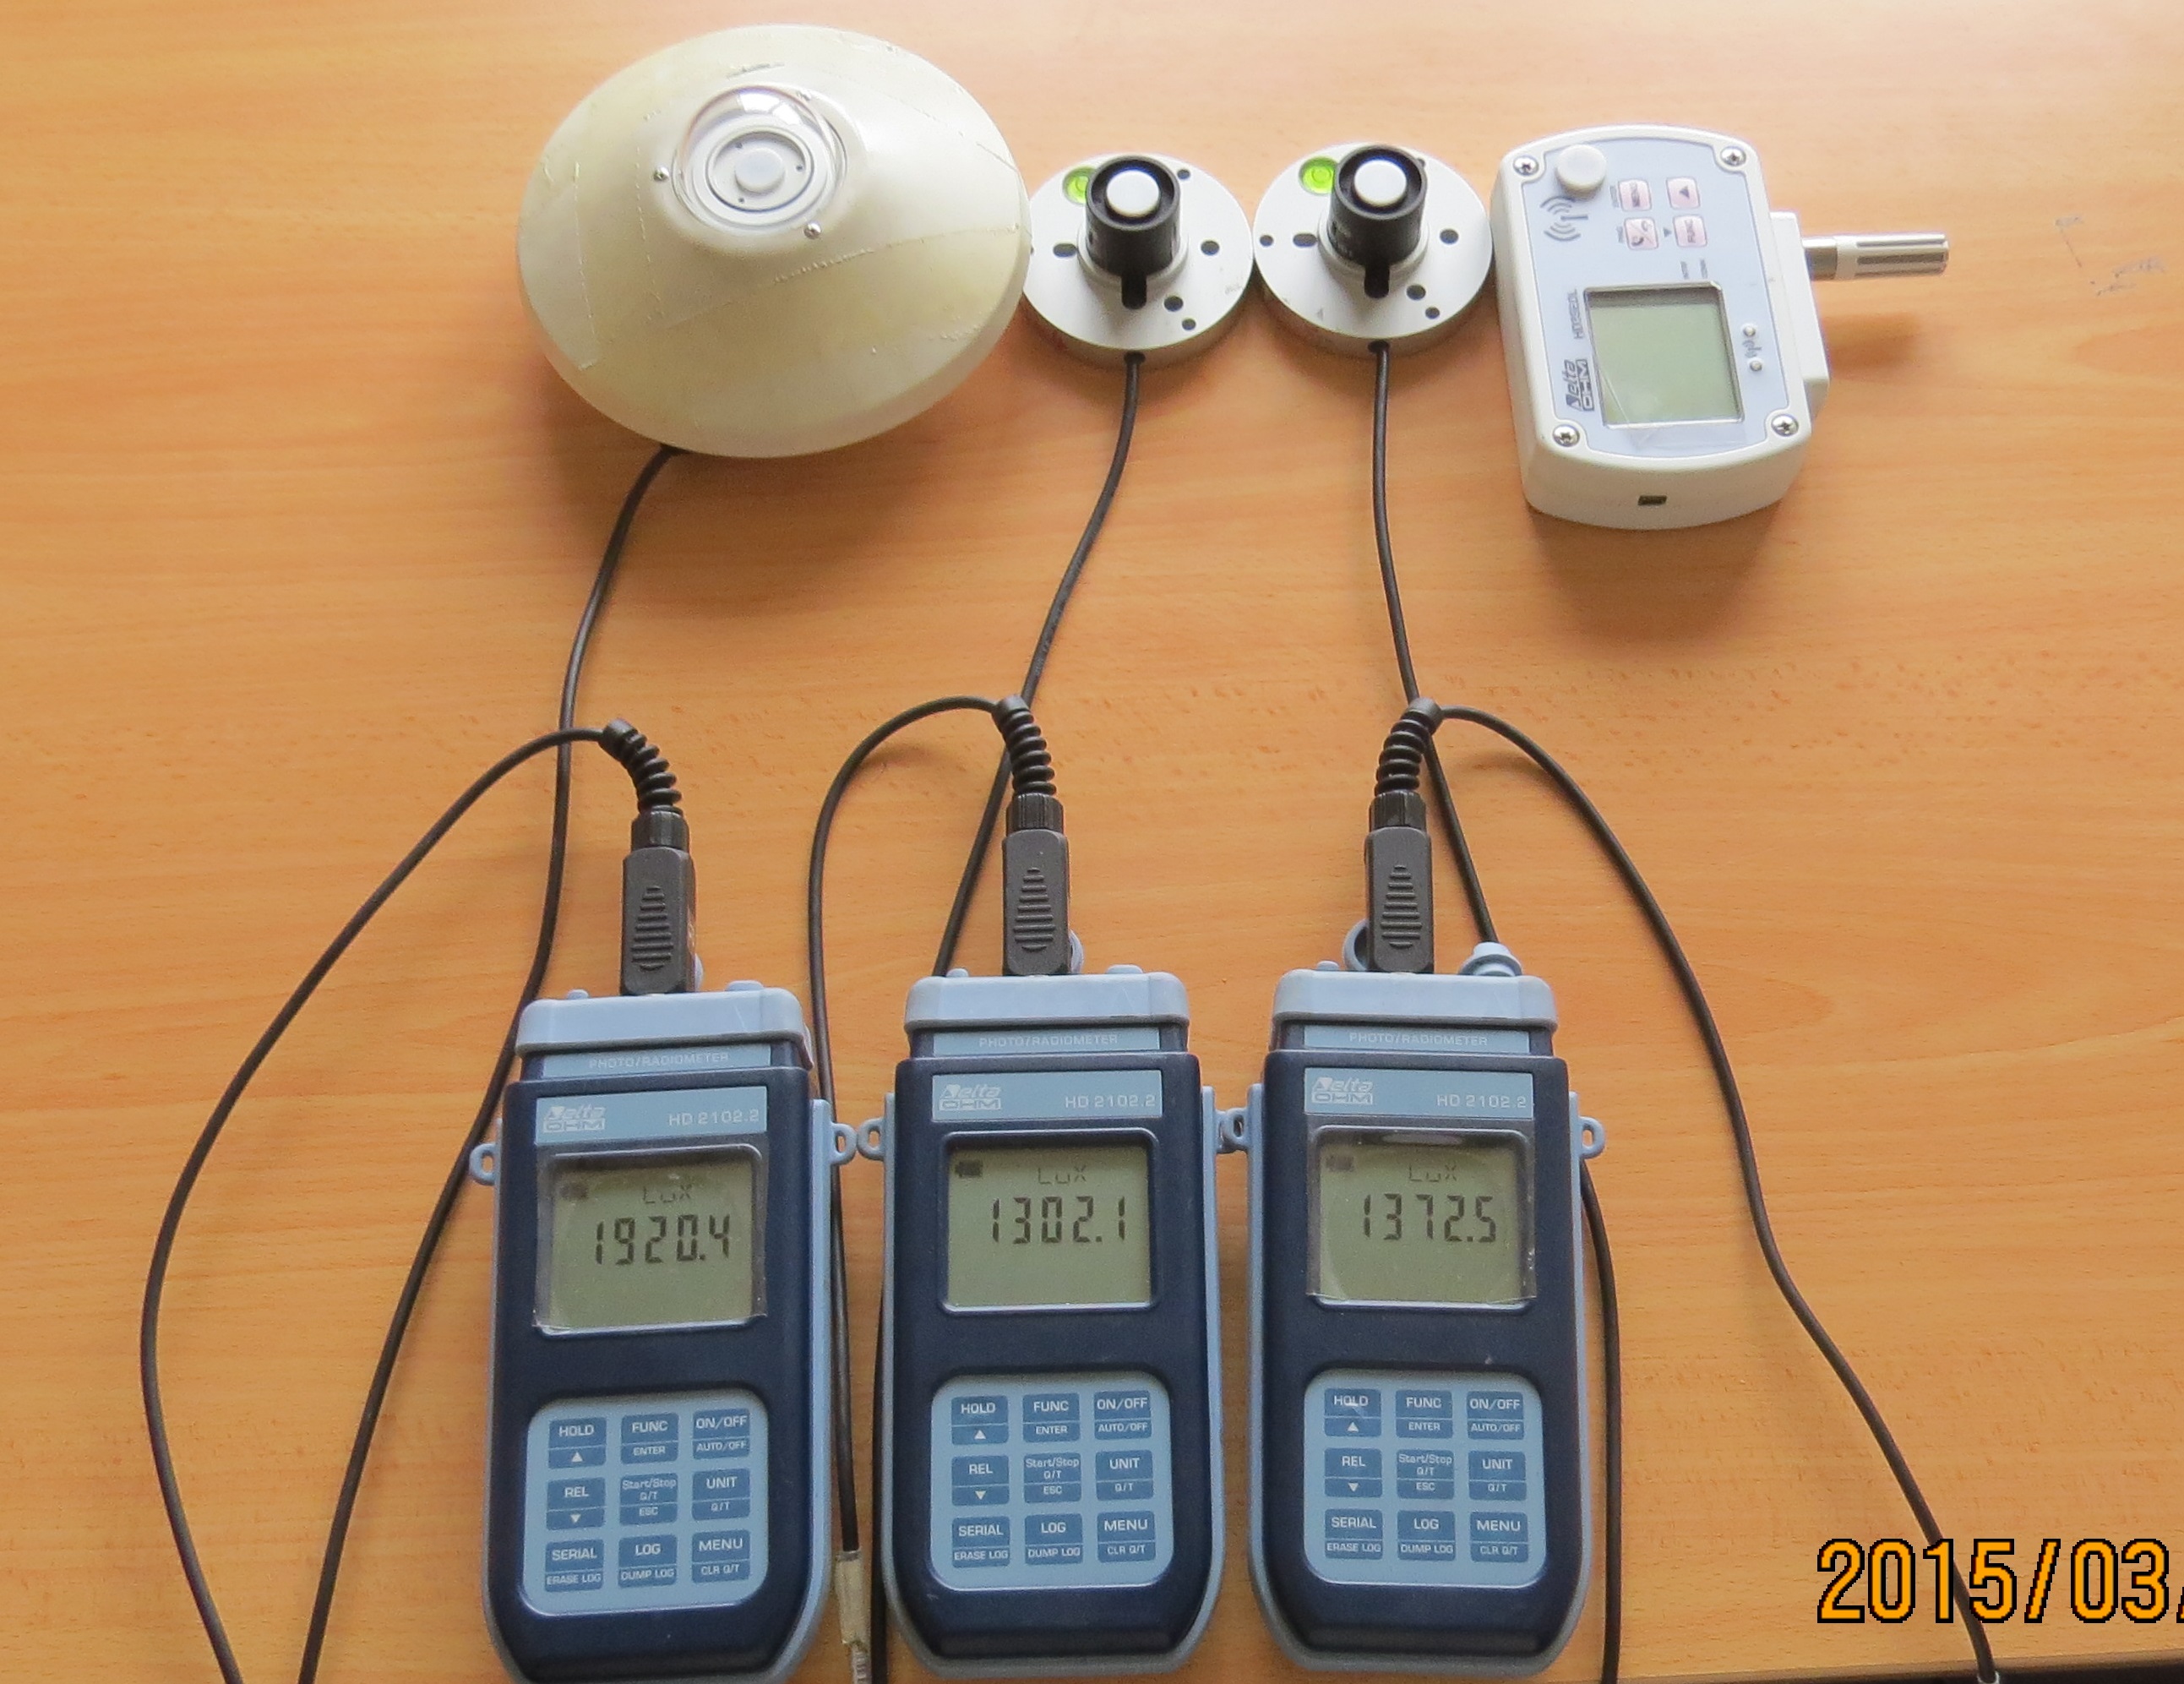
Fig. 4. Assessing the precision of the needed instruments through the calibration test.
2.1.3. Procedures of the experiment and simulation
The measurements were carried out in the furnished test room from 10 am to 6 pm during a four-day period (3-6 March 2015). The time interval of taking measurements was five minutes, while the time required for running daylight simulation experiments was an hour since it was impractical and far from the scope of this paper to set the time interval to 5 minutes for the simulation experiments. However, the average value of the measured results for each hour, which included 12 recordings, was compared with the simulated record for the equivalent hour. According to the data obtained from the Meteorology Station of Johor Bahru [48], the weather history for each hour was determined to record the tropical sky conditions during the field measurement. In addition, conditions of the sky were also recorded by a Fisheye camera for each hour during the measurement. By comparison of the photos recorded by a Fisheye camera and also the data collected from the Meteorology Station, the sky conditions during the field measurement were determined. Table 2 summarizes the conditions of the measurement and simulation in the furnished test room.
Some daylighting performance indicators were employed in this paper for the empirical validation of daylighting indices in Radiance-IES under the Malaysian tropical climate. WPI was employed to compare the measured illuminance values with the simulated ones at the three internal positions. E0, as the external illuminance, was employed to evaluate the difference between the CIE sky and the tropical sky under various conditions (overcast and intermediate). Daylight ratio (DR) and daylight factor (DF), as shown in Eq. (2), are both specified as the ratio of WPI values to E0 values on a horizontal surface [49]. Since the tropical sky is extremely dynamic, E0 is usually up to 20 klux for an overcast sky, while this value is usually greater than 20 klux for an intermediate sky; DR and DF are representatives of intermediate and overcast skies, respectively.
Table 2

Table 2. Summary of the measurement and simulation procedures of daylight in the furnished room.
2.2. Simulation of MUFLs with Radiance-IES
2.2.1. Procedures of the experiment and simulation
The standardized configuration of a typical working room (Fig. 5) with the three typologies of MUFLs (Fig. 1) in the existing residential buildings in Johor Bahru was modelled through the ‘Model Builder’ application in the IES-VE software. For generalisation purposes, a case room with only one window was assumed without any external shading devices. The surface reflectance of the case room was adjusted based on the average reflectance of the interior surfaces of residences obtained from the guidelines [50,51]. Accordingly, surface reflectance values of 70%, 50%, and 20% were assigned to the ceiling, walls, and floor, respectively. Furniture specifications in terms of type, material and colour were determined based on a social survey conducted in residential buildings in Johor Bahru [5]. However, the reflectance values of furniture surfaces were determined based on the adjusted colour for the selected furniture [52], as shown in Table 3.
Figure 5
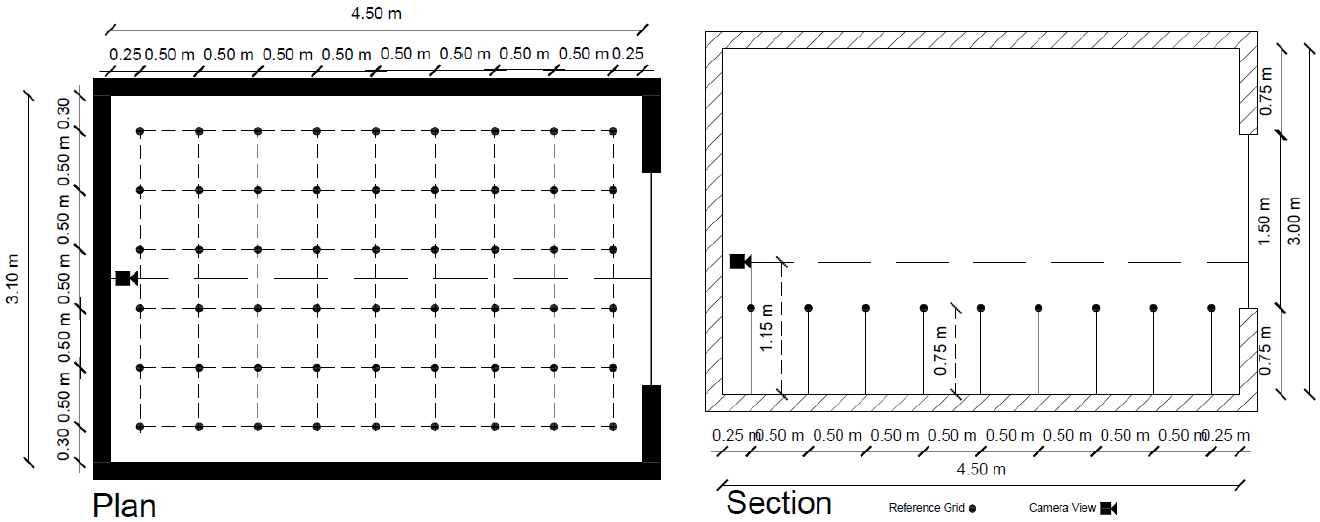
Fig. 5. Location of the reference points and camera in the case room.
Table 3
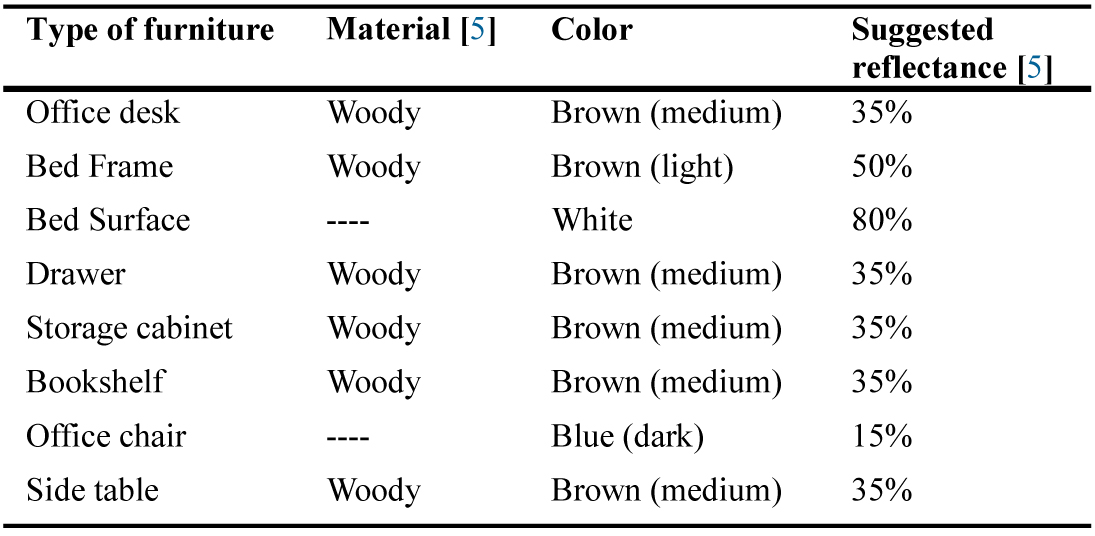
Table 3. Specifications of furniture modelled in the case room.
2.2.2. Simulation procedure
Previous daylighting studies in the tropics clarified that intermediate sky is the predominant sky type (approximately 86% time of a year) in the Malaysian tropical climate [21,22]. Accordingly, an intermediate sky was used for the simulation experiments. For a better generalisation, the cardinal orientations (N, S, E, W) were used in this paper. The selected dates and times for the simulation experiments indicated the critical and diverse position of the sun during the solstices and the equinoxes.
‘Illuminance-WP-data’ and ‘Luminance’ images in the Radiance-IES program were simulated to demonstrate the indoor daylight performance for different conditions. In this case, a reference grid for illuminance metrics and a camera for luminance metrics were determined. To create illuminance-related images, the reference grid was placed at the work plane height. There can be many viewing directions depending on the sitting positions in the case room; however, to generate luminance images, only 1 camera was placed at a 115 cm height above the floor (eye line in a sitting status on an office chair) towards the window since the main source of glare is from the window. In addition, the camera was placed near the back wall to show the effects of all the available furniture in the case room on indoor daylight performance. Figure 5 illustrates the configuration of case room, reference points, and the camera for the daylight simulation tests.
2.2.3. Simulation outputs
To evaluate indoor daylighting performance in the case room, some criteria related to illuminance and luminance need to be analysed. The DR and WPI uniformity ratio (IUR), as illuminance-related indicators, were simulated with ‘Illuminance WP data’ in the Radiance-IES program. DR was employed for a quantitative analysis to evaluate daylight utilization in the residential working room under intermediate the sky. DR is used to calculate daylight levels for areas near to the Equator [20,43]. IUR was used to assess daylight distribution qualitatively (Eq. (3)); therefore, a higher IUR means better distribution of daylight. However, a lower IUR represents non-uniform distribution of daylight in a building causing visual discomfort and glare. There are several luminance-related indices to evaluate glare condition in a building. However, daylighting qualitative indicators of CIE glare index (CGI) and Guth visual comfort probability (GVCP) were normally applied as the international measures of glare [43,53,54]. GVCP represents the percentage of users who are content with a specific view. CGI is an international unit less indicator of visual comfort [11].
To sum up, Fig. 6 summarizes the overall procedure of simulation experiments of MUFLs in the case room. As it can be seen, four types including one unfurnished and three furnished conditions of the case room were determined for the simulation experiments. Finally, the simulated results of each furnished type in terms of DR, IUR, GVCP, and CGI were compared with those of an unfurnished type to draw a conclusion on the impact of typical furniture layouts on indoor daylighting performance.
Figure 6
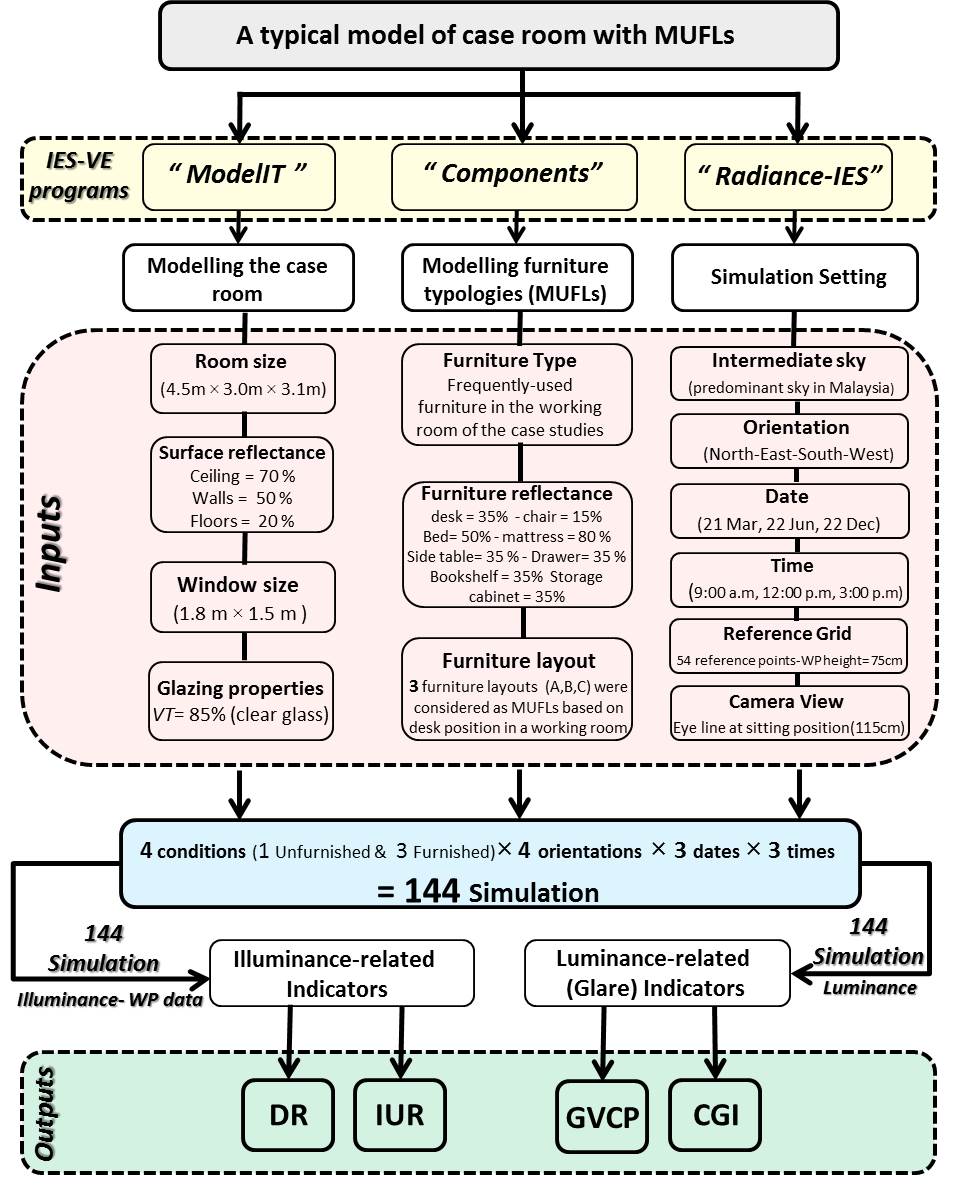
Fig. 6. Flowchart of simulation experiments for the typical residential working room.
3. Results
3.1. Validation of Radiance-IES under a tropical sky
Figure 7 shows the results of the simulated and measured outdoor illuminance in the case room during four days of the field measurement on average. The results of measured outdoor illuminance under the real tropical sky (M1-M4) were far greater than the simulated values of a CIE sky (S1-S4). The difference between the simulated and measured data was up to 85 % on all days (day three at one pm). While the simulated outdoor illuminance had almost steady fluctuations of less than 20000 lux, the measured one varied severely up to 120000 lux during the field measurement.
Figure 7
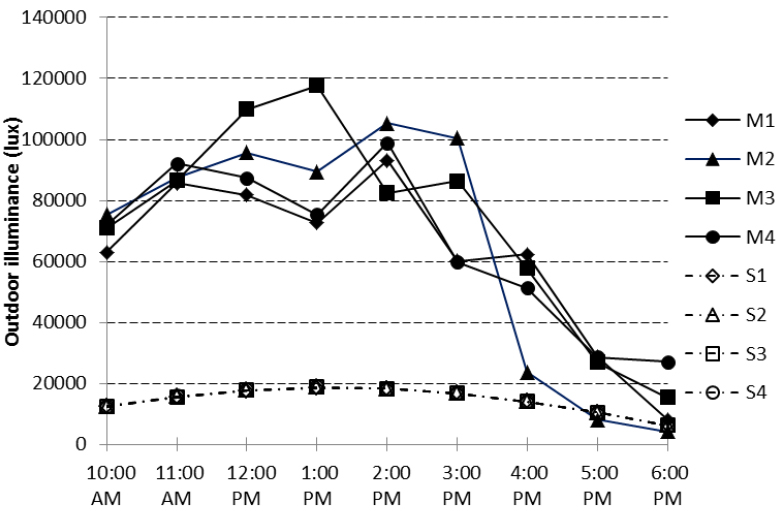
Fig. 7. Simulated and measured outdoor illuminance.
Figure 8 illustrates the difference between measured and simulated absolute WPI for the three points in the test room on all the studied days. Since WPI is directly related to the outdoor illuminance, the results of WPI during the measurement were much higher than the simulated results. In both measurement and simulation, as the distance from the window gets bigger the WPI value decreases. However, this reduction for measured results was far greater than the simulated ones. Overall, during the four days, the mean differences of the measured from simulated WPI values were 86 %, 84 %, and 76 % for P3, P2, and P1, respectively.
Figure 8
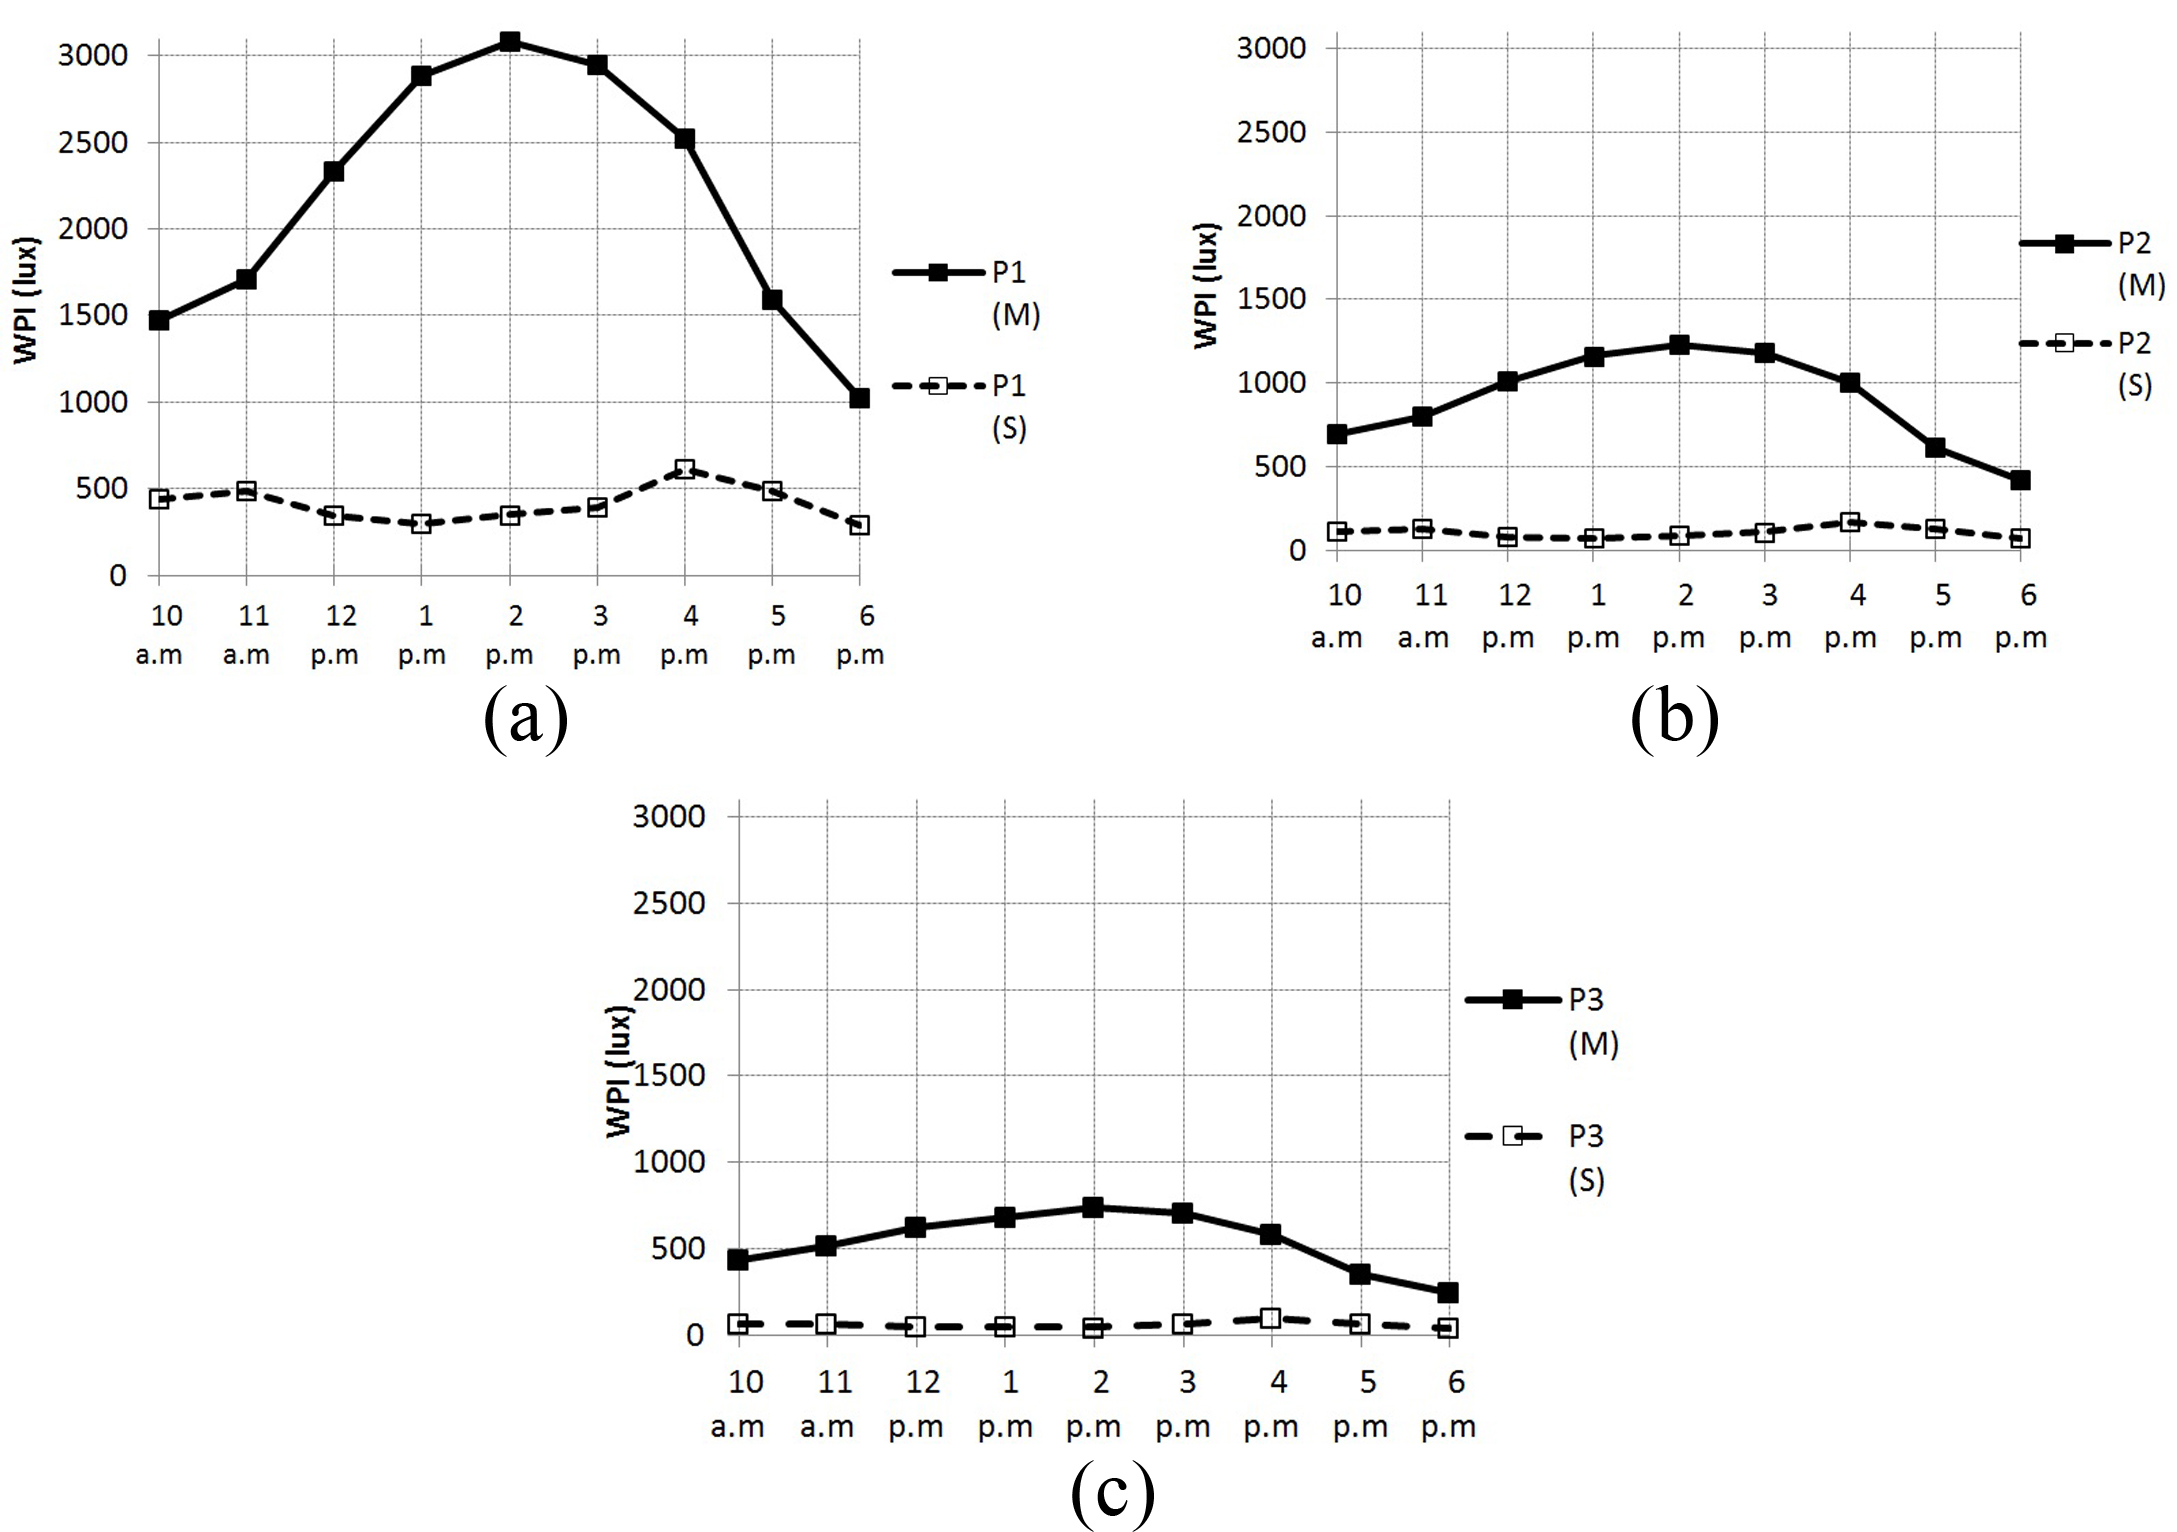
Fig. 8. (a-c) Mean values of simulated and measured WPI during the four days at P1, P2, and P3.
The differences between the simulated and measured values of the outdoor illuminance and absolute WPI were much higher than the results of DR and DF, as shown in Fig. 9. However, the simulated values of DR and DF were lower than their measured counterparts. As with the outcomes of WPI, a similar pattern was recorded in DR and DF in that the results reduces from P1 to P3 in parallel with the distance gets bigger from the window. Overall, the mean simulated and measured results of DF were 2.3% and 2.8%, and the mean measured and simulated DR results were 1.7% and 1.0%, respectively.
Figure 9
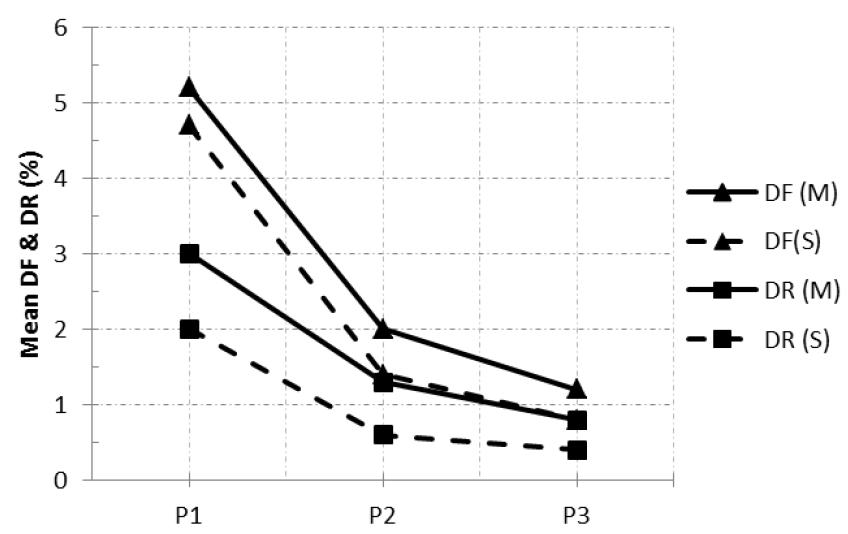
Fig. 9. Mean simulated and measured results of DR and DF at the three points in the test room.
Statistical analysis was used to assess the value of Pearson correlation for simulated and measured values in the furnished test room. There existed a significant correlation between measured and simulated results of the relative ratios (DR and DF) with the Pearson correlation of 0.774 and 0.856, respectively, under a Malaysian tropical sky (Table 4). However, as an intermediate sky is the predominant type of the Malaysian sky, only DR was employed for the further simulation experiments.
Table 4
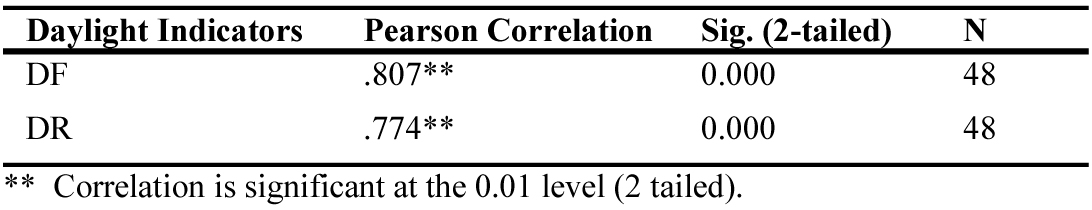
Table 4. Mean simulated and measured results of DR and DF at the three points in the test room.
3.2. Analysis of illuminance-related indices (DR and IUR)
The sun paths in Johor Bahru were simulated under intermediate sky on 21 Mar, 22 Jun and 22 Dec; (9:00, 12:00, and 15:00); for all the cardinal orientations (Fig. 10).
Table 4
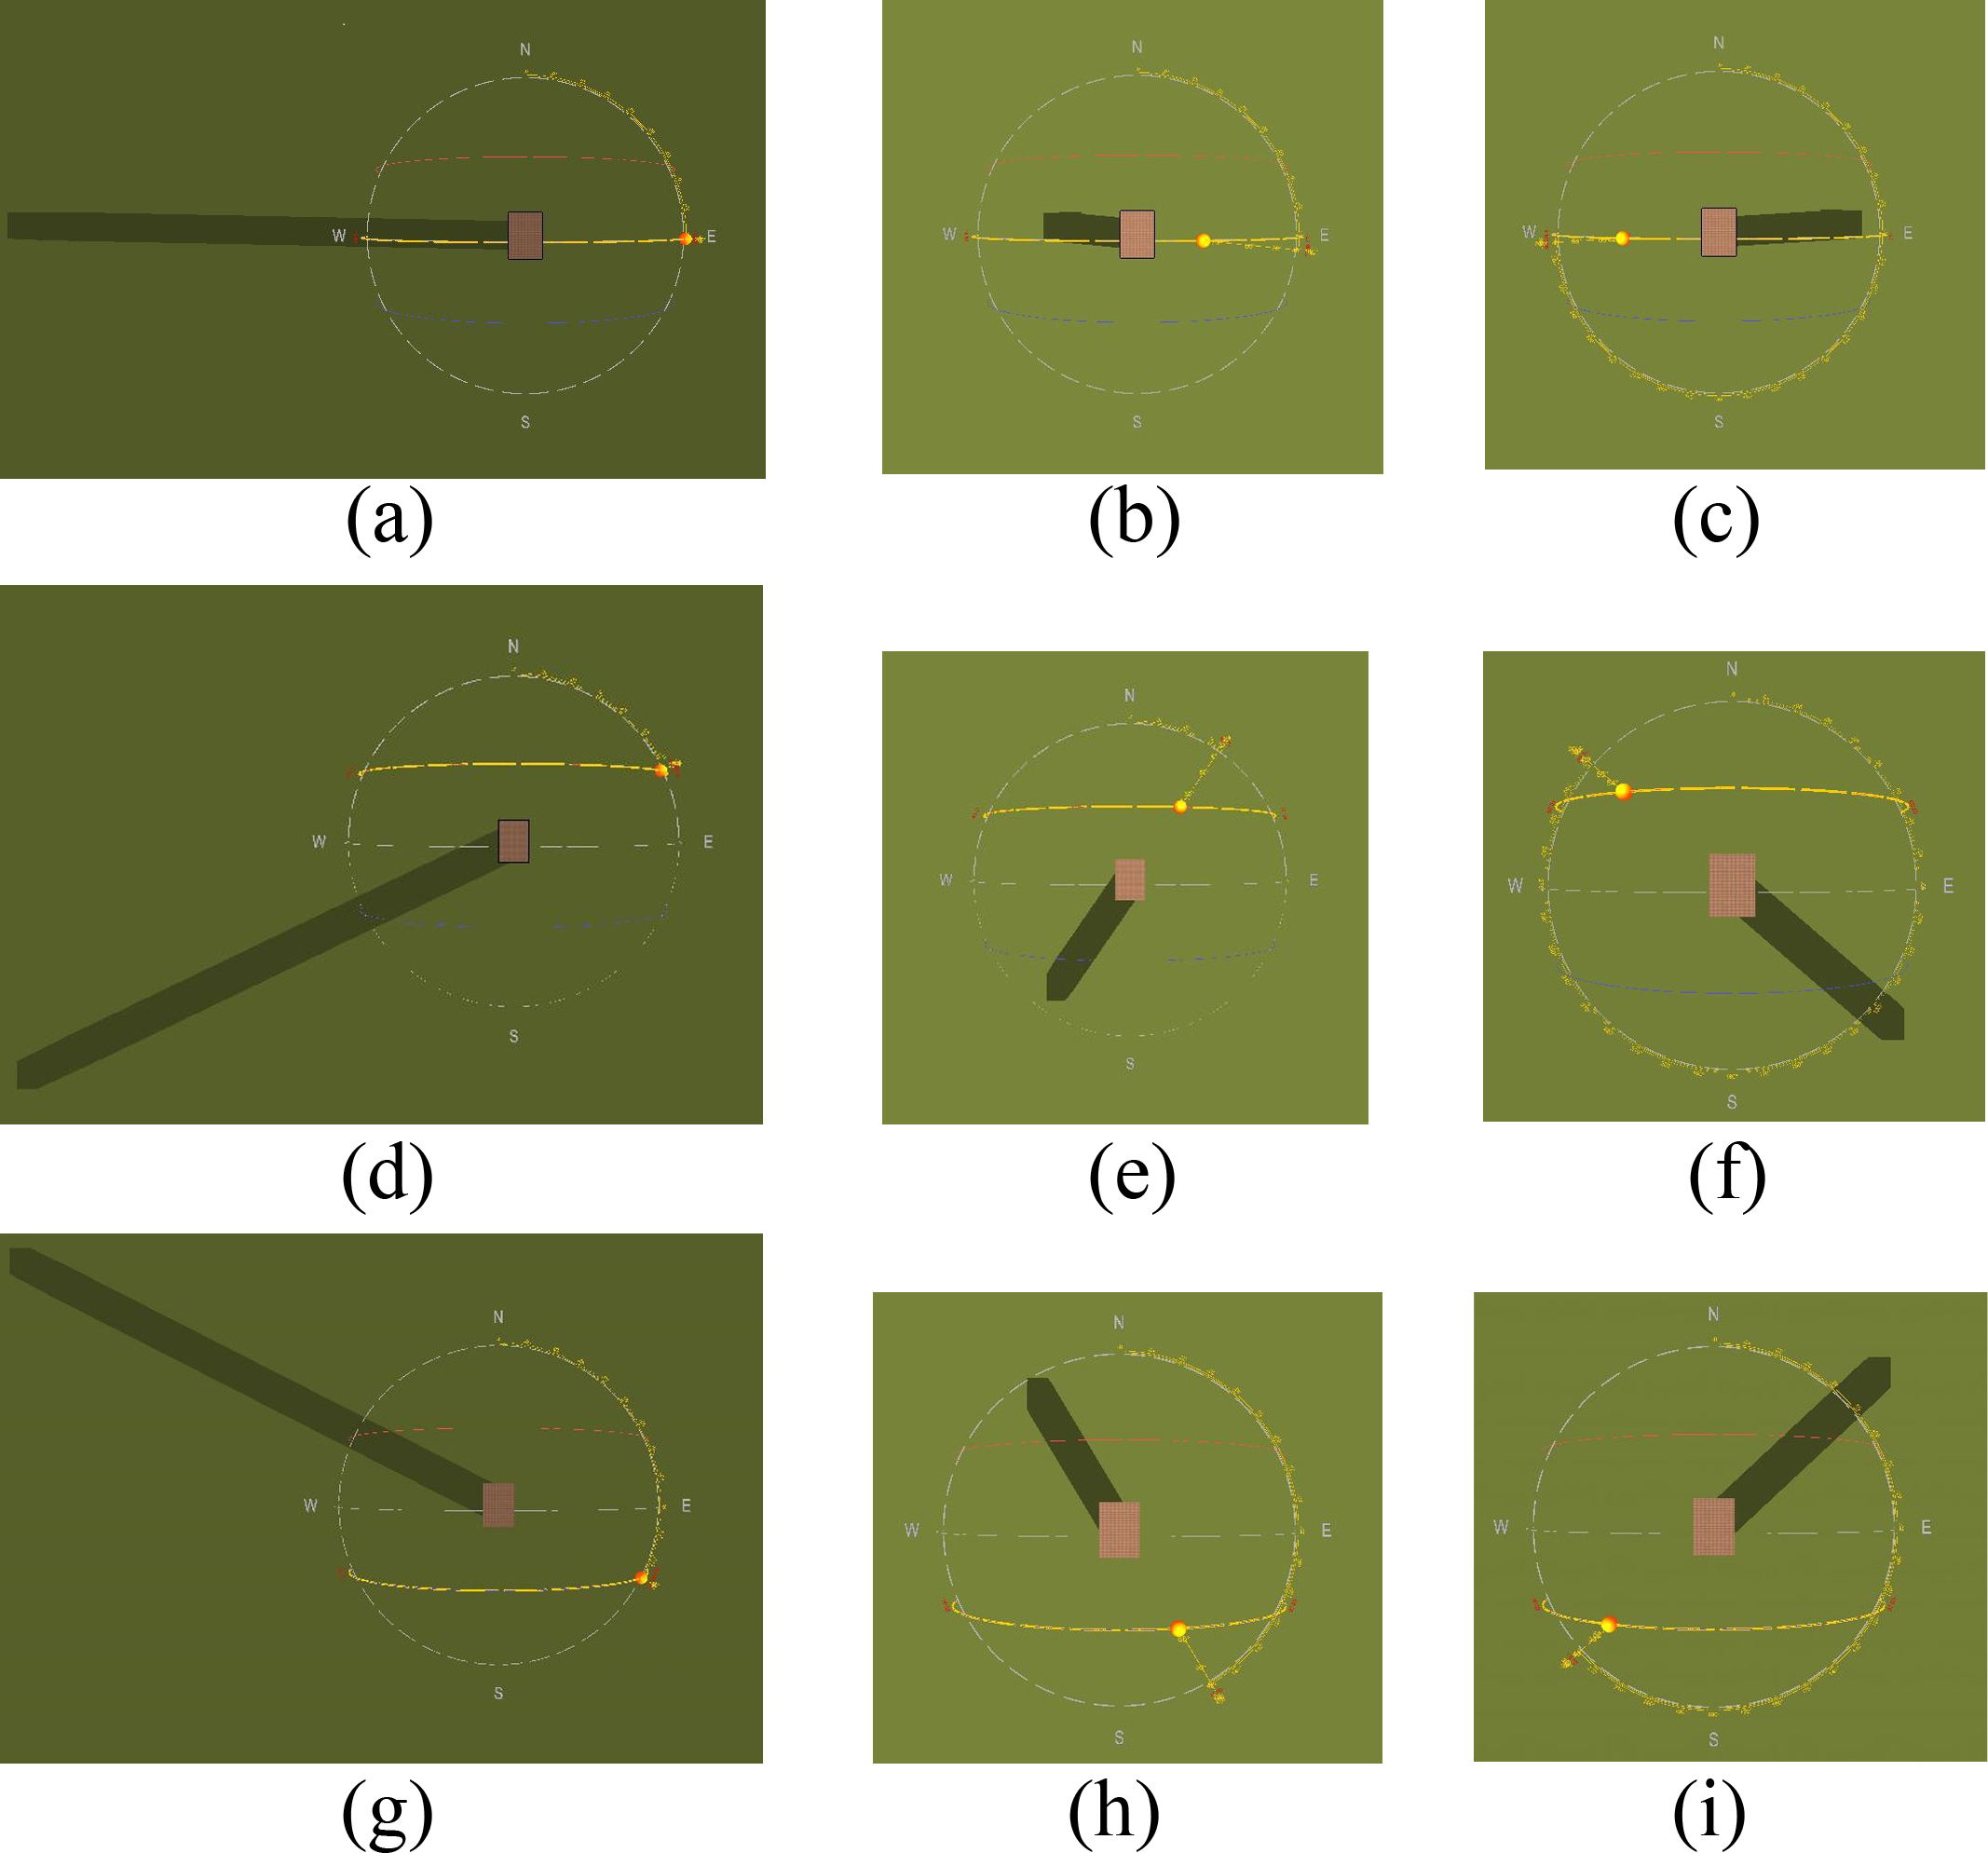
Fig. 10. Sun-paths in Johor Bahru on 21 Mar at (a) 9:00, (b) 12:00, and (c) 15:00, 22 Jun at (d) 9:00, (e) 12:00, and (f) 15:00, and 22 Dec at (g) 9:00, (h) 12:00, and (i) 15:00.
Figure 11 depicts the mean results of DR at the reference points under the unfurnished (base type) and the three furnished conditions (Type A, B, C). Based on the guidelines in Malaysia [55], the range of one to six percent is recommended for the relative ratios. For the north orientation, the mean DR was between one and six percent in all three furnished types, while it was higher than six percent in the base case on June 22nd. For the south orientation, the light levels were allowable in March and June in the four cases, while in December only type B can decrease the light levels to be in the acceptable range. For the east orientation, all four types had allowable DR values at noon and during the afternoon, while the results were excessively far higher than the allowable range in the morning (more than 13%). Although furnished types compared with the base type had lower light levels in the morning, particularly type B in June and December, the furniture layouts cannot reduce the intensive sunlight during morning times. Under west orientation, the average DR results were higher than the upper limit (six percent) at 3:00 pm for the furniture types excluding type B. The light levels were in the allowable range for the other times except March 21st at 12 pm that was lower than one percent. Overall, the mean DR results in the three furnished rooms (particularly type B) were lower than the DR values in the unfurnished condition. In addition, the differences between daylight levels of furnished and unfurnished conditions were much higher when the case room received direct sunlight.
Figure 11
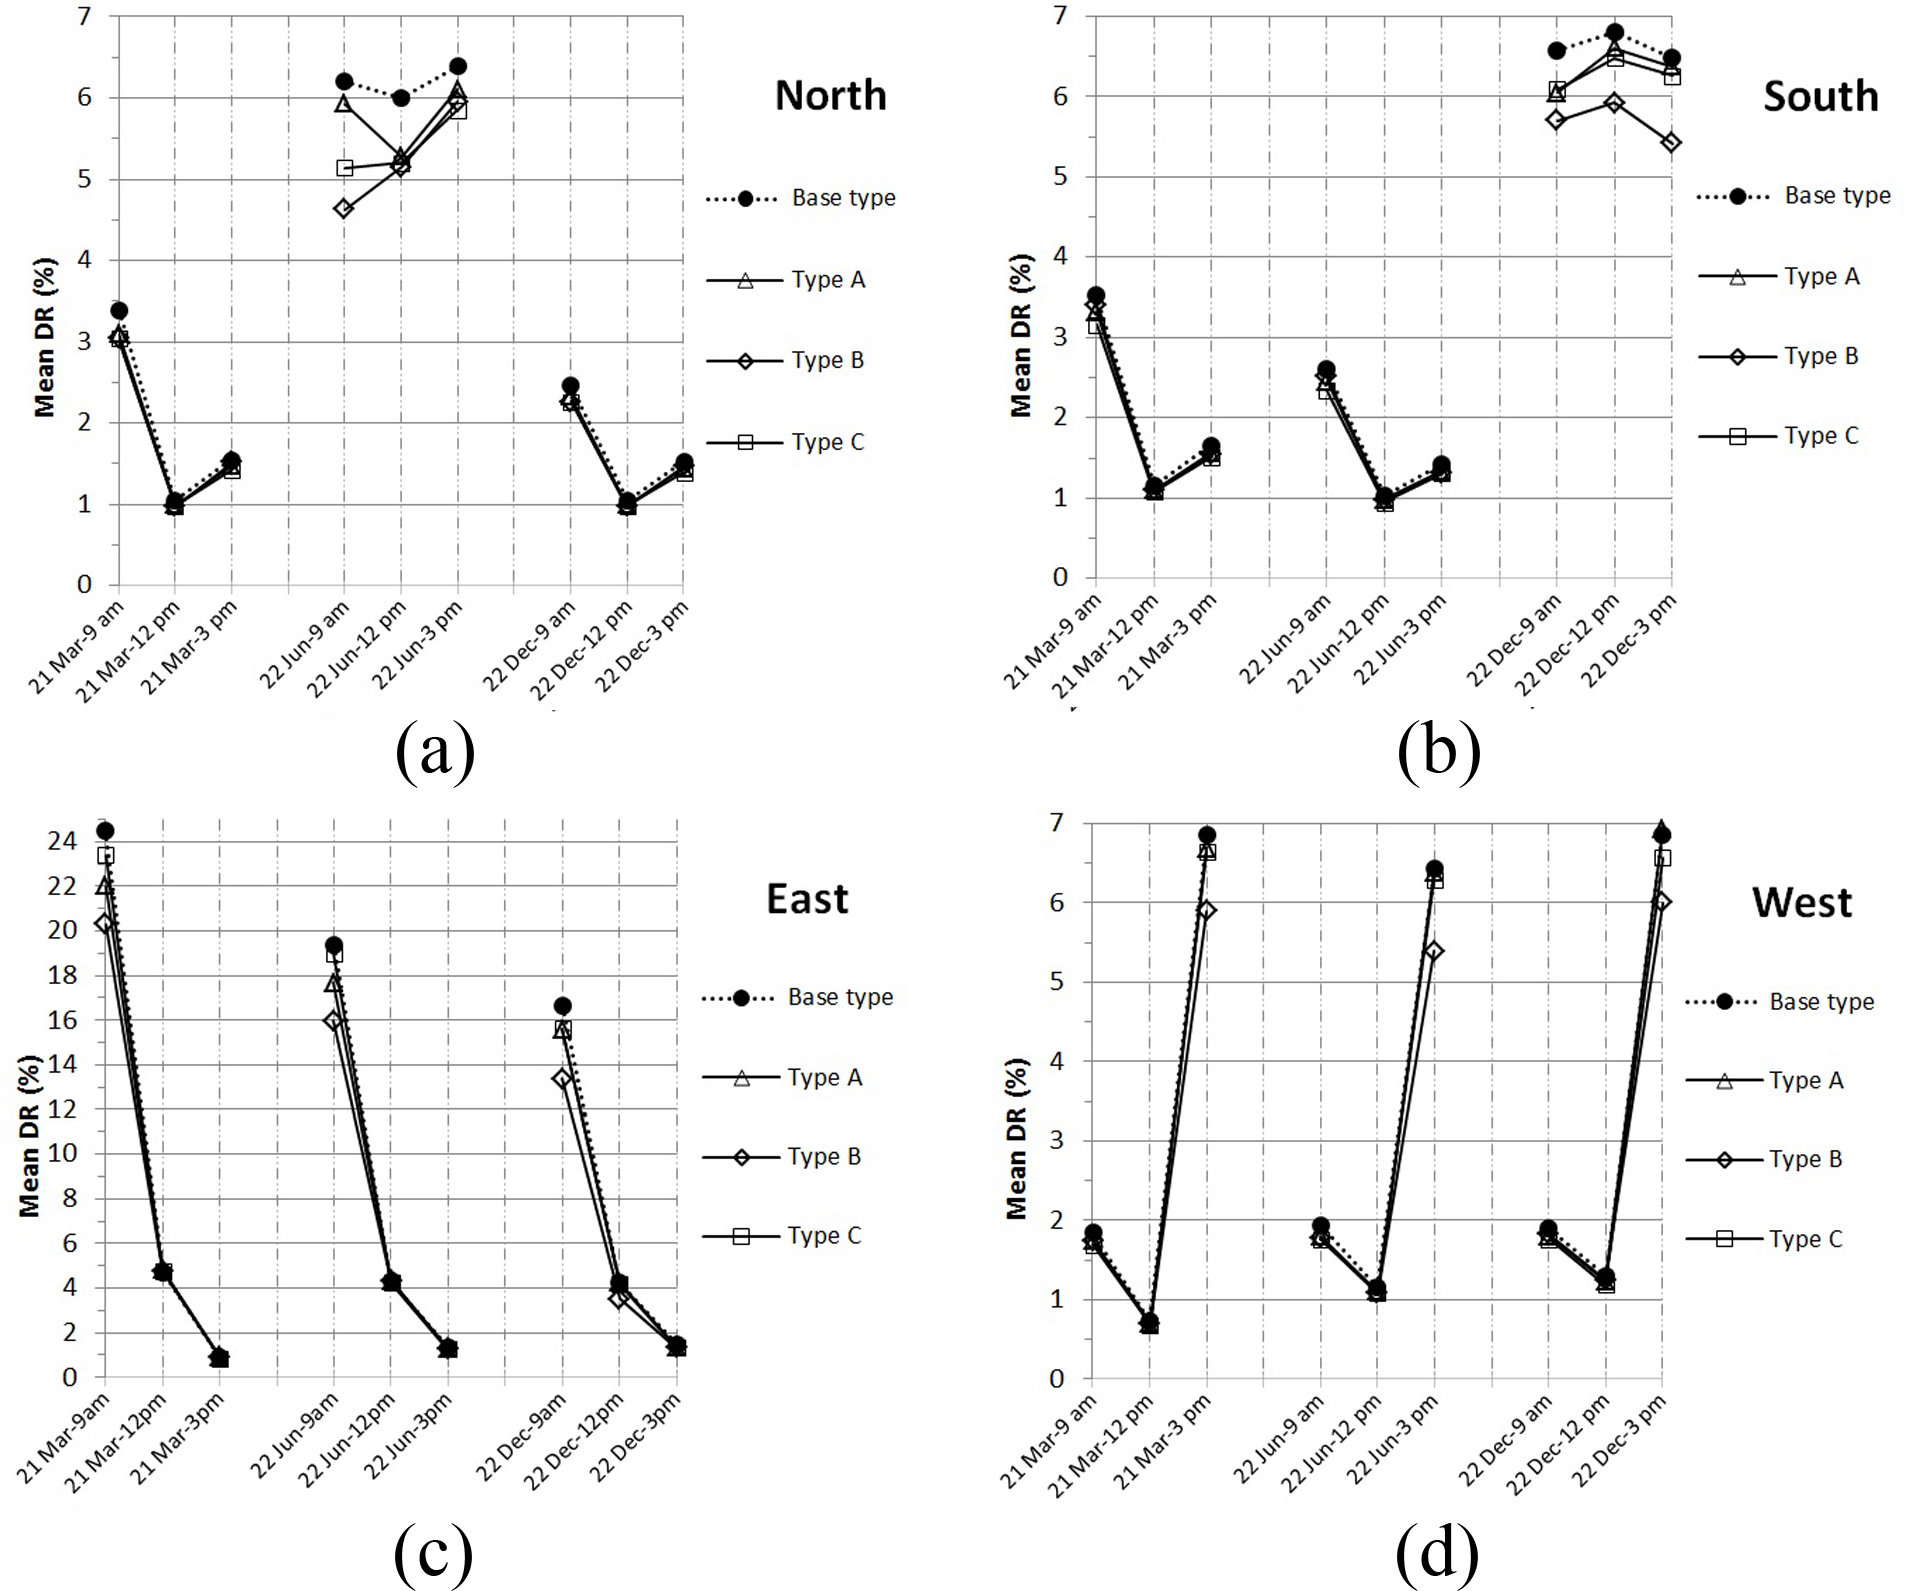
Fig. 11. Mean daylight ratio in the case room with different types and the cardinal orientations: (a) north (b) south (c), east, and (d) west.
While based on lighting standards [11,56,57] IUR > 0.8 is acceptable, until now there is not any benchmark of IUR for Malaysian context. Figure 12 demonstrates the IUR values of the reference grid under all types of the cardinal orientations. Overall, the results of IUR were less than 0.3 for all types and orientations. As it can be seen, the difference between IUR results of the furnished types B and the base type was much lower than the IUR results of the conditions A and C compared with the base type for all the studied times. However, the IUR results for the three furnished conditions were lower than results of the base condition except for type B only during those times when the case room received direct sunlight (morning and afternoon times under east and west orientations; and December 22nd and June 22nd under south and north orientations, correspondingly). Hence, in such times the IUR values of the furnished condition B were slightly more than the results of the base type.
Figure 12
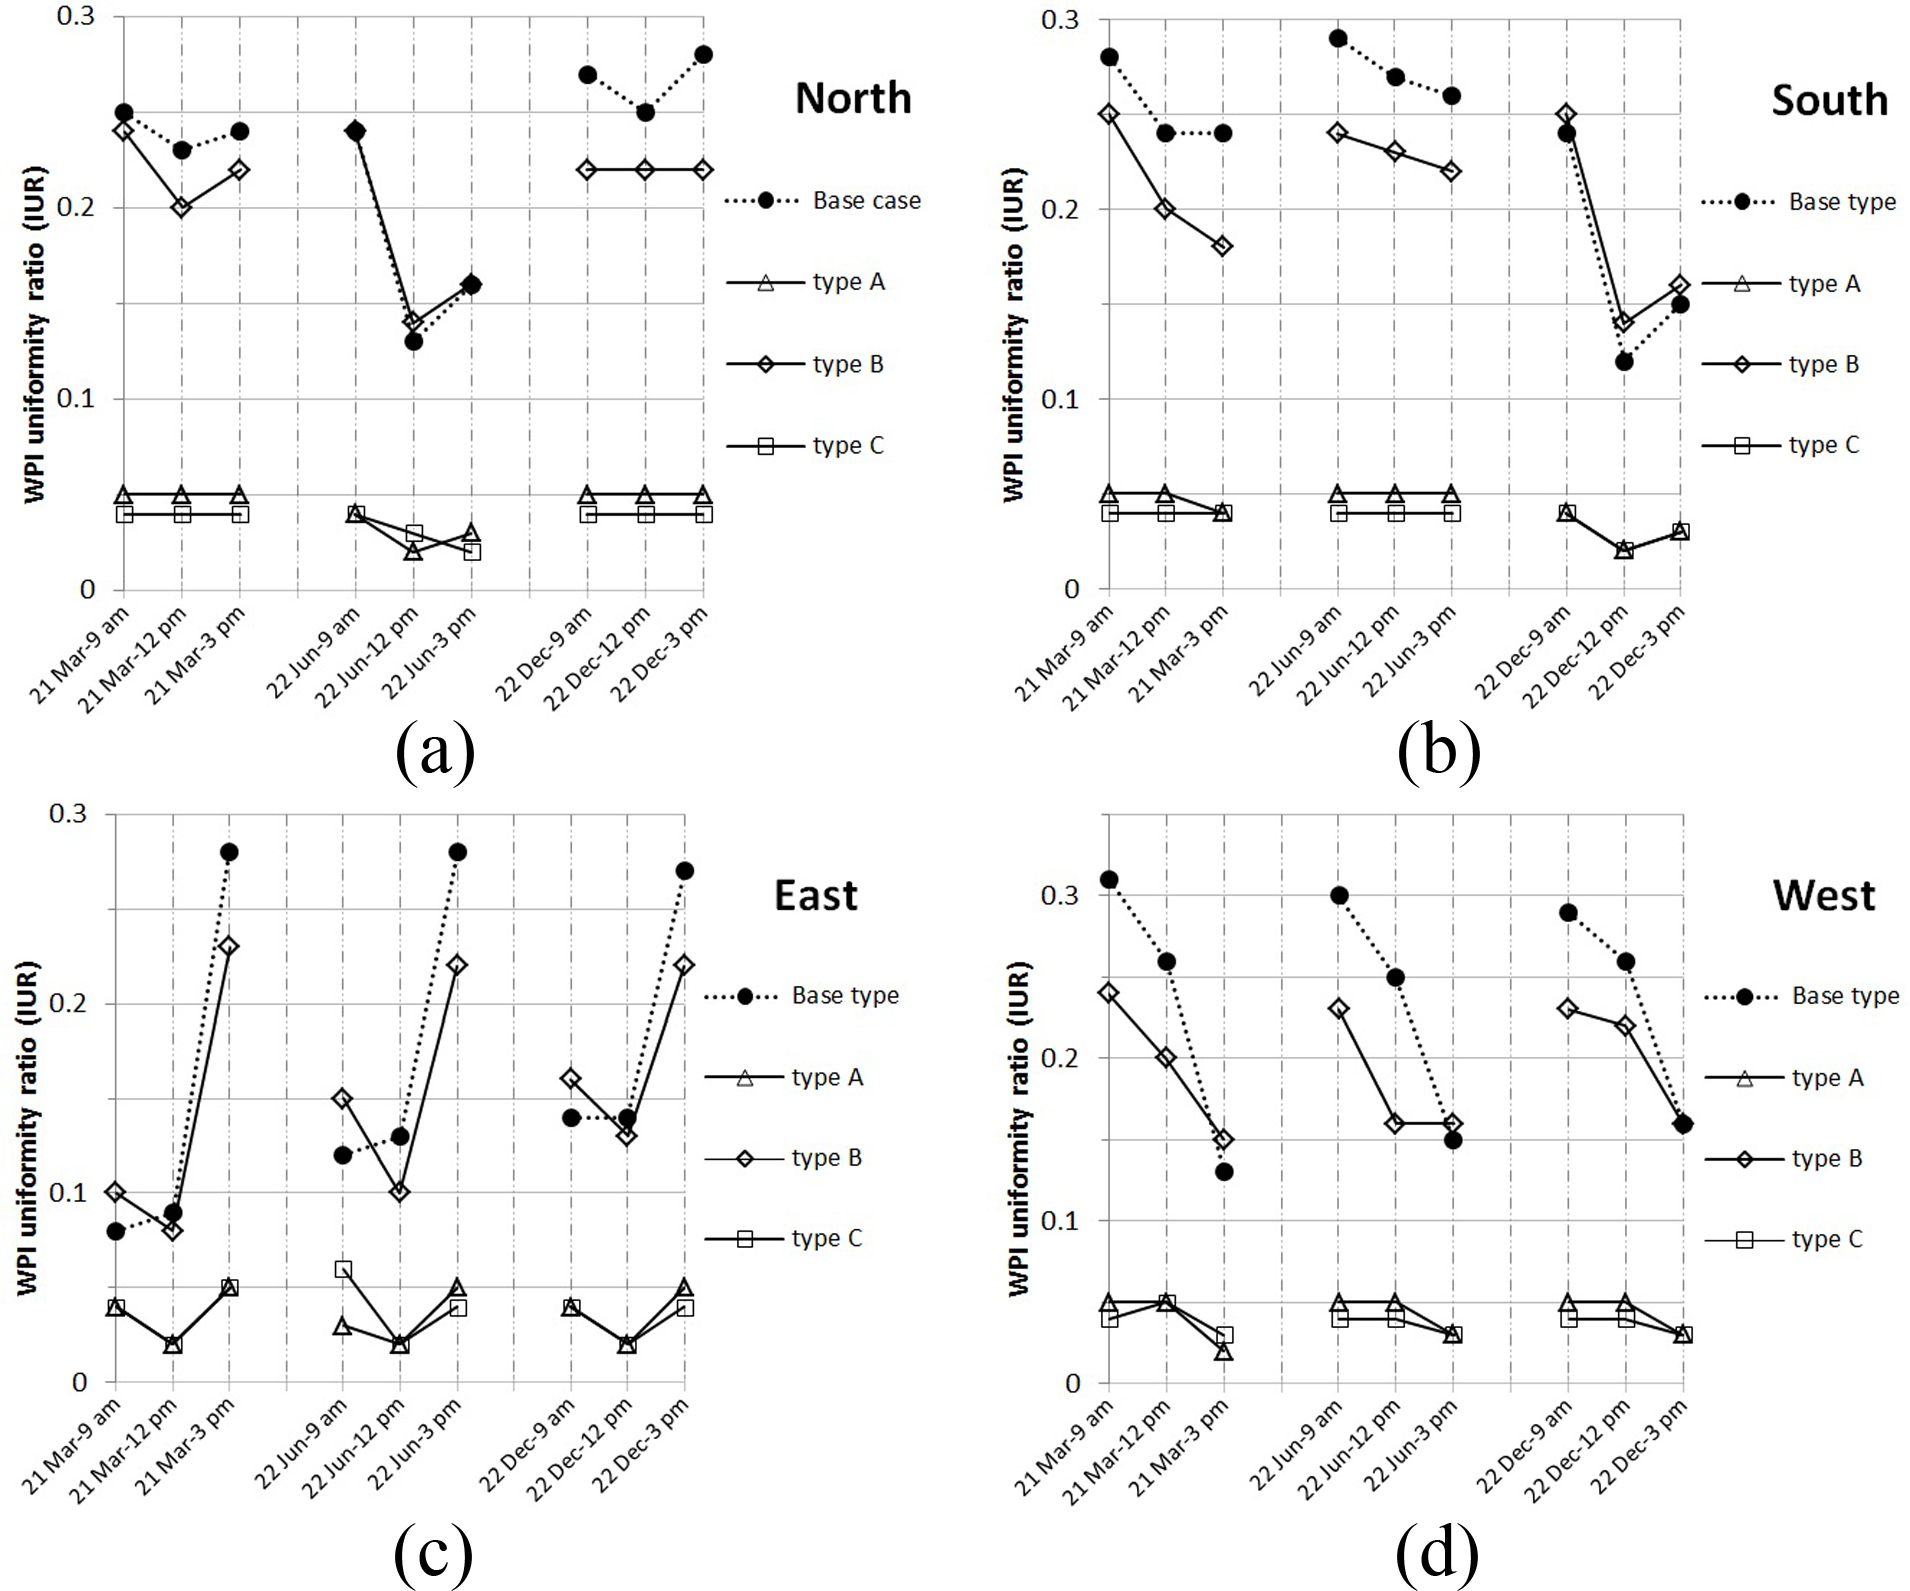
Fig. 12. WPI uniformity ratio (IUR) in the case room with different types and the cardinal orientations: (a) north (b) south (c), east, and (d) west.
3.3. Analysis of glare-related indices (GVCP and CGI)
Based on previous studies, GVCP of 65% and 52% are allowable for sedentary and transient cases, respectively; and CGI of 19 for sedentary status and 22 for transient situations are acceptable [43,53]. The GVCP values of the base type fluctuated from 23% to 45% during all the studied time and orientations. However, Table 5 summarizes the mean GVCP and CGI values of all the studied times for the four types under different orientations. The GVCP results in the base type averaged 18% and 31% lower than the recommended minimum threshold for sedentary and transient conditions, correspondingly. This situation worsens for the furnished types since the average GVCP results for the three furnished rooms were lower than the results in the base type under different orientations.
Table 5
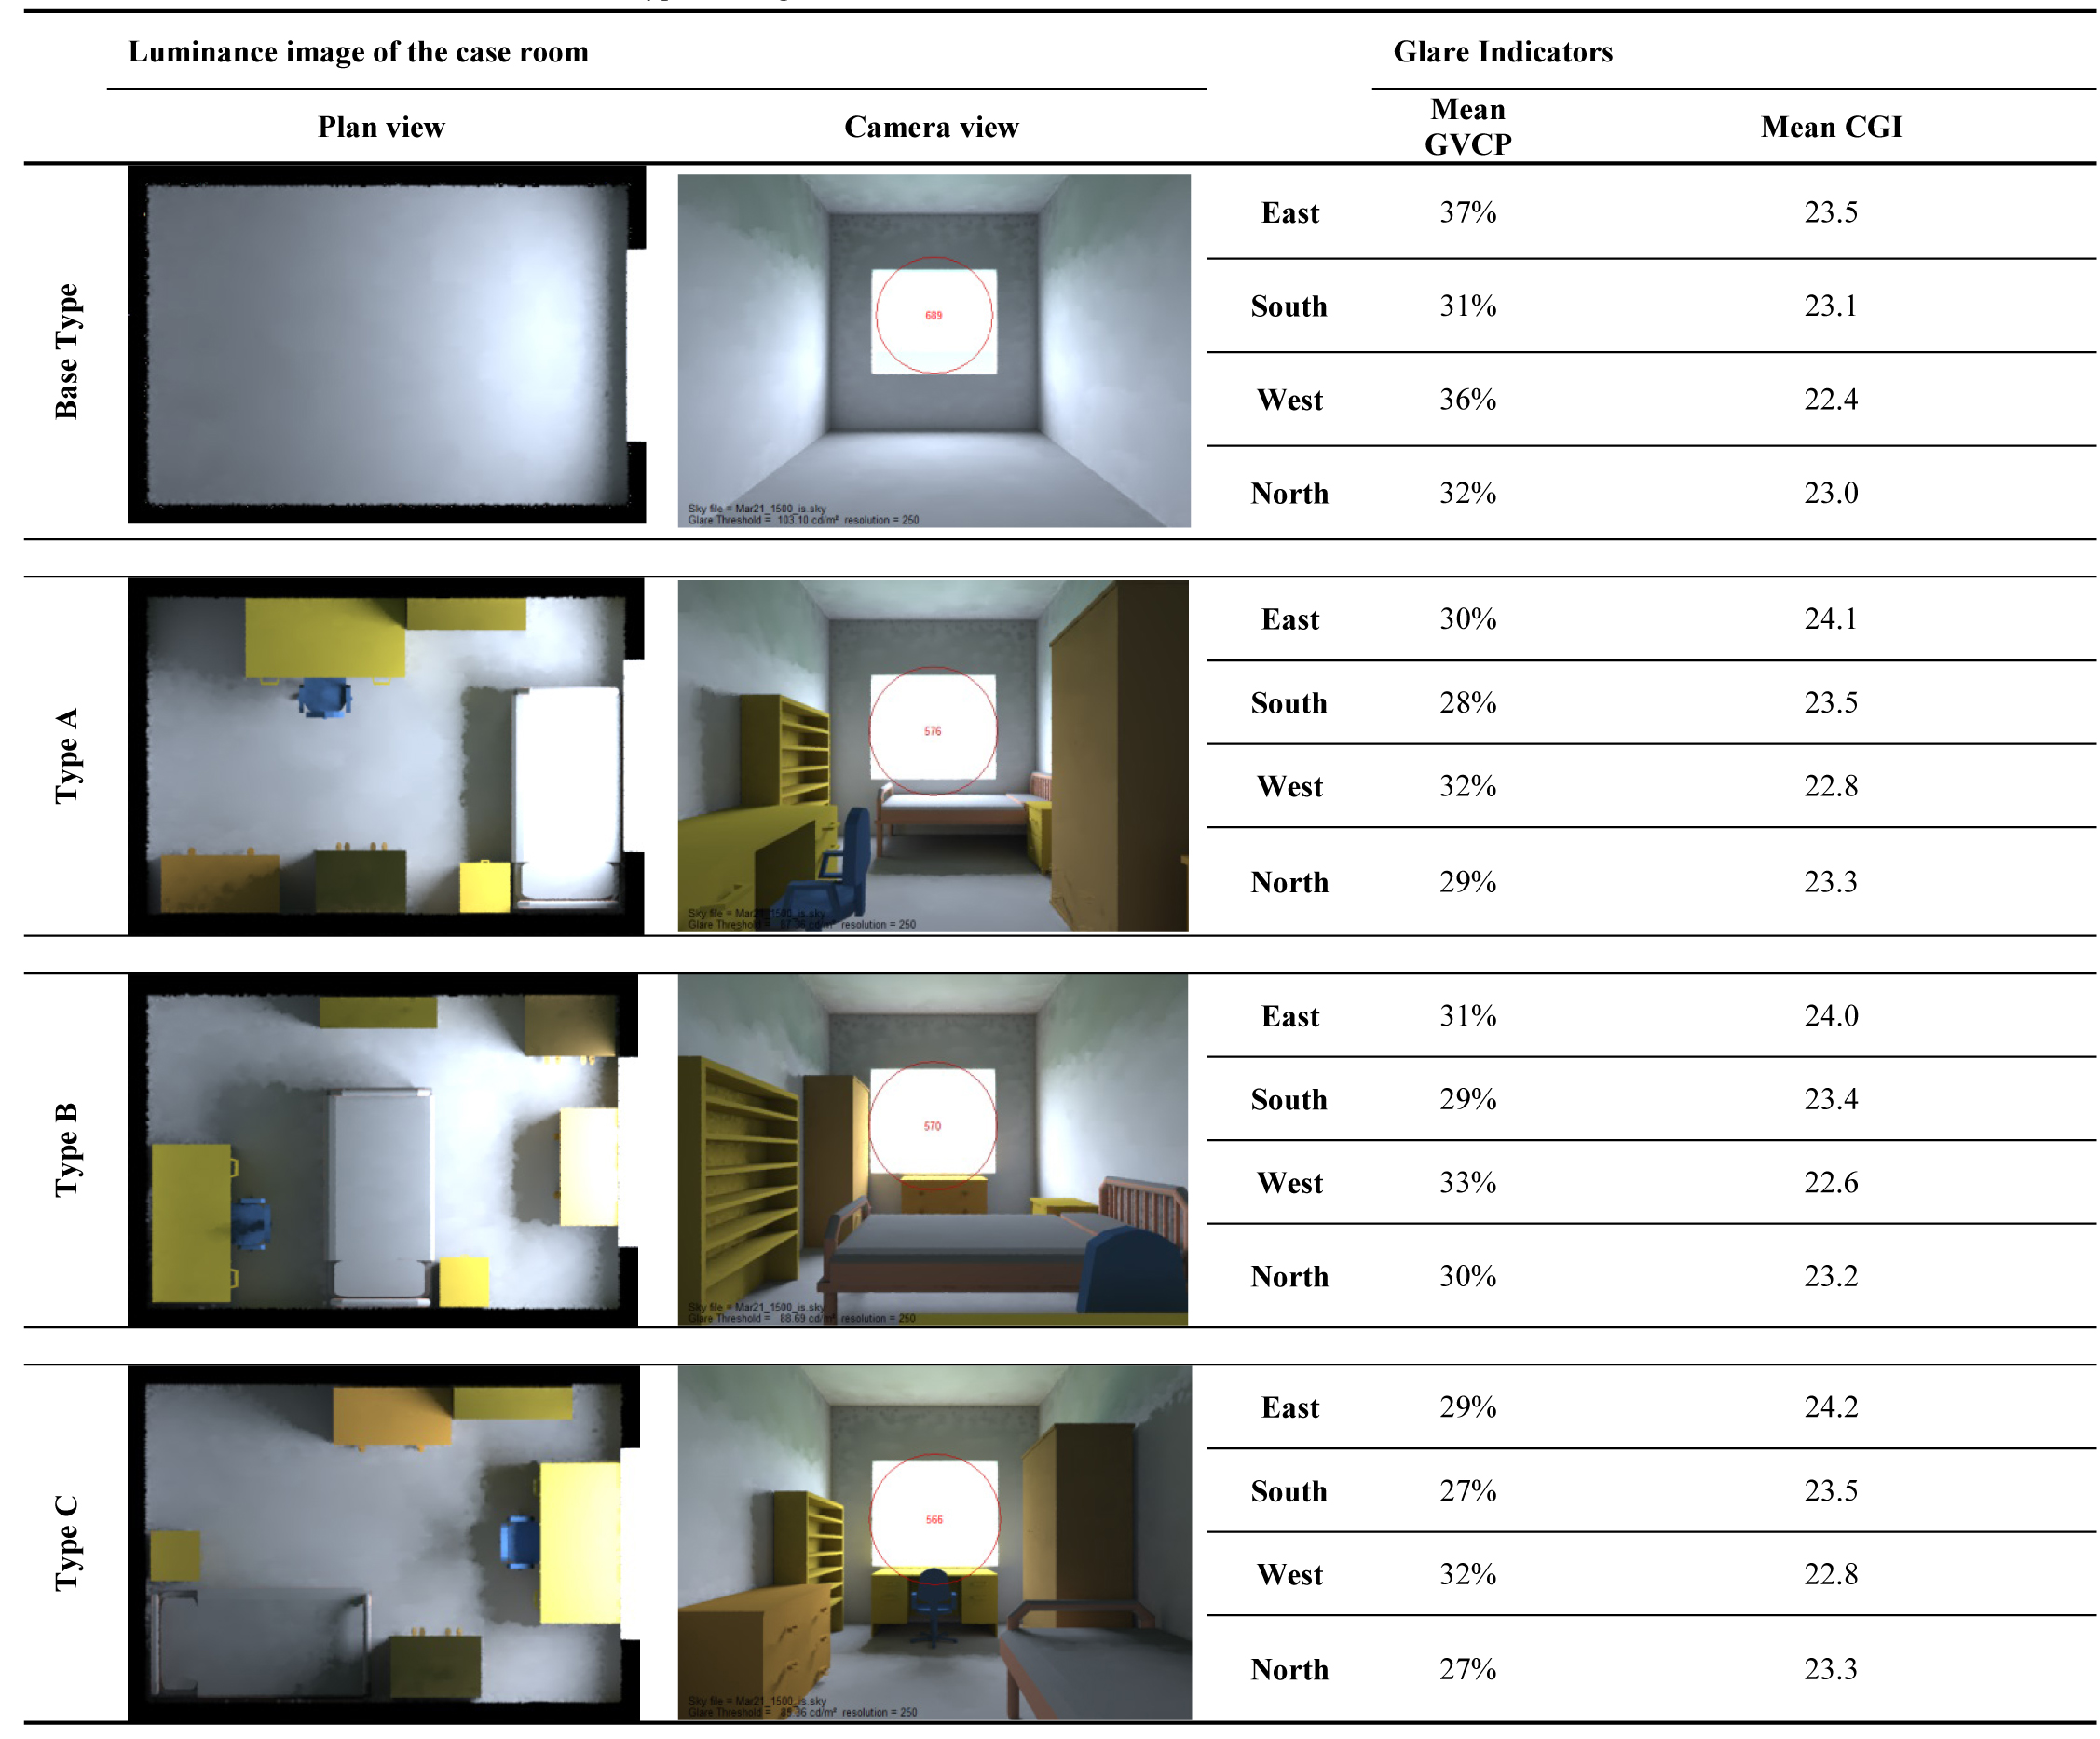
Table 5. Mean GVCP and CGI values for the four types during the simulated times and orientation.
The CGI values of the base type varied from 20 to 27 during the studied time and orientations. The CGI values for all types were in the allowable limit only for the transient condition (less than 22) during the times when the case room was not directly exposed to sunlight. However, the CGI values substantially increased up to 27 during the critical times of glare occurrence when the case room receives direct sunlight. As shown in Table 5, the mean CGI values in the base type were slightly higher than 22, which is the allowable upper limit for a transient condition, while such results clearly trespassed the upper limit for sedentary conditions at 19. However, all the furnished types aggravate the condition since the average CGI values in all the furnished rooms were higher than CGI values in the base type (Table 5).
4. Discussion
The field measurement shows that the Radiance-IES simulation engine could properly simulate a furnished room for the tropical skies. It is questionable to directly use the CIE sky types, which are employed in the Radiance-IES program, for evaluating tropical daylighting. The reason is that the value of outdoor illuminance in the tropical climate of Malaysia could be as big as 120000 lux, whereas the simulated value was up to 20000 lux under CIE sky. This was in line with previous research stated that the CIE skies had outdoor illuminance of lower than 20000 lux while this value was higher than 80000 lux for the Malaysia’s tropical sky [12,21,22]. However, before using the Radiance-IES software for a tropical climate, it needed to be validated because of the different characteristics of CIE and tropical skies. While there were huge differences between the simulated and measured values of the absolute values (E0 and WPI) in the furnished room, the Pearson correlation between the two sets of results were significant only for relative ratios (DF and DR). This was in accordance with previous studies that indicated Radiance-based software can accurately be used for the tropical daylight simulation for the relative ratios, but not absolute values [43,58].
The minimum value of mean DR was more than one percent, which is the allowable lower daylight limit, for all the simulated tests, except the west orientation on March 21st at 12 pm This implies that the indoor daylight availability was substantially adequate in the existing working rooms in residential buildings in Malaysia. Although the DR results in the case room steadily fluctuated during the day under the north and south orientations, these values drastically changed under the east and west orientations. This is in accordance with a study by Lim, Ahmad [59] that indicates the highest inconsistent daylighting patterns could be recorded for the rooms with east orientations in tropical regions. The DR values were reduced for all the simulated experiments by adding furniture in the case room. This decrease of indoor daylight level was more sensible when the furnished room (especially type B) receives direct sunlight compared with indirect sunlight.
The mean IUR values in the unfurnished room during all simulated tests were much lower than the recommended threshold. However, differently furnished types (MUFLS) not only improve indoor daylight uniformity but also deteriorate the condition. Moreover, the IUR values had much more potential rather than DR values to fluctuate drastically by changing the arrangement of furniture in the case room. This shows that the furniture layout has a major influence on daylight distribution uniformity in the room. The findings of GVCP and CGI showed that the daylight quality in the case room (without furniture) for all the simulated experiments was lower than the allowable ranges for transient and sedentary conditions. By furnishing the case room, even with different arrangements, the indoor visual comfort not only improved, but also it worsened the situation in terms of glare problems. Previous studies used relative differences to compare two daylight variables under different conditions [11]. Accordingly, Eq. (4) shows a method to draw a comparison between daylight variables (DR, IUR, GVCP, and CGI) in the three furnished types from the unfurnished one:
where Eu and Ef are representative of daylight indicators in the unfurnished and the three furnished rooms, respectively. Table 6 summarizes the mean relative difference of daylighting variables in the three furnished types (A, B, and C) from the unfurnished type for all the simulated tests. On average, all three furnished types reduce the mean DR values approximately 11% compared with the base type. This is in line with an investigation in temperate climates that indicates furniture may reduce daylight levels in a room [11]. The difference of IUR values between furnished and unfurnished conditions was obviously distinct for each furniture arrangement. Accordingly, type C recorded the high difference of 86% while type B had a 15% decrement of IUR results compared with the base type. It can be reasoned that various layouts of furniture in a room could greatly influence indoor daylight distribution uniformity. Thus, high reduction of daylight distribution uniformity in a building is the main impact of furniture on indoor daylighting performance. The mean relative difference of GVCP and CGI results was nearly similar in quantity for each furnished type. By furnishing the case room, on average a 12% decrement of GVCP values and a slight 2% increment of CGI values can be observed. Therefore, furnishing a room, irrespective of its arrangement, could increase glare and visual discomfort.
Overall, type B compared with the other furnished types had better indoor daylighting performance, particularly for illuminance-related metrics since whenever sunlight directly came inside the furnished room (type B), it dropped somewhere between the window and the bed. Therefore, the bed affected the daylight level reaching the rear space of the room that caused a reduction in the average indoor daylight level. Based on the solar angle and furniture position, furniture may reflect direct sunlight further in buildings or shade it from the rest. While the occupants of residential buildings in the context of Malaysia have more tendencies for choosing type A to furnish their residential working rooms [5], in this paper, type B represented better indoor daylight performance than the other furnished conditions. This indicates that the social needs of people had a higher priority over the environmental needs, especially daylight utilization, when furnishing their residential working rooms.
5. Conclusion
This paper focused on the impact of different furniture layouts on the quantitative and qualitative daylighting performances in residential working rooms. Though a vast majority of furniture arrangements could be discovered in reality, in order to have a better generalisation, the MUFLs in a typical working room of residential buildings in Malaysia were employed in this study. The field measurement under a tropical sky only validated the relative ratios of the daylighting variables in the Radiance-IES. Therefore, IUR and DR as illuminance-related metrics, CGI and GVCP as glare metrics were employed to assess indoor daylighting condition. Based on the findings of field measurement, as shown in Fig. 7, the outdoor illuminance under a tropical sky can be as high as 120 klux (third day of measurement at 1 pm).This extreme outdoor illuminance under the tropical sky can cause high indoor daylight levels, especially for the east and west orientations. The study showed that different furniture layouts can decrease the indoor daylight availability on average by approximately 11%, as shown in Table 6. The importance of furniture layout on the reduction of the indoor light level is more sensible when it is placed in a way that decreases the depth of the daylighting space by preventing sunlight from reaching the hind space of a room. By changing the layout of the furniture in the case room, daylight distribution uniformity recorded the biggest fluctuations among the other daylighting variables. It can be concluded that while various furniture arrangements may even slightly decrease the extreme daylight quantity (DR) in the tropics, they can also deteriorate the indoor daylight quality (IUR, GVCP, and CGI) compared with an unfurnished space. Thus, furniture as an interior design element could not improve tropical daylight performance in a building. Future studies can investigate the impacts of different interior design variables (such as surface reflectance, glazing tinting and internal shading controls) on indoor daylighting performance.
Acknowledgements
The authors would like to acknowledge the research funding by Ministry of Higher Education Malaysia (MOHE) through Fundamental Research Grant Scheme (FRGS), grant no. R.J130000.7821.4F665.
Contributions
S.M. Mousavi conceived the study, designed and performed experiments, interpreted the results, and wrote the manuscript. T.H. Khan and L. Y. Wah supervised with help each stage of the project in terms of data collection, analysis and interpretation and provided constructive advice to shape the project.
References
- R. Sulaiman, S. S. M. Shariff, and M. S. Ahmad, The e-business potential for home-based businesses in Malaysia: a qualitative study, International Journal of Cyber Society and Education 2 (2009) 21-36.
- L. Bateman, Home-work, Work Study 49 (2000) 198-200. https://doi.org/10.1108/00438020010337450
- C. M. Mason, S. Carter, and S. Tagg, Invisible Businesses: The Characteristics of Home-based Businesses in the United Kingdom, Regional Studies 45 (2011) 625–639. https://doi.org/10.1080%2F00343401003614241
- R. Sulaiman, Developing A Malaysian Electronic Home-Based Businesses Pre-Implementation Framework, Ph.D Thesis, 2011, Universiti Tenaga Nasional, Malaysia.
- S. M. Mousavi, T. H. Khan, and Y.-W. Lim, A Critical Review of User Fit-out in Habitable Rooms in High-Rise Residential Apartments in Malaysia, Asian Social Science 12 (2016). https://doi.org/10.5539%2Fass.v12n2p184
- GBI, GBI Assessment Criteria For Residential New Construction (Rnc), Accessed on: 1 July, 2016, Available at: http://new.greenbuildingindex.org/Files/Resources/GBI%20Tools/GBI%20RNC%20Residential%20Tool%20V3.0.pdf.
- L. N. Groat and D. Wang, Architectural research methods, 2002, John Wiley & Sons.
- D. H. W. Li and J. C. Lam, Evaluation of lighting performance in office buildings with daylighting controls, Energy and Buildings 33 (2001) 793–803. https://doi.org/10.1016%2Fs0378-7788%2801%2900067-6
- N. Baker and K. Steemers, Energy and environment in architecture: a technical design guide, 2003, Taylor & Francis.
- S. M. Mousavi, T. H. Khan, and B. Javidi, Environmentally Sustainable Affordable Design Elements in Housing in the context of Malaysia: Focus on Middle income group, Life Science Journal 10 (2013) 1138-1148.
- M. C. Dubois, Impact of solar shading devices on daylight quality:simulations with radiance, Lund University, Sweden, 2001.
- A. Zain-Ahmed, K. Sopian, M. Y. . Othman, A. A. . Sayigh, and P. . Surendran, Daylighting as a passive solar design strategy in tropical buildings: a case study of Malaysia, Energy Conversion and Management 43 (2002) 1725–1736. https://doi.org/10.1016%2Fs0196-8904%2801%2900007-3
- A. Tzempelikos and A. K. Athienitis, The impact of shading design and control on building cooling and lighting demand, Solar Energy 81 (2007) 369–382. https://doi.org/10.1016%2Fj.solener.2006.06.015
- G. Kim and J. T. Kim, Healthy-daylighting design for the living environment in apartments in Korea, Building and Environment 45 (2010) 287–294. https://doi.org/10.1016%2Fj.buildenv.2009.07.018
- H. Alzoubi, S. Al-Rqaibat, and R. F. Bataineh, Pre-versus post-occupancy evaluation of daylight quality in hospitals, Building and Environment 45 (2010) 2652–2665. https://doi.org/10.1016%2Fj.buildenv.2010.05.027
- J.-H. Choi, L. O. Beltran, and H.-S. Kim, Impacts of indoor daylight environments on patient average length of stay (ALOS) in a healthcare facility, Building and Environment 50 (2012) 65–75. https://doi.org/10.1016%2Fj.buildenv.2011.10.010
- S. Sharples and D. Lash, Daylight in Atrium Buildings: A Critical Review, Architectural Science Review 50 (2007) 301–312. https://doi.org/10.3763%2Fasre.2007.5037
- N. Ibrahim and A. Zain-Ahmed, Daylight availability in an office interior due to various fenestration options, in: 2nd PALENC Conference and 28th AIVC Conference on Building Low Energy Cooling and Advanced Ventilation Technologies in the 21st Century, Crete island, Greece, 2007.
- S. Fairuz Syed Fadzil and S.-J. Sia, Sunlight control and daylight distribution analysis: the KOMTAR case study, Building and Environment 39 (2004) 713–717. https://doi.org/10.1016%2Fj.buildenv.2003.12.009
- N. D. Dahlan, P. J. Jones, D. K. Alexander, E. Salleh, and J. Alias, Daylight Ratio, Luminance, and Visual Comfort Assessments in Typical Malaysian Hostels, Indoor and Built Environment 18 (2009) 319–335. https://doi.org/10.1177%2F1420326x09337041
- A. Zain-Ahmed, K. Sopian, Z. Zainol Abidin, and M. Y. H. Othman, The availability of daylight from tropical skies—a case study of Malaysia, Renewable Energy 25 (2002) 21–30. https://doi.org/10.1016%2Fs0960-1481%2800%2900209-3
- H. Djamila, C. C. Ming, and S. Kumaresan, Estimation of exterior vertical daylight for the humid tropic of Kota Kinabalu city in East Malaysia, Renewable Energy 36 (2011) 9–15. https://doi.org/10.1016%2Fj.renene.2010.06.040
- D. H. W. Li and E. K. W. Tsang, An analysis of daylighting performance for office buildings in Hong Kong, Building and Environment 43 (2008) 1446–1458. https://doi.org/10.1016%2Fj.buildenv.2007.07.002
- A. Mahdavi, S.P. Rao, and N. Inangda, Parametric Studies on Window-To-Wall Ratio for Passive Design Optimisation of Daylighting in High-Rise Office Buildings in Kuala Lumpur, Malaysia, Journal of Design and Built Environment 12(2013).
- R. Dangol, T. Kruisselbrink, A. Rosemann, Effect of Window Glazing on Colour Quality of Transmitted Daylight, Journal of Daylighting 4 (2017) 37-47. http://dx.doi.org/10.15627/jd.2017.6
- D. H. W. Li, S. L. Wong, C. L. Tsang, and G. H. W. Cheung, A study of the daylighting performance and energy use in heavily obstructed residential buildings via computer simulation techniques, Energy and Buildings 38 (2006) 1343–1348. https://doi.org/10.1016%2Fj.enbuild.2006.04.001
- A. Mahdavi, S.P. Rao, and N. Inangda, Orientation Effects on Daylighting in High-Rise Office Buildings in Malaysia: a simulation study, in: International Conference on Alternative Energy in Developing Countries and Emerging Economies, 2013, Bangkok, Thailand.
- K. D. Song, Influence of Canopy Systems on Daylight Performance of Four-Sided Atria under an Overcast Sky, Indoor and Built Environment 16 (2007) 110–120. https://doi.org/10.1177%2F1420326x07077953
- J. Du and S. Sharples, The variation of daylight levels across atrium walls: Reflectance distribution and well geometry effects under overcast sky conditions, Solar Energy 85 (2011) 2085–2100. https://doi.org/10.1016%2Fj.solener.2011.05.015
- M. Nikpour, M. Z. Kandar, and E. Mosavi, Investigating Daylight Quality Using Self-Shading Strategy in Energy Commission Building in Malaysia, Indoor and Built Environment 22 (2012) 822–835. https://doi.org/10.1177%2F1420326x12458512
- B.-C. Park, A.-S. Choi, J.-W. Jeong, and E. S. Lee, Performance of integrated systems of automated roller shade systems and daylight responsive dimming systems, Building and Environment 46 (2011) 747–757. https://doi.org/10.1016%2Fj.buildenv.2010.10.007
- M. V. Nielsen, S. Svendsen, and L. B. Jensen, Quantifying the potential of automated dynamic solar shading in office buildings through integrated simulations of energy and daylight, Solar Energy 85 (2011) 757–768. https://doi.org/10.1016%2Fj.solener.2011.01.010
- F. Linhart and J.-L. Scartezzini, Minimizing lighting power density in office rooms equipped with Anidolic Daylighting Systems, Solar Energy 84 (2010) 587–595. https://doi.org/10.1016%2Fj.solener.2009.05.001
- A. P. Diéguez’, N. Gentile, H. v. Wachenfelt, and M.-C. Duboisba, Daylight Utilization with Light Pipe in Farm Animal Production: A Simulation Approach, Journal of Daylighting 3 (2016) 1-11. http://dx.doi.org/10.15627/jd.2016.1
- S. Y. Koo, M. S. Yeo, and K. W. Kim, Automated blind control to maximize the benefits of daylight in buildings, Building and Environment 45 (2010) 1508–1520. https://doi.org/10.1016%2Fj.buildenv.2009.12.014
- H. Shen and A. Tzempelikos, Sensitivity analysis on daylighting and energy performance of perimeter offices with automated shading, Building and Environment 59 (2013) 303–314. https://doi.org/10.1016%2Fj.buildenv.2012.08.028
- L. Sanati and M. Utzinger, The effect of window shading design on occupant use of blinds and electric lighting, Building and Environment 64 (2013) 67–76. https://doi.org/10.1016%2Fj.buildenv.2013.02.013
- Y. K. Yi and Y. K. Yi, Environmental Performance of Furniture Layouts in SI Housing, Journal of Asian Architecture and Building Engineering 9 (2010) 547–553. https://doi.org/10.3130%2Fjaabe.9.547
- M.-C. Dubois, Impact of Solar Shading Devices on Daylight Quality: Measurements in Experimental Office Rooms, Lund, Lund University, 2001.
- M. Ghasemi, M. Z. Kandar, and M. Noroozi, Investigating the effect of well geometry on the daylight performance in the adjoining spaces of vertical top-lit atrium buildings, Indoor and Built Environment 25 (2016) 934–948. https://doi.org/10.1177%2F1420326x15589121
- D. R. Ossen, Building simulation for energy efficient solar shading, in Methodology in Architectural Research, 2008, UTM Press, Johor, Malaysia.
- S. Mirrahimi, et al., Optimal of daylighting performance with shading device via computer simulation for office building in Malaysia, Advances in Natural and Applied Sciences, 7 (2013) 51-60.
- Y.-W. Lim and C. Y. S. Heng, Dynamic internal light shelf for tropical daylighting in high-rise office buildings, Building and Environment 106 (2016) 155–166. https://doi.org/10.1016%2Fj.buildenv.2016.06.030
- F. Linhart, S. K. Wittkopf, and J.-L. Scartezzini, Performance of Anidolic Daylighting Systems in tropical climates – Parametric studies for identification of main influencing factors, Solar Energy 84 (2010) 1085–1094. https://doi.org/10.1016%2Fj.solener.2010.01.014
- M. H. Ahmad, et al., Methodology In Architectural Research. 2008, Johor, Malaysia, UTM Press.
- S. M. Mousavi, T. H. Khan, and Y.-W. Lim, Empirical validation of Radiance-IES daylight simulation for furnished and unfurnished rooms under a tropical sky, International Journal of Sustainable Building Technology and Urban Development 7 (2016) 61–69. https://doi.org/10.1080%2F2093761x.2016.1167646
- G. D. Ander, Daylighting performance and design, 2003, John Wiley & Sons.
- Weather, Weather History for WSSL nearest airport to Johor Bahru, 2015, Weather Underground, Accessed from: http://www.wunderground.com/history/airport/WSSL/2015/3/11/DailyHistory.html?req_city=Johor+Bahru&req_state=&req_statename=Malaysia&reqdb.zip=00000&reqdb.magic=13&reqdb.wmo=48692: meteorological station.
- C. L. Robbins, Daylighting: Design and Analysis, 1986, New York, Van Nostrand Reinhold Company.
- IES, Lighting Handbook: Reference and Application, (8th ed., Illuminating Engineering Society of North America (IESNA), 1993.
- M. D. Egan and V. Olgyay, Architectural lighting. 2002, McGraw-Hill, New York.
- G. K. Alison and W. T. Grondzik, The Green Studio Handbook: Environmental Strategies for Schematic Design, 2007, London, UK, Elsevier Inc.
- V. Murray, C. O’Flynn, and K. Beattie, Advanced building services simulation software providing design solutions in Dublin and Boston, in: 7th Internation IBPSA Conference, Brazil: Rio de Janeiro, 2001.
- Radiance, IES Virtual Environment : Introduction to Lighting, in: Integrated Environmental Solutions Limited, 2014.
- DSM, MS 1525. Code of Practice on Energy Efficiency and Use of Renewable Energy for Non-Residential Buildings, Department of Standards Malaysia, 2007.
- CIBSE, Code for interior lighting. London: The Chartered Institute of Building Services Engineers, 1994.
- CIE, Guide on Interior Lighting, in Second Edition1986, Commission Internationale de l’Éclairage (CIE), Vienna, Austria.
- M. Ahmad, Y. W. Lim, and R. O. Dilshan, Empirical validation of daylight simulation tool with physical model measurement. American Journal of Applied Sciences 7 (2010) 1426-1431. https://doi.org/10.3844%2Fajassp.2010.1426.1431
- Y.-W. Lim, M. H. Ahmad, and D. R. Ossen, Internal Shading for Efficient Tropical Daylighting in Malaysian Contemporary High-Rise Open Plan Office, Indoor and Built Environment 22 (2012) 932–951. https://doi.org/10.1177%2F1420326x12463024
Copyright © 2018 The Author(s). Published by solarlits.com.

2152
Total views
Citations
SHARE ON


