Article Outline
Figures and tables
Volume 6 Issue 2 > pp. 112-123 • doi: 10.15627/jd.2019.11
Automatic vs Manual Control Strategy for Window Blinds and Ceiling Lights: Consequences to Perceived Visual and Thermal Discomfort
Nicola Lolli,a,* Alessandro Nocente,a Johannes Brozovsky,b Ruth Woods,c Steinar Grynninga
Author affiliations
a SINTEF Community, Trondheim, Norway
b Department of Architecture and Technology, Norwegian University of Science and Technology, Trondheim, Norway
c Department of Interdisciplinary Studies of Culture, Norwegian University of Science and Technology, Trondheim, Norway
* Corresponding author.
nicola.lolli@sintef.no (N. Lolli)
alessandro.nocente@sintef.no (A. Nocente)
johannes.brozovsky@ntnu.no (J. Brozovsky)
ruth.woods@ntnu.no (R. Woods)
steinar.grynning@sintef.no (S. Grynning)
History: Received 8 October 2019 | Revised 13 November 2019 | Accepted 18 November 2019 | Published online 19 November 2019
Copyright: © 2019 The Author(s). Published by solarlits.com. This is an open access article under the CC BY license (http://creativecommons.org/licenses/by/4.0/).
Citation: Nicola Lolli, Alessandro Nocente, Johannes Brozovsky, Ruth Woods, Steinar Grynning, Automatic vs Manual Control Strategy for Window Blinds and Ceiling Lights: Consequences to Perceived Visual and Thermal Discomfort, Journal of Daylighting 6 (2019) 112-123. http://dx.doi.org/10.15627/jd.2019.11
Figures and tables
Abstract
A case study to evaluate the occupants' satisfaction in relation to two different control strategies (fully automatic and manual) for blind and ceiling lights use in cell offices was carried on in Trondheim, Norway. A group of 11 participants with varying age, gender, and ethnicity, used two test cells of a laboratory as a workspace primarily carrying out office tasks at a personal computer for a total of 19 calendar days. The participants were asked to answer a computer-based questionnaire for reporting their perceived thermal and visual comfort. Concurrently, measurements of the indoor operative temperature, illuminance level, and operation of windows, blinds, and ceiling lights were registered. Results shows that the use of the automatic control strategy led to a higher visual discomfort, which in addition led to a higher thermal discomfort, despite this last not caused by a higher average operative temperature.
Keywords
Window blind use, Control strategy, Visual discomfort, Thermal discomfort
1. Introduction
Daylight and solar radiation have a known influence on human health, by regulating the circadian rhythm, mood and behaviour, and synthesising vitamin D. Disruption of day/night cycles is associated to higher incidence of cardiovascular diseases, sleeping problems, depression, and reduction in cognitive functions [1-5]. In such a perspective, the window-blind system is one of the building's most complex physical interface, as it is required to allow satisfactory daylight penetration, ensure view, avoid glare, and limit the thermal exchange between the indoor space and the outdoor environment.
Occupant's perceived comfort is largely affected by the degree of interaction between building's users and window-blind systems. As several studies showed [2,6-8], occupants in offices tend to prefer manually operated blinds. Vine et al. [6] found that users largely prefer manual blind systems to automatic systems and complained when the automatic blind reduce too much the indoor overall illuminance. These findings where confirmed by Reinhart and Voss [7] who showed that office users accept an automatic blind system when this operates by raising the blinds. Moreover, in the same study it was shown that when the blinds were deployed to reduce incoming solar radiation, the occupants rose them back in 88% of the occasions. Vine et al. [6] found that users largely prefer manual blind systems to automatic systems and complained when the automatic blind reduce too much the indoor overall illuminance. These findings were confirmed by Reinhart and Voss [7] who showed that office users accept an automatic blind system when this operates by raising the blinds, and when the blinds were automatically operated to reduce incoming solar radiation, these were rose back in 88% of the occasions. Similarly, Karlsen et al. [9] found that building's occupants highlighted the outdoor view as a critical factor for satisfaction and they could endure a certain level of glare as long as the view was maintained. From these findings, the authors highlighted that buildings' occupants preferred to use cut-off strategies for positions of blinds rather than a strategy with either fully closed or fully open blind when shading was activated. According to an extensive literature review by Van Den Wymelenberg [10], typical blind occlusion values as several factors influence the occupants' preferences. Several authors [10-20] showed that orientation and sky condition, are the most critical factors to determine blind occlusion, whereas season, time of day, view type, and cooling system type have also been reported to have an influence. North and south orientations showed to be critical for determining the blind occlusion by a large extent, where typically 15–25% was reported for north orientation and 40–70% for south orientation [10,17,18]. Whether is visual or thermal comfort to influence the blind operation, it is still debatable. Many authors [12,14,19] reported that office occupants operated blinds in response to achieve a better visual comfort than thermal comfort. However, according to O'Brien et al. participants in surveys reported to operate blinds in response to reduce solar gains [20]. It is worth noting that in mechanically air-conditioned spaces the occupants tended to use less blinds to adjust the indoor thermal environment, whereas in buildings with natural or hybrid ventilation systems the occupants tended to use more the blinds to achieve thermal comfort [12].
Artificial lighting can contribute to between 20% and 60% [21] of a building's total electricity consumption and the use of naturally available daylight may save considerable amount of energy and greenhouse gas emissions. Energy savings from better use of daylighting in office spaces have been estimated between 20% and 80% [22,23], depending on the control strategy for artificial light operation and blind use. Strategies for maximising the use of daylight and reducing the buildings' energy use for artificial lighting need to consider the comfort for the building users' in relation to their visual task. From this consideration, this study investigates the occupant's discomfort in relation to automatic and manual control strategies for blind use, and the consequence for artificial lighting use, by developing from the previous investigation by Grynning et al. [8].
The objective of this paper is to investigate the discomfort in relation to the luminous environment in two cell offices with different control strategies for blind use and artificial lighting use, under a Nordic climate and high latitude sky conditions.
2. Method
A group of 11 participants with varying age (between 20 and 60 years), gender (4 males and 7 females), and ethnicity (North, Central, and South Europe, Middle East, and Asia), used the ZEB Test Cell Laboratory [1] as a workspace for two to four days for a minimum of 5 hours per day, and primarily carrying out office tasks at a personal computer. The ZEB Test Cell Laboratory is constituted by two identical cells. Each test cell was assigned as a working space to each participant for a minimum of two consecutive days, to let all the participants acclimatise and get acquainted with the control options of each of the test cells. However, it was not always possible to have each of the participants either sitting in the same test cell for two consecutive days or sitting in each cell, due to not fitting work schedules. The experiment lasted for 19 calendar days, both the test cells were occupied for a total of 36 days, of which 21 days were assigned to female participants and 15 days to male participants. Information regarding the scope of the experiment was given to the participants before, and specifically, the participants were instructed to use the test cell as their working space, to take breaks during the day, and to make themselves comfortable. To replicate a typical office setting, a motorized office desk, a reclining office chair, a sofa and a plant were placed in each cell. Food, fruit, tea, and coffee were also provided in the kitchen to make the environment more comfortable and to limit the potential distress due to hunger and thirst. The participants were asked to answer a computer-based questionnaire for reporting their perceived thermal and visual comfort, and perceived IAQ. Concurrently, measurements of the indoor air, radiative, and surface temperature, relative humidity, CO2 concentration, and power use of light, office equipment, and water-based radiators were registered. In addition, the use of windows, sun shading and doors were recorded. Further details on the questionnaires and measurement are reported in the following sections.
2.1. The experimental facility
The ZEB Test Cell Laboratory [24] is located at the Norwegian University of Science and Technology in Trondheim, Norway. The facility is constituted by two identical test cells with the size of a typical single-person office room, 2.4 m × 4.2 m × 3.3 m respectively width, length, and height (Fig. 1). The walls, ceiling, and floor of each of the two test cells are made of prefabricated sandwich panels (U-value of 0.23 W/m2K). Both cells are suspended from the ground floor, leaving a clearance of circa 50 cm and are surrounded by a guard room, as shown in Fig. 1. The south-facing façade of each cell (gross dimensions of 2.4 m × 3.3 m width and height respectively) is exposed to the outdoor environment and can be replaced to perform tests on different components and materials. The cells and the guard rooms are equipped with independent HVAC systems, and this gives the possibility to carry out both comparative and calorimetric tests. An auxiliary independent air handling unit provides fresh air intake to the guard rooms and to the auxiliary spaces of the facility. The facility is equipped with an average of 520 sensors, which allow monitoring several physical quantities such as the internal and external cells wall temperature, differential pressure between the cell and the guard, and between the cell and the outdoor environment, IAQ and illuminance, and weather information from the weather station mounted on the roof.
Figure 1

Fig. 1. (a) South facade of the ZEB Test Cell and (b) plan of the building.
2.2. Description of façade and windows
The layout of the windows installed in the ZEB Test Cell Laboratory for the experiment described in this paper is shown in Fig. 2. Each window has a width of 2.018 m and a height of 2.088 m, and it is constituted by four glazed units. The glazing units are made of a triple glass (two 4-mm low-e panes on the two external sides and a clear 4-mm pane at the middle) with two Argon gaps of 16 mm. The overall glazing’s and window’s specifications are summarised in Table 1. Units 1 and 4 are fixed; unit 3 is manually controlled and can be fully opened or tilted. Unit 2 is motorised, and the tilting can be controlled by the user or by the control system. In the experiments presented in this work, unit 3 in Cell A was automatically controlled according to the internal temperature in the room, while, in Cell B, it was directly controlled by the users via a wall-mounted switch. All doors and windows were equipped with magnetic sensors installed to detect the opening or the tilting, and all information was logged every minute in the acquisition system. Cameras were used to record the participants' presence and clothing factor every minute.
Figure 2
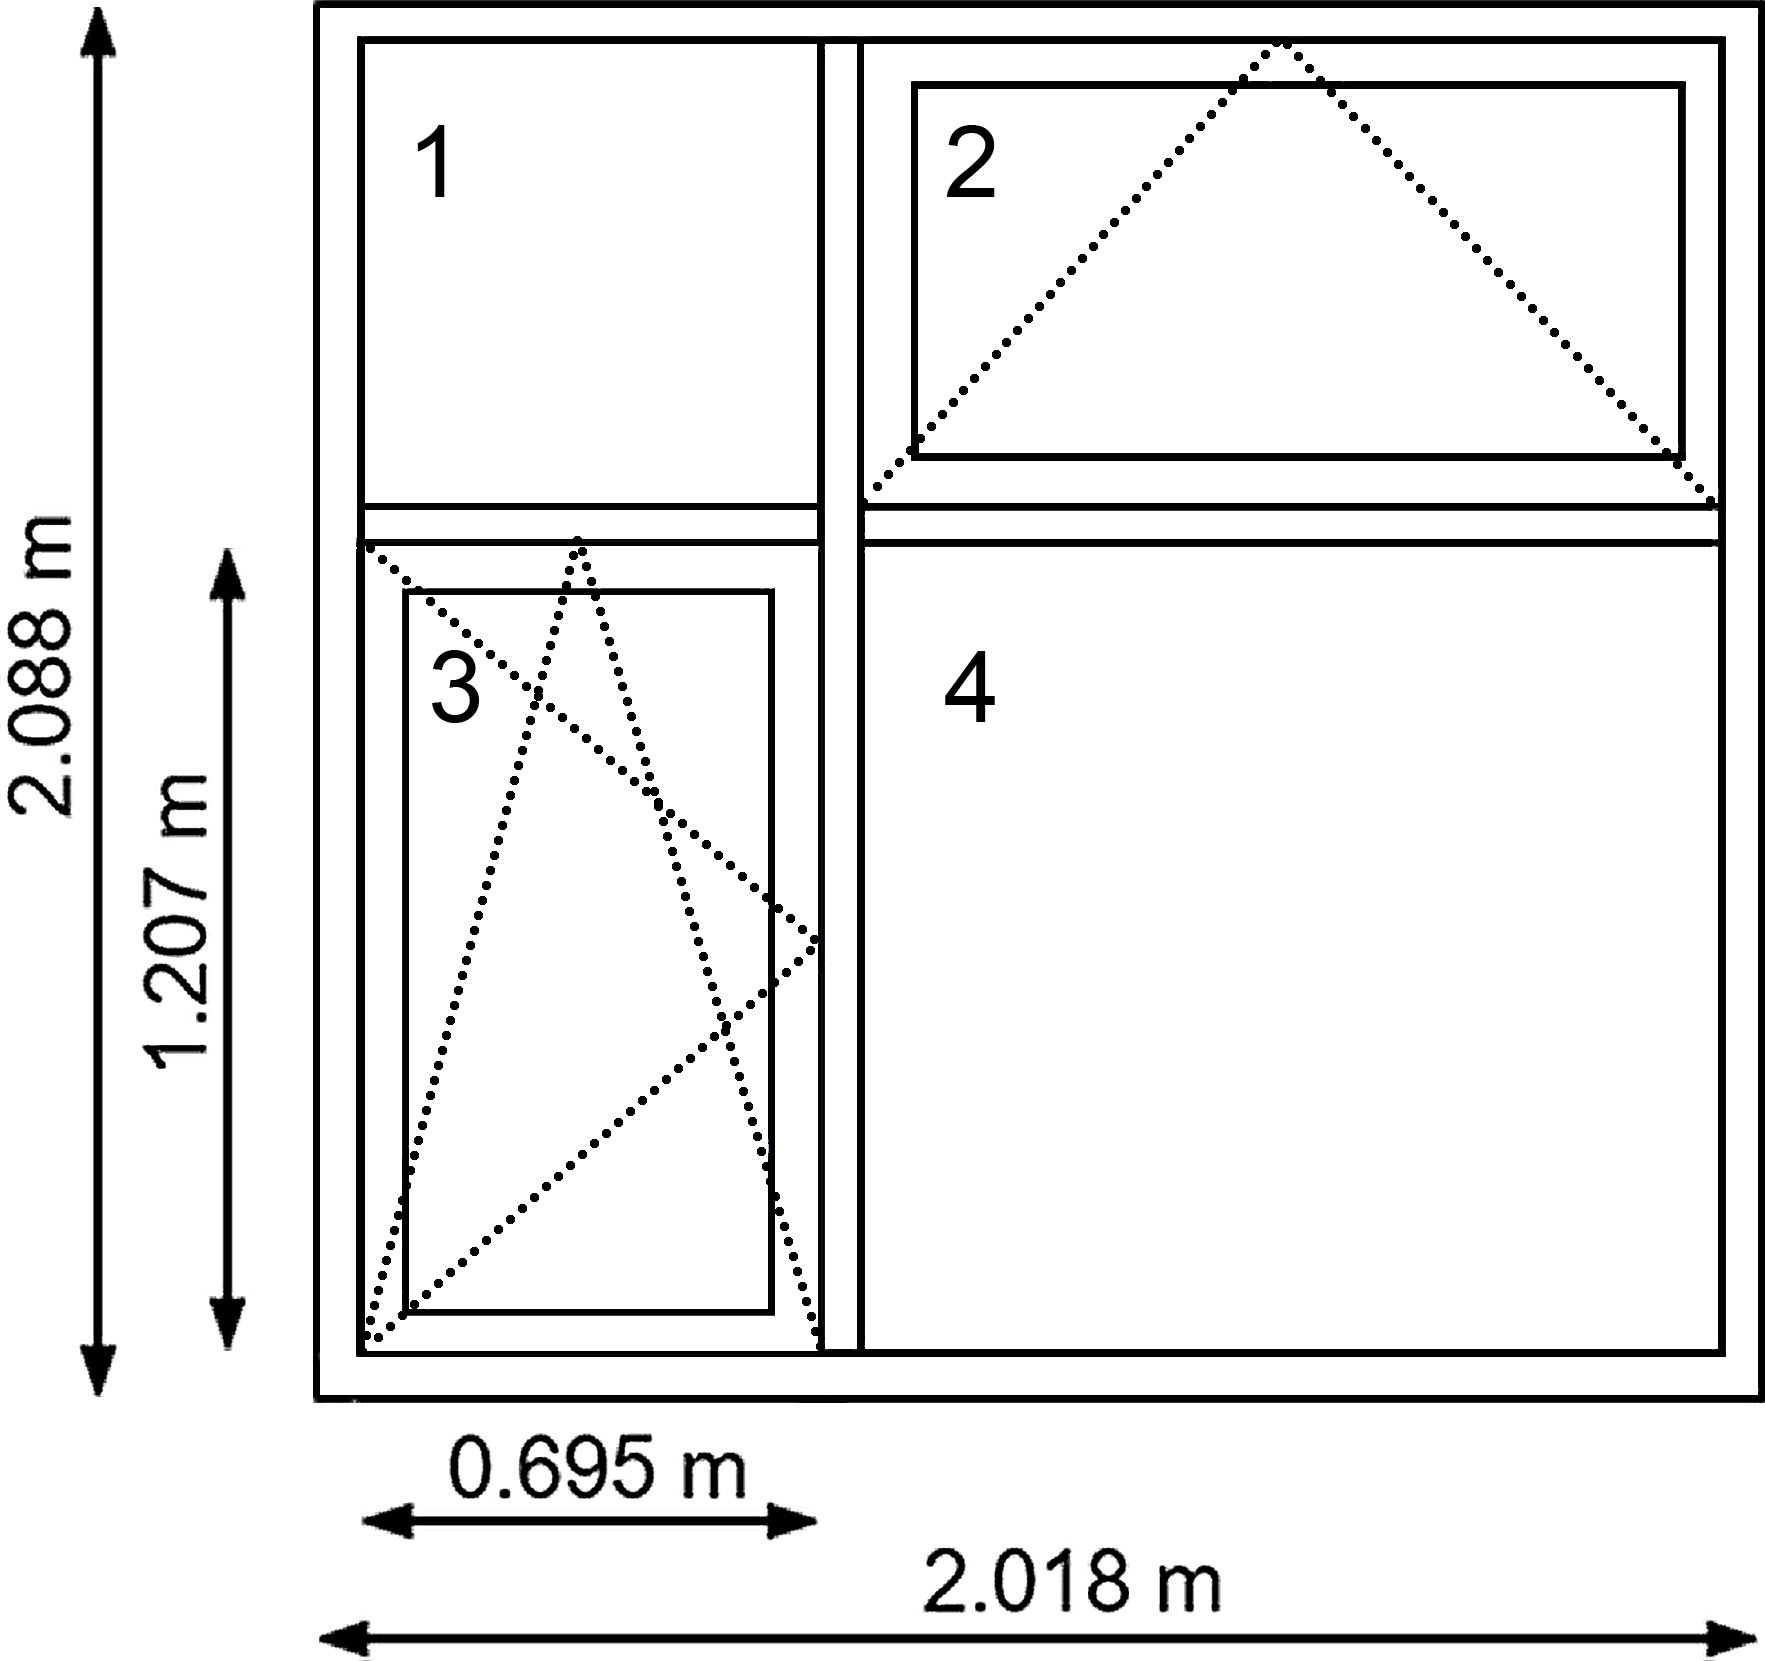
Fig. 2. Dimensions and layout of the window installed in each cell.
Table 1
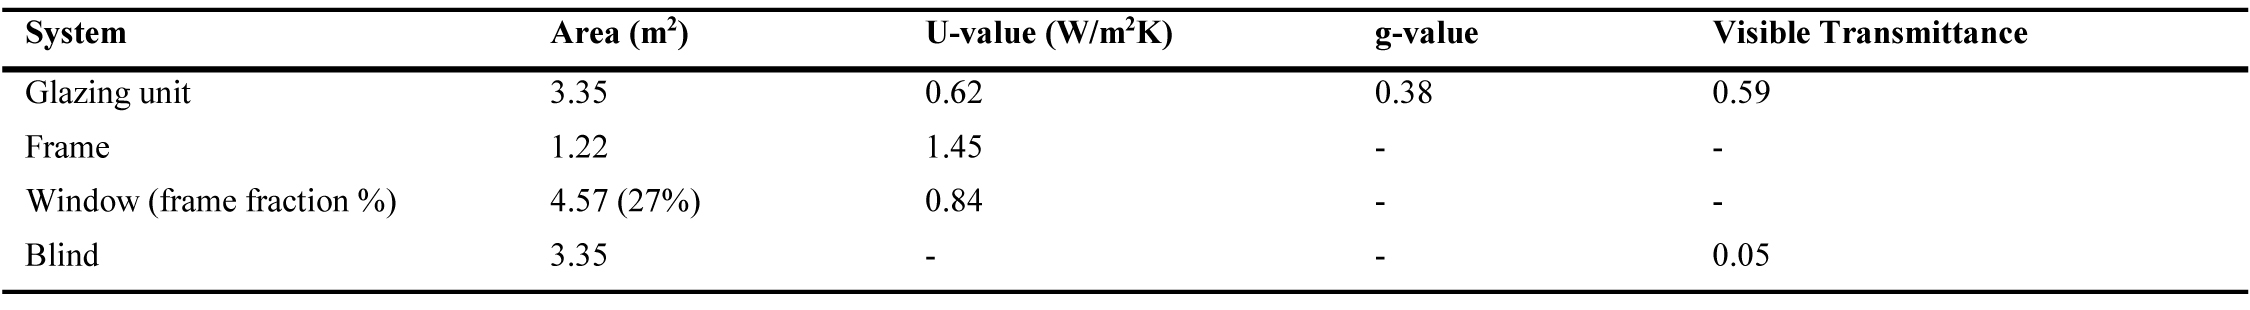
Table 1. Technical specifications of window and blind.
2.3. Experimental setup
The two rooms were identically furnished as a typical office space with motorized desks, reclining office chairs, and armchairs, as shown in Fig. 3. On each desk, there were a desk lamp (35 W), a laptop (150 W) used by the participants to compile the questionnaires, and an LCD computer screen (120 W). The participants brought their own laptops during the experiment. Three fluorescent lamps (180 W nominal) were available in each cell to provide general room lighting. Two different strategies for controlling the indoor environment were used in the experiment. In Cell A, the ceiling-mounted lights, the opening of the top motorized window, and the solar shading were controlled by the main acquisition and control system. The participants manually controlled the desk lights. In Cell B, the participants were given the control of the ceiling lights and the solar shading, which were operated by wall-mounted switches. They could also operate the desk light. Ventilation was provided by the mechanical system to both cells in order to replicate the typical HVAC setting in office buildings. All controls activations (either by the central computer or the participants) were logged during the whole duration of the experiment. A summary of the control strategies is reported in Table 2.
Figure 3
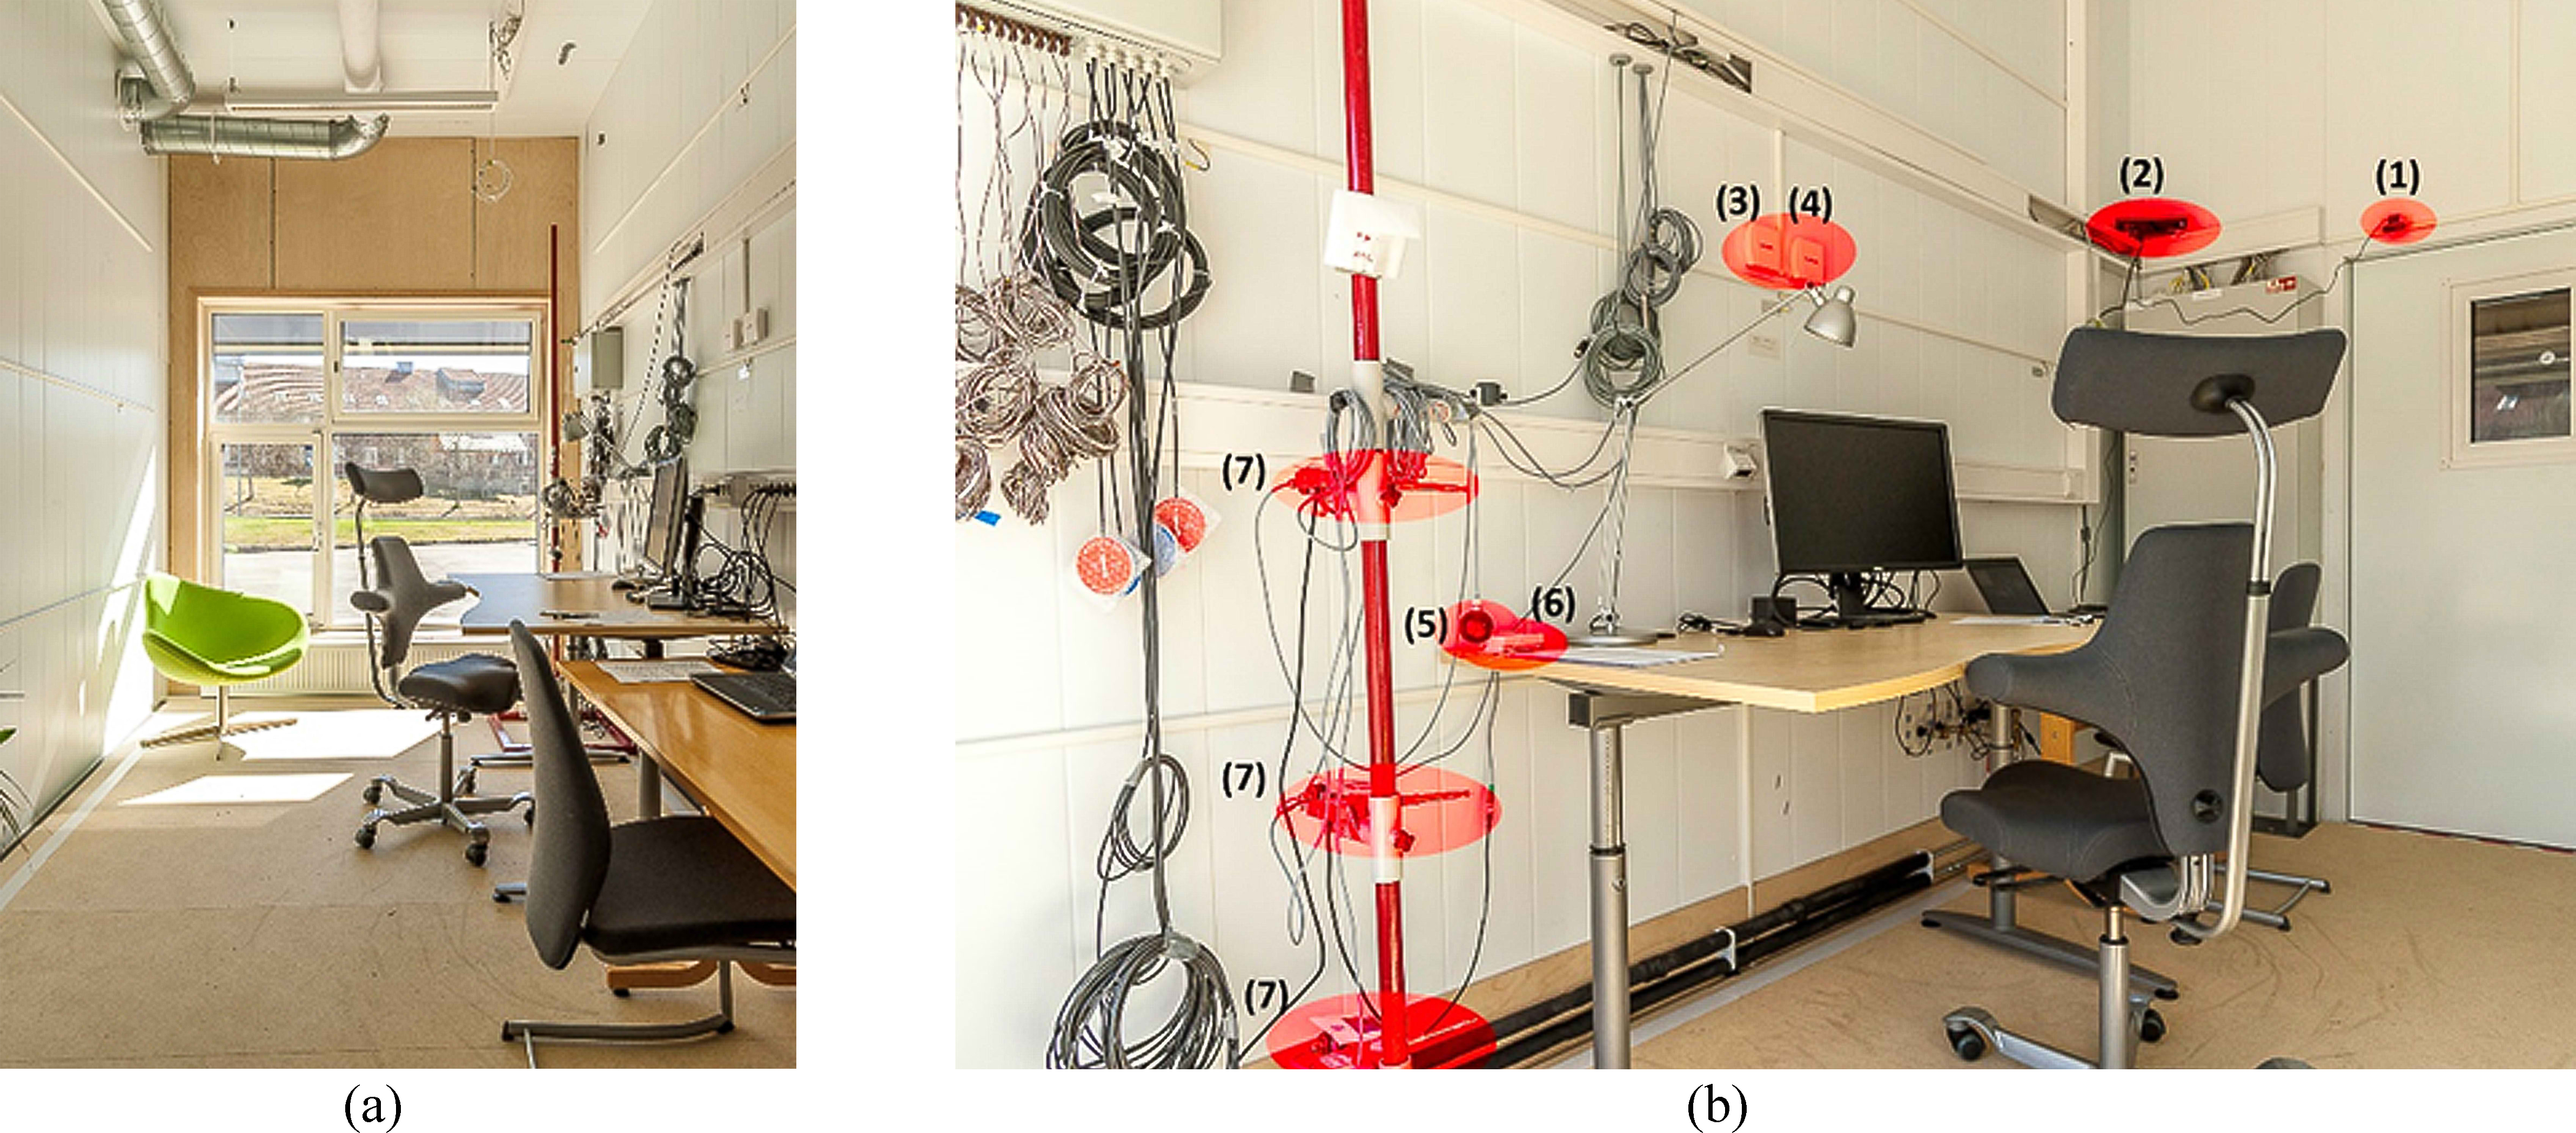
Fig. 3. (a) and (b) Showing the test cell setup. 1) Camera, 2) Microsoft Kinect (recorded data not presented in this paper, 3) CO2 sensor, 4) Relative humidity sensor, 5) globe thermometer for radiant temperature, 6) Illuminance sensor, and 7) anemometer for air velocity and Pt100 thermometers for air temperature.
Table 2
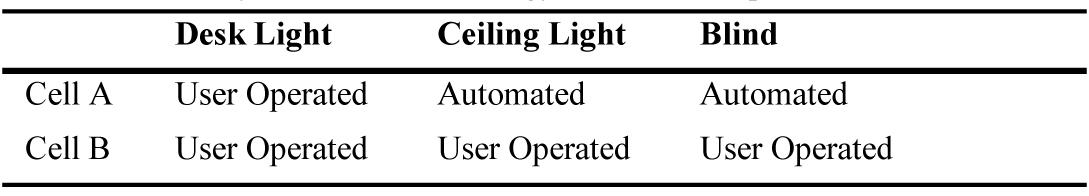
Table 2. Summary of the control strategy used in the experiment.
The surface temperature of the internal wall was measured by several K-type thermocouples distributed as follows: 5 on the two side walls, 3 on the floor and the ceiling, 4 on each window and one above the door. The air temperature was measured with 3 Pt100 thermometers mounted on racks and placed at different heights following the recommendation of the ISO 7726:1998. The latter were protected against solar radiation by cardboard screens. The radiant temperature of the room was measured by a black globe thermometer mounted on the rack by the side of the office desk, as shown in Fig. 3. Three portable anemometric probes with omnidirectional hot wire were installed next to the three Pt100 thermometers. The carbon dioxide level in the rooms was measured using a transducer with a range of 0 – 2000 ppm (accuracy ± 100 ppm). A humidity sensor (accuracy ± 3% RH) was placed next to the CO2 sensor. The illuminance sensor (measurement range was set to 0 – 1000 lux and accuracy 5% of measured value) was placed on the window-side of the office desk, in order to measure the sunlight on the desk, furthermore it was used to trigger the deployment of the automatic shading as soon as direct sunlight was hitting the desk. This was done to avoid sun patches on the working area and the wall behind the computer screens that could have caused glare.
The following logic was used in the LabVIEW software that controlled the operations in Cell A. The ceiling-mounted lights were operated by the system in response to the illuminance measured on the desk, as described in the section above, according to Fig. 4.
Figure 4
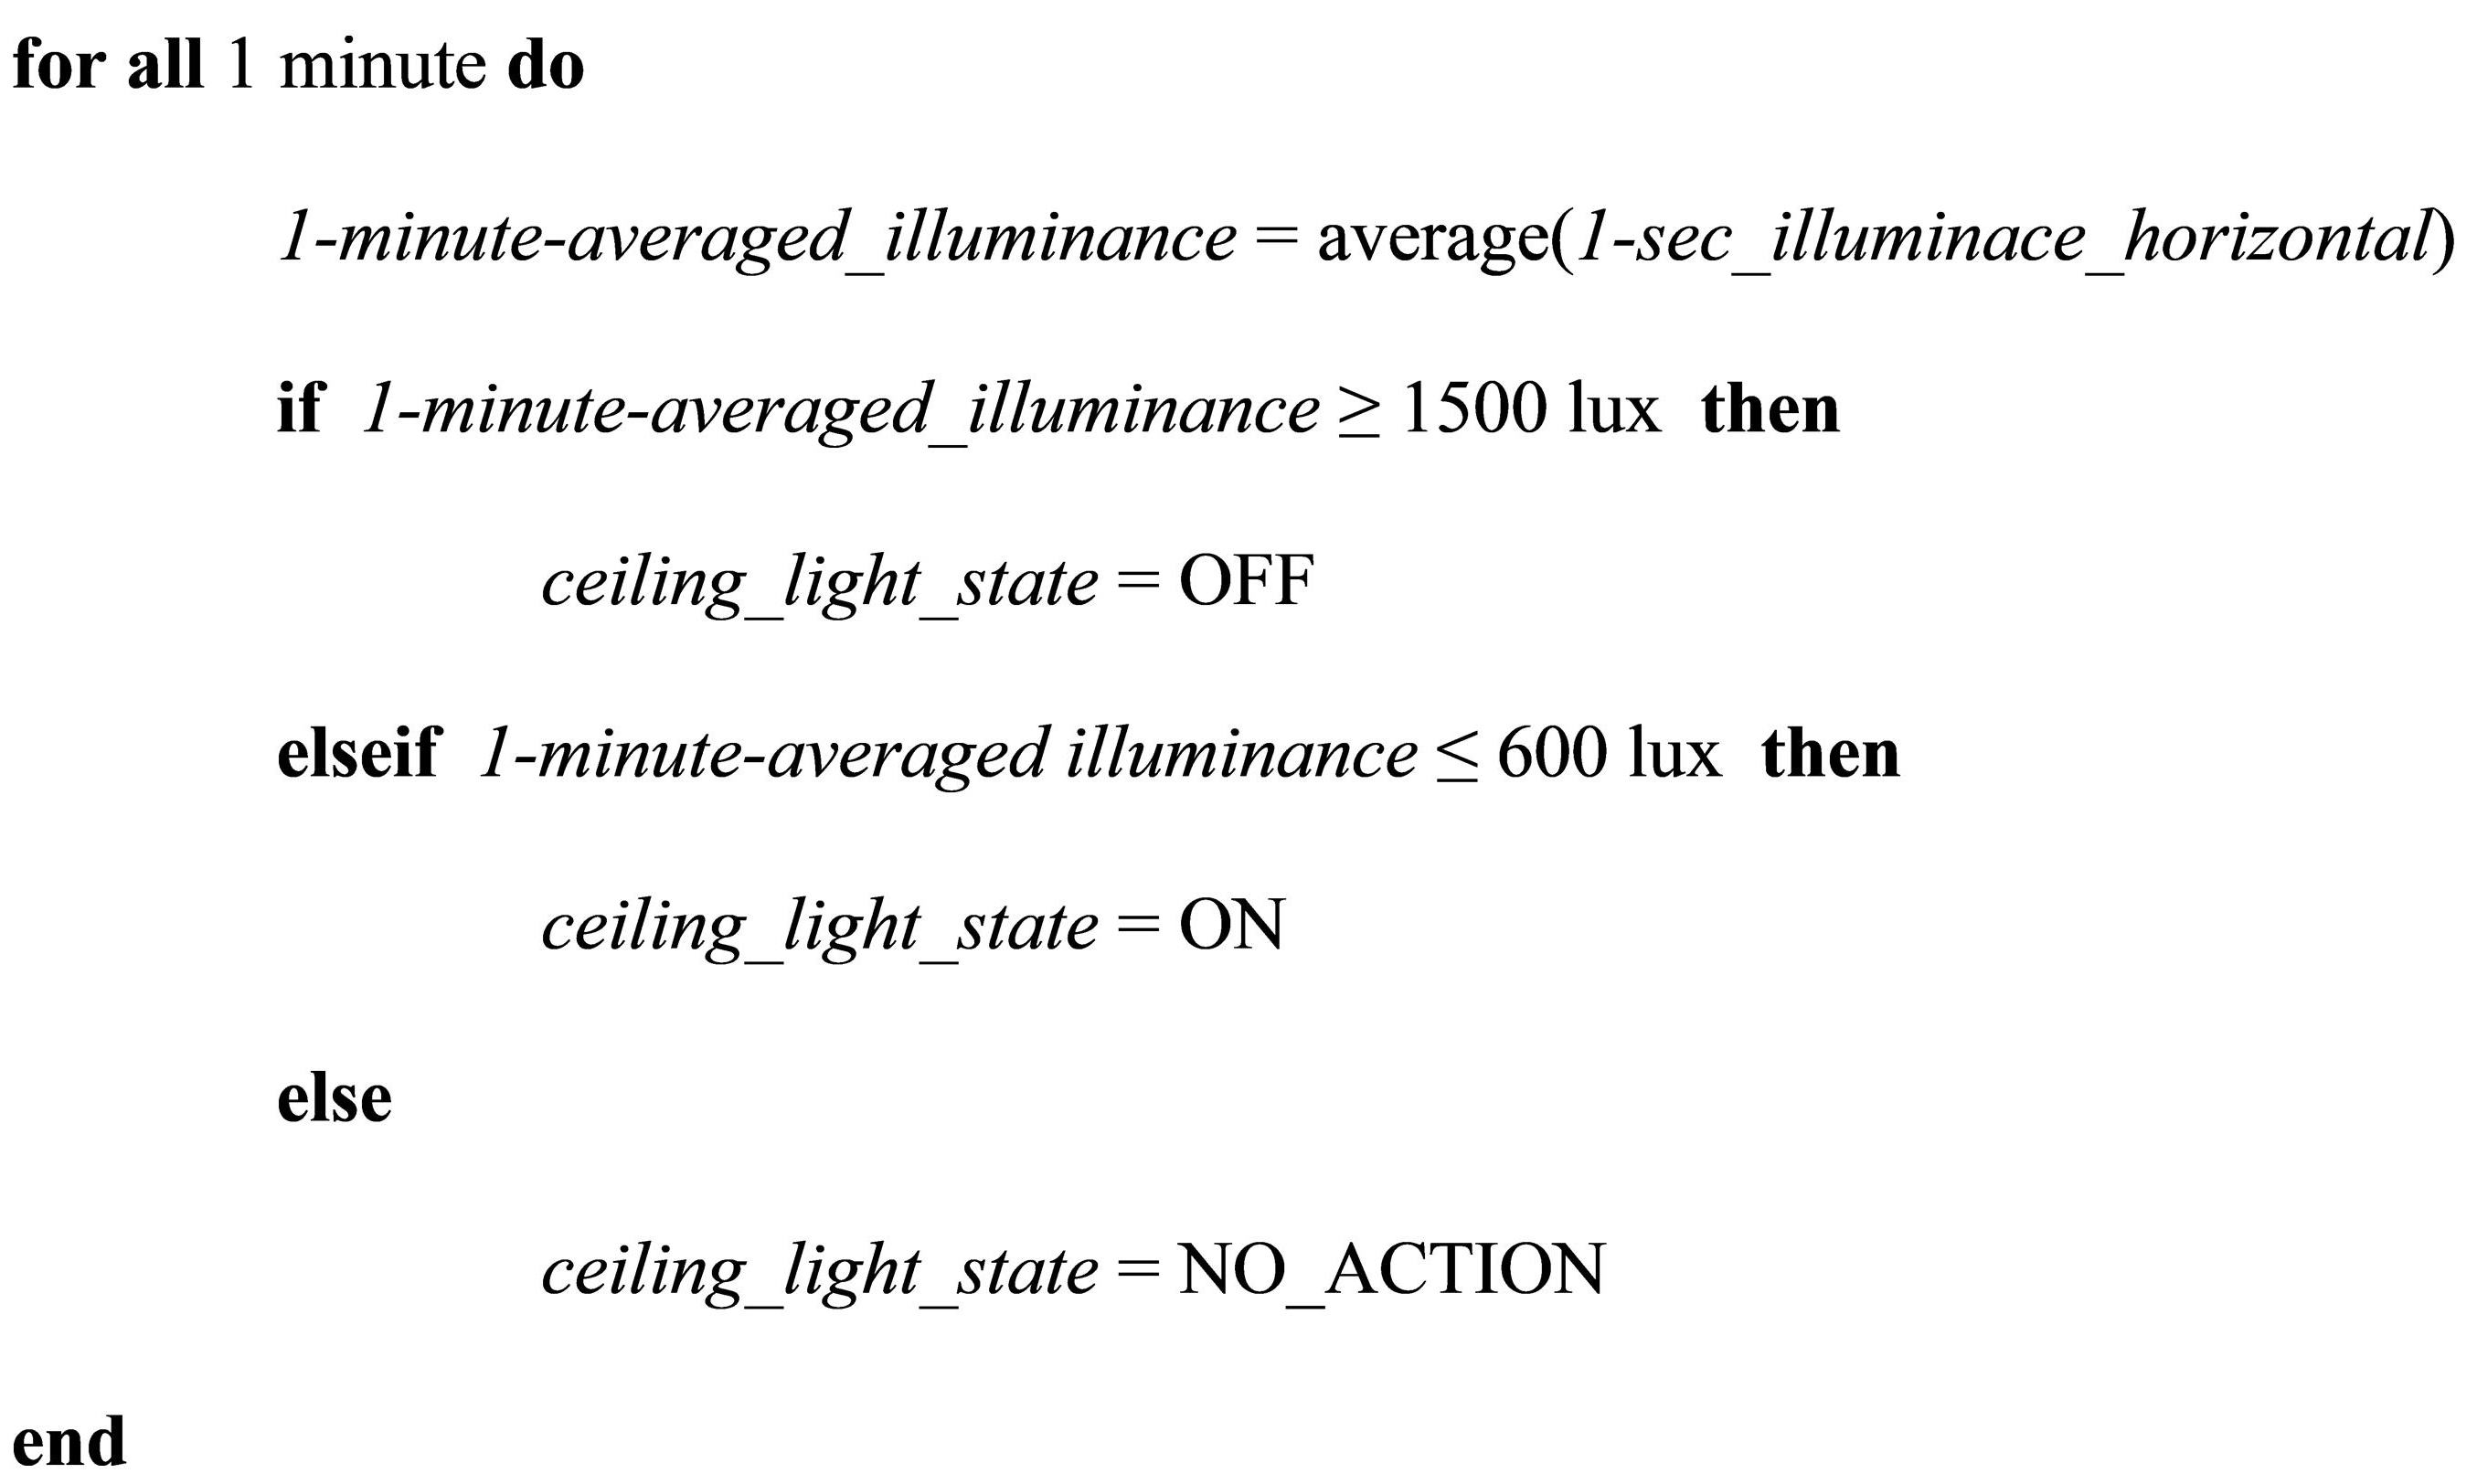
Fig. 4. Control strategy for the ceiling lights.
In the interval 600–1500 lux, a buffer zone was defined to avoid the continuous operation of the lights due to sudden changes of the outdoor sky luminance, and thus leading to dissatisfaction.
The motorized sun shading, mounted outside the window, was operated according to the same parameter used to control the ceiling lights, according to Fig. 5.
Figure 5
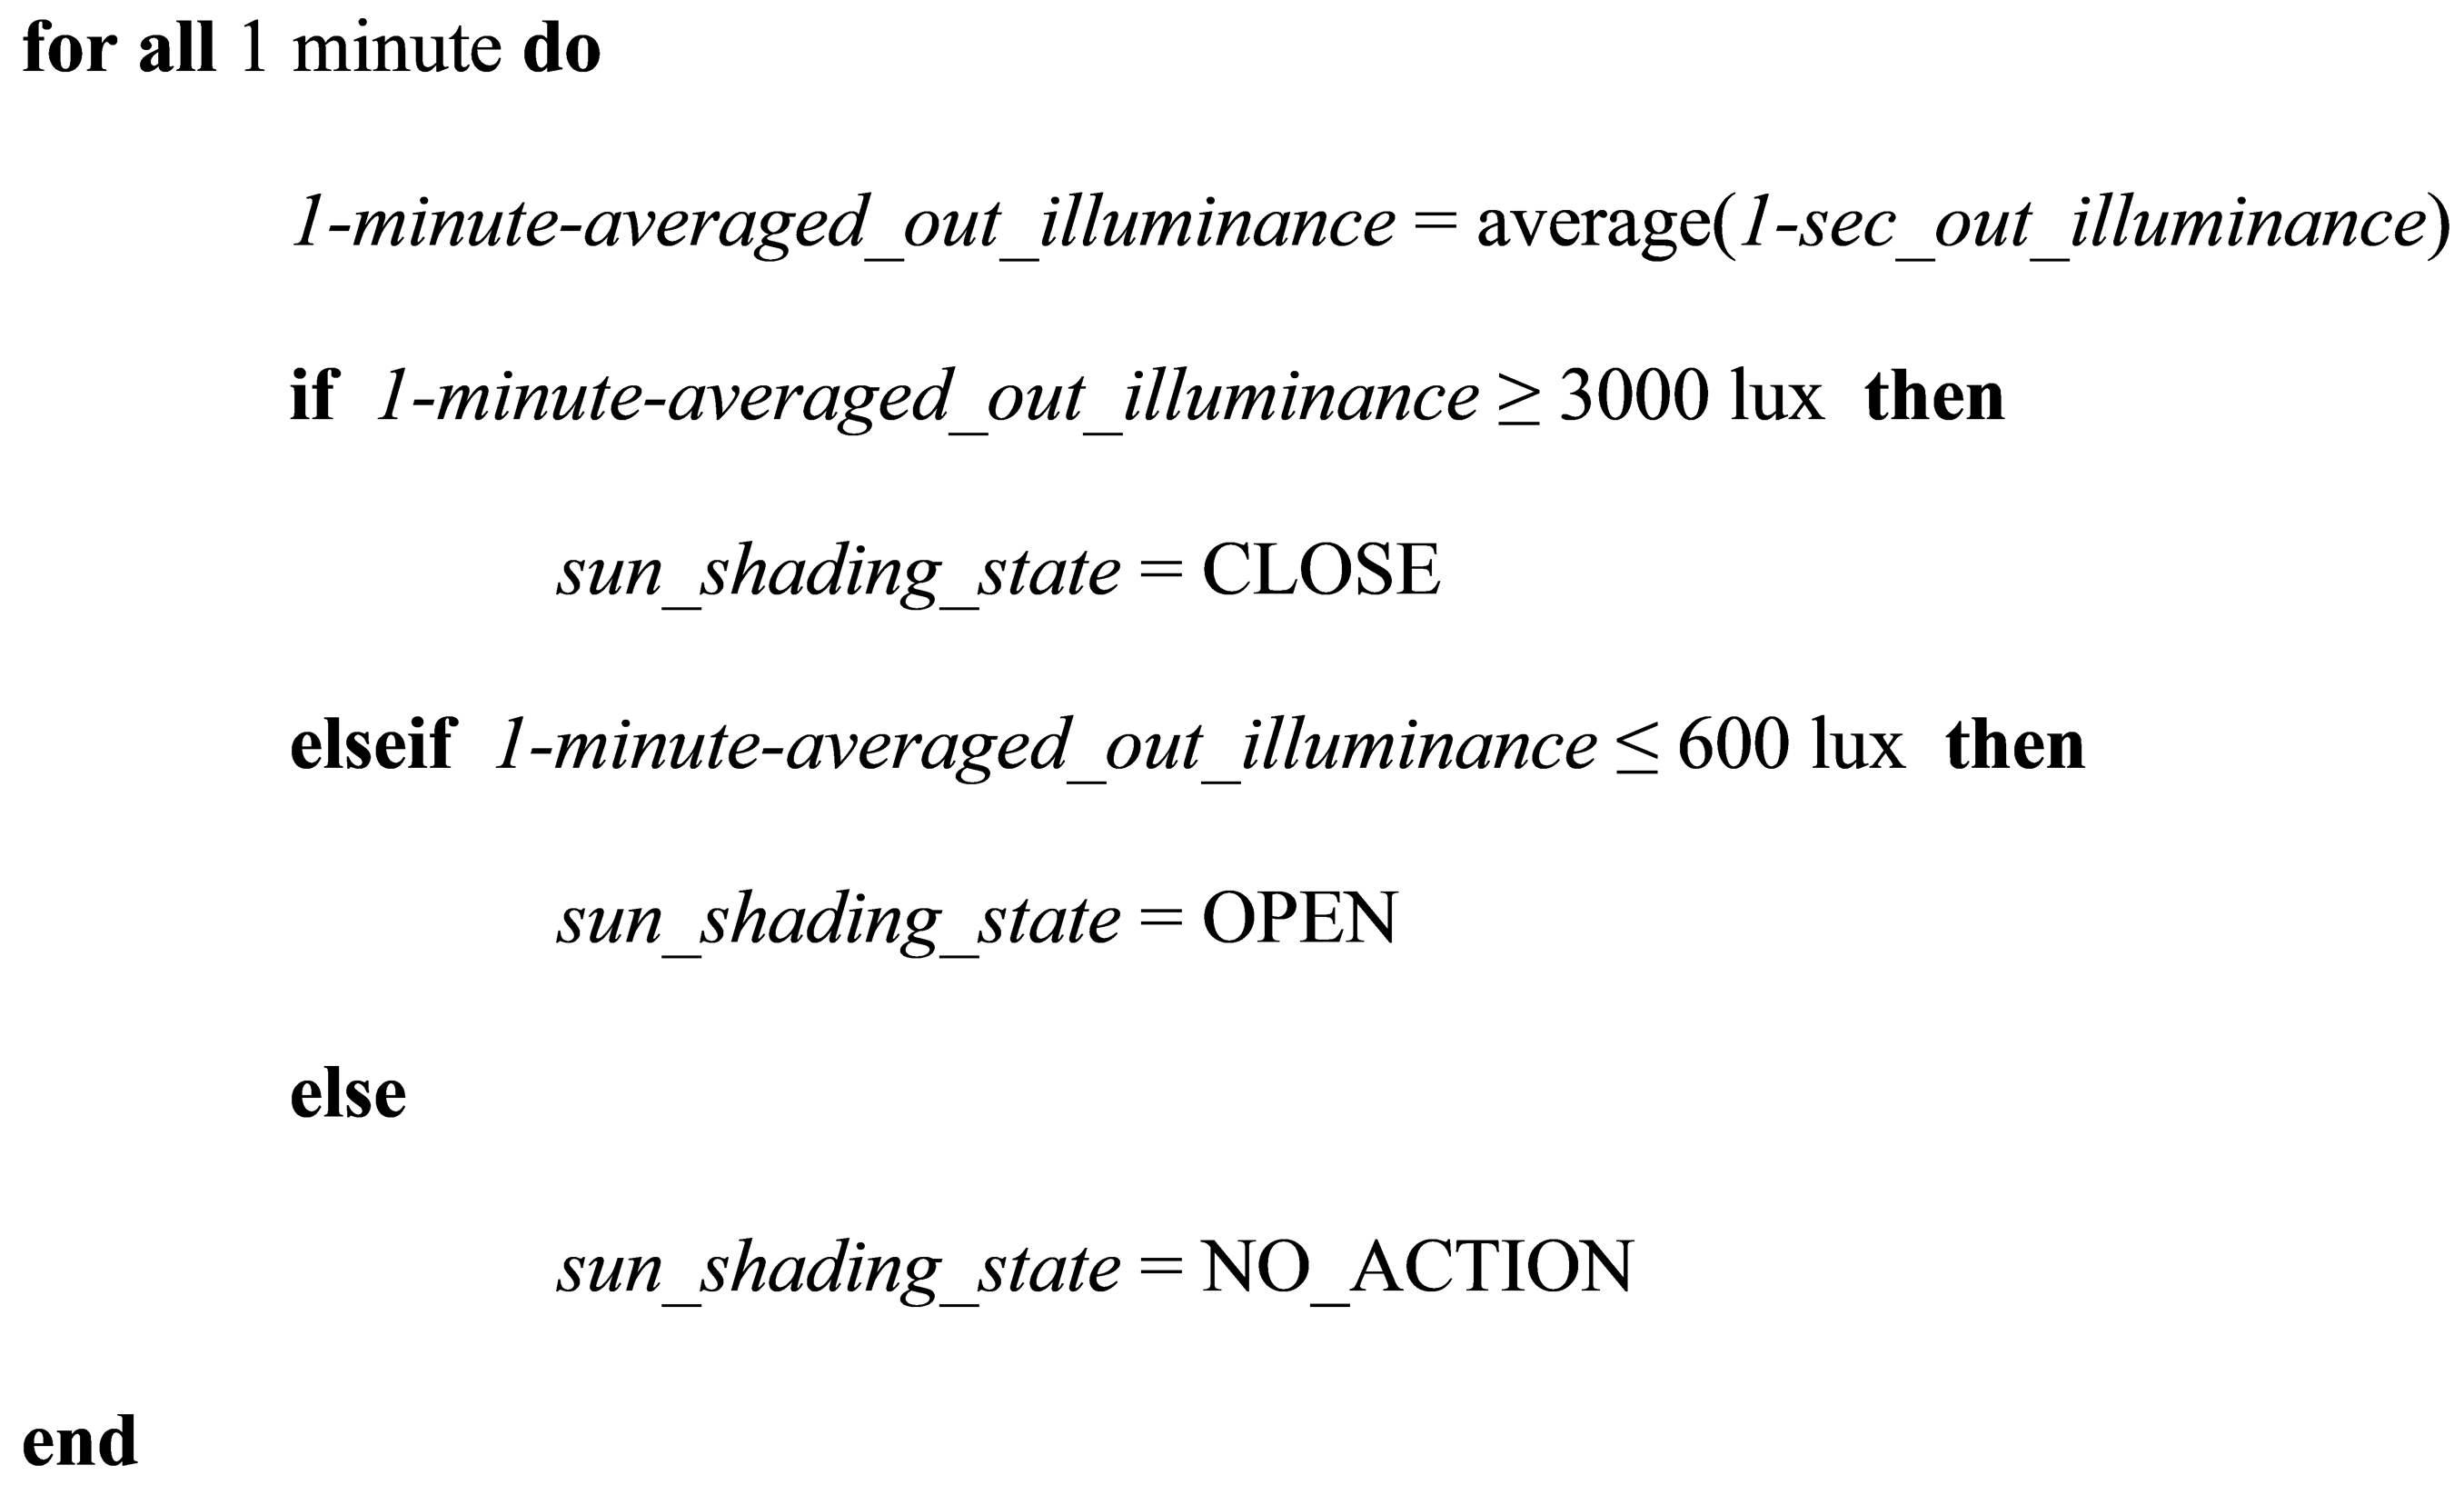
Fig. 5. Control strategy for the window blind.
Once the illuminance meter read more than 3000 lux, the computer sent the signal of closing the blind and started recording the illuminance level every 1 second. When the reading was below 3000 lux the computer sent the signal to stop the blind motor. This was done to avoid the total closure of the blind and to maximize the use of daylight. The choice of using 3000 lux as the maximum limit before deploying the solar shading was due to the very low visible light transmittance (4.9%) and solar transmittance (5.1%) of the installed product. Initial tests of the shading deployment at a 2000 lux level under partially overcast sky conditions reduced the illuminance at the desk below 600 lux, thus triggering the ceiling lights. To limit the use of ceiling lights the authors decided to rise the upper limit to 3000 lux, even if this might cause an increase of the glare [25-27].
The participants were asked to report their Thermal Sensation Votes (TSVs) and Illuminance Rating (IR) in a computer-based questionnaire and took part in individual interviews before and after their participation in the experiment. The initial interviews were meant to let the subjects acclimatize to the test cell indoor environment and to give information regarding the scope of the project and to get information regarding the participants' previous knowledge of thermal comfort, energy use in building, their preferred temperature and daily routines to save energy. A graphical interface was developed for the participants to report their initial clothing level, their mood, and their discomfort (temperature, illuminance/glare) throughout their working day. This software brings pop-ups on the computer display every 30 minutes. Pictures were taken every minute by a camera positioned on the door of the test cell to monitor the participants' position in the cell (if sitting at the desk or on the sofa by the window), activity, and clothing ensembles. The pictures were also used for double-checking the participants' changes of cloth layers that might not be reported in the questionnaire. The questionnaire was split in three parts. In the first part, the participants were asked only once per day to answer questions regarding their clothing level, their mood, physical conditions, and planned activities. In the second parts, the participants were asked to rate every 30 minutes their perceived thermal sensation, illuminance level (scale in Table 3), and open questions regarding what they would have liked to change in their environment. In the third and final part of the questionnaire, the participants were asked at the end of their working day to rate their overall comfort acceptability, what they would have changed in the environment during the day, and their physical conditions.
Table 3
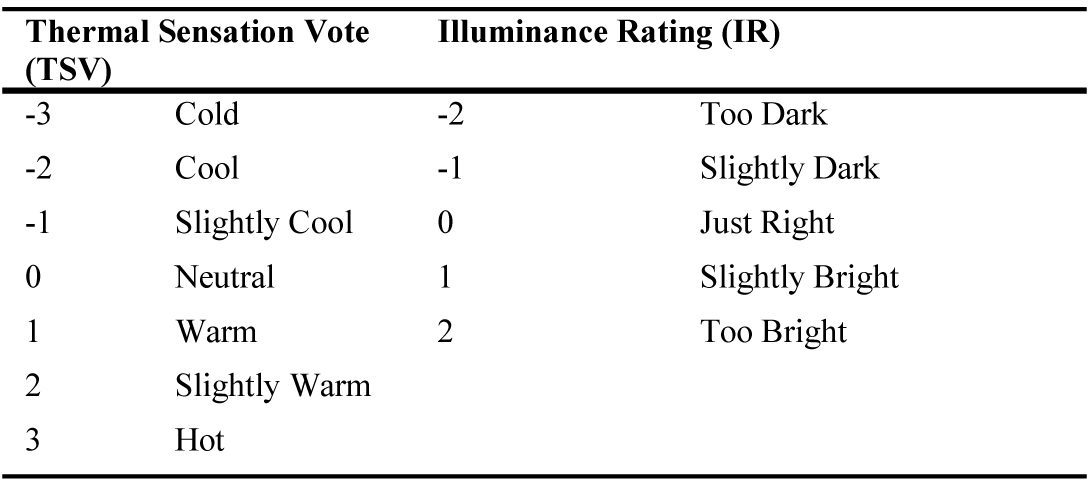
Table 3. Rating scale used in the questionnaire.
3. Results
During the experiment, Cell A was occupied for 6 361 minutes and Cell B for 7 004 minutes. Figure 6 shows the cumulative distribution (in minutes) of the Illuminance level recorded on the desk plane during the occupied time in either Cell A (a) or Cell B (b). The histograms represent the cumulative time of the recorded illuminance binned per 500 lux step and the curves are the quadratic interpolation of the values given by the histograms. The binning of the lux level is done by grouping the recorded illuminance according to the following scale: <500 lux, between 500 and 1000 lux (750 lux on scale), between 1000 and 1500 lux (1250 lux on scale), between 1500 and 2000 lux (1750 lux on scale), between 2000 and 2500 lux (2250 lux on scale), between 2500 and 3000 lux (2750 lux on scale), and >3000 lux. The most frequent illuminance levels registered in Cell A were between 750 lux and 1250 lux, plus a peak around 2250 lux (25% of the total occupied time). The saddle in the 1500-2000 lux range is due to the way the automatic control system was set to operate the blind (buffer zone). This resulted in a total of 710 minutes for a recorded illuminance level between 1500 lux and 2000 lux, and a total of 1536 minutes for the illuminance level between 2000 lux and 2500 lux. In Cell B, where the participants could manually operate the blind, the highest frequency of illuminance is around 750 lux (30% of total occupied time) and then gradually diminishes moving towards higher illuminance levels. The mean illuminance during the occupied time was 1578 lux in Cell A and 1120 lux in Cell B, as shown by the green continuous lines in Fig. 6.
Figure 6

Fig. 6. Time distribution of illuminance level and quadratic interpolation of the values (a) cell A and (b) cell B.
Figure 7 shows the distribution of the Illuminance Rating (IR) reported in either Cell A or Cell B. IR = 0 was reported for 4 247 minutes (67% of the total occupied time) in Cell A, and 5 687 minutes (81% of the total occupied time) in Cell B. IR = -1 was reported for 597 minutes (9% of total occupied time) in Cell A, and 1 046 minutes (15% of total occupied time) in Cell B. IR = 1 was reported for 1 402 minutes (22% of total occupied time) in Cell A, and 203 minutes (3% of total occupied time) in Cell B. The higher average illuminance level recorded in Cell A (due to the high number of minutes for which the illuminance fell between 2000 and 2500 lux) resulted in a higher discomfort reported by the cell occupants. The length of time for which the IR = 1 was reported in Cell A (1 402 minutes) is very close to the length to time during which the binned 2250 lux level was recorded (1 535 minutes). In Cell B, on the other hand, the occupants reported more frequently low illuminance levels (IR = -1), as the binned <500 lux level was recorded for 1470 minutes (21% of total occupied time).
Figure 7
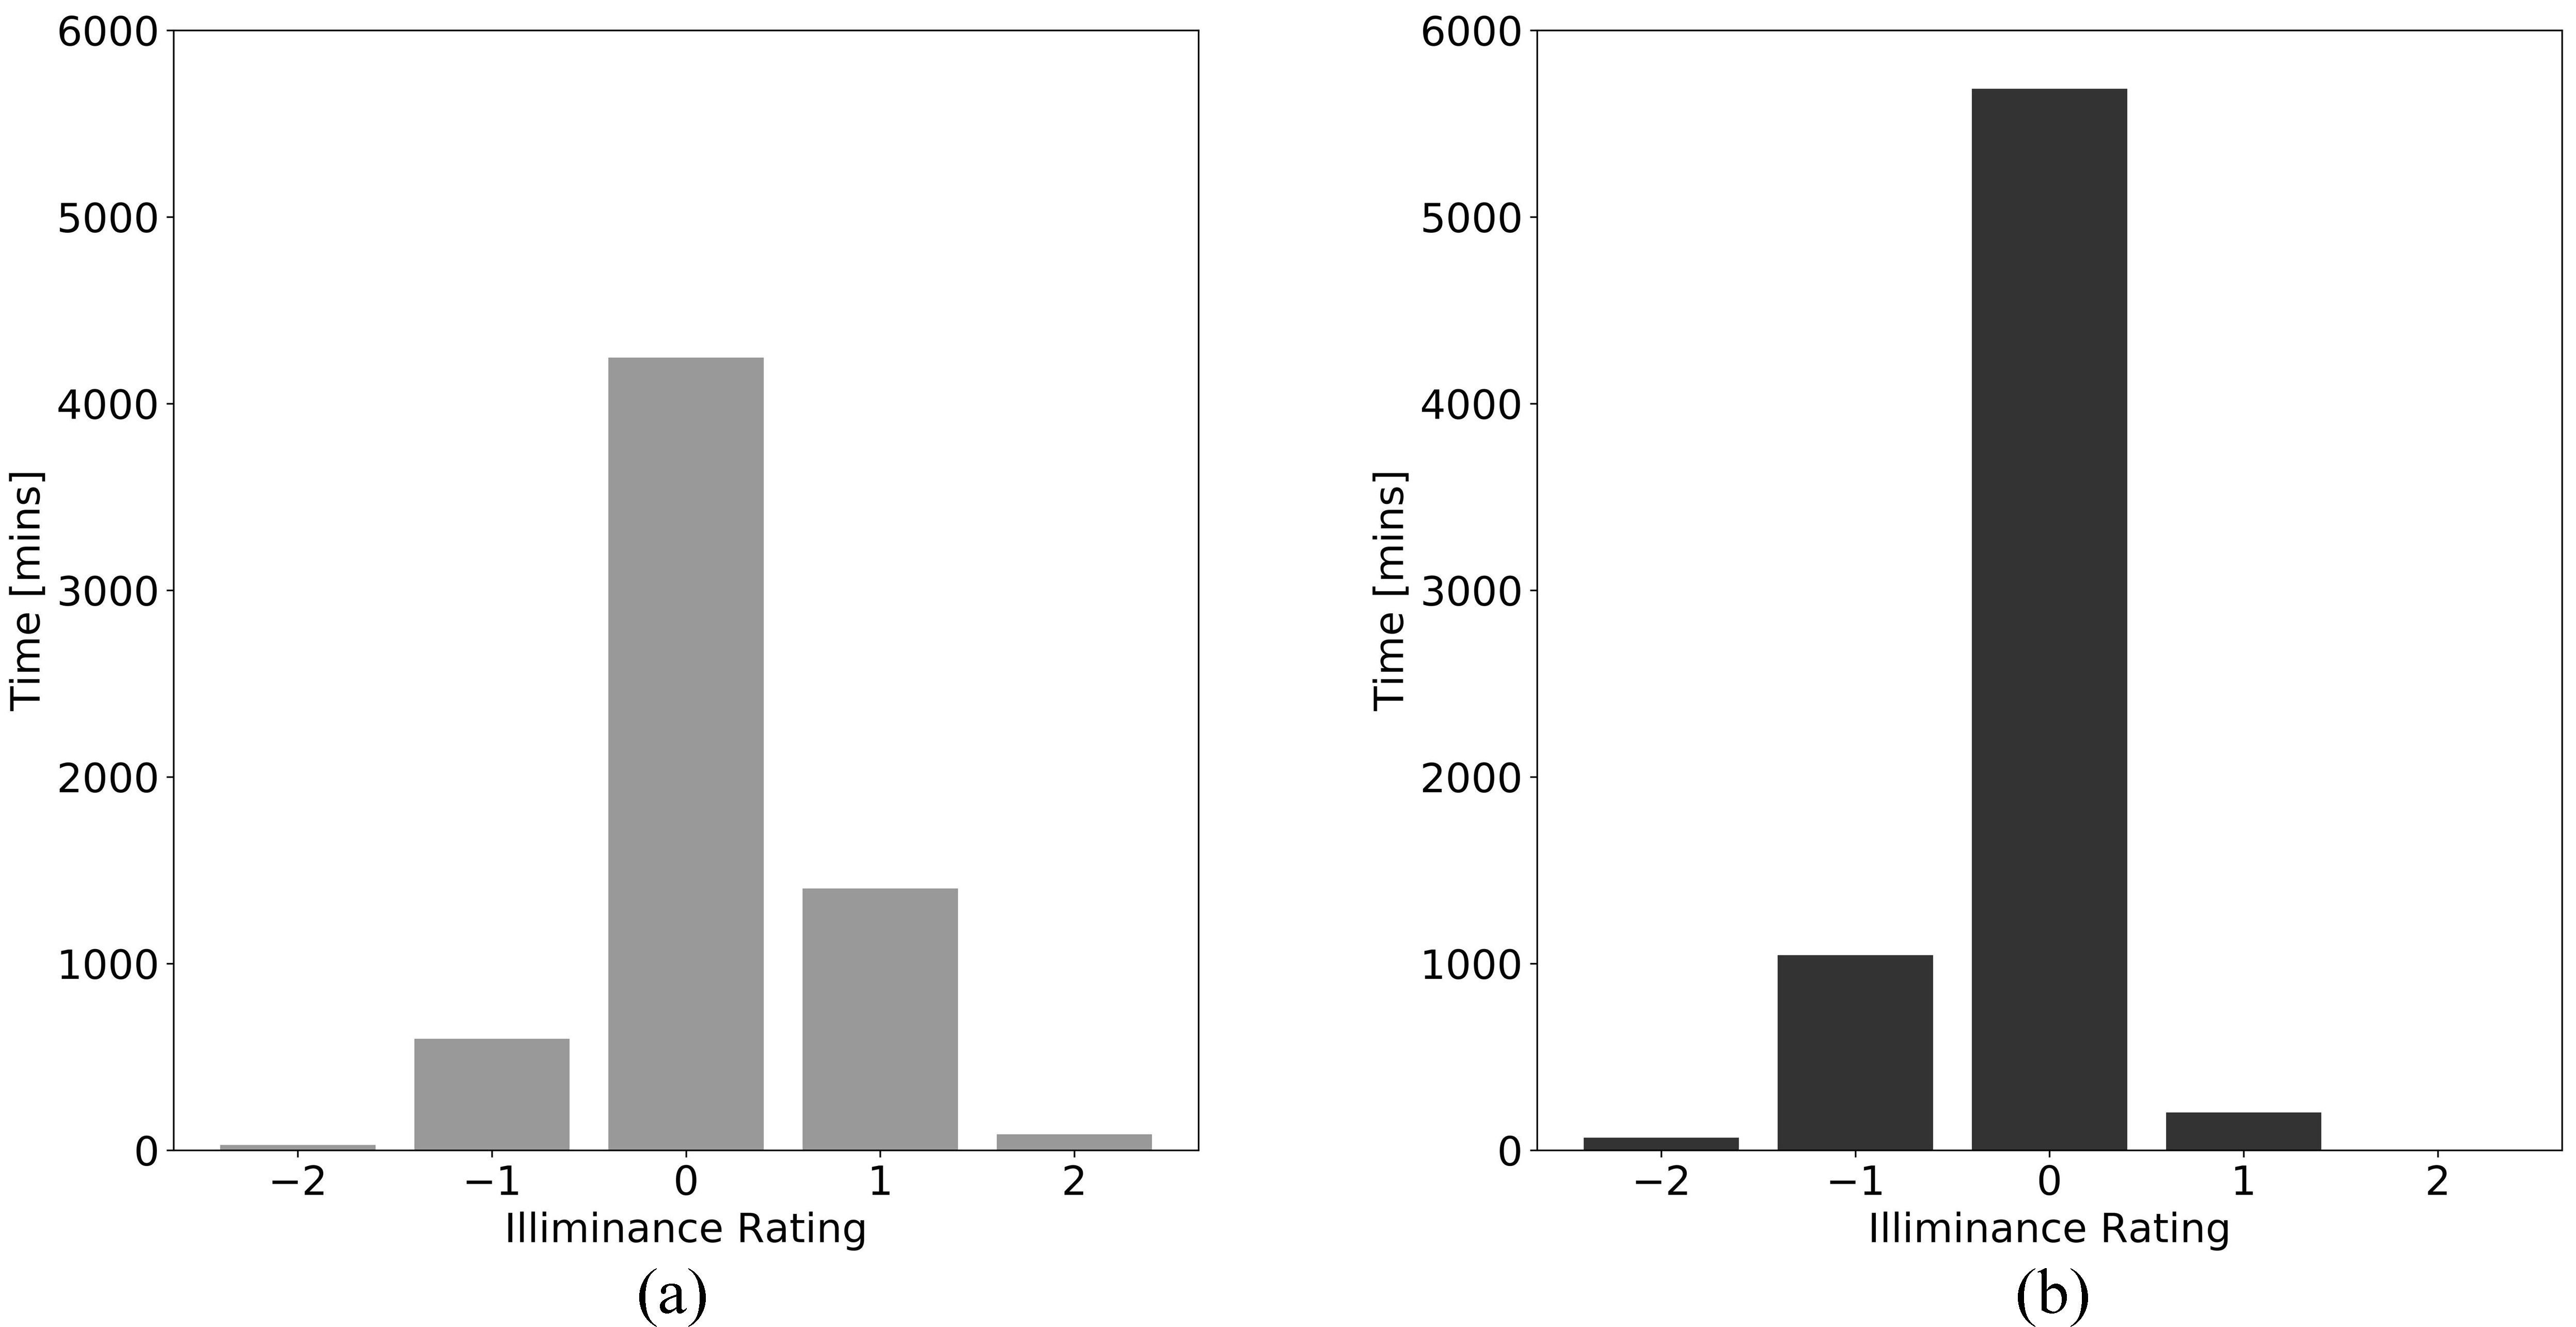
Fig. 7. Distribution of Illuminance Rating (IR) in (a) cell A and (b) cell B.
The relationship between IRs and illuminance levels is shown in Fig. 8, where the time distribution (quadratic interpolation) of the illuminance in either cells is distributed for the five IRs and binned per 500 lux steps. In Cell A, the IR = 0 peaks at a value between 750 lux and 1250 lux, and, surprisingly, IR = 0 was also largely reported for 2250 lux (circa 990 minutes). IR = 1 was reported for 550 minutes at the 750-lux bin and for 364 minutes at the 2250-lux bin. The high reported time for the combination of IR = 1 and 750 lux level may seem contradictory, but this is due to the automatic switching of the ceiling lights, which were in use for 1 473 minutes in the range 500-1000 lux (750-lux bin in the figure). Specifically, IR = 1 was reported in Cell A for 535 minutes within this illuminance range when the ceiling lights were in use, which is almost 10% of the total occupied time. The time distribution of the different Illuminance Ratings in Cell B shows more straightforward results. The IR = 0 curve peaks at 1 722 minutes (25% of total occupied time) in the range 500-1000 lux (750-lux bin in the figure) and decreases gradually by the increase of the illuminance level. The IR = -1 curve peaks at 738 minutes in the <500 lux range. The other IRs' curves do not show significant results. It is interesting to note that in Cell B the illuminance was rated satisfactory (IR = 0) for 17% of the total occupied time up to a 2000 lux level, and this rating value dropped drastically in the 2000-2500 lux level (7%, equal to 479 minutes). On the other hand, in Cell A the illuminance was rated as satisfactory (IR = 0) for 1 024 minutes in the same lux range. It may seem, therefore, that the occupants in Cell A showed a higher tolerance for high illuminance level than those sitting in Cell B. However, it is worth noticing that the occupants in Cell A recorded their dissatisfaction (IR = 1 and IR = 2) due to illuminance level above 2000 lux for a longer time than that in Cell B. In Cell A, the combination of illuminance >2000 lux and IR = 0 was reported by 4 occupants in 6 different days, whereas the same illuminance range was rated negatively (IR = 1 and above) by 5 occupants in 8 different days. Given the small number of occupants involved in this test, it is possible that the illuminance preference of few may have influenced the overall IR distribution. The average IR was 0.14 and -0.18 in Cell A and Cell B, respectively.
Figure 8
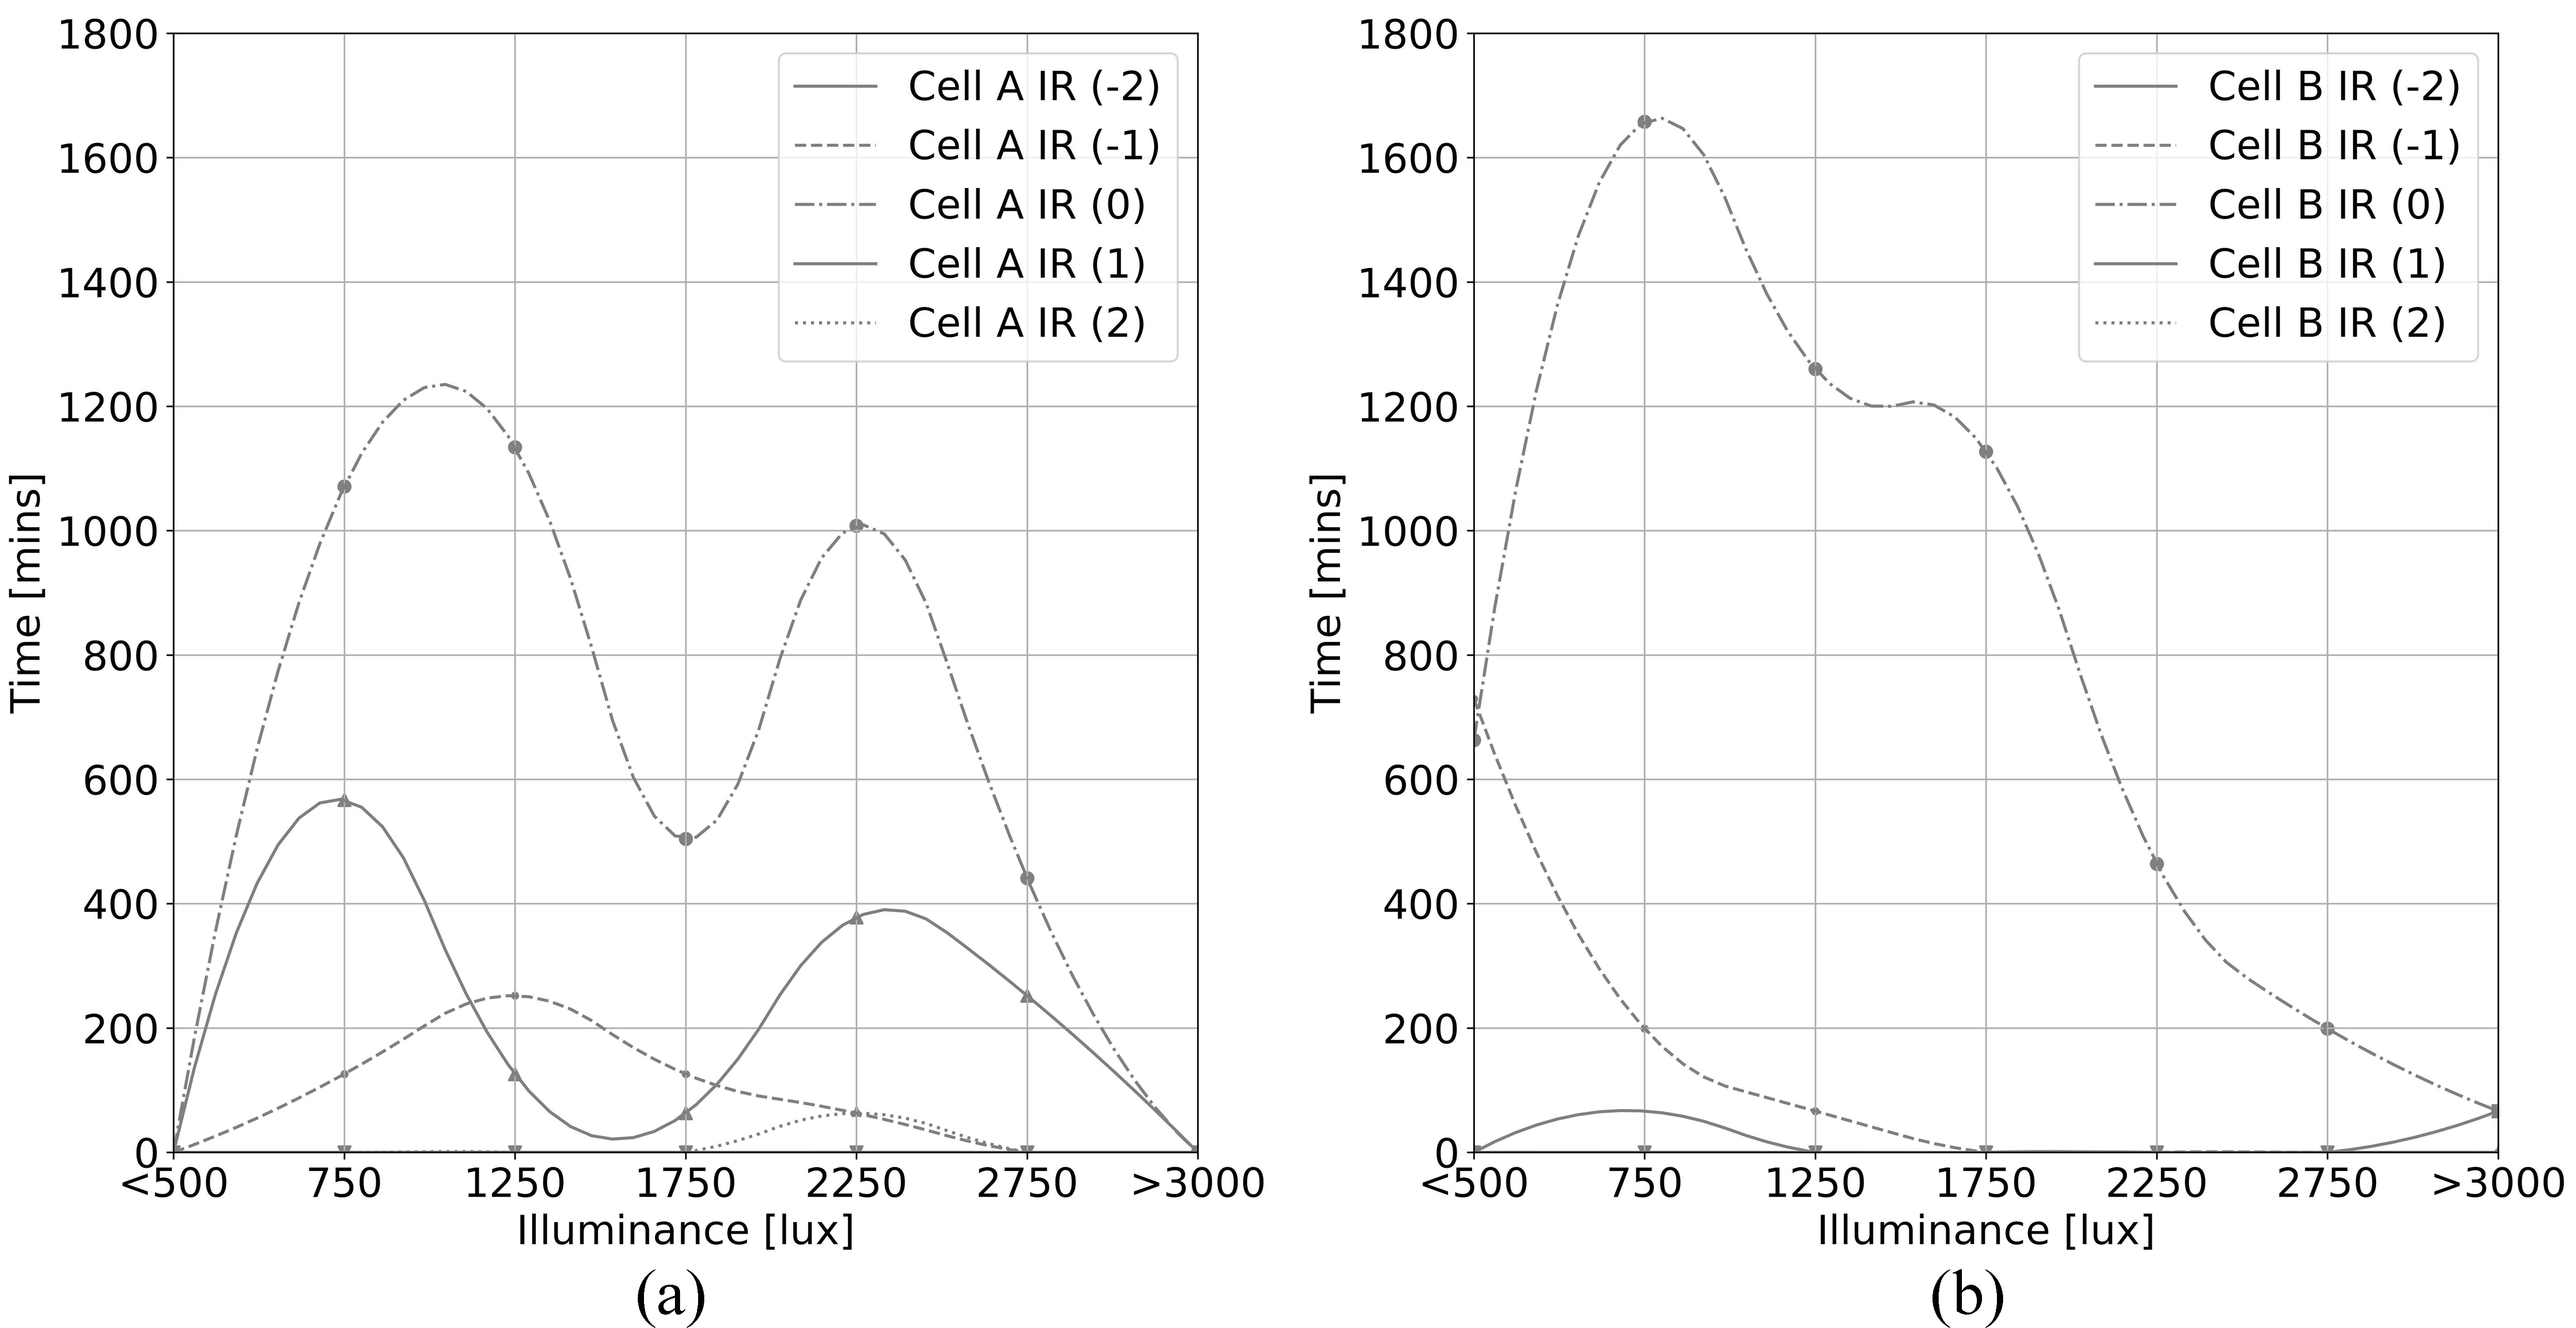
Fig. 8. Time distribution (quadratic interpolation) of Illuminance Rating (IR) per step of illuminance: (a) Cell A and (b) cell B.
As described in the method section, this test was meant to give an insight into the illuminance preferences in relation to control strategies of window blinds and ceiling lights. Figure 9 shows the time distribution (quadratic interpolation) of the use of window blinds and ceiling lights in either cells, values are binned per 500-lux steps. In Cell A, the operation of the window blind is dictated by the automatic control strategy. In the range 500-1000 lux (precisely at 600 lux), the two curves diverge, being the shading down to peak in the range 2000-2500 lux (circa 1 000 minutes). The schedule of the ceiling lights shows a similarly divergent graph, where at illuminances less than 1500 lux the curve Lights On give higher time values than those of the curve Light Off lux, and vice versa. The maximum operative time of ceiling lights is in the range 500-1000 lux with 1 473 minutes. In Cell B, the curves Shading up and Shading down met in the range 1000-1500 lux. The shading was mostly down when the illuminance was between 1500 and 2000 lux. The occupants used the shading for illuminance levels below 1000 lux for at least 800 minutes. Differently from Cell A, in Cell B the ceiling lights were in use for a considerable smaller time. The use of ceiling lights peaked in the range 500-1000 lux with circa 600 minutes, in contrast to almost 1 500 minutes of use in Cell A, for the same illuminance range. This hints at a large potential of energy savings from use of ceiling lights. In Cell A, the ceiling lights were in use for a total of 2389 minutes during the occupied time, in contrast to 1 148 minutes in Cell B. This translates in a total of 8.6 kWh of electricity use in Cell A, and 3.4 kWh in Cell B. The desktop lamps were seldomly used in either cells and their contribution to the total electricity use for artificial lighting was not significant. As a general trend, when the ceiling lights were in use in either cells the occupants of Cell A gave a higher illuminance rating (average IR = 0.21) than that given by the occupants of Cell B (IR = -0.14). Similarly, when the shading was deployed, the average IR in Cell A was higher (IR = 0.23) that that reported in Cell B (IR = -0.23). It is interesting to note that the average illuminance during the time the lights were in use was 928 lux in Cell A and 997 lux in Cell B. The difference of IR rating between the two cells is therefore given by the possibility of controlling the operation of the lights in Cell B. However, the average illuminance when the window blind was deployed was 1992 lux in Cell A and 1145 lux in Cell B, thus justifying the difference of IR between the two cells. The average operative temperature recorded during the occupied time in either cells was 25.9 °C and 26.1 °C in Cell A and Cell B, respectively.
Figure 9
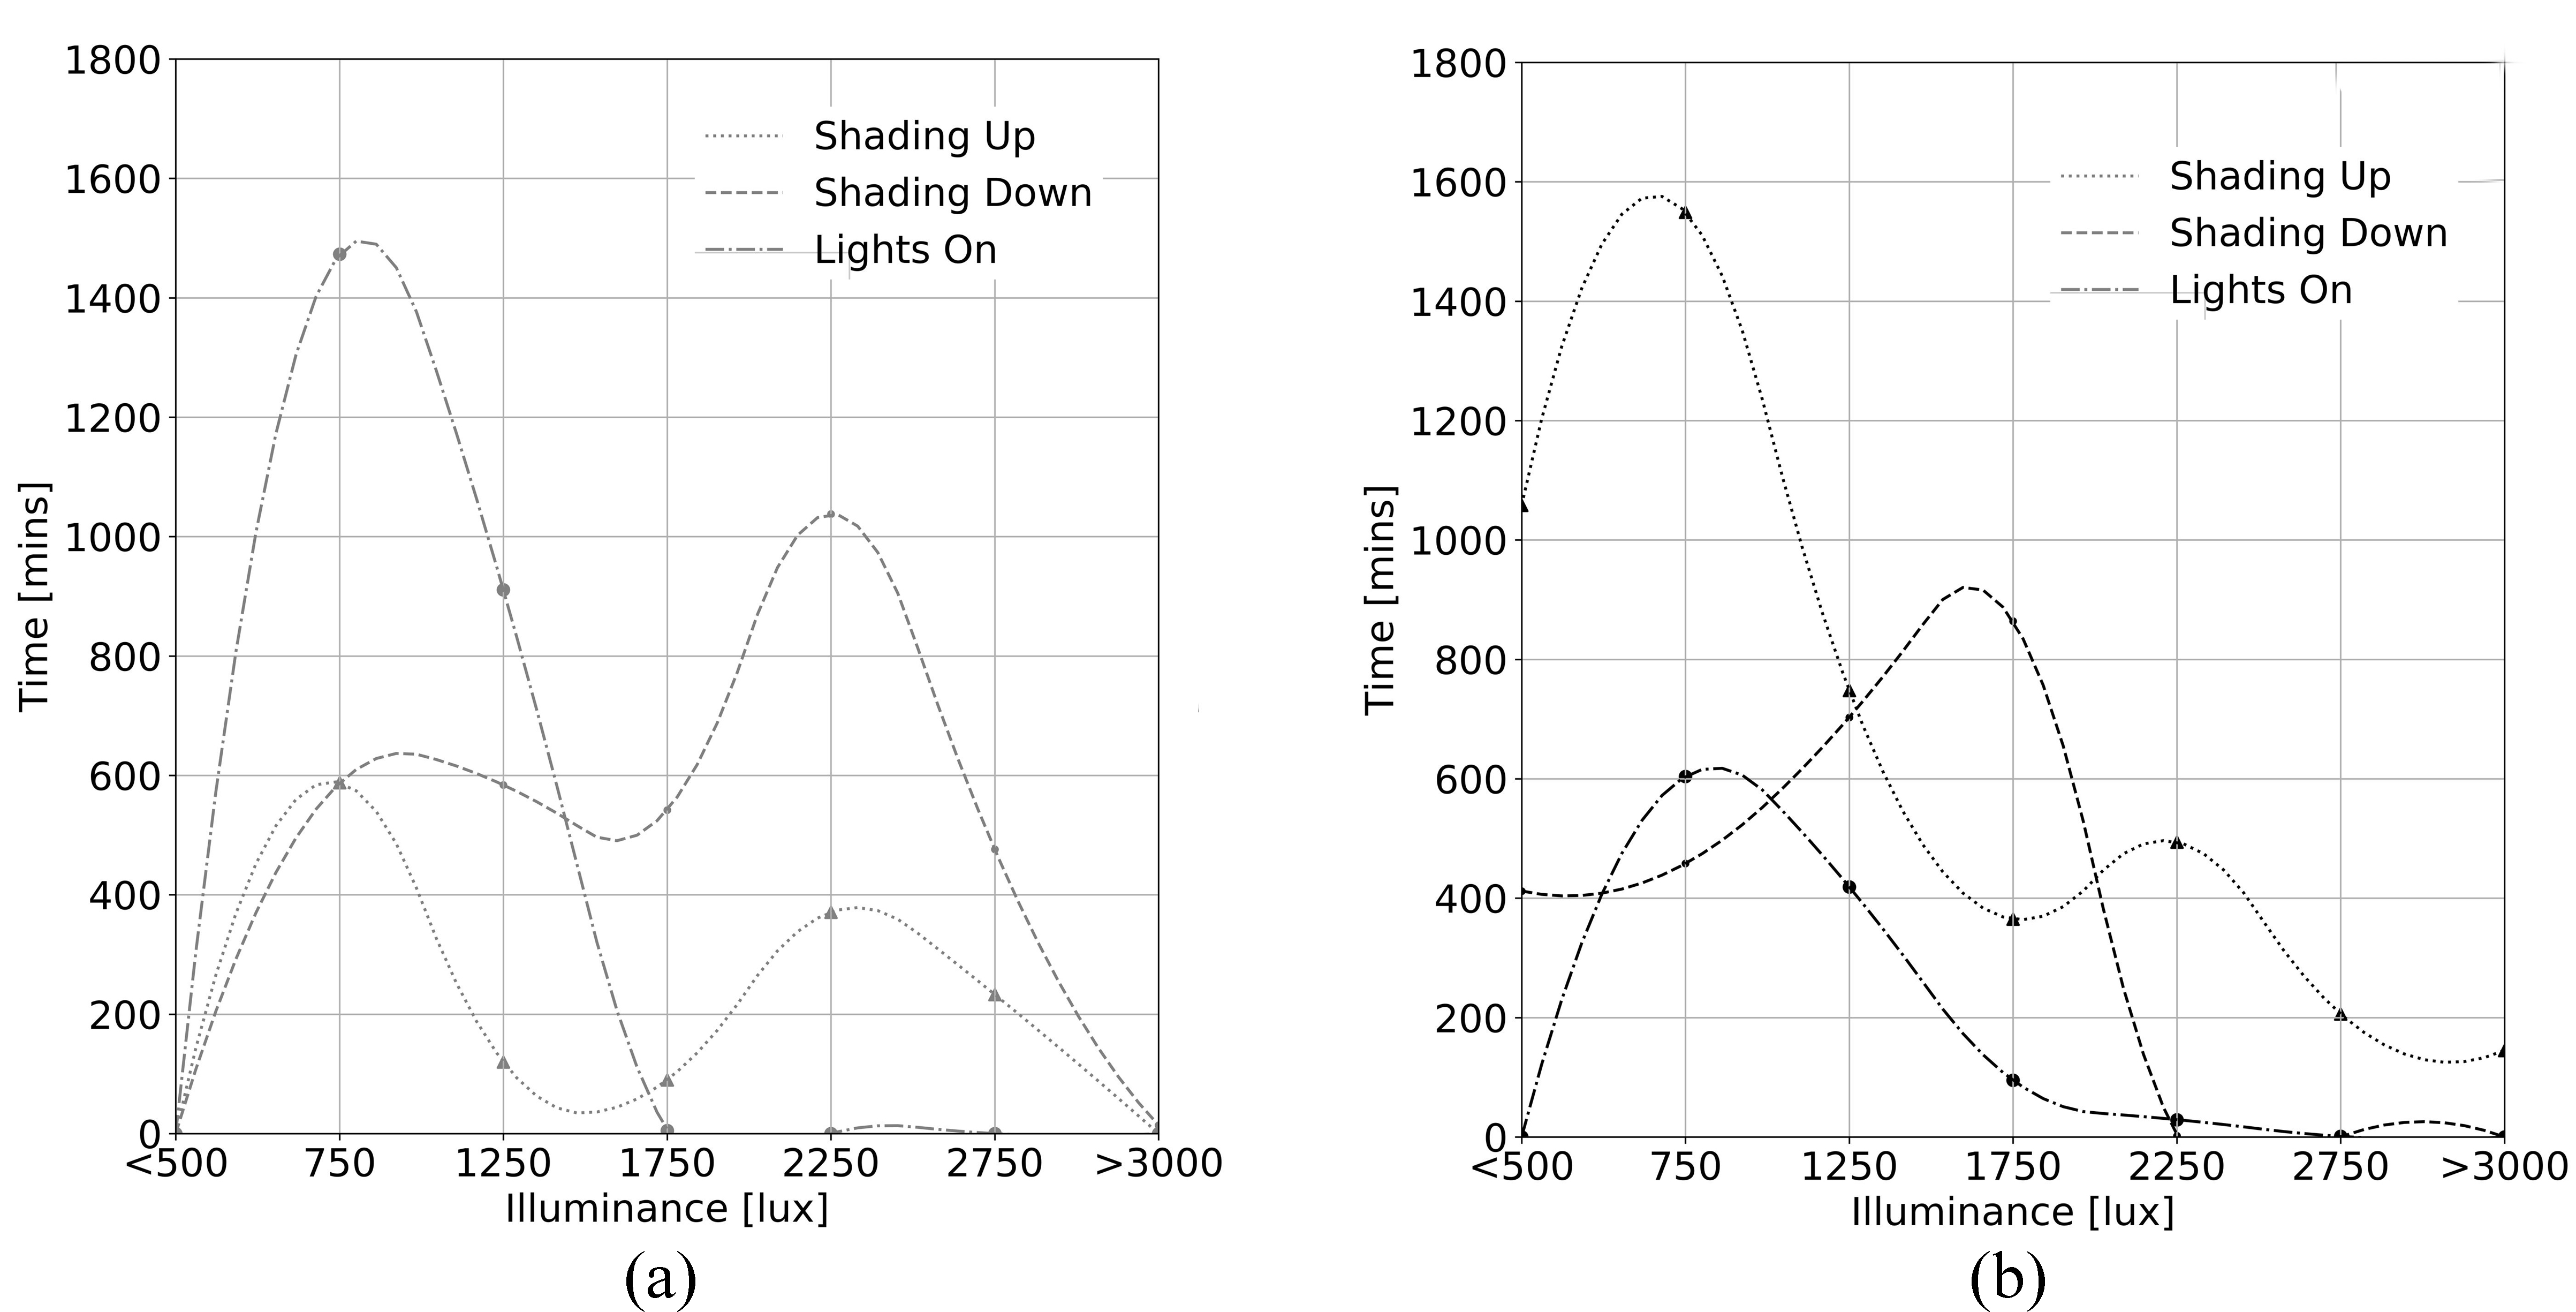
Fig. 9. Use of blind and ceiling lights per step of illuminance: (a) Cell A and (b) cell B.
The results of the investigation whether the indoor operative temperature may have influenced the perceived Illuminance Rating are also shown. Figure 10 shows for either cells from top to bottom: the distribution of the reported IRs (binned per 2 °C step of operative temperature) against the concurrently recorded operative temperature, the distribution of the recorded illuminance against the concurrently recorded indoor operative temperature, the distribution of the Thermal Sensation Votes (TSVs, binned per 500 lux step) against the concurrently recorded illuminance. Trendlines of the correlation between the different variables are superimposed in all charts. The colour density in both Fig. 10(a), (b), (e), and (f) charts represents the amount of time in minute (specified in the right-side colour bar) for which the relationships between the two metrics was recorded. In Cell A, the top and the middle trendline shows a positive correlation between either IR or illuminance level and indoor operative temperature. This is justified by the increasing of the operative temperature by incoming solar radiation on the cell's floor. It is worth remembering that the occupants could reduce the indoor temperature by either opening the window or reducing their clothing level. On the other hand, in Cell B, the correlation between IR and temperature is negative, meaning that the occupants used the blind to reduce either the illuminance, or the indoor temperature, or a combination of both. The bottom charts of Fig. 10 show that in Cell A the increasing of illuminance (and temperature, as described above) was followed by an increase of thermal discomfort (worth remembering that TSV = 1, 2, and 3 correspond to slightly warm, warm, and hot temperature rates). In Cell B, this correlation is weakly negative, meaning that the value of the TSV slightly diminishes by the increasing of the illuminance. This is due to the occupants using the blind to cut out incoming solar radiation, and thus reducing the indoor illuminance. Since the TSV rating does not significantly change at different illuminance values, whereas the IR = 0 steadily decreases at increasing illuminance (shown in Fig. 8), the luminous environment did not influence the perceived thermal comfort of the occupants in Cell B (Fig. 9).
Figure 10
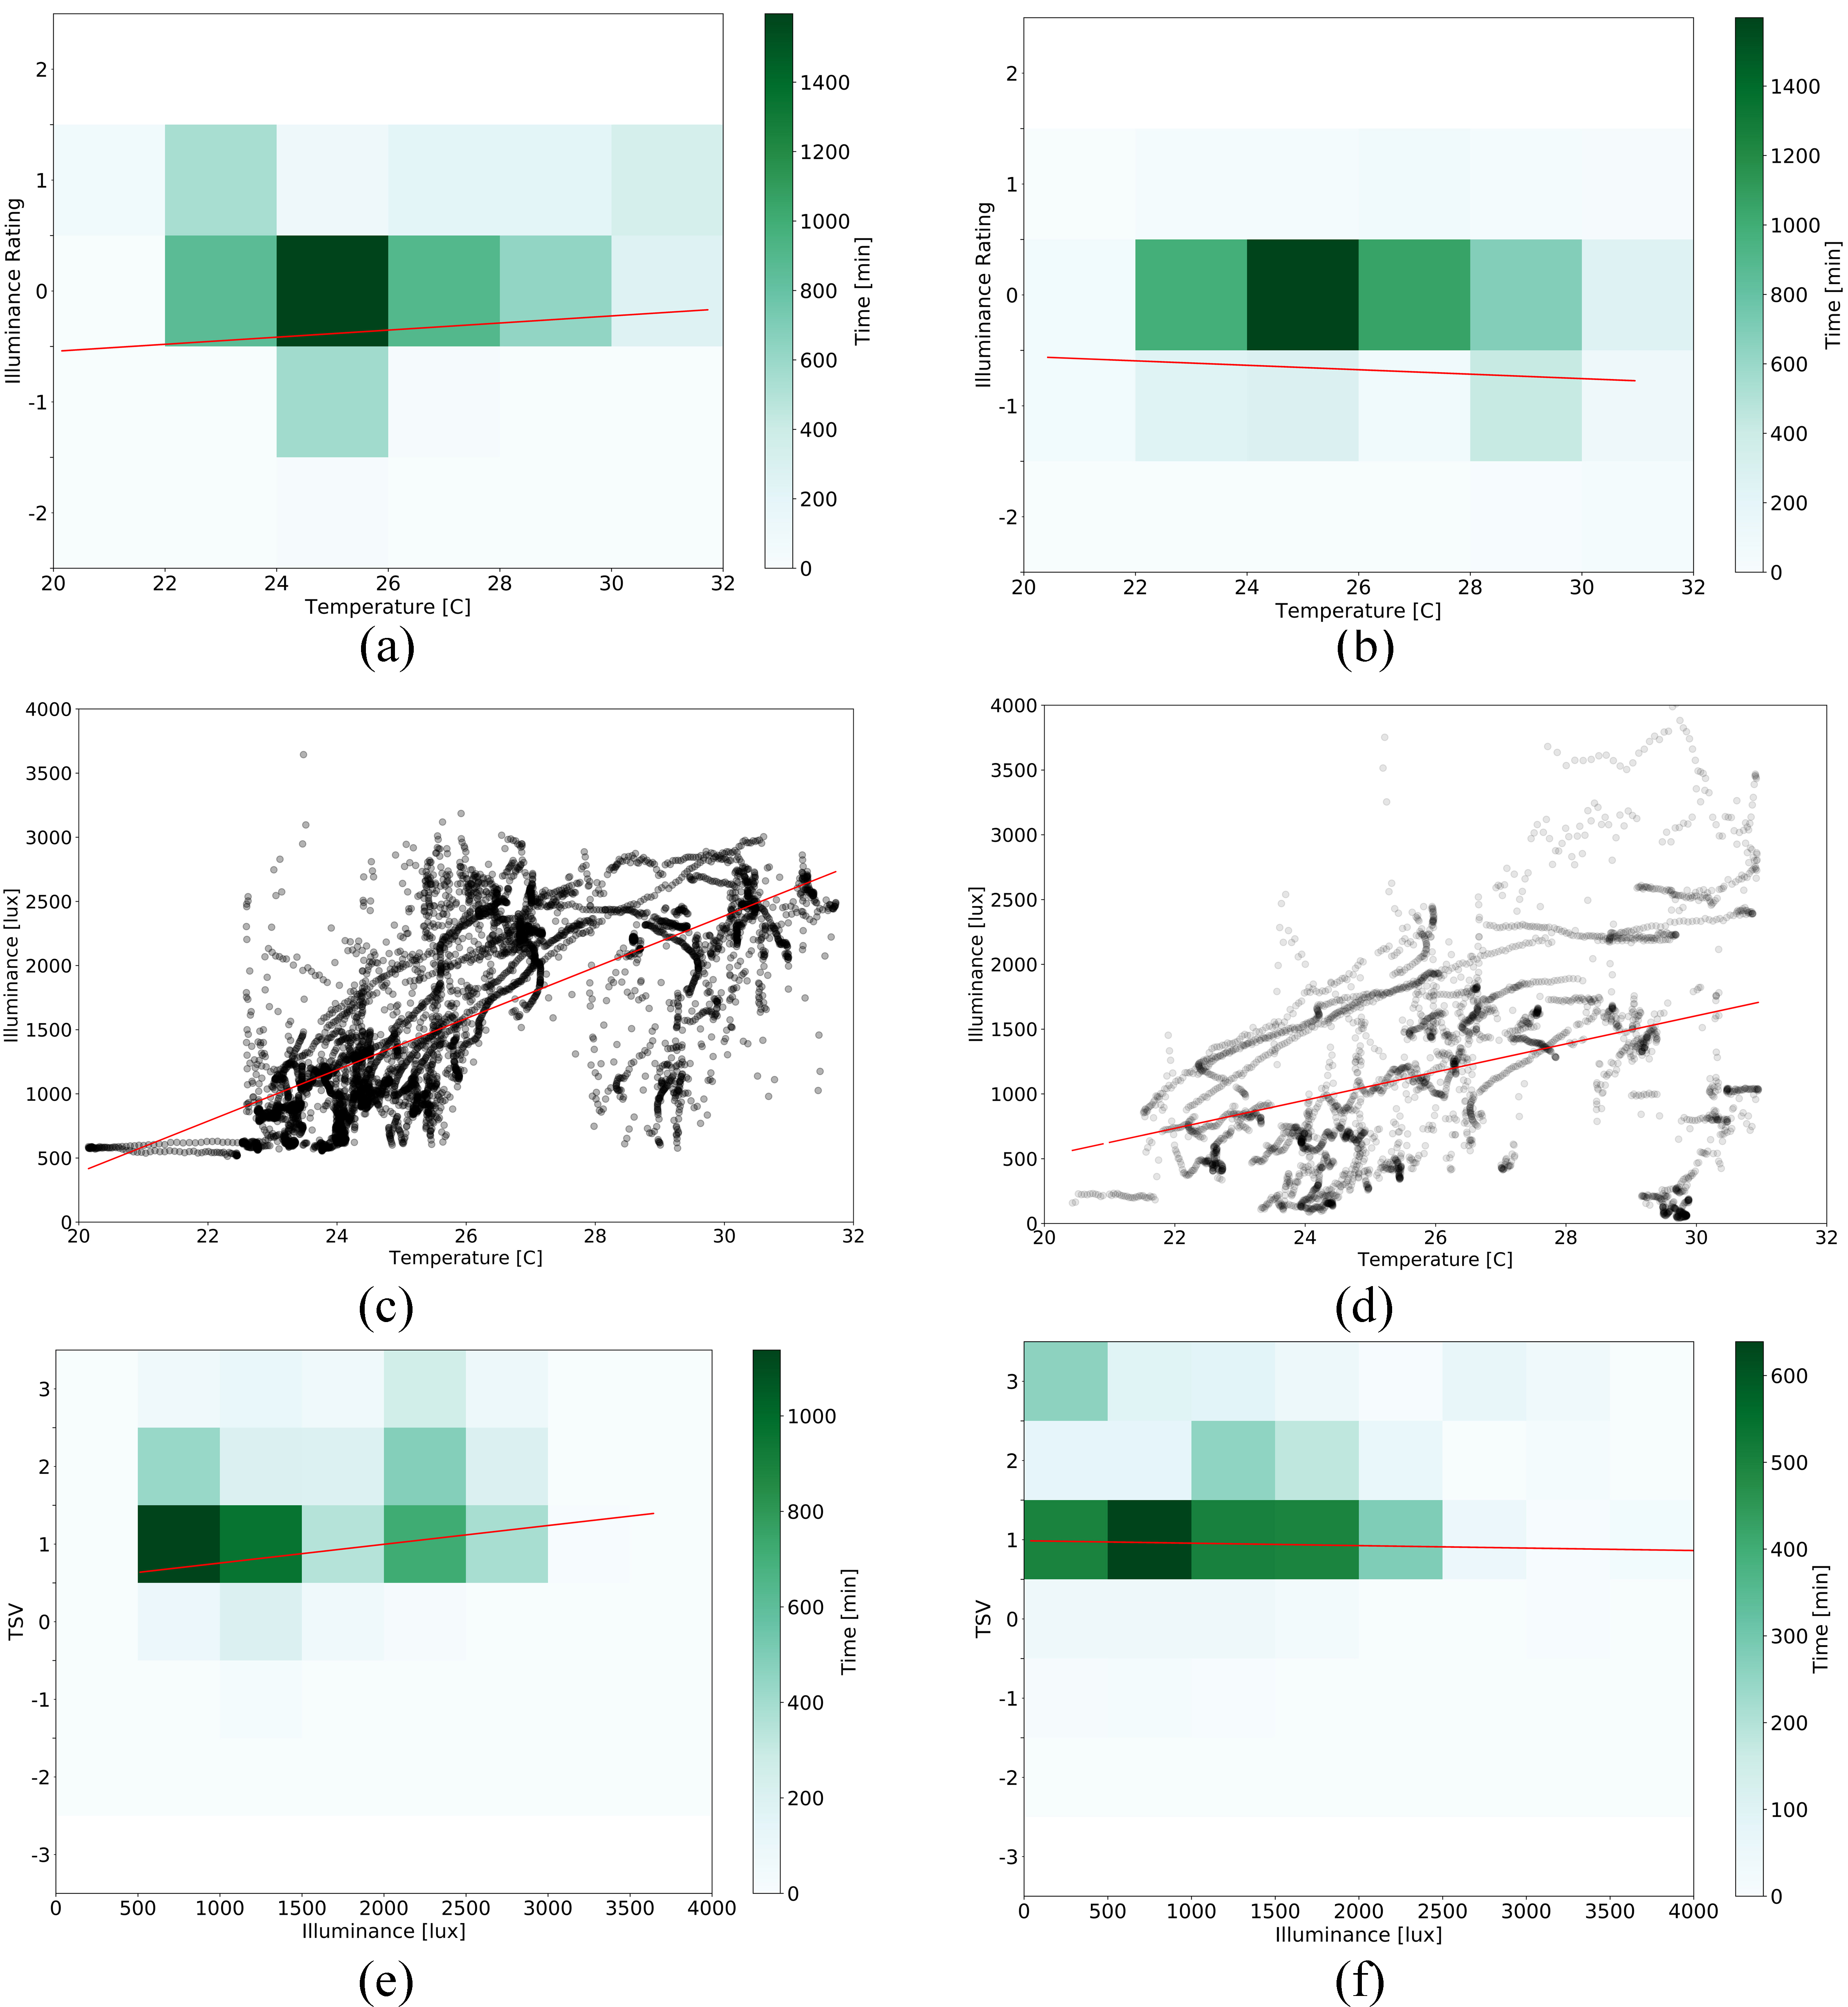
Fig. 10. (a) and (b) Distribution of the reported IRs (binned per 2 °C-operative temperature step) against concurrently recorded operative temperature. (c) and (d) Distribution of the recorded illuminance against operative temperature. (e) and (f) distribution of the reported TSVs (binned per 500 lux illuminance level) against concurrently recorded illuminance levels.
During the working day the participants were asked whether they did any change in their working environment or could not do any change that they wished to. The participants of Cell A reported the open-field questions 167 times during the whole experiment. Among these, they reported changes to the working environment for 51 times, of which 28 regarded the windows (either opening, or closing, or getting closed or away from them). The sun shading was mentioned 1 time only. The participants reported wishes for changes that they could not do for 54 times, among which 8 answers regarded the windows (mainly regarding the option to close the top motorized window to avoid noise), 28 answers regarded the sun shading (mainly to close it more to reduce brightness from the floor and heat). With this respect, glare on the computer screen was mentioned for 7 times mainly from mid-day to the afternoon due to the light reflected from the white back wall that led to a visible reflection in the computer screen. The word bright was used 15 times in relations to the actions that could not be taken by the participants, and the words describing too warm conditions were mentioned 13 times. The wish to use the blind in relation to either the temperature or the brightness of the room was mentioned 9 times, and 16 times, respectively. The participants in Cell B reported the open-field questions for 187 times. When asked if they changed the conditions of their working environment, they answered positively 71 times, and 39 answers of these regarded the use of the windows, 18 answers the use of the sun shading, and 17 answers regarded the thermal discomfort. Glare was not mentioned. When the participants were asked for further actions that they could not do, the operation of windows was mentioned 7 times, the sun shading 2 times, and actions to mitigate thermal discomfort were mentioned 4 times. Glare or brightness were not mentioned.
In both cells the participants complained about the noise levels, especially noise coming from outside that could not be avoided due to the necessity of having the window open. Noise was mentioned 3 times by the participants of Cell B, and 9 times by the participants in Cell A. This occurred due to roadwork nearby and some students talking on a lot at circa 30 m from the experimental facility. Figure 8 and the questionnaires shown that the use of the automatic control strategy for window blinds in Cell A influenced negatively both the illuminance rating and the perceived thermal comfort of the occupants. It is worth remembering that the average operative temperatures recorded in either cells were substantially the same (0.2 °C difference). The use of automatic switching ceiling lights in Cell A also lead to visual discomfort (too much brightness). Table 4 shows the symptFoms of distress reported by the occupants of each cell in relation to their perceived cause (illuminance, temperature, noise). The occupants of Cell A mentioned in their open questions headaches and tiredness 6 times and 2.5 times more frequently than the occupants of Cell B. The perceived cause of these symptoms was attributed by the occupants of both cells to primarily temperature.
Table 4
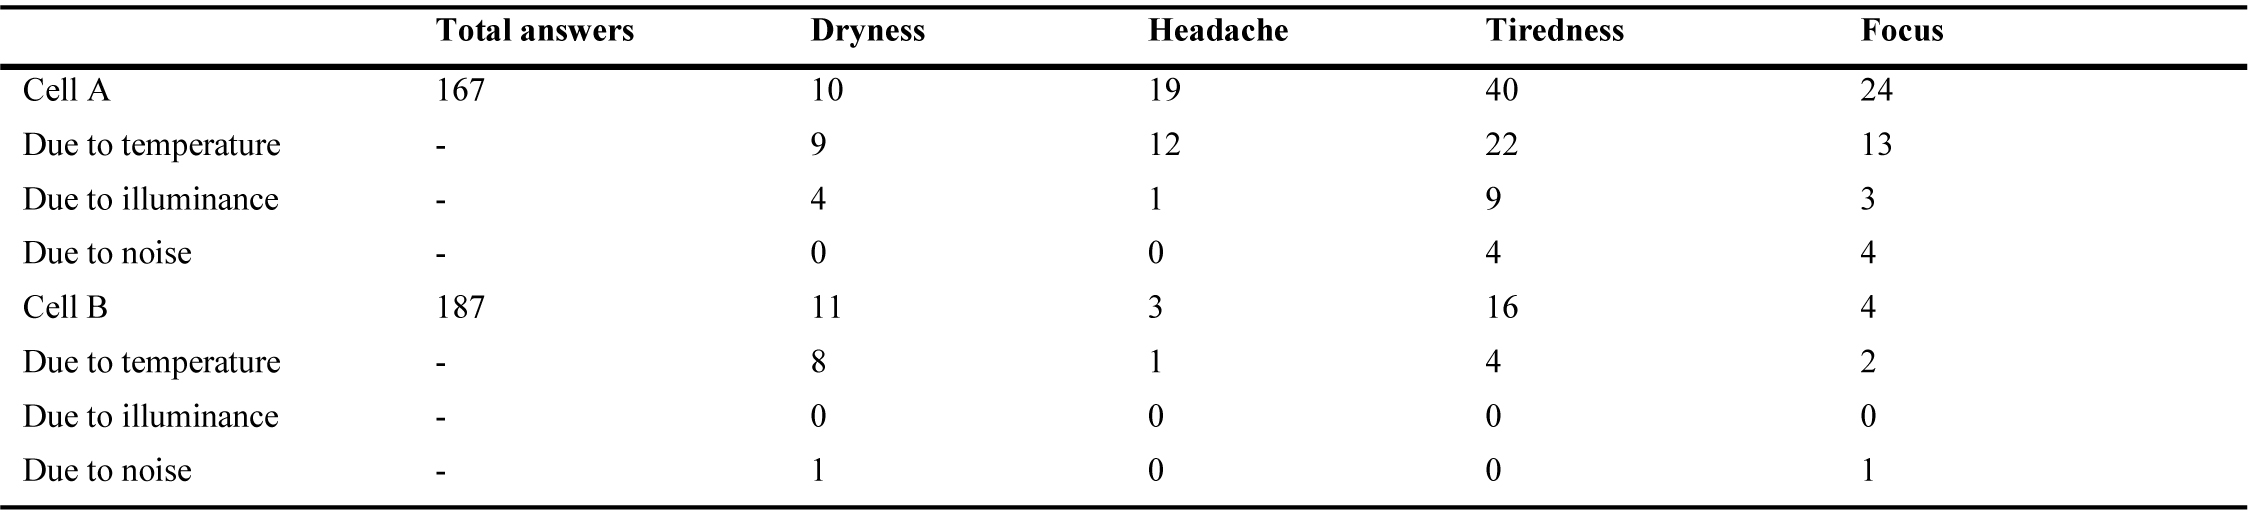
Table 4. Reported symptoms and reported distress factors in both cells.
4. Limitations and discussion
The following limitations of this case study are here highlighted. The experiment took place with a limited number of participants (n=11), thus increasing the influence on the results given by single participant's thermal and visual preferences. Despite this limitation, the results obtained are in line with previous studies. The preference for manual blind control in office spaces was found by Inkarojrit [12] who surveyed 25 office users in Berkley, CA regarding their preference for either manual or automatic blind control. Less than half of the respondents preferred an automatic blind control, and those who preferred it expected the control strategy to be smart (e.g. to reduce the glare, do not limit the view, and be overridable). A more recent study by Sadeghi et al. [28] analysed the occupants' preference for different blind control strategies in cell-offices in West Lafayette, IND. The authors tested two fully manual (wall mounted switches vs digital interface), fully automatic, and user-overridable automatic control strategy. The respondents of the survey gave the lowest comfort votes (for either the amount of light or the visual conditions) and the lowest productivity level when the fully automatic blind control strategy was used. Similar results were found in relation to the control strategy of artificial lighting use. A study by Nagy et al. [29] surveyed the occupants of an office building in Zurich, Switzerland, in relation to the use of a dedicated control strategy for artificial lighting. Most of the respondents (80%) agreed on the importance of having control over the lighting environment, and to be able to override the automatic control system (90%). Finally, a study by Merbeek et al [30] investigated the blind use with either an automatic or a manual control strategy in an office building in Eindhoven, the Netherlands. The authors found that most of the participants switched off the automatic control system because, according to them, it did not work as they wished it did.
The results of this case study showed that when the occupants were given control of the blinds (in Cell B), a weak negative correlation between TSVs and illuminance was found, meaning that the use of blinds did not influence the occupants' thermal comfort. This finding is in line with previous research. According to Inkarojrit [12], the use of blind was due to heat for only 27% of the surveyed office occupants, whereas most of them used the blinds to reduce glare (65%). Similar results were reported by Meerbeek et al, who found that 70% of the respondents either used or adjusted the blinds for reducing the glare and only 5% mentioned thermal discomfort [30], and Pigg et al. [14], who found that 80% of the respondents that used the blinds, did so to reduce glare and direct solar illuminance.
The ZEB Test cell was used as the closest representative of a cell office environment in this case study. The geometry and the installations in the ZEB Test cell were designed for this scope, and it is cells' areas are in line with cell offices in buildings in Scandinavia [31]. It is worth noting that the optimization of the office spaces is moving towards the use of open plans, rather than single cell offices, given the possibility of increasing the number of employees in the same office area. In such a perspective, the single occupant's thermal and visual comfort is largely influenced by the control exercised by colleagues and co-workers, in addition to the limitation given by the available control in the office space. Additional discomfort (in relation to the thermal, visual, and acoustic environment) is reported by occupants of open-plan offices in this study by Danielsson and Bodin [32].
The illuminance thresholds (< 600 lux to open blinds, > 3000 lux to close blinds) for triggering the blind use in Cell A was chosen to balance between frequency of activation and illuminance level. It was decided to open the blinds at lux levels lower than 600 lux to avoid the concurrent activation of the ceiling lights with the blind closed. The upper threshold was used to ensure an enough large buffer zone in which the blind did not operate, given the high shading factor of the installed screen (which has a 5% visible transmittance). According to O'Brien and Gunay, 50% probability of blind close was set to 5700 lux on the work plane in a Monte Carlo simulation for an occupant-behaviour model of office users [33]. Haldi and Robinson investigated the blind pattern use in an office building in Lausanne and found that a 1200 lux illuminance level triggered a maximum frequency for lowering the blinds [34]. Similar results were found by Kim et al. [35] who investigated office users' preference of automated vs manual blind use. They found that occupants were mostly satisfied when the indoor illuminance level was around 1200 lux, whereas values above and up to 2400 lux were deemed uncomfortable. A similar upper threshold was found by Bülow-Hübe [36], who reported an average 2600 lux illuminance on the work plan triggered the closing of either the awning or the venetian blind. In addition to blind's controls based on occupants' usage patterns, other forms of control strategies are possible, such as glare metric and sun profile [37]. In such a perspective, Yun et al. determined that a vertical eye illuminance of 3000 lux corresponds to the threshold at which glare occurs [38]. In relation to the results obtained in this paper's case study, the 3000 lux upper threshold for the blind operation may be reconsidered in a future case study.
5. Conclusions
A case study to evaluate the occupants' satisfaction in relation to two different control strategies for blind and ceiling lights use in cell offices was carried on in Trondheim, Norway. A group of 11 participants with varying age, gender, and ethnicity, used two test cells of a laboratory as a workspace primarily carrying out office tasks at a personal computer. The total time during which either Cell A or Cell B were occupied by the participants was 6361 minutes and 7004 minutes, respectively. The participants were asked to answer a computer-based questionnaire for reporting their perceived thermal and visual comfort. Concurrently, measurements of the indoor operative temperature, illuminance level, and operation of windows, blinds, and ceiling lights were registered. Two different strategies for controlling the indoor environment of the test cells were used in the experiment. In Cell A, the ceiling-mounted lights and the solar shading were controlled by the main acquisition and control system, whereas in Cell B, the participants were given the control of the ceiling lights and the solar shading. In both cells the occupants could operate the manually the windows and the desk light. The occupants had no control over the air-flow and temperature. Ventilation was provided by the mechanical system to both cells in order to replicate the typical HVAC setting in office buildings. Results of this case study showed that:
- The average operative temperature was 25.9 °C and 26.1 °C in Cell A and Cell B, respectively.
- The average illuminance level was 1578 lux in Cell A and 1120 lux in Cell B.
- The average illuminance rating (in a scale from -2 to +2) was 0.14 and -0.18 in Cell A and Cell B, respectively.
- The occupants in Cell A used the ceiling lights for a total of 2 389 minutes, which translated in 8.6 kWh of electricity use. The occupants in in Cell B used them for 1 148 minutes, which gave 3.4 kWh of electricity use.
- When the ceiling lights were in use in either cells the occupants of Cell A gave a higher illuminance rating (average IR = 0.21) than that given by the occupants of Cell B (IR = -0.14).
- The automatic control strategy for blind and ceiling lights lead the occupants of Cell A to report a higher visual and thermal discomfort, than that given by the occupants of Cell B.
- Despite the small average temperature difference (0.2 °C), the occupants of Cell A reported an increasing thermal discomfort at raising illuminance levels. In Cell B, the reported thermal sensation votes were substantially constant at raising illuminance levels.
- The occupants of Cell A reported symptoms of headaches and tiredness due to temperature more often than the occupants of Cell B.
Acknowledgements
This work has been supported by the Research Council of Norway and several partners through the project "Advanced facades with integrated technology – SkinTech" (nr. 255252). Special thanks to Prof. Salvatore Carlucci for his helpful advice.
Contributions
N. Lolli conceived the case study, set up the test cells for the case study, followed the experiment, interpreted the results and wrote the manuscript. A. Nocente set up the test cells for the case study, produced the analysis charts and figures. J. Brozovsky edited and summarized the data. R. Woods set up and arranged the interviews with the case study's participants. S. Grynning provided constructive advice on the case study's concept.
References
- M.P.J. Aarts, J.C. Stapel, T.A.M.C. Schoutens, J. van Hoof, Exploring the impact of natural light exposure on sleep of healthy older adults: A field study, Journal of Daylighting 5 (2018) 14-20. https://doi.org/10.15627/jd.2018.2
- A.R. Webb, Considerations for lighting in the built environment: Non-visual effects of light, Energy and Buildings, 38 (2006) 721-727. https://doi.org/10.1016/j.enbuild.2006.03.004
- J.A. Veitch, Investigating and influencing how buildings affect health: Interdisciplinary endeavours, Canadian Psychology 49 (2008) 281-288. https://doi.org/10.1037/a0013567
- J.A. Veitch, Light, lighting, and health: Issues for consideration, Leukos 2 (2005) 85-96. https://doi.org/10.1582/leukos.2005.02.02.001
- P.R. Boyce, Review: The Impact of Light in Buildings on Human Health, Indoor and Built Environment 19 (2010) 8-20. https://doi.org/10.1177/1420326x09358028
- E. Vine, E. Lee, R. Clear, D. DiBartolomeo, S. Selkowitz, Office worker response to an automated Venetian blind and electric lighting system: a pilot study, Energy and Buildings (2) (1998) 205-218. https://doi.org/10.2172/658295
- C. Reinhart and K. Voss, Monitoring manual control of electric lighting and blinds, Lighting Research and Technology 35 (2003) 243-258. https://doi.org/10.1191/1365782803li064oa
- S. Grynning, N. Lolli, S. Wågø, B. Risholt, Solar Shading in Low Energy Office Buildings - Design Strategy and User Perception, Journal of Daylighting 4 (2017) 1-14. http://dx.doi.org/10.15627/jd.2017.1
- L. Karlsen, P. Heiselberg, I. Bryn, Occupant satisfaction with two blind control strategies: Slats closed and slats in cut-off position, Solar Energy 115 (2015) 166-179. https://doi.org/10.1016/j.solener.2015.02.031
- K. Van Den Wymelenberg, Patterns of occupant interaction with window blinds: A literature review, Energy and Buildings 51 (2012) 165-176. https://doi.org/10.1016/j.enbuild.2012.05.008
- M.S. Rea, Window blind occlusion: a pilot study, Building and Environment 19 (1984) 133-137. https://doi.org/10.1016/0360-1323(84)90038-6
- V. Inkarojrit, Balancing comfort: Occupants’ control of window blinds in private offices, University of California, 2005.
- A.I. Rubin, B.L. Collins, R.L. Tibbott, Window blinds as a potential energy saver-a case study, NBS Build. Sci. Ser., 1978.
- S. Pigg, M. Eilers, J. Reed, Behavioral aspects of lighting and occupancy sensors in private offices : A case study of a university office building, 1996.
- A. Mahdavi, Patterns and implications of user control actions in buildings, Indoor and Built Environment, 18 (2009) 440-446. https://doi.org/10.1177/1420326x09344277
- J. Day, J. Theodorson, K. Van Den Wymelenberg, Understanding controls, behaviors and satisfaction in the daylit perimeter office: A daylight design case study, Journal of Interior Design 37 (2012) 17-34. https://doi.org/10.1111/j.1939-1668.2011.01068.x
- F. Nicol, M. Wilson, C. Chiancarella, Using field measurements of desktop illuminance in European offices to investigate its dependence on outdoor conditions and its effect on occupant satisfaction, and the use of lights and blinds, Energy and Buildings 38 (2006) 802-813. https://doi.org/10.1016/j.enbuild.2006.03.014
- J.-H. Kim, Y.-J. Park, M.-S. Yeo, and K.-W. Kim, An experimental study on the environmental performance of the automated blind in summer, Building and Environment, 44 (2009) 1517-1527. https://doi.org/10.1016/j.buildenv.2008.08.006
- F. Haldi, D. Robinson, Adaptive actions on shading devices in response to local visual stimuli, Journal of Building Performance Simulation, 3 (2010) 135-153. https://doi.org/10.1080/19401490903580759
- W. O’Brien, K. Kapsis, A.K. Athienitis, Manually-operated window shade patterns in office buildings: A critical review, Building and Environment, 60 (2013) 319-338. https://doi.org/10.1016/j.buildenv.2012.10.003
- A.D. Galasiu, J.A. Veitch, Occupant preferences and satisfaction with the luminous environment and control systems in daylit offices: a literature review, Energy and Buildings 38 (2006) 728-742. https://doi.org/10.1016/j.enbuild.2006.03.001
- M. Bodart, A.D. Herde, Global energy savings in offices buildings by the use of daylighting, Energy and Buildings 34 (2002) 421-429. https://doi.org/10.1016/s0378-7788(01)00117-7
- X. Yu, Y. Su, Daylight availability assessment and its potential energy saving estimation –A literature review, Renewable and Sustainable Energy Reviews 52 (2015) 494-503. https://doi.org/10.1016/j.rser.2015.07.142
- F. Goia, C. Schlemminger, A. Gustavsen, The ZEB Test Cell Laboratory. A facility for characterization of building envelope systems under real outdoor conditions, 11th Nordic Symposium on Building Physics, 2017.
- A. Nabil, J. Mardaljevic, Useful daylight illuminance: a new paradigm for assessing daylight in buildings, Lighting Research and Technology 37 (2005) 57-58. https://doi.org/10.1177/136578280503700109
- A. Nabil, J. Mardaljevic, Useful daylight illuminances: A replacement for daylight factors, Energy and Buildings 38 (2006) 905-913. https://doi.org/10.1016/j.enbuild.2006.03.013
- L. Roche, E. Dewey, P. Littlefair, Occupant reactions to daylight in offices, Lighting Research and Technology, 32 (2000) 119-126. https://doi.org/10.1177/096032710003200303
- S.A. Sadeghi, P. Karava, I. Konstantzos, A. Tzempelikos, Occupant interactions with shading and lighting systems using different control interfaces: A pilot field study, Building and Environment 97 (2016) 177-195. https://doi.org/10.1016/j.buildenv.2015.12.008
- Z. Nagy, F.Y. Yong, A. Schlueter, Occupant centered lighting control: A user study on balancing comfort, acceptance, and energy consumption, Energy and Buildings 126 (2016) 310-322. https://doi.org/10.1016/j.enbuild.2016.05.075
- B. Meerbeek, M. te Kulve, T. Gritti, M. Aarts, E. van Loenen, E. Aarts, Building automation and perceived control: A field study on motorized exterior blinds in Dutch offices, Building and Environment 79 (2014) 66-77. https://doi.org/10.1016/j.buildenv.2014.04.023
- S. Shahzad, J. Brennan, D. Theodossopoulos, B. Hughes, J.K. Calautit, Energy and comfort in contemporary open plan and traditional personal offices, Applied Energy 185 (2017) 1542-1555. https://doi.org/10.1016/j.apenergy.2016.02.100
- C.B. Danielsson, L. Bodin, Difference in satisfaction with office environment among employees in different office types, Journal of Architectural and Planning Research 26 (2009) 241-256.
- W. O’Brien, H.B. Gunay, Mitigating office performance uncertainty of occupant use of window blinds and lighting using robust design, Building Simulation 8 (2015) 621-636. https://doi.org/10.1007/s12273-015-0239-2
- F. Haldi, D. Robinson, A comprehensive stochastic model of blind usage: theory and validation, Glasgow, Scotland, 2009.
- J.-H. Kim, Y.-J. Park, M.-S. Yeo, K.-W. Kim, An experimental study on the environmental performance of the automated blind in summer, Building and Environment 44 (2009) 1517-1527. https://doi.org/10.1016/j.buildenv.2008.08.006
- H. Bülow-Hübe, Office worker preferences of exterior shading devices: a pilot study, Copenhagen, Denmark, 2000.
- S. Jain, V. Garg, A review of open loop control strategies for shades, blinds and integrated lighting by use of real-time daylight prediction methods, Building and Environment 135 (2018) 352-364. https://doi.org/10.1016/j.buildenv.2018.03.018
- G. Yun, K.C. Yoon, K.S. Kim, The influence of shading control strategies on the visual comfort and energy demand of office buildings, Energy and Buildings 84 (2014) 70-85. https://doi.org/10.1016/j.enbuild.2014.07.040
Copyright © 2019 The Author(s). Published by solarlits.com.

2361
Total views
Citations
SHARE ON


