Volume 6 Issue 2 > pp. 124-130 • doi: 10.15627/jd.2019.12
A First Approach to a New Index on Indoor Lighting Comfort Based on Corneal Illuminance
Ferdinando Salata,a,* Iacopo Golasi,a Antonio Peña-García,b Virgilio Ciancio,a Zahra Yousefic
Author affiliations
a DIAEE (Department of Astronautical, Electrical and Energy Engineering – Applied Physics Area), Faculty of Civil and Industrial Engineering, University of Rome “Sapienza”, Italy
b Department of Civil Engineering & Research Group “Lighting Technology for Safety and Sustainability”, University of Granada, Granada, 18071, Spain
c School of Art, Architecture and Design, University of South Australia, Adelaide, South Australia
* Corresponding author.
ferdinando.salata@uniroma1.it (F. Salata)
iacopo.golasi@uniroma1.it (I. Golasi)
pgarcia@ugr.es (A. Peña-García)
virgilio.ciancio@uniroma1.it (V. Ciancio)
z.yousefi@ut.ac.ir (Z. Yousefi)
History: Received 20 October 2019 | Revised 21 November 2019 | Accepted 26 November 2019 | Published online 28 November 2019
Copyright: © 2019 The Author(s). Published by solarlits.com. This is an open access article under the CC BY license (http://creativecommons.org/licenses/by/4.0/).
Citation: Ferdinando Salata, Iacopo Golasi, Antonio Peña-García, Virgilio Ciancio, Zahra Yousefi, A First Approach to a New Index on Indoor Lighting Comfort Based on Corneal Illuminance, Journal of Daylighting 6 (2019) 124-130. http://dx.doi.org/10.15627/jd.2019.12
Figures and tables
Abstract
In this study, the conditions of visual comfort were assessed in an indoor environment intended for students. For this reason, a transversal field survey was carried out in two libraries, one at the Sapienza University of Rome (Italy) and another at the University of Granada (Spain). During the analysis, measurement of lighting engineering variables such as horizontal illuminance, corneal illuminance, and luminance was carried out at the same time. The randomly selected individuals were asked to compile the structured questionnaires voluntarily at both sites. The first part of the questionnaire covered personal information, such as gender, age, eye color, etc. While the latter part evaluated the perception and visual preference of interviewees. In particular, we analyzed the visual perception on the basis of a five-point scale (-2÷+2), where positive and negative values identified visual comfort and discomfort, respectively. Each point was related to both related measured values of the lighting project variables and values of the personal data derived from the questionnaires. The subsequent statistical analysis (carried out through parameters and methodologies such as evaluation of the Variance Inflation Factor, Multicollinearity and Best Subsets Analysis) allowed the development of a new empirical index that is easy to apply, i.e., the Predictive Visual Comfort Index (PVCI). Some of the independent variables included horizontal illuminance, corneal illuminance, and age. In the design phase, once the other variables had been set, it was useful to determine the necessity of corneal illuminance to ensure visual comfort. The influence of each variable on the index and visual comfort was also quantified.
Keywords
Lighting, Visual comfort, Corneal illuminance, Energy saving
1. Introduction
Even if the traditional lighting project approach focuses on the illuminance of the horizontal worktop [1], in recent years the importance of corneal illuminance has been progressively increased. Defined in some cases as vertical illuminance at eye level, it is useful for the evaluation of various aspects, including non-visual circadian effects. For this reason, the cylindrical illuminance (identified as an average value of vertical illuminance levels on a cylinder) was introduced in various regulations. In this regard, the current version of the EN 12464-1 standard [2] suggests an average cylindrical illuminance higher than 150 lux for places such as offices, meeting rooms and classes and, from a more general point of view, higher than 50 lux for indoor environments. The lighting aspects therefore play a key role in maintaining healthy circadian rhythms [3] and can also favor the balance of the so-called "endogenous clock", which varies between 23.5 and 24.7 hours, depending on the individuals [4]. The situation changes if exposure to light during daylight hours proves to be insufficient, and if the night light is inappropriate. In this case, there would be an interruption of circadian rhythms. In particular, the question of corneal illuminance is still unclear, and it is the aim of this research [5]. It was emphasized that, in industrialized countries and during daylight hours, the amount of light the occupants receive may be too low [6].
According to various studies, different values of corneal illuminance indicate favoring the circadian effects. Among the various models proposed to date, the most frequently used ones are the Circadian Stimulus (CS) model and the Equivalent Melanopic Lux model. The former, for example, was developed by Rea et al., which preliminarily calculated the so-called circadian light (CLA) with reference to the distribution of spectral irradiance on the cornea and then obtained the CS value (Eq. (1)) assuming an exposure of 1 hour and a fixed pupil diameter of 2.3 mm:
The CS value thus designed to be equal to the percentage of melatonin suppressed. It can, therefore, be used to assess the impact of light on the individual's circadian rhythms [7]. Rea and Figueiro [8] conducted research on Alzheimer's patients and they found that a CS value between the first hours of the morning and 6 p.m. at least equal to 0.30 could bring significant benefits in terms of duration and quality of sleep and a reduction in agitation and depression symptoms. Young et al. [9], in a study conducted on subjects employed in submarines, identified the value of CS able to favor the correct maintenance of circadian rhythms in 0.30. With respect to office environments, Figueiro and Rea [10] found an improvement in the quality of sleep during summer months compared to winter months. They attributed this to the fact that, during summer, an average CS value of about 0.30 was measured, while in winter this value decreased to 0.20. Finally, similar studies were conducted by Acosta et al. [4] in hospital environments, where a minimum CS value of 0.35 was obtained.
It must be said that, among the factors that influence circadian rhythms, the spectral distribution and corneal illuminance seem to have a static connotation. They, therefore, derive from the choices that are made at the design stage [11]. In this regard, some research has shown that the spectrum relative to daylight is extremely efficient in promoting the circadian stimulus. Taking into consideration the CIE D65 spectrum, a corneal illuminance of 233 and 190 lux correspond to values of the Circadian Stimulus (CS) of 0.35 and 0.31 respectively.
However, it should highlighted how ensuring an adequate CS value through natural light is rather complicated. This is evidenced by studies that have evaluated the number of days characterized by, for at least an hour during the morning, a CS value higher than or equal to 0.35. Indeed, they confirmed a certain influence of factors such as the orientation of the windows, the latitude, the meteorological conditions, the reflection coefficient of the internal walls ... It is therefore essential to carefully plan artificial lighting and optimize its spectral performance.
From this point of view, if it is considered a typical fluorescent lamp, it would be necessary to have a corneal illuminance of 575 lux to ensure a CS value of 0.35. The corneal illuminance value remains high even though, to be implemented, is a LED lamp (4,000 K CCT and Color Rendering Index ≥ 80) characterized by a spectral optimization. In this case, the corneal illuminance turns out to be equal to 442 lux, highlighting how the required values are higher than what was recommended and obtained in the current lighting design. The application of circadian light in the built environment, therefore, involves a rather interesting challenge regarding the values of corneal illuminance [12].
The contribution of corneal illuminance can promote comfort in the performance of one's visual task, reinforcing the luminous flux perceived by the eye, and at the same time, horizontal illuminance must be guaranteed on the work surface. This can be useful to guarantee adequate visual comfort, reducing the demands of horizontal lighting with a consequent energy saving [13-15]. It linked to the lower luminous flux required by the lighting systems [16,17].
2. Purpose of the work
Experimental data were collected in some university libraries in Rome (Italy) and in Granada (Spain). In these places experimental data related to horizontal illuminance, cylindrical vertical illuminance and luminance were sampled. At the same time, the required information on the visual comfort of the subjects present at the time of the measurements in the libraries was collected through questionnaires. This was to determine the importance (numerically determining the weight in a mathematical relation) of each parameter analyzed (illuminance and luminance on the plane of the visual task, corneal illuminance) in order to numerically express the sensations of visual comfort through an index capable of predicting its value. This index has to be easy to apply for technicians in the related sector.
3. Area and subjects of the study
With regard to the activity of this research, visual comfort was evaluated in indoor environments with the need to guarantee lighting levels suitable for reading: the libraries belong to the Sapienza University of Rome (Fig. 1(a)) and the University of Granada (Fig. 1(b)).
Figure 1
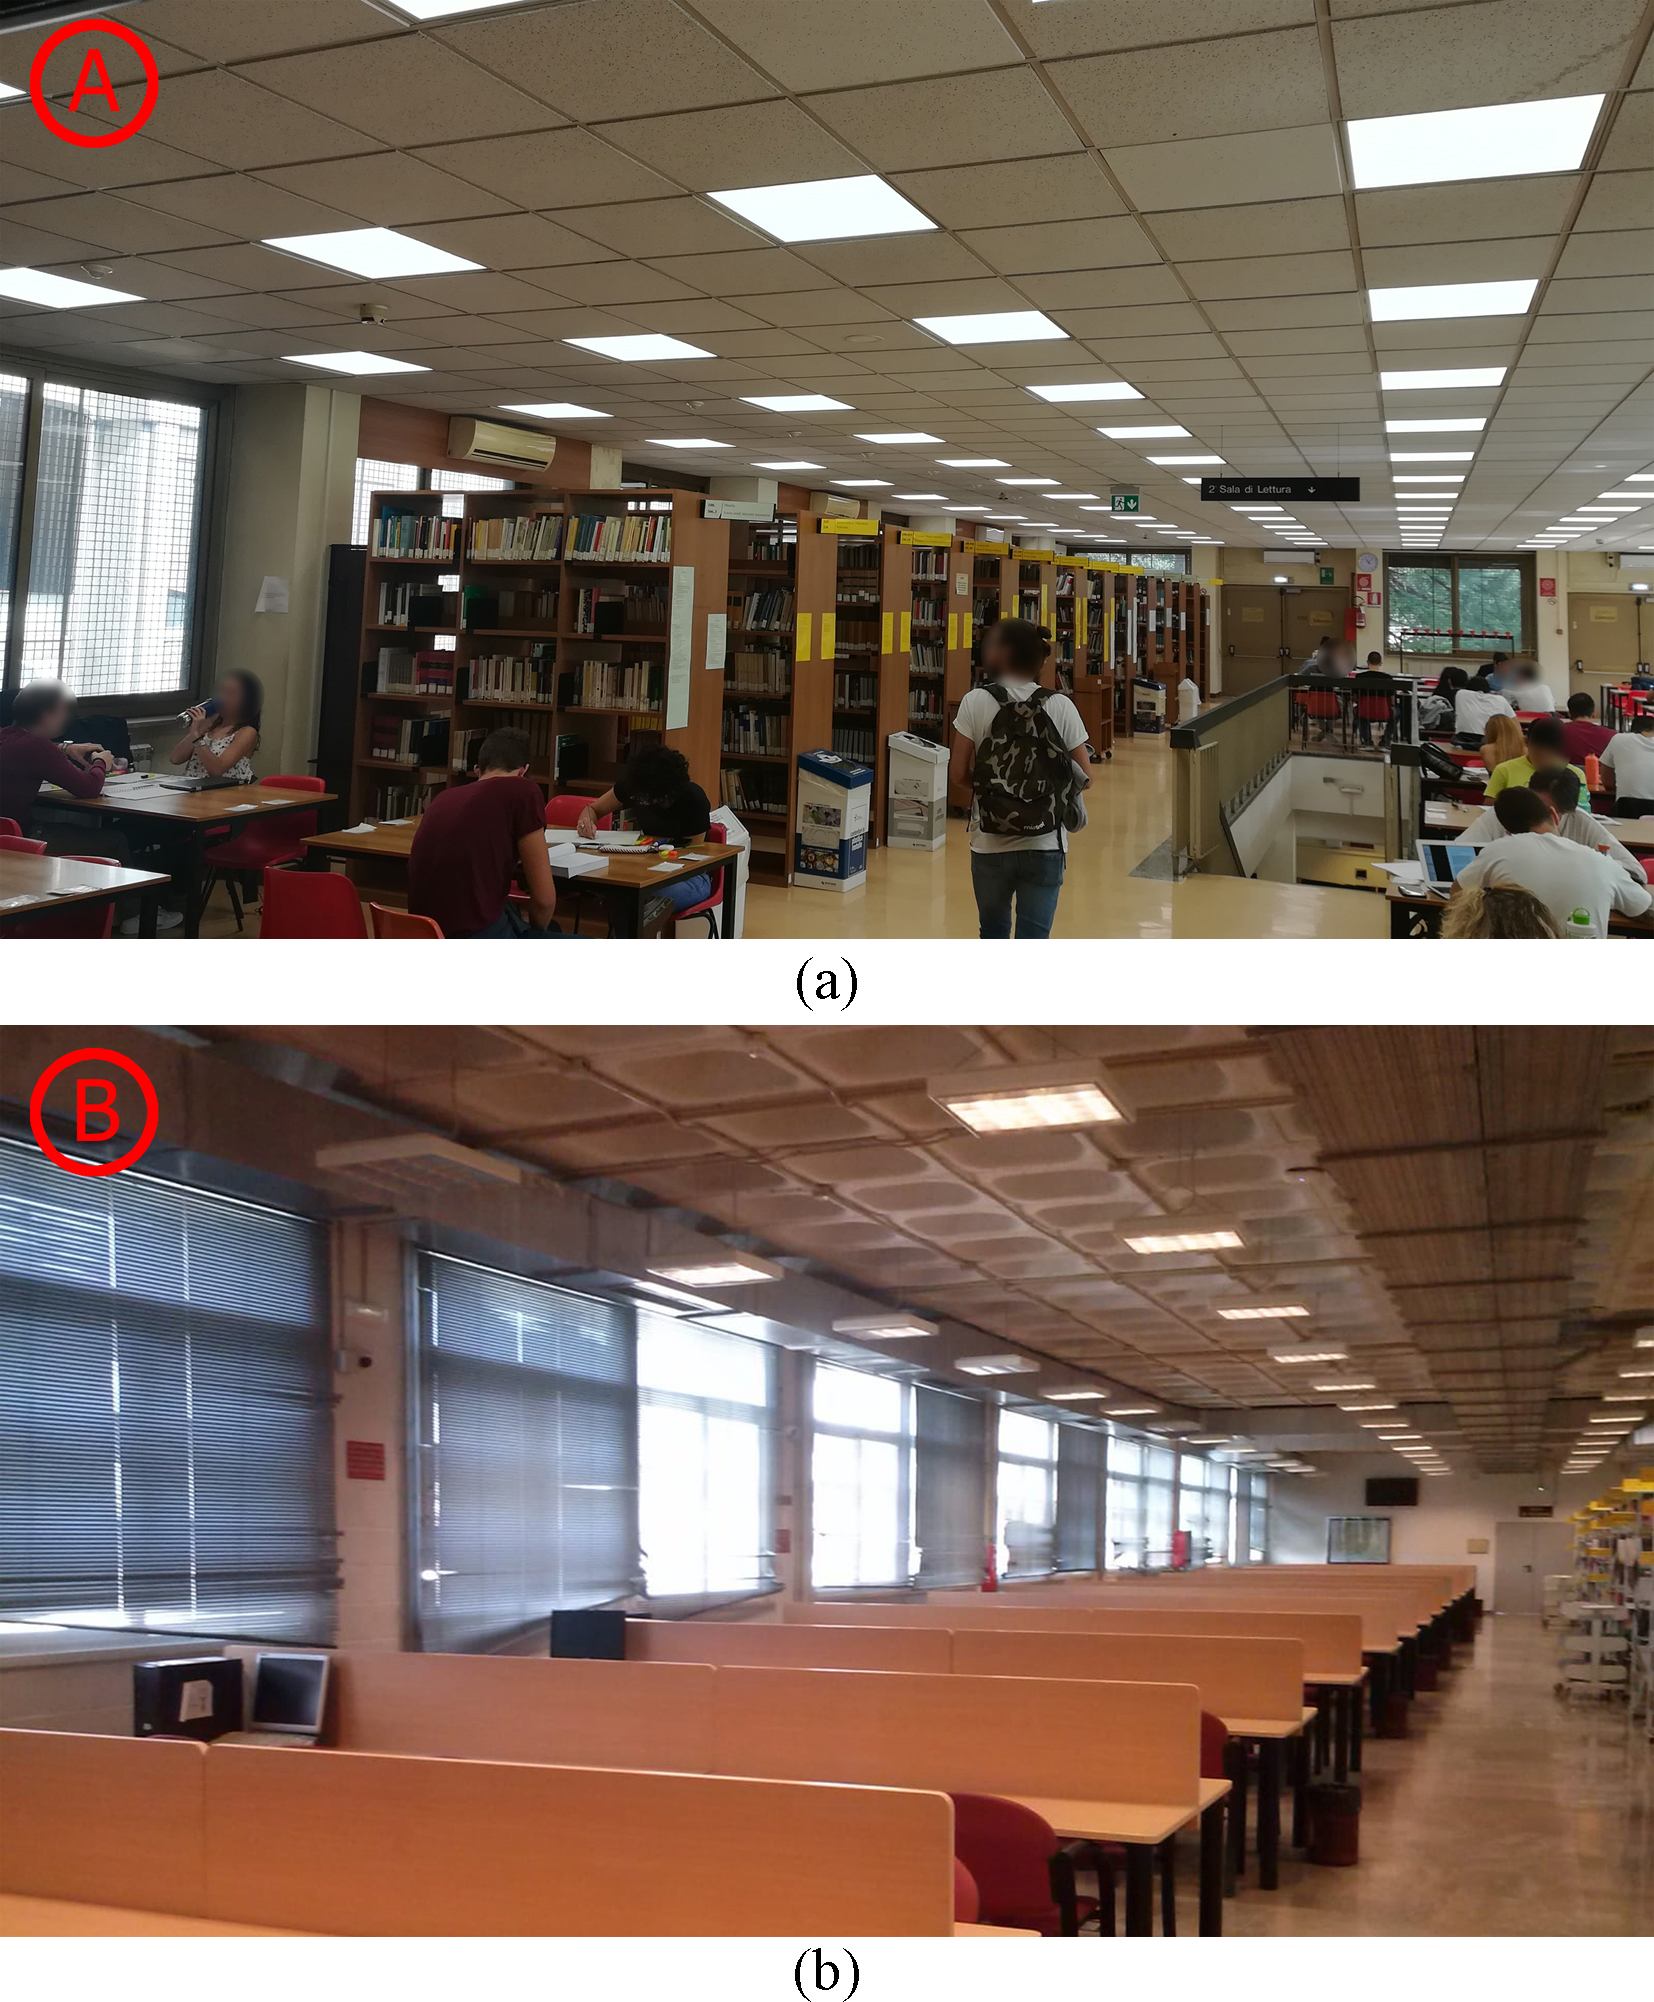
Fig. 1. The indoor environments characterizing (a) the library belonging to Sapienza University of Rome and (b) the one belonging to the University of Granada.
The library used for the research in Rome is a rectangular room (35.00 m × 11.50 m) located on the ground floor and characterized by large windows (3.40 m (base) × 2.20 m (height)) along the longer sides (North-West and South-East) and on one of the smaller sides (North-East). The windows facing North-East and South-East have a free horizon, while the windows located in North-West overlook the high university building (7 floors) (Fig. 2). The capacity is 408 people and has a lighting system consisting of 116 luminaires (total power for each light source: 75 W; Colour Rendering Index (CRI): 80 ÷ 89; colour temperature: 4,000 K; luminous flux: 1,350 lm). The library is roofed with white roofs and walls the floor is in cream-colored linoleum (with a surface reflectance of 70% and 60%, respectively).
Figure 2
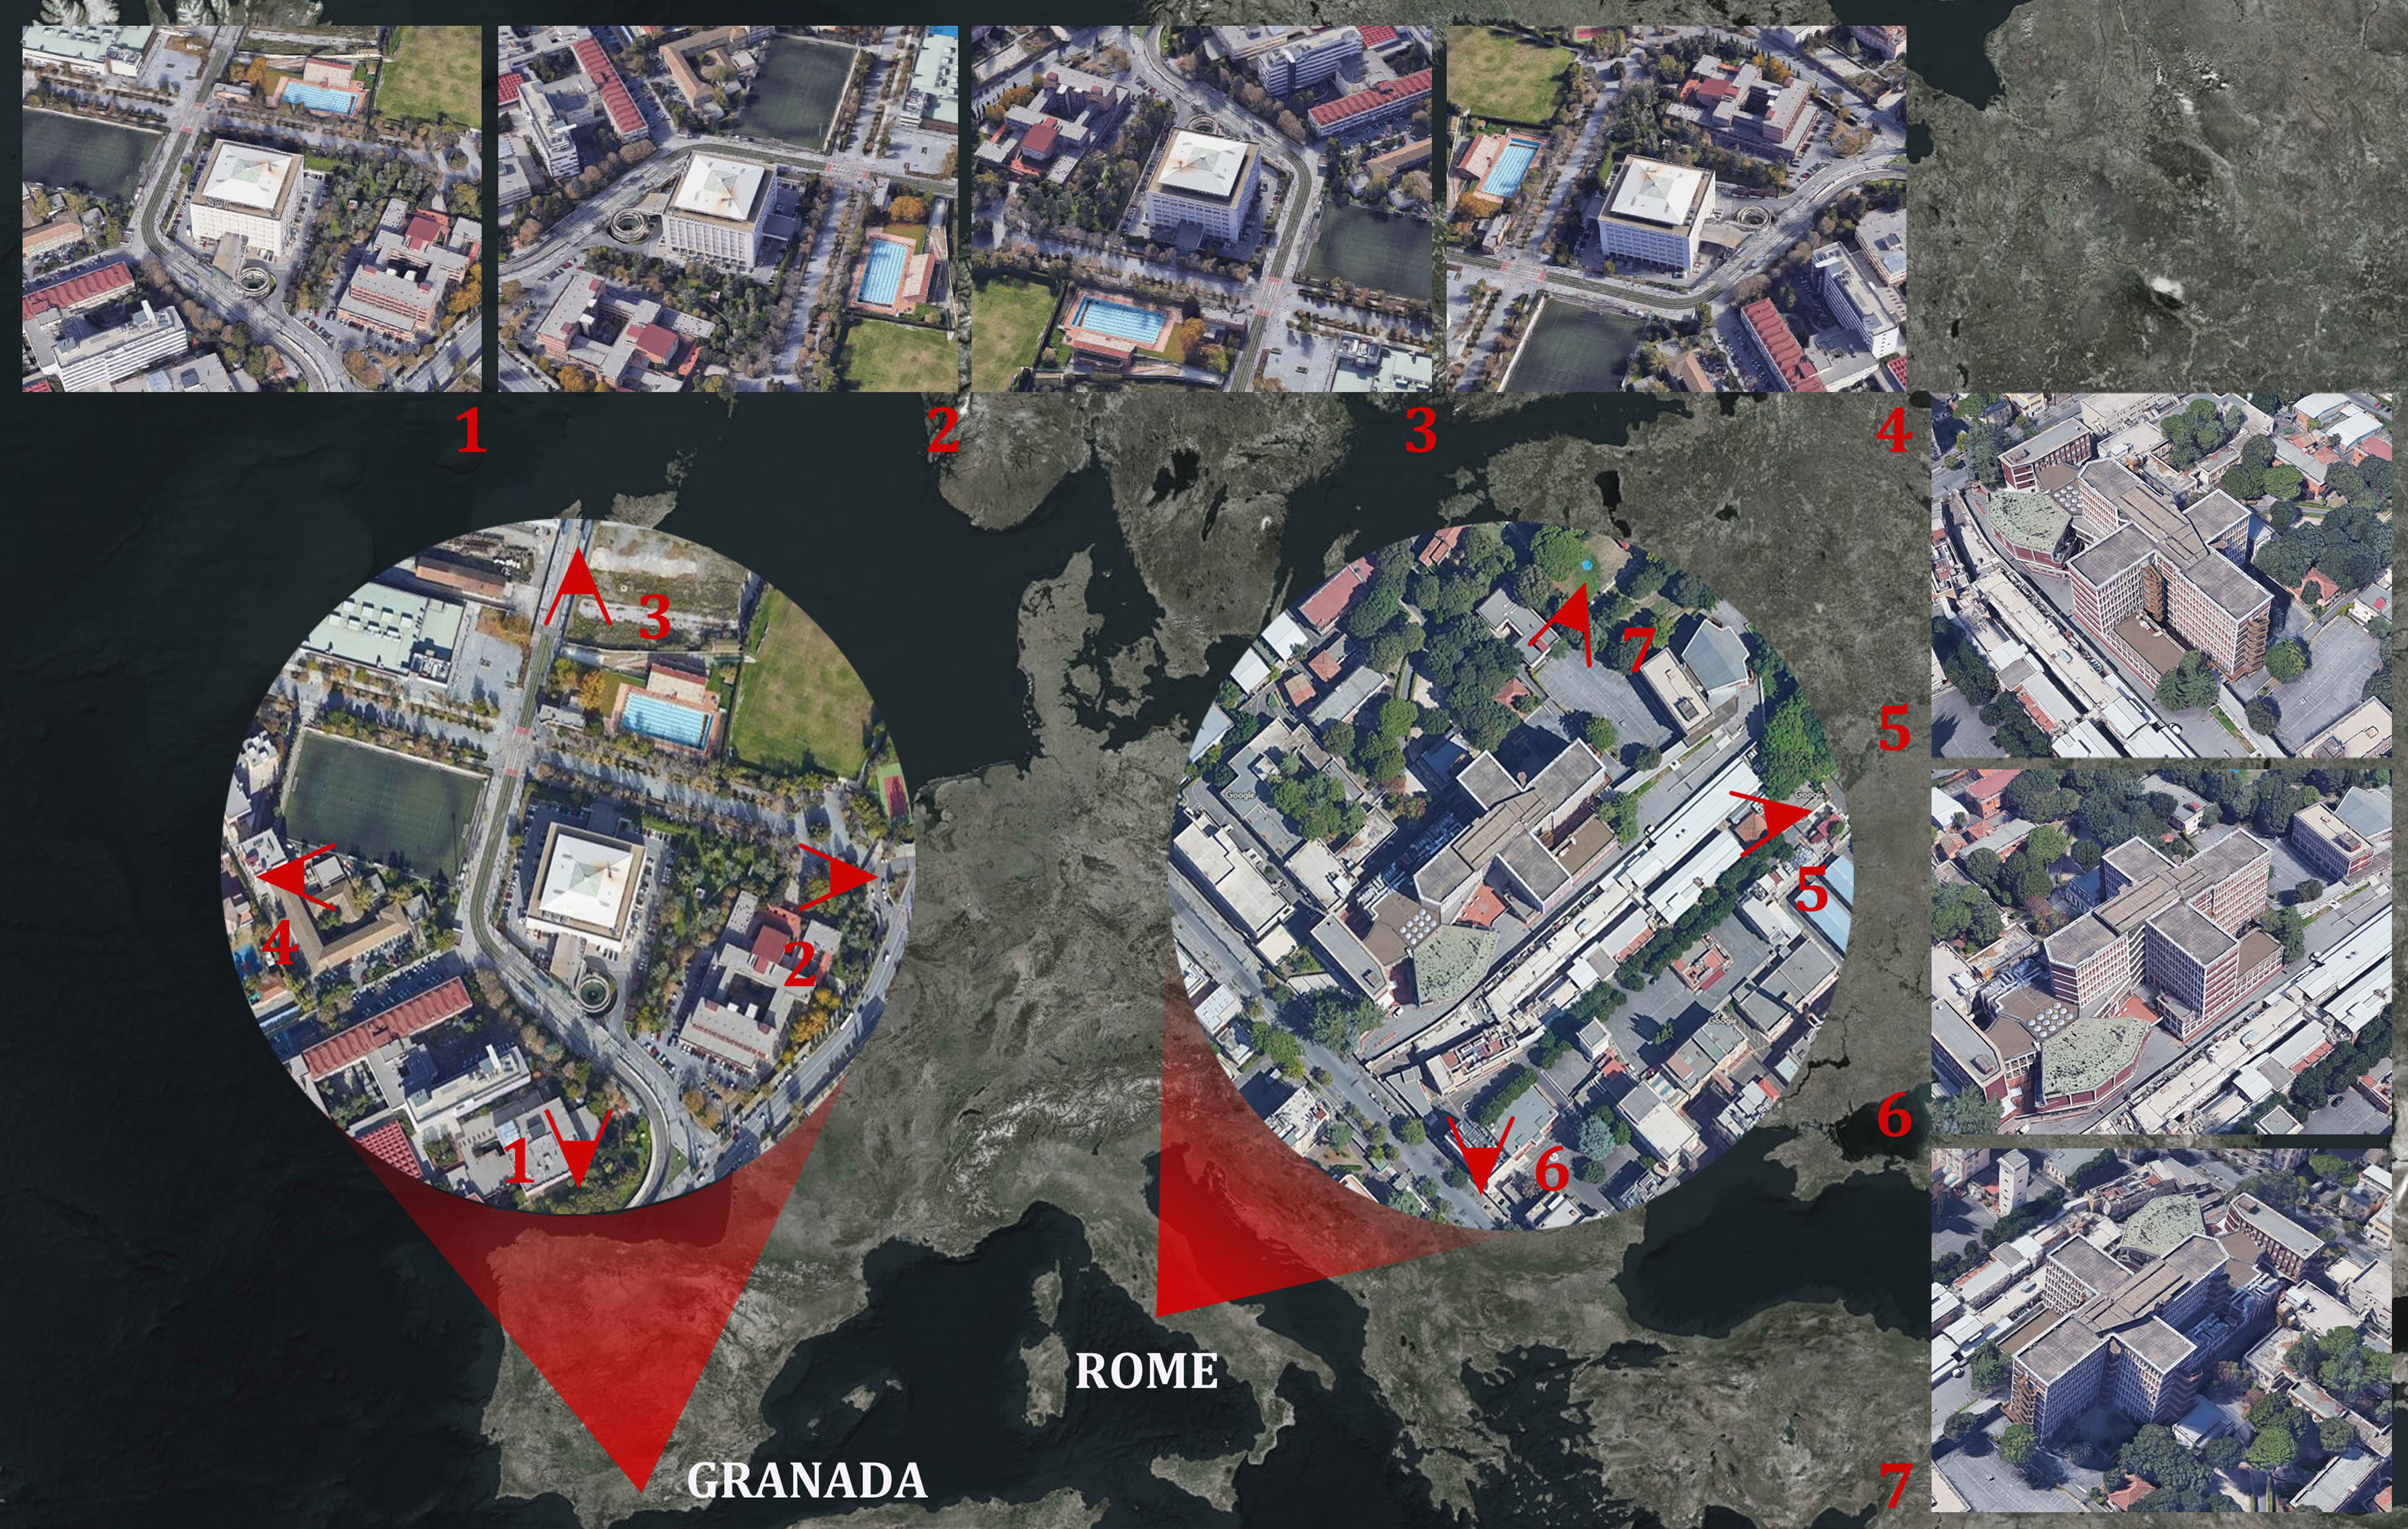
Fig. 2. University libraries object of this study.
In Granada, the library is a rectangular room with dimensions of 10.85 m × 40.40 m and with the south-east side characterized by a wall with windows (3.60 m (base) × 2.30 m (height)). It can seat 150 people and its lighting system consists of 60 artificial light sources (total power for each light source: 108 W; Colour Rendering Index (CRI): 80; colour temperature: 4,000 K; luminous flux: 8,700 lm). Each light source incorporates three florescent bulbs. The walls are in white plaster; the ceiling is light grey, and the floor is light brown (with reflection coefficients equal to 70%, 70% and 40% respectively).
4. Materials and methods
As previously said, different lighting measurements were carried out during the survey. This allowed to relate the feedback given by the participants on visual comfort to the corresponding values of the measured lighting variables. In particular, the values of illuminance on the horizontal work surface, corneal illuminance, and luminance were measured. The horizontal illuminance was measured by placing the lux meter on the work surface representative of the visual task. The corneal illuminance was calculated as the mean value of three vertical illuminance measurements at the participant's eyes level. The luminance was finally obtained by placing the luminance meter at eye level of the interviewee in the direction of the horizontal work surface.
The experimental measurements were performed on each individual interview according to the schemes shown in Fig. 3. The used instruments are described in Table 1, together with their metrological properties. Then Table 2 reports some data related to the measured variables.
Figure 3
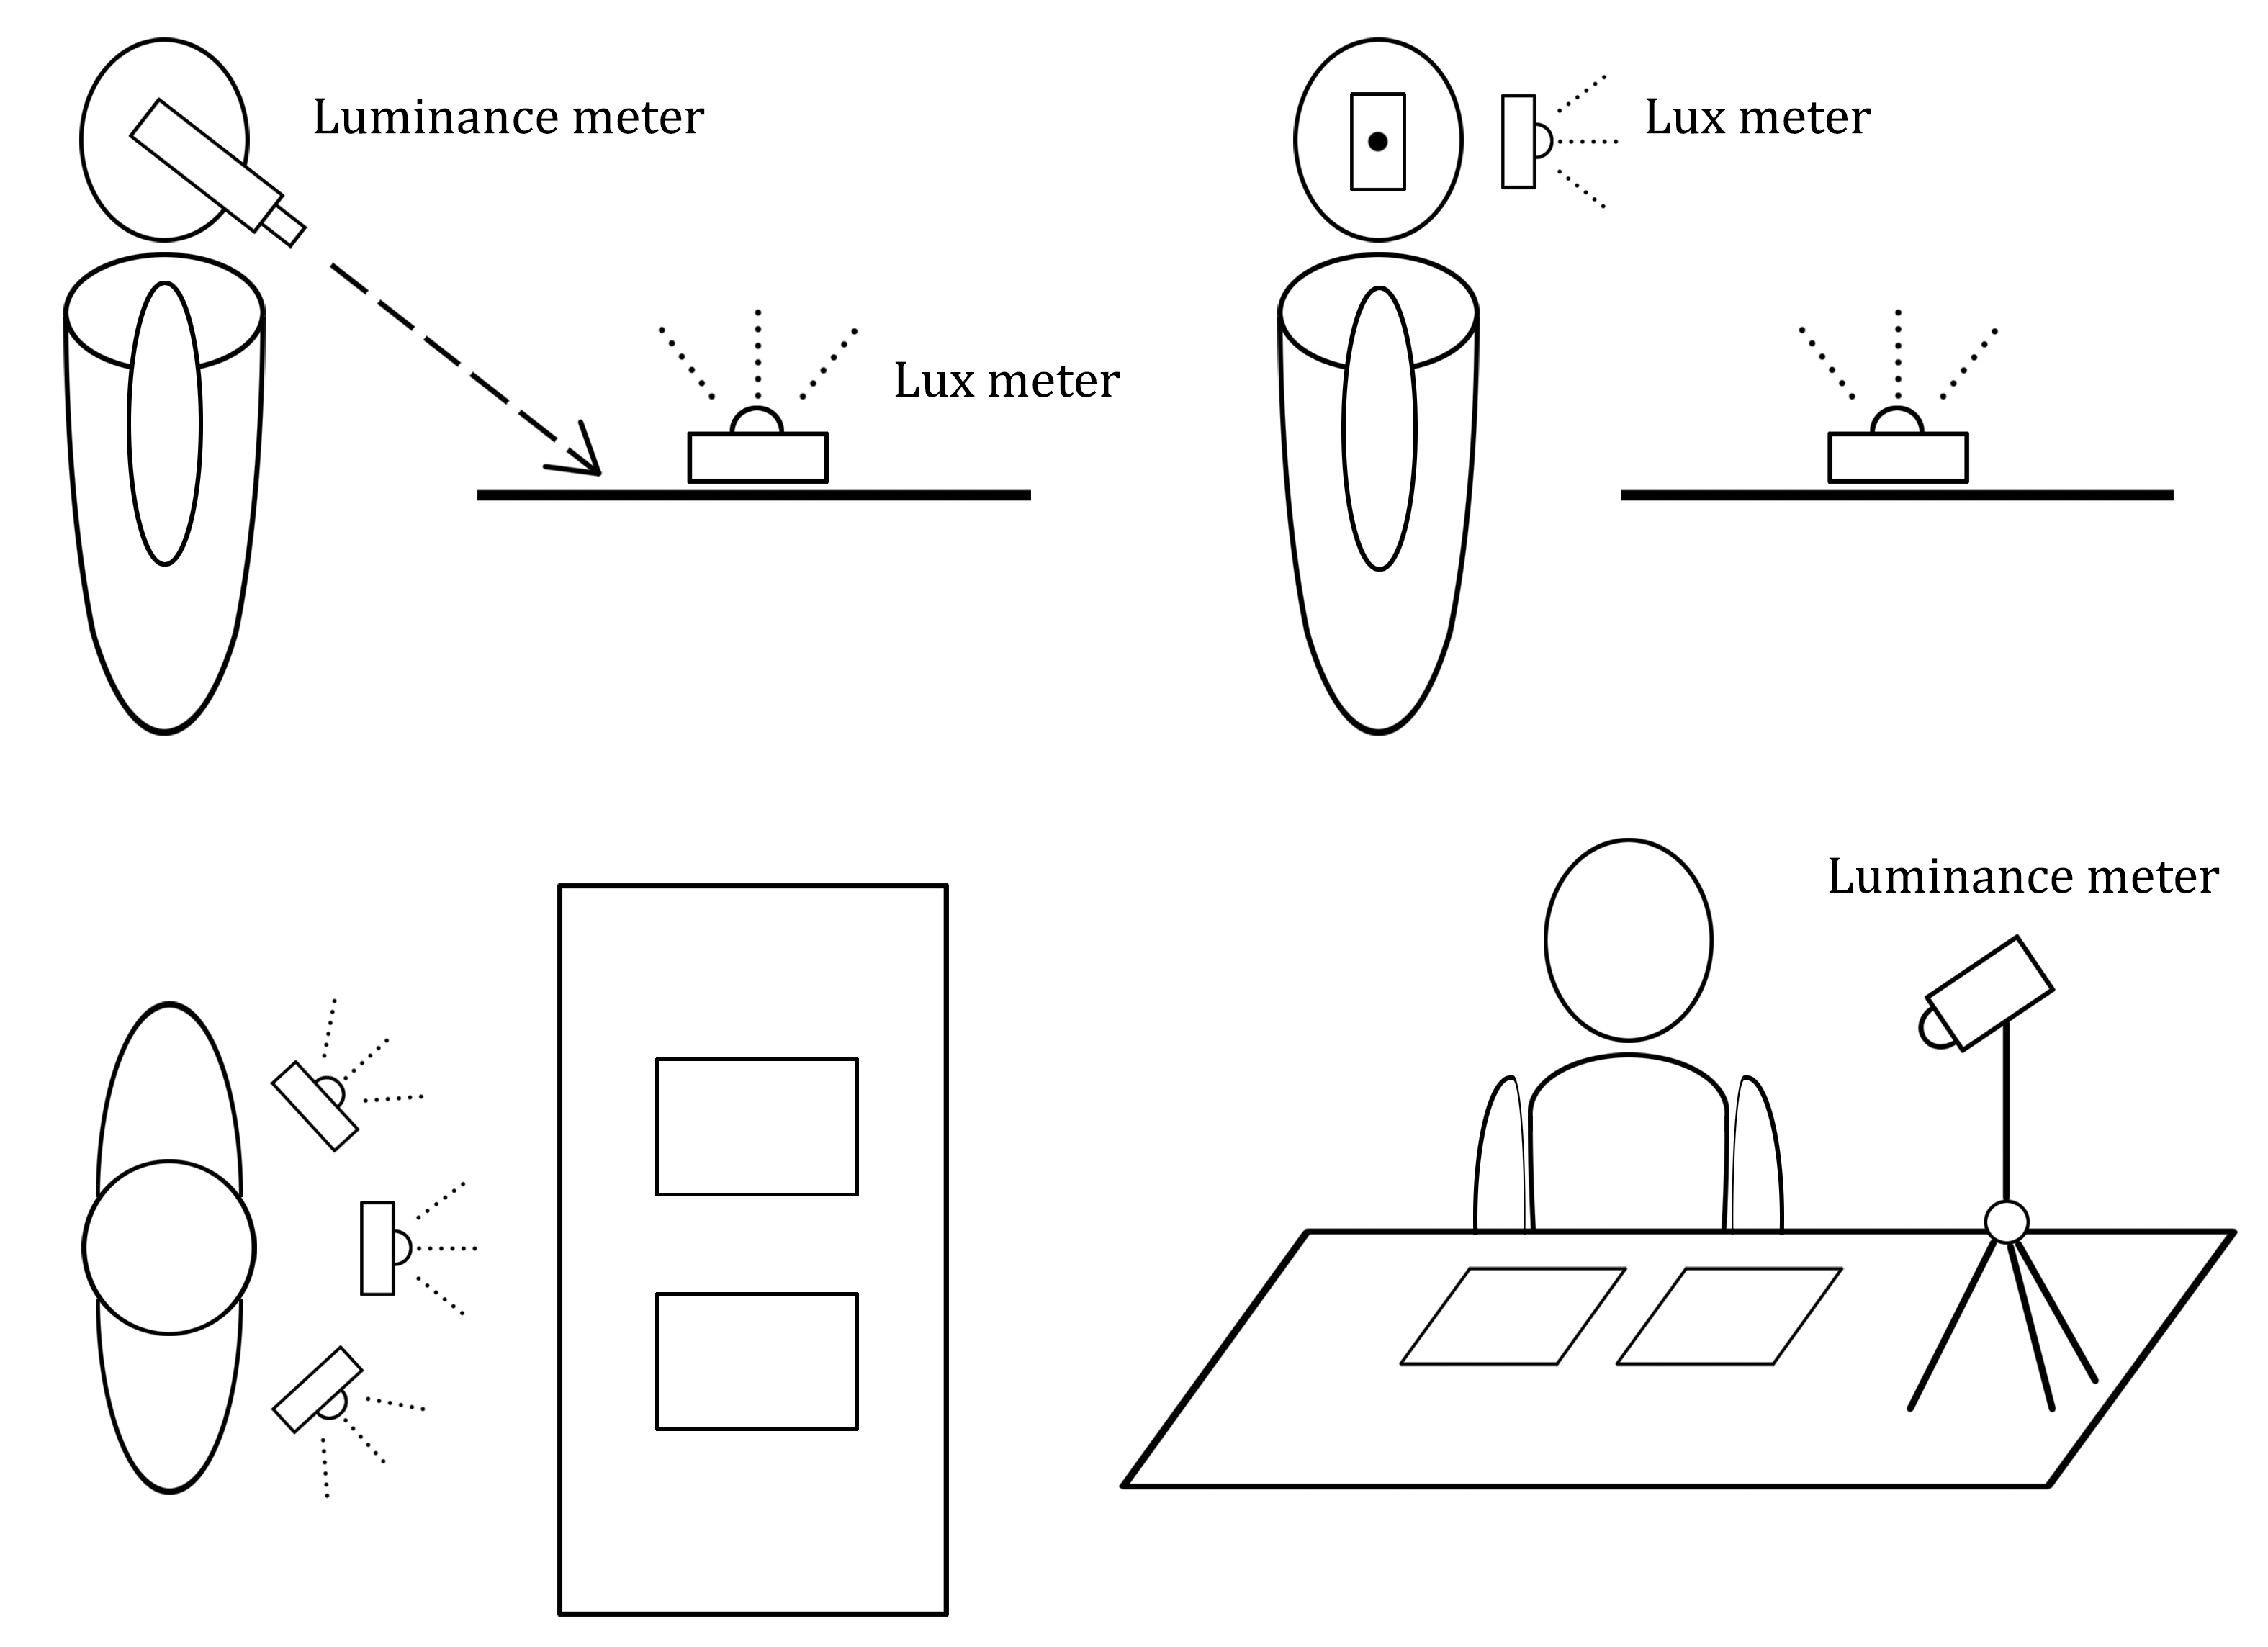
Fig. 3. Schematics of the measurements carried out in accordance with the libraries' reading plans.
Table 1
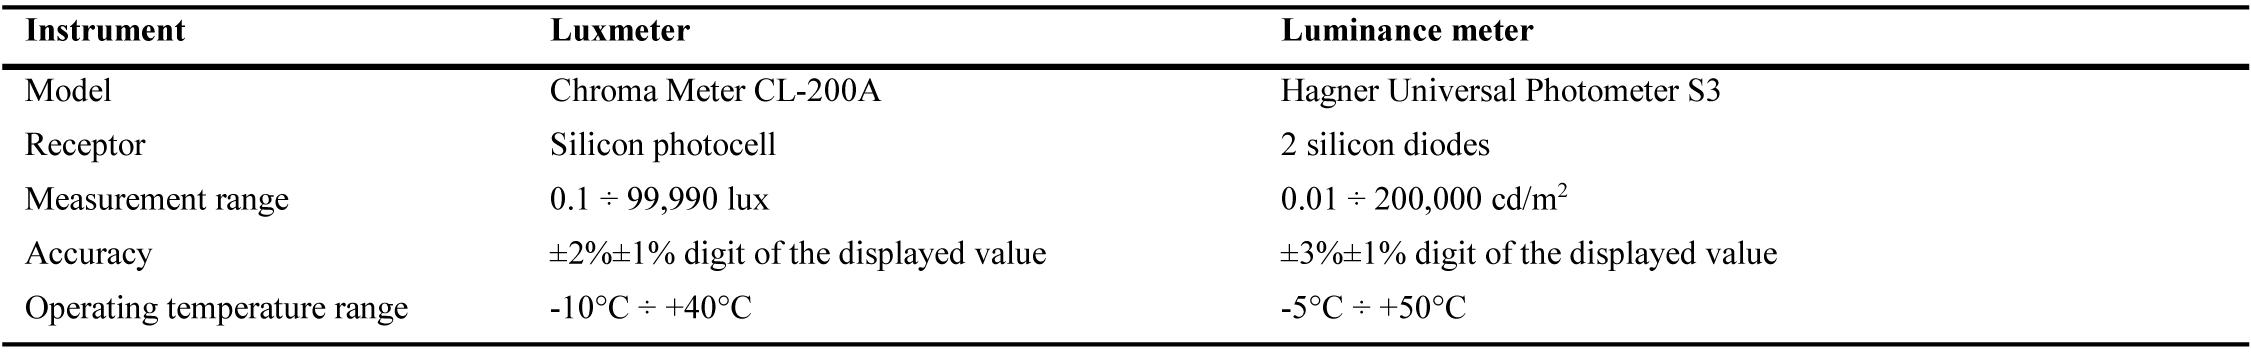
Table 1. Metrological properties of measuring instruments used in experimental measurements.
Table 2
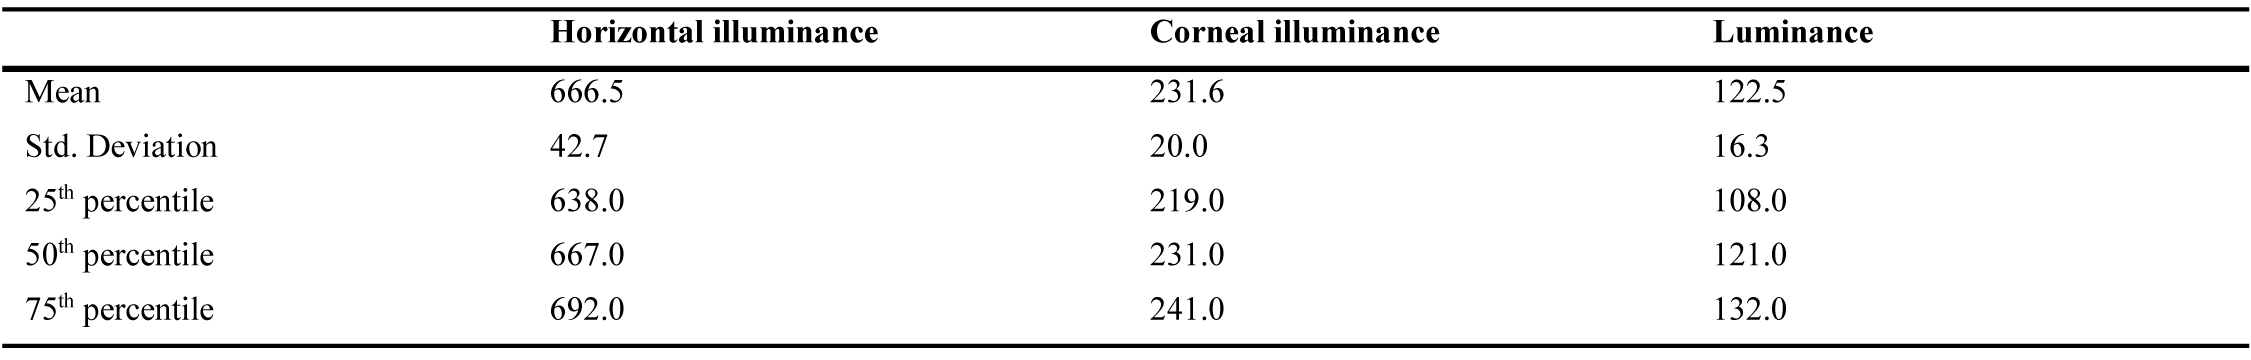
Table 2. Data related to the measured variables.
To assess the influence of corneal illuminance on the visual comfort of the occupants and to determine its value for maintaining ideal conditions, a field survey was then prepared. It was based on a structured field survey and simultaneous measurement of the values of the lighting engineering variables (illuminance and luminance on the plane of the visual task, corneal illuminance). The evaluation sheets have allowed collecting personal information on the survey participants and, at the same time, their perception and preference with regard to the lighting environment. The general data that characterize the sample of interviewed individuals are summarized in Fig. 4.
Figure 4
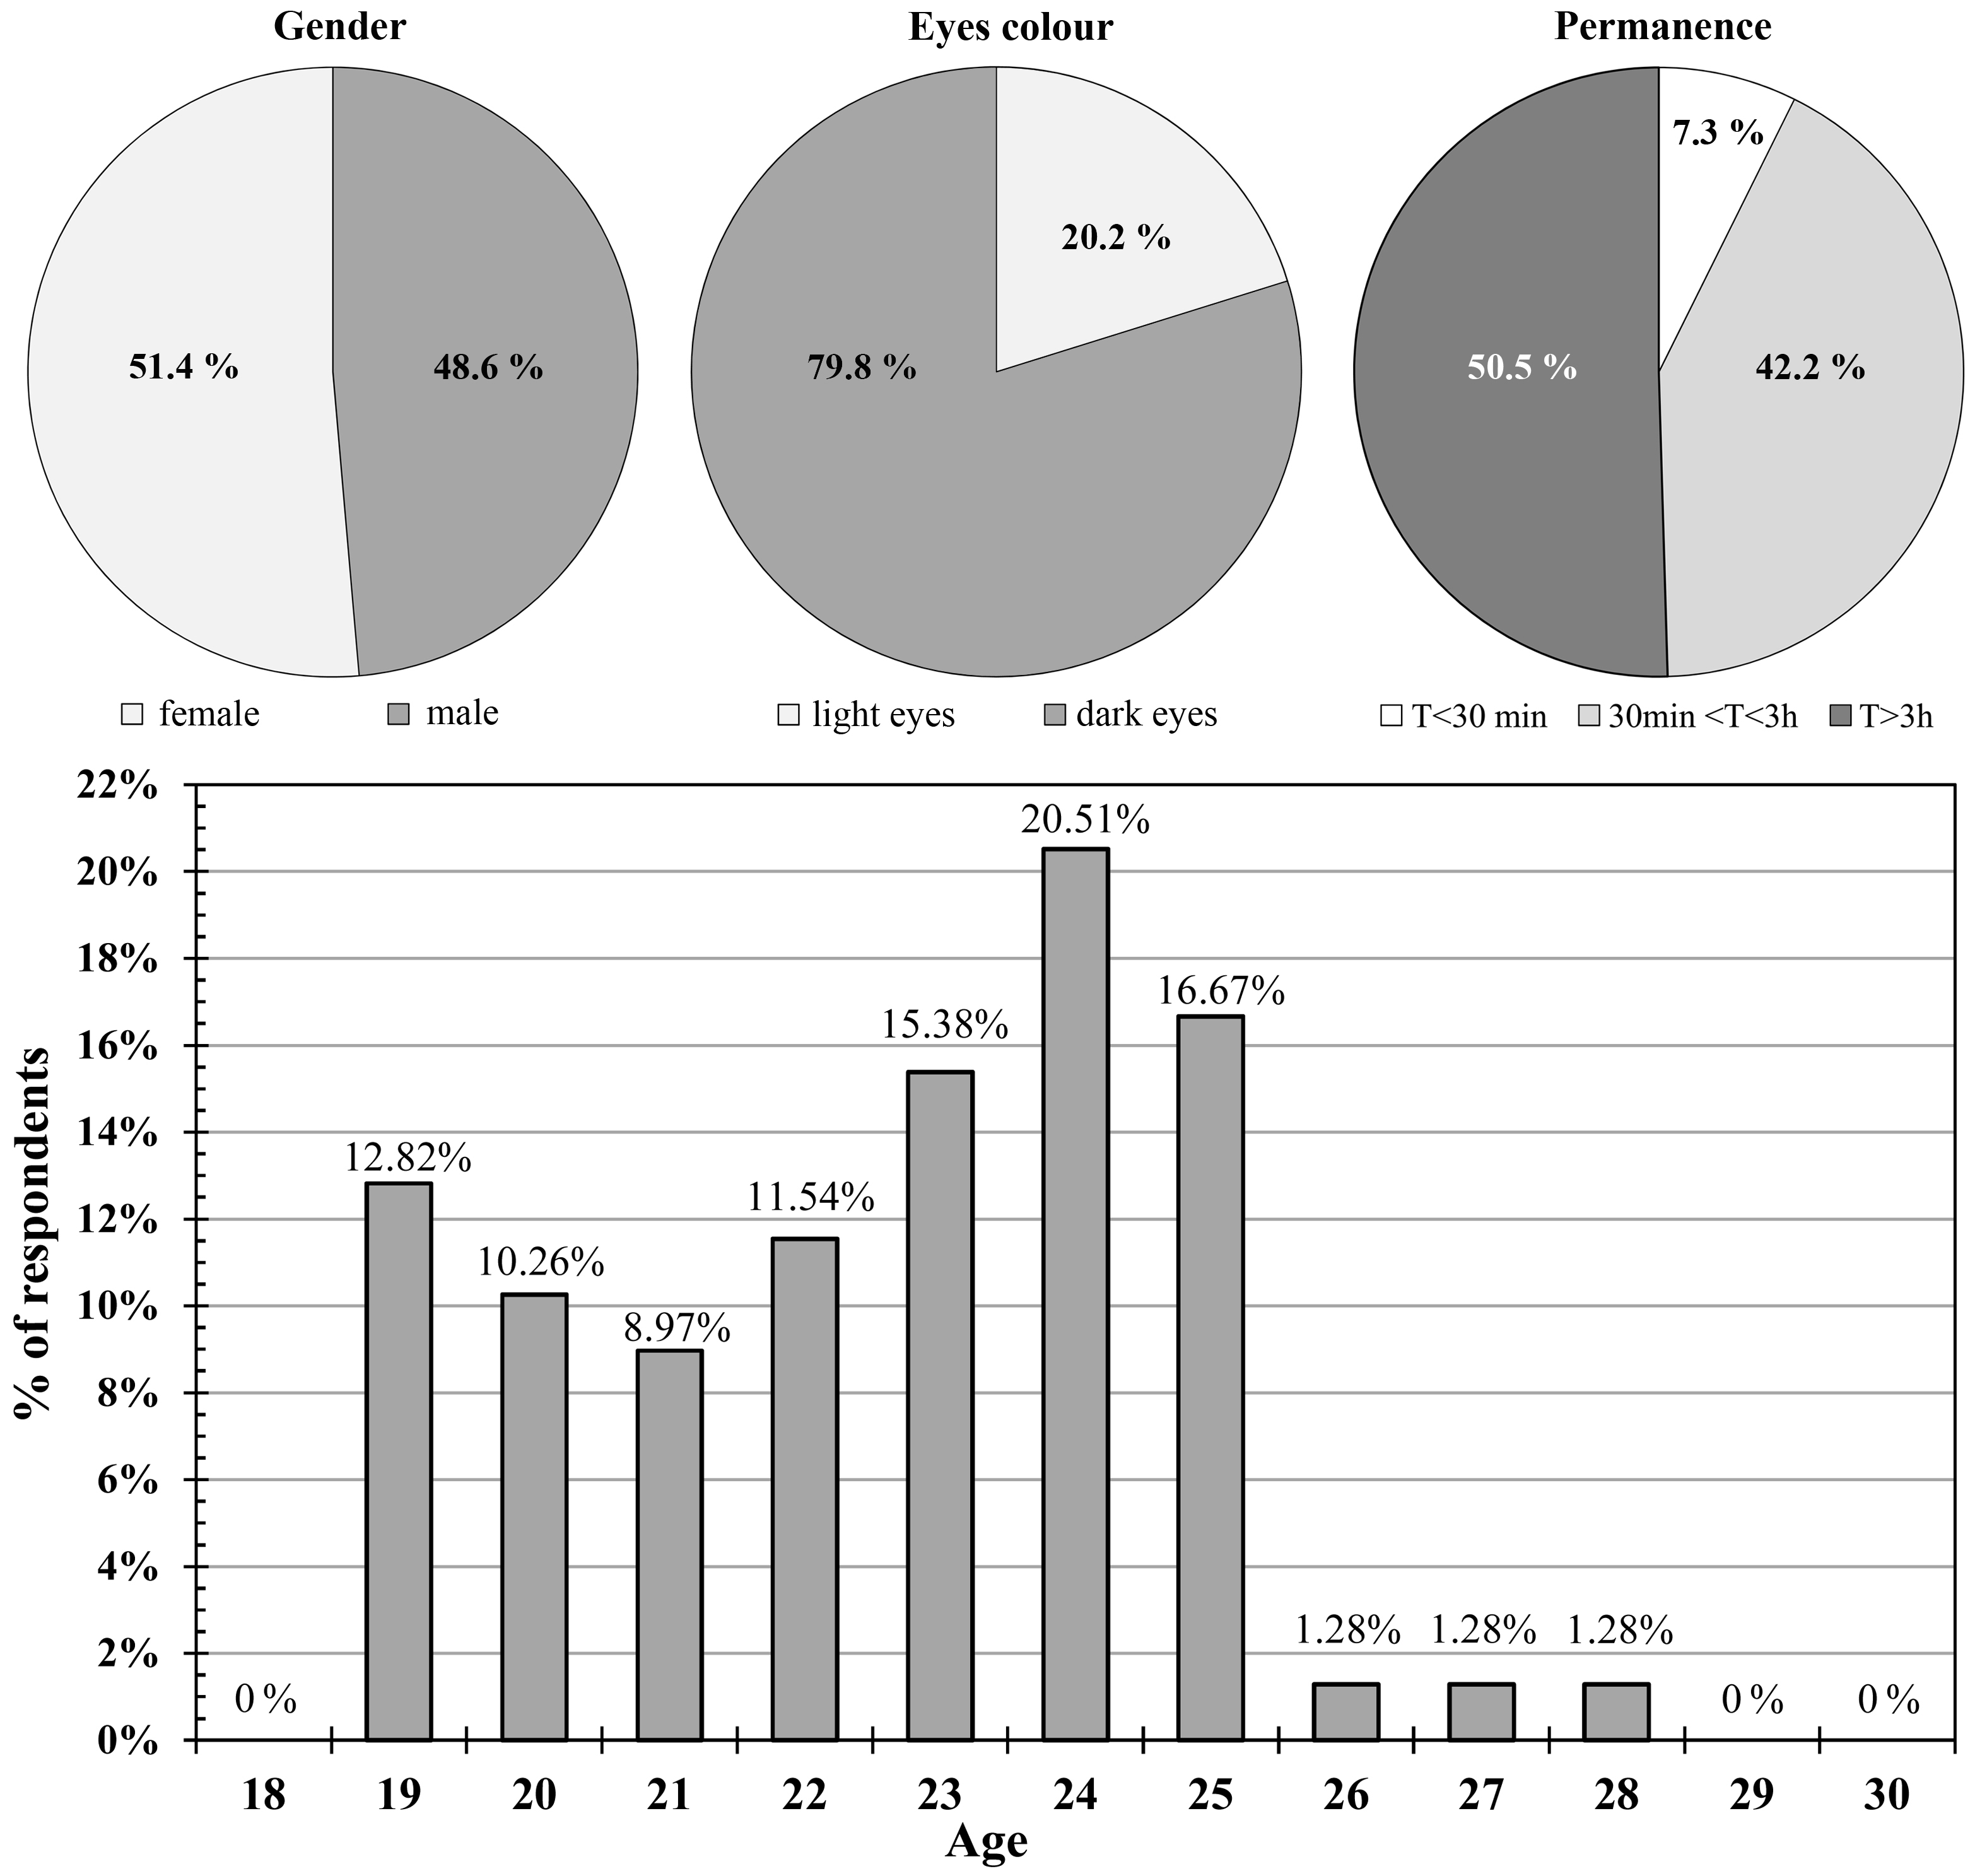
Fig. 4. Statistical data about the sample of respondents.
A questionnaire was prepared and submitted to all students present in the analyzed libraries. The questionnaires contained 19 different questions and were filled in anonymously by the subjects (randomly present at the time of sampling) who agreed to participate in the research. The questionnaire was characterized by three sections. The first part collected personal information as gender, age, eye color, possible sight problems, time of exposure to the library lighting conditions. The second part of the questionnaire concerned specific questions on perception of lighting present in the entire library and its visual comfort. In particular, the subjects were asked to judge the level of general lighting and uniformity of the library and the passage areas and to express any annoying conditions. The third part dealt specifically with the plan where the visual task was performed (reading), expressing a judgment about the level and uniformity of illuminance both of the artificial and natural component, expressing any annoying or straining conditions of one's own sight and to express a preference about a possible variation of the lighting at the time of survey.
With respect to this first approach, the answers given by the interviewees to the first part of the questionnaire were analyzed and related to the votes given to judge their visual comfort.
The results thus were collected and analyzed statistically on the basis of various tests: i) VIF (Variance Inflation Factor), ii) Best Subsets Analysis, iii) partial F test, and iv) t-test. In particular:
- The Variance Inflation Factor represented the quotient of the variance in the model (based on multiple terms) by the variance of a model with one term alone. The VIF quantifies the severity of multicollinearity in least-squares regression analysis, and it provides an index that measures how much the variance (the square of the estimate's standard deviation) of an estimated regression coefficient has been increased because of collinearity [18].
- Best Subsets Regression is an exploratory model building regression analysis. It compares all possible models that can be created based upon an identified set of predictors. The results present best subsets showing the best models for one, two, and three predictors, and so on for the number of possible predictors that were entered into the best subsets regression. To determine the best model, these models fit statistics that are used in conjunction with one another. R2 and adjusted R2 measure the coefficient of multiple determination and are used to determine the amount of predictability of the criterion variable based upon the set of predictor variables [19].
- The F test is useful for the comparison of two variances. It is a hypothesis test based on the Fisher-Snedecor F distribution and aims at verifying the hypothesis that two populations following both normal distributions have the same variance [20].
- The test-t is a parametric statistical test with the aim of verifying whether the average value of a distribution deviates significantly from a certain reference value [20].
5. Results and Discussion
The preliminary analysis of the VIF and multicollinearity and the subsequent Best Subsets Analysis have allowed us to develop the relationship at the base of the predictive model (which we will call Predictive Visual Comfort Index, PVCI). In particular, the variables initially examined age, time spent in the library, eye color, possible vision problems, illuminance on the horizontal work surface, corneal illuminance, and luminance. The study of VIF and multicollinearity led to the exclusion of luminance. The remaining variables were then combined with each other in all possible regression models. The evaluation of parameters such as the statistic CP, R2 and adjusted R2 then led to choosing the model that includes, among the independent variables, horizontal illuminance, corneal illuminance, and age. The results of these analyses are reported in Table 3.
From which derives the expression of the index sought reported in Eq. (1).
The dependent variable turned out to be visual comfort, derived from the votes given by the participants about their visual perception on the basis of a symmetrical scale ranging from (-2) to (+2), where the score (+2) turns out to be representative of a very comfortable lighting condition while the grade (-2) of a marked condition of visual discomfort.
Table 3
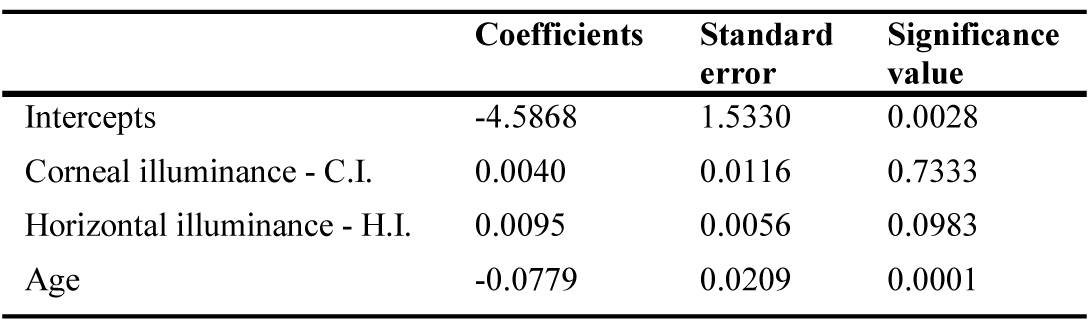
Table 3. Results related to the regression model obtained for the definition of PVCI.
Table 4 shows data that provide the quality of Eq. (1) in predicting the conditions of visual comfort. The partial F test allowed the quantitative evaluation of the contribution that each independent variable could give to the developed model (Fig. 5).
Table 4
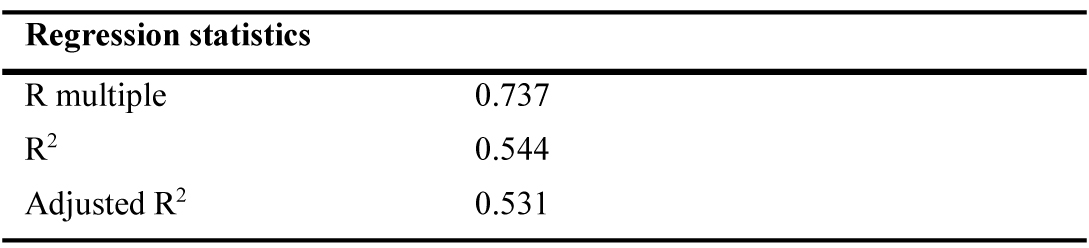
Table 4. Predictive goodness of Eq. (1).
Figure 5
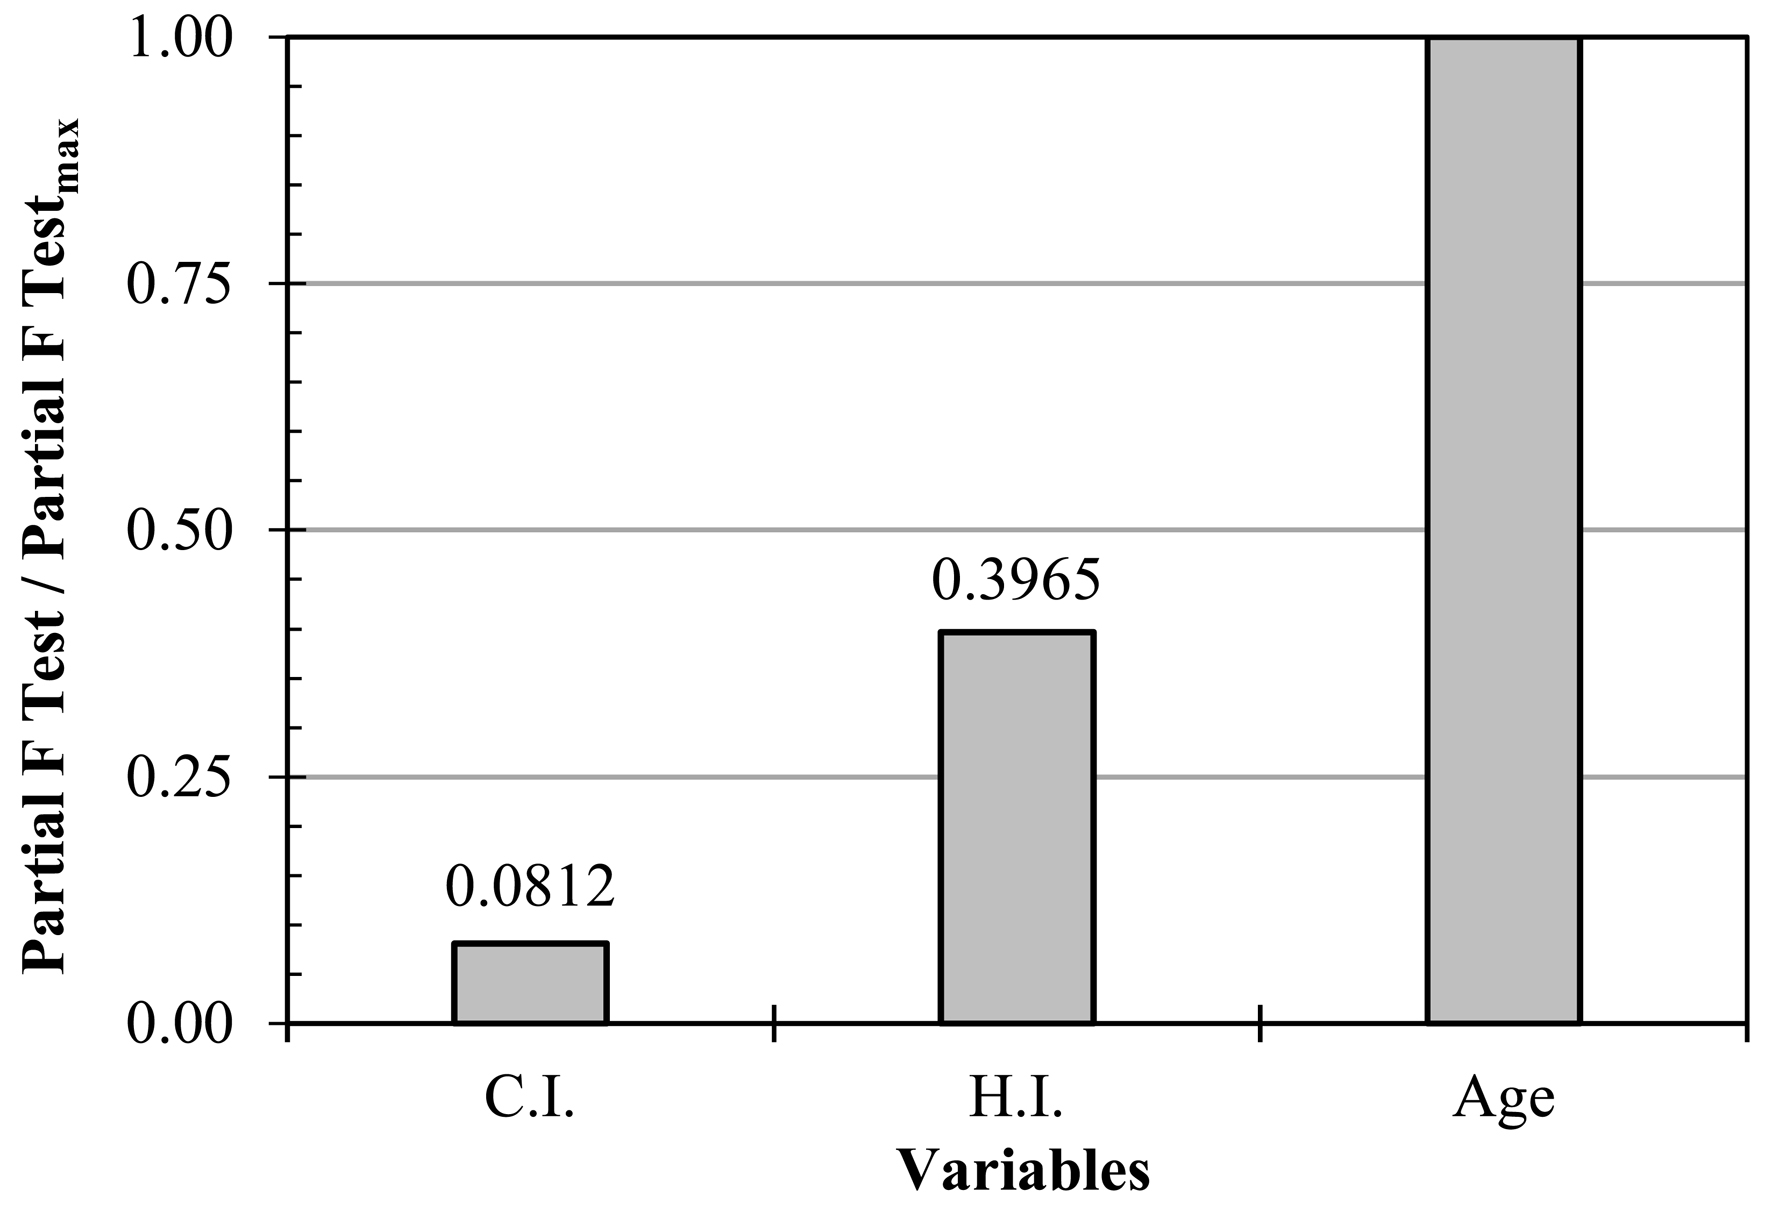
Fig. 5. Values concerning the ratio between the partial F test obtained for each variable and the maximum partial F test obtained in the study.
In particular, it appeared that the most influential variable is age. This was also confirmed by the evaluation of the “t statistic”, which allowed establishing if there was a significant relationship between the examined variables and visual comfort (Table 5).
Table 5
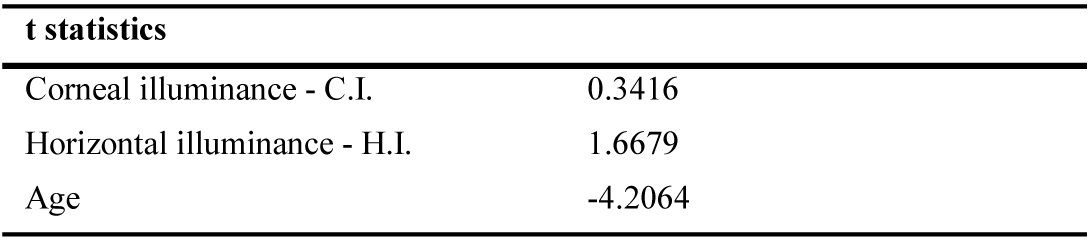
Table 5. Significance of the magnitudes in Eq. (1).
Although its weight is lower than that of age and horizontal illumination, it is significant how the statistical analysis led to the inclusion of corneal illuminance among the explanatory variables underlying the PVCI index. In particular, it could be useful to have the same available value to ensure visual comfort in the face of a given environment. This could be achieved by entering Eq. (1) the horizontal illuminance value prescribed by the legislation for the environment in question and, for age, a representative value of those who use the above-mentioned space. A value of the representative index of visual comfort conditions would then be inserted and Eq. (1) would finally be resolved with reference to corneal illumination.
6. Conclusions
National regulations and international standards that clearly define the lighting requirements provide adequate illuminance of public places (where particular visual tasks are performed). These needs are linked to visual comfort to guarantee occupants who must work comfortably, efficiently and safely. All this involves energy consumption proportional to the lighting to be guaranteed. In recent decades, light source technology has undergone significant improvements. This has allowed us to proportionally increase the regulatory requirements, especially regarding the values of horizontal illuminance on the work surface. It provided better lighting while consuming less energy. This was possible especially thanks to the improvement of the luminous efficiency of the new lamps. It is fair to ask two questions; the first one is whether to obtain comfort conditions; in other words, it is necessary to guarantee higher horizontal illuminance levels. The second one is if it is possible to mitigate this value, considering that vision is also influenced by other contributions such as corneal illuminance relative to vertical cylindrical illumination around the area where your visual task takes place. To this end, an experimental verification was prepared in two libraries (in Italy and in Spain) on a sample of students who volunteered for this study by completing a field survey while the lighting values were monitored on the site.
An index called Predicted Visual Comfort Index PVCI was derived statistically from the data collected by the field surveys and from the simultaneous measurements carried out. This allows us to predict the visual comfort: corneal illuminance, horizontal illuminance and the age of the respondents. These parameters were determined by the analysis carried out via evaluating the Variance Inflation Factor and Best Subsets Analysis. The determined index thus allows evaluating the visual comfort expressed on a scale of 5 values (-2 ÷ + 2), where positive and negative values identify comfort and visual discomfort, respectively. This index allows us to predict or verify adequate lighting conditions of the environment, but also to calibrate the luminous flux to obtain ideal conditions for the occupants with the possibility of minimizing energy consumption for this purpose.
This preliminary study can be refined in the future by extending the sample of interviewees. The implemented methodology thus also can be used in other workplaces. This can be done with different visual tasks, to try to understand how to obtain visual comfort according to the needs of the different visual tasks. Furthermore, the application of the index opens up a debate on the parameters of lighting engineering which will take the technical regulations into consideration in order to obtain visual comfort in the rooms.
Acknowledgements
This research received no specific grant from any funding agency in the public, commercial, or not-for-profit sectors. Iacopo Golasi thanks the Sapienza University for the contribution provided with its research grant entitled “Activities related to the design and construction of new high-efficiency plant systems for all the buildings of the Sapienza building stock - New external artistic lighting for prestigious buildings of the University". All the authors thank the staff of the General Library of the Faculty of Economics E. Barone by Sapienza of Rome and of the library of the “Escuela Técnica Superior de Ingeniería de Caminos, Canales y Puertos” of the University of Granada (UGR).
Contributions
The authors have contributed equally to the realization of this research.
References
- C. Cuttle, Towards the third stage of the lighting profession, Lighting Research & Technology 42 (2010) 73–93. https://doi.org/10.1177/1477153509104013
- European Committee for Standardization, EN 12464-1 Light and lighting - Lighting of work places - Part 1: Indoor work places, 2011.
- C. Cuttle, A new direction for general lighting practice, Lighting Research & Technology 45 (2013) 22–39. https://doi.org/10.1177/1477153512469201
- I. Acosta, R. Leslie, M. Figueiro, Analysis of circadian stimulus allowed by daylighting in hospital rooms, Lighting Research & Technology 49 (2017) 49–61. https://doi.org/10.1177/1477153515592948
- A. S. Patel, Spatial Resolution by the Human Visual System The Effect of Mean Retinal Illuminance, Journal of the Optical Society of America 56 (1966) 689–694. https://doi.org/10.1364/josa.56.000689
- International Commission on Illumination (CIE), CIE 218 Research Roadmap for Healthful Interior Lighting Applications, 2016.
- Q. Dai, W. Cai, W. Shi, L. Hao, M. Wei, A proposed lighting-design space: circadian effect versus visual illuminance, Building and Environment 122 (2017) 287–293. https://doi.org/10.1016/j.buildenv.2017.06.025
- M. Rea, M. Figueiro, Light as a circadian stimulus for architectural lighting, Lighting Research & Technology 50 (2018) 497-510. https://doi.org/10.1177/1477153516682368
- C.R. Young, G.E. Jones, M.G. Figueiro, S.E. Soutière, M.W. Keller, A.M. Richardson, B.J. Lehmann, M.S. Rea, At-Sea Trial of 24-h-Based Submarine Watchstanding Schedules with High and Low Correlated Color Temperature Light Sources, Journal of Biological Rhythms 30 (2015) 144–154. https://doi.org/10.1177/0748730415575432
- M. Figueiro, M. Rea, Office lighting and personal light exposures in two seasons: Impact on sleep and mood, Lighting Research & Technology 48 (2016) 352–364. https://doi.org/10.1177/1477153514564098
- W. Cai, J. Yue, Q. Dai, L. Hao, Y. Lin, W. Shi, Y. Huang, M. Wei, The impact of room surface reflectance on corneal illuminance and rule-of-thumb equations for circadian lighting design, Building and Environment 141 (2018) 288–297. https://doi.org/10.1016/j.buildenv.2018.05.056
- M. Knoop, K. Broszio, A. Diakite, C. Liedtke, M. Niedling, I. Rothert, F. Rudawski, N. Weber, Methods to Describe and Measure Lighting Conditions in Experiments on Non-Image-Forming Aspects, LEUKOS 15 (2019) 163–179. https://doi.org/10.1080/15502724.2018.1518716
- F. Nardecchia, M. Barbalace, F. Bisegna, C. Burattini, F. Gugliermetti, A. de L. Vollaro, F. Salata, I. Golasi, A method to evaluate the stimulation of a real world field of view by means of a spectroradiometric analysis, Sustainability 7 (2015) 14964–14981. https://doi.org/10.3390/su71114964
- F. Salata, I. Golasi, G. Falanga, M. Allegri, E. de Lieto Vollaro, F. Nardecchia, F. Pagliaro, F. Gugliermetti, and A. Vollaro, Maintenance and Energy Optimization of Lighting Systems for the Improvement of Historic Buildings: A Case Study, Sustainability 7 (2015) 10770-10788. https://doi.org/10.3390/su70810770
- F. Salata, A. De Lieto Vollaro, A. Ferraro, An economic perspective on the reliability of lighting systems in building with highly efficient energy: A case study, Energy Conversion and Management 84 (2014) 623–632. https://doi.org/10.1016/j.enconman.2014.04.063
- I. Golasi, F. Salata, E. de L. Vollaro, A. Peña-García, Influence of lighting colour temperature on indoor thermal perception: A strategy to save energy from the HVAC installations, Energy and Buildings 185 (2019) 112–122. https://doi.org/10.1016/j.enbuild.2018.12.026
- F. Salata, I. Golasi, M. di Salvatore, A. de Lieto Vollaro, Energy and reliability optimization of a system that combines daylighting and artificial sources. A case study carried out in academic buildings, Applied Energy 169 (2016) 250–266. https://doi.org/10.1016/j.apenergy.2016.02.022
- J. Miles, Tolerance and Variance Inflation Factor, Wiley StatsRef Stat. Ref. Online, John Wiley & Sons, Ltd, Chichester, UK, 2014. https://doi.org/10.1002/9781118445112.stat06593
- D.W. Hosmer, B. Jovanovic, S. Lemeshow, Best Subsets Logistic Regression, Biometrics 45 (1989) 1265. https://doi.org/10.2307/2531779
- K. Takezawa, Learning Regression Analysis by Simulation, Springer Japan, Tokyo, 2014. https://doi.org/10.1007/978-4-431-54321-3
Copyright © 2019 The Author(s). Published by solarlits.com.

1580
Total views
Citations
SHARE ON


