Volume 6 Issue 2 > pp. 176-186 • doi: 10.15627/jd.2019.16
Design of a Multi-Surface Solar Concentrator
Fangzhou Liu, Hongfei Zheng, Rihui Jin, Xinglong Ma*
Author affiliations
School of Mechanical Engineering, Beijing Institute of Technology, Beijing 100081, China
* Corresponding author. Tel.: +86-010-68912510
594190681@qq.com (F. Liu)
hongfeizh@bit.edu.cn (H. Zheng)
2808922112@qq.com (R. Jin)
baalxmxl@yeah.net (X. Ma)
History: Received 11 November 2019 | Revised 16 December 2019 | Accepted 18 December 2019 | Published online 21 December 2019
Copyright: © 2019 The Author(s). Published by solarlits.com. This is an open access article under the CC BY license (http://creativecommons.org/licenses/by/4.0/).
Citation: Fangzhou Liu, Hongfei Zheng, Rihui Jin, Xinglong Ma, Design of a Multi-Surface Solar Concentrator, Journal of Daylighting 6 (2019) 176-186. http://dx.doi.org/10.15627/jd.2019.16
Figures and tables
Abstract
A multi-surface solar concentrator is proposed in this study. The concentrator is designed by improving the light receiving rate of a parabola when the incident angle changes within 0°~20° by adding involute, shifting the involute up, and changing the shape of the parabolic top. The results show that adding involute can effectively avoid light escaping from the bottom, which improves the light receiving rate under large incident angle. The light receiving rate is improved by increasing the height of involute at incident angle of about 5°~15°. Changing the shape of the top of parabola apparently improves the light receiving rate under high incident angle. Finally, the concentrator was tested experimentally. The experimental efficiency of the concentrator at different incident angles was 0.426. The average light receiving rate of 0.868 was achieved through the optical simulation where different losses include the optical loss, such as the absorption and reflection of the glass cover, the absorption of reflectors, the heat loss, etc. Thus, the concentrator provides a stable and efficient energy source.
Keywords
Multi-surface, Solar concentrator, Paraboloid, Optical analysis
Nomenclature
r Radius of the circular receiver
θ Receiving half angle of CPC
φ Independent variable
f Focal length of the parabola
a Translation distance of the parabola
η1 Light receiving rate
Lreceive Number of rays collected by the receiver
Linlet Number of rays entering the concentrator
η1,average Average efficiency
η1,0° The light receiving rate at an incident angle of 0°
η1,5° The light receiving rate at an incident angle of 5°
η1,10° The light receiving rate at an incident angle of 10°
η1,15° The light receiving rate at an incident angle of 15°
η1,20° The light receiving rate at an incident angle of 20°
δ Solar incident angle
m Month
W Local latitude
η2 Experimental efficiency
cp Specific heat capacity of air
ΔT Air inlet and outlet temperature difference
ṁ Mass flow rate of the air
I Irradiance
S Receiving area of the concentrator
1. Introduction
As an inexhaustible and green new energy source, solar energy has attracted wide attention. However, solar energy also has the problem of low energy density. Therefore, high-concentration of solar energy is needed. At present, among the solar concentrators, the compound parabolic concentrator (CPC) has a good development prospect in the field of medium and low temperature because of its simple structure, no need to track, partial absorption of scattered light, and good concentrating effect. In order to expand the application space of CPC, scholars have done a series of research work on the structural optimization of the CPC. Hongfei Zheng et al. [1] evaluated the advantage of the miniature solid dCPC over common prismatic structures, and used a commercial software to compare the daylighting control performance between a dCPC rod and two common prismatic elements. Zehui Chang et al. [2] designed a new trough-type parabolic concentrator solar drying system to solve the problem that the surface of the material was easily hardened due to heat and hindered of the internal water evaporation. Moreover, the optical simulation software was used to calculate and analyze the influence mechanism of different incident angles on the optical efficiency and concentrating efficiency of the concentrator. According to the parametric equation, Dezhong Wu et al. [3] analyzed the influence of the interception ratio on the total arc length of CPC and the number of receiving tubes when the area was same. The results showed that the use of CPC camber materials could be effectively reduced when the interception ratio was from 0.15 to 0.25. Sainath A. Waghmare et al. [4] performed a ray tracing technique to minimize the optical loss in order to improve the performance of CPC. Miaomiao Yu et al. [5] proposed a compound parabolic trough photovoltaic concentrator, which calculated the light receiving rate and concentrating efficiency of receiver surface at different incident angles and installation positions of photovoltaic modules. Pian Hu et al. [6] used a Fresnel lens with a focal length of 1200 mm to achieve first-order concentrating, and used a total-reflection compound parabolic concentrator to achieve secondary concentrating. Finally they analyzed the influence of various parameters of CPC on the concentrating performance. Jifu Shi et al. [7] optimized the concentrator combining with compound paraboloid and involute, and produced a collector water tank, which could match with the concentrating system, and carried out the heat collecting performance test. Bellos et al. [8] designed a CPC with vacuum tube as the receiver, and comparative analysis showed that pressurized water was more suitable as the heat transfer working medium than the typical heat conduction oil. Jing Hou et al. [9] put forward a new type of composite parabolic concentrator that could be applied to solar power generation, and analyzed the influence of different incident angles on the receiving rate of solar cells. Naum Fraidenraich et al. [10] divided the concentrators with fully illuminated inverted V absorbers into two groups based on the relationship between the vertex angle of the absorber and the acceptant angles of cavity, and calculated the collectible energy for various receiver vertex angle and acceptance angle. I. Santos-Gonzalez et al. [11] based on a previous compound parabolic concentrator model developed its thermal and fluid-dynamic behavior. Xinglong Ma et al. [12] showed the combination on optical elements of multi-surface and multi-element solar concentrators, evaluated their advantages and disadvantages, and pointed out that the improvement on the structure of CPC-type solar concentrators could effectively enhanced theirs acceptance angle and energy distribution. Chigueru Tiba et al. [13] focused on the stationary low concentrators, and found the relationship between the different parameters, such as length and height of the reflector surface and the aperture, (L/A) and (H/A), and the lower average number of reflections. Manuel I. Gonzalez et al. [14] presented a CPC collector whose tubular receiver contained the sorption bed and where only a portion of receiver was exposed to sunlight. Chia-Wei Kuo et al. [15] adjusted the vertical position of the receiver to overcome the major limits of a traditional CPC, including a rapid increase in height for a larger aperture width and a low concentration ratio. Meng Tian et al. [16] presented a comprehensive review of the recent research progress on CPC, and the concentrators had been classified according to the structures and applications. The above studies optimized the structure of CPC and explored its thermal performance, but paid little attention to the design of vacuum tube composite parabolic collector. In addition, there are few studies focus on the further optimization of paraboloid-involute collector and the influence of CPC tip structure optimization on CPC optical efficiency.
Based on the CPC design principle, this paper proposes an optimized multi-surface, which is composed of parabola, involute, and straight line. The parabolic concentrator is taken as the prototype, which is continuously optimized according to the design requirements. The optical analysis software Lighttools® is used to calculate and analyze the light receiving rate of the concentrator at different incident angles to obtain the final three-dimensional model. Finally, a compound parabolic concentrator test bed is built, and its experimental efficiency is tested.
2. MSC structure design
2.1. Design target and criteria
In winter, the solar irradiance on the surface of the earth is relatively small, and the solar altitude angle is low, which leads to the temperature obtained by using the flat plate collector is about 50°C~70°C. To get a higher temperature, it needs to use a concentrator with a large solar altitude angle, high light receiving rate, and moderate size based on the existing concentrator. This concentrator should satisfy the following conditions:
- The outer diameter of the glass tube is 110 mm, which is the standard diameter on the market. Therefore, it is very convenient to purchase the glass tube of this size, which is very helpful to save the cost. The thickness of the glass tube is 2.8 mm. The diameter of the internally mountable receiver is 100 mm;
- The geometric concentration ratio should be more than 2 times, so the width of the light inlet should bigger than 628 mm, and set the maximum width of the light inlet to 700 mm during the calculation;
- To make the installation of the concentrator easier and reduce the occupied space, the lower the height of concentrator, the better is the performance;
- The solar acceptance angle of this concentrator is around ±20°. For Beijing, the solar altitude angle for the autumn equinox is 50°, and that for the winter solstice is 26.5°, with a range of ±11.75°, so the concentrator meets the condition of no tracking in winter.
2.2. Selection of parabolic equation
The final model should meet the above conditions as far as possible. During the design process, the choice of geometric equations for parabola and involute should be given important, which is the core step in the design and optimization of the entire concentrator. Considering that when the parallel light illuminates the parabolic reflector vertically, the light is converged at the focus of the parabola. Therefore, a parabola is cut at its apex, and the formed two parabolas are translated away from each other. The line connecting the apexes is the x-axis, and the axis of symmetry of the two parabolas is the y-axis. The coordinate system shown in Fig. 1 is established. In Fig. 1, the involute parametric equation can be expressed as:
where 0≤φ≤π/2+θ and θ is the receiving half angle of the CPC.
Figure 1
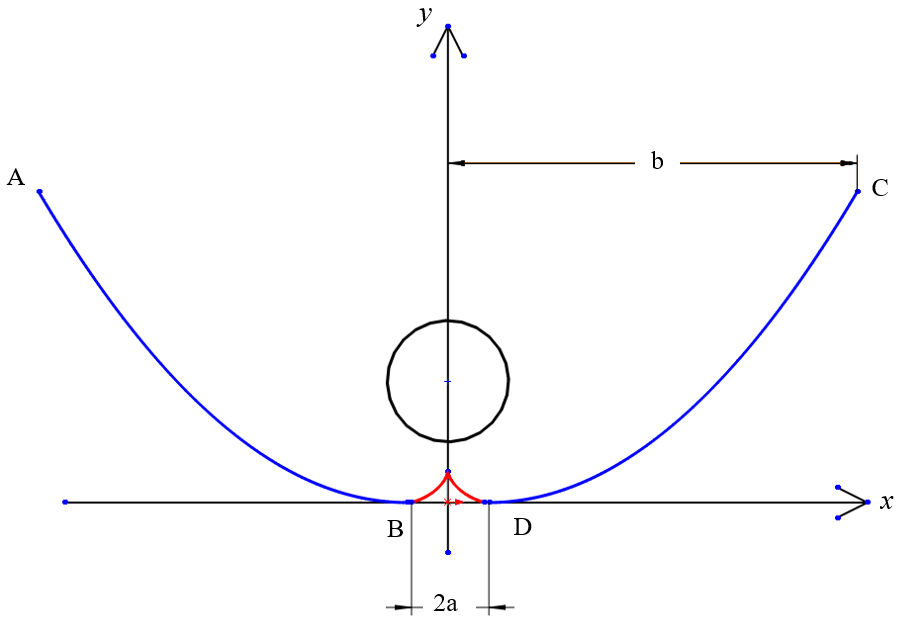
Fig. 1. Structure diagram of compound parabolic concentrator.
Point B and point D are the apexes of the parabola AB and CD respectively, and the length of BD equals to 2a. In order to ensure that the focus of parabola should be located in the mountable receiver in the glass tube, the width of the outlet must be less than the diameter of the receiver, otherwise most of the light will not be reflected on the glass tube, so 2a≤100 mm. Besides that, limited by the width of the light inlet: 2b≤700 mm. Take the parabola on the right as an example, its geometric equation should be:
where f is the focal length of the parabola, and a is the translation distance of the parabola. Considering the limitation of height and width of light inlet, set the upper limit of y-coordinates of point C as 300 mm, therefore:
therefore,
Due to the limitation of light inlet width, the maximum value of xc is 350 mm, so the value range of f is f>75 mm. Next use software LightTools to simulate the trace of light at the incident angles of 0°, 5°, 10°, 15°, 20° at f=75, 80, 85, 90 mm and a=20, 30, 40, 50 mm. During the process of modeling, the value of x should range in ±(a~350) mm, and the diameter of the receiver is set to 100 mm, which equals to the diameter of the receiver in the glass tube.
The installation position diagram of glass tube and receiver of the model are shown in Fig. 2, was established. Because the diameter of the receiver is 100 mm, which is quite large, the height of receiver was not changed during the optical simulation. The outer diameter and the thickness of the glass tube are 110 mm and 2.8 mm respectively, and the lower end of the glass tube is tangent to the lower end of the receiver. After the calculation, the height of the center of the glass tube is 102.2 mm. As shown in Fig. 2, the black circle is the external contour of the receiver, the red circle is the outer outline of the glass tube, and the blue circle is the inner outline of the glass tube, which is tangent to the black one.
Figure 2

Fig. 2. Schematic diagram of glass tube and receiver installation position
After the optical simulation, the curves of the concentrators' light receiving rate change with the incident angles under different parameters are shown in Fig. 3. Light receiving rate (η1) can be calculated by the following equation:
where Lreceive is the number of rays collected by the receiver, and Linlet is the number of rays entering the concentrator.
Figure 3

Fig. 3. Showing curves of the concentrators' light receiving rate with the incident angles for (a) f=75 mm, (b) 80 mm, (c) 85 mm, and (d) 90 mm.
where η1,0°, η1,5°, η1,10°, η1,15°, η1,20° represent the light receiving rate at an incident angle of 0°, 5°, 10°, 15° and 20°, respectively.
According to the average efficiency, five models with higher average efficiency were selected from the 16 models, and the curves of the light receiving rate change with the incident angles of them were shown in Fig. 4.
Figure 4
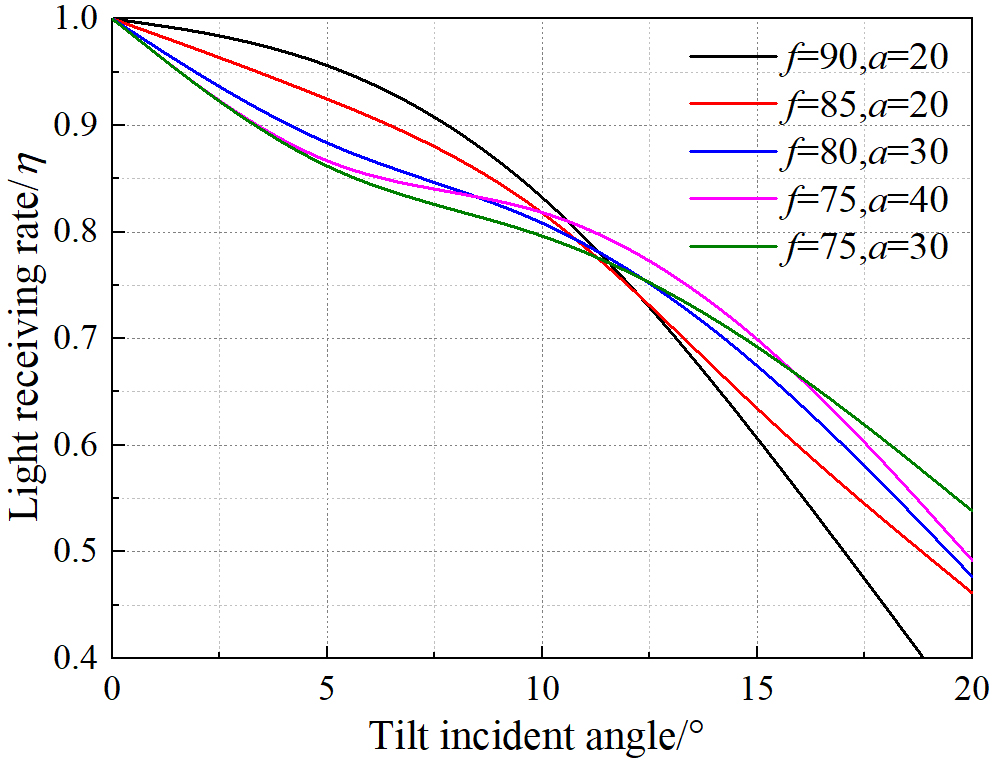
Fig. 4. The curves of light receiving rate with incident angles of the five models.
In the above five models, three models were selected for the next optimization, and the selected model should have the following conditions:
- Have a higher average efficiency;
- Have a higher light receiving rate than other models at low incident angles or high incident angles.
Considering the above two points, finally select f=80 and a=30, f=90 and a=20, and f=75 and a=30 models for the next optimization. The reasons are as follows: f=80 and a=30 model has a good light receiving rate at each incident angles of 0°~20°; f=90 and a=20 model has the highest light receiving rate at low incident angles; f=75 and a=30 model has the highest average efficiency and highest light receiving rate at high incident angles.
3. MSC structure optimization
3.1. First optimization-add involute
For convenience of description, f=80 and a=30, f=90 and a=20 and f=75 and a=30 models are recorded as Model1, Model2 and Model3, respectively, and the Model1 before the first optimization is recorded as Model1-Base, and the Model1 after the first optimization is recorded as Model1-Revised1. Take Model1 as an example, during the simulation, it is found that when the incident angle is large, a small amount of light escapes from the gap between the apexes of the parabolas on both sides, and some rays have no reflection surface at the lower part of the receiver, which leads to them directly reflected to the opposite parabola and reflected out. The ray tracing pattern of the Model1-Base at a incident angle of 20° is shown in Fig. 5.
Figure 5
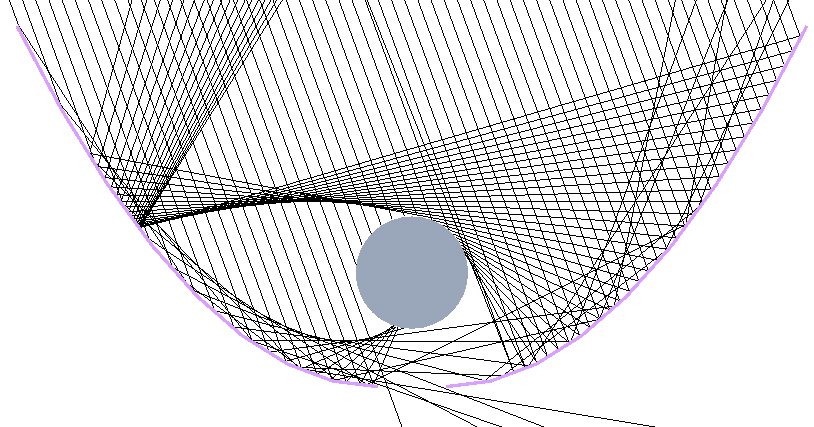
Fig. 5. Ray tracing pattern of Model1-Base at an incident angle of 20°.
According to the involute property of the circle, the normal of any point on the involute is tangent to the base circle of the involute. If the involute is the reflection surface, the incident light which illuminate the involute surface can be reflected to the base circle. Therefore, consider establishing an involute at the bottom of the receiver for the first optimization. Take the Model1 as an example, the involute is constructed with the diameter of base circle equals to 100 mm, and the involute intersects the vertex of the parabola. Take the right section of parabola as an example, its equation is y=(x-30)2/320, the equation of involute is x=50×(sin(t)-t×cos(t)), y=75.78-50×(cos(t)+t×sin(t)), where t is the independent variable, here 0t<1.2873, which means the involute starts at t=0 x=0 y=25.78 and ends at t=1.2873 x=30 y=0. Among them, “75.78” influences the height of the involute, “1.2873” influences the end position of the involute, these two numbers have different values for different models because the “a” (the x-coordinate of the vertex of parabola) is different. The optimized three-dimensional model is shown in Fig. 6. When the incident angle is 20°, the ray tracing pattern of the Model1-Revised1 is shown in Fig. 7.
Figure 6
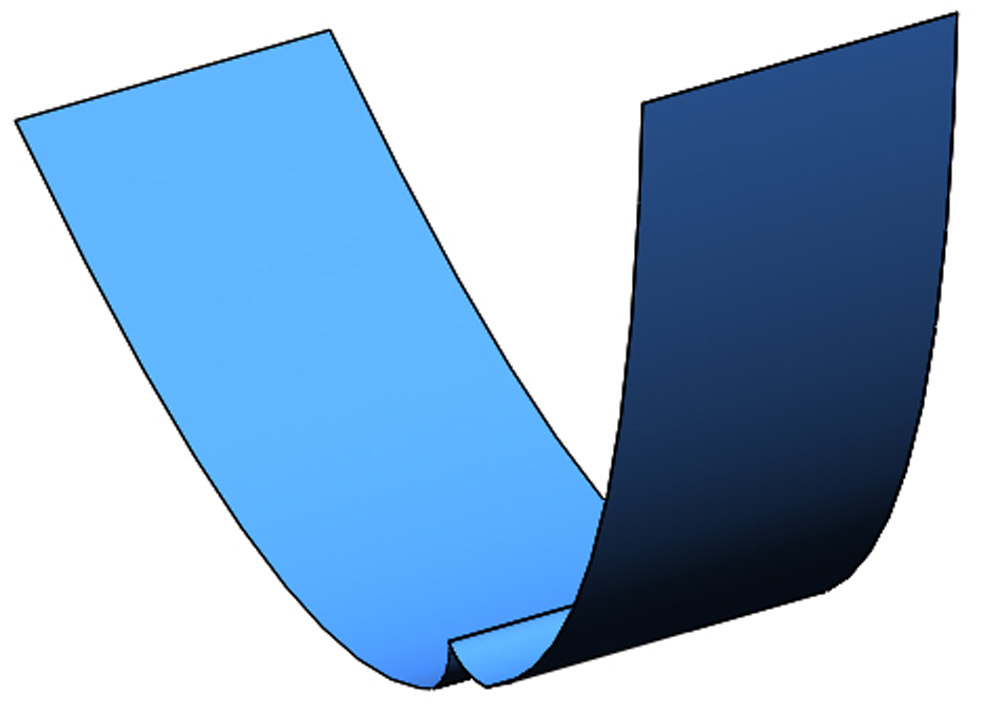
Fig. 6. 3D model of Model1-Revised1.
Figure 7
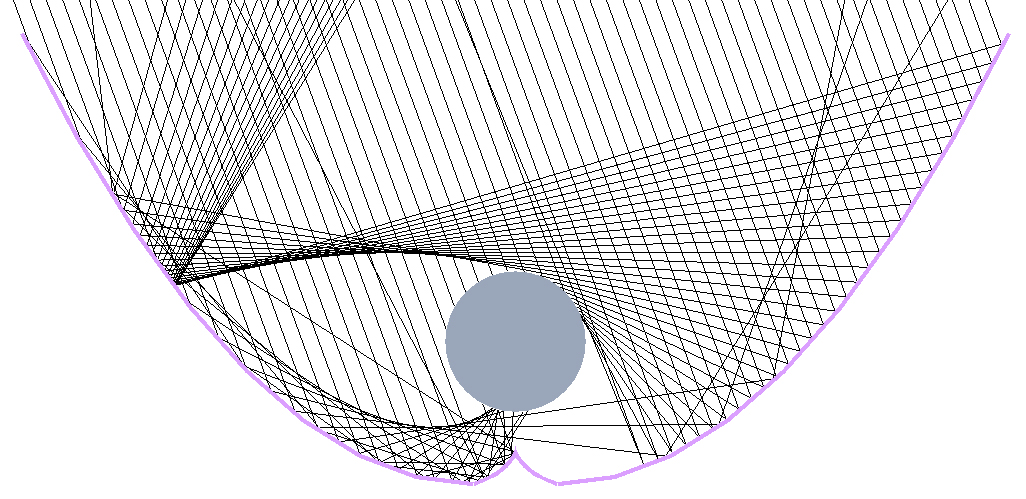
Fig. 7. Ray tracing pattern of Model1-Revised1 at an incident angle of 20°.
By comparing Figs. 6 and 7, it can be seen that the addition of involute is very effective in preventing the ray from escaping from the gap, and effectively reducing the number of emitted ray after the secondary reflection of the parabola. The three models’ light receiving rate change with incident angles before and after the first optimization are compared, which was shown in Fig. 8. According to Fig. 8, the first optimization effectively improved the light receiving rate of the models in the range of incident angles from 5° to 20°. It can be seen that adding involute can effectively improve the light receiving rate at high incident angles.
Figure 8

Fig. 8. Comparison of (a) Model1-Revised1and Model1-Base, (b) Model2-Revised1and Model2-Base, (c) Model3-Revised1and Model3-Base.
3.2. Second optimization-raise the height of the involute
The first optimization is very effective in improving the light receiving rate of the prototype at high incident angles, but when the incident angle is 10°, some of the light is directly reflected out by the involute reflection. Therefore, try to raise the height of involute to improve this situation. However, because the surrounding structure of the glass tube should be as stable and firm as possible when the concentrator is assembled, the position of the involute after lifting should keep a certain distance from the bottom of the glass tube. Take the Model1-Revised1 as an example, the involute established in the first optimization was shifted upward to make its center height of circle equal to 80 mm, and the involute intersected with the parabola. After the second optimization, take the right involute for example, the equation changed from 0<t<1.2873 x=50×(sin(t)-t×cos(t)) y=75.78-50×(cos(t)+t×sin(t)) to 0<t<1.5931 x=50×(sin(t)-t×cos(t)) y=80-50×(cos(t)+t×sin(t)), the difference between the two involutes is reflected in the change of ordinate(75.78 to 80) and end point(1.2873 to 1.5931), but the shapes of these two involutes are the same. When the incident angle is 10°, the optical simulation results of the Model1-Revised2 are compared with the simulation results of the Model1-Revised1. As shown in Fig. 9, it is obvious that the second step optimization has effectively improved the light scattering situation at 10°. The light receiving rate with incident angles before and after the secondary optimization of the three models are compared, which was shown in Fig. 10. According to the Fig. 10, it can be found that the light receiving rate within the incident angle of 5°~15° has been significantly improved. Thus, it can be seen that the light receiving rate in the range of incident angles of 5°~15° can be effectively improved by appropriately raising the height of the involute.
Figure 9
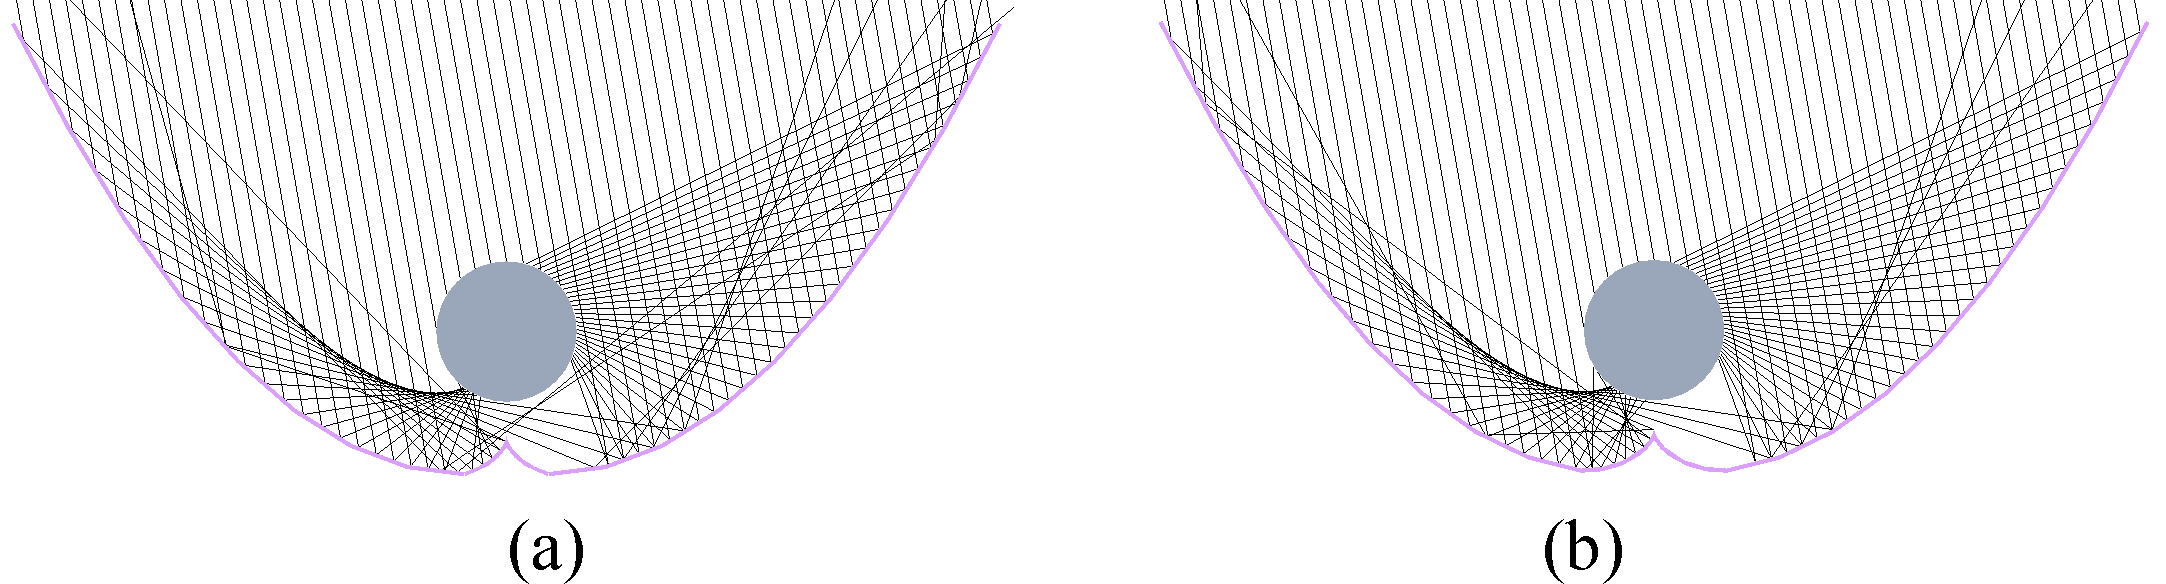
Fig. 9. Comparison of ray tracing pattern between (a) Model1-Revised1 and (b) Model1-Revised2 at an incident angle of 10°.
Figure 10
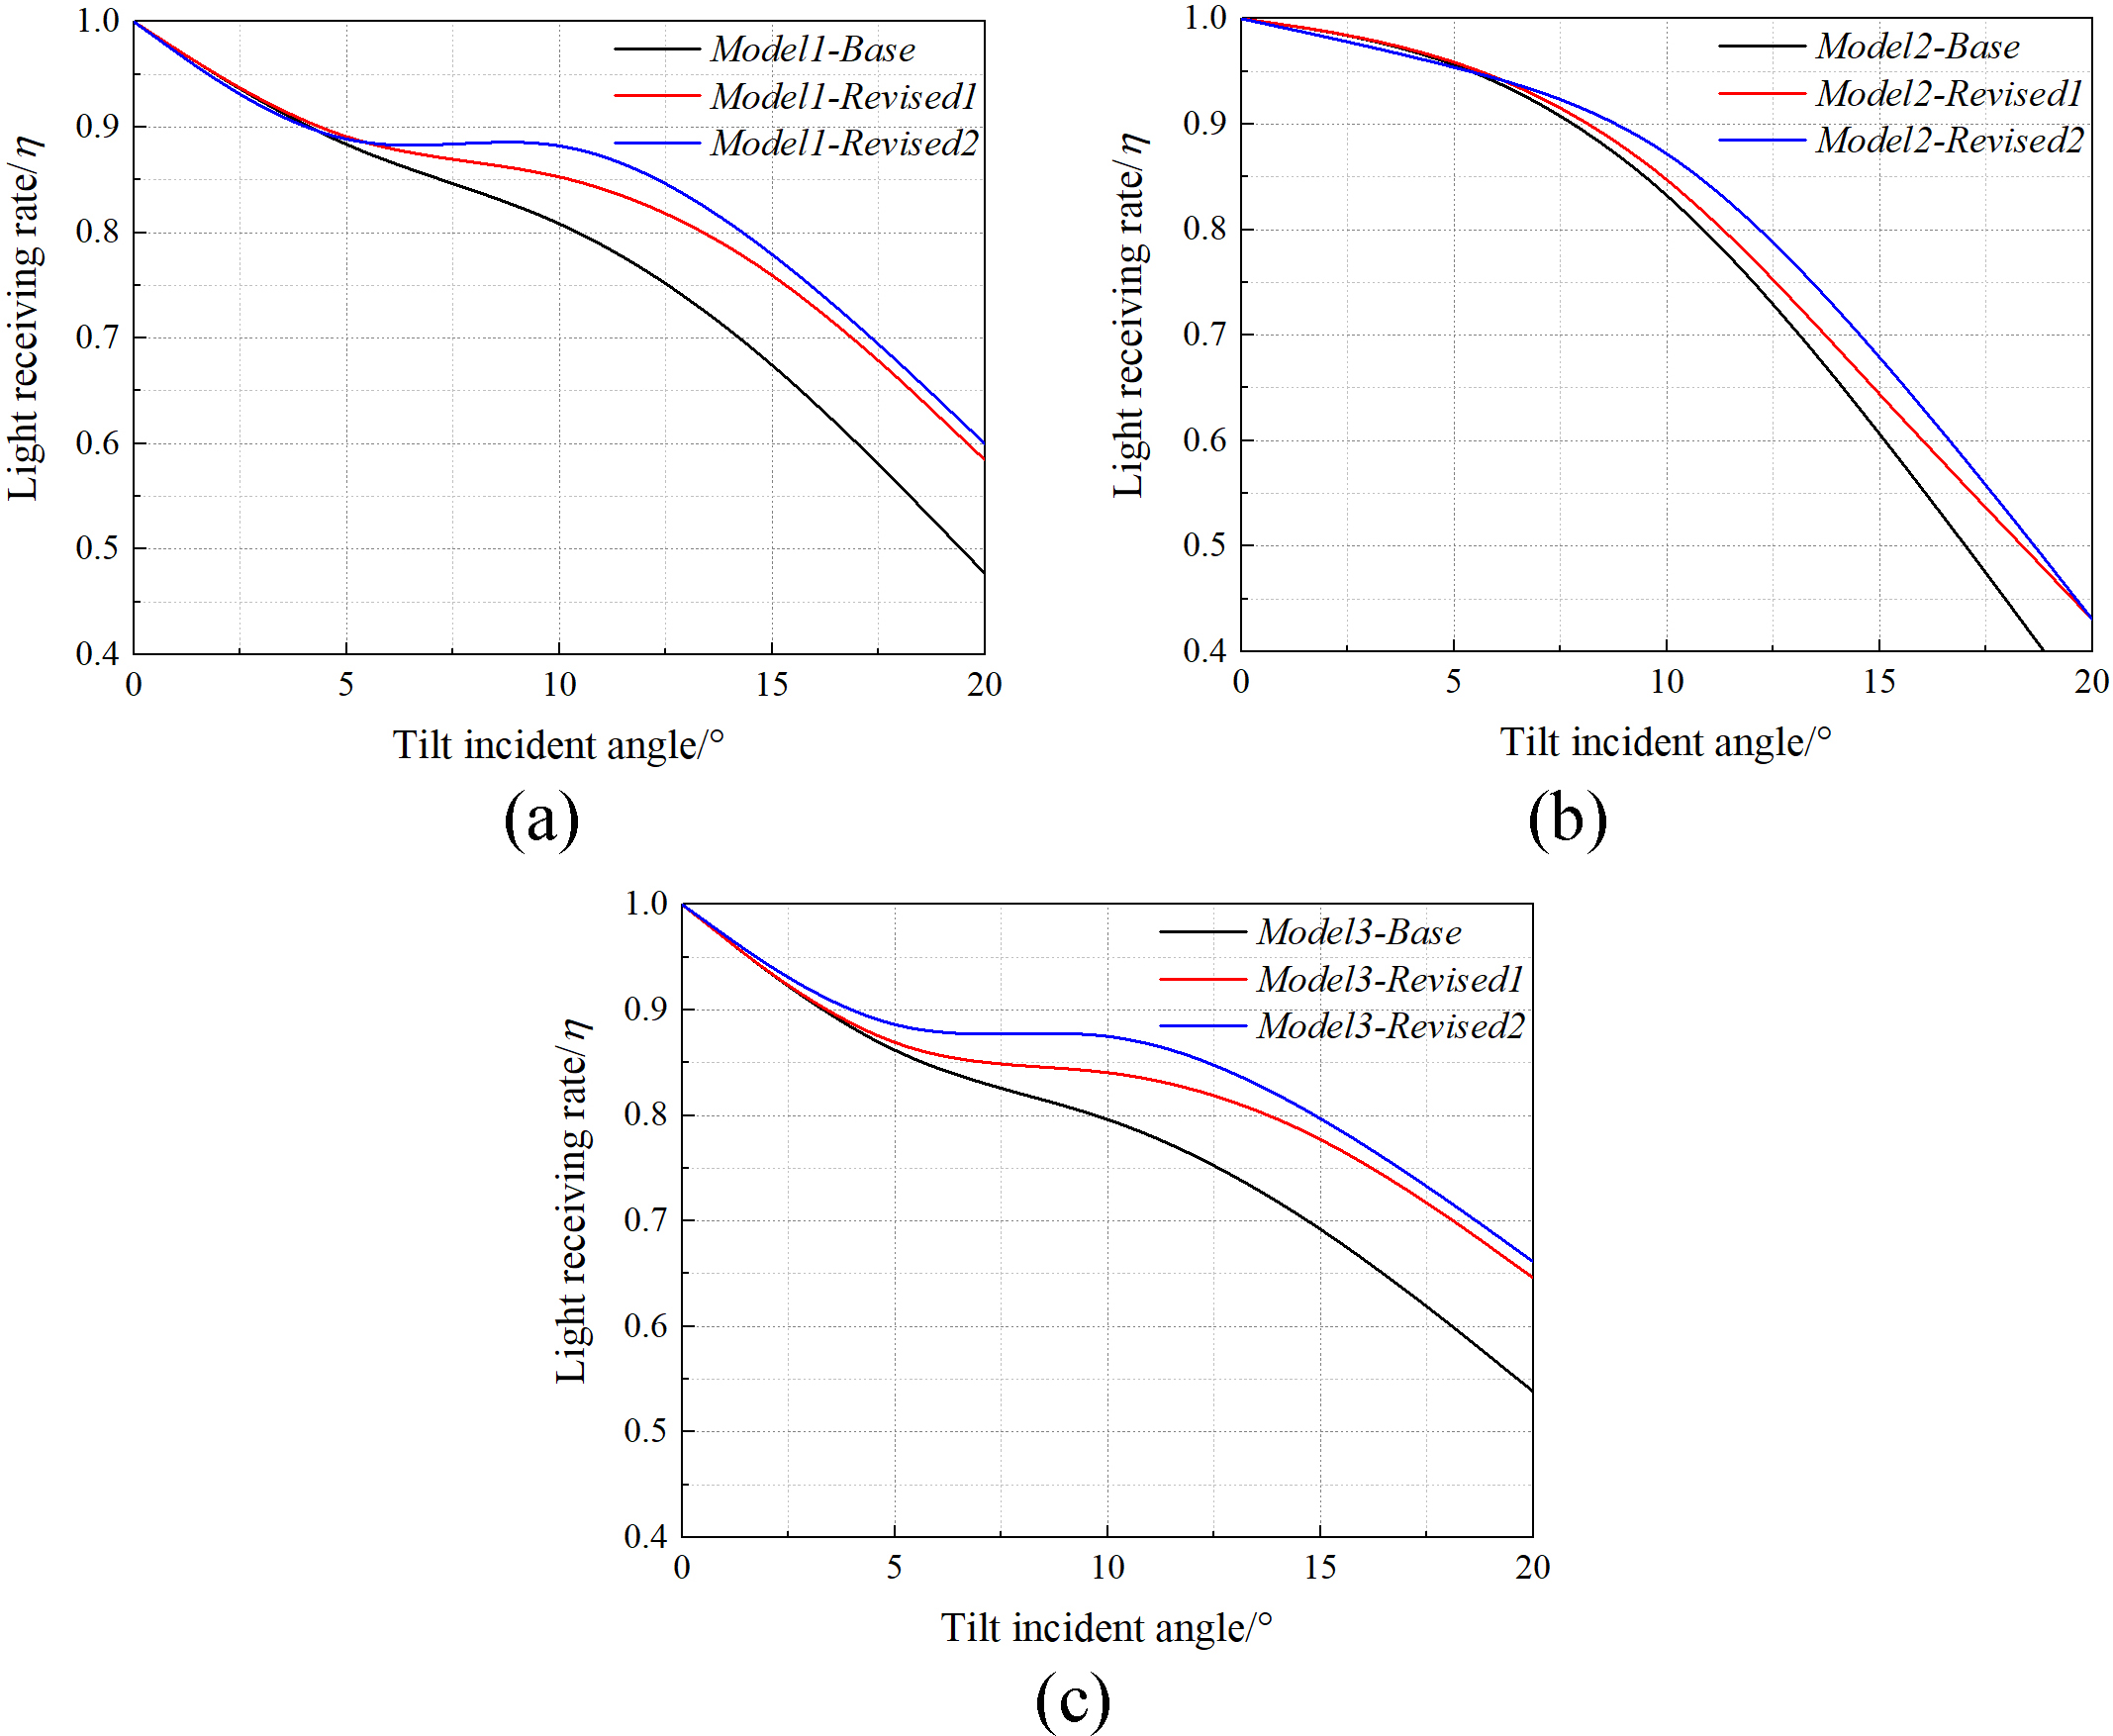
Fig. 10. Comparison of (a) Model1-Revised2 and Model1-Revised1, (b) Model2-Revised2 and Model2-Revised1, and (c) Model3-Revised2 and Model3-Revised1.
3.3. Third optimization-change the shape of the top of the parabola
The ray tracing pattern of Model1-Revised2 at a incident angle of 20° is shown in Fig. 11. It is found that some light cannot be received by the receiver after reflected from the upper end of the parabola.
Figure 11
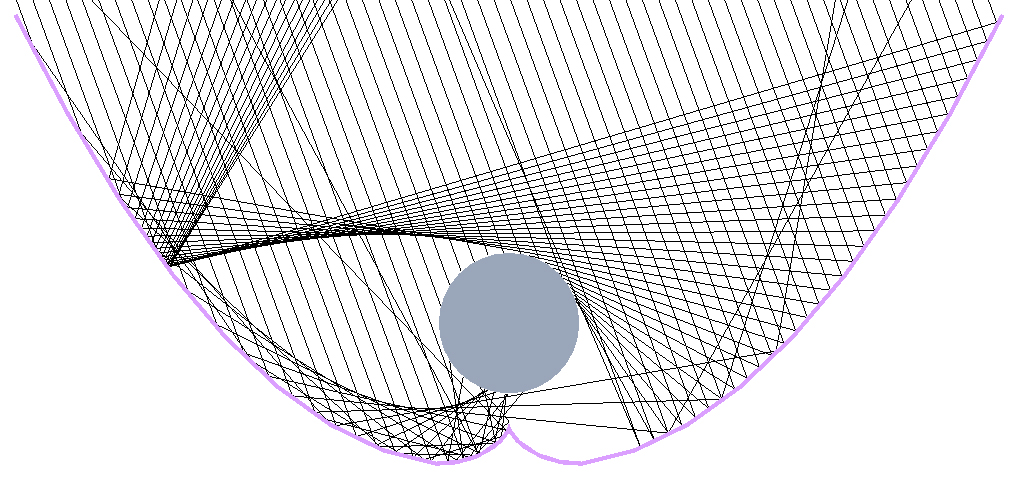
Fig. 11. Ray tracing pattern of Model1-Revised2 at an incident angle of 20°.
In this condition, if an angle can be deflected inward at the upper end of the parabola, the light can be irradiated on the upper surface of the receiver. However, if the deflected angle is too large or the deflected length is too long, the light receiving rate at low incident angles can be seriously decreased. Considering that the overall structure of the concentrator should be as easy to process as possible, select the tangent of the parabola at x=290 mm and rotate the tangent to the inside of the parabola by 10°. Considering the height and width of the parabola, the tangent is cut off to x= 340 mm. Take the right side of Model1-Revised2 as an example, the equation of parabola is y=(x-30)2/320, y’=(x-30)/160, when x=290 mm, y=211.25 mm, y’=tanα=1.625, α is the angle between the tangent and the x-axis, tan(α+10°)=2.525, then the equation of the line after the deflection is y-211.25=2.525×(x-290), when x=340 mm, y=337.5 mm. It seems like that the upper parabolic reflector was replaced by a plane reflector. The 3D model of Model1-Revised3 is shown in Fig. 12, and the ray tracing pattern of Model1-Revised3 at an incident angle of 20° is shown in Fig. 13. It can be seen from the Fig. 13 that, with a high incident angle, bending the upper end of the parabola inward can make a lot of light rays directly shine on the upper surface of the receiver and greatly improve the light receiving rate of the concentrator. The light receiving rate change with incident angles before and after the third optimization of the three models are compared, which was shown in Fig. 14. As can be seen from Fig. 14, although bending the tangent inward at the upper end of the parabola could slightly reduce the light receiving rate at low incident angles, it significantly increased the light receiving rate at 15°~20°, so this method is feasible.
Figure 12
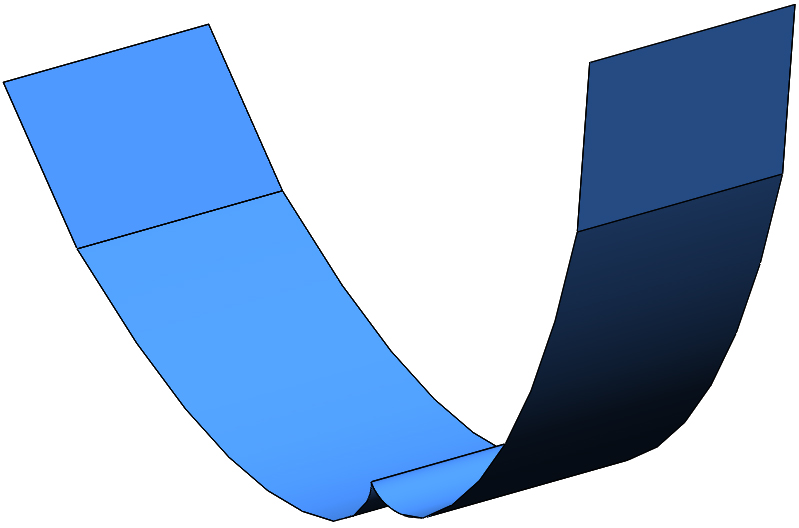
Fig. 12. 3D model of Model1-Revised3.
Figure 13
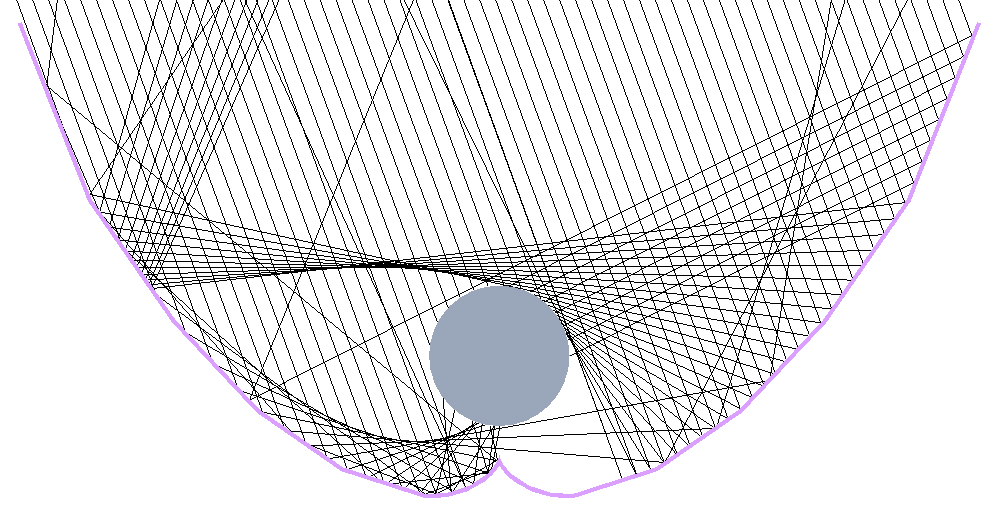
Fig. 13. Ray tracing pattern of Model1-Revised3 at an incident angle of 20°.
Figure 14
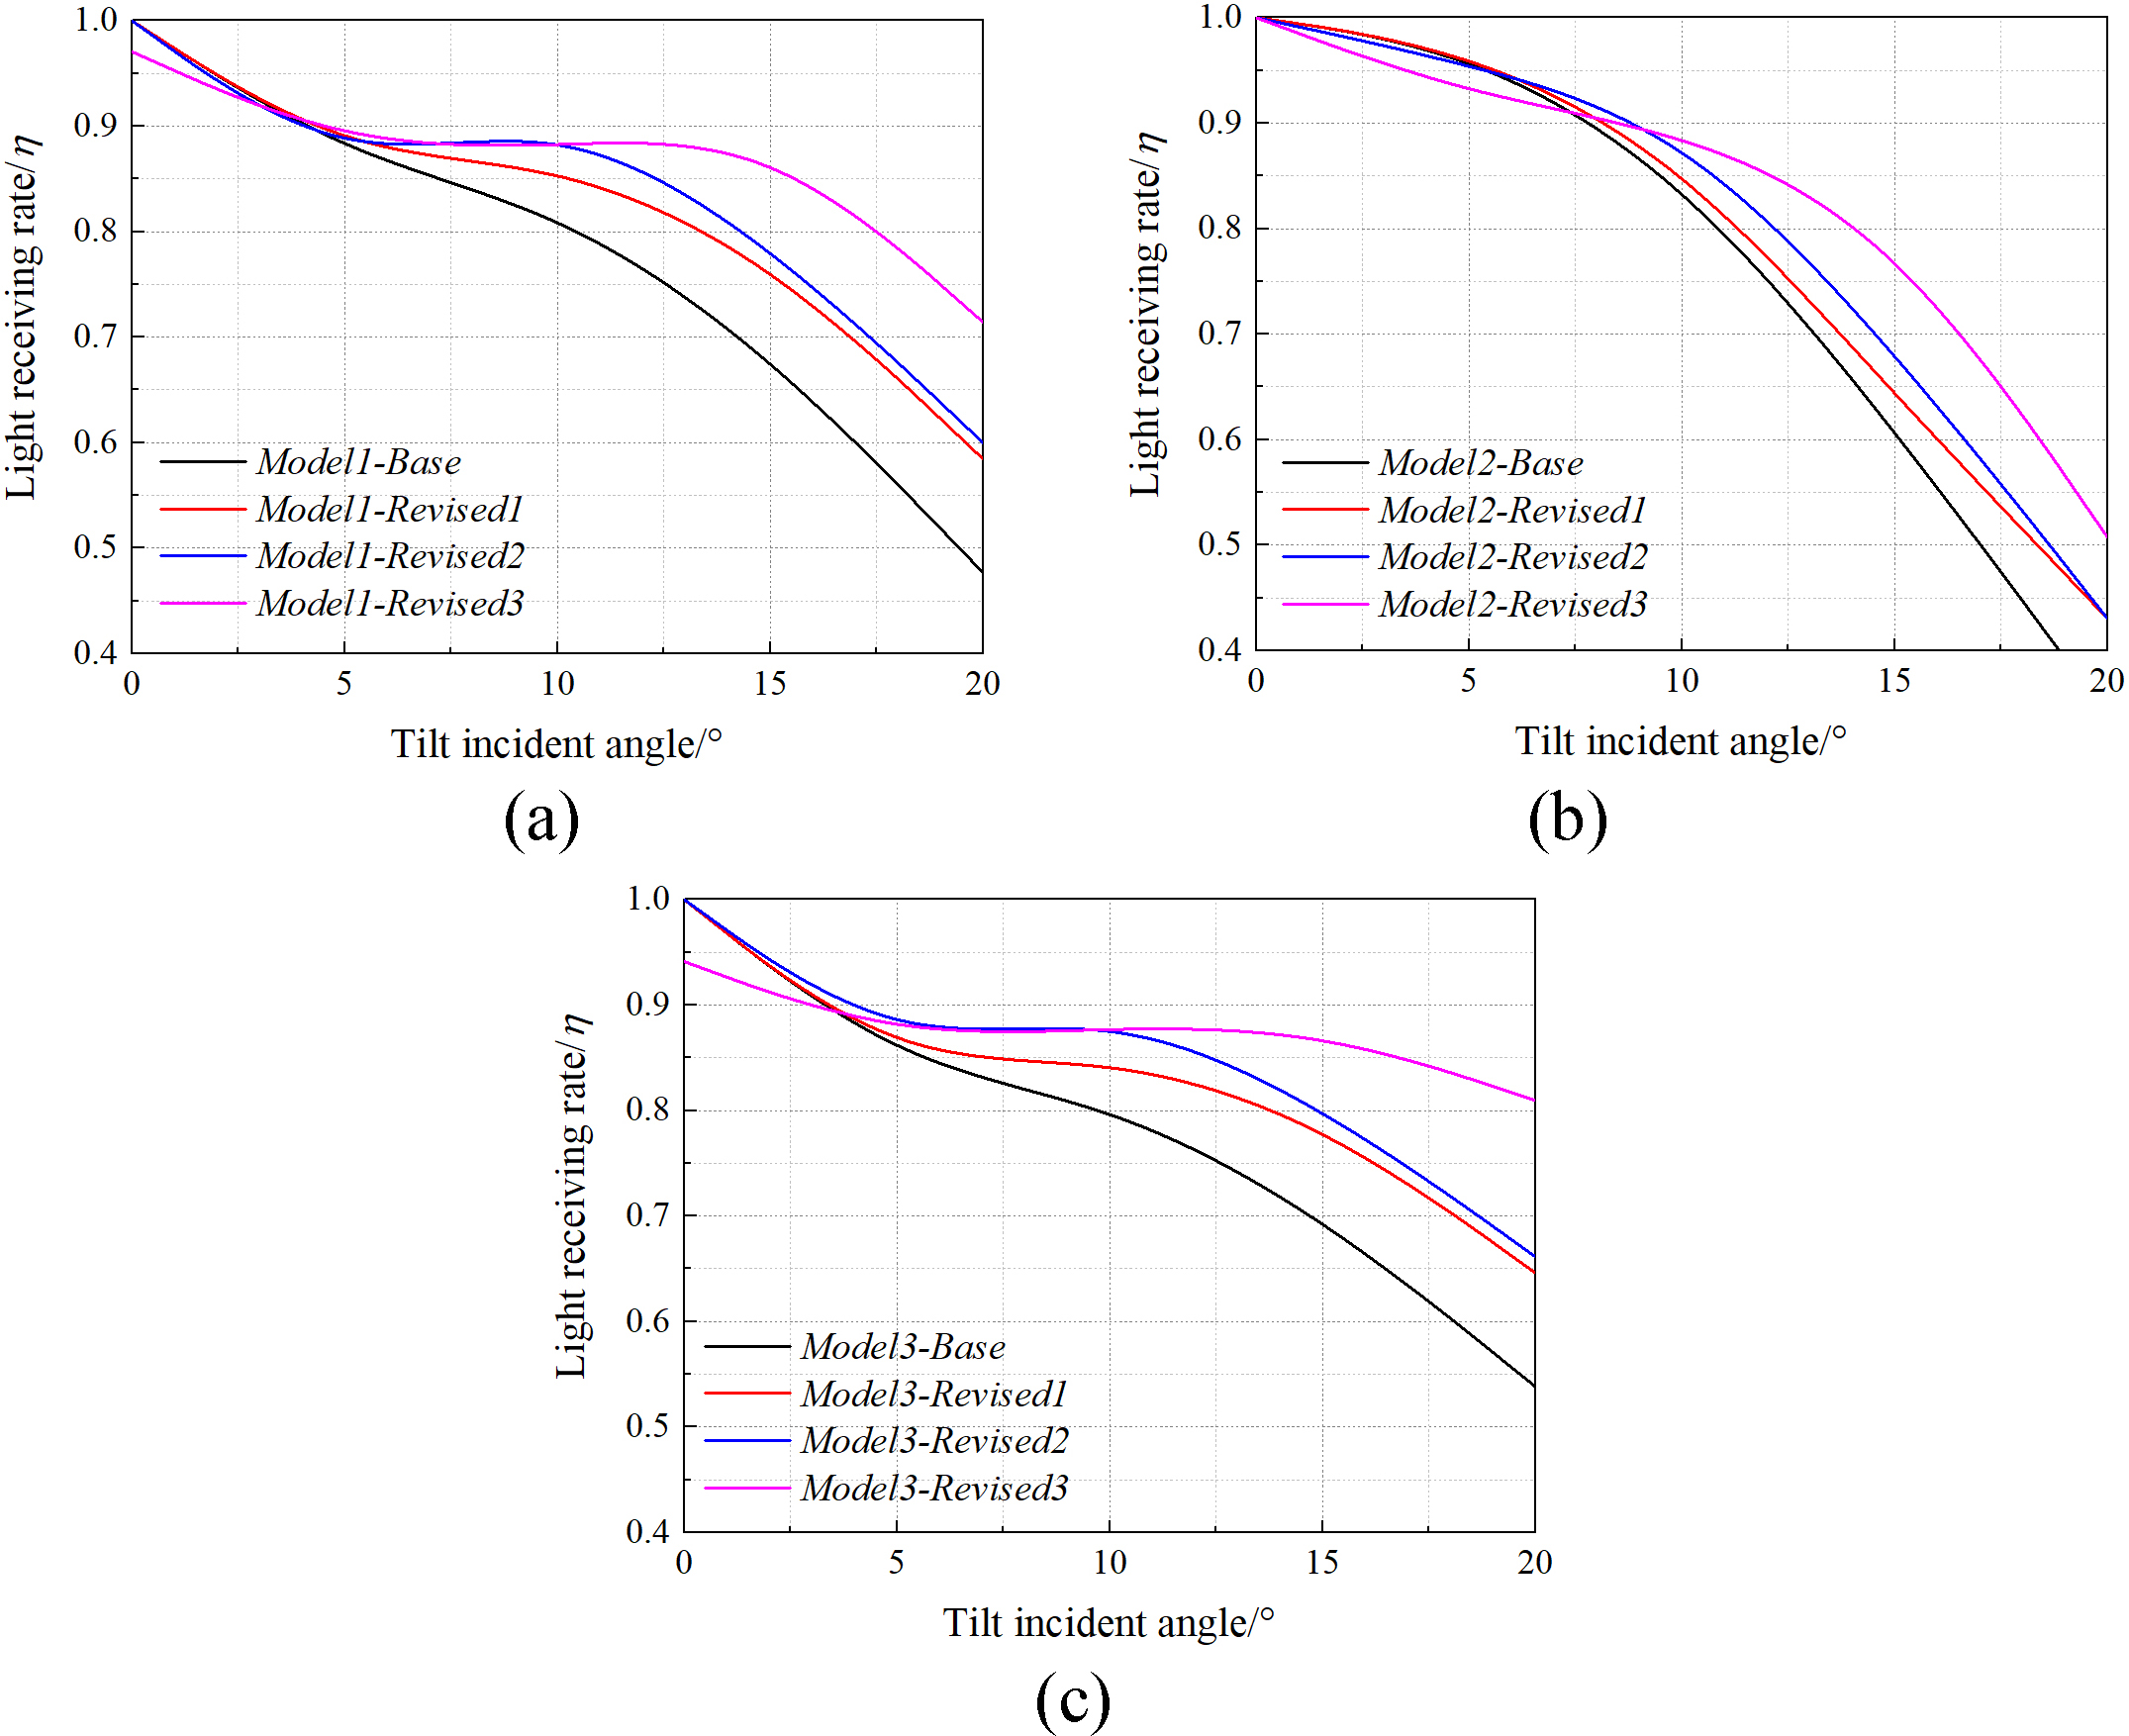
Fig. 14. Comparison of (a) Model1-Revised3 and Model1-Revised2, (b) Model1-Revised3 and Model1-Revised2, and (c) Model1-Revised3 and Model1-Revised2.
Fully consider the average efficiency, light receiving rate trend along with the change of the incident angles, the difficulty of the model processing and the design criterion of the three models, finally choose Model1-Revised3 as the final model, because it has higher average efficiency, and its width is 680 mm, height is 337.5 mm, which means that this model has maximum possible to meet the design requirements. Light receiving rates at different incident angles of Model1-Revised3, Model2-Revised3 and Model3-Revised3 are shown in Table 1.
Table 1
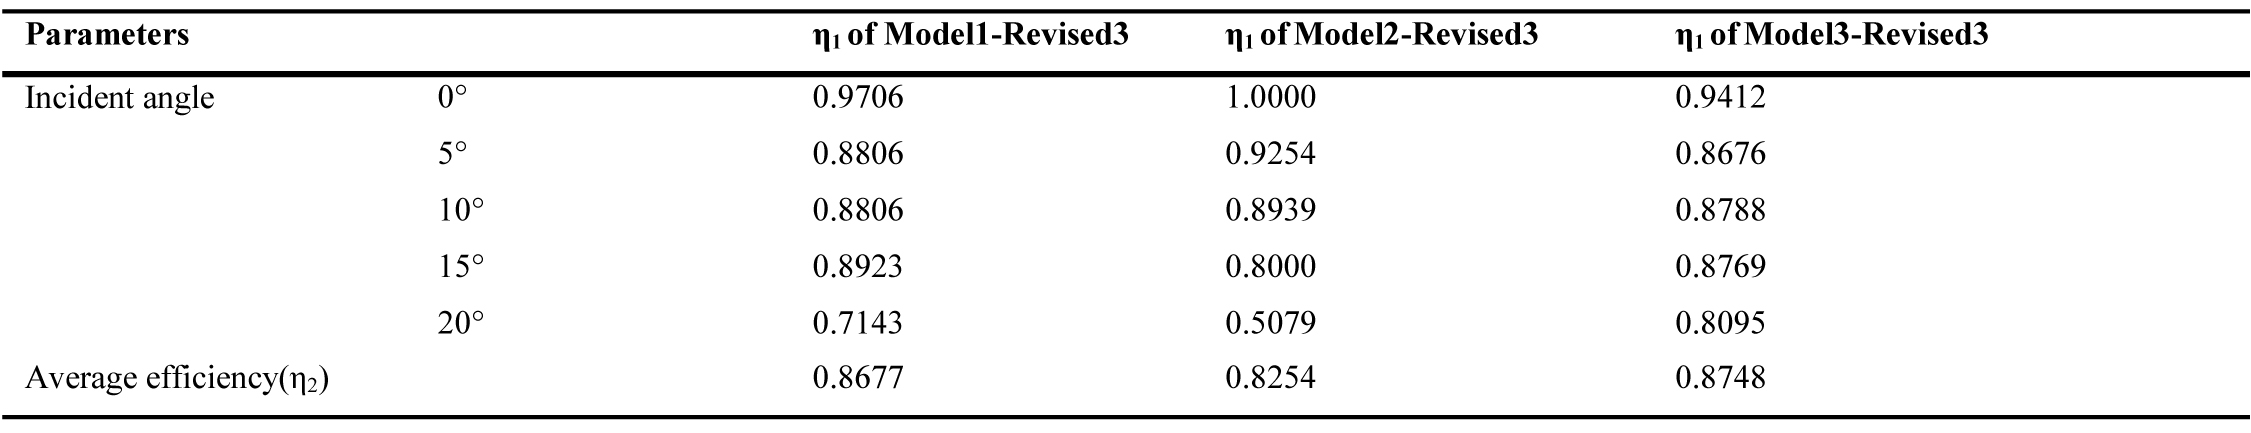
Table 1. Some details of Model1-Revised3, Model2-Revised3, and Model3-Revised3.
The three-segment equations (unit: mm) of Model1-Revised3 are shown as follows:
- Involute: Take the right involute for example, the equation of the involute is 0<t<1.5931 x=50×(sin(t)-t×cos(t)) y=80-50×(cos(t)+t×sin(t)), it starts at t=0 x=0 y=30 and ends at t=1.5931 x=51.7612 y=1.4798;
- Parabola: Take the right involute for example, the equation of parabola is y=(x-30)2/320 51.7612<x<290, it starts at x=51.7612 y=1.4798 and ends at x=290 y=211.25;
- Line: Take the straight line above the right parabola as an example, the equation is y-211.25=2.525×(x-290), it starts at x=290 y=211.25 and ends at x=340 y=337.5.
Base on the above details, final three-dimensional model of Model1-Revised3 is shown in Fig. 15. The solar concentrator manufactured according to the 3D model is shown in Fig. 16.
Figure 15
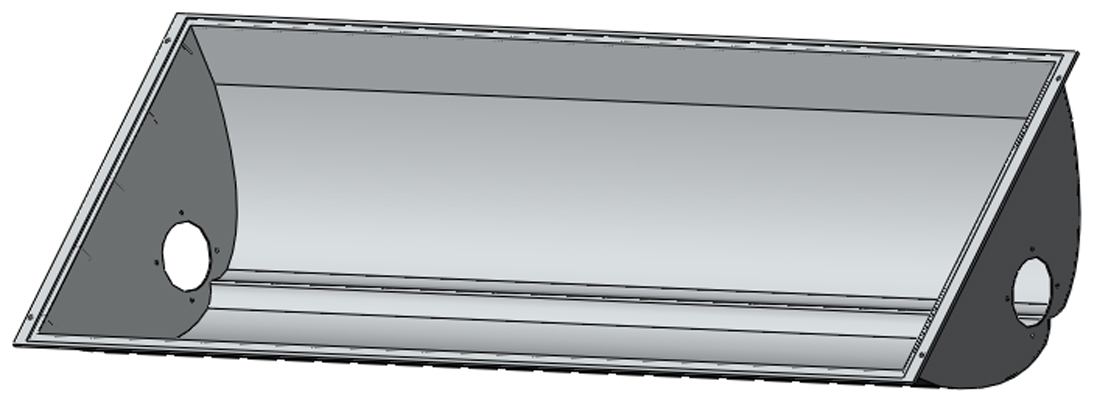
Fig. 15. 3D model of the final concentrator.
Figure 16
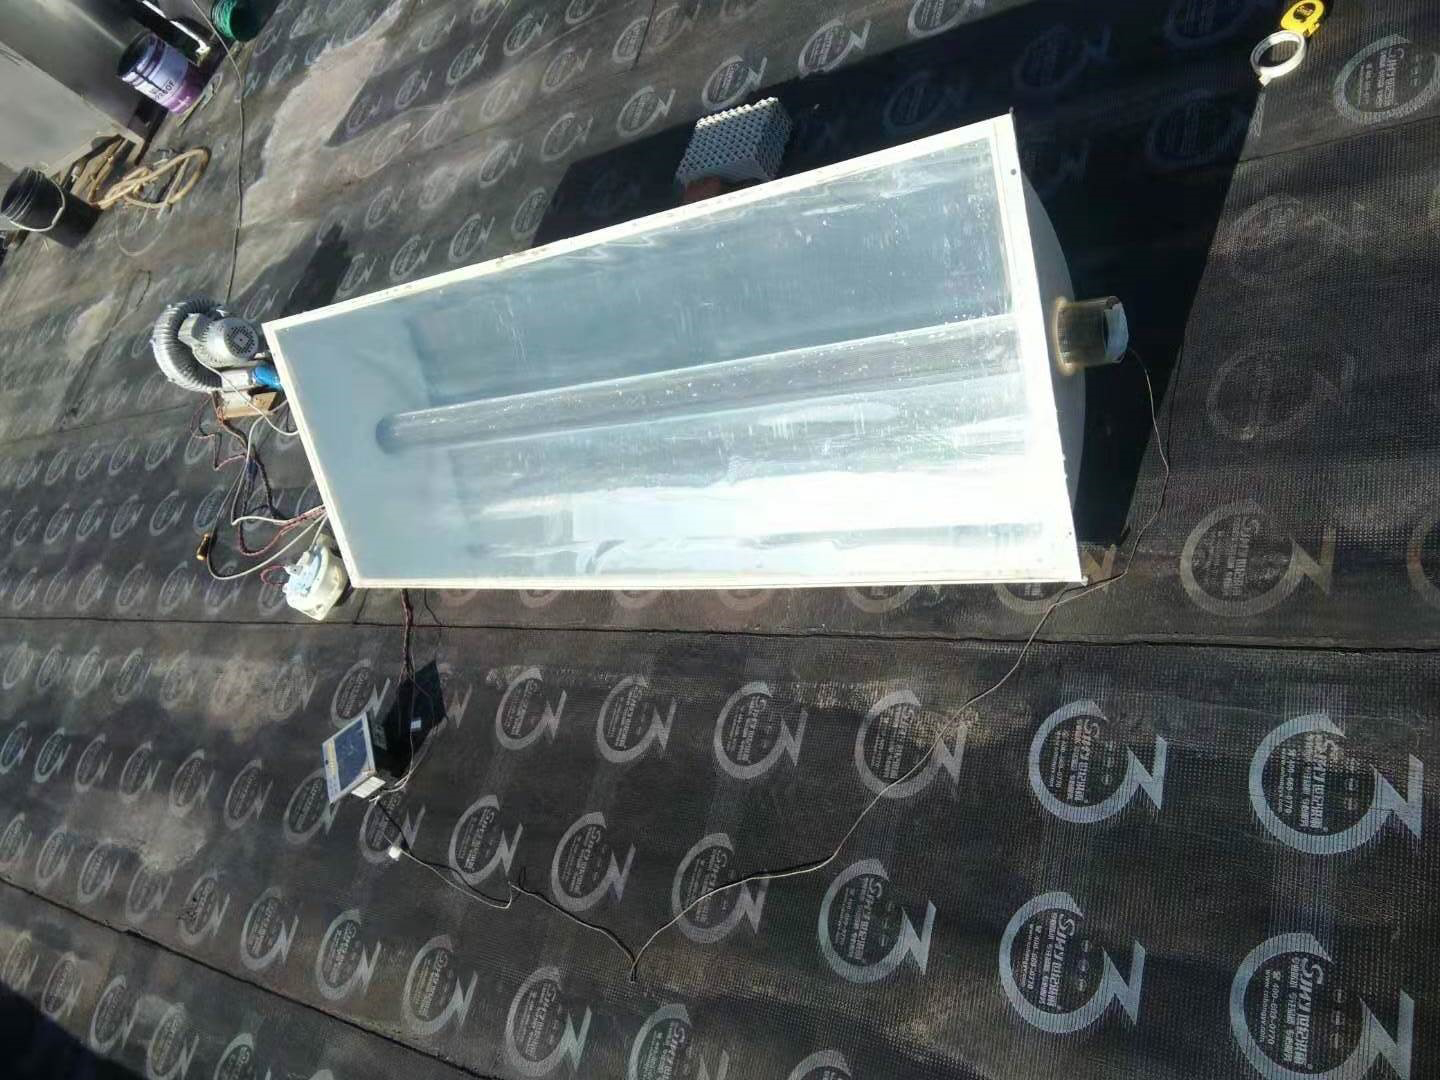
Fig. 16. Manufactural model of the final concentrator.
4. Performance test and discussions
4.1. Thermal collection test
The experimental system which was shown in Fig. 16 was set up. The experimental equipment includes: concentrator, air pump (model: HG-1500, maximum power is 1.5W), glass cover (light transmittance is 0.92), reflector (material is aluminum, reflectance is 0.92), glass tube (outer diameter is 110 mm, light transmittance is 0.92), receiver (diameter is 100 mm, absorption rate is 0.9), K-type thermocouple, temperature recorder, irradiance recorder, and so on. Connect the outlet of the air pump to the inlet of the concentrator. During the experiment, the inlet and outlet temperature of the air pump, the outlet temperature of the concentrator, the irradiance, and the air mass flow rate were measured every minute.
The performance of the solar concentrator was tested at noon on December 3, 2019. Place the concentrator east and west, and the light inlet faces the south side. The sun altitude angle at noon in the northern hemisphere can be calculated by the following equation:
The experiment was performed at 11:10 on December 3rd. Before the experiment started, the concentrator had been rotated to an incident angle of 20° and lasted for a period of time. Therefore, the outlet temperature of the concentrator at 11:10 was considered to have reached relative stability. The five minutes’ data from 11:11 to 11:15 were taken as the experimental data at an incident angle of 20°, and the concentrator was rotated to an incident angle of 15° at 11:16. The experimental data fluctuated greatly during the period from 11:16 to 11:20, so it was not used for later calculation. Similarly, the five minutes’ data from 11:21 to 11:25 were taken as the experimental data at an incident angle of 15°, and the concentrator was rotated to an incident angle of 10° at 11:26; The five minutes’ data from 11:31 to 11:35 were taken as the experimental data at an incident angle of 10°, and the concentrator was rotated to an incident angle of 5° at 11:36; The five minutes’ data from 11:41 to 11:45 were taken as the experimental data at an incident angle of 5°, and the concentrator was rotated to an incident angle of 0° at 11:46; The five minutes’ data from 11:51 to 11:55 were taken as the experimental data at an incident angle of 0°, and the experiment ended at 11:56. The experimental data at each incident angle are averaged to obtain the average solar irradiance and average temperature difference at each incident angle, which is shown in Fig. 17. As can be seen from the Fig. 17, the average solar irradiance and the average temperature difference have been increasing since the beginning of the experiment. When the incident angle changes from 5° to 0°, the average temperature difference has increased significantly, which proves that the performance of the condenser is very good at low incident angles.
Figure 17
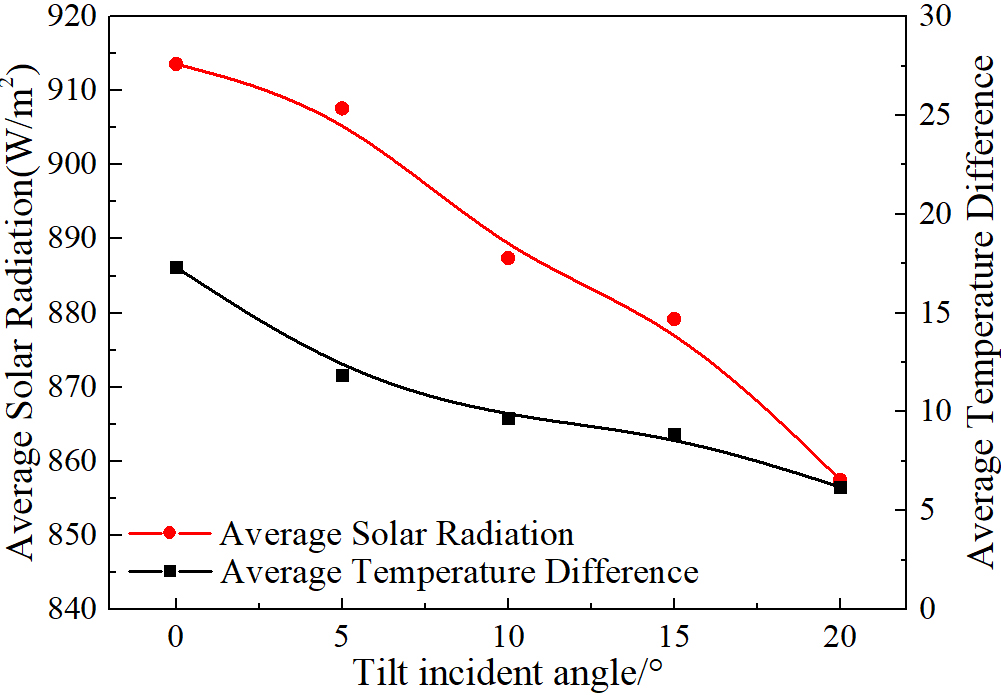
Fig. 17. Average solar irradiance and average temperature difference at each incident angle.
4.2. Analysis on efficiency
The experimental efficiency of the concentrator was calculated and compared with the optical efficiency of the concentrator, which was shown in Fig. 18. Where, the experimental efficiency (η2) can be calculated by the following equation:
where cp is the specific heat capacity of air, here takes 1.005kJ/(kg·K), ΔT is the air inlet and outlet temperature difference, m is the mass flow rate of the air, I is the irradiance, S is the area of the inlet of the concentrator.
Figure 18
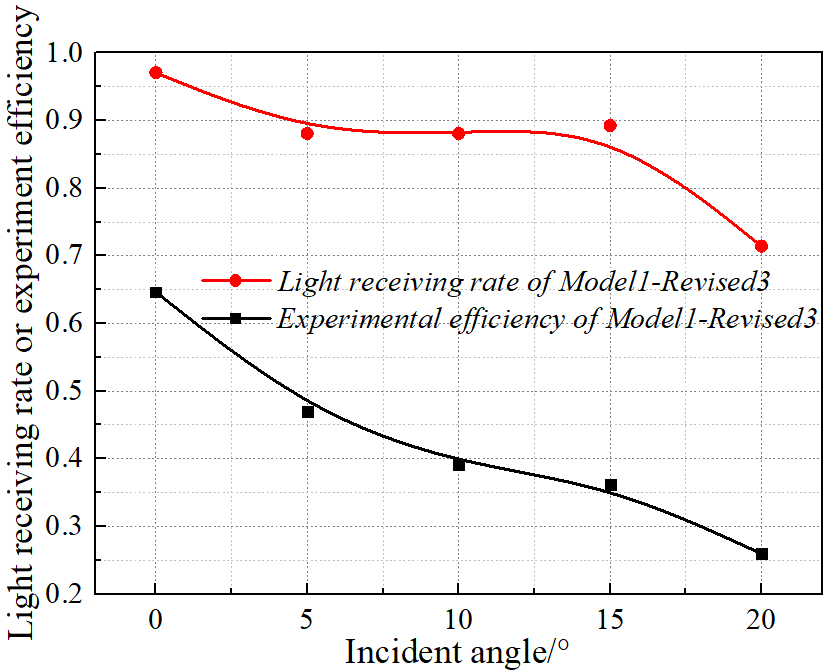
Fig. 18. Comparison between experimental efficiency and light receiving rate of concentrator.
As can be seen from Fig. 18, the variation trend of the curve of experimental efficiency is basically consistent with the light receiving rate obtained by optical simulation. The average efficiency of the concentrator measured by the experiment is 0.426, this value is much different from 0.868 which is the value of average efficiency obtained by optical simulation, indicating that there is a large amount of energy loss in the experimental device. Therefore, it is necessary to analyze the energy which enter the concentrator.
The energy entering the concentrator can be divided into three parts: the first part is the heat collected by the receiver, accounting for 0.426; the second part is energy of escaping light, accounting for 1-0.868=0.132; the third part is the heat loss of the concentrator and the loss caused by experimental instruments, accounting for 1-0.426-0.132=0.442. The loss caused by the experimental instrument includes the loss caused by the glass cover, reflectors, glass tube, receiver, and other experimental components. According to the properties of the chosen materials, the glass cover has about 8% loss, which is caused by glass cover absorbing and reflecting some light; the reflector loses 8% due to the adsorption; the glass tube transmission loss is about 8%, which is caused by glass tube absorbing and reflecting some light; the receiver absorption loss rate is around 10%, which is caused by the inability of the receiver to fully absorb all incident light; and the heat loss rate is 10.2%, which is because the device can’t be not completely insulated from the outside world. The various losses are shown in Fig. 19. During the experiment, various losses which were shown in Fig. 19 are inevitable, and the average experimental efficiency of the concentrator can reach 0.426, which indicates that the concentrator has a good performance and can provide a stable and efficient energy source.
Figure 19

Fig. 19. The proportion of various losses during the experiment.
4.3. Comparison with the related research
In [17], a novel multi-surface trough solar concentrator for air heating has been presented, and the real weather experimental test was carried out. The experimental system is shown in Fig. 20. The length of concentrator and receiver is 4 m. The daily average efficiency can reach about 60% at a certain air flow rate of 55.12 kg/h and its highest temperature can be over 140℃. The collection efficiency of the system can exceed 45% at the outlet temperature of above 60℃. Compared with this concentrator, the advantages of the concentrator proposed in this text can be reflected in these aspects: First, the concentrator proposed in this paper does not need to track the sun, which greatly reduces the construction cost. Secondly, the concentrator proposed in this paper is only 1.4m long, but it can heat air with a mass flow rate of 180 kg/h to 42.4℃ under the conditions of low irradiance in winter. Thirdly, when the incident angle is 0°, the concentrator proposed in this paper can achieve an average efficiency of 65% and an average concentrator outlet temperature of 41.38℃. The above three points can prove that the concentrator proposed in this paper has good performance and has profound research significance. The difference between the concentrator in reference [17] and the concentrator proposed in this paper is shown in Table 2.
Figure 20
![Experimental system built in [17].](figures/6-176-20.jpg)
Fig. 20. Experimental system built in [17].
Table 2
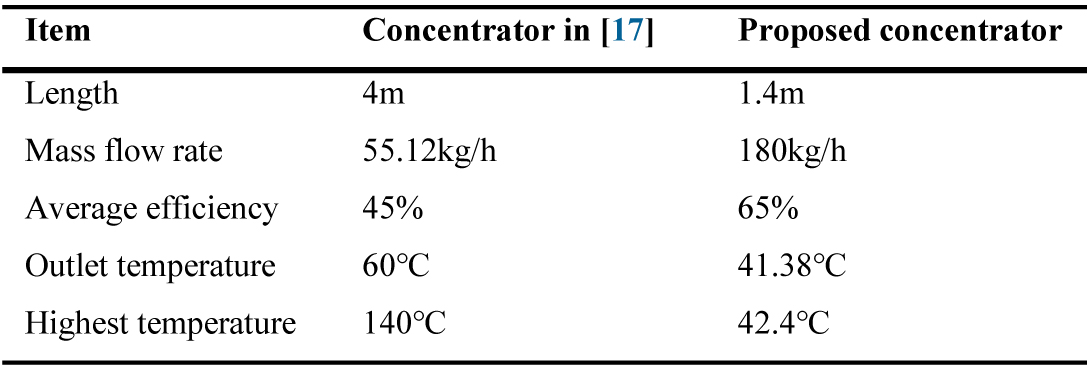
Table 2. Output of the proposed concentrator.
4.4. Market commercialization analyzation
Since it has been proved that this concentrator has a good development prospect, it is necessary to analyze its commercial prospect. Table 3 shows the component cost of this concentrator, which is estimated based on the bulk purchases price.
Table 3
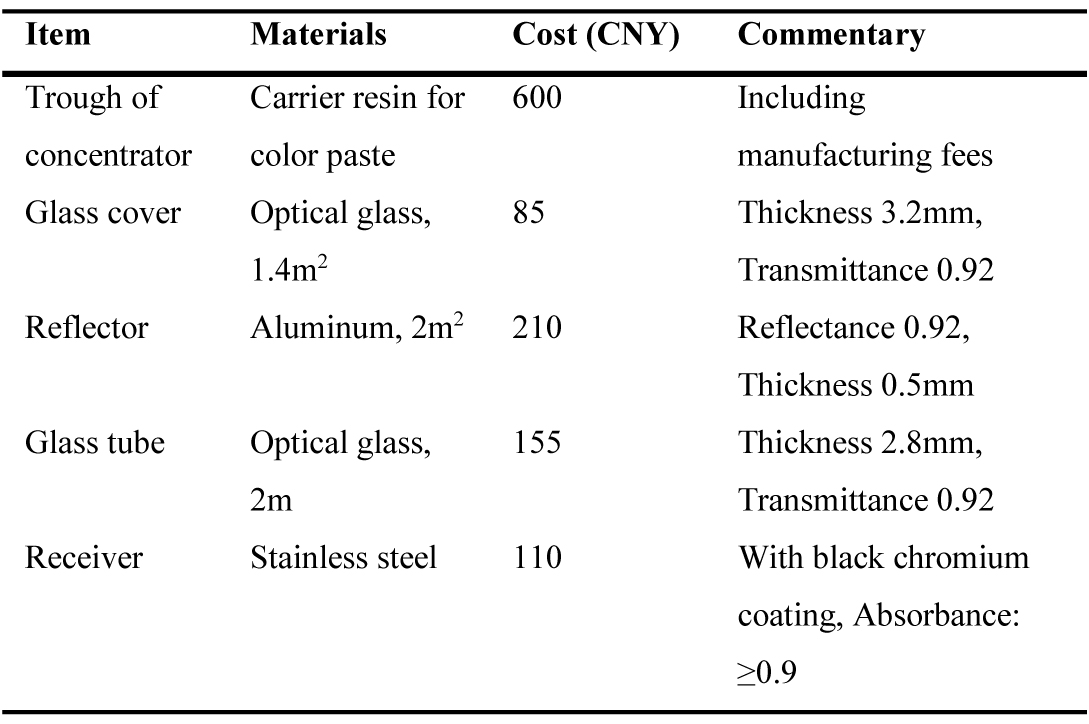
Table 3. Details of the commercial offers.
5. Conclusions
In this paper, a multi-surface solar concentrator is designed, and its optical simulation and experimental test are carried out. The conclusions are as follows:
- Adding involute at the bottom of the original parabolic concentrator effectively avoids light escaping from the bottom and improves the light receiving rate at high incident angles;
- At the incident angle of 5°~15°, the light receiving rate of the concentrator is improved by appropriately raising the height of the involute. However, the stability of the structure around the glass tube must be ensured during raising the involute; therefore, in the coordinate system shown in Fig. 1, the height of the center of the involute is 80 mm, keeping a distance of 20 mm from the center of the glass tube;
- Deflect the tangent of upper end of the parabola toward the center effectively improves the light receiving rate at high incident angles, but the light receiving rate is slightly reduced at low incident angles. However, the light receiving rate will be severely affected if the deflection angle is too large or the length that is deflected is too long
- According to the experiment, the concentrator achieved the average efficiency of 0.426, while the optical simulation achieved the average efficiency of 0.868. The inevitable losses of 44.2% were noted. Therefore, this concentrator has good performance and can provide a stable and efficient energy source.
Acknowledgment
This work has been supported by Beijing Municipal Natural Science Foundation (Grant NO. 3192031).
Contributions
F. Liu wrote the article. H. Zheng and R. Jin helped to conduct the experiments. H. Zheng and X. Ma helped to check the viewpoints and language to improve the manuscript.
References
- X. Yu, Y. Su, H. Zheng, S. Riffat, A study on use of miniature dielectric compound parabolic concentrator (dCPC) for daylighting control application, Building and Environment, 2014, 74. https://doi.org/10.1016/j.buildenv.2013.12.008
- C. Zehui, L. Jianye, L. Wenlong, H. Jing, Z. Hongfei, Analysis of thermal performance of trough-type compound parabolic concentrator in solar drying equipment, Transactions of the Chinese Society of Agricultural Engineering 35(2019) 197-203.
- W. Dezhong, L. Ming, L. Guoliang, W. Yunfeng, F. Zhikang, Z. Guofu, Photothermal Properties of Composite Parabolic Condenser with Low Intercept Ratio, Laser & Optoelectronics Progress 56(2019) 201-208. https://doi.org/10.3788/lop56.082201
- S. A. Waghmare, N. P. Gulhane, Design and ray tracing of a compound parabolic collector with tubular receiver, Solar Energy 137 (2016) 165-172. https://doi.org/10.1016/j.solener.2016.08.009
- Y. Miao, L. Chengshu, H. Jing, J. Liize, Z. Hongfei, C. Zehui, Study on performance of compound parabolic trough photovoltaic concentrator, Renewable Energy Resources 34 (2016) 1107-1111. https://doi.org/10.13941/j.cnki.21-1469/tk.2016.08.001
- H. Wei, L. Yan, Z. Shuguang, C. Xuerong, Z. Jun, F. Yiqin, S. Xiaotao, Effect of compound parabolic concentrator parameters on the concentrating efficiency of solar lasers, Laser Journal 38 (2017) 8- 11. http://dx.doi.org/10.14016/j.cnki.jgzz.2017.10.008
- S. Jifu, Z. Yanqing, L. Yinbiao, L. Yujian, X. Gang, J. Jie, Composite parabolic-involute concentrating solar heating water heater, Optics and Precision Engineering 24 (2016) 1281-1288. https://doi.org/10.3788/ope.20162406.1281
- E. Bellos, D. Korres, C. Tzivanidis, K.A. Antonopoulos, Design, simulation and optimization of a compound parabolic collector, Sustainable Energy Technologies and Assessments 16 (2016) 53-63. https://doi.org/10.1016/j.seta.2016.04.005
- Hou Jing, Wen Wen, Study on performance simulation of compound parabolic concentrating system applied to concentrating power generation, Energy Engineering 3 (2014) 31-33+38. https://doi.org/10.16189/j.cnki.nygc.2014.03.020
- N. Fraidenraich, C. Tiba, B. B. Brandão, O. C. Vilela, Analytic solutions for the geometric and optical properties of stationary compound parabolic concentrators with fully illuminated inverted V receiver, Solar Energy 82 (2007) 132-143. https://doi.org/10.1016/j.solener.2007.06.012
- I. Santos-González, O. García-Valladares, N. Ortega, V.H. Gómez, Numerical modeling and experimental analysis of the thermal performance of a Compound Parabolic Concentrator, Applied Thermal Engineering 114 (2017) 1152-1160. https://doi.org/10.1016/j.applthermaleng.2016.10.100
- X. Ma, H. Zheng, S. Liu, A Review on Solar Concentrators with Multi-surface and Multi-element Combinations, Journal of Daylighting 6 (2019) 80-96. http://dx.doi.org/10.15627/jd.2019.9
- C. Tíba, N. Fraidenraich, Optical and thermal optimization of stationary non-evacuated CPC solar concentrator with fully illuminated wedge receivers, Renewable Energy 36 (2011) 2547-2553. https://doi.org/10.1016/j.renene.2011.02.007
- M. I. González, L. R. Rodríguez, Solar powered adsorption refrigerator with CPC collection system: Collector design and experimental test, Energy Conversion and Management 48 (2007) 2587-2594. https://doi.org/10.1016/j.enconman.2007.03.016
- C.-W. Kuo, P.-S. Yen, W.-C. Chang, K.-C. Chang, The Design and Optical Analysis of Compound Parabolic Collector, Procedia Engineering 79 (2014) 258-262. https://doi.org/10.1016/j.proeng.2014.06.340
- M. Tian, Y. Su, H. Zheng, G. Pei, G. Li, S. Riffat, A review on the recent research progress in the compound parabolic concentrator (CPC) for solar energy applications, Renewable and Sustainable Energy Reviews 82 (2018) 1272-1296. https://doi.org/10.1016/j.rser.2017.09.050
- H. Zheng H, T. Tao, M. Ma, H. Kang, Y. Su, Experimental test of a novel multi-surface trough solar concentrator for air heating, Energy conversion and management 63 (2012) 123-129. https://doi.org/10.1016/j.enconman.2012.01.034
Copyright © 2019 The Author(s). Published by solarlits.com.

2529
Total views
Citations
SHARE ON


