Article Outline
3. Description of the experimental apparatus
5. Comparative experimental analysis
Figures and tables
Volume 7 Issue 1 > pp. 37-56 • doi: 10.15627/jd.2020.4
Experimental Analysis of the Performance of Light Shelves in Different Geometrical Configurations Through the Scale Model Approach
Paolo Zazzini,* Alessandro Romano, Alessio Di Lorenzo, Valeria Portaluri, Alessandro Di Crescenzo
Author affiliations
Department INGEO, University “G. D’Annunzio”, Viale Pindaro 42, 65127 Pescara, Italy
* Corresponding author. +39 085 4537282
zazzini@unich.it (P. Zazzini)
romanoalessandro86@gmail.com (A. Romano)
alessiodilorenzo88@gmail.com (A. Di Lorenzo)
valeria.portaluri@hotmail.it (V. Portaluri)
dicrescenzo.a@live.it (A. Di Crescenzo)
History: Received 5 December 2019 | Revised 10 February 2020 | Accepted 25 February 2020 | Published online 3 March 2020
Copyright: © 2020 The Author(s). Published by solarlits.com. This is an open access article under the CC BY license (http://creativecommons.org/licenses/by/4.0/).
Citation: Paolo Zazzini, Alessandro Romano, Alessio Di Lorenzo, Valeria Portaluri, Alessandro Di Crescenzo, Experimental Analysis of the Performance of Light Shelves in Different Geometrical Configurations Through the Scale Model Approach, Journal of Daylighting 7 (2020) 37-56. http://dx.doi.org/10.15627/jd.2020.4
Figures and tables
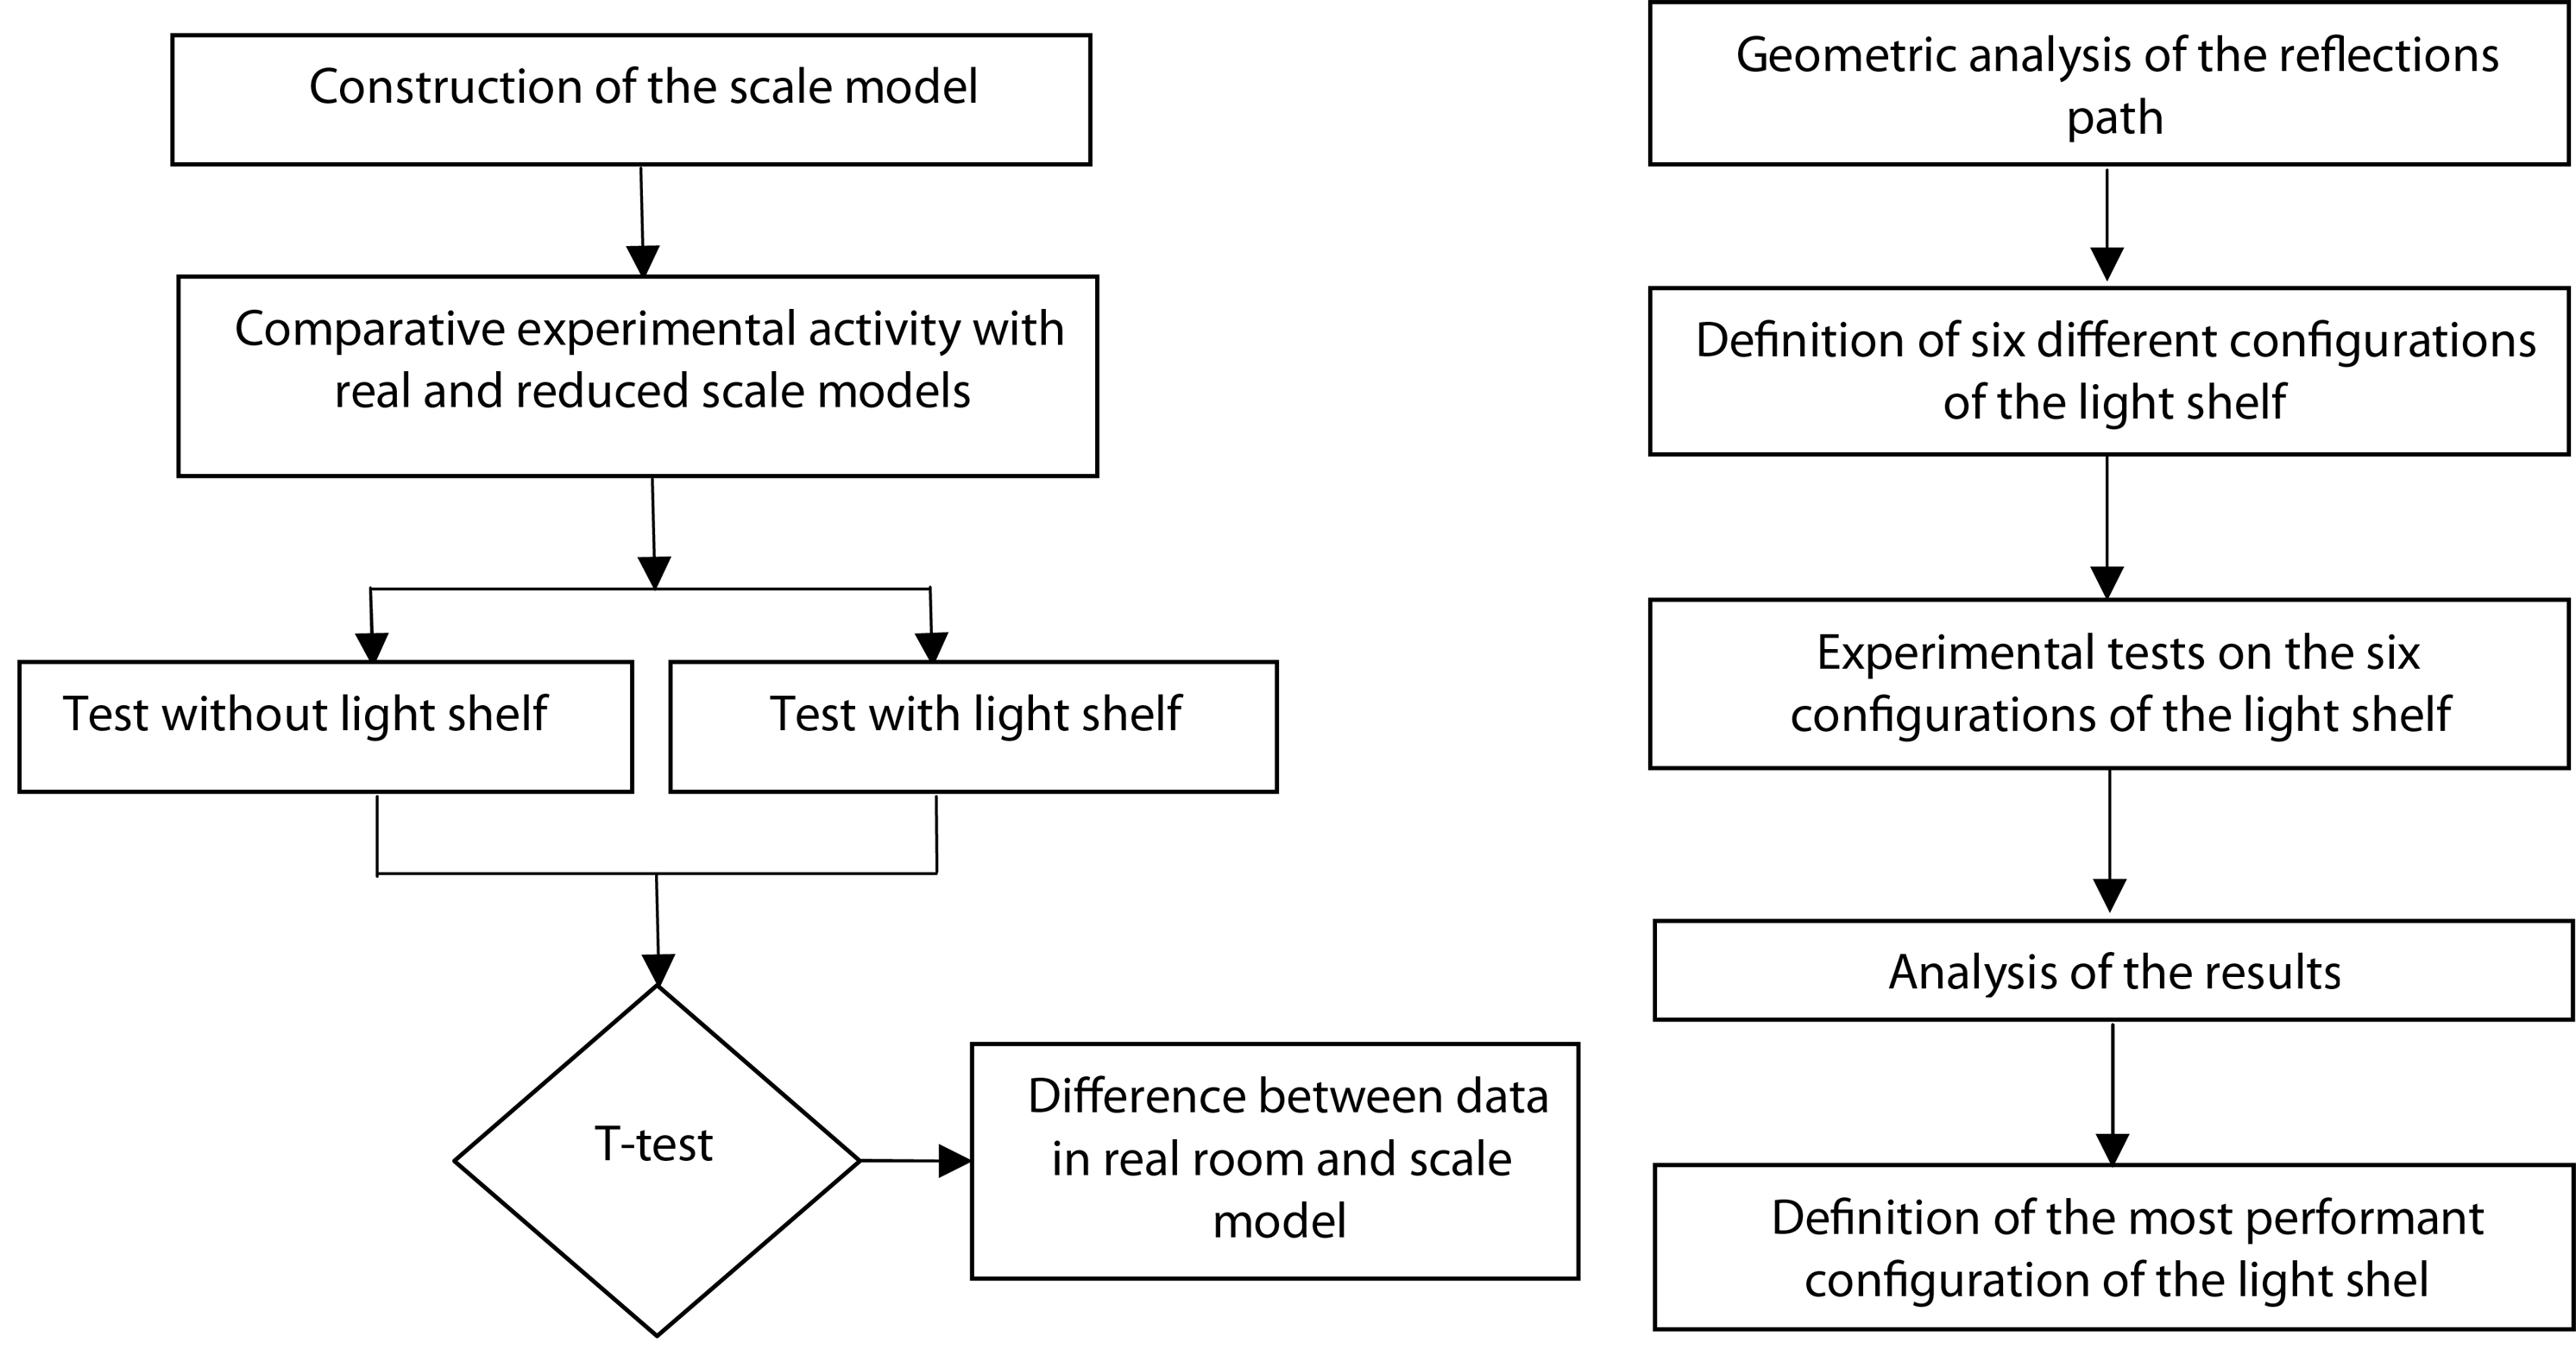 Figure 1
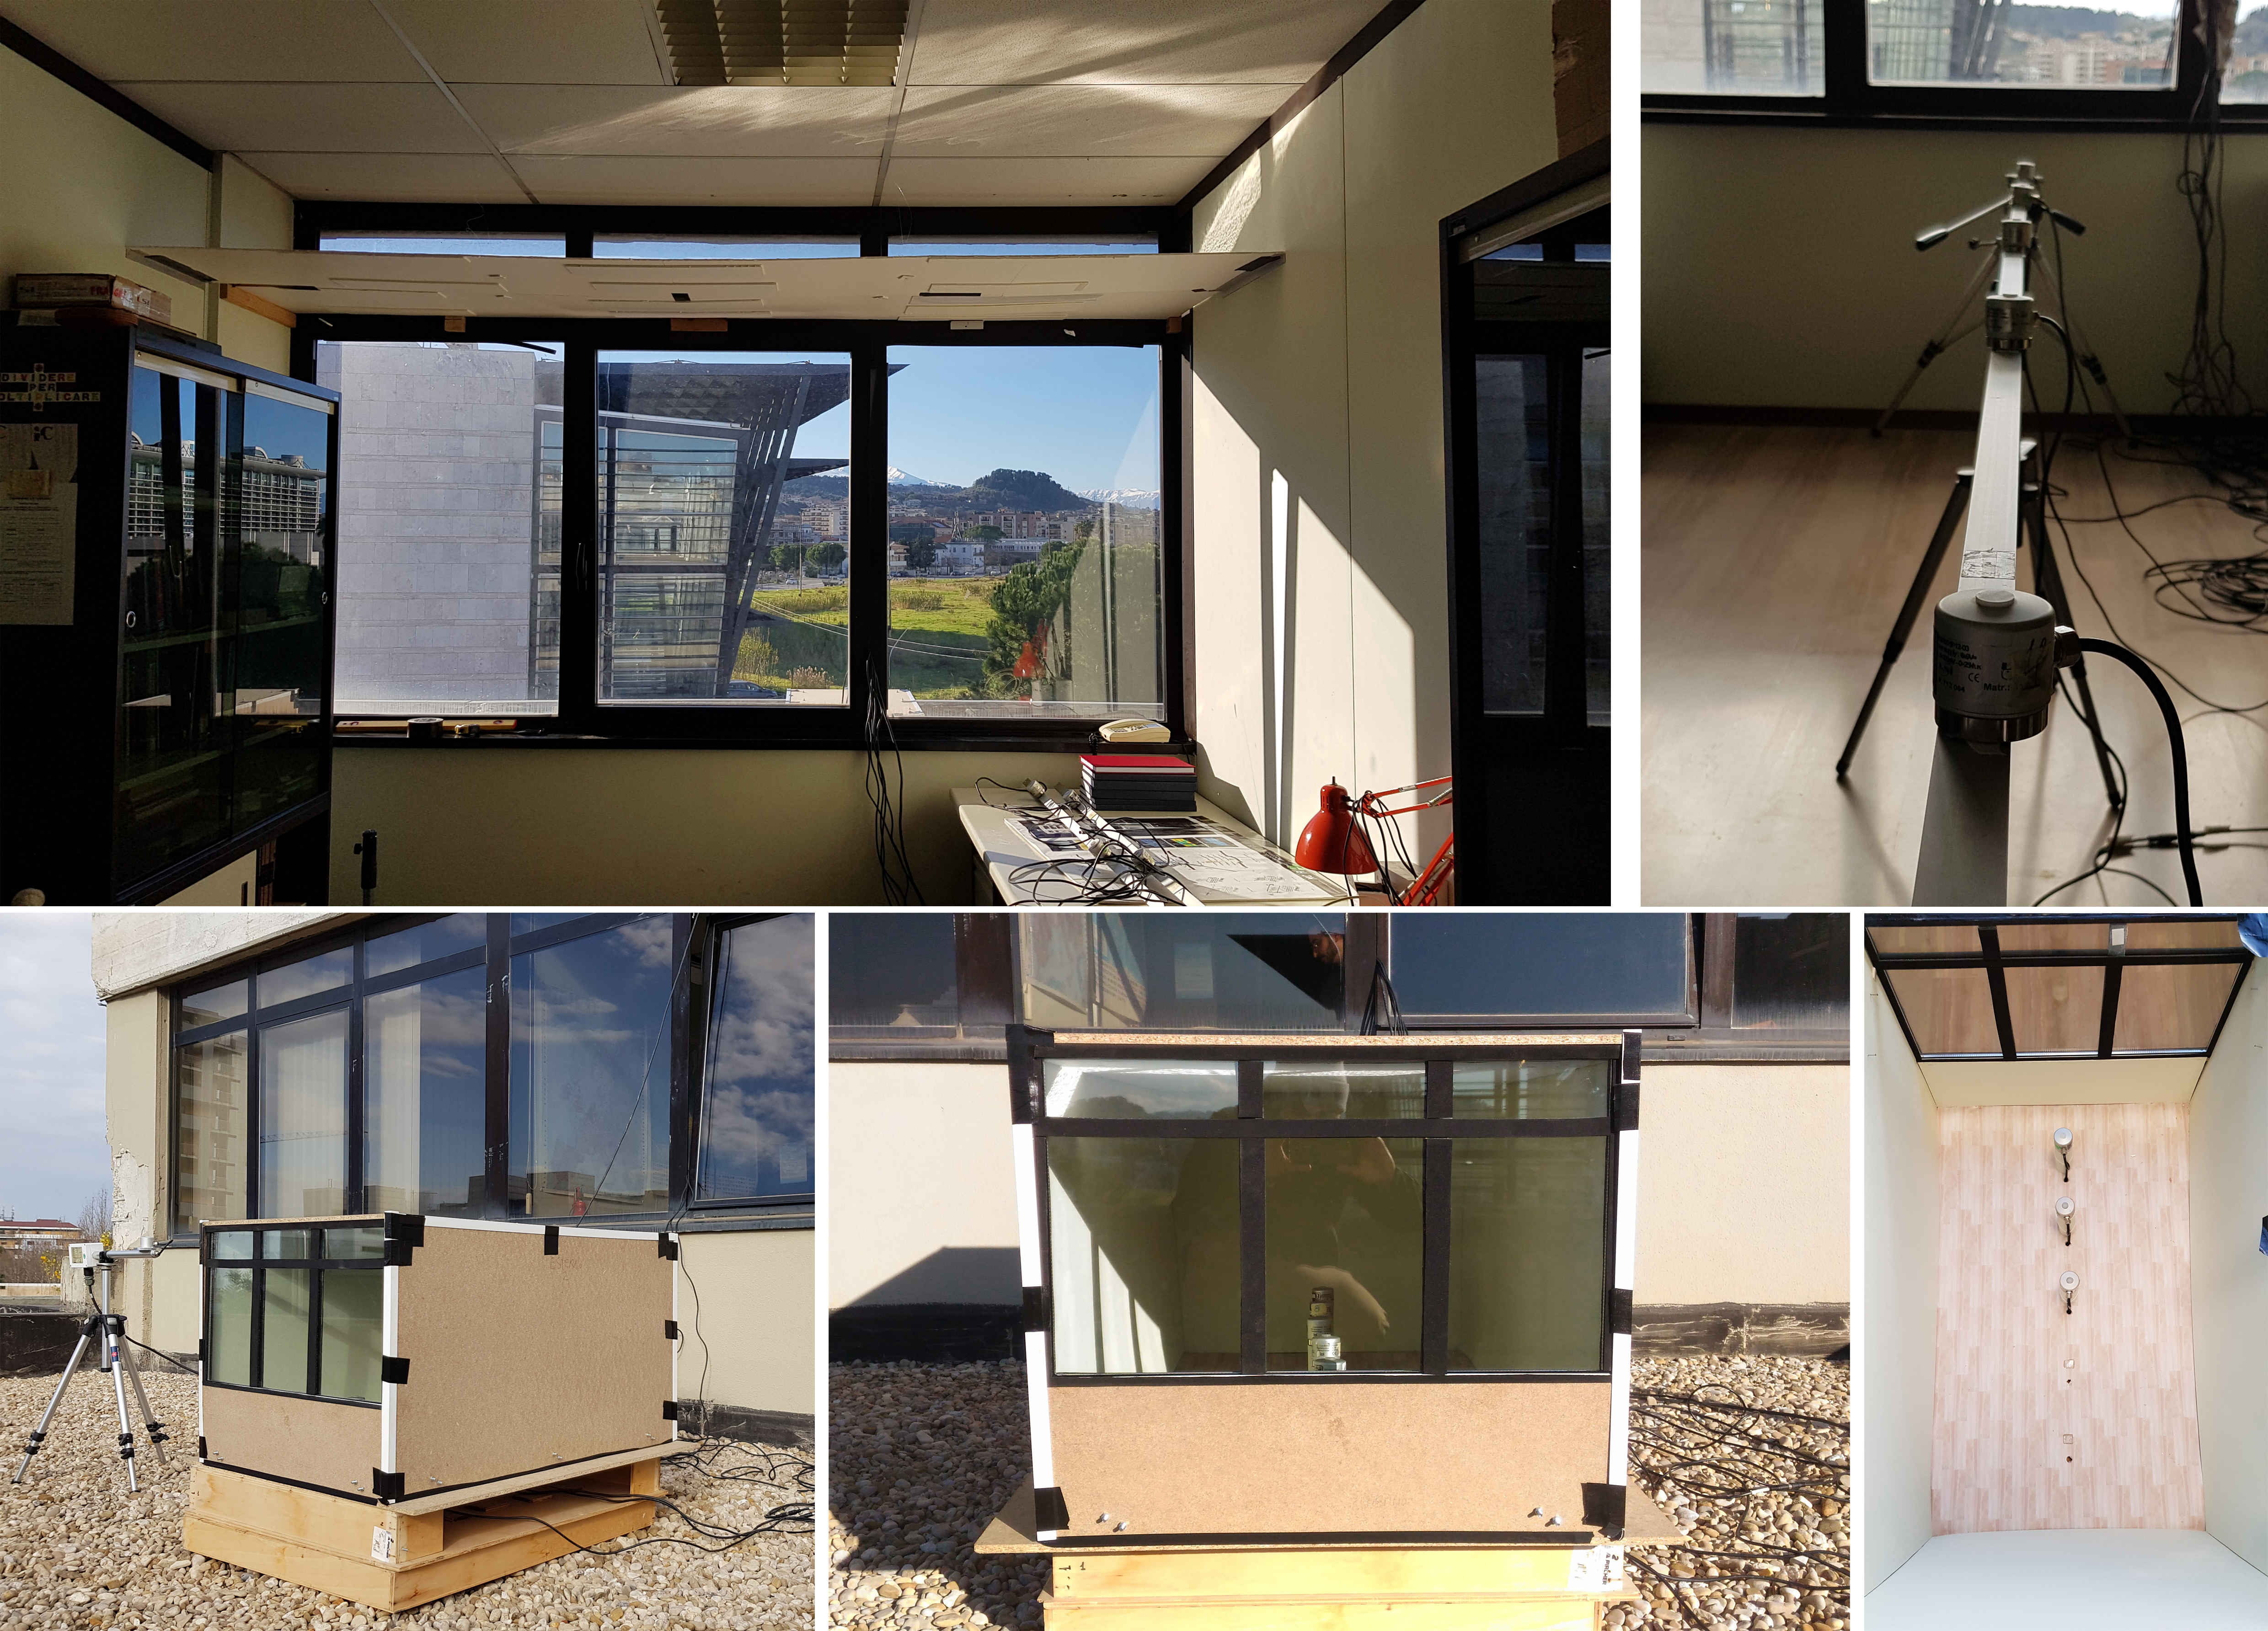 Figure 2
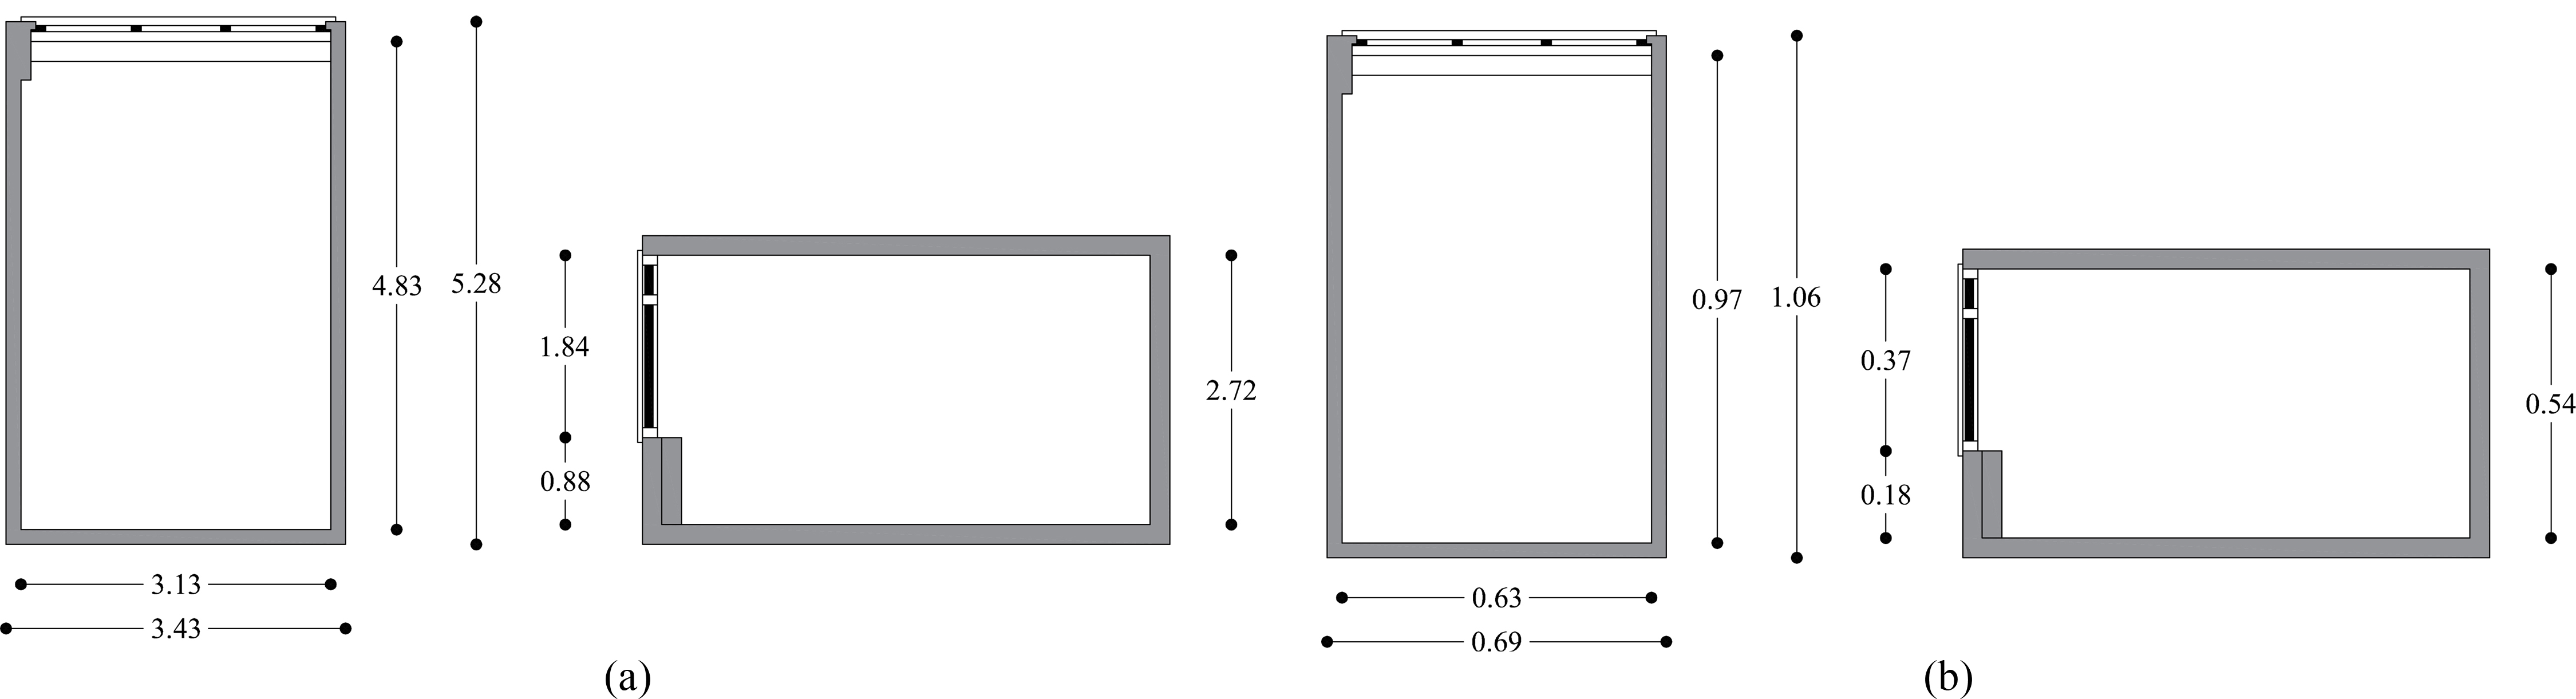 Figure 3
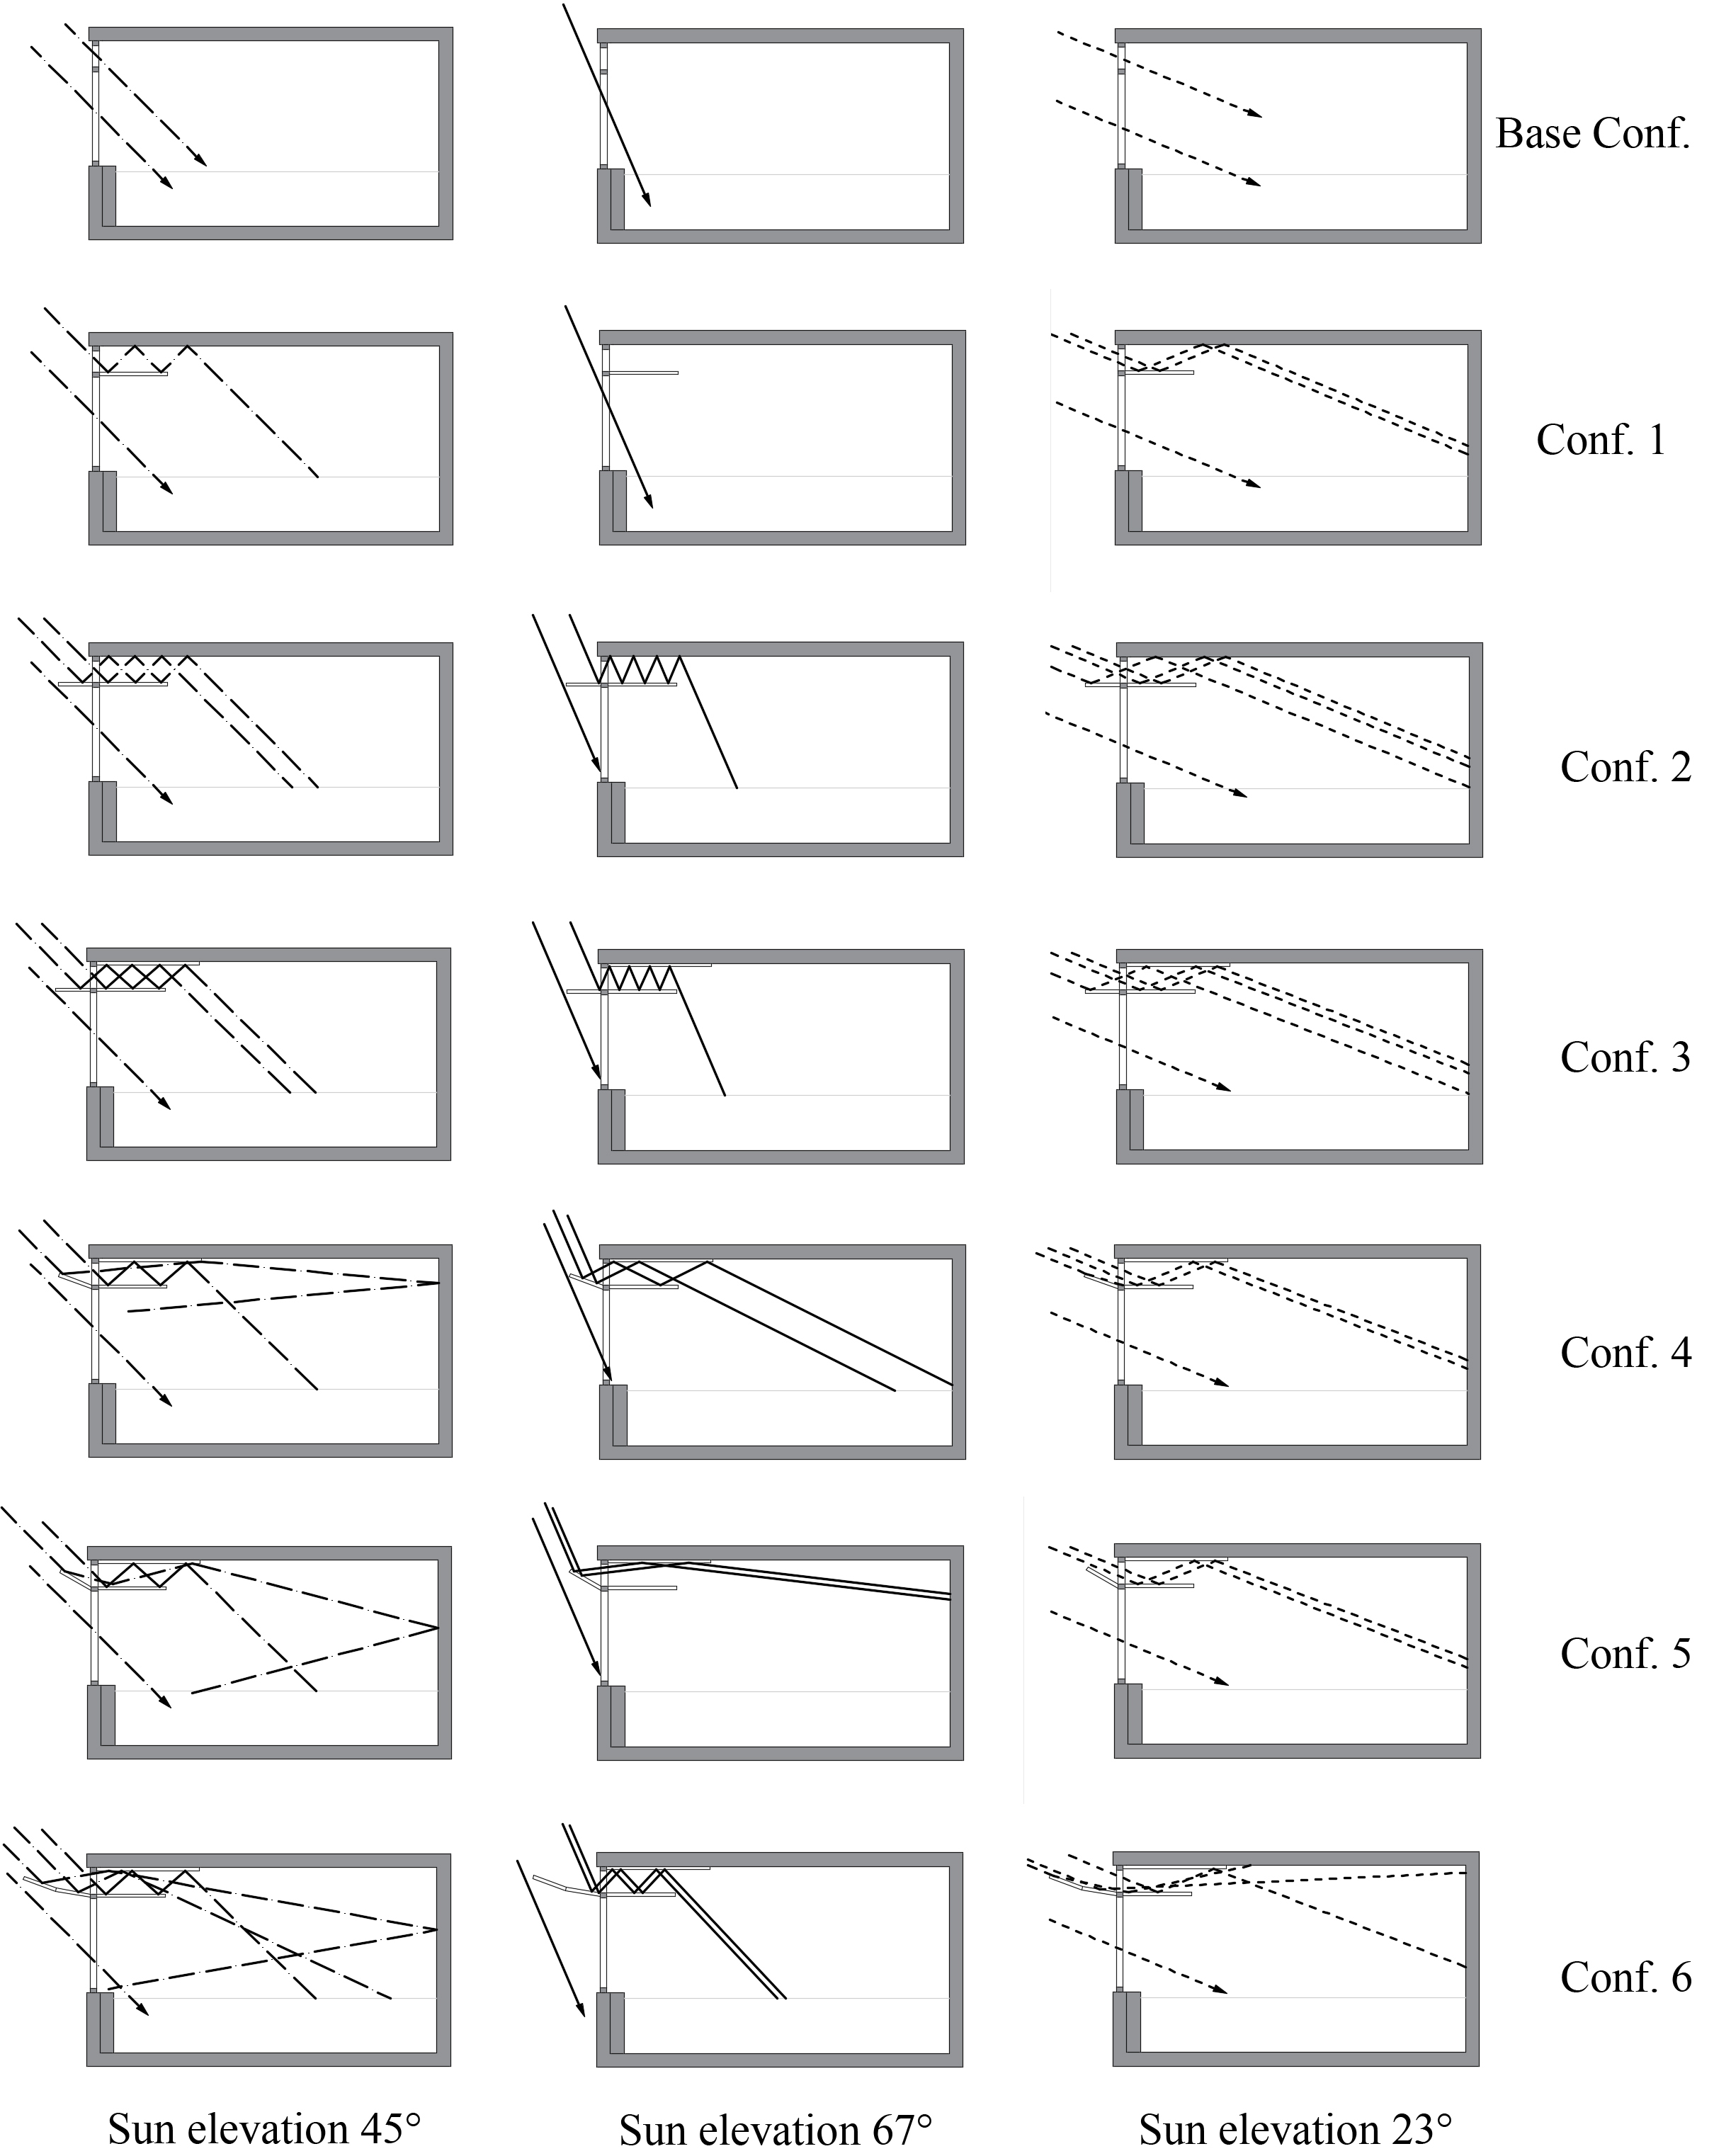 Figure 4
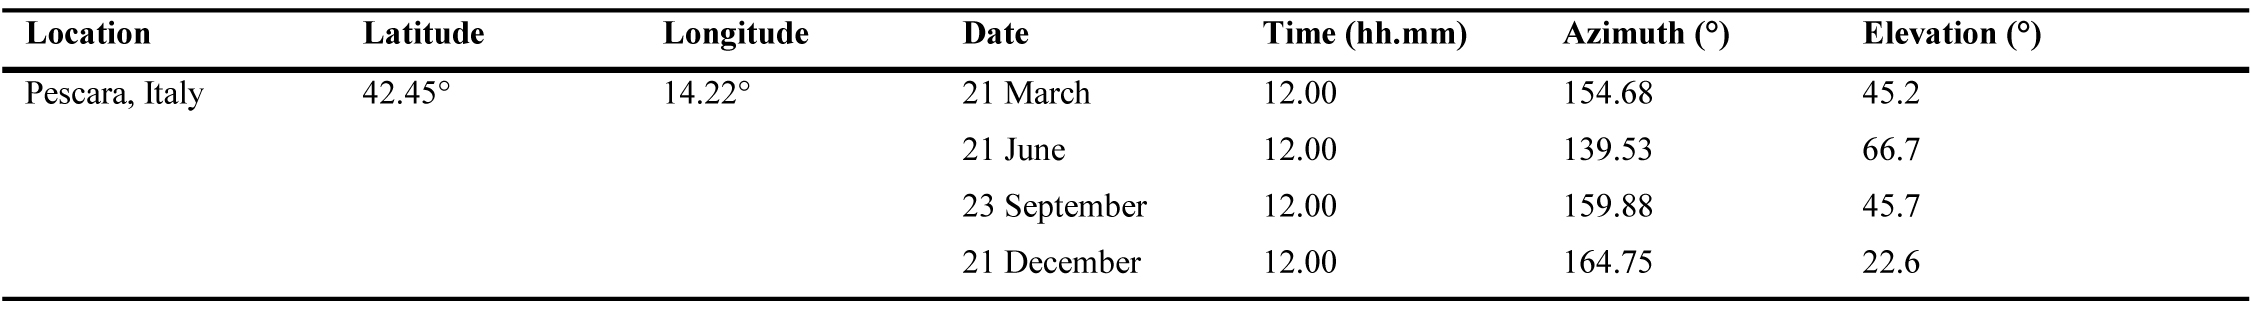 Table 1
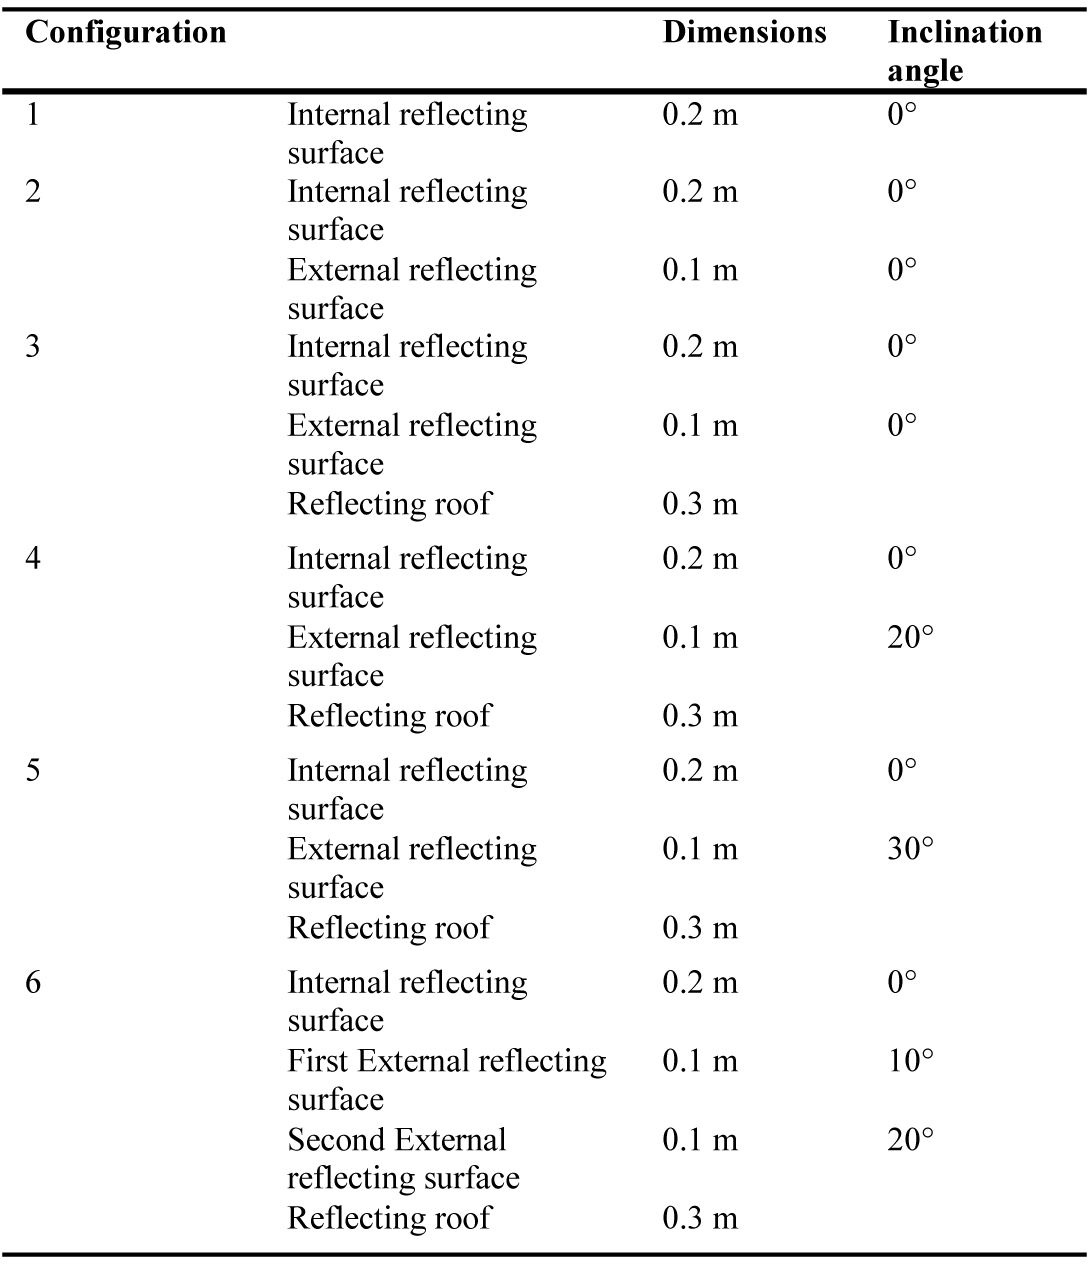 Table 2
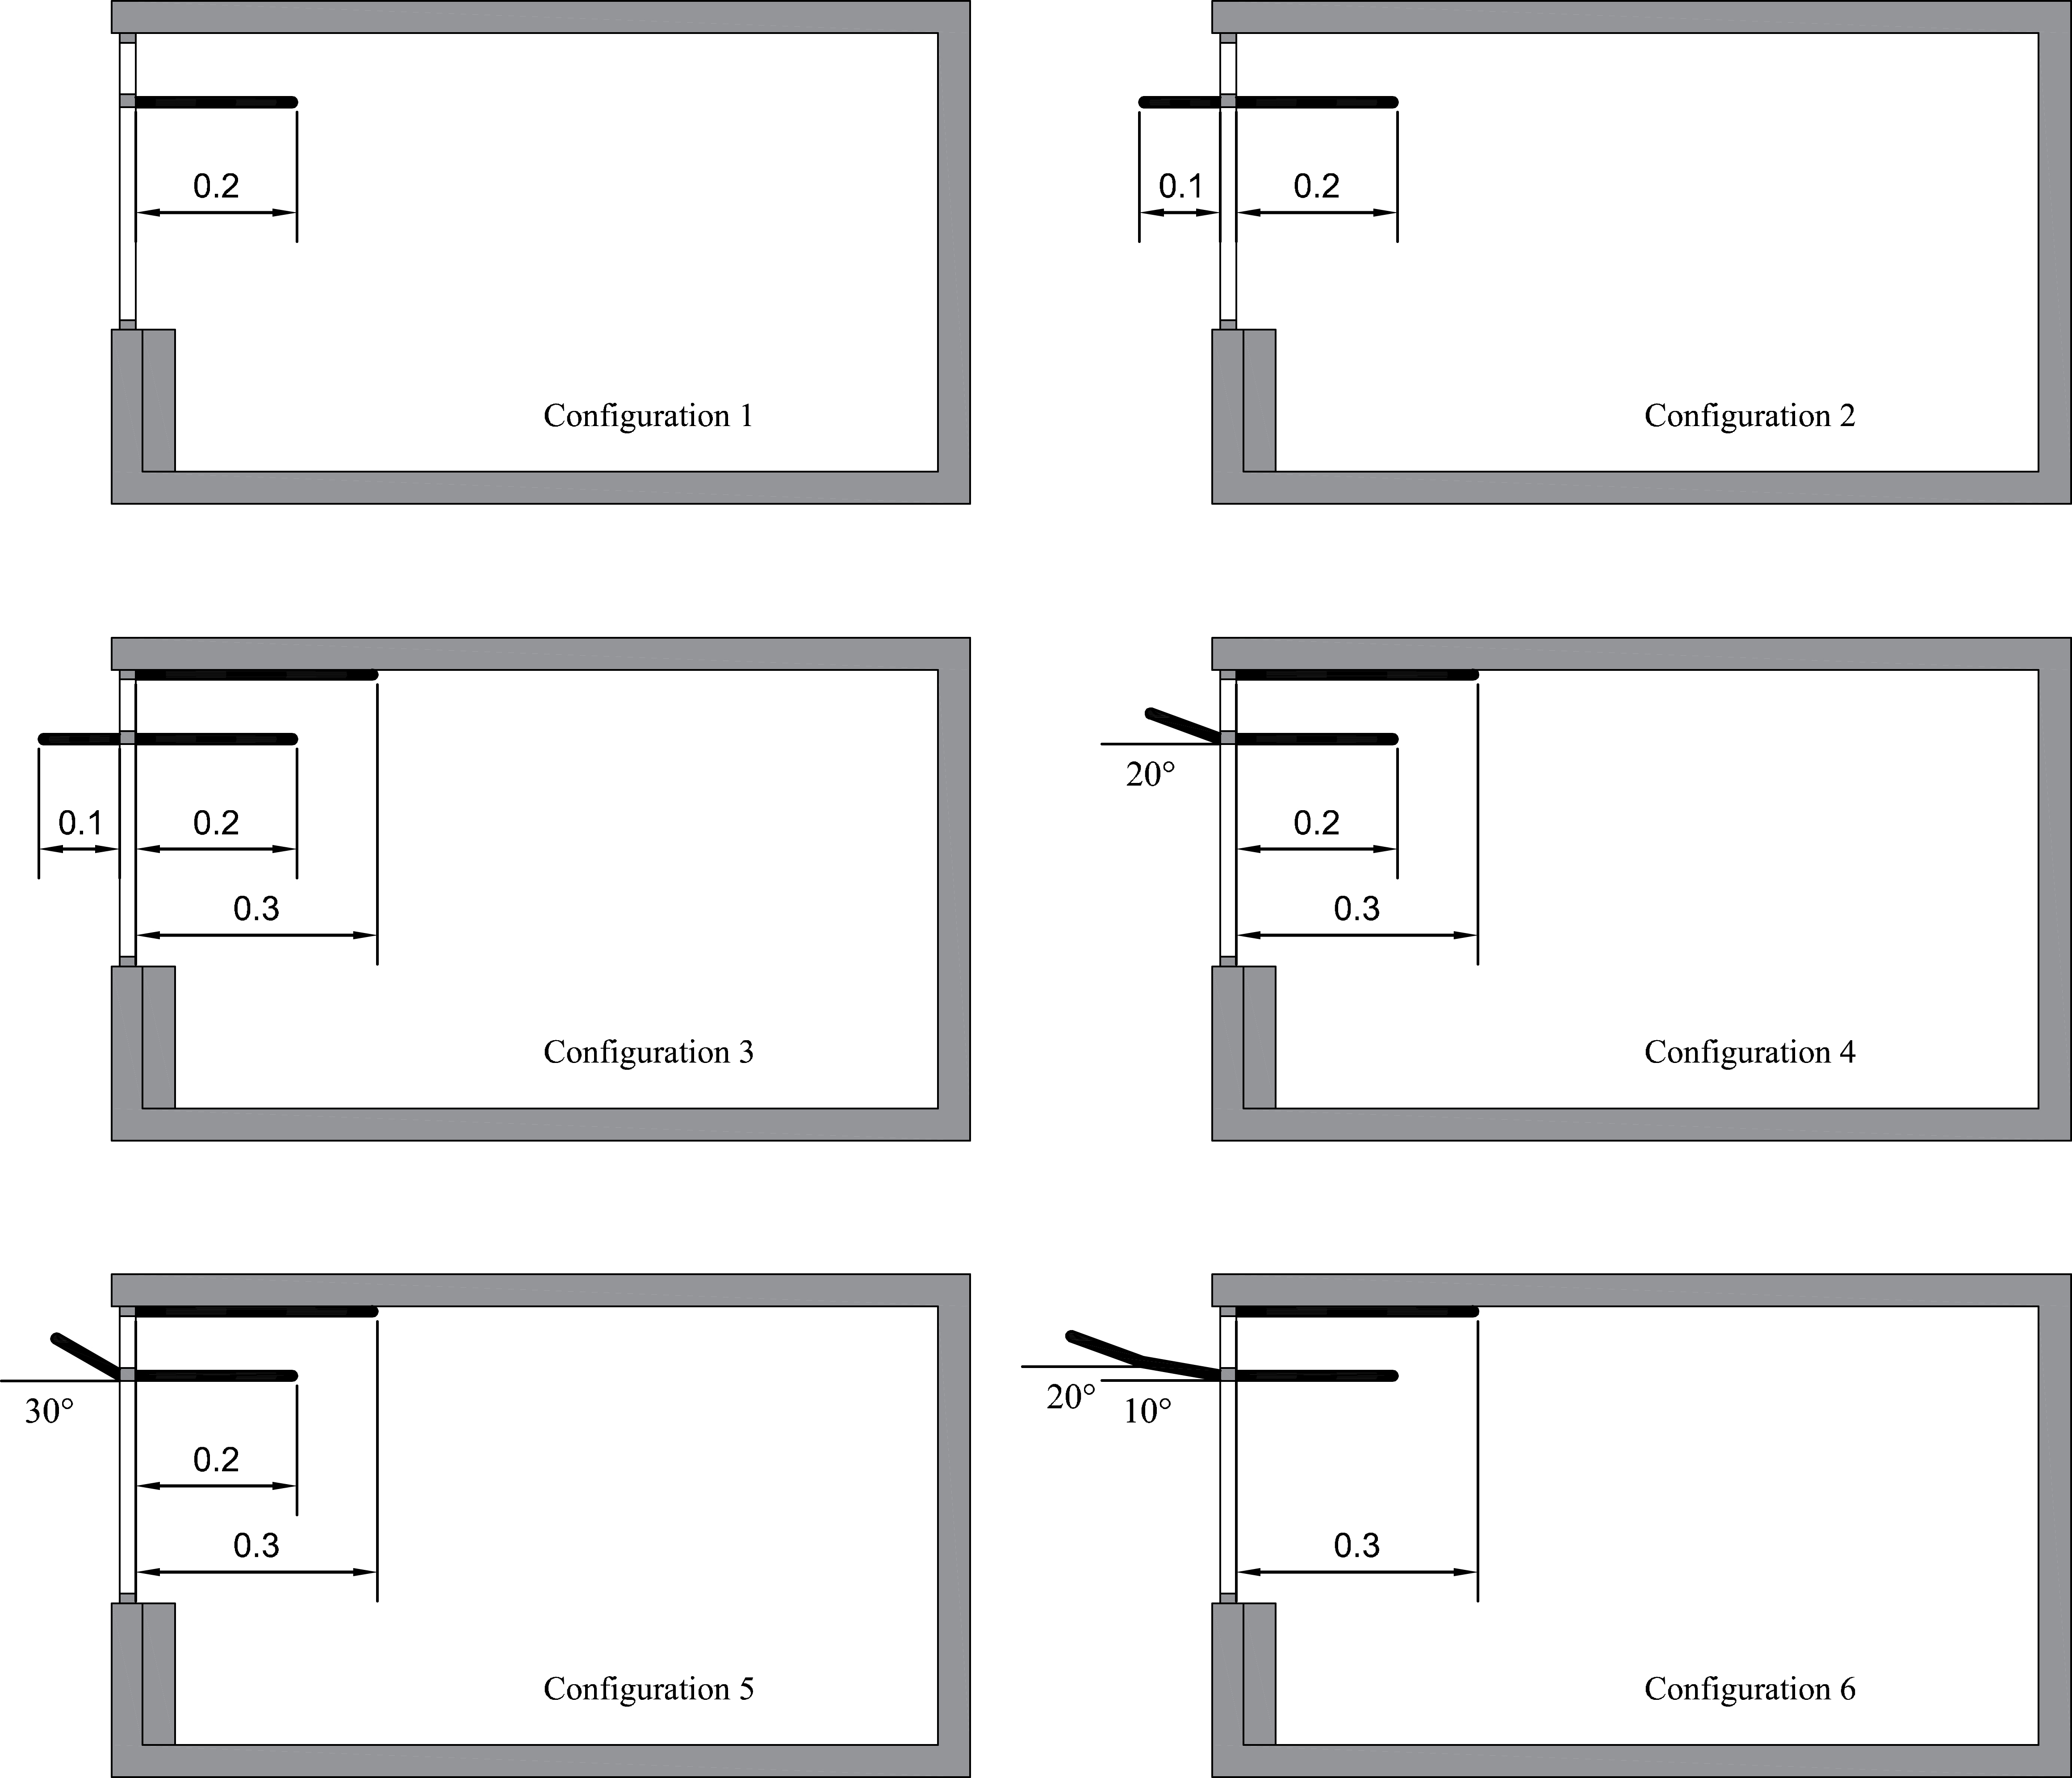 Figure 5
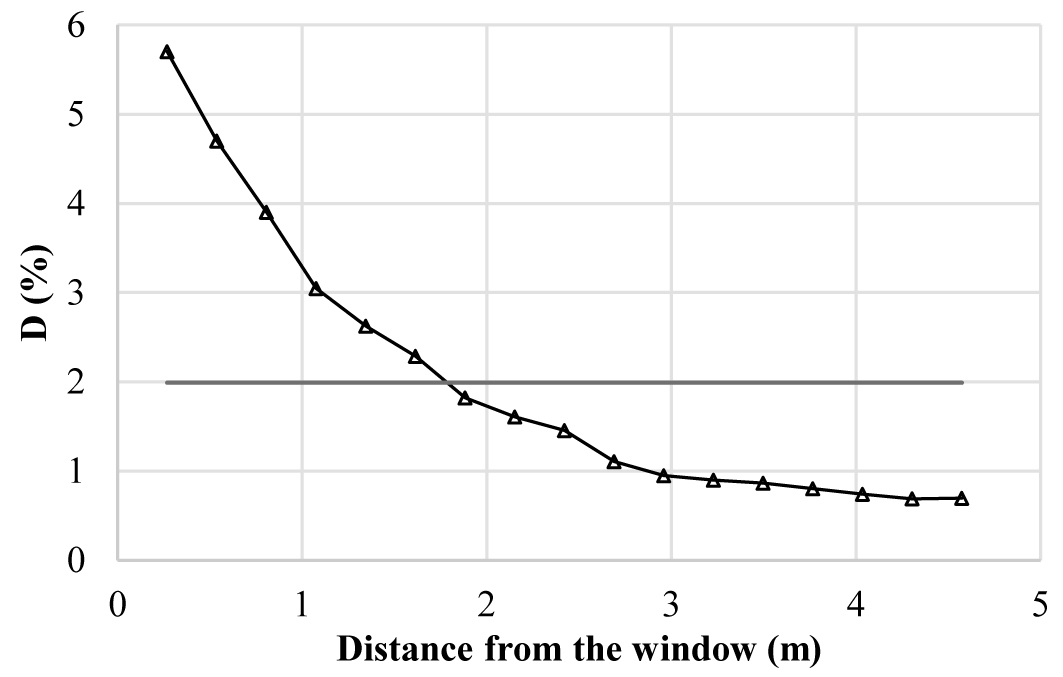 Figure 6
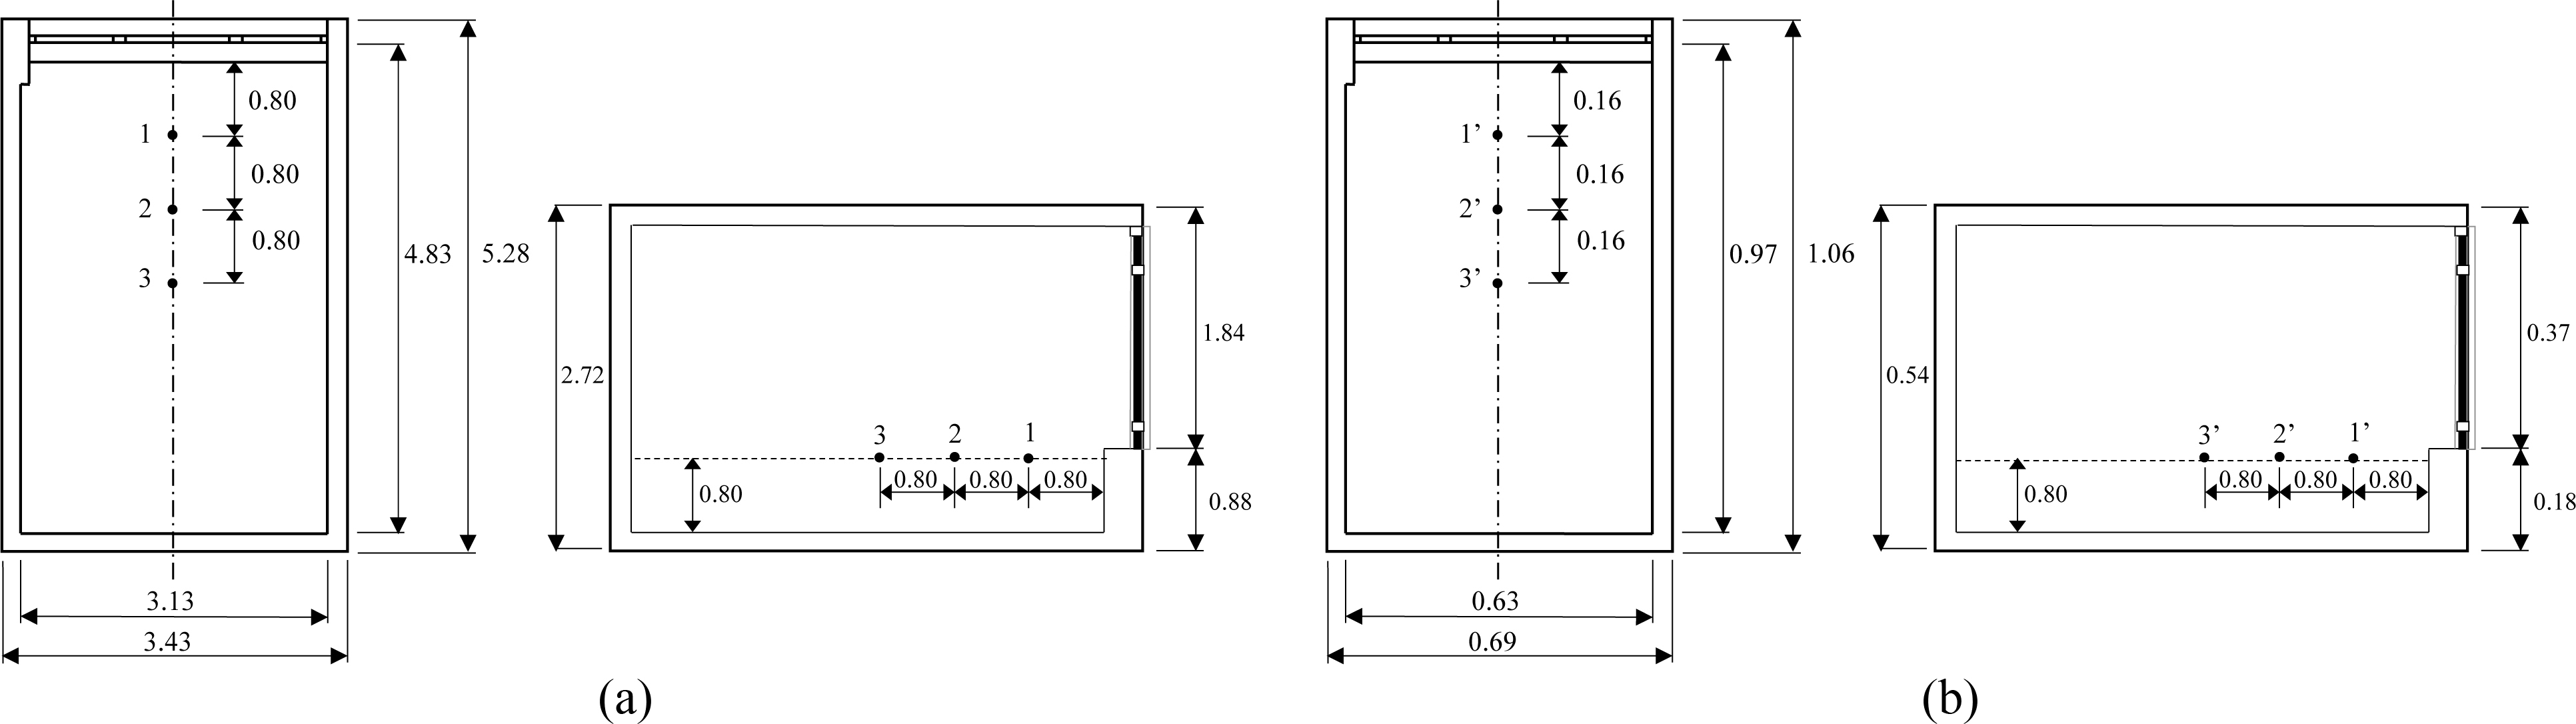 Figure 7
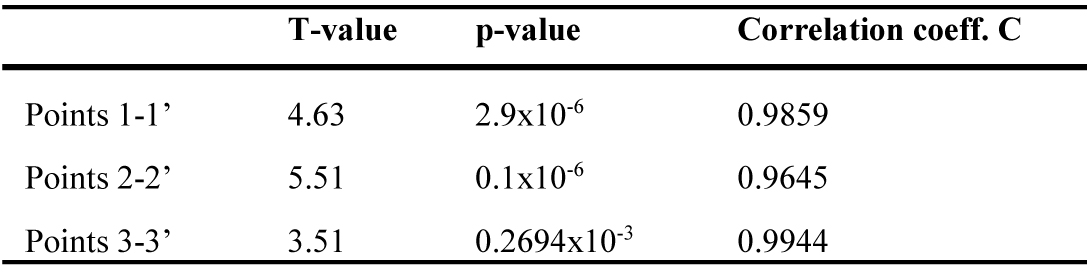 Table 3
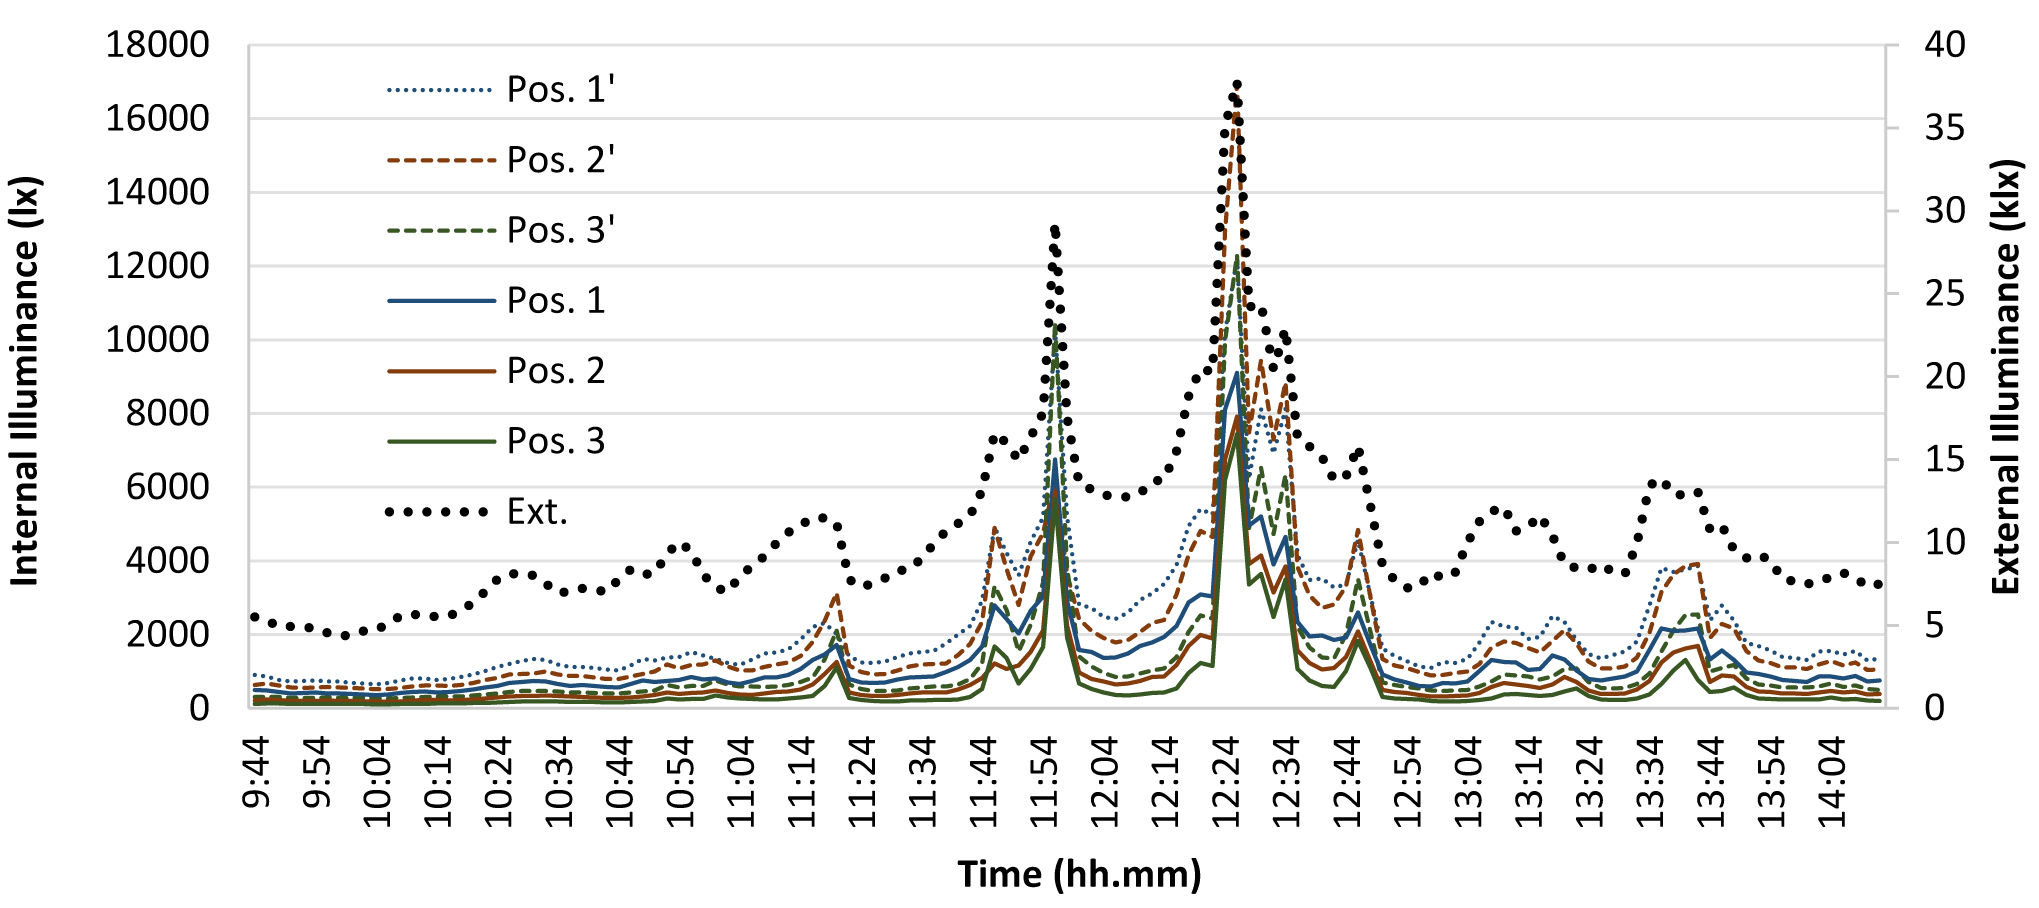 Figure 8
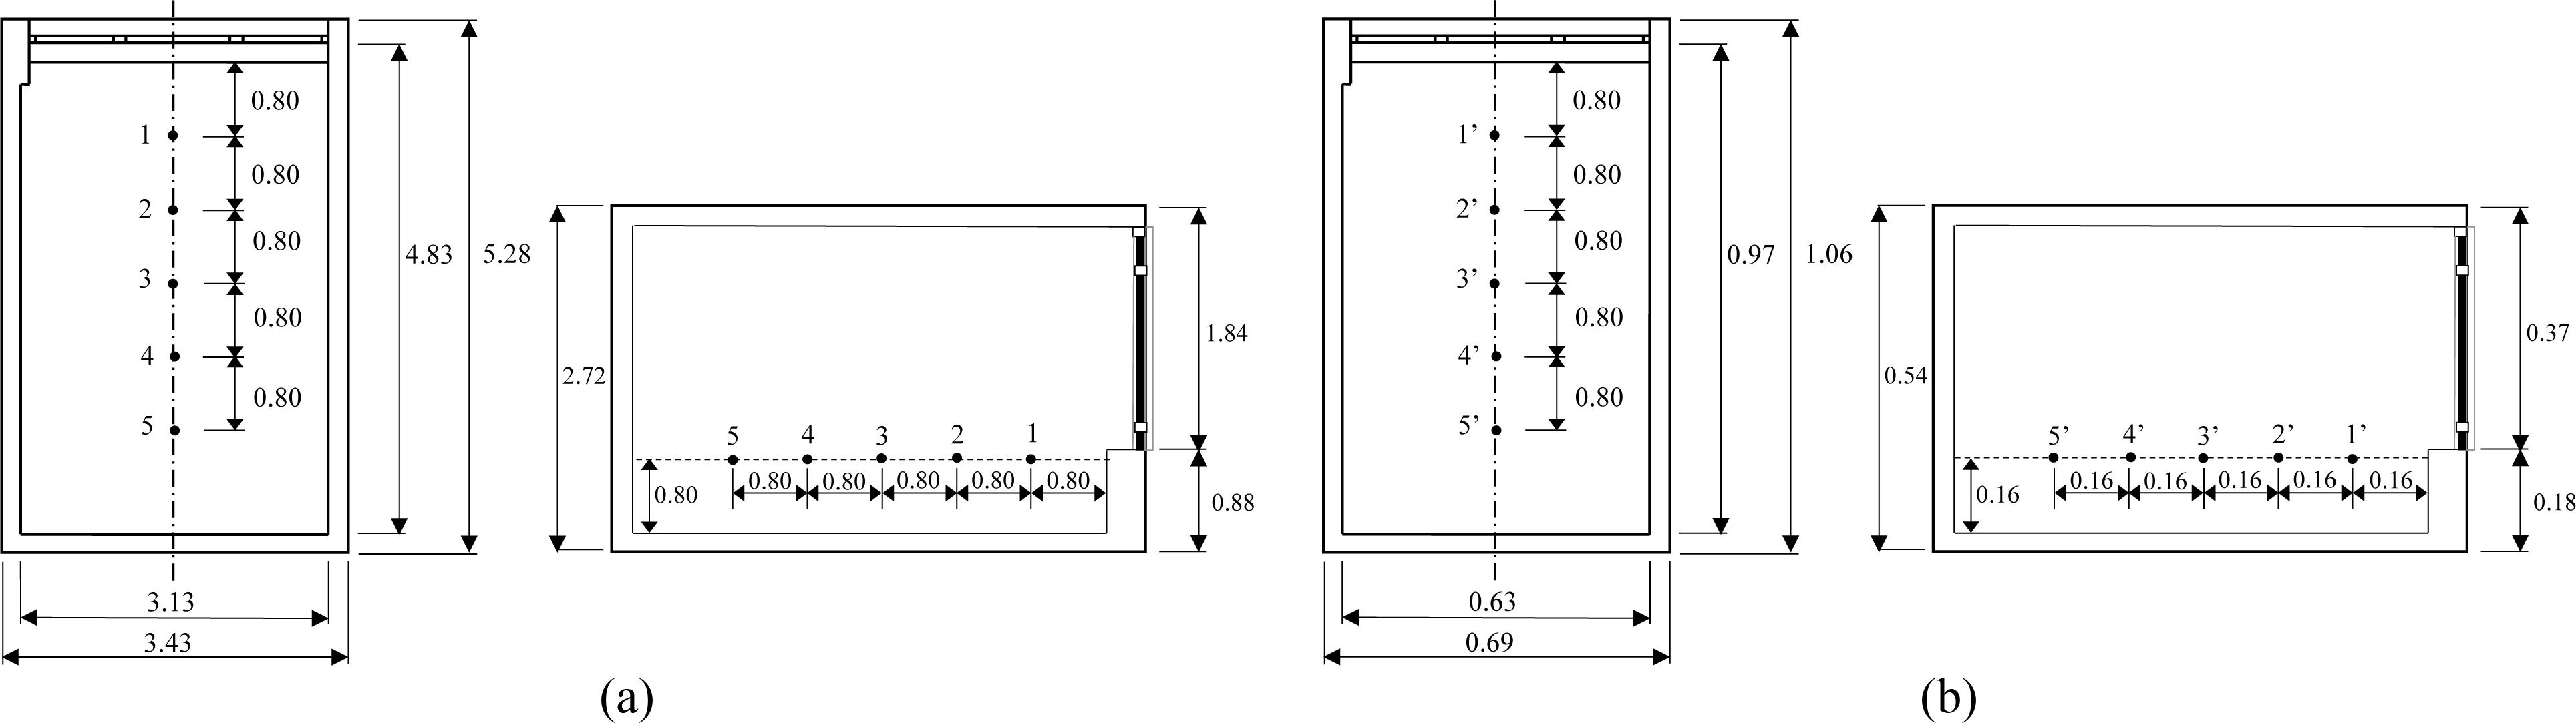 Figure 9
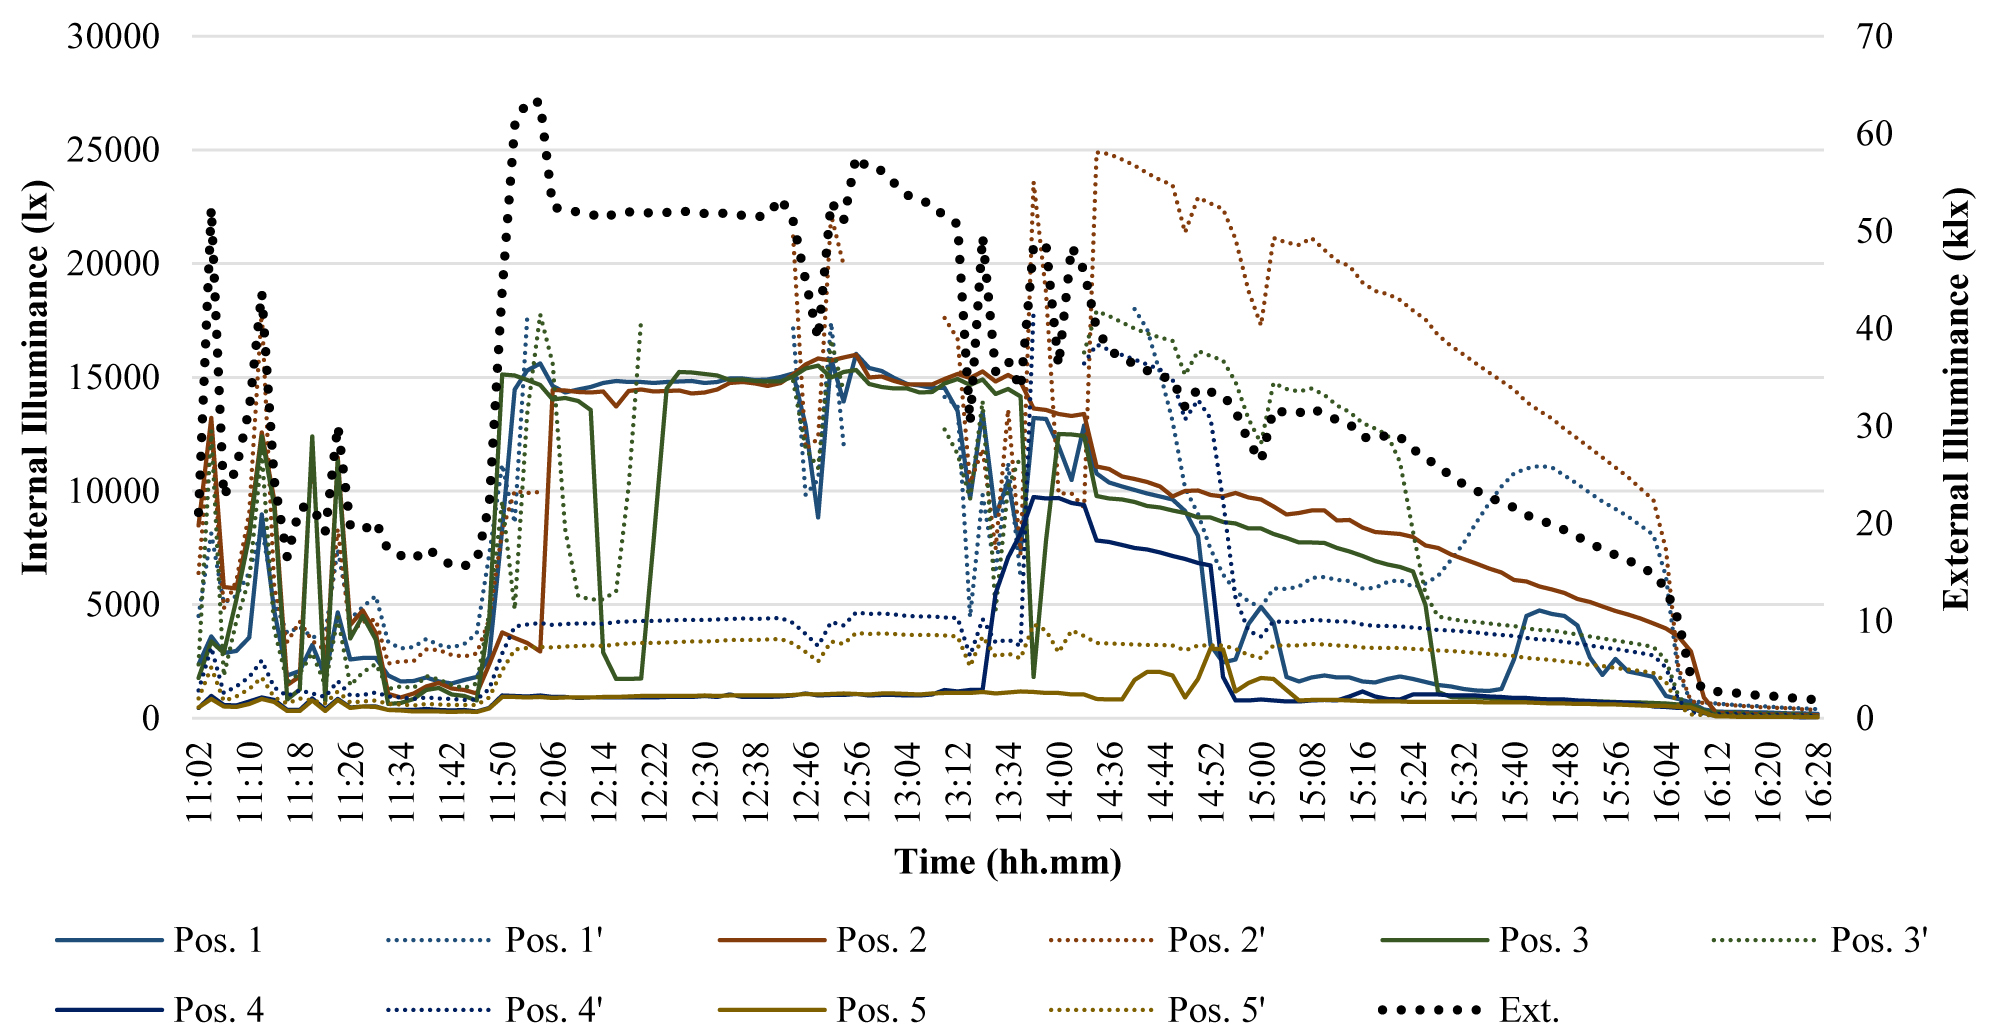 Figure 10
 Figure 11
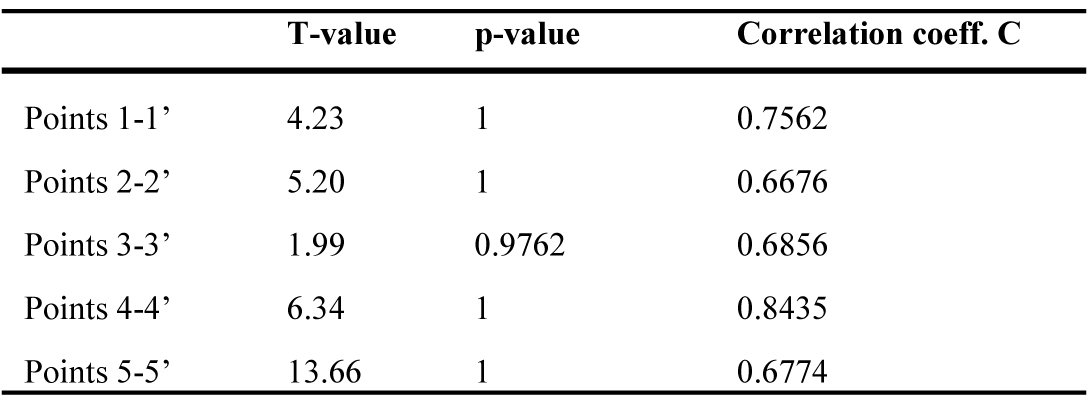 Table 4
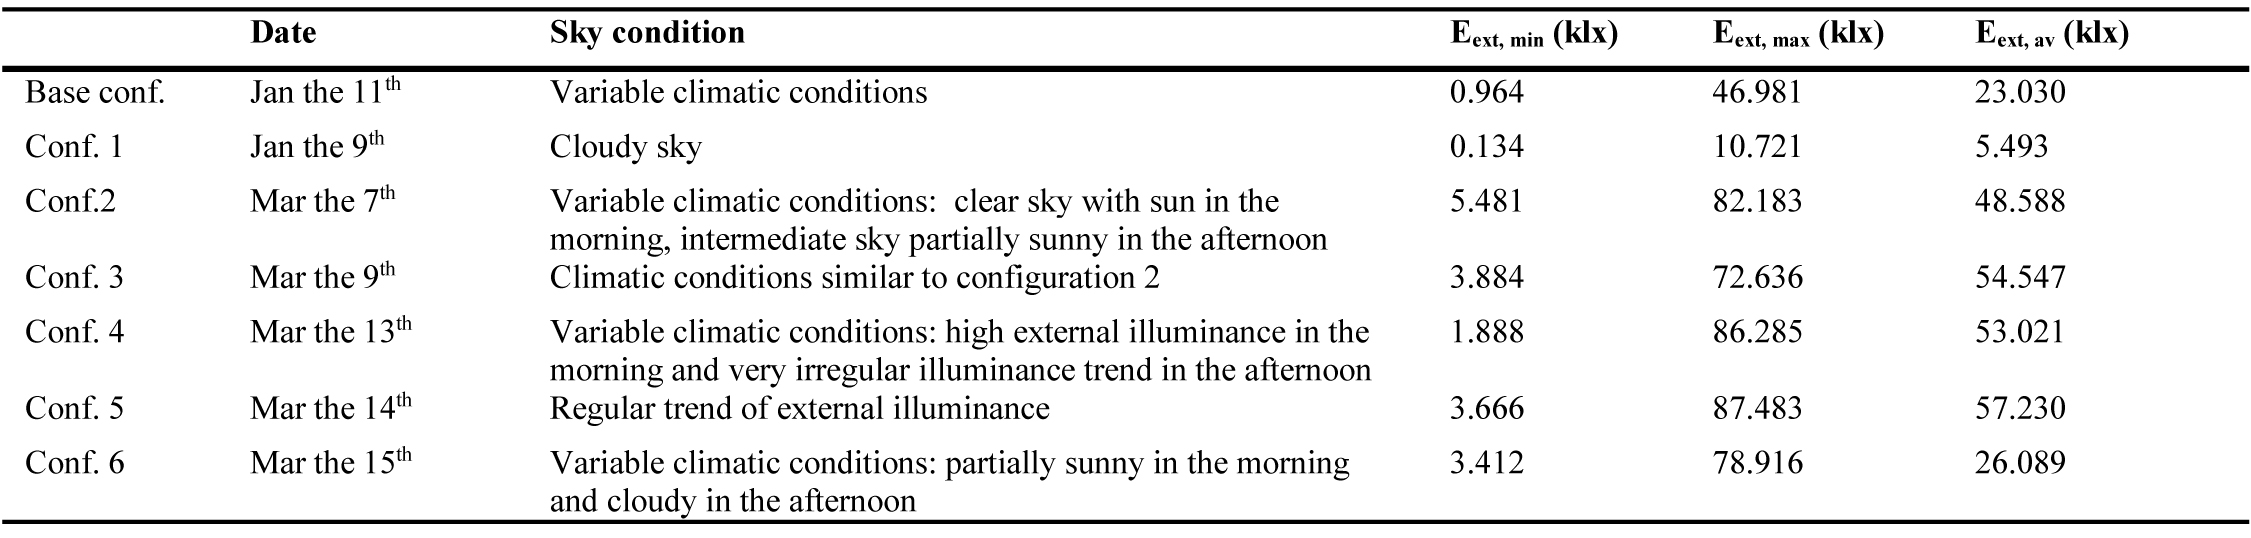 Table 5
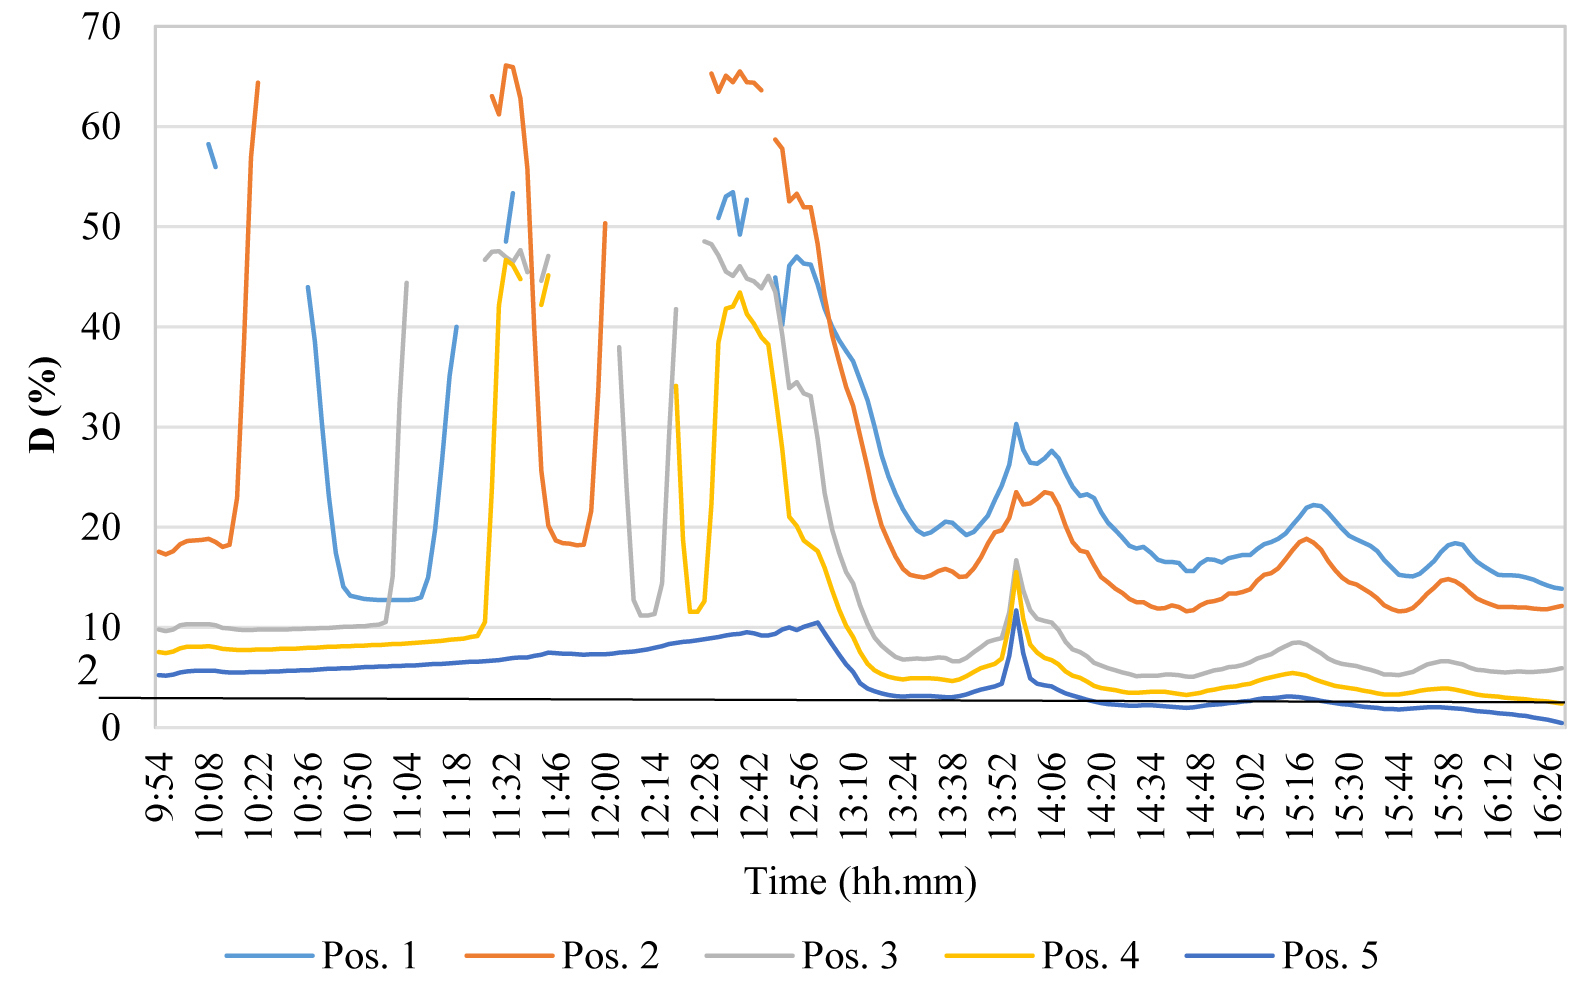 Figure 12
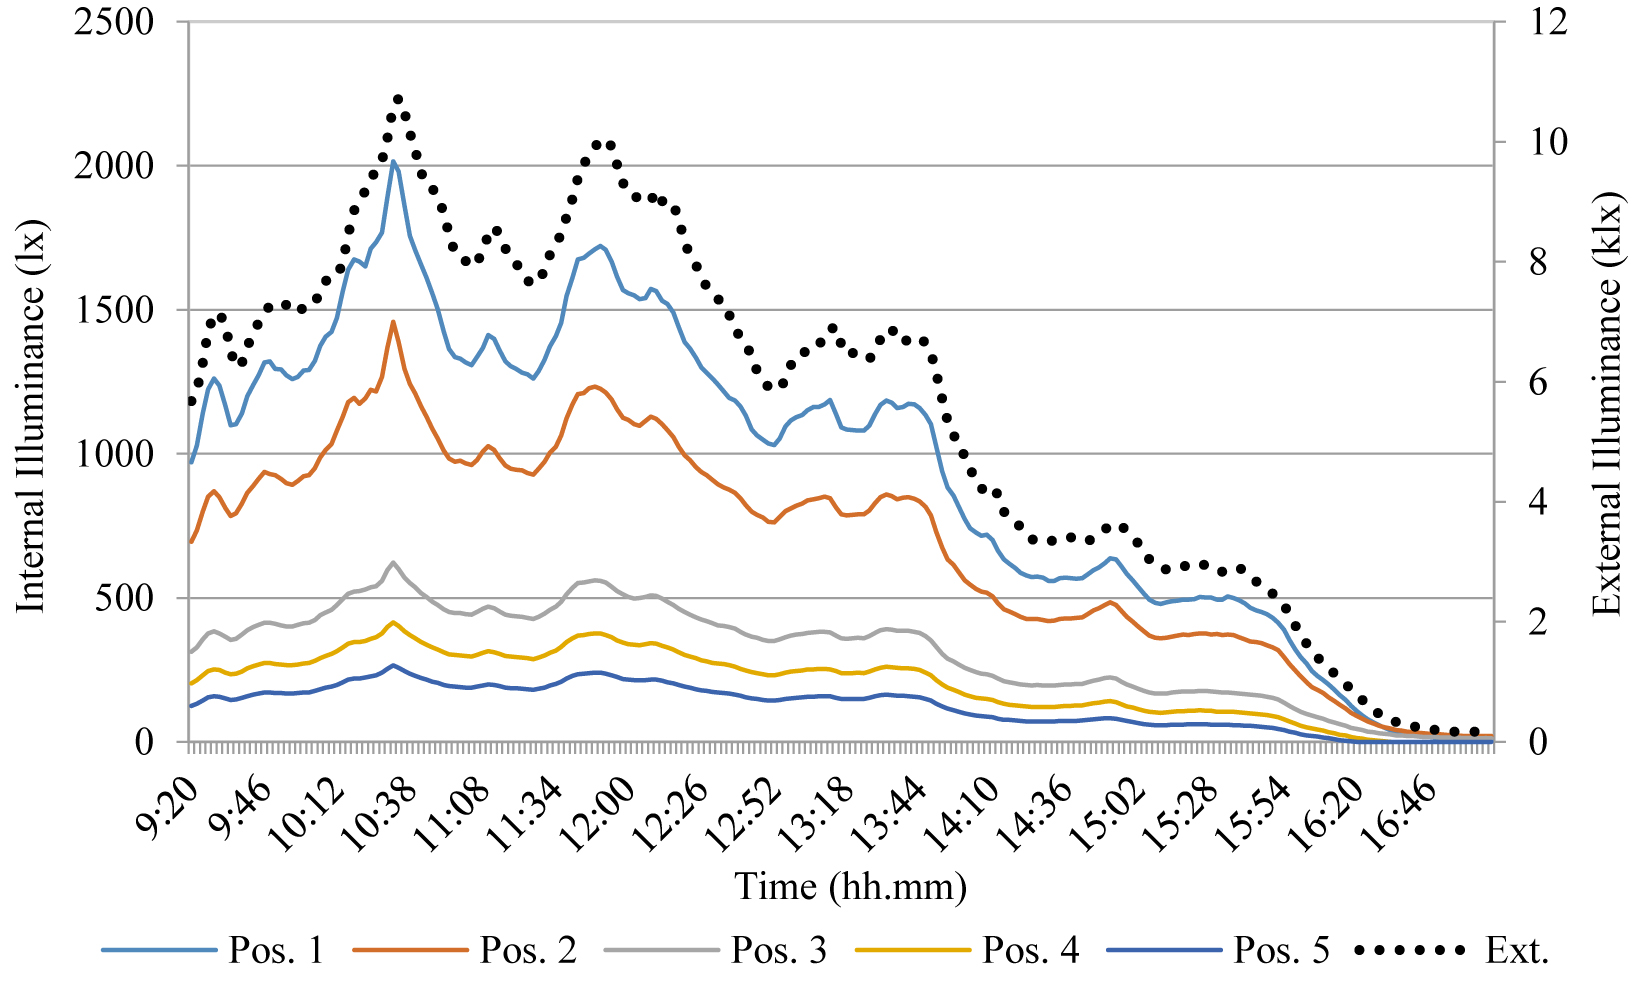 Figure 13
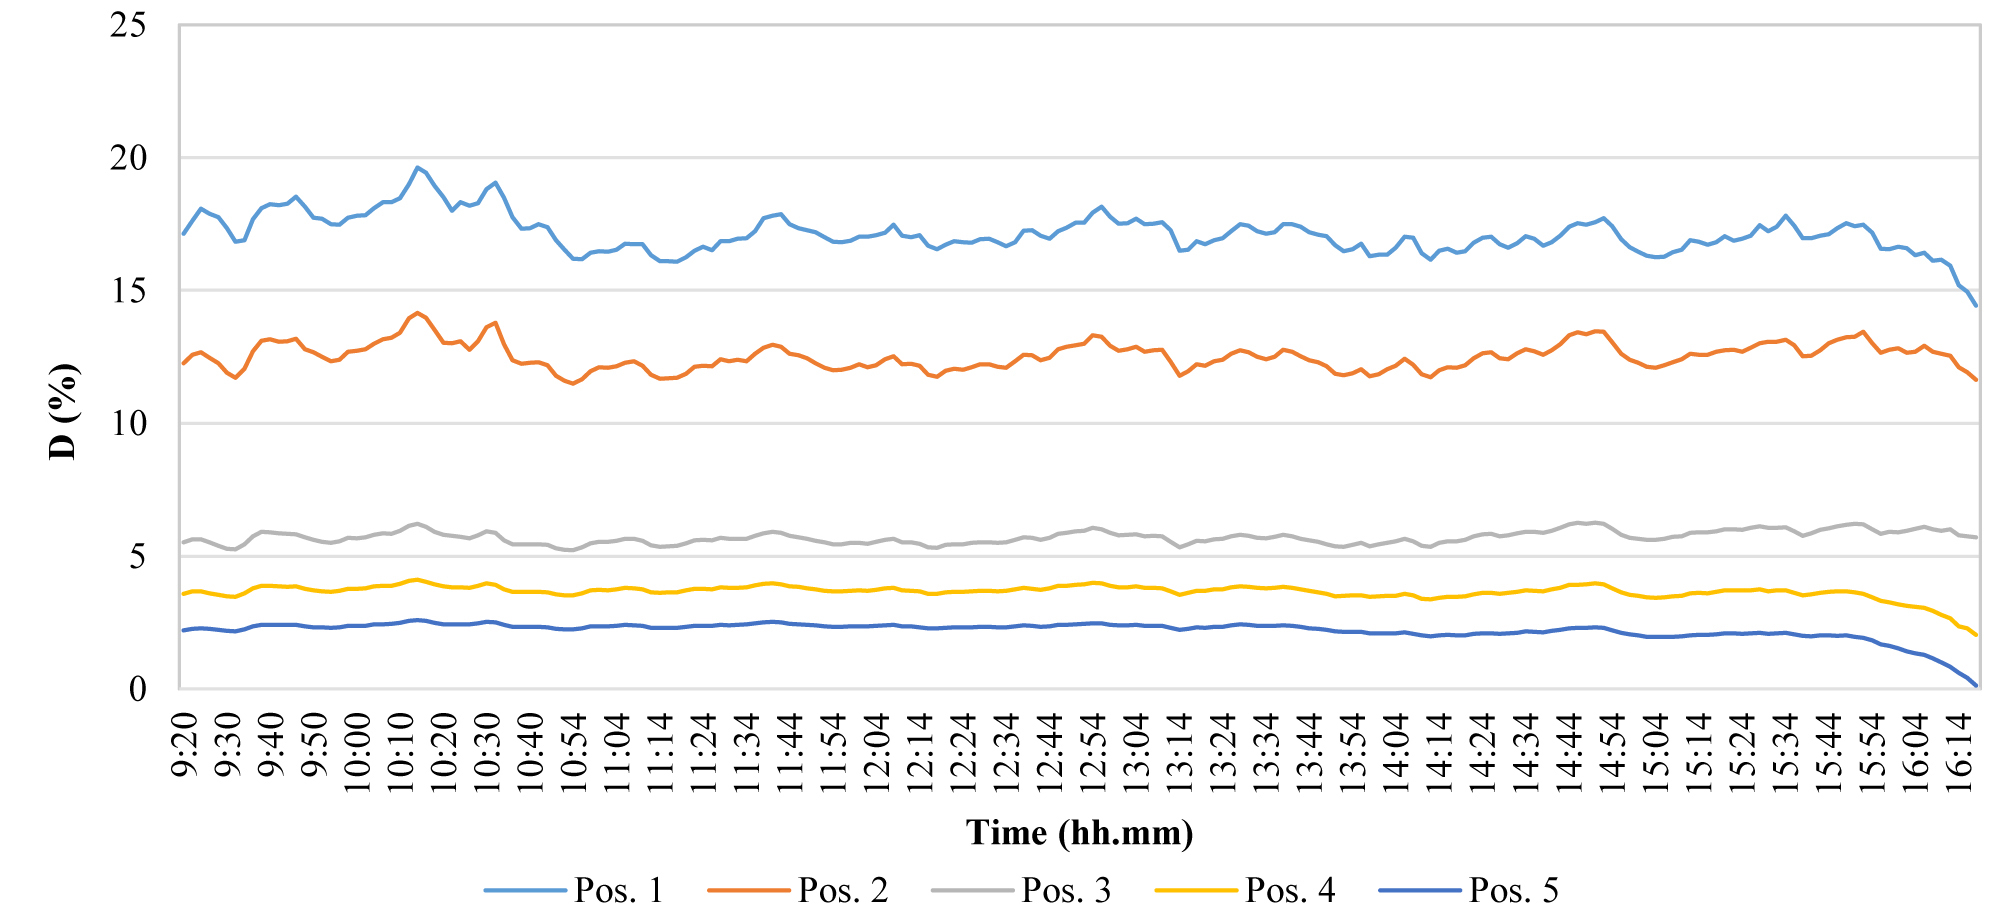 Figure 14
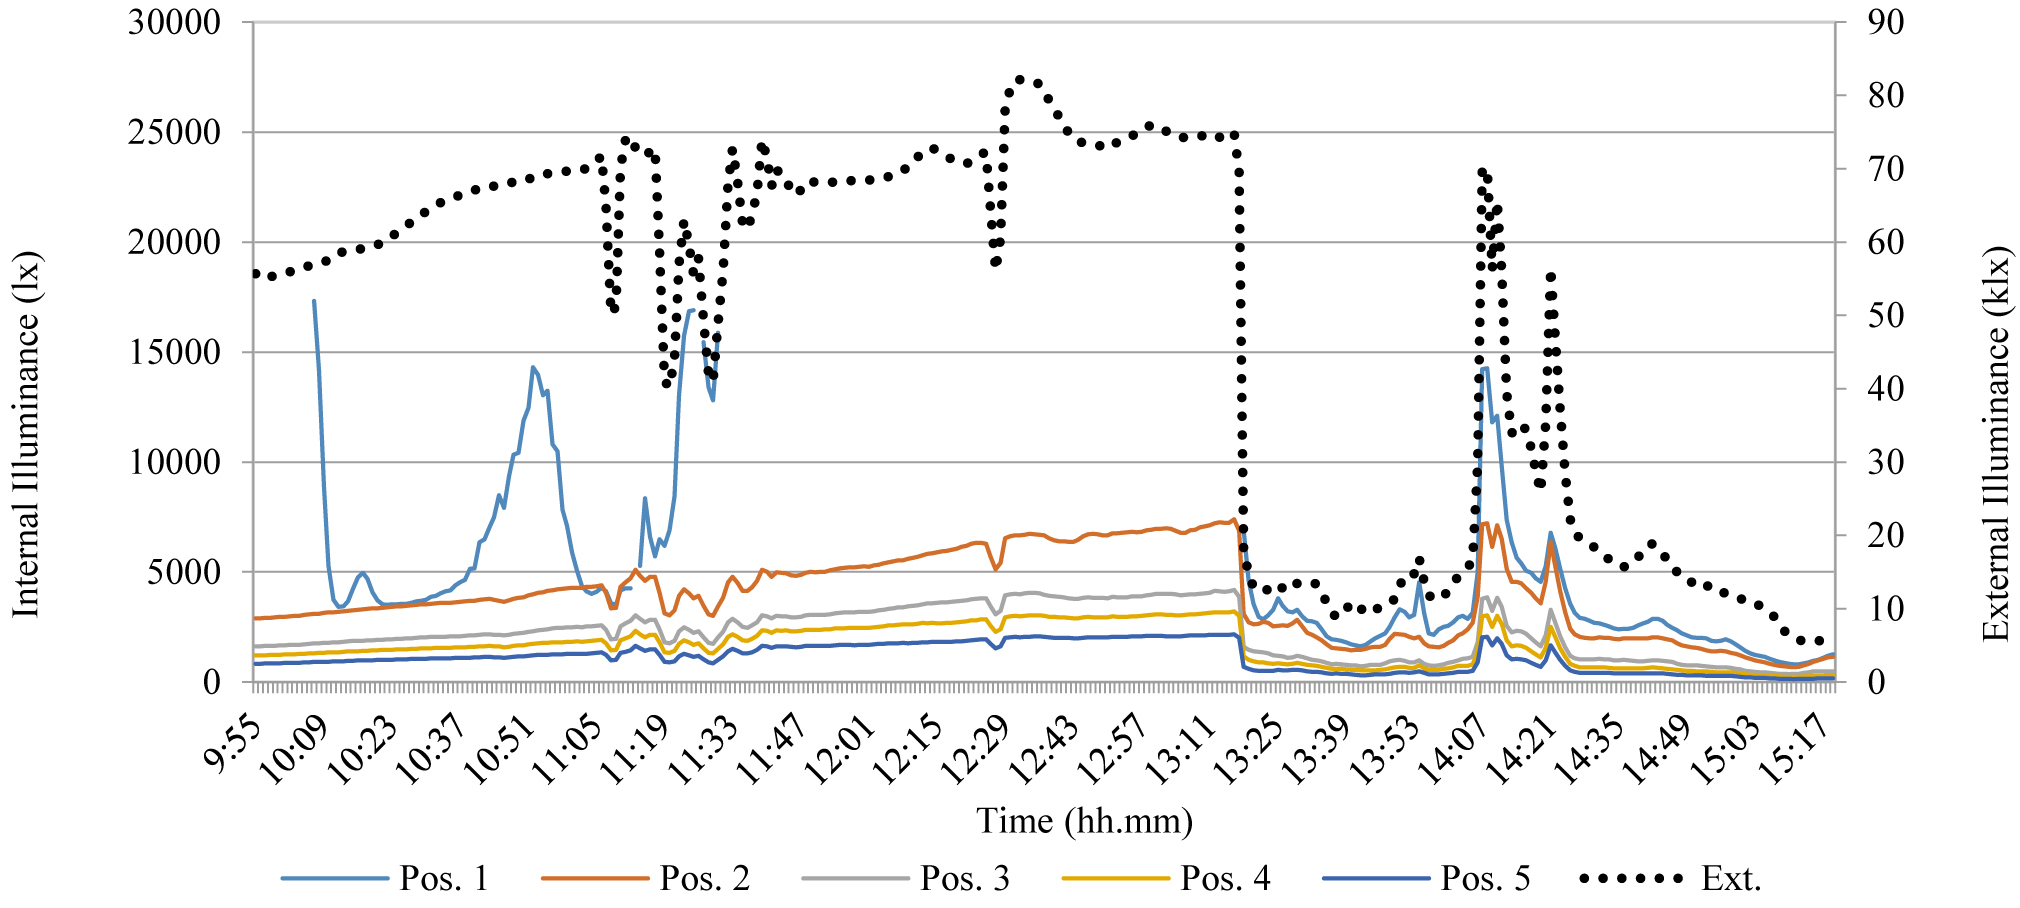 Figure 15
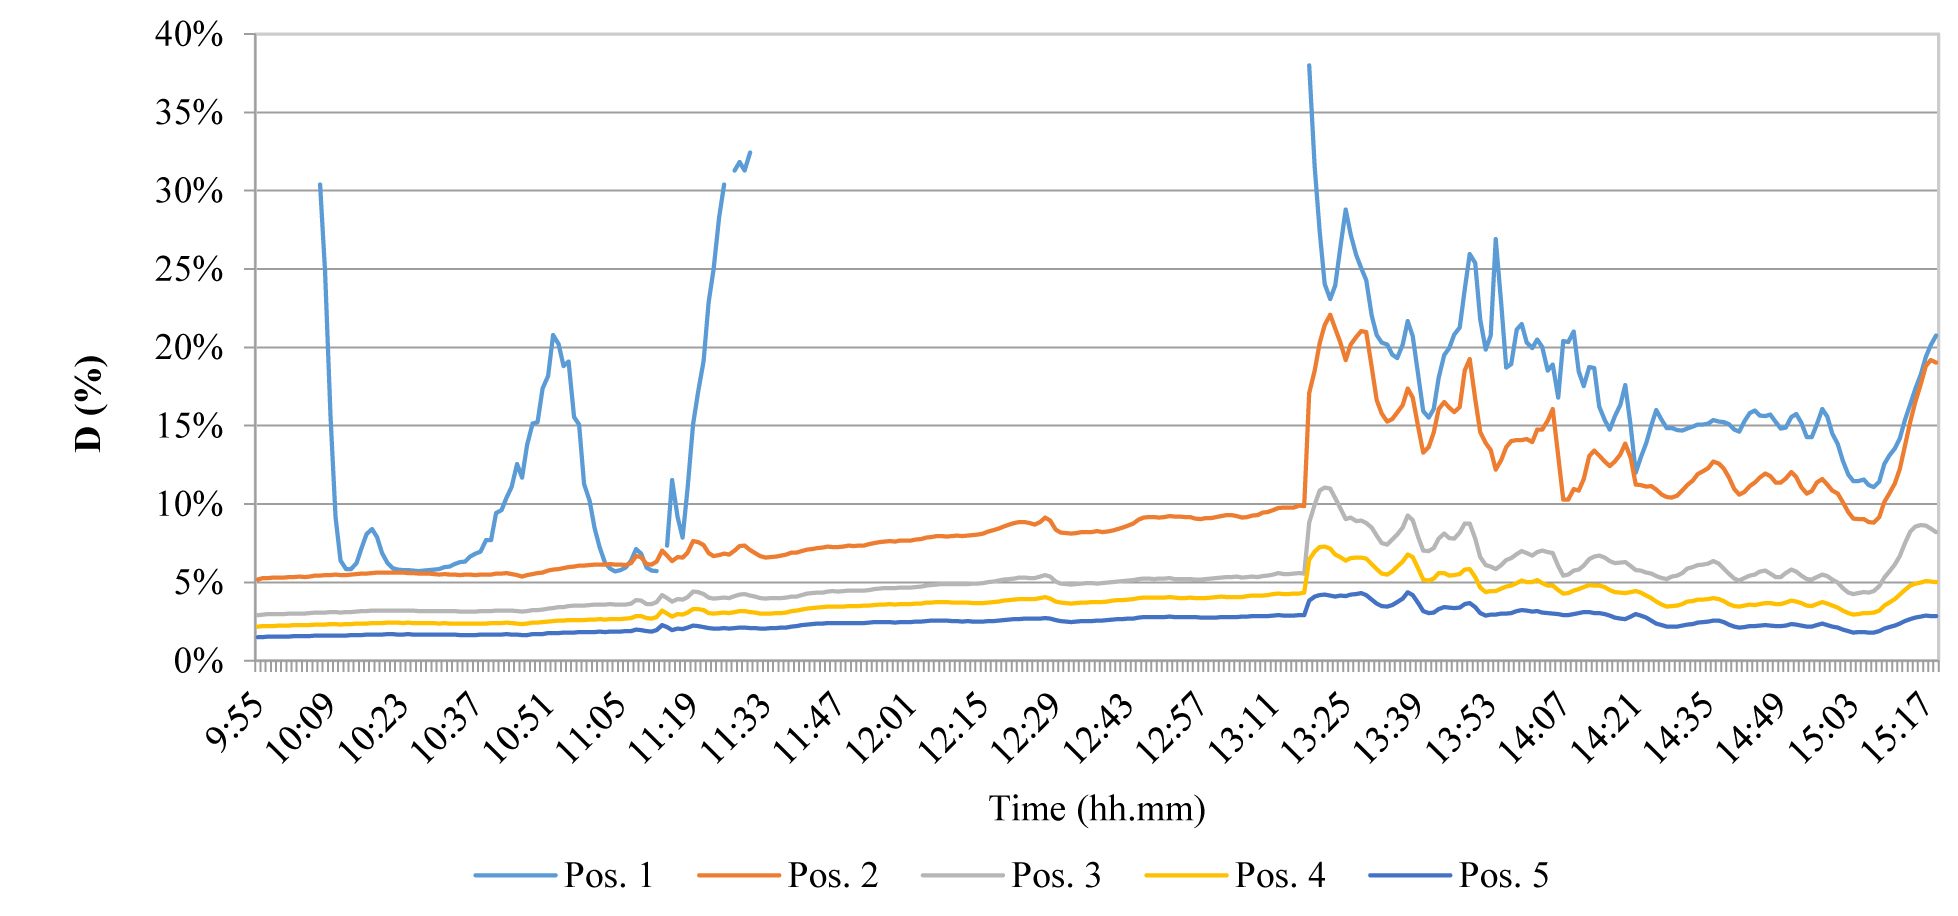 Figure 16
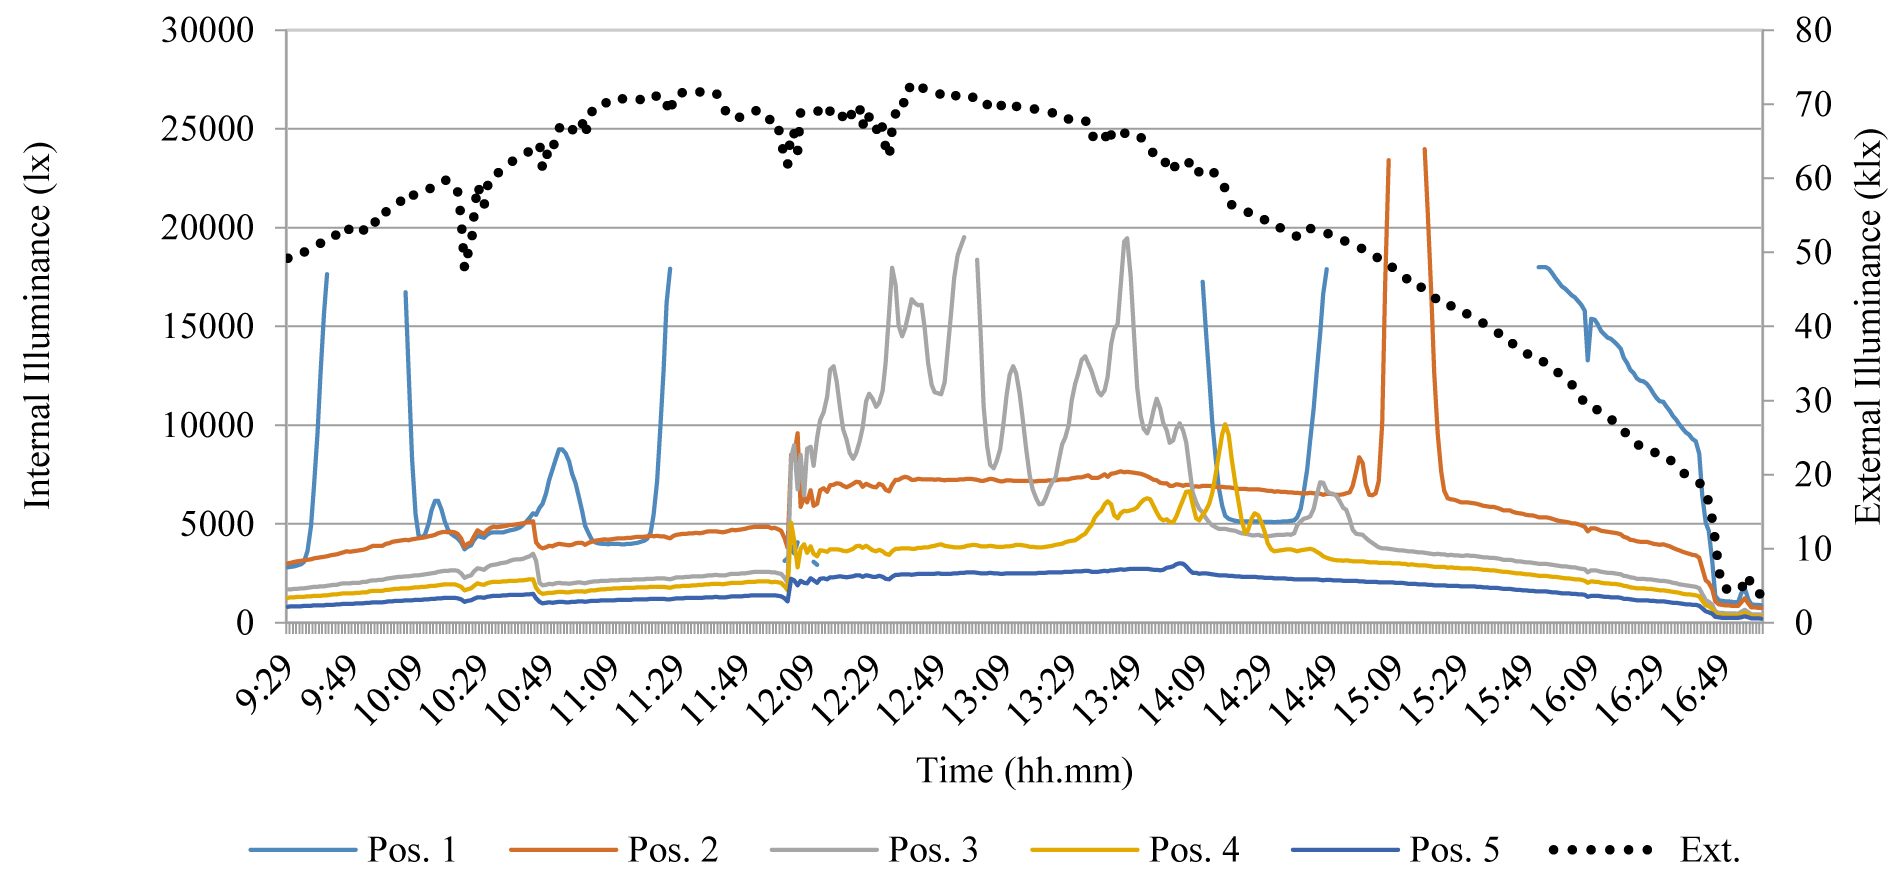 Figure 17
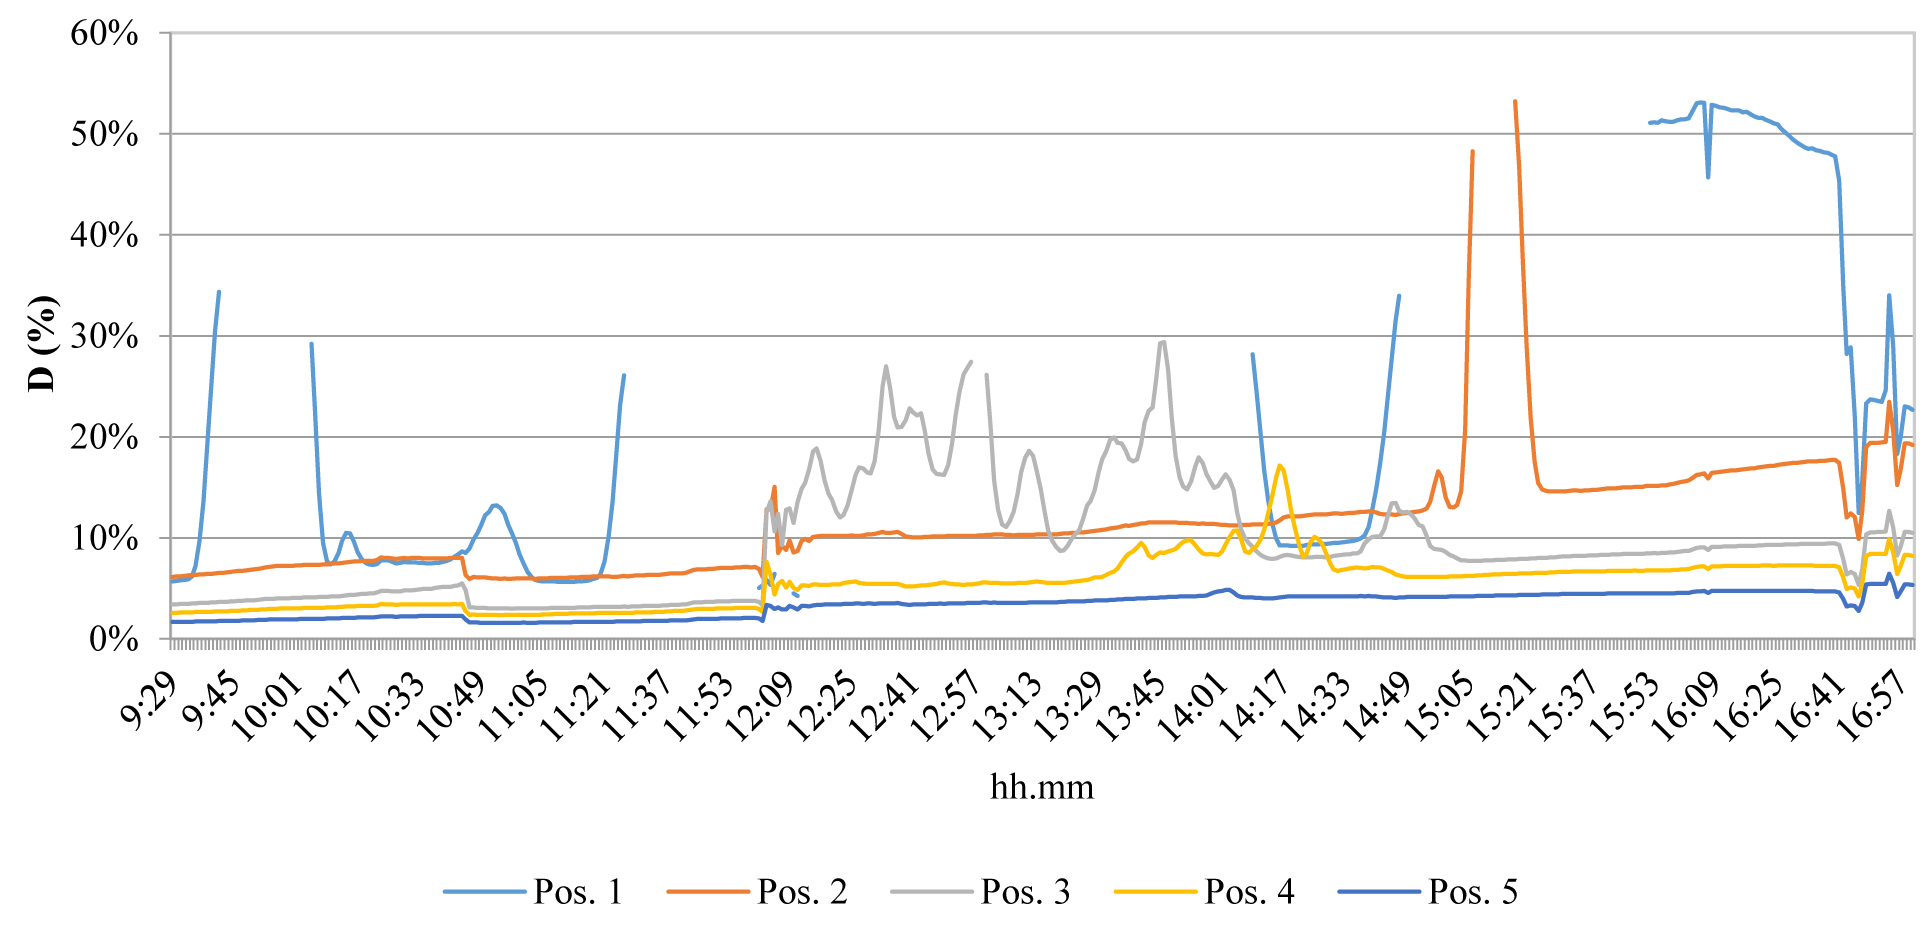 Figure 18
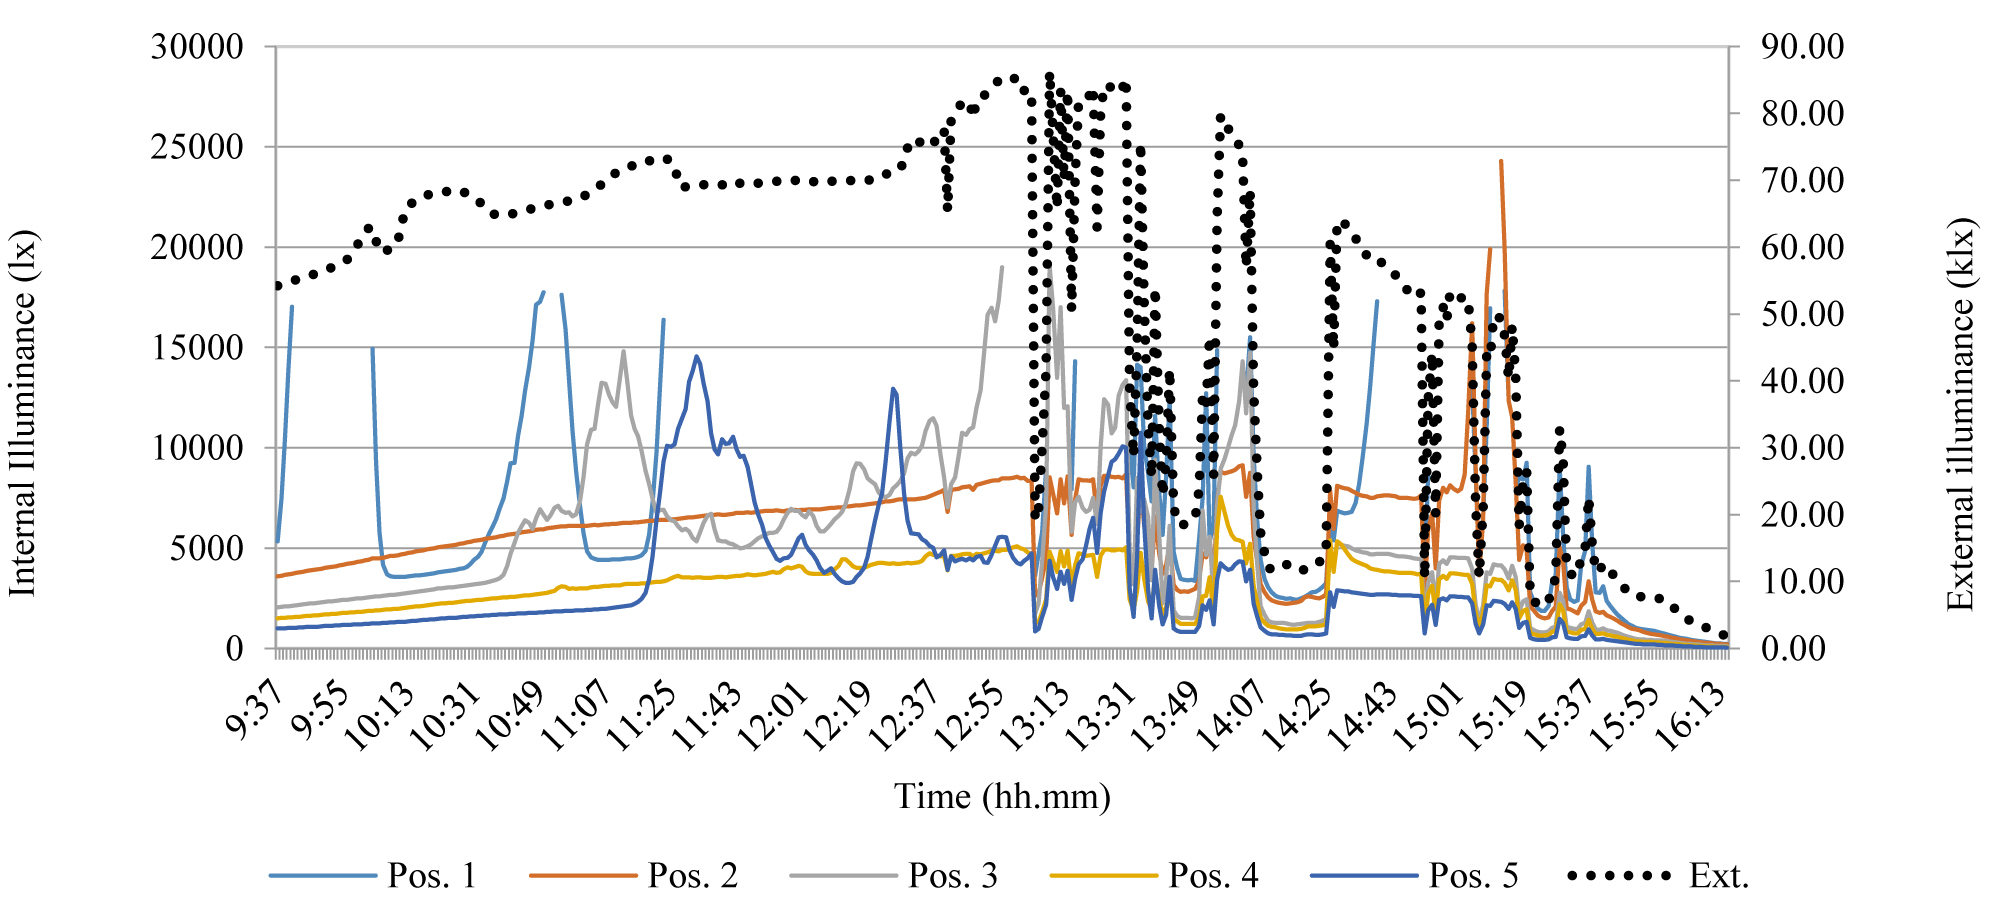 Figure 19
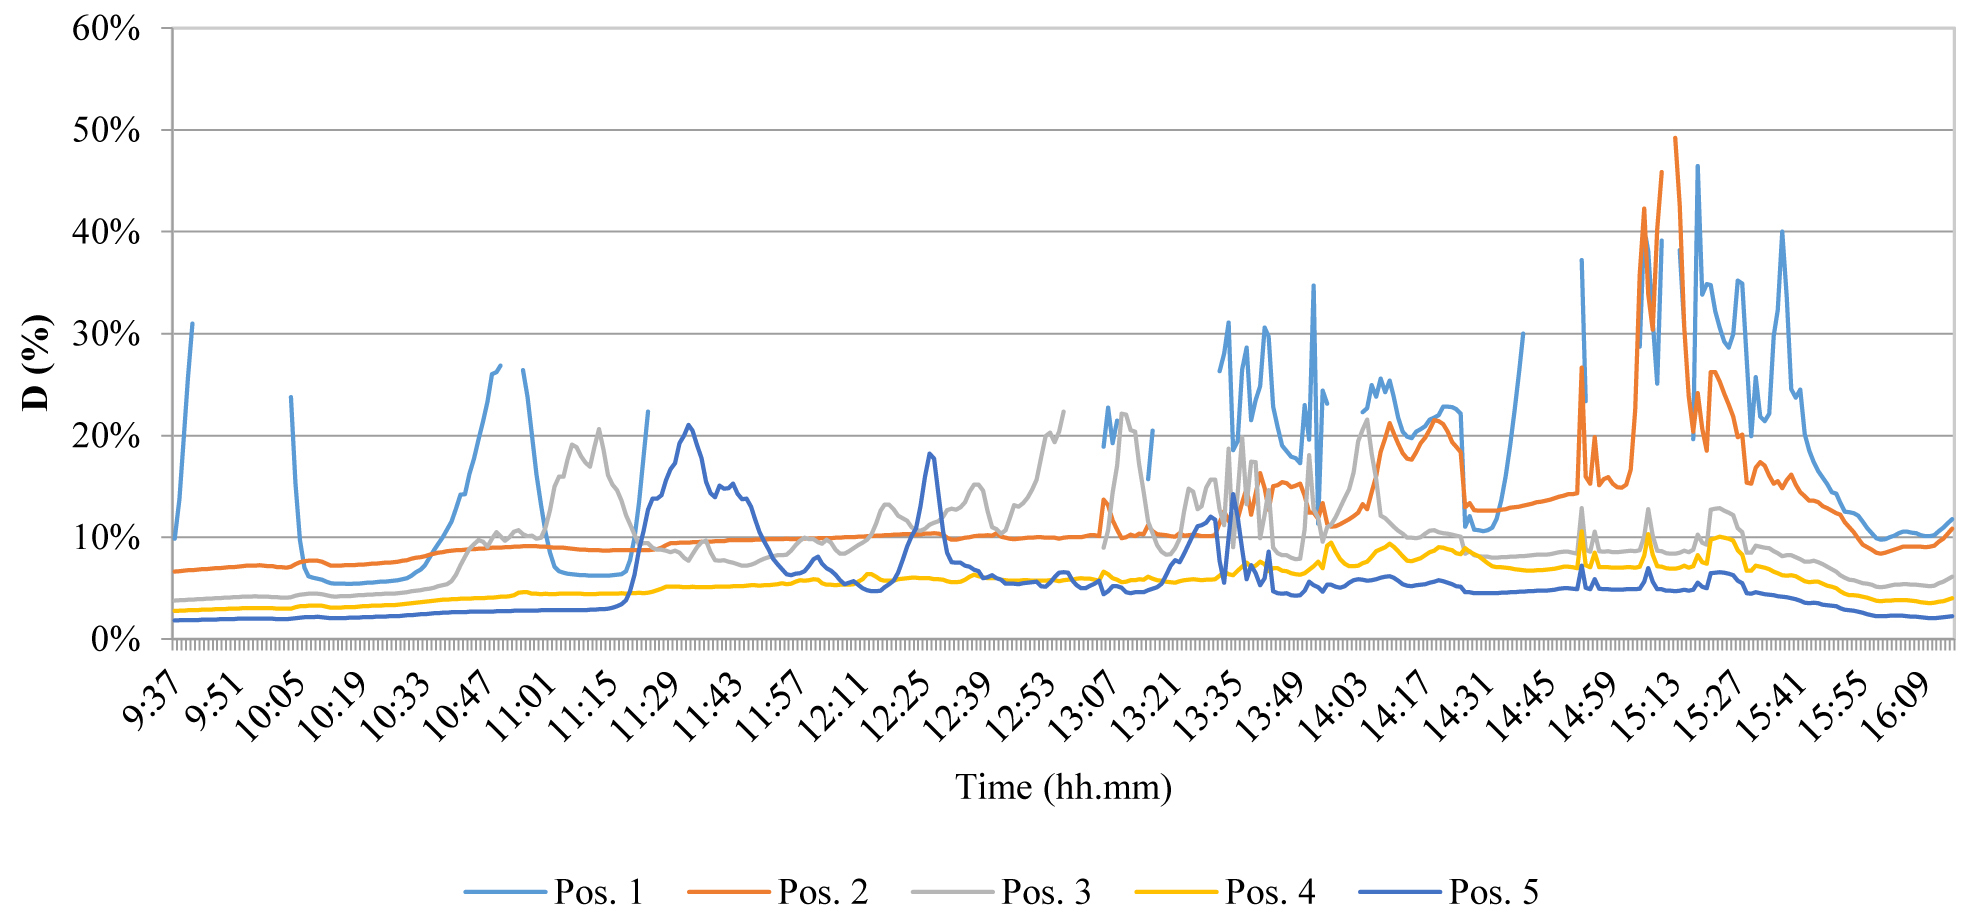 Figure 20
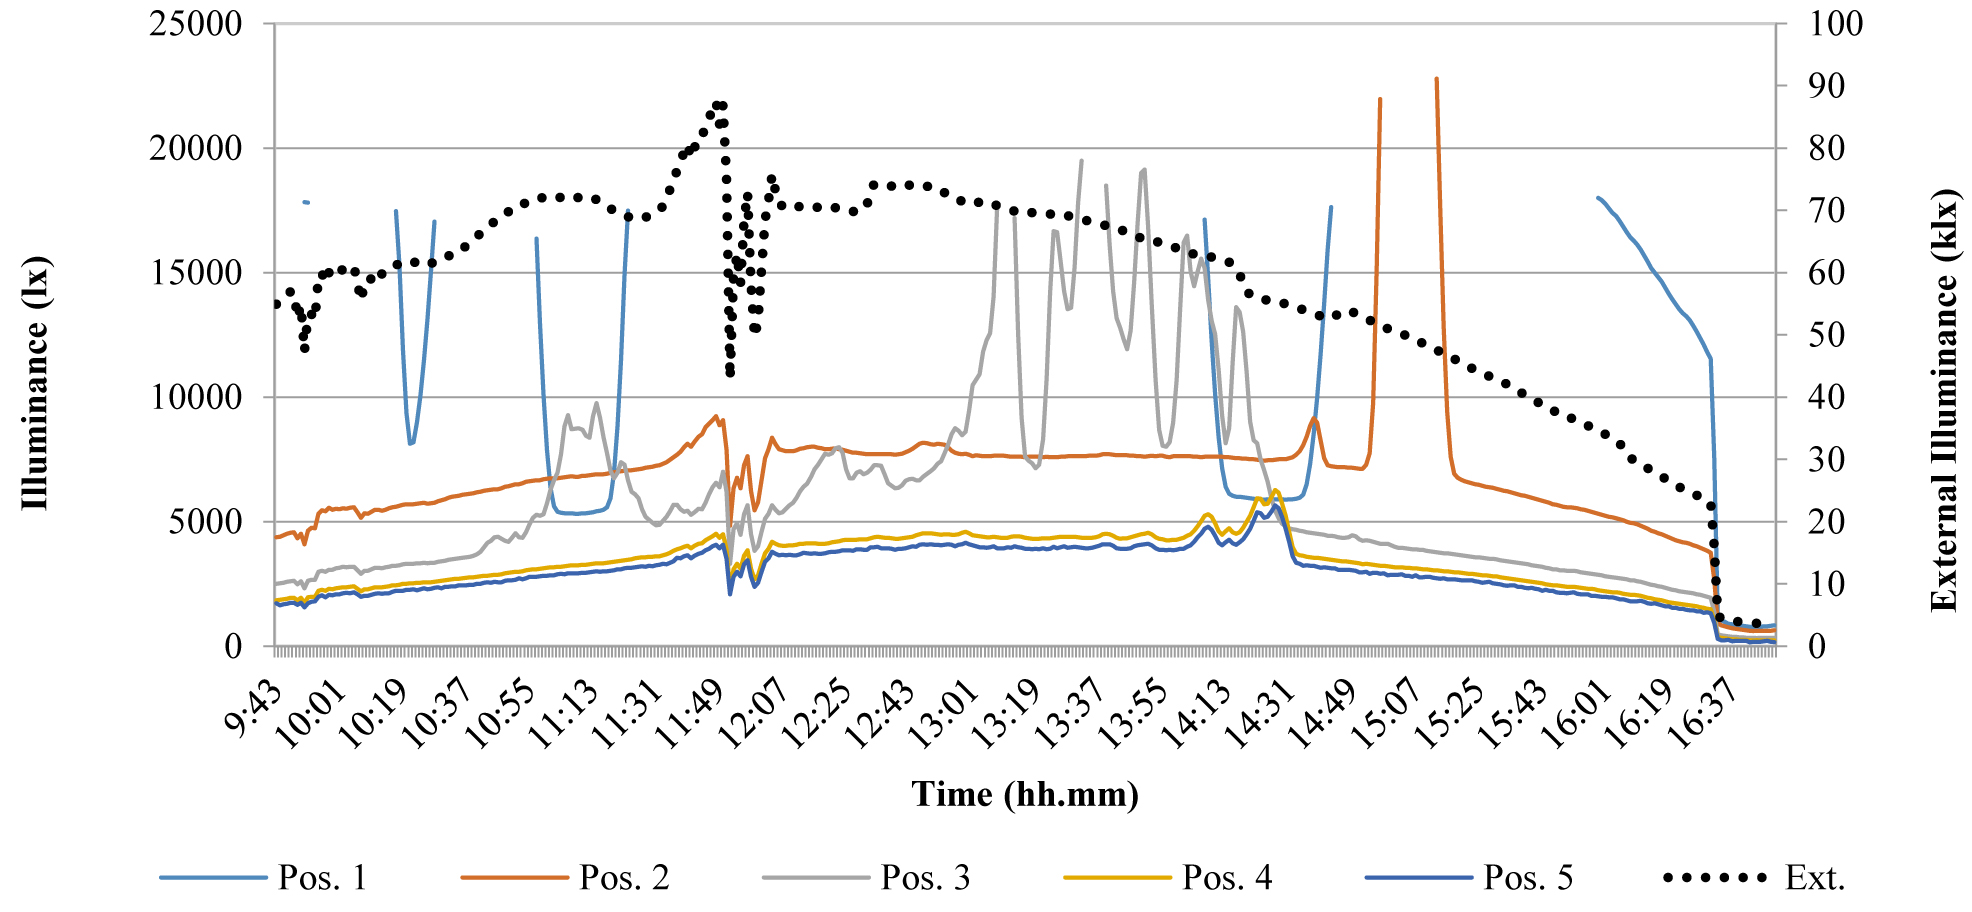 Figure 21
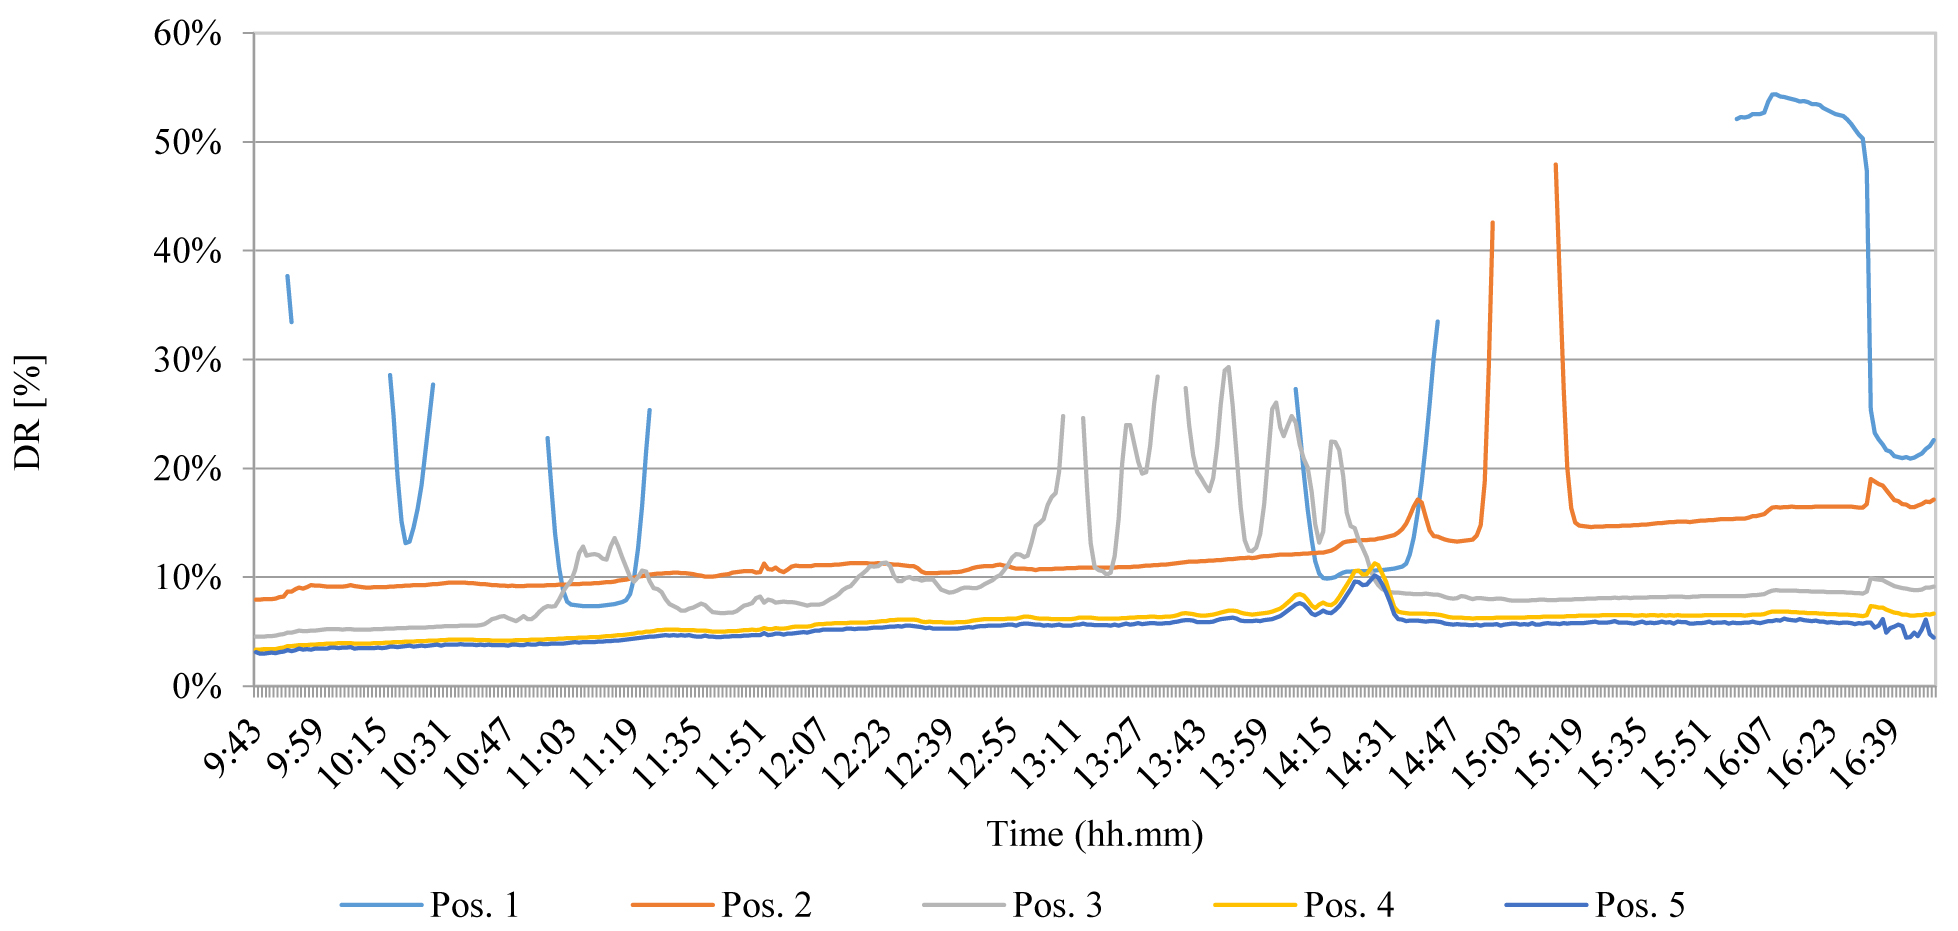 Figure 22
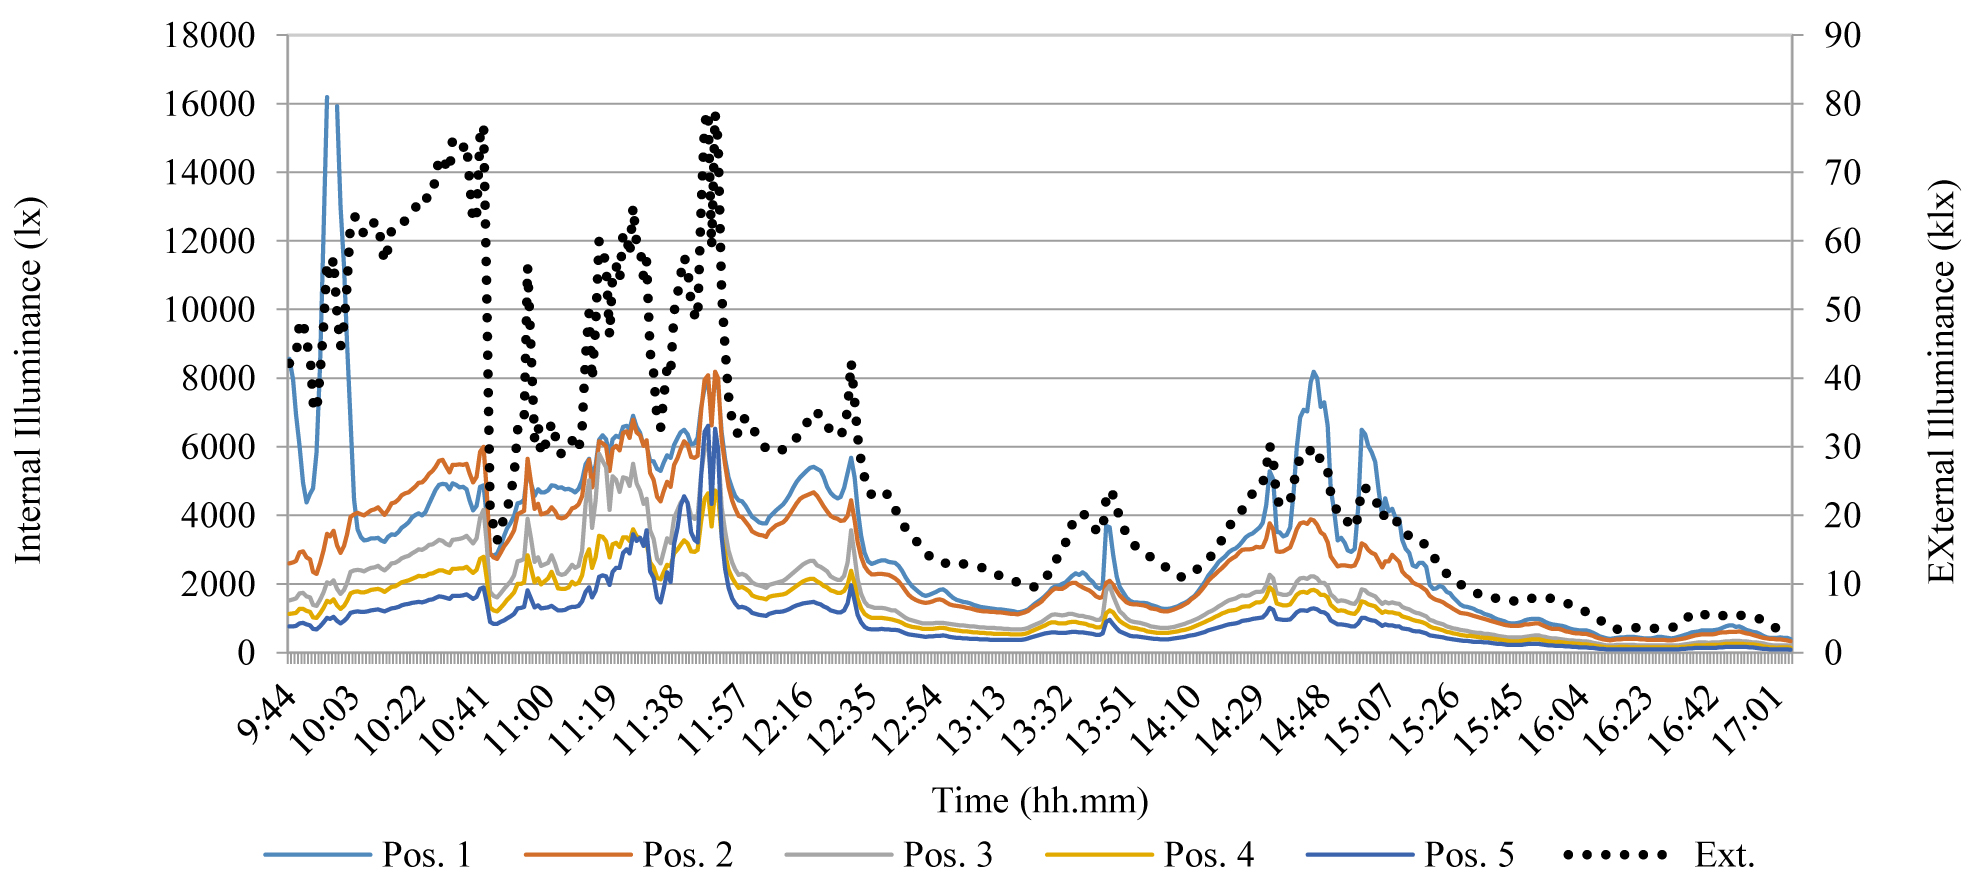 Figure 23
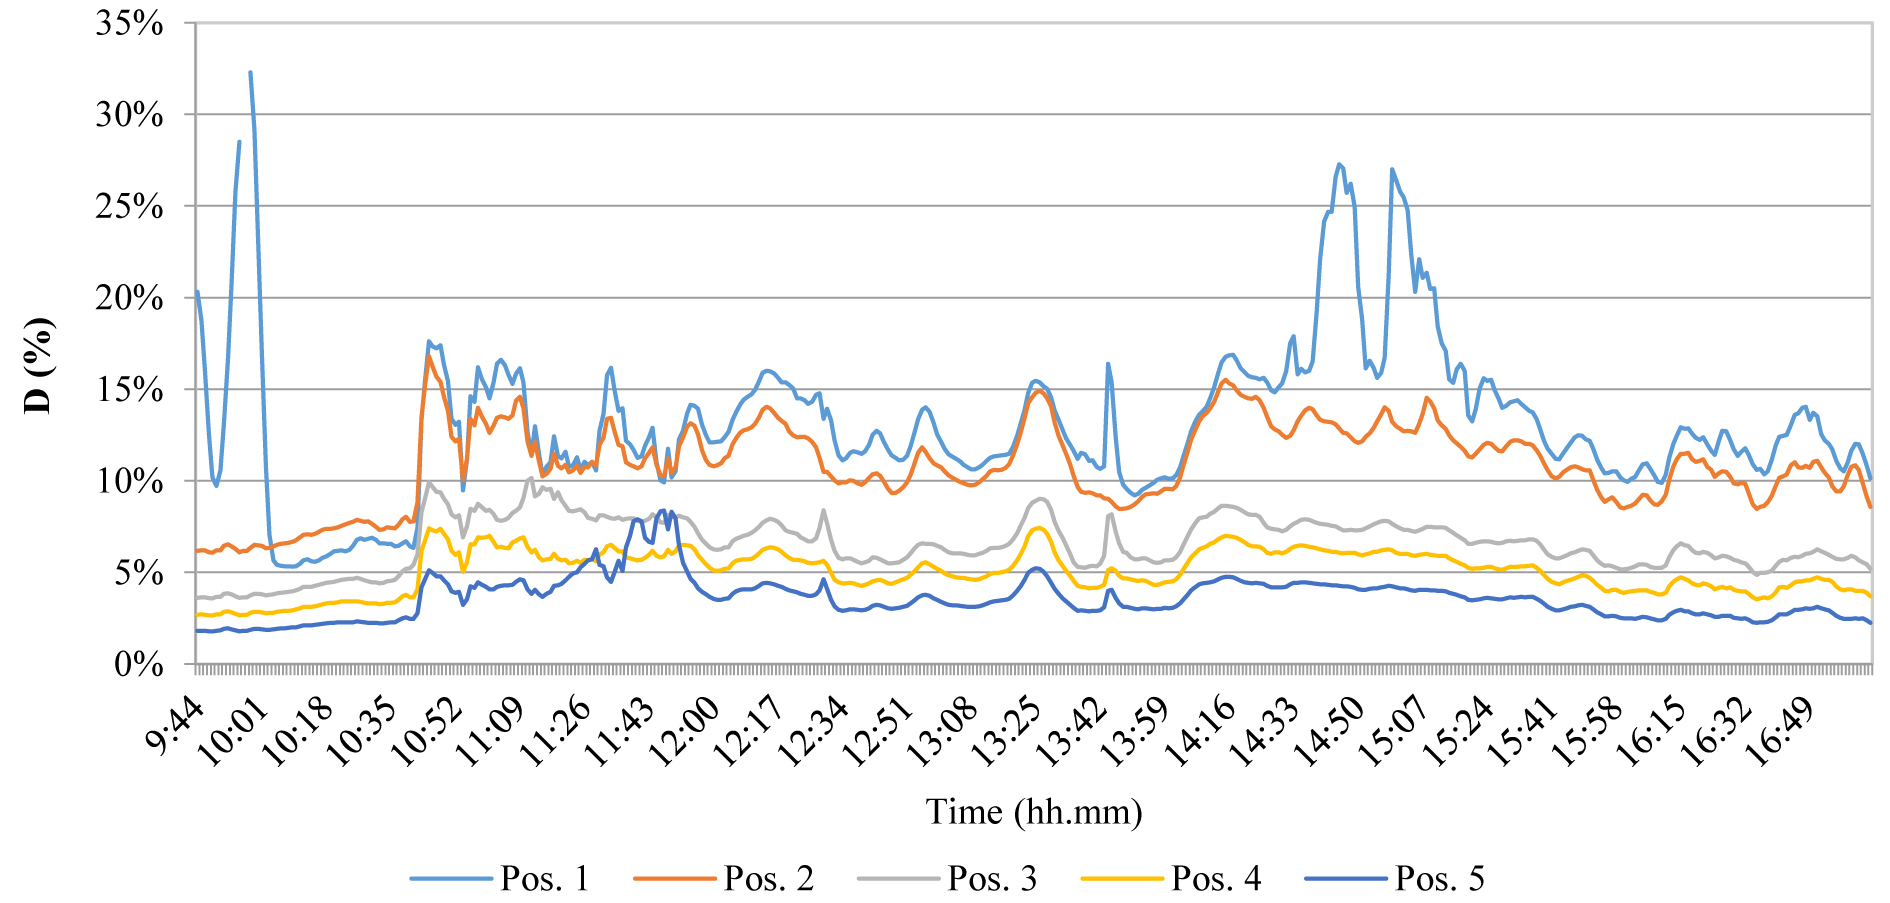 Figure 24
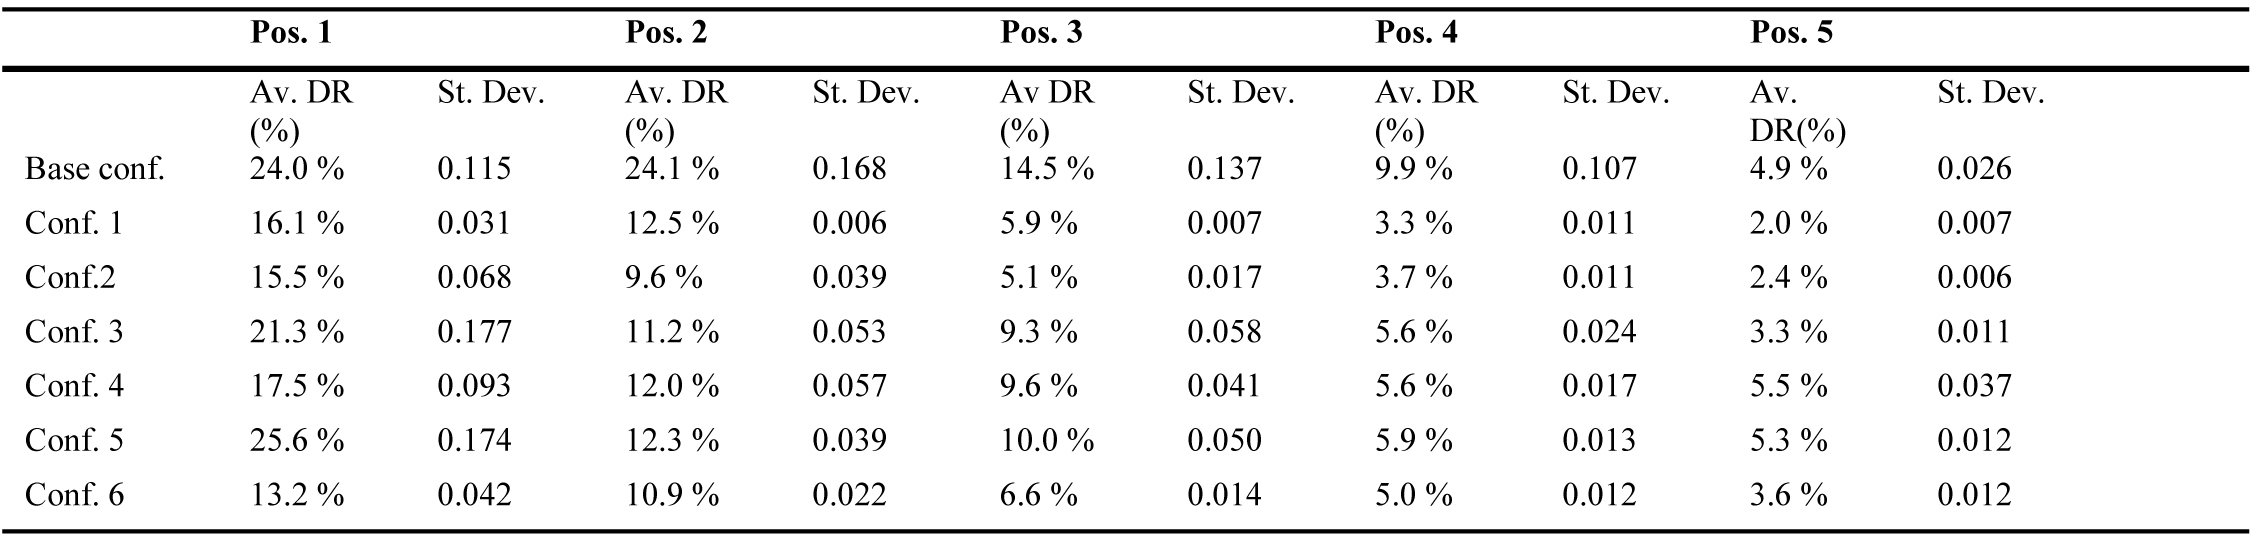 Table 6
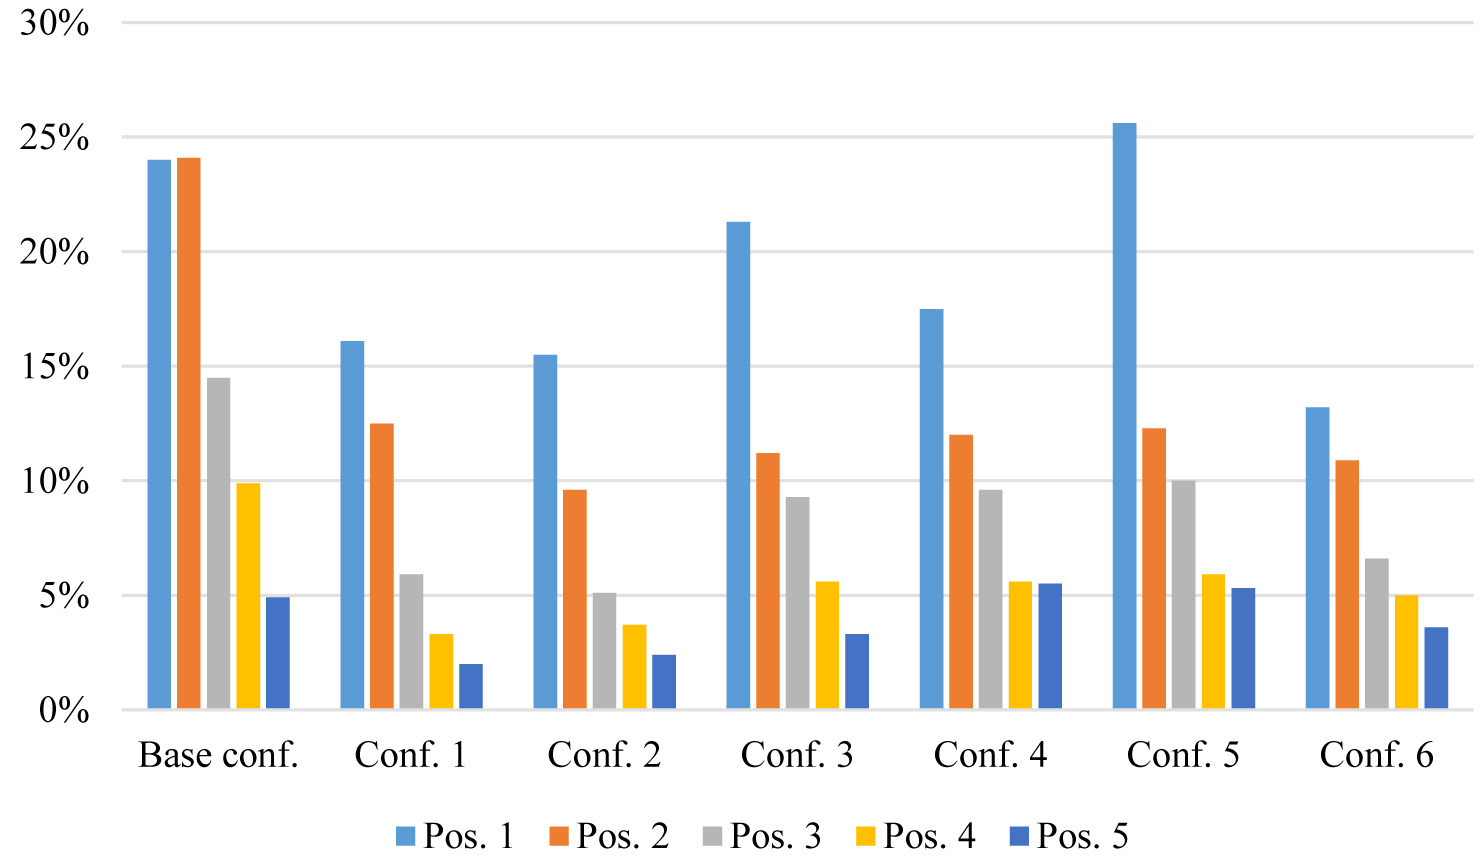 Figure 25
 Figure 26
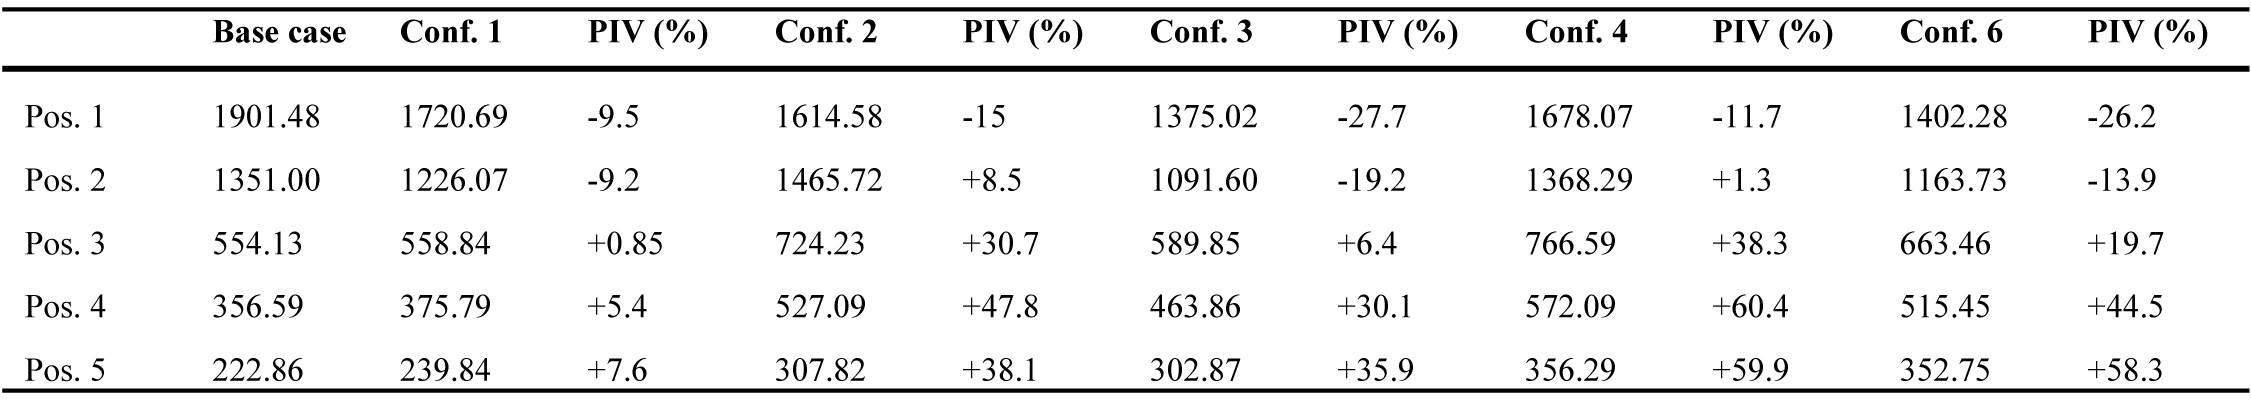 Table 7
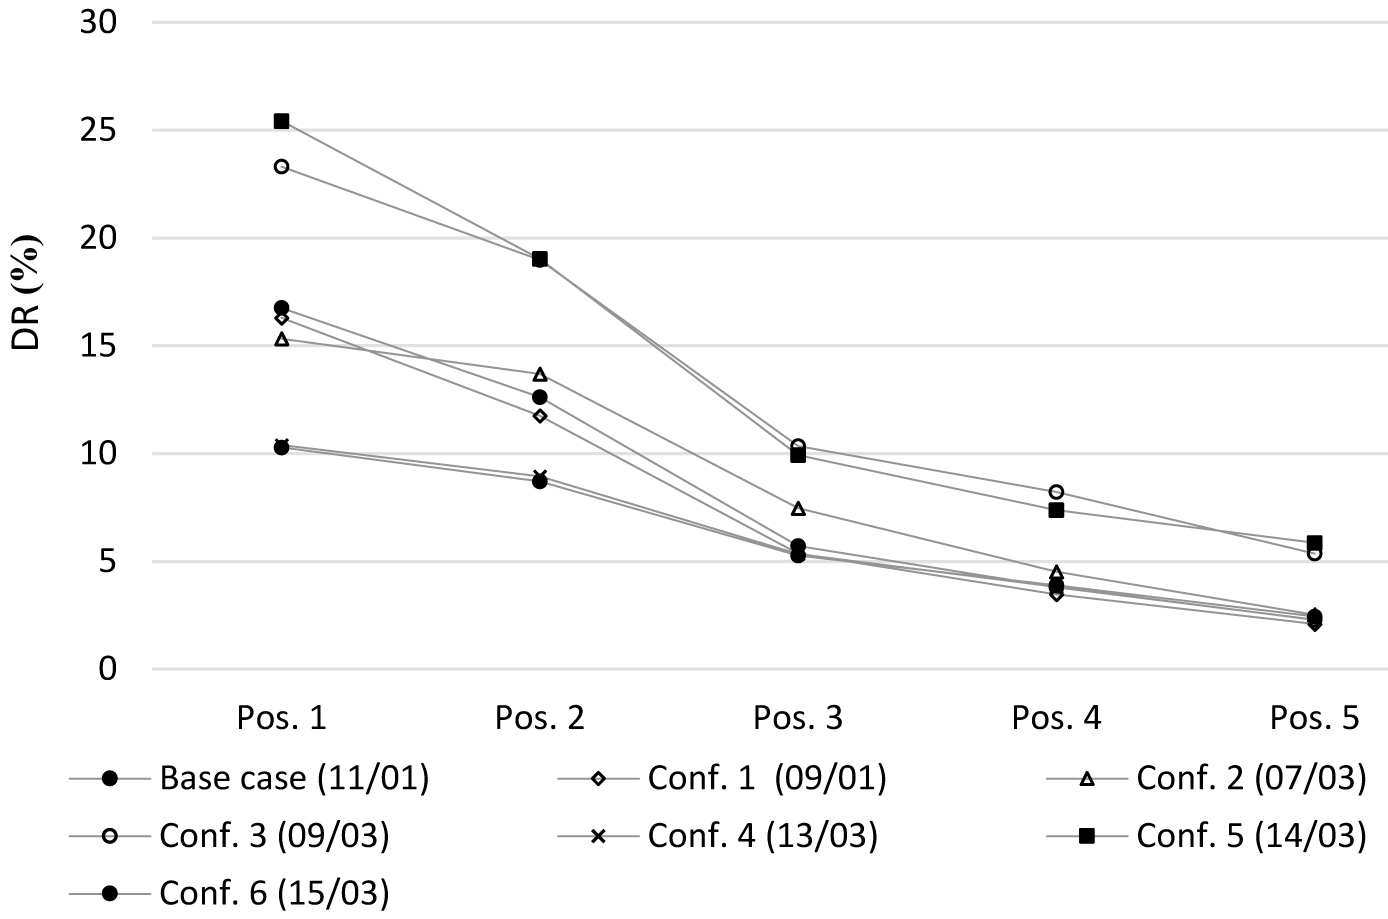 Figure 27
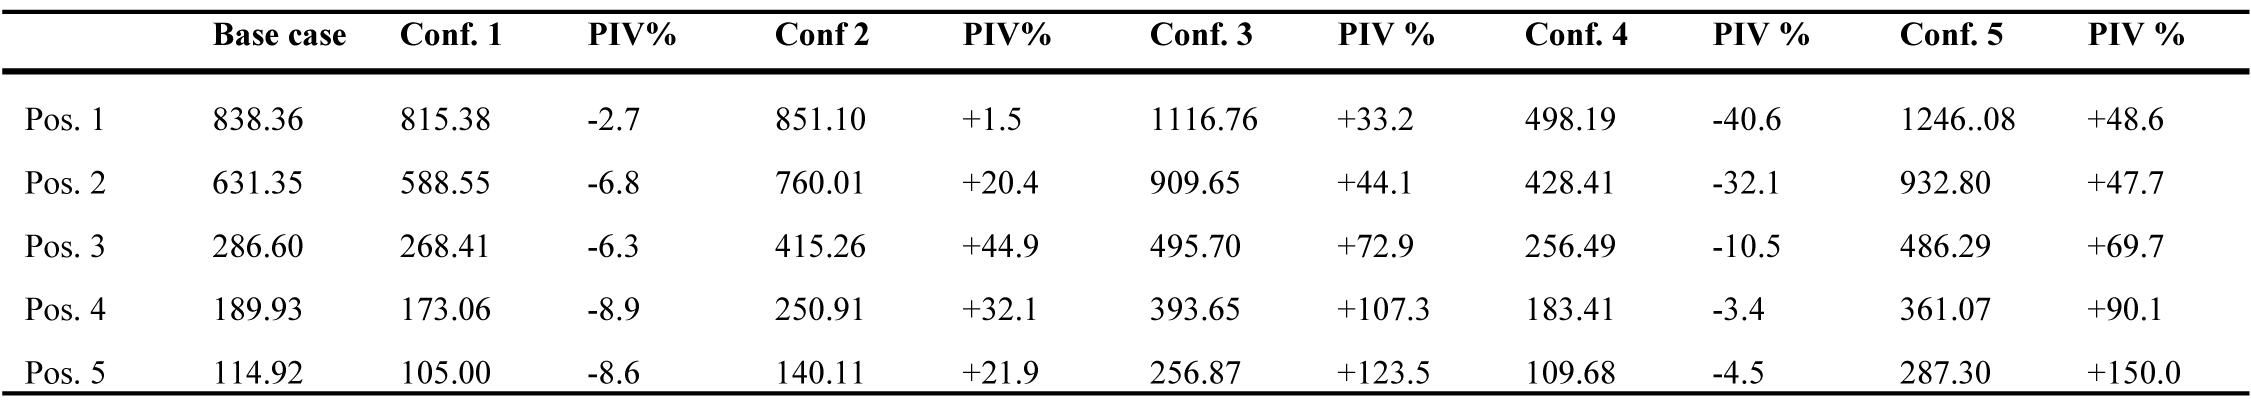 Table 8
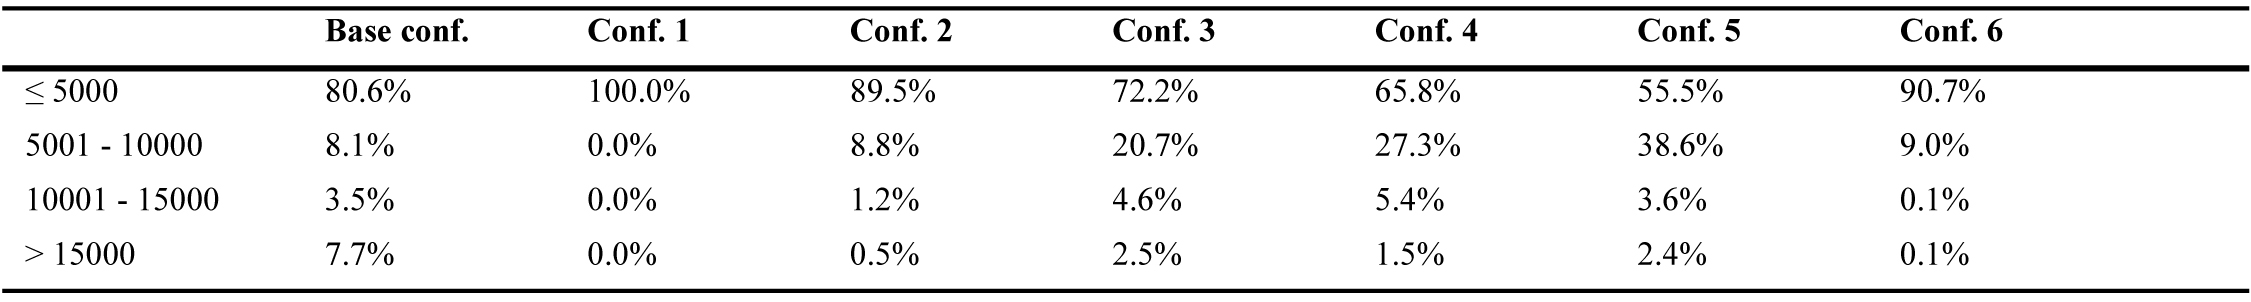 Table 9
 Figure 28
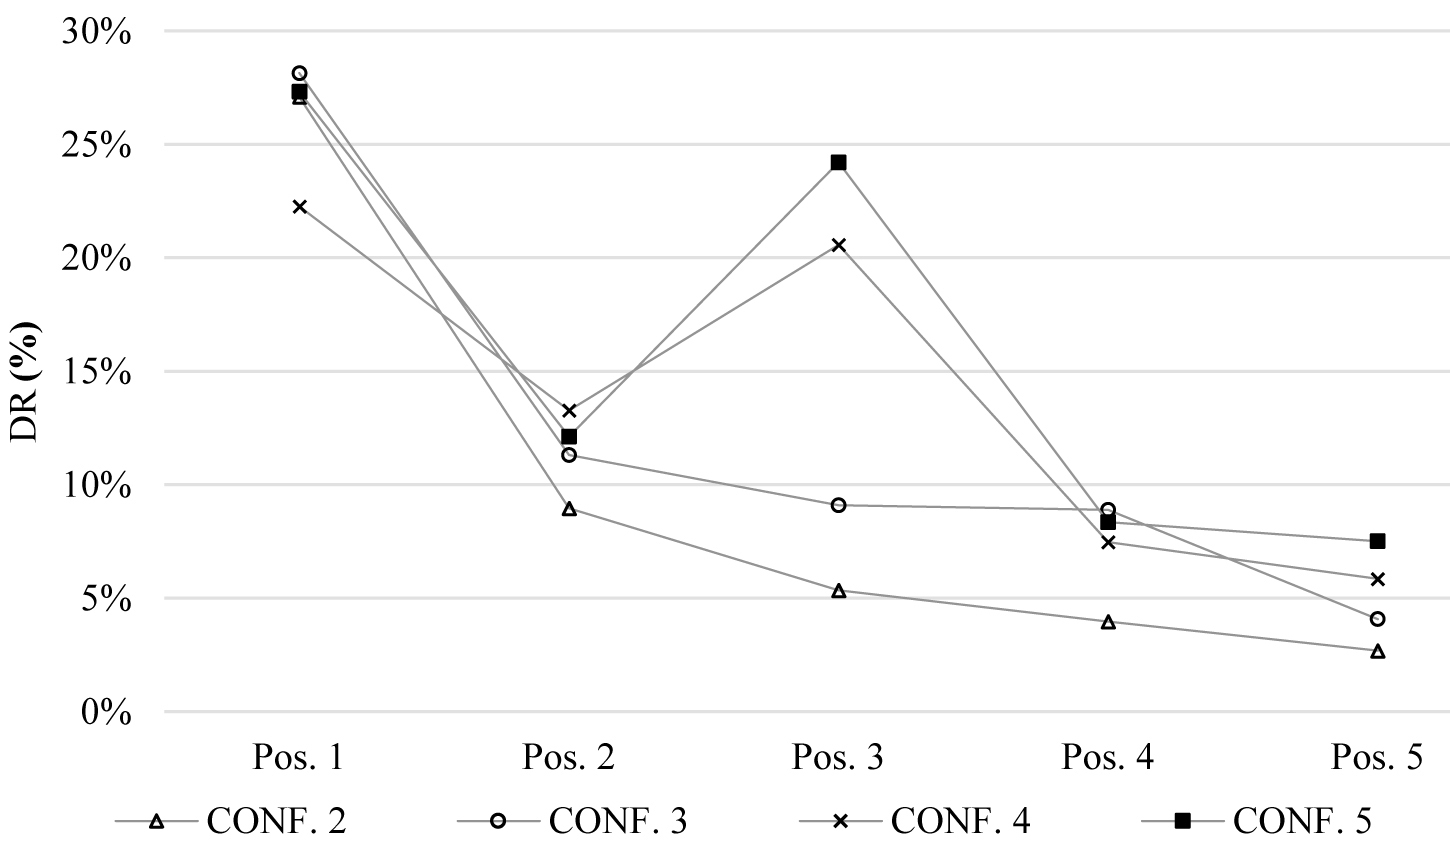 Figure 29
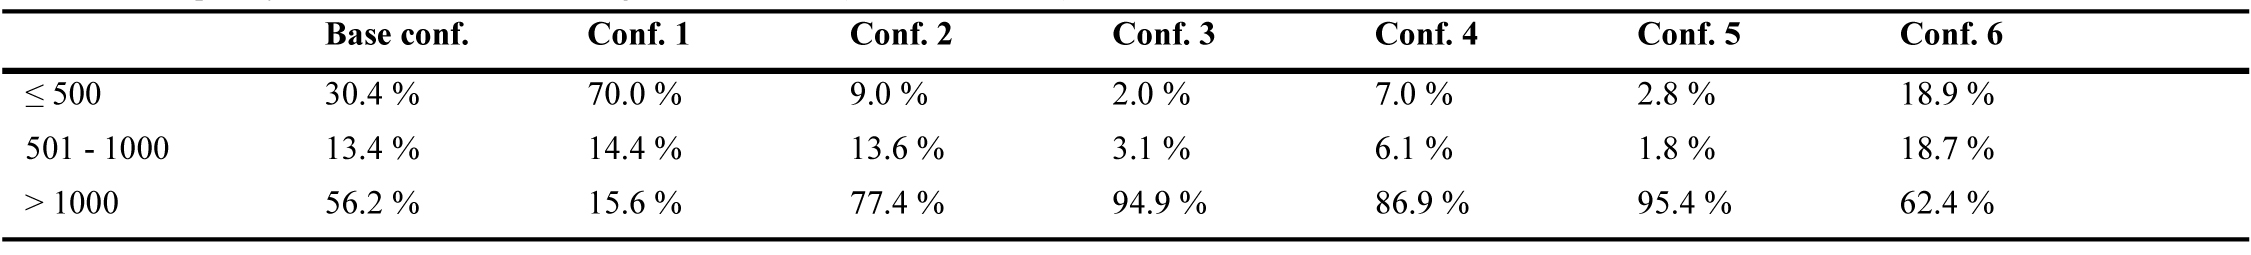 Table 10
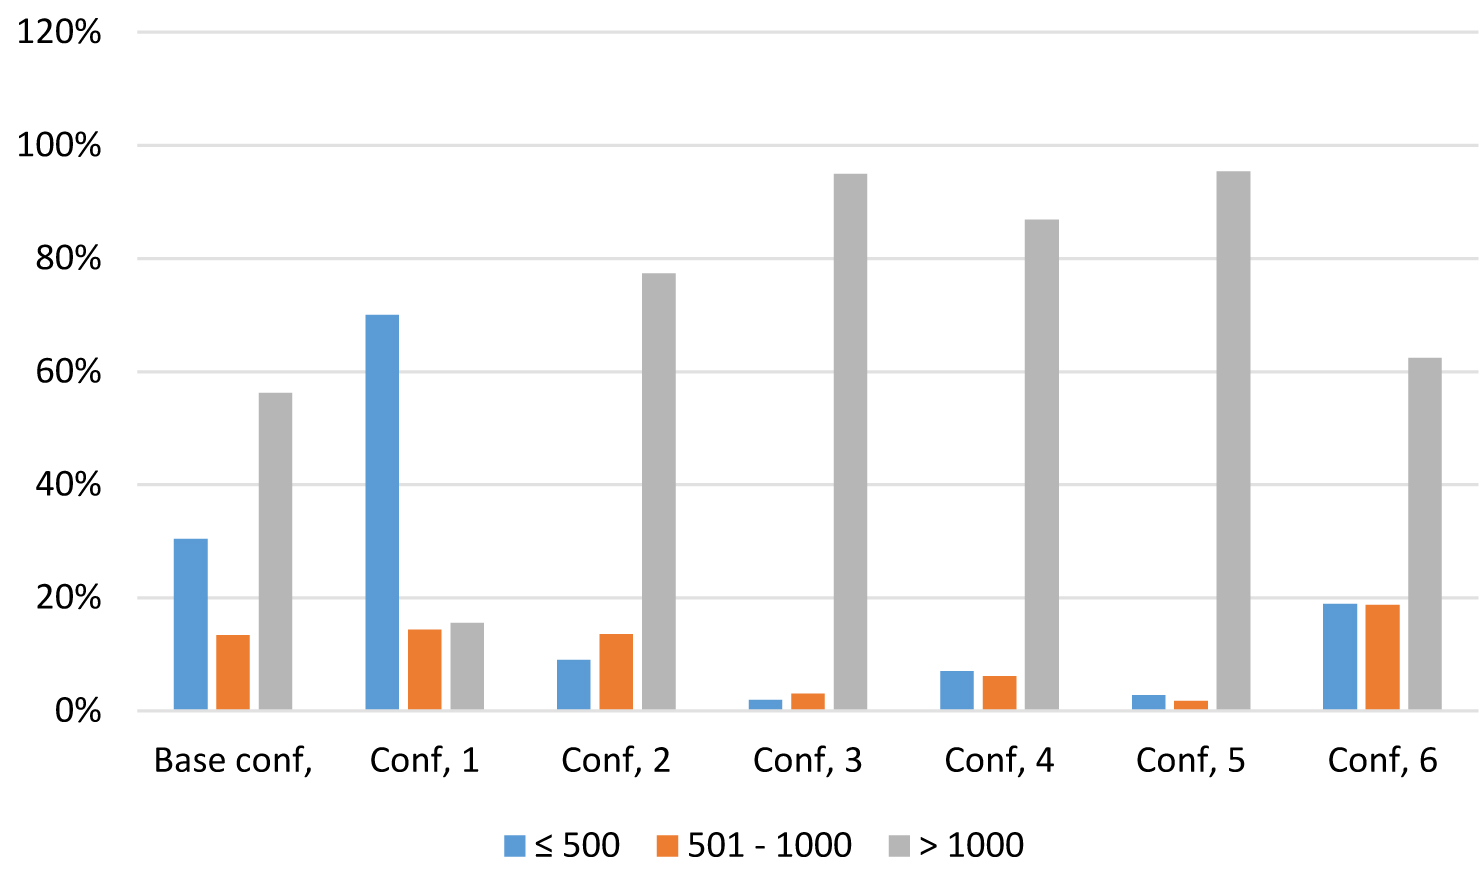 Figure 30
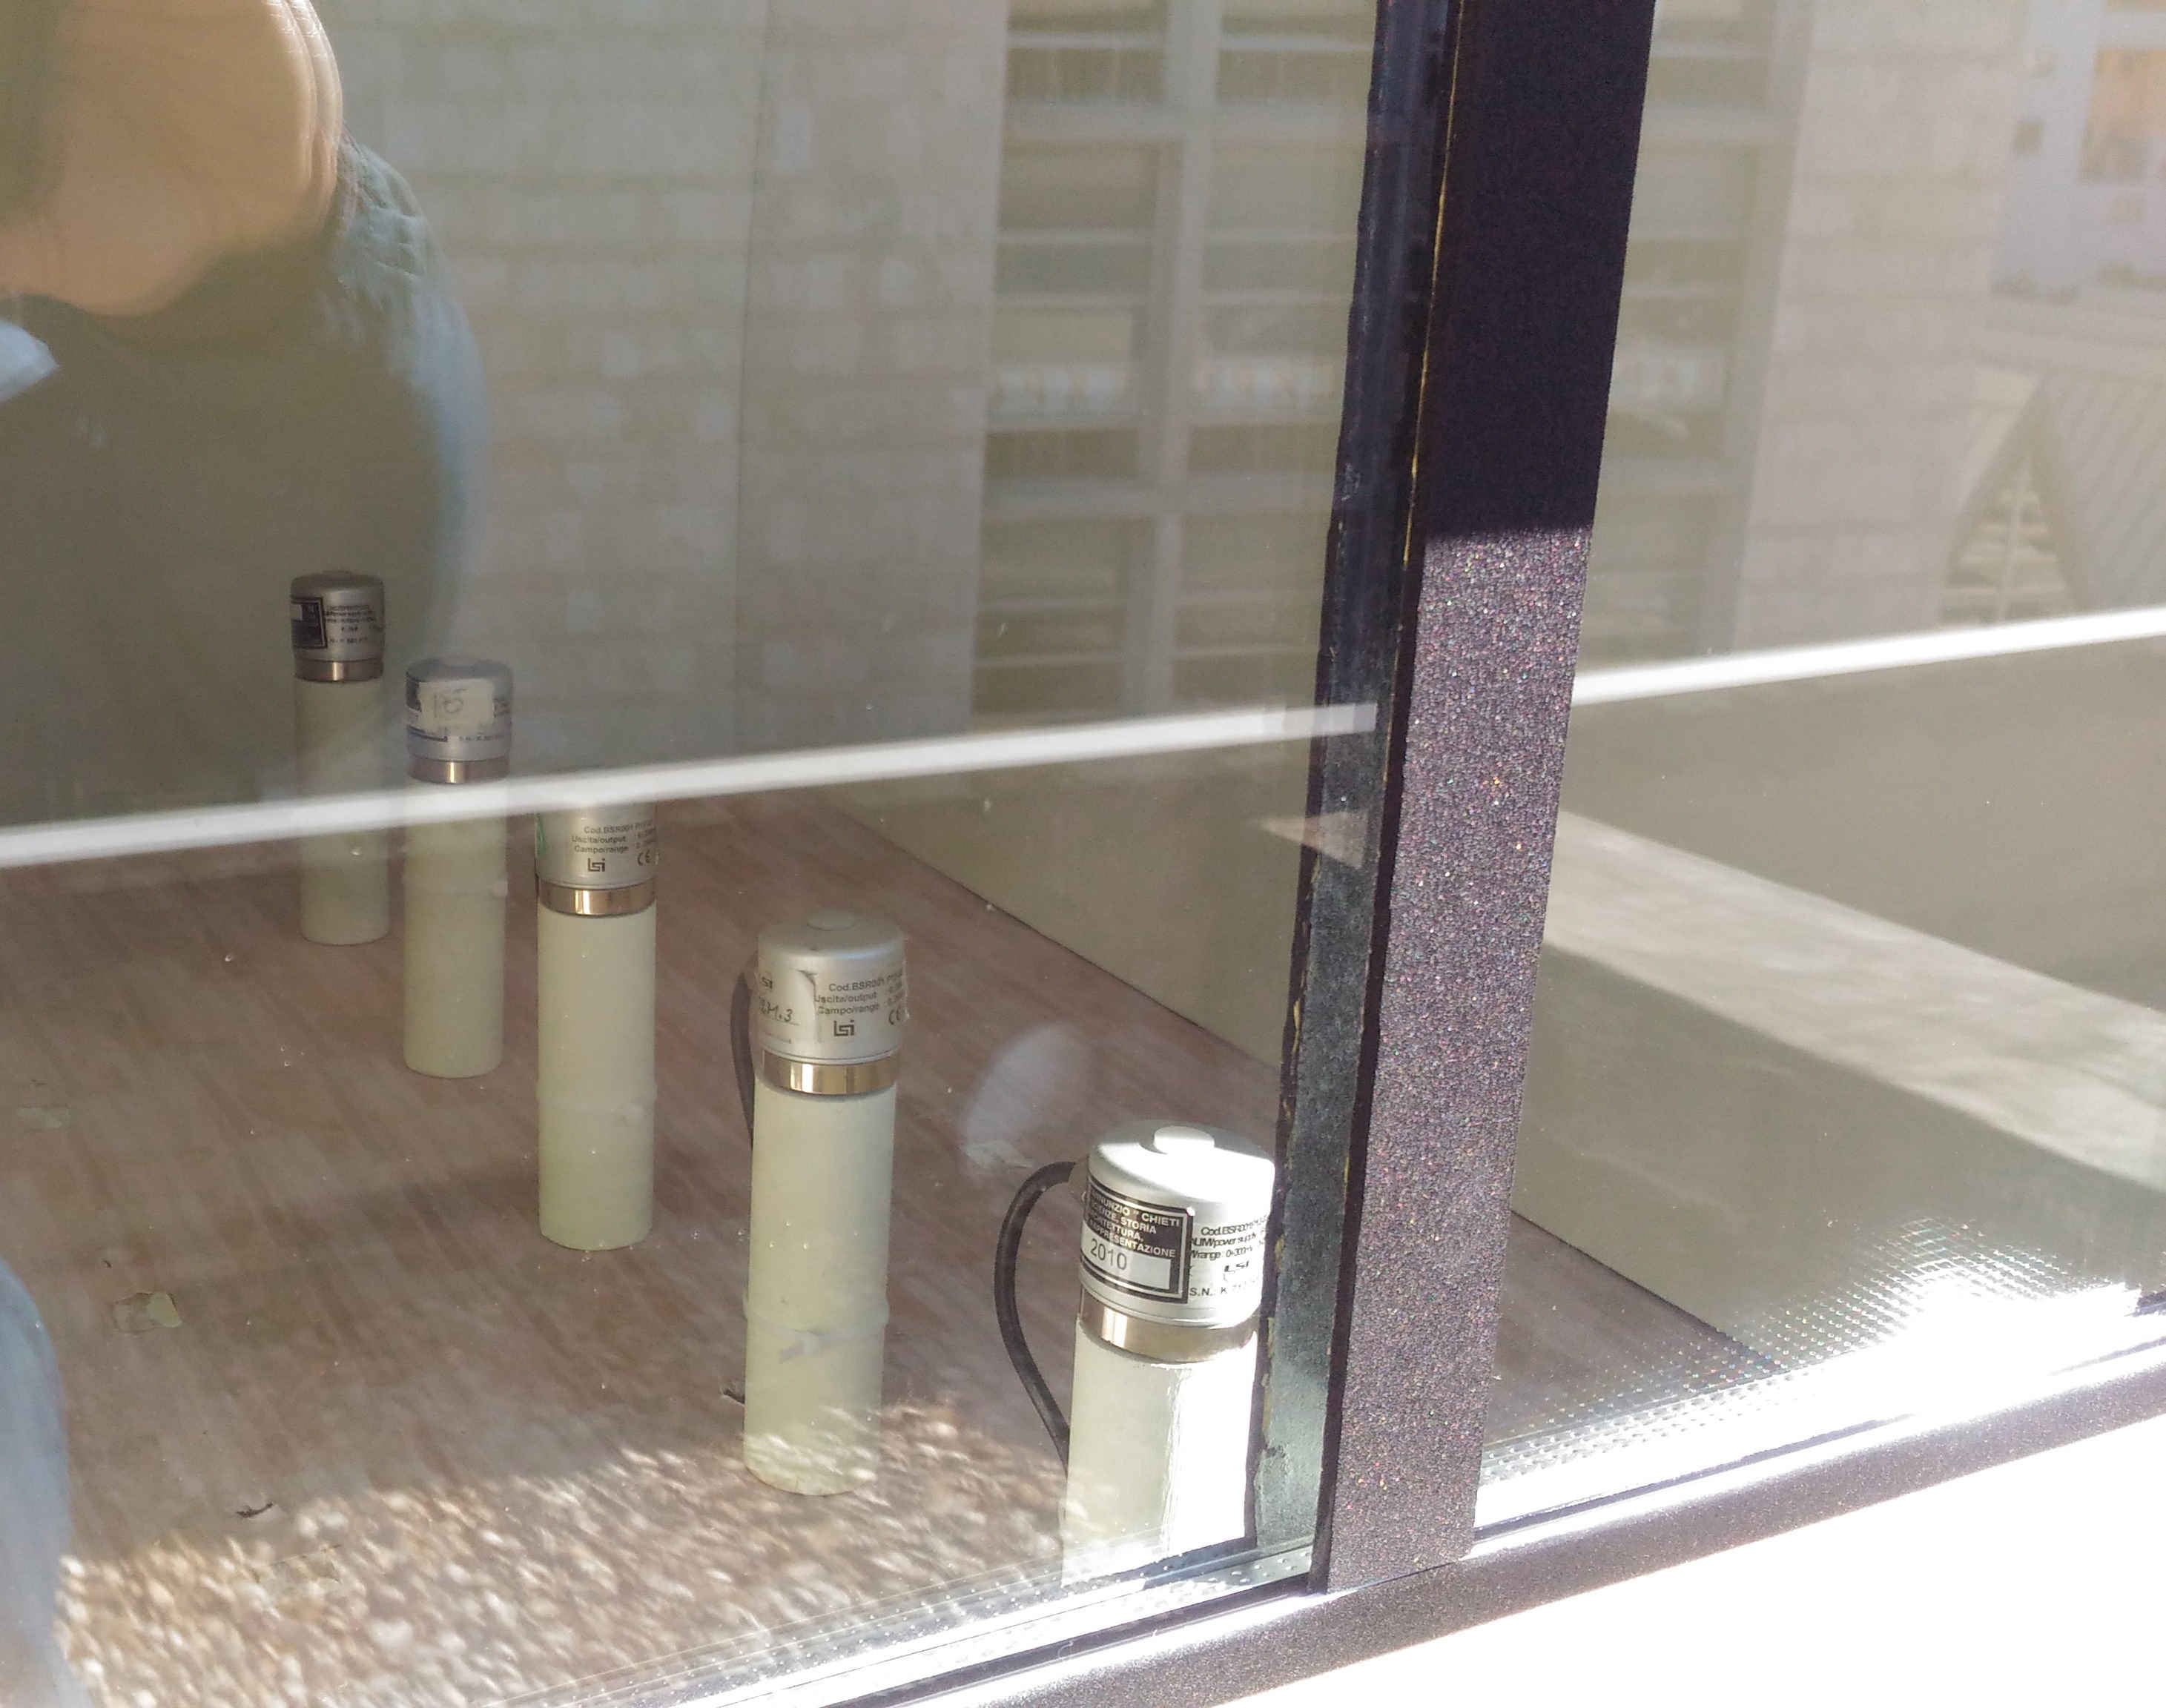 Figure 31
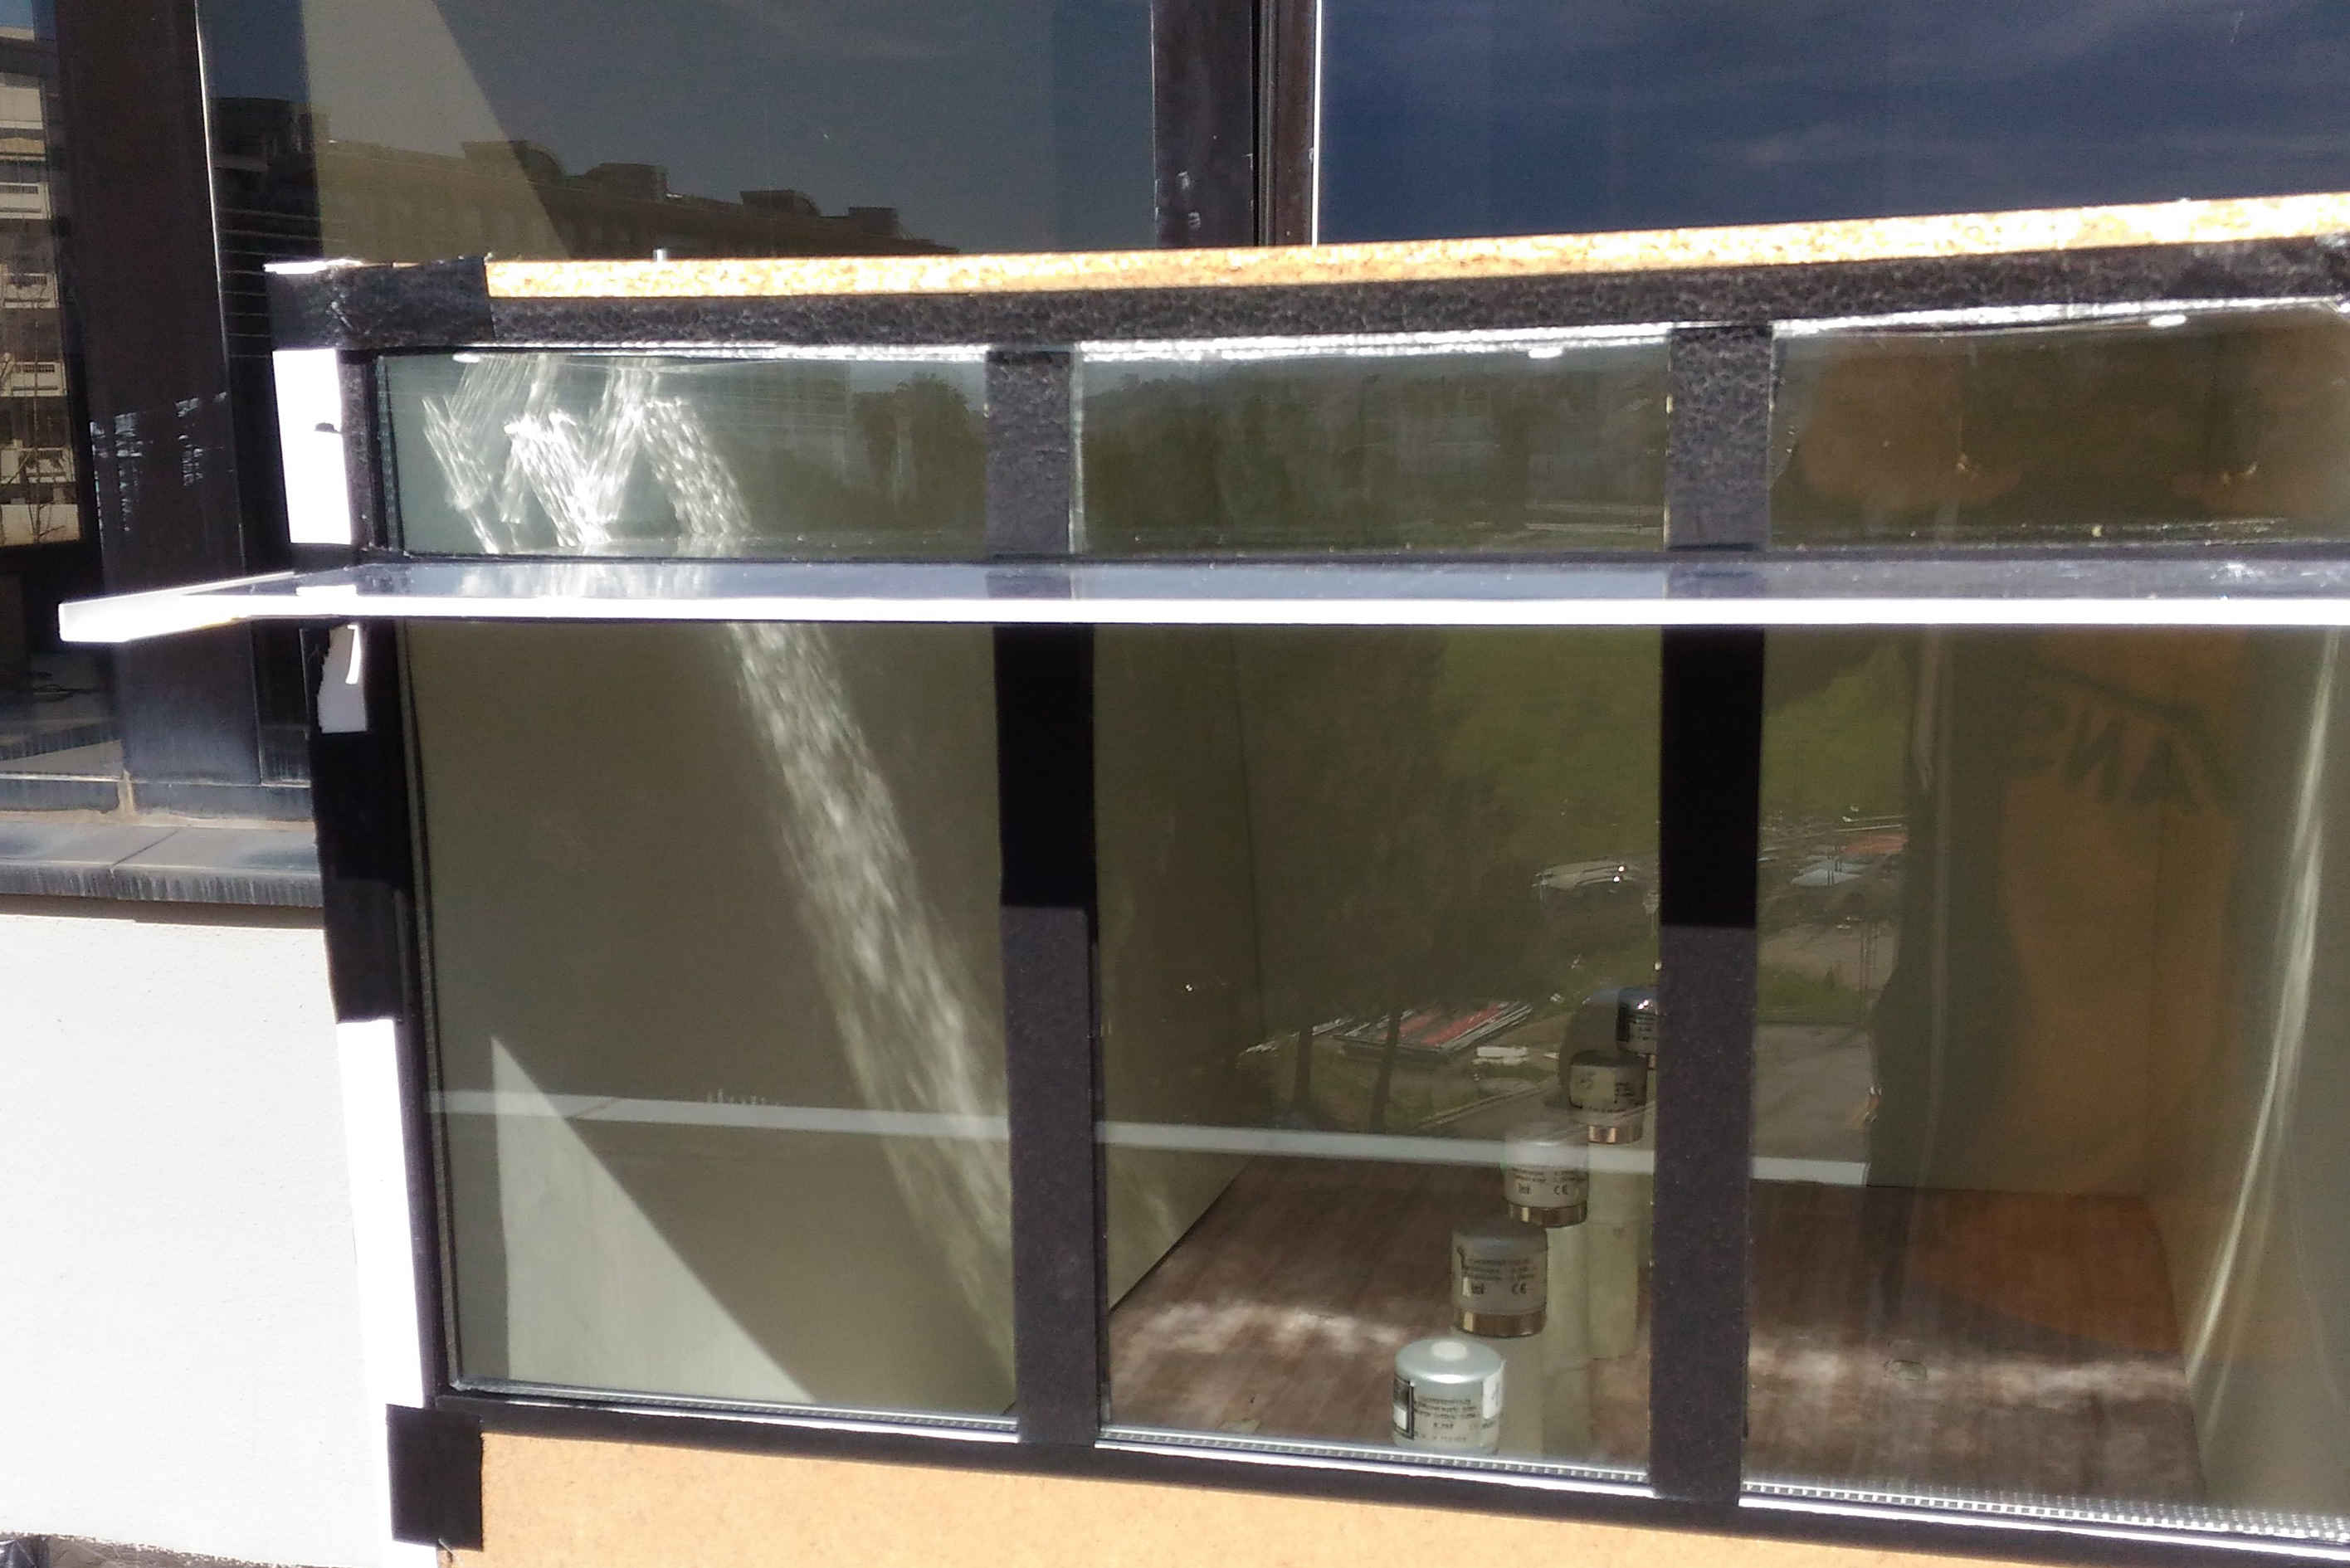 Figure 32
Abstract
Daylight plays a significant role in achieving energy saving and comfort in buildings. It is in accordance with the human circadian rhythms and allows the best visual conditions in work environments and residential buildings. Recently, numerous researchers have focused their attention on the performance of technological devices able to increase natural light availability in interior areas of buildings. Among them, light shelves are commonly used with the aim of improving the depth of daylight penetration, trying to reduce the non-uniform diffusion of light entering from vertical windows. In this paper, the authors propose six different configurations of an internal-external light shelf and analyse their performance using the experimental scale model approach under real sky. Although the method is not very accurate as deduced from literature on this topic, the authors still demonstrate its usefulness in examining different geometric configurations of light shelves. In fact, even if the results highlight inaccuracies in the method used, which are accentuated under direct sun light, they are useful for considerations in the comparative analysis, particularly in regard to data logged under partially completely cloudy skies albeit with the awareness that light shelves’ effectiveness is improved under direct sun light. Despite its limits, the method is simple to use and can be considered efficient in allowing the authors to carry out considerations regarding the performance of the system analysed. Among the six different configurations proposed two seem to be the most efficient and are characterized by the presence of an internal highly reflecting surface applied on the ceiling and an external one with two different inclination angles (10° and 20°).
Keywords
Illumination, Light shelve, Energy saving, Daylight
Nomenclature
| WWR | Window to wall ratio |
| D | Daylight Factor (%) |
| DR | Ratio between internal illuminance due to daylight in a measure position and external illuminance on a horizontal work-plane (%) |
| PIV | Percentage variation of daylight illuminance in a point due to the light shelf compared with the corresponding value in absence of light shelf (%) |
| Eext | External illuminance (klx) |
| Eext, min | Minimum external illuminance (klx) |
| Eext, max | Maximum external illuminance (klx) |
| Eext, av | Average external illuminance (klx) |
1. Introduction
Buildings are responsible for about 40% of the total energy consumption in developed countries (USA and EU) and for approximately 32% in the world [1,2]. It is known that the main causes of energy consumption in buildings are artificial lighting and HVAC installations and recent studies have underlined their mutual influence. For example, Golasi et al. [3] quantified the influence of the colour temperature of lighting sources on persons’ thermal perception, demonstrating that, during the warm season, lamps with high colour temperature maintain the thermal comfort conditions of occupants by increasing the air temperature by more than one degree, thus producing significant energy saving in HVAC consumption. In recent years, improving the energy efficiency of luminaires by LED technology has produced a significant amount of energy saving in illumination of buildings, but it cannot be overlooked that occupants’ behaviour can be responsible for increased energy consumption, such as the bad habit of using artificial light even in the absence of occupants and in the presence of daylight [4,5]. This is particularly true when intense direct solar radiations hit the windows because, in this case, curtains or blinds are kept shut in order to avoid glare. Moreover, from this point of view, the occupants’ opinions about visual comfort do not always coincide with those attested by the commonly used daylight performance indexes, Useful Daylight Illuminance and Daylight Glare Probability as underlined by Bellia et al. [6].
The efficacy of energy saving measures related to artificial lighting in buildings greatly depends on the use of lighting control systems linked to daylight and occupancy. Regarding this topic, it is worth noting the study of Loverso et al. [7] who carried out a comparative analysis between the four typologies of lighting control systems defined by the Standard EN 15193-1:20017 [8] for a great number of buildings in public and scholastic sectors, in various European locations, showing the great influence of the lighting control system used on saving energy.
It goes without saying that daylight significantly contributes to energy savings, as underlined in [9,10] and greatly influences indoor visual comfort and the wellness of occupants [11-14]. The contribution of daylight to energy saving in buildings is due to the adoption of photo-sensors, as attested in [15-18]. Bellia et al. [15] underline that DLCs are useful tools to increase energy saving and comfort in buildings, but their widespread use has been delayed due to many factors, among which the users’ reluctance in using them. Bonomolo et al. [16], starting from the assumption that commercial DLCs often do not work as expected due to various factors, evaluate the performance of a DLCs after determining some indices that take into account the variations of illuminance respect to a target set point. Doulos et al. [17] confirm that DLCs are efficient energy saving tools in school buildings. They carried out a study on a typical classroom in a Greek public school and demonstrated that the adoption of photo-sensors drastically reduced the annual lighting consumption and the related CO2 emissions. Moreover Doulos et al. [18] present a study regarding the determination of the best position and field of view of photo-sensors used in DLCs, on the basis on multiple criteria analysis.
Many authors focused their attention on improving and controlling daylight availability in interior areas, also taking into account that daylight entering from windows gives non-uniform illuminance spatial distribution with very high values close to the window rapidly decreasing from it, particularly in large industrial and commercial buildings, often characterized by wide areas in plan with regular geometry and windows mounted on the perimeter walls.
In this research field, the work of Abigail et al. [19] is noteworthy. They focused their attention on the use of perforated screens as effective tools for daylight control, underlying how their performance depend on typical geometric parameters. After analysing the influence of each factor through a statistical method, they proposed design guidelines for the Mediterranean climate. Likewise, Mueller [20] proposed a device able to redirect sunlight to the ceiling and the depth of the room and avoid glare by integrating micro-structures in triple glass windows, while Ullah [21] proposed a new daylighting system with a parabolic collector and a nonimaging reflector to optimize the transmission of light to the optical fibers device.
Some technological devices, such as light pipes, are increasingly being used in residential or commercial buildings [22-25] because they contribute in uniforming the distribution of light on the work-plane. They have recently been used also in infrastructures with different utilities, such as farms or road tunnels, as attested in [26-30]. In the field of tubular daylight system, recent studies by Spacek et al. [31] have proposed the use of new materials, as polymer metallized with aluminum, which is cheaper than the reflecting materials currently marketed by several companies, with costs reduced by 50% for a 35% lower efficacy of the device.
Light pipes can be used to transport daylight in hypogeal areas of buildings. If they are used to light two hypogeal levels, the tubular guidelines must pass through the first level before arriving to the second, thus producing a significant obstruction in the passage area. To solve this problem some innovative technological devices, such as the double light pipe, have been proposed by Baroncini et al. [32-34] and Boccia et al. [35].
In this paper, the authors focused their interest on the light shelves, because they play a significant role in improving and controlling interior daylight distribution, increasing the inhabitants’ visual comfort. Light shelves’ performances depend on numerous parameters: geometry, materials, dimensions, inclination angle of the external portion of the device, external climatic conditions (overcast or clear sky, with or without sun). Light shelves can be installed totally inside, totally outside, or partially inside and outside the glazed area. The outer part of the device is able to shade the glass surface, while the inner one reflects solar radiations, increasing illuminance away from the window and producing a uniform distribution of light on the work plane [36]. Freewan et al [37], after analysing the factors affecting the light shelves’ performances, underline the importance of the ceiling geometrical shape, while Berardi et al. [38] highlight how the WWR affects the diffusion of daylight obtained using light shelves.
A specific issue regards light shelves installed in high-rise buildings, subjected to very intense wind action [39,40]. In this case, wind pressure acting on the device can damage the external light shelves. Heangwoo Lee et alias took interest in this problem and proposed some solutions, such as the adoption of perforated light shelves [41].
An effective method commonly used in determining the performance of devices for daylight is the experimental approach on scale models [42]. Many authors use this methodology also in the case of light shelves. As an example, in [43], the authors carried out an experimental analysis on a scaled prototype in various configurations and a parallel numerical approach by which some new metrics are established specifically to determine the performances of light shelves.
In this paper, the authors show the results of an experimental study on a scaled room equipped with a light shelf. Starting from the base case, they consider six different configurations, determining the daylight distribution for each one with the aim to define the performance of the light shelf. The results underline how the use of the scale model approach under real sky is strictly affected by some factors, as the presence of direct solar radiation, or the sky luminance distribution. These can decrease the results’ accuracy, but the method is simply used and allows a comparison of the performances of various geometrical configurations of the device.
2. Method
The authors carried out an experimental analysis on a reduced scale model (1:5) of a test room equipped with a wide south facing window with WWR = 0.67 so as to define the best geometrical configuration of a horizontal external-internal light shelf mounted on the window.
Before testing the six different configurations of the light shelf, they carried out two comparative tests on the 1:5 model and the 1:1 room with the aim of defining if significant differences take place between them as attested by literature: the first one without and the second with the light shelf. During these tests, the model was placed in front of the window of the building, so the model and the real scale room had the same south orientation. No obstruction was produced by the adjacent buildings, since the nearest structure was more than 20 m from the model. Thanks to a statistical T-test, they determined a significant difference between illuminance data in the real and in the reduced scale model, confirming the literature.
Subsequently, for each configuration proposed they carried out daily experimental tests to measure internal illuminance in five points on a horizontal work-plane 0.16 m from the floor and determining the ratio between internal and external illuminance.
Finally, they compared the results in similar external conditions deducing the most performant configuration of the light shelf. In Fig. 1(a), diagram with the steps of the method is shown.
Figure 1
Fig. 1. Methodology used in the research.
3. Description of the experimental apparatus
The mock-up is wood made, the walls are painted with the same light colour used in the real-size room with reflectivity of about 65%, the floor is covered with a sheet of photographic paper reproducing the real travertine floor, reflectivity is about 50 %, and the ceiling is laid with the same white perforated cardboard used in the real scale room, reflectivity is about 75 %.
The window is equipped by a double glass, each 4 mm thin, with an air gap of 7 mm and a luminous transmission factor of about 75 %, equal to those of the real scale glazing.
Figure 2 shows some photos of the room and the scale model, while Fig. 3 shows the dimensions (m) of the room and the scale model.
Figure 2
Fig. 2. Photos of the real scale room and the scale model during the tests.
Figure 3
Fig. 3. (a) Plan and vertical section of the room and (b) the scale model (all the dimensions are in m).
The experimental activity was carried out using the following instruments:
- Elven internal luxmeters type LSI ESR-BSR001 ( 0-25000 lx).
- One external luxmeter LSI DPA503 (0-100 klx).
- One DATA LOGGER E-Log ELO310 with 16 analogical, 4 digital and 1 RS232 inputs, expandable by a second slave unit.
Data were collected every 10 s and elaborated every 120 s. The data logger gives the minimum, maximum and average values and the standard deviation as output.
3.1. Choice of the different geometries of the light shelf
The authors considered six configurations of the light shelf (see Table 1 and Fig. 3), and compared illuminance data on a horizontal work plane in each configuration with those obtained in the base configuration (without light shelf). A polymeric film with luminous specular reflectivity higher than 99% coats the upper surface of the light shelf. The same film also covers a portion of the ceiling 0.3 m wide (1.5 m in real scale) in configurations 3 to 6.
Table 1
Table 1. Latitude, longitude, and sun coordinates of Pescara city.
A preliminary graphic analysis was carried out with the aim of choosing the geometrical configurations of the light shelf, taking into account the south orientation of the window and the sun coordinates on the solstices and equinoxes for the city of Pescara at 12.00 (see Table 1). The study was carried out analysing the sun radiation path with an inclination angle of 45°, 67° and 23° that represent the elevation of sun in March/September, June and December. Since the elevation in March and September are very similar, the authors felt they could consider a single average elevation angle of 45° for these two months.
In Fig. 4, the direct radiation path has been represented in the six different geometries.
Figure 4
Fig. 4. (a) Sun direct radiation path in the six different geometries for three sun elevation values (45°, 67°, and 23°).
Figure 4 shows that, in the base configuration, the whole work-plane is hit by direct sunlight only with low sun elevation (23°), while with sun elevation of 45° and 67° only reduced portion of it is lighted. The application of the internal component of the light shelf (see Conf.1) allows to increase the lighted surface with sun elevation of 45° but not with 67°. The outer reflecting surface (see Conf. 2) and the inner one applied on the ceiling (see Conf. 3) increase the daylight penetration. Furthermore, the shielding action is performed particularly effectively at 67 °, less at 45 °, while it is not at all effective at 23°. The inclination of 20° (see Conf. 4) and 30 ° (see Conf. 5) of the outer component of the light shelf allows illuminating the work-plane, particularly with sun elevation of 67° even if in configuration 5 only the second reflections hit the work-plane. Obviously, at 45° the shielding action is reduced inclining the external surface. The configuration 6 is an attempt to reconcile the two needs.
This preliminary analysis highlights the difficulty to select the best configuration, but it gives some useful information about the behaviour of the light shelf. The dimensions of the single portions of the light shelf have been chosen in order to guarantee the reflecting and shielding functions with an acceptable encumbrance. Table 2 and Fig. 5 describe in detail the six configurations of the light shelf.
Figure 5
Fig. 5. Six configurations of the light shelf (all the dimensions are in m).
Table 2
Table 2. Description of the light shelf features in six different configurations.
4. Daylight factor
The Daylight Factor of the room has been calculated in order to define the adequacy of daylight with respect to the use of the room as an office. The D % was calculated on a grid of 187 points on a horizontal work-plane 0.8 m high on the floor (0.16 m in the scale model). Figure 6 shows the D % values on the central axis of the room vs the distance from the window.
Figure 6
Fig. 6. D % and average D going away from the window.
As shown in Fig. 6, the daylight factor presents the typical trend generated by a vertical window. If compared to the reference value of 2%, it is evident that more than 60% of the room has D < 2%. This underlines the possible suitability of using a light shelf, thus straightening the curve, reducing the difference between maximum and minimum values and increasing the uniformity in the internal distribution of light.
5. Comparative experimental analysis
The suitability of using reduced scale models for determining the daylight distribution in interior environments is attested by literature. Many authors focused their attention on this topic [44-48]. Scale models of buildings can be tested either under sky simulators [48] or real sky. In the first case, the same model with different interchangeable components can be analyzed and the results are repeatable and reliable being free of errors due to climatic changes or other accidental factors, but they are influenced by parallax errors or scale factor errors, caused by the reduced dimensions of the sky vault. On the other hand, when scale models are tested under real sky, the daylight performance can be evaluated depending on different sky conditions (clear, cloudy, etc.), but data are not repeatable.
According to Bodart et al. [45], scale factors of 1:500 up to 1:200 can be adopted for preliminary design of buildings, but scale factors of 1:10 up to 1:1 are required if the intent is to analyze the interior light distribution.
It is known that the daylight performance of buildings deduced by the scale model approach are overestimated with respect to real scale rooms, as shown by Thanachareonkit et al. [44] and Cannon-Brookes [47]. These discrepancies usually depend on the geometrical features of the mock-up, the reflectance of the walls, ceiling and floor, the type of sensors and how precisely they are placed.
Prior the experimental analysis on the reduced scale models in the six different configurations of the light shelf, the authors carried out some experiments under real sky, comparing the real and the reduced scale model of the room. Since the room and the mock up must have the same sky view factor, as underlined by Thanachareonkit et al. [44], the authors paid great attention to place the scale model outside the window in front of it with exactly the same orientation of the real scale room.
In agreement to Bodart et al. [45], the authors used a 1:5 scale model. The results of the tests confirmed the literature knowledge in this field: a general overestimation of illuminance takes place in the scale model respect to the real size room. Besides, some factors, such as light misalignment of models or corresponding sensors, can penalize the accuracy degree in comparing data, particularly with direct solar radiations, which can produce local peak values or shadows caused by the window’s frame, furnishings or other objects in the room, as underlined by Boccia et al. [42]. These inaccuracies are mitigate under cloudy sky. These considerations are confirmed by the results of the comparative test carried out on December the 21st in the test room and the scale model not equipped by light shelves.
Since usually a window provides daylight up to a distance approximately equal to its height [38], the authors measured illuminance within a space of about half of the room’s area in three measure positions on the central axis of the room on a horizontal work plane 0.8 m from the floor (0.16 m in the scale model), equally distanced each from the other (i.e. 0.8 m, 0.16 in the scale model).
Figure 7 shows the measure positions in the real scale model and in the mock-up.
Figure 7
Fig. 7. (a) Positions of illuminance sensors respectively in the real test room and (b) in the model on Dec the 21st (all the dimensions are in m).
The test was carried out under variable conditions: cloudy sky for most of the time, with external illuminance under 15 klx, clear sky in the time ranges between 11.50 and 12.00, with external illuminance of about 30 klx, and between 12.20 and 12.30 with external illuminance of about 37 klx. The interior illuminance regularly decreases moving away from the window in both the real and the reduced scale model, while some peak values were verified during the day, at 11.56 and 12.24, during the aforementioned time intervals, when there was an anomalous trend of interior illuminance particularly in position 2’ in the reduced scale model, as shown in Fig. 8. This was probably due the influence of direct solar radiation, very significant at this time considering the south orientation of the window. In addition, illuminance in the 1:5 model in all the measurement positions was overestimated with respect to the corresponding points in the real scale room. The overestimation was up to 80% in position 1, very close to the window, 180% and 144% respectively in positions 2 and 3. These very high differences were partially due to the presence of furniture in the real scale room. In fact, it was not possible to remove them during the experimental activity because the room is currently used as a personal office.
Figure 8
Fig. 8. Compared results of the test on the real and reduced scale rooms not equipped by light shelf on Dec the 21st with variable conditions of sky (External illuminance referred to the 2° vertical axis).
The differences between the two series were evaluated by a T-test, whose results are shown in Table 3. The correlation coefficient C is very close to 1, attesting that the two series are perfectly correlated, while the high value of T shows how significant the difference between them is. Finally, a very low value of p indicates that it is not due to accidental events.
Table 3
Table 3. Description of the light shelf features in six different configurations.
The following test was carried out after installing a 0.5 m large lightweight plastic internal light shelf, 2.3 m from the floor in the real scale test room and a corresponding 0.1 m large one, 0.46 m from the floor in the scale model. In this case, as a more uniform light distribution was predicted, a new configuration of sensors was adopted, adjoining two sensors respectively in the test room and the model, as shown in Fig. 9. During the test a clear sky condition occurred. Figure 10 shows the results.
Figure 9
Fig. 9. (a) Positions of illuminance sensors respectively in the real test room (b) and in the model on Jan the 16th (all the dimensions are in m).
Figure 10
Fig. 10. Compared results of the test of Jan the 16th - Clear sky (external illuminance referred to the 2° vertical axis).
The interior illuminance trend was similar to the external one, and daylight contribution was significant in those measurement positions further from the window, although many irregularities took place. Moreover, in positions 1’, 2’, 3’, 4’ numerous values were out of the range of illuminance (0 to 25000 lx). This occurs in the middle of the day, when the window is hit by intense direct sunlight and external illuminance is higher than 50 klx. Once more the great influence of direct solar radiations on internal illuminance was confirmed and the overestimation of data in the mock-up with respect to real ones.
Also in this case, the differences were evaluated by a T-test, whose results are shown in Table 4. The series were different, as attested by high values of T, well correlated (high values of C) but significantly influenced by accidental factors, as attested by high values of p. The authors believe that the most important factor affecting data was the presence of intense direct solar radiations.
Table 4
Table 4. Results of T-test on data on Jan the 16th.
The comparative analysis in real and reduced scale test room confirms the statements of [42]. In particular, the reduced scale approach is a suitable method for determining the daylight illuminance distribution in interior environments, although data are commonly overestimated. This general trend can be disregarded in presence of direct solar radiation that increases the effects of accidental causes of inaccuracy.
The 1:5 scale seems to be suitable for carrying out a comparative analysis and thus determining the best geometrical configurations of the light shelf among the six considered.
6. Experimental analysis on the scale model in six different configurations
The experimental tests on the scale model in six different configurations were carried out between January and March 2018. The internal illuminance was measured in five positions 0.16 m distant from each other on a horizontal work-plane 0.16 m from the floor, as indicated in Fig. 9(b). Table 5 shows the date, sky conditions, maximum, minimum and average values of external illuminance for each test.
Table 5
Table 5. Date, sky conditions, maximum, minimum and average values of external illuminance for each test.
Figure 11 shows the illuminance trend in the base configuration in positions 1 to 5 during the experimental test carried out on January 11th with variable external climatic conditions, while Fig. 12 represents the DR % versus the distance from the window.
Figure 11
Fig. 11. Results of the test of Jan 11th – base configuration, variable sky conditions (External illuminance referred to the 2° vertical axis).
Figure 12
Fig. 12. Results of the test of Jan 11th – base configuration, variable sky conditions (External illuminance referred to the 2° vertical axis).
Illuminance is regularly decreased moving away from the window after 13.00 with cloudy conditions and external illuminance less than 20 klx. On the contrary, the presence of direct solar radiations greatly affected illuminance data, particularly in positions 1 to 3, close to the window, where they were often out of range (0 to 25 klx) in the morning, and illuminance in position 2 sometimes exceeded the corresponding values in position 1, closer to the window (i.e. approximately between 12.30 and 13.10), as shown in Fig. 11.
Figure 12 highlights that DR % > 2 in all the measurement positions for almost the entire test time, confirming the overestimation of data in reduced scale models.
The test carried out on January 9th in Configuration 1 with cloudy sky gave very regular data: the external illuminance was always less than 11 klx (maximum value about 10.4 klx). The DR % regularly decreased moving away from the window (see Figs. 13 and 14), confirming that the absence of direct solar radiation allows to forecast a regular trend of illuminance versus the distance from the window.
Figure 13
Fig. 13. Results of the test of Jan 9th – configuration 1, cloudy sky (External illuminance referred to the 2° vertical axis).
Figure 14
Fig. 14. Results of the test of Jan the 9th – configuration 1, cloudy sky.
The results of the test carried out in configuration 2 with variable climatic conditions (clear sky with sun in the morning, intermediate sky partially sunny in the afternoon) are shown in Figs 15 and 16. The results were significantly influenced by the presence of direct solar radiation. Given the high values of external illuminance and the sun elevation, approximately between 11.30 and 13.15, illuminance in position 1 was out of range, while, previously, it was characterized by a fluctuating trend. A more regular trend was observed between 13.30 and 14.15 (see Figs. 15 and 16), while, after 14.15, internal illuminance in all measurement positions followed the external trend, also with high values of external illuminance.
Figure 15
Fig. 15. Illuminance trend during the test of Mar 7th - configuration 2, variable sky conditions (External illuminance referred to the 2° vertical axis).
Figure 16
Fig. 16. DR trend during the test of Mar 7th - configuration 2, variable sky conditions.
In configuration 3, a similar situation to configuration 2 took place. The sensor n. 1 was hit by direct sunlight and consequently was out of range approximately between 11.30 and 14.10 as shown in Figs. 17 and 18. This is a similar but longer time range than the test in configuration 2. In fact, the shielding action from the external portion of the light shelf was similar, since the test was carried out a few days later and the sun coordinates were quite the same. In addition, data from sensor 3 were higher than from sensor 2, between 12.10 and 14.30, due to the influence of significant reflections from the ceiling (see Figs. 17 and 18).
Figure 17
Fig. 17. Results of the test of Mar the 9th - configuration 3, variable sky conditions (External illuminance referred to the 2° vertical axis).
Figure 18
Fig. 18. Results of the test of Mar the 9th - configuration 3, variable climatic conditions.
Figures 19 and 20 show the results of the test carried out on the model in configuration 4 under variable climatic conditions, with high external illuminance values in the morning and a very irregular illuminance trend in the afternoon, which greatly influenced the interior illuminance. Sensors n. 1 and n. 3 were often out of range, the first one probably hit by direct solar radiation, the second by significant reflections from the ceiling. It was evidenced how accidental factors can greatly affect the results. Only during the last period of the test time, when external illuminance was low, general considerations could be deduced about the performance of the light shelf. In fact, as highlighted in Fig. 20, a very irregular DR % trend was verified for almost the entire experiment.
Figure 19
Fig. 19. Results of the test of Mar 13th – configuration 4, variable climatic conditions (External illuminance referred to the 2° vertical axis).
Figure 20
Fig. 20. Results of the test of Mar 13th – configuration 4, variable climatic conditions.
The test in Configuration 5 was carried out on March 14th under a regular trend of external illuminance. Data in position 1 was out of range before 10.15, between 10.30 and 11.00, between 11.25 and 14.00, and between 14.45 and 16.00. Illuminance in position 2 was out of range between 15.00 and 15.15. Illuminance in position 3 was out of range between 13.30 and 13.40 and it was higher than illuminance in position 2 between 13.00 and 14.30. This last irregularity does not only depend on the high illuminance values, but on the presence of direct solar radiation. In fact, it did not take place in correspondence with the highest illuminance data that were verified at 11.50 (see Fig. 21). These considerations are confirmed by the DR % trend shown in Fig. 22.
Figure 21
Fig. 21. Results of the test of Mar 14th – configuration 5, regular trend of external illuminance (External illuminance referred to the 2° vertical axis).
Figure 22
Fig. 22. Results of the test of Mar 14th – configuration 5, regular trend of external illuminance.
The last test was carried out on March 15th in Configuration 6 under variable climatic conditions: partially sunny in the morning and cloudy in the afternoon. It is noticeable that no irregularities took place, confirming that solar radiation is the main cause for out of range data and in absence of them a regular illuminance trend took place (see Fig. 23). These considerations are confirmed by the DR % trend (see Fig. 24).
Figure 23
Fig. 23. Results of the test of Mar 15th – configuration 6, variable climatic conditions (External illuminance referred to the 2° vertical axis).
Figure 24
Fig. 24. Results of the test of Mar 15th – configuration 6, variable climatic conditions.
Table 6 shows the average values of DR % and the relative standard deviations in the measurement positions in all the tests, while Fig. 25 shows the average DR in the measurement positions. All the configurations allowed the illuminance decreasing respect to the base configuration in position 1, 2 and 3, while the most uniform distribution of D was obtained in configurations 4 and 6. The ratio between the minimum (pos. 5) and maximum (pos. 1) values are respectively 0.31 and 0.27.
Figure 25
Fig. 25. Comparison of the average D for the six different configurations of the light shelf.
Table 6
Table 6. Average DR % and standard deviations for all the tests.
7. Comparison of data
In the scale model approach under real sky, some unpredictable factors significantly penalize the results’ accuracy. As highlighted by the results, particularly significant was the influence of direct solar radiation on interior illuminance, such as the variability of external climatic conditions.
In this section, the authors firstly compared data measured with similar values of external illuminance under cloudy sky, without direct sunlight, specifically about 5 and 10 klx, thus reducing this cause of inaccuracy. Since similar values of external illuminance do not always occur at the same time during the day, the luminance distributions of sky may differ from each other also in the case of similar external illuminance on a horizontal work-plane. For this reason, in this work the authors focused particular attention on selecting corresponding data of different tests verified approximately at the same time during the day. Since data of Configuration 5 did not have these characteristics in the case of Eext = 10 klx, it was not considered in the analysis (see Fig. 26 and Table 7). The results are shown in Figs. 26 and 27 and in Tables 7 and 8.
Figure 26
Fig. 26. Comparison of data for six different configurations of the light shelf with Eext = 10 klx.
Figure 27
Fig. 27. Comparison of data from six different configurations of the light shelf with Eext = 5 klx.
Table 7
Table 7. PIV with Eext = 10 klx.
It is evident from Fig. 26 and Table 7 that the adoption of light shelf reduces daylight availability in position 1 in all the configurations (PIV<0) and in position 2 in configurations 1, 3 and 6, while it increases daylight in positions 3 to 6 in all the configurations considered. Configurations 4 and 6 seem to be the most performant from this point of view. The maximum percentage variation was about 60% in configuration 4 position 5, confirming the high suitability of light shelves to improve daylight away from the window, thus contributing to a more uniform distribution of light. Besides, the particular geometrical characteristics of configuration 4 (inclination angle of 20 ° of the external surface) are very efficient from this point of view.
The results shown in Fig. 27 and Table 8 do not confirm at all the considerations from data of Table 7 and Fig. 26 regarding position 1, close to the window, in which a reduction of daylight availability was registered in configurations 1, 4 and 6, and an increment in configurations 2, 3 and 5. Moreover, configuration 1 seems to be inefficient in all the measurement positions (PIV <0). while 2, 3 and 5 improve the performance of the system in all the positions. In this case, the maximum value is registered in position 5 and configuration 5, with an increment of 150 % with respect to the base case. The inclination angle of 30° of the external surface seems to be the most efficient in directing daylight away from the window.
Table 8
Table 8. PIV with Eext = 5 klx.
In a successive phase, the authors carried out a comparison between data in the six different configurations with clear sky conditions. In this case, it would be important to evaluate the shielding action of the external portion of the light shelf, but the tests carried out between January and March did not allow to estimate it, due to the low sun elevation. In addition, the base configuration and the configuration 1 were not equipped by the external portion of the light shelf. Based on these considerations, the authors calculated the frequency function of data for each test with the aim to determine the most uniform distribution of daylight among those produced by the six different configurations. They determined the frequency of values lower than 5 klx, from 5 and 10 klx, from 10 and 15 klx, and upper than 15 klx. The results are shown in Table 9 and Fig. 28.
Table 9
Table 9. Frequency function for all the configurations tested (5, 10, 15 klx).
Figure 28
Fig. 28. Frequency function for all the configurations tested.
Since the test in Configuration 1 was carried out under cloudy sky, with Eext < 11 klx, the results were not significant to evaluate the performance of the light shelf with clear sky. In fact, 100% of data were lower than 5 klx. The configurations 4 and 5 had the minor density of values in the range < 5 klx (respectively 65.8 % and 55.5 %) and the maximum in the range 5 klk - 10 klx (respectively 27.3 % and 38.6 %). So they seem the most performant in producing uniformity in the distribution of daylight, causing a reduction of the differene between minimum and maximum values of illuminance.
Successively, the authors carried out a comparison between data in configurations 2, 3, 4, 5 with external illuminance of about 60 klx (Fig. 29). Configurations 1 and 6 were not considered in this phase because such external illuminance did not occur during the experiments with these configurations. As previously underlined, these tests were carried out on March with low sun elevation, therefore the shielding action of the external portion of the light shelf was not evident. Furthermore, configurations 4 and 5 were characterized by high values of DR % in position 3 (probably accentuated by direct solar radiation) and by the best ratio between minimum and maximum values of DR % (0.27 for configuration 5 and 0.44 for configuration 4).
Figure 29
Fig. 29. DR values for Configurations 2-5 with Clear sky conditions, Eext = 60 klx.
Finally, the authors calculated the frequency function for all the configurations in order to determine the density of values lower than 500 lx, between 500 and 1000 lx and upper than 1000 lx. As shown in Table 10 and Fig. 30 the configurations 3, 4 and 5 allowed to increase illuminance upper than 1000 lx.
Table 10
Table 10. Frequency function for all the configurations tested (500 and 1000 lx).
Figure 30
Fig. 30. Frequency function for all the configurations tested (500 and 1000 lx).
8. Discussion
Based on the results of the experimental tests carried out by the authors, the issue that the scale model approach overestimates illuminance values with respect to real scale ones has been reinforced. Furthermore, although the authors paid particular attention to positioning the model exactly with the same view factor as the real size room, some errors may have been verified during the compared experimental activity due to a light misalignment of models or corresponding sensors.
The results presented in this paper confirmed the knowledge deducible from literature that attests the overestimation of data in scale models with respect to real scale rooms even if this is particularly true in absence of direct sunlight. Once more, the significant influence of direct solar radiation is underlined. As an example, this is evident in Figs. 31 and 32 that show some photos taken during the tests in configuration 2 and 3 respectively. Figure 31 shows the sensor in position 1 hit by direct sun light between 11.30 and 13.15, while in the same time range, shadows produced inside by the external portion of the light shelf affected the measurement positions 2 to 5. Figure 32 shows very intense solar radiation reflected by the device and the reflecting surface applied on the ceiling, influencing illuminance data in the model.
Figure 31
Fig. 31. Photo of the model during the test of Mar 7th - configuration 2.
Figure 32
Fig. 32. Photo of the model during the test of Mar 9th - configuration 3.
Obviously all these causes of inaccuracy are mitigated under cloudy sky as attested by the results of the tests carried out without the presence of direct sunlight. In any case, despite all these weaknesses, the authors were able to do reliable considerations about the performance of the light shelf in the six different configurations considered.
The experimental analysis was carried out on six different configurations of an external-internal light shelf applied on the window of the scale model. The results have shown the efficacy of the light shelf to improve the uniformity of interior daylight distribution particularly in configurations 4 and 5 that present the outer reflecting surface inclined of 20° and 30° respectively. These considerations derive from the experimental data collected under cloudy sky and are confirmed by data under clear sky, although more difficulties arose in the analysis of these last, due to the presence of intense direct solar radiation.
9. Conclusions
This paper is focused on the use of the experimental scale model approach for investigating the performance of light shelves and the authors present the preliminary results of a series of tests carried out on a reduced scale model of a real scale room equipped with an external-internal horizontal light shelf. In agreement with literature, the principle weakness of the method has been confirmed, underlyining that variable climatic conditions, particularly in the presence of direct sunlight, stricly affect experimental data. The authors confirm the tendence to overestimate daylight availability in reduced scale models with respect to data in real size rooms, as attested by literature. This general trend occurs, except for cases of direct sun light which cause peak values or shadows in particular points in internal areas.
The experimental analysis was carried out on a 1:5 scale model of a personal office room placed in the building of the University “G. D’Annunzio” in Pescara. The daylight distribution was measured and the percentage Daylight Ratio was determined in the interior environment, considering six different geometric configurations of an internal-external light shelf applied on the window. The experimental data for each configuration were compared with those obtained in the model without light shelf (base configuration).
The authors demonstrated that useful assessments regarding the performance of the light shelf can be done also from preliminary results. Despite its limitations, the scale model analysis can be considered a useful investigation tool to make general evaluations due to its inexprnsive costs and simple applicability. This is particularly true in the case of comparing tests aimed at determining the light shelves’ performances depending on different geometric configurations.
In this perspective it is very important to select data logged during the test with external climatic conditions that are not influenced by the presence of direct sun-light, with the awareness that direct sunlight improves ligt shelves’ performances.
Among the six different configurations of light shelves proposed in this work. configurations 4 and 5 are preferrable. They are characteried by the presence of an internal reflecting surface applied on the ceiling and an external one with two different inclinations (20° and 30 °). Thanks to the application of a highly reflective surface on the light shelf and on the ceiling of the model the uniformity of internal daylight distribution is increased. Further developments of the work will concern the use of numerical simulations to validate the experimental results and to calculate dynamic daylight metrics.
Contributions
The authors have contributed equally.
References
- T. Liu, Z. Tan, C. Xu, H. Chen, Z. Li, Study on deep reinforcement learning techniques for building energy consumption forecasting, Energy and Buildings 208 (2020) 109675. https://doi.org/10.1016/j.enbuild.2019.109675
- X. Cao, X. Dai, J. Liu, Building energy-consumption status worldwide and the state-of-the-art technologies for zero-energy buildings during the past decade, Energy Building 128 (2016) 198-213. https://doi.org/10.1016/j.enbuild.2016.06.089
- I. Golasi, F. Salata, A. de Lieto Vollaro, A. Peña-García, Influence of lighting colour temperature on indoor thermal perception: a strategy to save energy from the HVAC installations, Energy and Buildings, 185 (2019) 112-122. https://doi.org/10.1016/j.enbuild.2018.12.026
- Z. Yu, B. C.M. Fung, F. Haghighat, H. Yoshino, E.Morofsky, A systematic procedure to study the influence of occupant behavior on building energy consumption, Energy and Buildings 43 (2011) 1409–1417. https://doi.org/10.1016/j.enbuild.2011.02.002
- O. T. Masoso, L. J. Grobler, The dark side of occupants’ behaviour on building energy use, Energy and Buildings 42 (2010) 173–177. https://doi.org/10.1016/j.enbuild.2009.08.009
- L. Bellia, F. Fragliasso, E. Stefanizzi, Daylit offices: A comparison between measured parameters assessing light quality and users’ opinions, Building and Environment 113 (2017) 92–106. https://doi.org/10.1016/j.buildenv.2016.08.014
- V. R. M. Lo Verso, A. Pellegrino, Energy saving generated through automatic lighting control systems according to the estimation method of the standard EN 15193-1, Journal of Daylighting 6 (2019) 131-147. https://doi.org/10.15627/jd.2019.13
- CEN (Comité Européen de Normalisation), European Standard EN 15193:2007, Energy performance of buildings, Energy requirements for lighting, Brussels, 2007.
- M. A. Momani, B. Yatim, M. A. M. Ali, The impact of the daylight saving time on electricity consumption—a case study from Jordan, Energy Policy 37 (2009) 2042–2051. https://doi.org/10.1016/j.enpol.2009.02.009
- J. Mardaljevic, M. Heschong, E. Lee, Daylight metrics and energy savings, Lighting Research and Technology 41 (2009) 261–283. https://doi.org/10.1177/1477153509339703
- J.H. Heerwagen, D.R. Heerwagen, Lighting and psychological comfort, Lighting Design and Application 16 (1986) 47–51.
- P. Leather, M. Pyrgas, D. Beale, C. Lawrence, Windows in the workplace: sunlight, view, and occupational stress, Environment and Behaviour 30 (1998) 739–762. https://doi.org/10.1177/001391659803000601
- A.D. Galasiu, J.A. Veitch, Occupant preferences and satisfaction with the luminous environment and control systems in daylit offices: a literature review, Energy and Buildings 38 (2006) 728–742. https://doi.org/10.1016/j.enbuild.2006.03.001
- M.S. Alrubaih, M.F.M. Zain, M.A. Alghoul, N.L.N. Ibrahim, M.A. Shameri, O.Elayeb, Research and development on aspects of daylighting fundamentals, Renewable and Sustainable Energy Reviews 21 (2013) 494–505. https://doi.org/10.1016/j.rser.2012.12.057
- L. Bellia, F. Fragliasso, E. Stefanizzi, Why are daylight-linked controls (DLCs) not so spread? A literature review, Building and Environment 106 (2016) 301–312. https://doi.org/10.1016/j.buildenv.2016.06.040
- M.Bonomolo, M.Beccali, V.Lo Brano, G.Zizzo, A set of indices to assess the real performance of daylight-linked control systems, Energy and Building, 149 (2017) 235-245. https://doi.org/10.1016/j.enbuild.2017.05.065
- L.T. Doulos, A. Kontadakis, E.N.Madias, M. Sinou, A. Tsangrassoulis, Minimizing energy consumption for artificial lighting in a typical classroom of a Hellenic public school aiming for near Zero Energy Building using LED DC luminaires and daylight harvesting systems, Energy and Building 194 (2019) 201-217. https://doi.org/10.1016/j.enbuild.2019.04.033
- L. Doulos, A. Tsangrassoulis. F.V. Topalis, Multi-criteria decision analysis to select the optimum position and proper field of view of a photosensor, Energy Conversion and Management, 86 (2014) 1069–1077. https://doi.org/10.1016/j.enconman.2014.06.032
- D. A. C. Pool, A Comprehensive Evaluation of Perforated Façades for Daylighting and Solar Shading Performance: Effects of Matrix, Thickness and Separation Distance, Journal of Daylighting 6 (2019) 97-111. https://doi.org/10.15627/jd.2019.10
- H. F.O. Mueller, Application of Micro-structured Sunlighting Systems in Different Climatic Zones, Journal of Daylighting 6 (2019) 52-59. https://doi.org/10.15627/jd.2019.7
- I. Ullah, Fiber-based daylighting system using trough collector for uniform illumination, Solar Energy 196 (2020) 484-493. https://doi.org/10.1016/j.solener.2019.12.052
- R. Canziani, F. Peron, G. Rossi, Daylight and energy performances of a new type of light pipe, Energy and Buildings 36 (2004) 1163–1176. https://doi.org/10.1016/j.enbuild.2004.05.001
- D. Jenkins, T. Muneer, J. Kubie, A design tool for predicting the performances of light pipes, Energy and Buildings 37 (2005) 485–492. https://doi.org/10.1016/j.enbuild.2004.09.014
- J. Nieves and R. Lindsay, Vitamin D malnutrition and skeletal health in the nursing home, Nursing Home Medicine 2 (1994) 167-170. https://doi.org/10.1016/s0360-1323(03)00061-1
- F. Chella. A. Scarduzio. P. Zazzini. Numerical and experimental analysis of light pipes' performances: Comparison of the obtained result. PLEA 2006 - 23rd International Conference on Passive and Low Energy Architecture. Geneva; Switzerland. 6 – 8 September 2006. Conference Proceedings2006. Pages II219-II224. Code 92432.
- M. Al-Marwaee, D. Carter, Tubular guidance systems for daylight: Achieved and predicted installation performances, Applied Energy, 83 (2006) 774-788. https://doi.org/10.1016/j.apenergy.2005.08.001
- L.M. Gil-Martín, A. Peña-García, A. Jiménez, E. Hernández-Montes, Study of Light-pipes for the use of sunlight in road tunnels: from a scale model to real tunnels, Tunnelling and Underground Space Technology 41 (2014) 82-87. https://doi.org/10.1016/j.tust.2013.11.007
- A. Peña-García, L.M. Gil-Martín, E. Hernández-Montes, Use of sunlight in road tunnels: An approach to the improvement of light-pipes’ efficacy through heliostats, Tunnelling and Underground Space Technology 60 (2016) 135-140. https://doi.org/10.1016/j.tust.2016.08.008
- H. v. Wachenfelt, V. Vakouli, A. Pacheco Diéguez, N. Gentile, M.-C. Dubois, K.-H. Jeppsson, Lighting Energy Saving with Light Pipe in Farm Animal Production, Journal of Daylighting 2 (2015) 21-31. https://dx.doi.org/10.15627/jd.2015.5
- A. P. Diéguez, N. Gentile, H. v. Wachenfelt, M.-C. Dubois, Daylight Utilization with Light Pipe in Farm Animal Production: A Simulation Approach, Journal of Daylighting 3 (2016) 1-11. http://dx.doi.org/10.15627/jd.2016.1
- A. D. Spacek, J. M. Neto, L.D. Biléssimo, O.H. Ando Junior, M.V.F. Santana, C.D.F. Malfatti, Proposal of the Tubular Daylight System Using Acrylonitrile Butadiene Styrene (ABS) Metalized with Aluminum for Reflective Tube Structure, Energies 11 (2018) 199. https://doi.org/10.3390/en11010199
- C. Baroncini, F. Chella, P. Zazzini, Numerical and experimental analysis of the double light pipe. a new system for daylight distribution in interior spaces, International Journal of Low Carbon Technologies 3 (2008)110–125. https://doi.org/10.1093/ijlct/3.2.110
- C. Baroncini, O. Boccia, F. Chella, P. Zazzini, Experimental analysis on a 1:2 scale model of the double light pipe. an innovative technological device for daylight transmission, Solar Energy 84 (2010) 296–307. https://doi.org/10.1016/j.solener.2009.11.011
- C. Baroncini, F. Chella, P. Zazzini, Numerical analysis on daylight transmission and thermal comfort in the environments containing devices called double light pipes (DLP), in: Proceedings of the World Renewable Energy Congress, 2011, Linkoping. Sweden. https://doi.org/10.3384/ecp110571914
- O. Boccia, F. Chella, P. Zazzini, Innovative devices for daylighting and natural ventilation in architecture, Solar Radiation, Elisha B. Babatunde, IntechOpen, pp. 269-290, 2012. https://doi.org/10.5772/34823
- A. Kontadakis, A. Tsangrassoulis, L. Doulos, S. Zerefos, A Review of Light Shelf Designs for Daylit Environments. Sustainability 10-1 (2018) 71. https://doi.org/10.3390/su10010071
- A.A. Freewan, L. Shao, S. Riffat, Optimizing performance of the lightshelf by modifying ceiling geometry in highly luminous climates, Solar Energy 82 (2008) 343–353. https://doi.org/10.1016/j.solener.2007.08.003
- U. Berardi, A. H. Khademi, Analysis of the impact of light shelves on the useful daylight illuminance in office buildings in Toronto, Energy Procedia 78 (2015) 1793-1798. https://doi.org/10.1016/j.egypro.2015.11.310
- F. Rizzo, M. Barbato, V. Sepe, Peak factor statistics of wind effects for hyperbolic paraboloid roofs, Engineering Structures, 173 (2018) 313-330. https://doi.org/10.1016/j.engstruct.2018.06.106
- F. Rizzo, G. Maddaloni, A. Occhiuzzi, A. Prota, High-rise building dynamics identification through shaking table measurements on scale model for multi-hazard experiments 2019, in: Proceedings of the ANIDIS (Associazione Nazionale Italiana di Ingegneria Sismica), 2019, Ascoli, Italy.
- H. Lee, K. Kim, J. Seo, Y, Kim, Effectiveness of a perforated light shelf for energy saving, Energy and Buildings 144 (2017) 144-151. https://doi.org/10.1016/j.enbuild.2017.03.008
- O. Boccia, P. Zazzini, Daylight in buildings equipped with traditional or innovative sources: a critical analysis on the use of the scale model approach, Energy and Buildings 86 (2015) 376–393. https://doi.org/10.1016/j.enbuild.2014.10.003
- G.A. Warrier, B. Raphael, Performance evaluation of light shelves, Energy and Buildings 140 (2017) 19–27. https://doi.org/10.1016/j.enbuild.2017.01.068
- A. Thanachareonkit, J.-L. Scartezzini, M. Andersen, Comparing daylighting performances assessment of buildings in scale models and test modules, Solar Energy, 79-2 (2005) 168-182. https://doi.org/10.1016/j.solener.2005.01.011
- M. Bodart, A. Deneyer, A. De Herde, P. Wouters, A Guide for Building Daylight Scale Models Architectural Science Review, 50-1 (2007) 31-36. https://doi.org/10.3763/asre.2007.5005
- D. Kesten, S. Fiedler, F. Thumm, A. Loffler, U. Eicker, Evaluation of daylight performance in scale models and full-scale mock-up office, International Journal of Low carbon Technologies 5-3 (2010) 158–165. https://doi.org/10.1093/ijlct/ctq023
- S.W.A. Cannon-Brookes, Simple scale models for daylighting design: analysis of sources of error in illuminance prediction, Lighting Research and Technology 29 (1997) 135–142. https://doi.org/10.1177/14771535970290030901
- C. Aghemo, A. Pellegrino, V.R.M. Lo Verso, The approach to daylighting by scale models and sun and sky simulators: a case study for different shading systems, Building and Environment 43 (2008) 917–927. https://doi.org/10.1016/j.buildenv.2007.01.020
Copyright © 2020 The Author(s). Published by solarlits.com.

2794
Total views
Citations
SHARE ON


