Volume 8 Issue 1 pp. 134-148 • doi: 10.15627/jd.2021.10
Optimal Window to Wall Ratio Ranges of Photovoltachromic Windows in High-Rise Office Buildings of Iran
Soheil Fathi, Allahbakhsh Kavoosi*
Author affiliations
Department of Architectural Engineering, Faculty of Engineering, Razi University, Kermanshah, Iran
*Corresponding author.
fathi.soheil@stu.razi.ac.ir (S. Fathi)
a.kavoosi@razi.ac.ir (A. Kavoosi)
History: Received 15 February 2021 | Revised 11 April 2021 | Accepted 29 April 2021 | Published online 22 May 2021
Copyright: © 2021 The Author(s). Published by solarlits.com. This is an open access article under the CC BY license (http://creativecommons.org/licenses/by/4.0/).
Citation: Soheil Fathi, Allahbakhsh Kavoosi, Optimal Window to Wall Ratio Ranges of Photovoltachromic Windows in High-Rise Office Buildings of Iran, Journal of Daylighting 8 (2021) 134-148. https://dx.doi.org/10.15627/jd.2021.10
Figures and tables
Abstract
Windows are one of the weakest building components concerning high thermal losses. Traditional windows cannot adapt to external and internal environmental conditions. On the other hand, smart windows such as electrochromic (EC) windows do not emit greenhouse gases and adapt to environmental conditions and increase indoor environmental quality. The combination of EC windows and building integrated photovoltaic system (BIPV) is called photovoltachromic (PVC) windows. This paper aims to find optimal window to wall ratio (WWR) ranges of PVC windows in a high-rise office building model in four different cities in Iran. This paper uses several simulations to find the optimal WWR ranges of PVC windows using Radiance and EnergyPlus. First, the minimum acceptable WWR value in each climate condition was identified using several simulations without any optimization tools. Afterward, traditional windows were replaced with EC windows and results indicated that energy consumption of the building reduced up to 15.94%. In the next stage, BIPV was combined with EC windows, and results indicated that BIPV reduced energy consumption of the building up to 7.55%. Finally, simulation results showed that PVC windows reduced energy consumption of the building up to 16.31% in Kermanshah, 19.69% in Tehran, 18.59% in Yazd and 17.36% in Bandar Abbas. Also, the optimal WWR range of PVC windows in Kermanshah was 80-90%, while it was 70-80% in Tehran, Yazd and Bandar Abbas. Simulation results indicated that cooling degree days (CDD) of the site, where buildings were located, effected on the optimal WWR range of PVC windows in high-rise office buildings. An analytical approach was used to validate simulation results, and it showed that simulation results had 1.60-6.22% error.
Keywords
High-rise building, Electrochromic smart windows, Building integrated photovoltaic, Window-to-wall ratio
1. Introduction
Building and construction sector consume near 36% of the total energy consumption of the world [1]. This large amount of energy consumption has created new policies around the world to mitigate both energy consumption and greenhouse gas emissions [2]. The building envelope can regulate solar heat gain and light transmittance entering into the building. High-rise buildings consume a large amount of energy, and it is essential to reduce energy consumption of these building types as much as possible.
On the other hand, an office building is occupied during specific hours, and since solar energy is always available during working hours, it receives significant amount of solar energy. Solar energy can have benefits, while an additional amount of heat can increase cooling demand. Therefore, high-rise office buildings use a large amount of energy and receive solar energy during occupied hours, and several researches have tried to mitigate energy consumption of these building types.
The average energy use intensity (EUI) of office buildings in Iran is about 350 kWh/m2.year, which is more than the global average [3]. Therefore, it is essential to mitigate the energy consumption of these building types as much as possible. Optimization can be defined as finding the best solution among lots of possible answers [4], and it is essential to choose the right thermal and optical properties of windows. Smart windows are the new generation of windows capable of adapting to environmental conditions in a dynamic way [5–7]. These windows can be categorized according to their thermal and optical performance [8–12]. Each smart window has some advantages and disadvantages. Several researches have discussed different types of smart windows and their effect on energy consumption and daylighting performance of buildings in different climate conditions.
Active shading devices (electrochromics, suspended particle devices and liquid crystals) are more efficient in comparison with passive shading devices (phase change materials, thermotropics, thermochromics, gasochromics) and electrochromic (EC) window is the best choice for building application among active shading devices [5]. These new technologies, such as EC windows, are expensive. If designers do not find optimal solutions to mitigate the costs of these windows, these new technologies can have more disadvantages than their advantages [13]. EC windows belong to active shading systems that react to environmental conditions in an active way [6]. These windows are made of five thin layer coatings (Fig. 1) [10]. The most effective parameters that can improve thermal and optical performance of EC windows are overall heat loss coefficient (U-value), solar heat gain coefficient (SHGC) and visible transmittance (Tvis) [7,12,14]. Photovoltaic (PV) technology is a practical renewable energy resource that its application is increasing in buildings and can be combined with buildings in two types, including building attached photovoltaic systems (BAPV) and building integrated photovoltaic systems (BIPV) [15,16]. BAPVs cannot be combined with windows due to lack of visibility and blocking view to outside, but these systems can be used in other parts such as roofs [17,18]. On the other hand, BIPVs can be integrated with windows and provide view to outdoor simultaneously [19,20].
EC smart windows showed great energy saving potentials for Swiss office buildings and showed 11% energy saving potential in lighting and cooling demand [21]. Fang et al. [22] evaluated thermal performance of an EC window and results of their research showed that EC windows could absorb 60% of solar radiation in their tinted state. DeForst et al. [23] assessed thermal performance of near-infrared electrochromic windows (NEC) in 16 different climate regions of the United States and their research showed that the best performance locations included medium offices and midrise residential buildings. EC windows reduced approximately 48% of monthly peak solar heat loads in winters and about 53% in summers compared to double-glazed windows with no shading devices [24]. Lee et al. [25] evaluated the effect of EC windows on energy consumption of medium-sized commercial buildings in different climate conditions. They indicated that using EC windows with optimal control type reduced 17.40% of annual heating and cooling demand.
Salameh et al. [26] showed that using BIPV system in Sharjah, United Arab Emirates (UAE) reduced 27.69% of annual electricity consumption. Qiu et al. [27] evaluated a proposed vacuum PV insulated glass unit using various experiments and indicated that this proposed glass unit achieved a very low U-value (around 1.5 W/m2.K) and cooling load reduced up to 14.20% [27]. Abdelhakim et al. [28] evaluated the effect of BIPV windows on energy consumption of an office building. They indicated that these windows reduced the cooling demand of the building and provided thermal comfort during the summer season.
According to thermal and optical properties of EC windows and BIPVs, the combination of these technologies can be very effective in window applications. These windows are called photovoltachromic (PVC) windows. Wu et al. [29] reported these novel devices (PVC windows) for the first time and indicated that these windows were composed of EC electrode and dye-sensitized TiO2 NP photoanode. In a recent research, thermal and optical properties of PVC windows were identified using experiments [30]. In this research, authors proposed a novel architecture for PVC windows and demonstrated that coloration intensity of EC devices had direct relation with the voltage applied. For the first time, Cannavale et al. [31] indicated that perovskite PVC windows with self-adaptive transparency had 16-26% average visible transmittance and 3.70-5.50% maximum light power conversion efficiency. Fiorito et al. [32] showed that PVC windows reduced energy consumption of office buildings up to 20% in cooling dominated regions and reduced energy consumption up to 32% in heating dominating regions. Favoino et al. [33] assessed active control strategies of PVC windows in an office room and it was found that these control strategies reduced energy consumption of the test case model between 2-12% in comparison with static alternatives. Pierucci et al. [34] evaluated environmental impacts of PVC windows in different climate conditions. They compared PVC windows with traditional windows in two office buildings and indicated that using PVC windows reduced the environmental impacts between 41-44%. Cannavale et al. [35] improved photovoltaic performance of PVC windows from 3.26% to 6.55%. They investigated the effect of the electrolyte composition on both photoelectrochromic (PEC) and PV performances of PVC devices by tuning the iodide content in the electrolyte.
Window to wall ratio (WWR) values can reduce or increase energy consumption of a building [36]. Optimal WWR values depend on various parameters such as lighting power density, climate, window orientation and the insulation features of the envelope [37,38]. Chi et al. [39] evaluated different WWR values between 10-90% in rural residences in China using daylight factor (DF), air temperature and air velocity parameters under different building orientations. Marino et al. [38] evaluated the effect of several factors, including various climates, thermal features of the building envelope, the installed lighting electric power and EC smart windows on optimal WWR value of office buildings in various climate conditions in Italy. They indicated that the optimal WWR value did not change considerably when the effect of each parameter was assessed individually. Xue et al. [40] evaluated thermal and optical performance of external shading devices in a hotel building in China to find the relation between daylight performance and energy consumption of the building [40]. This research tried to find optimal WWR ranges that could be used in other researches and other climates. Goia [41] searched for optimal WWR in office buildings in different European climates. This research indicated that optimal WWR range varied between 30-45% in various climate conditions and orientations. Pino et al. [42] assessed the effect of WWR on thermal and lighting behavior of office buildings in Chile and indicated that a WWR of 20% was adequate to reach useful daylight at 80% of the time throughout the year. Yeom et al. [43] determined optimal WWR for office buildings in South Korea to improve workers’ task performance and energy performance and demonstrated that the optimal WWR was 60%, where the highest task performance was achieved. Phillips et al. [44] compared different WWR values in a 12 story office building under various climate conditions in the United States. They indicated that there was a direct relation between WWR values and environmental impacts, occupant dissatisfaction and life cycle cost [44].
It is essential to improve visual and thermal performance of windows simultaneously. Previous studies assessed visual performance of office buildings [45–50], and each one used specific daylighting metrics. Karlsson and Roos [51] assessed visual performance of EC windows in a real window using experiments and used direct solar transmittance, Tsol, Tvis and angular dependence parameters to evaluate the performance of EC windows and concluded that the optimal performance of these windows was largely dependent on the application and site’s location. Piccolo et al. [52] evaluated optical performance of EC windows with respect to daylighting control in indoor environments using field measurements. They indicated that the angular selectivity of the glazing combined with its active switching effect allowed a wide range of visible transmittance according to the latitude and orientation of a building in various climate conditions. Page et al. [48] assessed visual performance of EC windows using an integrated system that used both EC windows and an anidolic daylighting system. They showed the potential of using this integrated system to control daylight flux entering a working place and indicated that EC windows could be effectively combined with other systems to benefit from other systems as well as these smart windows. Wu et al. [53] designed and conducted an experiment for a building to evaluate the effect of an integrated EC glazing automation system on daylight provision and inconvenient glare for occupants. This research demonstrated that about 83% of working hours for work-plane illuminance (WPI) and 95% of the time for daylight glare probability (DGP) remained in comfort spectrum using EC glazing automation system under clear sky conditions while under clear sky with thin clouds WPI remained about 68% and DGP about 94% of the time within the comfort range and in partly cloudy skies, WPI was within desired range during 62% and DGP about 85% of the time. Cannavale et al. [54] evaluated the effect of PVC windows on useful daylight illuminance (UDI) and DGP using experiments (a standard test room) and simulations (DAYSIM software). This paper indicated that average UDI for a typical room increased up to 71.80% when traditional windows were replaced with PVC windows while intolerable glare levels (DGP higher than 0.45) decreased down to 12%.
It can be concluded that previous studies evaluated the effect of EC smart windows, BIPV and PVC windows on energy consumption of various buildings using both experiments and simulation methods. Also, some previous studies indicated the effect of WWR on energy consumption of buildings. On the other hand, several researches improved thermal and optical properties of these smart windows using various interesting methods. According to these previous studies about EC windows, BIPVs and PVC windows, it can be concluded that it is important to find a relation between WWR and thermal and optical properties of PVC windows. Therefore, this paper tries to find optimal WWR ranges of PVC windows in a high-rise office building model in four cities in Iran. This paper indicates the relation between WWR and energy consumption of high-rise office buildings before and after using PVC windows. The novelty of this paper is that it evaluates the effect of latitude and cooling degree days (CDD) parameters on energy consumption of high-rise office buildings before and after using PVC windows with various WWR values. This paper uses a unique simulation method to find optimal WWR values of PVC windows that can be used in other researches and various climate conditions.
2. Methodology
2.1. Research method
This paper uses several simulations to find optimal WWR ranges of PVC windows in a high-rise office building model in four climate conditions in Iran. This paper aims to evaluate the effect of CDD and latitude of a city on energy consumption of PVC windows in high-rise office buildings. Therefore, four cities were selected according to their CDD and latitude value, including Kermanshah, Tehran, Yazd and Bandar Abbas. First, architectural plans and 3D form of the building are designed. Then, the 3D model is imported to DesignBuilder to begin the simulation process, and the overall simulation process is shown in Fig. 2. All required inputs are entered in DesignBuilder simulation software according to both international standards [55,56] and Iran National Construction regulations [57–62].
Also, weather data of four cities with different climate conditions in Iran are used during the simulation process. These data were collected from weather files and Iran national building code number 14 [58]. Table 1 indicates the climate data of four climate zones and their properties.
Afterward, daylighting simulations are performed using Radiance to find minimum acceptable WWR input in each climate condition. Among daylighting metrics, spatial daylight autonomy (sDA) and UDI have been used in this paper to find the minimum acceptable WWR value in each climate condition. Radiance can use annual daylighting simulations to calculate sDA and UDI amounts for a building. According to LEED v4 certificate, sDA300lux/50% should achieve at least 55% of the occupied floor area in new constructions and UDI300-3000lux should achieve 75% of occupied floor area in new constructions. In this paper, a new daylighting simulation method is used to find minimum WWR value of the building. After daylighting simulations, WWR values that pass minimum daylighting requirements will be used during the simulation process.
EnergyPlus simulation software is used to calculate energy consumption of the building during the optimization process. Primary simulations are performed to calculate energy consumption of the building with various WWR values in each climate condition. In the next stage, traditional window is replaced with EC smart window. In this section, simulation results are compared with previous results without EC windows to indicate the effect of EC windows on energy consumption of the building in various climate conditions. Afterward, BIPV is combined with EC window and PVC window is created here. In this section, several simulations are performed, and the effect of PVC windows on energy consumption of the building is evaluated. Then, optimal WWR range of PVC windows in each city is identified. In the end, daylighting simulations are performed to indicate that optimal WWR ranges of PVC windows provide the minimum illuminance value according to LEED v4 certificate.
2.2. Architectural design
In this section, a 17-storey office building is designed for typical office works. Eleven different floor plan types (Fig. 3) are designed, including basement, ground floor, six different office floor plans, thirteenth floor for restaurant, cultural exhibition and one library. Finally, two upper floors, including fourteenth and fifteenth floors are designed as sky lobbies that provide view to outdoor.
The building has two different heights. The height of the basement is 3.15 meter, and the heights of other floors is 2.83 meters. The basement is designed for parking area and one mechanical room. The ground floor has three different parts, including lobby, restaurant and conference room. Architectural plans of office floors divided into two major types, including office floors from first to sixth floors and second type from seventh to twelfth floors. The building form is considered to be circular since it is an aerodynamic shape and is more effective [63]. Due to the lack of previous studies about optimal form of high-rise office buildings, this paper just uses a circular form to focus on its main objectives. Future studies can find optimal form of these building types. In the next step, architectural plans are exported to DesignBuilder to begin the simulation process. A similar model is created with the same plans and heights (Fig. 4).
2.3. Simulation
In this stage, several inputs are entered as primitive values to the model like building activity, working schedule, heating and cooling set point and window parameters. Also, daylighting simulations need accurate inputs to perform simulations, and Table 2 shows thermal and optical properties of the window for energy and daylighting simulations using EnergyPlus and Radiance.
The first part of the simulation process uses daylighting simulations to identify the minimum acceptable WWR value in each city. During daylighting simulations, the work-plane is considered to be 0.75m above the floor level. According to Iran National Construction Regulation No. 13 [59], the recommended illuminance level for office activities is 500lux. Therefore, the minimum sDA value is considered 500lux to provide adequate daylighting during occupied hours. Also, UDI range is considered between 500-1000lux, which is different from LEED v4 certificate (UDI300-3000lux). The minimum UDI value (500lux) is recommended by Iran National Construction Regulation No. 13 [59] for general office activities. Also, this minimum value is used in previous studies [41,50,64], which shows that the minimum acceptable illuminance value can change the minimum UDI value. On the other hand, the maximum UDI value is considered 1000lux for several reasons. First, this paper used two daylighting metrics, including sDA and UDI, while annual sun exposure (ASE1000/250hr) metric should be considered to evaluate visual comfort. According to LEED v4 certificate, ASE1000/250hr indicates excessive sunlight exposure when receiving direct sunlight of 1000 lux or more than this value for more than 250 hours. It should not exceed 10% of the space area, and it is preferred not to be more than 3% to avoid possible visual discomfort. The second reason is that some previous studies used 1000 lux as the maximum amount of perceptible daylighting [65,66]. According to these two studies, the human eye has the capability to adapt to higher illuminance levels, while illuminance values between 1000–2000 lux can cause disturbing glare.
Here, a new method is used to identify the minimum WWR value for the simulation process. Two southern office rooms on each floor (first, third, fifth, seventh, ninth and eleventh floors) are selected, which receive direct solar radiation during working hours and daylighting performance of these office rooms are simulated using Radiance. Figure 5 shows these rooms which are used during daylighting simulations to find the minimum WWR value. Here, sDA and UDI metrics are used to find the minimum acceptable WWR range and Eq. (1) shows how sDA daylighting metric is used to assess daylighting performance of the office rooms and is:
K=1 if sDA500lux/50% ≥ 95%
K=1 if 80% ≤ sDA500lux/50% < 95% and UDI500-1000lux ≥ 80%
K=0 if sDA500lux/50% < 80%
where sDA500lux/50% is the minimum acceptable illuminance level (500lux) for office rooms in this building for more than 50% of occupied hours, and K is a variable that can be 1 or 0 according to sDA500lux/50% percentage of an office room. UDI500-1000lux percentage indicates illuminance level that is within “perceptible threshold” (500-1000 lux) [66,67].
LEED v4 certificate gives 3 points to new constructions that their sDA300lux/50% percent is more than 75%. In this paper, sDA500lux/50% percentage should be 95% or more to provide sufficient daylighting in office spaces as much as possible. Also, sufficient daylighting in office spaces reduces electricity demand of the building since there is no need to use artificial lighting for office spaces when sufficient daylighting is available. According to Eq. (1), when the sDA500lux/50% percentage is more than 95%, the K value is 1. When it is between 80-95% and UDI500-1000lux percentage is equal or more than 80%, the K value is 1. When sDA500lux/50% percentage is less than 80%, the K value is 0. Also, f (K) is calculated in each office room (southern office rooms), and if one office room fails to meet the minimum daylighting requirement, that WWR value will be removed from the simulation process. Eq. (1) is used to find the minimum WWR value in each city, and the mentioned process calculates the minimum WWR value in each climate condition separately.
After daylighting simulations, several simulations are performed to identify energy consumption of the building before using smart windows. These results demonstrate energy consumption of the building in each climate condition. Afterward, traditional glazing type (double-glazed window) is replaced with EC smart window. EC windows are active smart shading devices that use different control types. Here, solar control type is used to control EC windows. This control type reacts to extra amounts of diffuse solar radiation and changes the color of the window to block additional solar radiation. In the next stage, BIPV is combined with EC windows to create PVC windows. BIPVs generate electricity that can be used for changing EC color states and this can reduce electricity demand of buildings. According to Fig. 6, transparent PV film (a non-silicon based thin film) is sandwiched between electrolyte layers. In this section, PVC windows are modelled using thermal and optical properties shown in Table 3.
It is worth mentioning that the energy efficiency of PVC windows is 5% and is calculated using EnergyPlus simulation reports. Other inputs are entered before simulations using cited references. In this stage, optimal WWR ranges of PVC windows in four climate conditions are identified. Afterward, simulation results are compared with primary results and energy saving potential of PVC windows is demonstrated in four climate conditions in Iran.
In the last part of this paper, daylighting simulations are performed using Radiance to indicate daylighting availability in office rooms. LEED v4 certificate is used to show that PVC windows provided the minimum acceptable sDA300lux/50% percentage in office rooms. During daylighting simulations, PVC windows are considered to be tinted entirely during all occupied hours. Meanwhile, it is clear that these windows change their color during occupied hours several times and adapt to their environment according to their control type.
3. Results and discussion
3.1. Daylighting simulations
This section is the first simulation step and aims to remove WWR values that do not meet minimum daylighting requirements. In this section, Eq. (1) is used to identify the minimum acceptable WWR value in each city according to Iran National Construction Regulation No. 13 [59]. According to Fig. 7, daylighting simulations indicate that cities that have more latitude can have fewer WWR values. Solar radiation angle identifies the minimum acceptable WWR value according to sDA and UDI metrics. Results indicate that the minimum acceptable WWR is 40% in Kermanshah and Tehran (heating dominated climates) and 50% in Yazd and Bandar Abbas (cooling dominated climates).
3.2. Primary simulations
Results of this section indicate that energy consumption of the building has a direct relation with WWR and a higher WWR leads to an increase in energy consumption of the building in all climate conditions (Fig. 8). Meanwhile, results indicate that energy consumption of the building has a direct relation with CDD of the cities. Figure 8 shows that high-rise office buildings consume less energy in heating dominated climates. Accordingly, cooling dominated cities, including Yazd and Bandar Abbas consume more energy. It can be concluded that since office buildings need more cooling demand than heating demand, energy consumption of the building in cooling dominated cities is higher than heating dominated cities.
Figure 8
Fig. 8. (a) Energy consumption of the building with different WWR values in four climate conditions; (b) Cooling Degree Days of the cities.
3.3. EC smart windows
In this section, EC smart windows are added to the simulation process that can change optical and thermal properties of windows. The main purpose of using these windows is to control additional solar radiation entering indoor spaces and provide as much view to outdoor spaces as possible. These smart windows can control the color state of windows without blocking view to outdoor spaces in three states, including clear, tinted and intermediate states (between tinted and clear states) [8]. Figure 9 indicates the effect of different windows (traditional, EC and PVC) and different WWR values on energy consumption of the building in four climate conditions. According to the simulation results, Tehran demonstrates the most energy saving potential (15.94%) at 80% WWR. Results indicate that energy consumption of the building reduces up to 13.21% (80% WWR) in Yazd. Also, results show that energy consumption reduces up to 13.03% (80% WWR) in Kermanshah and reduces up to 10.61% (80% WWR) in Bandar Abbas. On the other hand, results indicate that energy consumption of the building using EC windows has a direct relation with CDD and cities which have more CDD (cooling dominated regions) consume more energy. Also, the optimal WWR value is 80% in all climate conditions and this value shows that lower WWR values save less energy than higher WWR values. It can be concluded that WWR values that are less than 80% reduce energy saving potential of PVC windows, while higher WWR values (90% WWR) increase cooling demand of the building since office spaces receive more solar energy. However, this optimal WWR value is just identified for this paper and optimal WWR value of PVC windows depends on the climate conditions of the sites where buildings are located. It is worth mentioning that EC windows were not added to northern office spaces and only various WWR values were applied in northern office spaces during the simulation process.
3.4. Building integrated photovoltaic system
BIPVs can be integrated with windows without blocking view to outdoor environment and generate electricity using solar energy simultaneously. The combination of BIPVs and EC windows creates a window that can react to outdoor environment, change its color in a few minutes and produce electricity simultaneously. In this section, CdTe BIPV thin film is sandwiched between two electrolytes of EC window. DesignBuilder uses thermal properties of BIPVs and combines them with thermal and optical properties of EC windows to create PVC windows. EC windows can operate with various control types to switch between clear and tinted states. The optimal control type of EC windows should change the color of these windows efficiently to reduce energy consumption of the building and increase electricity generation as much as possible. After BIPVs are combined with EC windows in the DesignBuilder environment, several simulations are performed and results are compared with the previous glazing type (EC windows). It is important to note that this building uses EC sensors to change the color state of PVC windows and electricity generation using BIPVs changes as the color state of PVC windows change. Four different set points were imported into the DesignBuilder environment to control PVC windows. These set points were identified using weather data of these cities. The solar set point (diffuse solar radiation amount) is 140 W/m2 in Kermanshah, 150 W/m2 in Tehran, 200 W/m2 in Yazd and 230 W/m2 in Bandar Abbas.
According to Fig. 9, adding BIPV reduces energy consumption of the building up to 3.92% (90% WWR) in Kermanshah, 4.48% (90% WWR) in Tehran, 6.19% (80% WWR) in Yazd and 7.55% (80% WWR) in Bandar Abbas. Simulation results show that higher WWR values generate more electricity using BIPVs. Simulation results indicate that higher WWR values reduce more cooling demand of the building using EC windows increase the electricity generation of BIPVs simultaneously. This fact demonstrates that higher WWR values of PVC windows are more efficient in high-rise office buildings. Meanwhile, simulation results indicate that there is no direct relation between WWR value and energy saving potential and increasing WWR value is not always an effective solution. For instance, simulation results indicate that 90% WWR value increases energy consumption of the building in all climate conditions before and after using PVC windows (Fig. 9). Figure 9 demonstrates that the efficiency of BIPVs is more in cooling dominated regions and their combination with EC windows increases electricity generation in higher air temperatures.
Comparison between final simulation results and primary simulation results indicates that both EC windows and BIPVs can reduce energy consumption of the building and their properties match with each other. Results show that using PVC windows with optimal WWR value reduces energy consumption of the building up to 16.31% in Kermanshah, 19.69% in Tehran, 18.59% in Yazd and 17.36% in Bandar Abbas. According to Fig. 9, simulation results indicate that CDD of the site has a direct relation with energy consumption of the building before and after using EC and PVC windows and cities that have less CDD (Kermanshah) consume less energy than others. Therefore, it is essential to consider CDD of the site to evaluate the energy saving potential of PVC windows. On the other hand, there is no relation between the latitude of the site and energy consumption of the building using PVC windows (Fig. 10) and these windows reduce energy consumption of the building up to 19.69% in Tehran, 18.59% in Yazd, 17.36% in Bandar Abbas and 16.31% in Kermanshah. According to Fig. 10, optimal WWR ranges of PVC windows are identified in each city. In Kermanshah, where it has the least CDD, the optimal WWR range is between 80-90%, and in other cities (Tehran, Yazd and Bandar Abbas), the optimal WWR range is between 70-80%.
Figure 10
Fig. 10. Energy saving potential of PVC windows using different WWR values in various climate conditions.
It can be concluded that CDD of the site effects on WWR value and optimal WWR range of PVC window, while there is no relation between latitude of the site and WWR value and optimal WWR range of PVC windows in high-rise office buildings. Future studies can investigate the effect of more items such as various control types of PVC windows and optimal WWR range of these windows simultaneously in various climate conditions.
It is possible to calculate energy consumption of the building (using EnergyPlus) before and after using EC windows and BIPVs. Meanwhile, it is not possible to run Radiance simulations to evaluate the effect of EC windows on daylighting availability in the DesignBuilder environment. Therefore, a new glazing type is created in DesignBuilder using optical properties of PVC windows in the tinted state to run daylighting simulations. During daylighting simulations, solar transmittance of PVC windows is 9.90%, and their visible transmittance is 15.50%.
In the last part of the simulation process, daylighting simulations are performed to show that these optimal ranges pass LEED v4 certificate minimum requirement. Table 4 shows that sDA300lux/50% percentage is more than 55% in all office rooms of the building. This indicates that PVC windows reduce energy consumption of the building and provide the minimum illuminance level at the same time. Although these windows are considered to be permanently tinted during working hours, they provide sufficient sDA300lux/50% percentage and pass LEED v4 certificate. Accordingly, a new window is created with the same optical properties as PVC windows using Table 3 inputs.
Table 4
Table 4. Daylighting performance of PVC windows in the tinted state using various WWR values.
3.5. Results validation
There are three different ways to validate the results of a simulation software, including analytical, laboratory and actual techniques. An analytical validation approach is used to compare simulation results with other similar researches. Previous studies used DesignBuilder to create their energy models and used EnergyPlus to evaluate thermal and optical performance of buildings. EnergyPlus mostly overestimates energy consumption of a building [68–70] and runs simulations that can be used in design and research contexts [71]. Table 5 shows some previous researches that are similar to the inputs of this research.
According to Table 5, two previous studies [69,74] are more similar with the inputs of this paper. These inputs are compared with the inputs of this paper to find simulation errors. Fathalian et al. [69] used DesignBuilder software and EnergyPlus to predict the energy consumption of a 3-story office building in Semnan, Iran. This office building had a rectangular form with an east-west orientation. Results of this research demonstrated that the maximum simulation error was about 1.6%. Hoseinzadeh et al. [74] used Honeybee plugins to evaluate energy consumption of a high-rise office building in Tehran. They designed a 20-story high-rise office building with a rectangular form and north-south orientation. In the end, they validated their simulation results using a case study in Mashhad. The difference between Ladybug monthly average simulation results (501.3 kWh) and experimental data (482.3 kWh) indicated that the maximum error was about 3.93%. Here, two previous studies are compared with the inputs of this paper in Table 6. According to Table 6, all these three buildings are offices and all are in Iran. Finally, it can be concluded that the simulation results of this paper have a minimum of 1.60% and a maximum of 6.22% error.
4. Conclusion
Improving thermal performance of windows reduces energy consumption of a building. Also, it is essential to reduce energy consumption of high-rise buildings more than other buildings since these buildings consume more energy than other building types. High-rise office buildings have more wall to roof ratio than other building types and receive more solar energy during occupied hours. Therefore, it is important to consider the effect of windows on energy consumption of high-rise buildings, and finding best solutions can save energy as much as possible in these building types. The effect of PVC windows with various WWR values on energy consumption of a high-rise office building was assessed using several simulations. Daylighting simulations were performed to identify the minimum acceptable WWR value in each climate condition using sDA and UDI daylighting metrics. Afterward, primary simulations with various WWR values were performed, and energy consumption of the building without any optimization tool indicated that energy consumption of the building had a direct relation with CDD. In the next stage, simulation results showed that EC windows reduced energy consumption of the building up to 15.94% in Tehran, 13.03% in Kermanshah, 13.21% in Yazd and 10.61% in Bandar Abbas. Results demonstrated that energy consumption of the building using EC windows had a direct relation with CDD of the site. Adding BIPVs reduced energy consumption of the building up to 3.92% in Kermanshah, 4.48% in Tehran, 6.19% in Yazd and 7.55% in Bandar Abbas. These results indicated that the efficiency of BIPV windows had a direct relation with CDD of the site. Afterward, final simulation results were compared with primary results, and energy consumption of the building reduced up to 16.31% in Kermanshah, 19.69% in Tehran, 18.59% in Yazd and 17.36% in Bandar Abbas. In this stage, optimal WWR ranges were identified in each climate condition. Results indicated that the optimal WWR range was 80-90% in Kermanshah and 70-80% in other climate conditions. It can be concluded that CDD of the site should be considered to identify optimal WWR range of PVC windows in high-rise office buildings. Also, results indicated that there is no direct relation between latitude of the site and energy consumption of high-rise office buildings. Daylighting simulations indicated that PVC windows provided minimum acceptable sDA300lux/50% percentage using solar control type.
This paper used just one control type to evaluate the effect of PVC windows on energy consumption of high-rise buildings. Future studies should evaluate the effect of various control types on WWR range of PVC windows. Future studies can find optimal WWR ranges of PVC windows in the zone level of a high-rise office building and compare energy consumption of the building in zone level before and after using PVC windows. Also, future studies can find optimal WWR range of PVC windows at the zone level. Furthermore, future studies should consider building orientation, form and other building types to evaluate energy saving potential of PVC windows.
Contributions
S. Fathi: Conceptualization, Methodology, Software, Validation, Investigation, Visualization, Writing - Original Draft.
A. Kavoosi: Writing - Review & Editing, Supervision, Project administration.
Declaration of competing interest
The authors report no conflicts of interests.
References
- IEA, Global Status Rreport for Buildings and Constructions, 2019. https://webstore.iea.org/download/direct/2930?fileName=2019_Global_Status_Report_for_Buildings_and_Construction.pdf.
- IEA, World Energy Outlook, 2016. https://webstore.iea.org/download/direct/202?fileName=WEO2016.pdf.
- F. Bagheri, V. Mokarizadeh, M. Jabbar, Developing energy performance label for office buildings in Iran, Energy Build. 61 (2013) 116–124. https://doi.org/10.1016/j.enbuild.2013.02.022
- F. Kheiri, A review on optimization methods applied in energy-efficient building geometry and envelope design, Renew. Sustain. Energy Rev. 92 (2018) 897–920. https://doi.org/10.1016/j.rser.2018.04.080
- M. Casini, Active dynamic windows for buildings: A review, Renew. Energy. 119 (2018) 923–934. https://doi.org/10.1016/j.renene.2017.12.049
- J. Al Dakheel, K. Tabet Aoul, Building Applications, Opportunities and Challenges of Active Shading Systems: A State-of-the-Art Review, Energies. 10 (2017) 1672. https://doi.org/10.3390/en10101672
- S.D. Rezaei, S. Shannigrahi, S. Ramakrishna, A review of conventional, advanced, and smart glazing technologies and materials for improving indoor environment, Sol. Energy Mater. Sol. Cells. 159 (2017) 26–51. https://doi.org/10.1016/j.solmat.2016.08.026
- A. Ghosh, B. Norton, Advances in switchable and highly insulating autonomous (self-powered) glazing systems for adaptive low energy buildings, Renew. Energy. 126 (2018) 1003–1031. https://doi.org/10.1016/j.renene.2018.04.038
- R. Tällberg, B.P. Jelle, R. Loonen, T. Gao, M. Hamdy, Comparison of the energy saving potential of adaptive and controllable smart windows: A state-of-the-art review and simulation studies of thermochromic, photochromic and electrochromic technologies, Sol. Energy Mater. Sol. Cells. 200 (2019) 109828. https://doi.org/10.1016/j.solmat.2019.02.041
- C.G. Granqvist, İ. Bayrak Pehlivan, G.A. Niklasson, Electrochromics on a roll: Web-coating and lamination for smart windows, Surf. Coatings Technol. 336 (2018) 133–138. https://doi.org/10.1016/j.surfcoat.2017.08.006
- R.C.G.M. Loonen, F. Favoino, J.L.M. Hensen, M. Overend, Review of current status, requirements and opportunities for building performance simulation of adaptive facades, J. Build. Perform. Simul. 10 (2017) 205–223. https://doi.org/10.1080/19401493.2016.1152303
- G. Gorgolis, D. Karamanis, Solar energy materials for glazing technologies, Sol. Energy Mater. Sol. Cells. 144 (2016) 559–578. https://doi.org/10.1016/j.solmat.2015.09.040
- C.G. Granqvist, Electrochromics for smart windows: Oxide-based thin films and devices, Thin Solid Films. 564 (2014) 1–38. https://doi.org/10.1016/j.tsf.2014.02.002
- J.L. Aguilar-Santana, H. Jarimi, M. Velasco-Carrasco, S. Riffat, Review on window-glazing technologies and future prospects, Int. J. Low-Carbon Technol. 15 (2020) 112–120. https://doi.org/10.1093/ijlct/ctz032
- J.E. Goncalves, T. van Hooff, D. Saelens, A physics-based high-resolution BIPV model for building performance simulations, Sol. Energy. 204 (2020) 585–599. https://doi.org/10.1016/j.solener.2020.04.057
- A. Karthick, K. Kalidasa Murugavel, L. Kalaivani, U. Saravana Babu, Performance study of building integrated photovoltaic modules, Adv. Build. Energy Res. 12 (2018) 178–194. https://doi.org/10.1080/17512549.2016.1275982
- S. Aguacil, S. Lufkin, E. Rey, Active surfaces selection method for building-integrated photovoltaics (BIPV) in renovation projects based on self-consumption and self-sufficiency, Energy Build. 193 (2019) 15–28. https://doi.org/10.1016/j.enbuild.2019.03.035
- P. Reddy K, S. Gupta, S. Nundy, A. Karthick, A. Ghosh, Status of BIPV and BAPV system for less energy-hungry building in India-a review, Appl. Sci. 10 (2020) 2337. https://doi.org/10.3390/app10072337
- A. Ghosh, Potential of building integrated and attached/applied photovoltaic (BIPV/BAPV) for adaptive less energy-hungry building’s skin: A comprehensive review, J. Clean. Prod. 276 (2020) 123343. https://doi.org/10.1016/j.jclepro.2020.123343
- A. Roy, A. Ghosh, S. Bhandari, T. Mallick, Perovskite Solar Cells for BIPV Application: A Review, Buildings. 10 (2020) 129. https://doi.org/10.3390/buildings10070129
- J. Chambers, P. Hollmuller, O. Bouvard, A. Schueler, J.-L. Scartezzini, E. Azar, M.K. Patel, Evaluating the electricity saving potential of electrochromic glazing for cooling and lighting at the scale of the Swiss non-residential national building stock using a Monte Carlo model, Energy. 185 (2019) 136–147. https://doi.org/10.1016/j.energy.2019.07.037
- Y. Fang, T. Hyde, N. Hewitt, P.C. Eames, B. Norton, Thermal performance analysis of an electrochromic vacuum glazing with low emittance coatings, Sol. Energy. 84 (2010) 516–525. https://doi.org/10.1016/j.solener.2009.02.007
- N. DeForest, A. Shehabi, J. O’Donnell, G. Garcia, J. Greenblatt, E.S. Lee, S. Selkowitz, D.J. Milliron, United States energy and CO2 savings potential from deployment of near-infrared electrochromic window glazings, Build. Environ. 89 (2015) 107–117. https://doi.org/10.1016/j.buildenv.2015.02.021
- A. Aldawoud, Conventional fixed shading devices in comparison to an electrochromic glazing system in hot, dry climate, Energy Build. 59 (2013) 104–110. https://doi.org/10.1016/j.enbuild.2012.12.031
- J. Hoon Lee, J. Jeong, Y. Tae Chae, Optimal control parameter for electrochromic glazing operation in commercial buildings under different climatic conditions, Appl. Energy. 260 (2020) 114338. https://doi.org/10.1016/j.apenergy.2019.114338
- T. Salameh, M.E.H. Assad, M. Tawalbeh, C. Ghenai, A. Merabet, H.F. Öztop, Analysis of cooling load on commercial building in UAE climate using building integrated photovoltaic façade system, Sol. Energy. 199 (2020) 617–629. https://doi.org/10.1016/j.solener.2020.02.062
- C. Qiu, H. Yang, W. Zhang, Investigation on the energy performance of a novel semi-transparent BIPV system integrated with vacuum glazing, Build. Simul. 12 (2019) 29–39. https://doi.org/10.1007/s12273-018-0464-6
- M. Abdelhakim, M.Z. Kandar, Y.W. Lim, Experimental investigation of overall energy performance in Algerian office building integrated photovoltaic window under semi-arid climate, Journal of Daylighting 6 (2019) 23-41. https://doi.org/10.15627/jd.2019.3
- J.-J. Wu, M.-D. Hsieh, W.-P. Liao, W.-T. Wu, J.-S. Chen, Fast-Switching Photovoltachromic Cells with Tunable Transmittance, ACS Nano. 3 (2009) 2297–2303. https://doi.org/10.1021/nn900428s
- F. Malara, A. Cannavale, S. Carallo, G. Gigli, Smart Windows for Building Integration: A New Architecture for Photovoltachromic Devices, ACS Appl. Mater. Interfaces. 6 (2014) 9290–9297. https://doi.org/10.1021/am501648z
- A. Cannavale, G.E. Eperon, P. Cossari, A. Abate, H.J. Snaith, G. Gigli, Perovskite photovoltachromic cells for building integration, Energy Environ. Sci. 8 (2015) 1578–1584. https://doi.org/10.1039/c5ee00896d
- F. Fiorito, A. Cannavale, M. Santamouris, Development, testing and evaluation of energy savings potentials of photovoltachromic windows in office buildings. A perspective study for Australian climates, Sol. Energy. 205 (2020) 358–371. https://doi.org/10.1016/j.solener.2020.05.080
- F. Favoino, F. Fiorito, A. Cannavale, G. Ranzi, M. Overend, Optimal control and performance of photovoltachromic switchable glazing for building integration in temperate climates, Appl. Energy. 178 (2016) 943–961. https://doi.org/10.1016/j.apenergy.2016.06.107
- A. Pierucci, A. Cannavale, F. Martellotta, F. Fiorito, Smart windows for carbon neutral buildings: A life cycle approach, Energy Build. 165 (2018) 160–171. https://doi.org/10.1016/j.enbuild.2018.01.021
- A. Cannavale, M. Manca, F. Malara, L. De Marco, R. Cingolani, G. Gigli, Highly efficient smart photovoltachromic devices with tailored electrolyte composition, Energy Environ. Sci. 4 (2011) 2567–2574. https://doi.org/10.1039/c1ee01231b
- M.I. Ayoosu, Y.-W. Lim, P.C. Leng, O.M. Idowu, Daylighting Evaluation and Optimisation of Window to Wall Ratio for Lecture Theatre in the Tropical Climate, Journal of Daylighting 8 (2021) 20-35. https://doi.org/10.15627/jd.2021.2
- L. Wen, K. Hiyama, M. Koganei, A method for creating maps of recommended window-to-wall ratios to assign appropriate default values in design performance modeling: A case study of a typical office building in Japan, Energy Build. 145 (2017) 304–317. https://doi.org/10.1016/j.enbuild.2017.04.028
- C. Marino, A. Nucara, M. Pietrafesa, Does window-to-wall ratio have a significant effect on the energy consumption of buildings? A parametric analysis in Italian climate conditions, J. Build. Eng. 13 (2017) 169–183. https://doi.org/10.1016/j.jobe.2017.08.001
- F. Chi, Y. Wang, R. Wang, G. Li, C. Peng, An investigation of optimal window-to-wall ratio based on changes in building orientations for traditional dwellings, Sol. Energy. 195 (2020) 64–81. https://doi.org/10.1016/j.solener.2019.11.033
- P. Xue, Q. Li, J. Xie, M. Zhao, J. Liu, Optimization of window-to-wall ratio with sunshades in China low latitude region considering daylighting and energy saving requirements, Appl. Energy. 233–234 (2019) 62–70. https://doi.org/10.1016/j.apenergy.2018.10.027
- F. Goia, Search for the optimal window-to-wall ratio in office buildings in different European climates and the implications on total energy saving potential, Sol. Energy. 132 (2016) 467–492. https://doi.org/10.1016/j.solener.2016.03.031
- A. Pino, W. Bustamante, R. Escobar, F.E. Pino, Thermal and lighting behavior of office buildings in Santiago of Chile, Energy Build. 47 (2012) 441–449. https://doi.org/10.1016/j.enbuild.2011.12.016
- S. Yeom, H. Kim, T. Hong, M. Lee, Determining the optimal window size of office buildings considering the workers’ task performance and the building’s energy consumption, Build. Environ. 177 (2020) 106872. https://doi.org/10.1016/j.buildenv.2020.106872
- R. Phillips, L. Troup, D. Fannon, M.J. Eckelman, Triple bottom line sustainability assessment of window-to-wall ratio in US office buildings, Build. Environ. 182 (2020) 107057. https://doi.org/10.1016/j.buildenv.2020.107057
- B. Obradovic, B.S. Matusiak, Daylight autonomy improvement in buildings at high latitudes using horizontal light pipes and light-deflecting panels, Sol. Energy. 208 (2020) 493–514. https://doi.org/10.1016/j.solener.2020.07.074
- R. Urbano Gutiérrez, J. Du, N. Ferreira, A. Ferrero, S. Sharples, Daylight control and performance in office buildings using a novel ceramic louvre system, Build. Environ. 151 (2019) 54–74. https://doi.org/10.1016/j.buildenv.2019.01.030
- Q. Xuan, G. Li, Y. Lu, B. Zhao, X. Zhao, G. Pei, Daylighting characteristics and experimental validation of a novel concentrating photovoltaic/daylighting system, Sol. Energy. 186 (2019) 264–276. https://doi.org/10.1016/j.solener.2019.05.014
- J. Page, J.-L. Scartezzini, J. Kaempf, N. Morel, On-site performance of electrochromic glazings coupled to an anidolic daylighting system, Sol. Energy. 81 (2007) 1166–1179. https://doi.org/10.1016/j.solener.2007.01.011
- F. Chi, R. Wang, G. Li, L. Xu, Y. Wang, C. Peng, Integration of sun-tracking shading panels into window system towards maximum energy saving and non-glare daylighting, Appl. Energy. 260 (2020) 114304. https://doi.org/10.1016/j.apenergy.2019.114304
- H. Teixeira, M.G. Gomes, A. Moret Rodrigues, J. Pereira, Thermal and visual comfort, energy use and environmental performance of glazing systems with solar control films, Build. Environ. 168 (2020) 106474. https://doi.org/10.1016/j.buildenv.2019.106474
- J. Karlsson, A. Roos, Angle-resolved optical characterisation of an electrochromic device, Sol. Energy. 68 (2000) 493–497. https://doi.org/10.1016/s0038-092x(00)00021-9
- A. Piccolo, A. Pennisi, F. Simone, Daylighting performance of an electrochromic window in a small scale test-cell, Sol. Energy. 83 (2009) 832–844. https://doi.org/10.1016/j.solener.2008.11.013
- Y. Wu, T. Wang, E.S. Lee, J.H. Kämpf, J.-L. Scartezzini, Split-pane electrochromic window control based on an embedded photometric device with real-time daylighting computing, Build. Environ. 161 (2019) 106229. https://doi.org/10.1016/j.buildenv.2019.106229
- A. Cannavale, F. Fiorito, D. Resta, G. Gigli, Visual comfort assessment of smart photovoltachromic windows, Energy Build. 65 (2013) 137–145. https://doi.org/10.1016/j.enbuild.2013.06.019
- E. Neufert, Architects’ data, 2d (international..., Granada Pub., St. Albans, Eng, 1980.
- J.P. [edited by] Joseph De Chiara Martin Zelnik, Time-saver standards for interior design and space planning, Second edition. New York : McGraw-Hill, [2001] ©2001, n.d. https://search.library.wisc.edu/catalog/999918508702121.
- National Building Code of Iran No.3, Construction Engineering Organization, Tehran, 2009.
- National Building Code of Iran No.14, Construction Engineering Organization, Tehran, 2009.
- N.B.C. of Ir. No.13, Construction Engineering Organization, Tehran, 2009.
- N.B.C. of I. No.4, Construction Engineering Organization, Tehran, 2009.
- National Building Code of Iran No.15, Construction Engineering Organization, Tehran, 2009.
- National Building Code of Iran No.19, Construction Engineering Organization, Tehran, 2009.
- H. Elotefy, K.S.S. Abdelmagid, E. Morghany, T.M.F. Ahmed, Energy-efficient Tall Buildings Design Strategies: A Holistic Approach, Energy Procedia. 74 (2015) 1358–1369. https://doi.org/10.1016/j.egypro.2015.07.782
- H. Shen, A. Tzempelikos, Sensitivity analysis on daylighting and energy performance of perimeter offices with automated shading, Build. Environ. 59 (2013) 303–314. https://doi.org/10.1016/j.buildenv.2012.08.028
- N.S. Shafavi, M. Tahsildoost, Z.S. Zomorodian, Investigation of illuminance-based metrics in predicting occupants’ visual comfort (case study: Architecture design studios), Sol. Energy. 197 (2020) 111–125. https://doi.org/10.1016/j.solener.2019.12.051
- S.S. Korsavi, Z.S. Zomorodian, M. Tahsildoost, Visual comfort assessment of daylit and sunlit areas: A longitudinal field survey in classrooms in Kashan, Iran, Energy Build. 128 (2016) 305–318. https://doi.org/10.1016/j.enbuild.2016.06.091
- Z. Luo, C. Sun, Q. Dong, A daylight-linked shading strategy for automated blinds based on model-based control and Radial Basis Function (RBF) optimization, Build. Environ. 177 (2020) 106854. https://doi.org/10.1016/j.buildenv.2020.106854
- S.S. Korsavi, Z.S. Zomorodian, M. Tahsildoost, Energy and economic performance of rooftop PV panels in the hot and dry climate of Iran, J. Clean. Prod. 174 (2018) 1204–1214. https://doi.org/10.1016/j.jclepro.2017.11.026
- A. Fathalian, H. Kargarsharifabad, Actual validation of energy simulation and investigation of energy management strategies (Case Study: An office building in Semnan, Iran), Case Stud. Therm. Eng. 12 (2018) 510–516. https://doi.org/10.1016/j.csite.2018.06.007
- P.G. Loutzenhiser, G.M. Maxwell, H. Manz, An empirical validation of the daylighting algorithms and associated interactions in building energy simulation programs using various shading devices and windows, Energy. 32 (2007) 1855–1870. https://doi.org/10.1016/j.energy.2007.02.005
- N.M. Mateus, A. Pinto, G.C. da Graça, Validation of EnergyPlus thermal simulation of a double skin naturally and mechanically ventilated test cell, Energy Build. 75 (2014) 511–522. https://doi.org/10.1016/j.enbuild.2014.02.043
- P.G. Loutzenhiser, H. Manz, S. Moosberger, G.M. Maxwell, An empirical validation of window solar gain models and the associated interactions, Int. J. Therm. Sci. 48 (2009) 85–95. https://doi.org/10.1016/j.ijthermalsci.2008.01.011
- W. Choi, J. Joe, Y. Kwak, J.-H. Huh, Operation and control strategies for multi-storey double skin facades during the heating season, Energy Build. 49 (2012) 454–465. https://doi.org/10.1016/j.enbuild.2012.02.047
- P. Hoseinzadeh, M. Khalaji Assadi, S. Heidari, M. Khalatbari, R. Saidur, K. Haghighat nejad, H. Sangin, Energy performance of building integrated photovoltaic high-rise building: Case study, Tehran, Iran, Energy Build. 235 (2021) 110707. https://doi.org/10.1016/j.enbuild.2020.110707
Copyright © 2021 The Author(s). Published by solarlits.com.
 HOME
HOME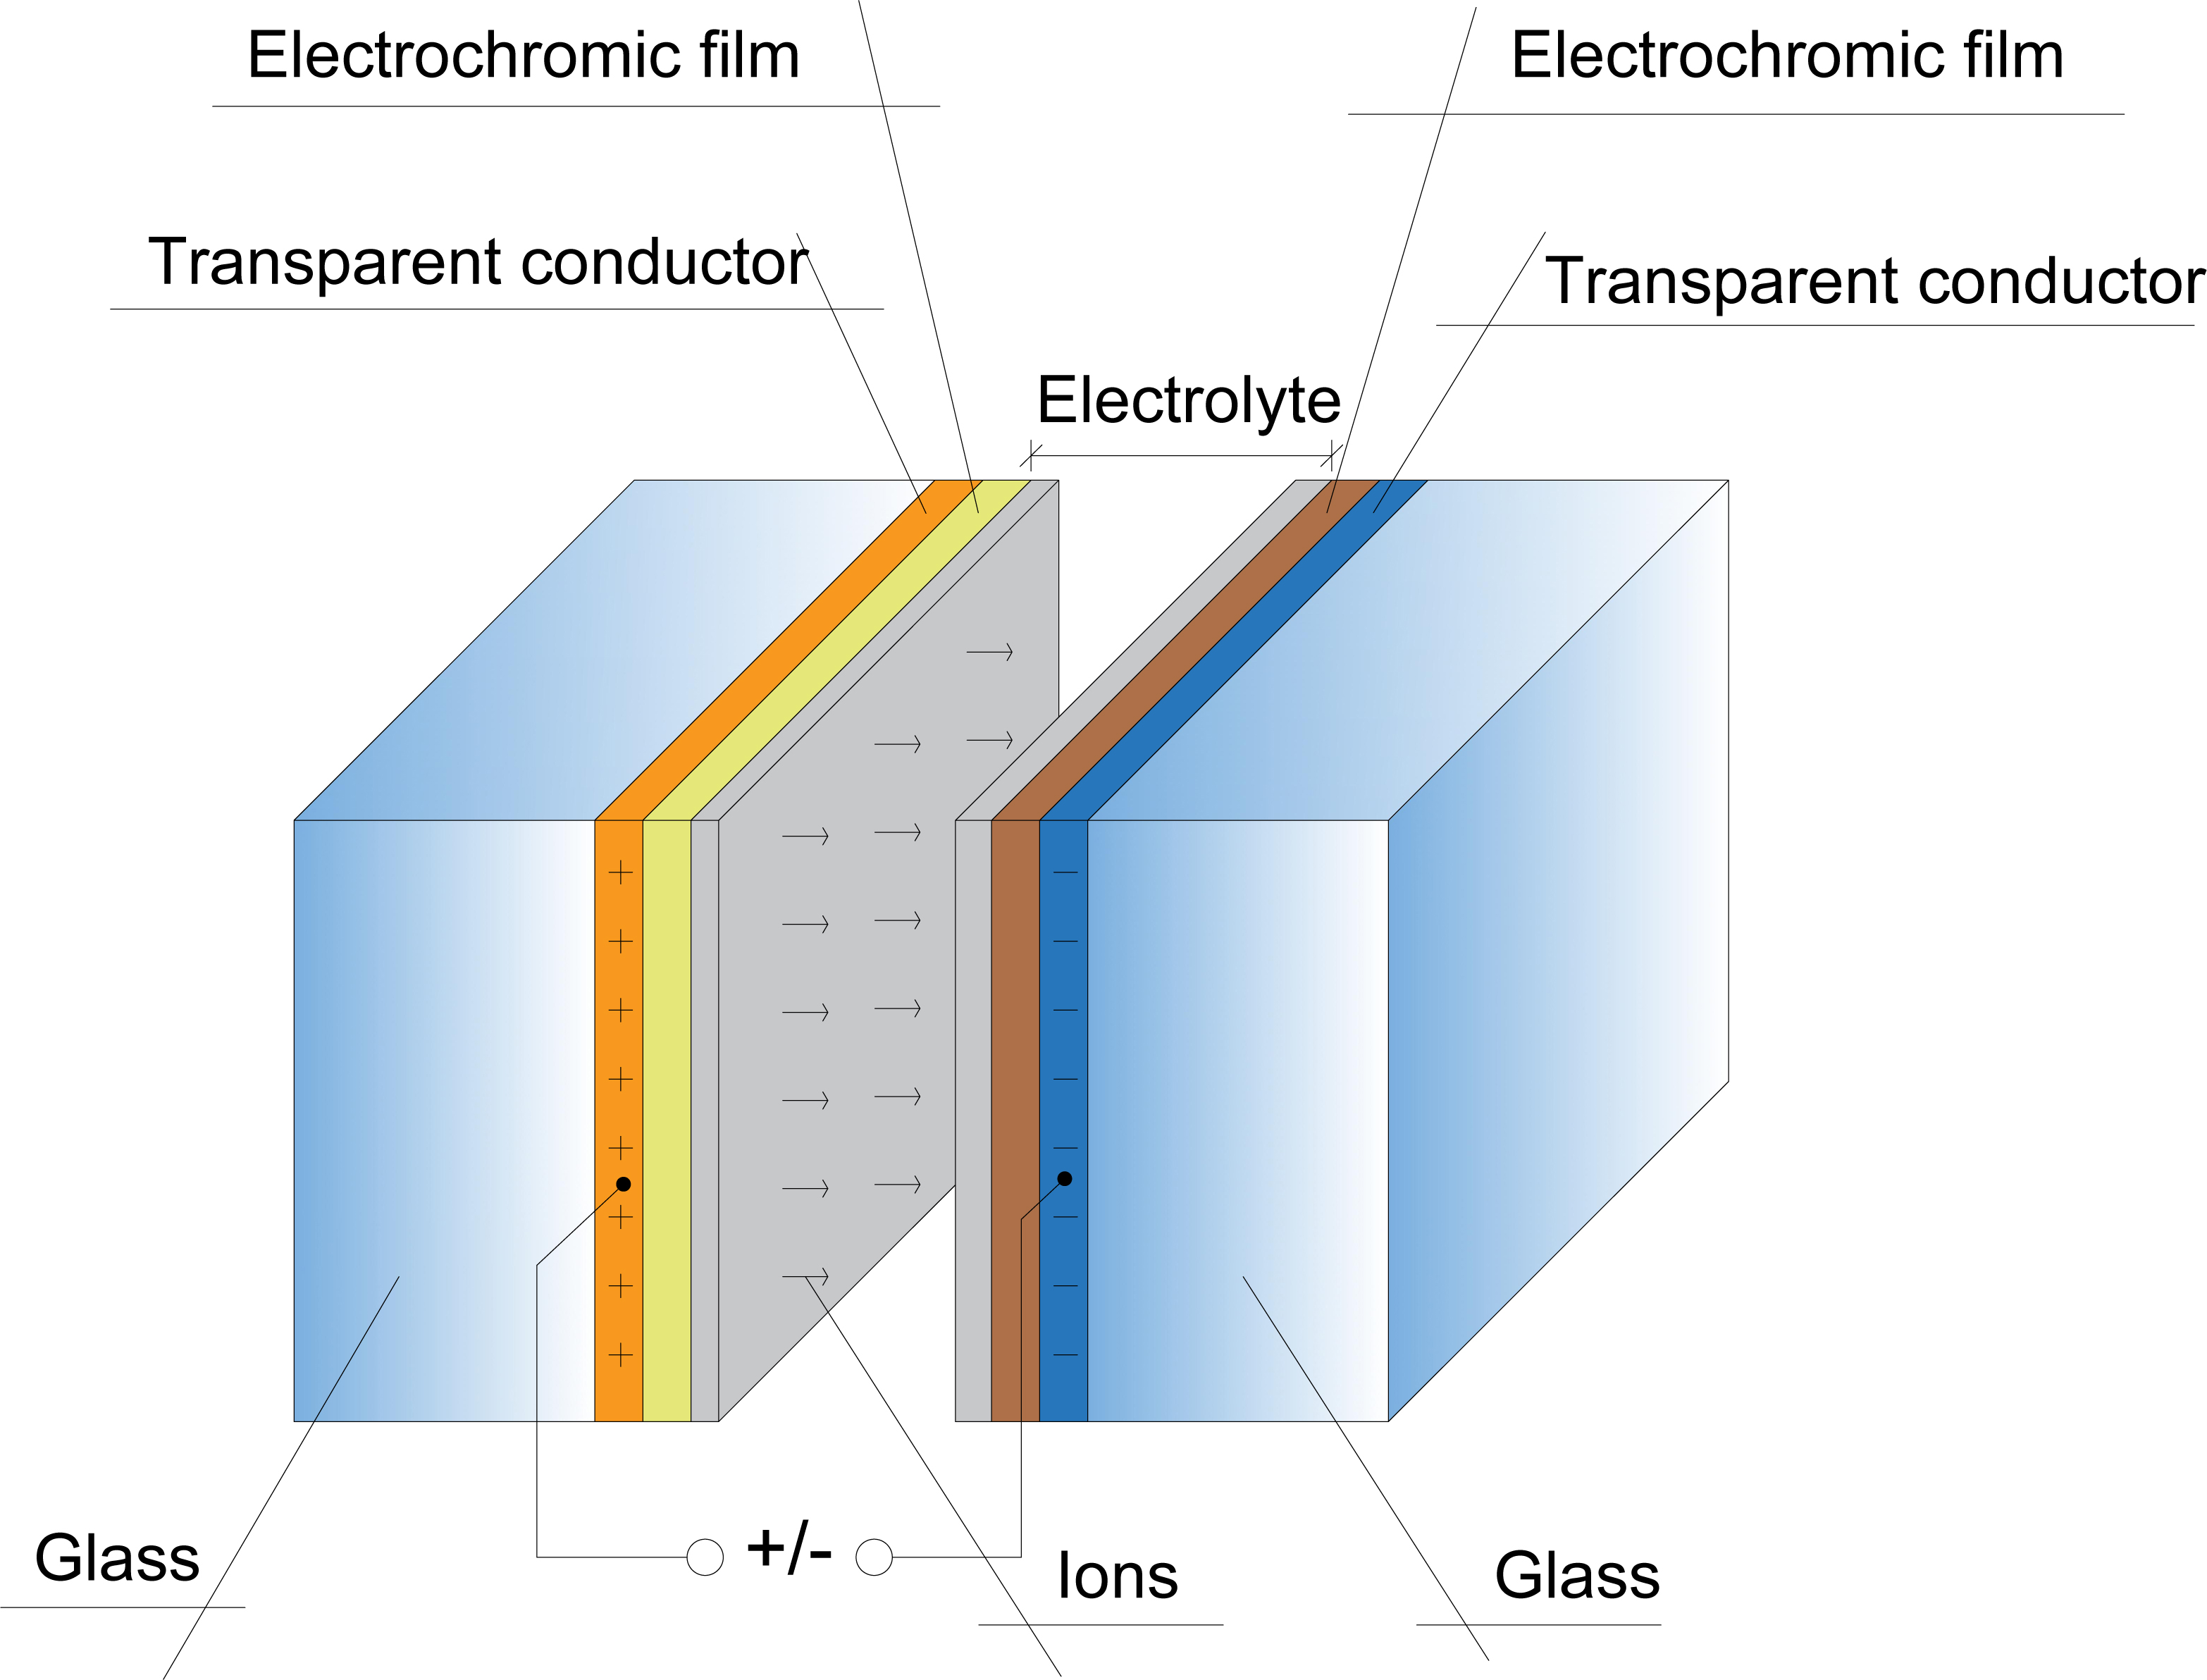 Figure 1
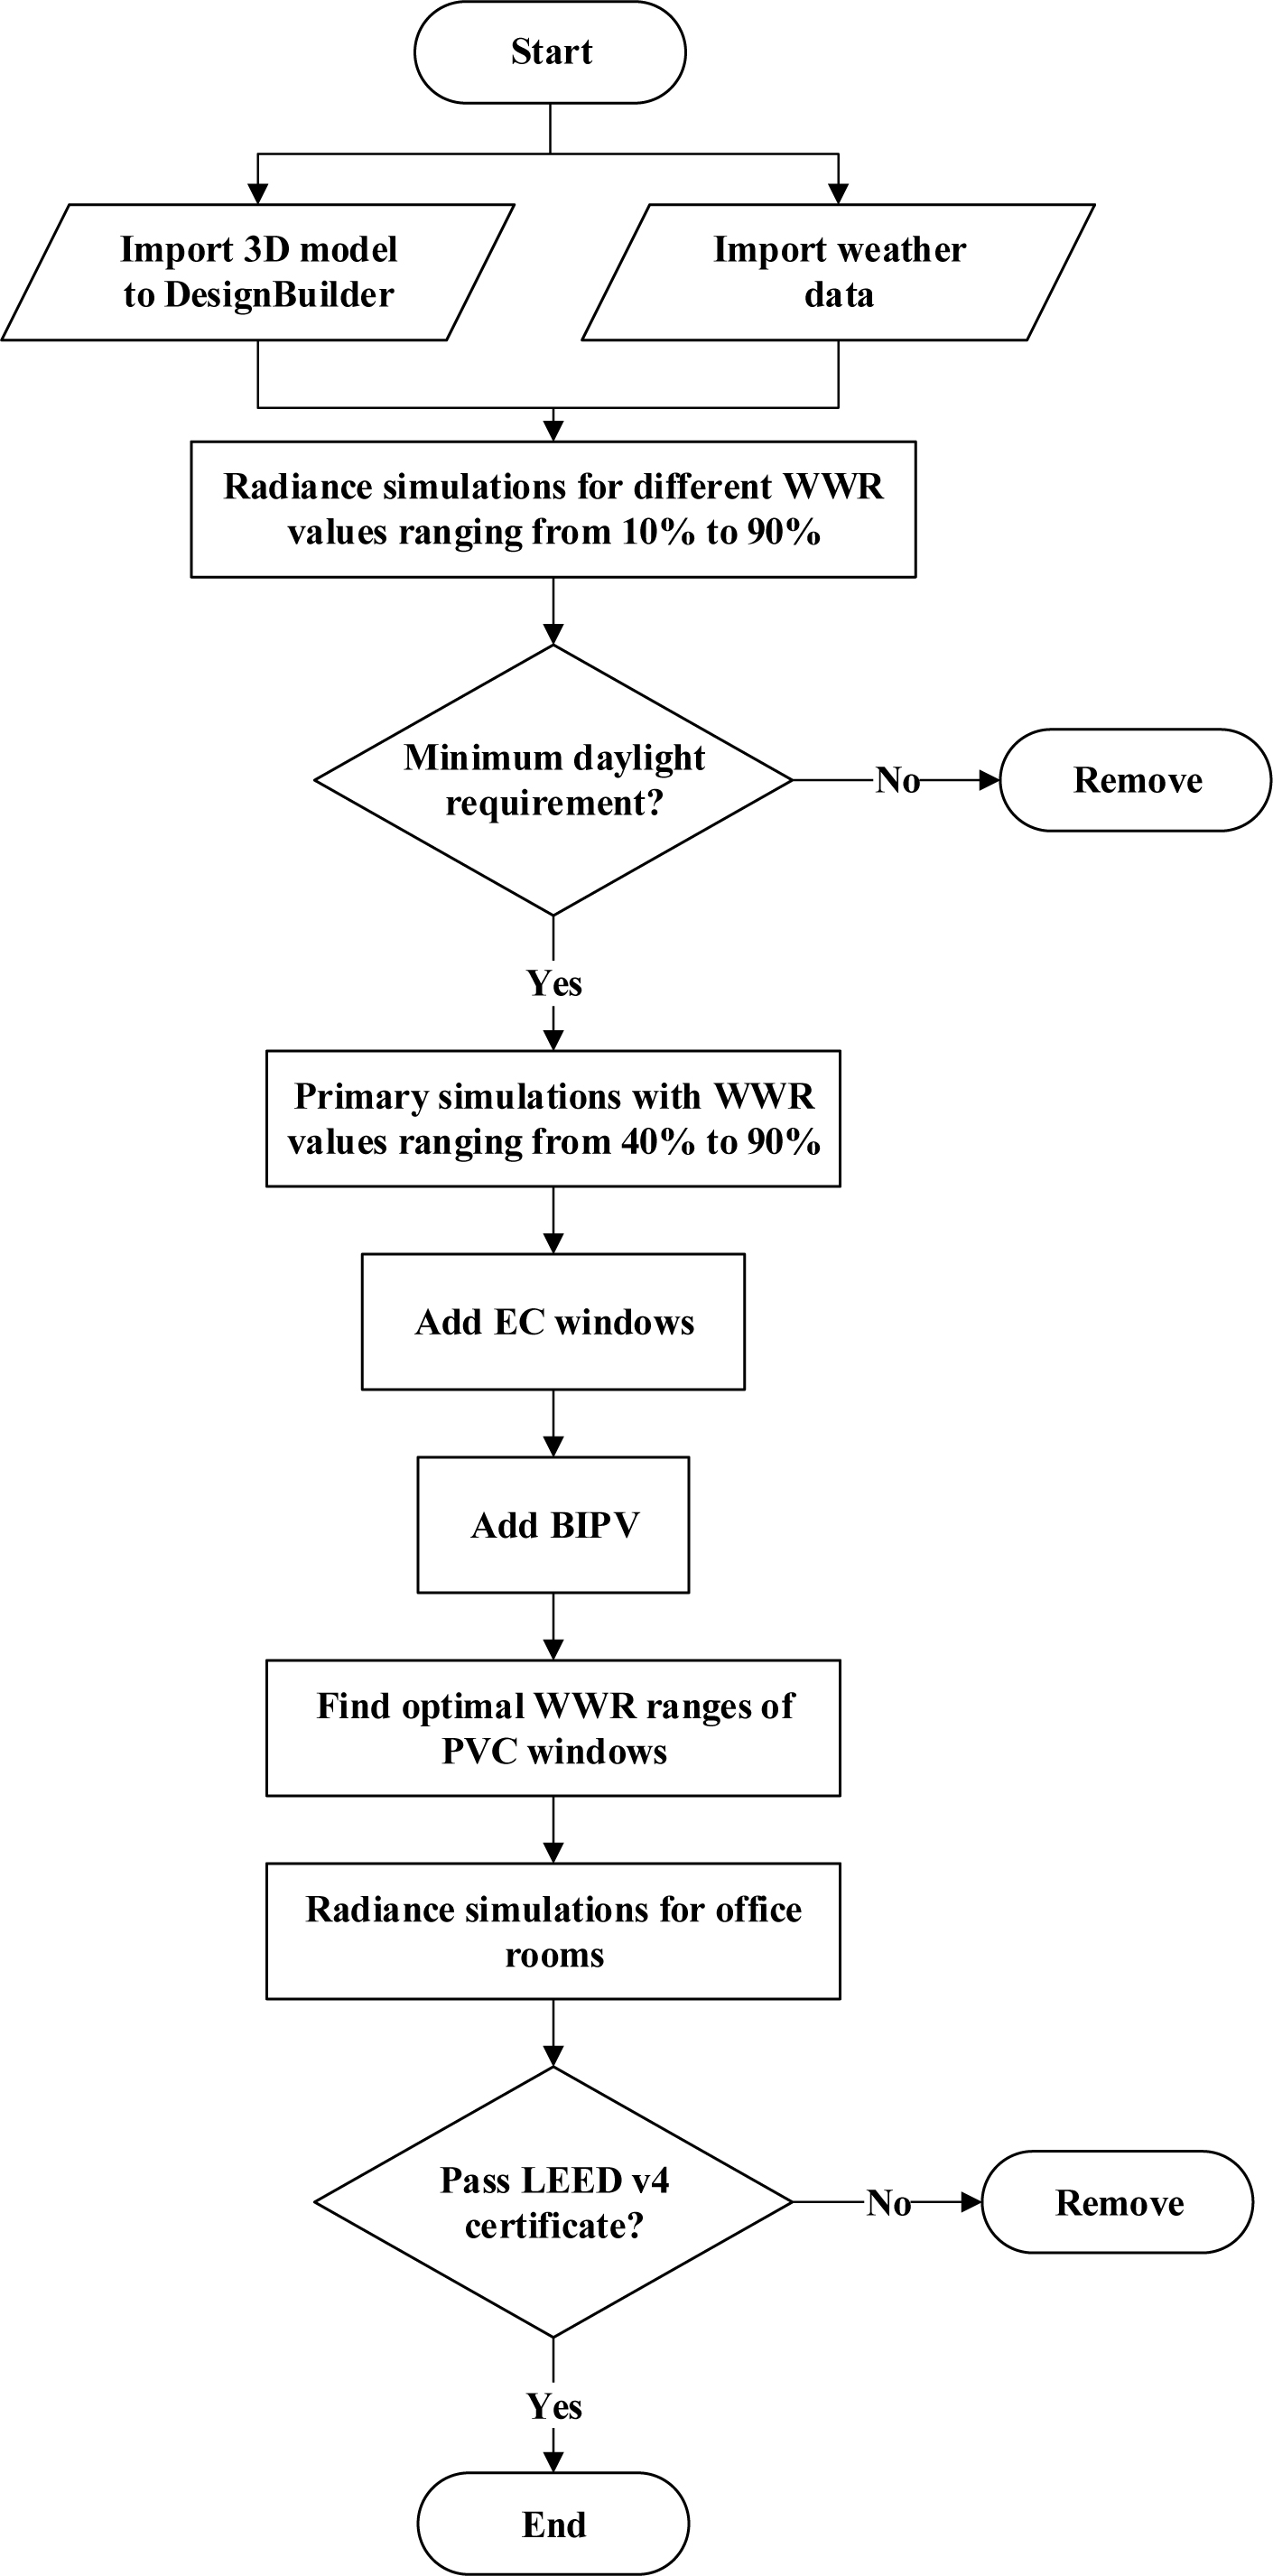 Figure 2
 Table 1
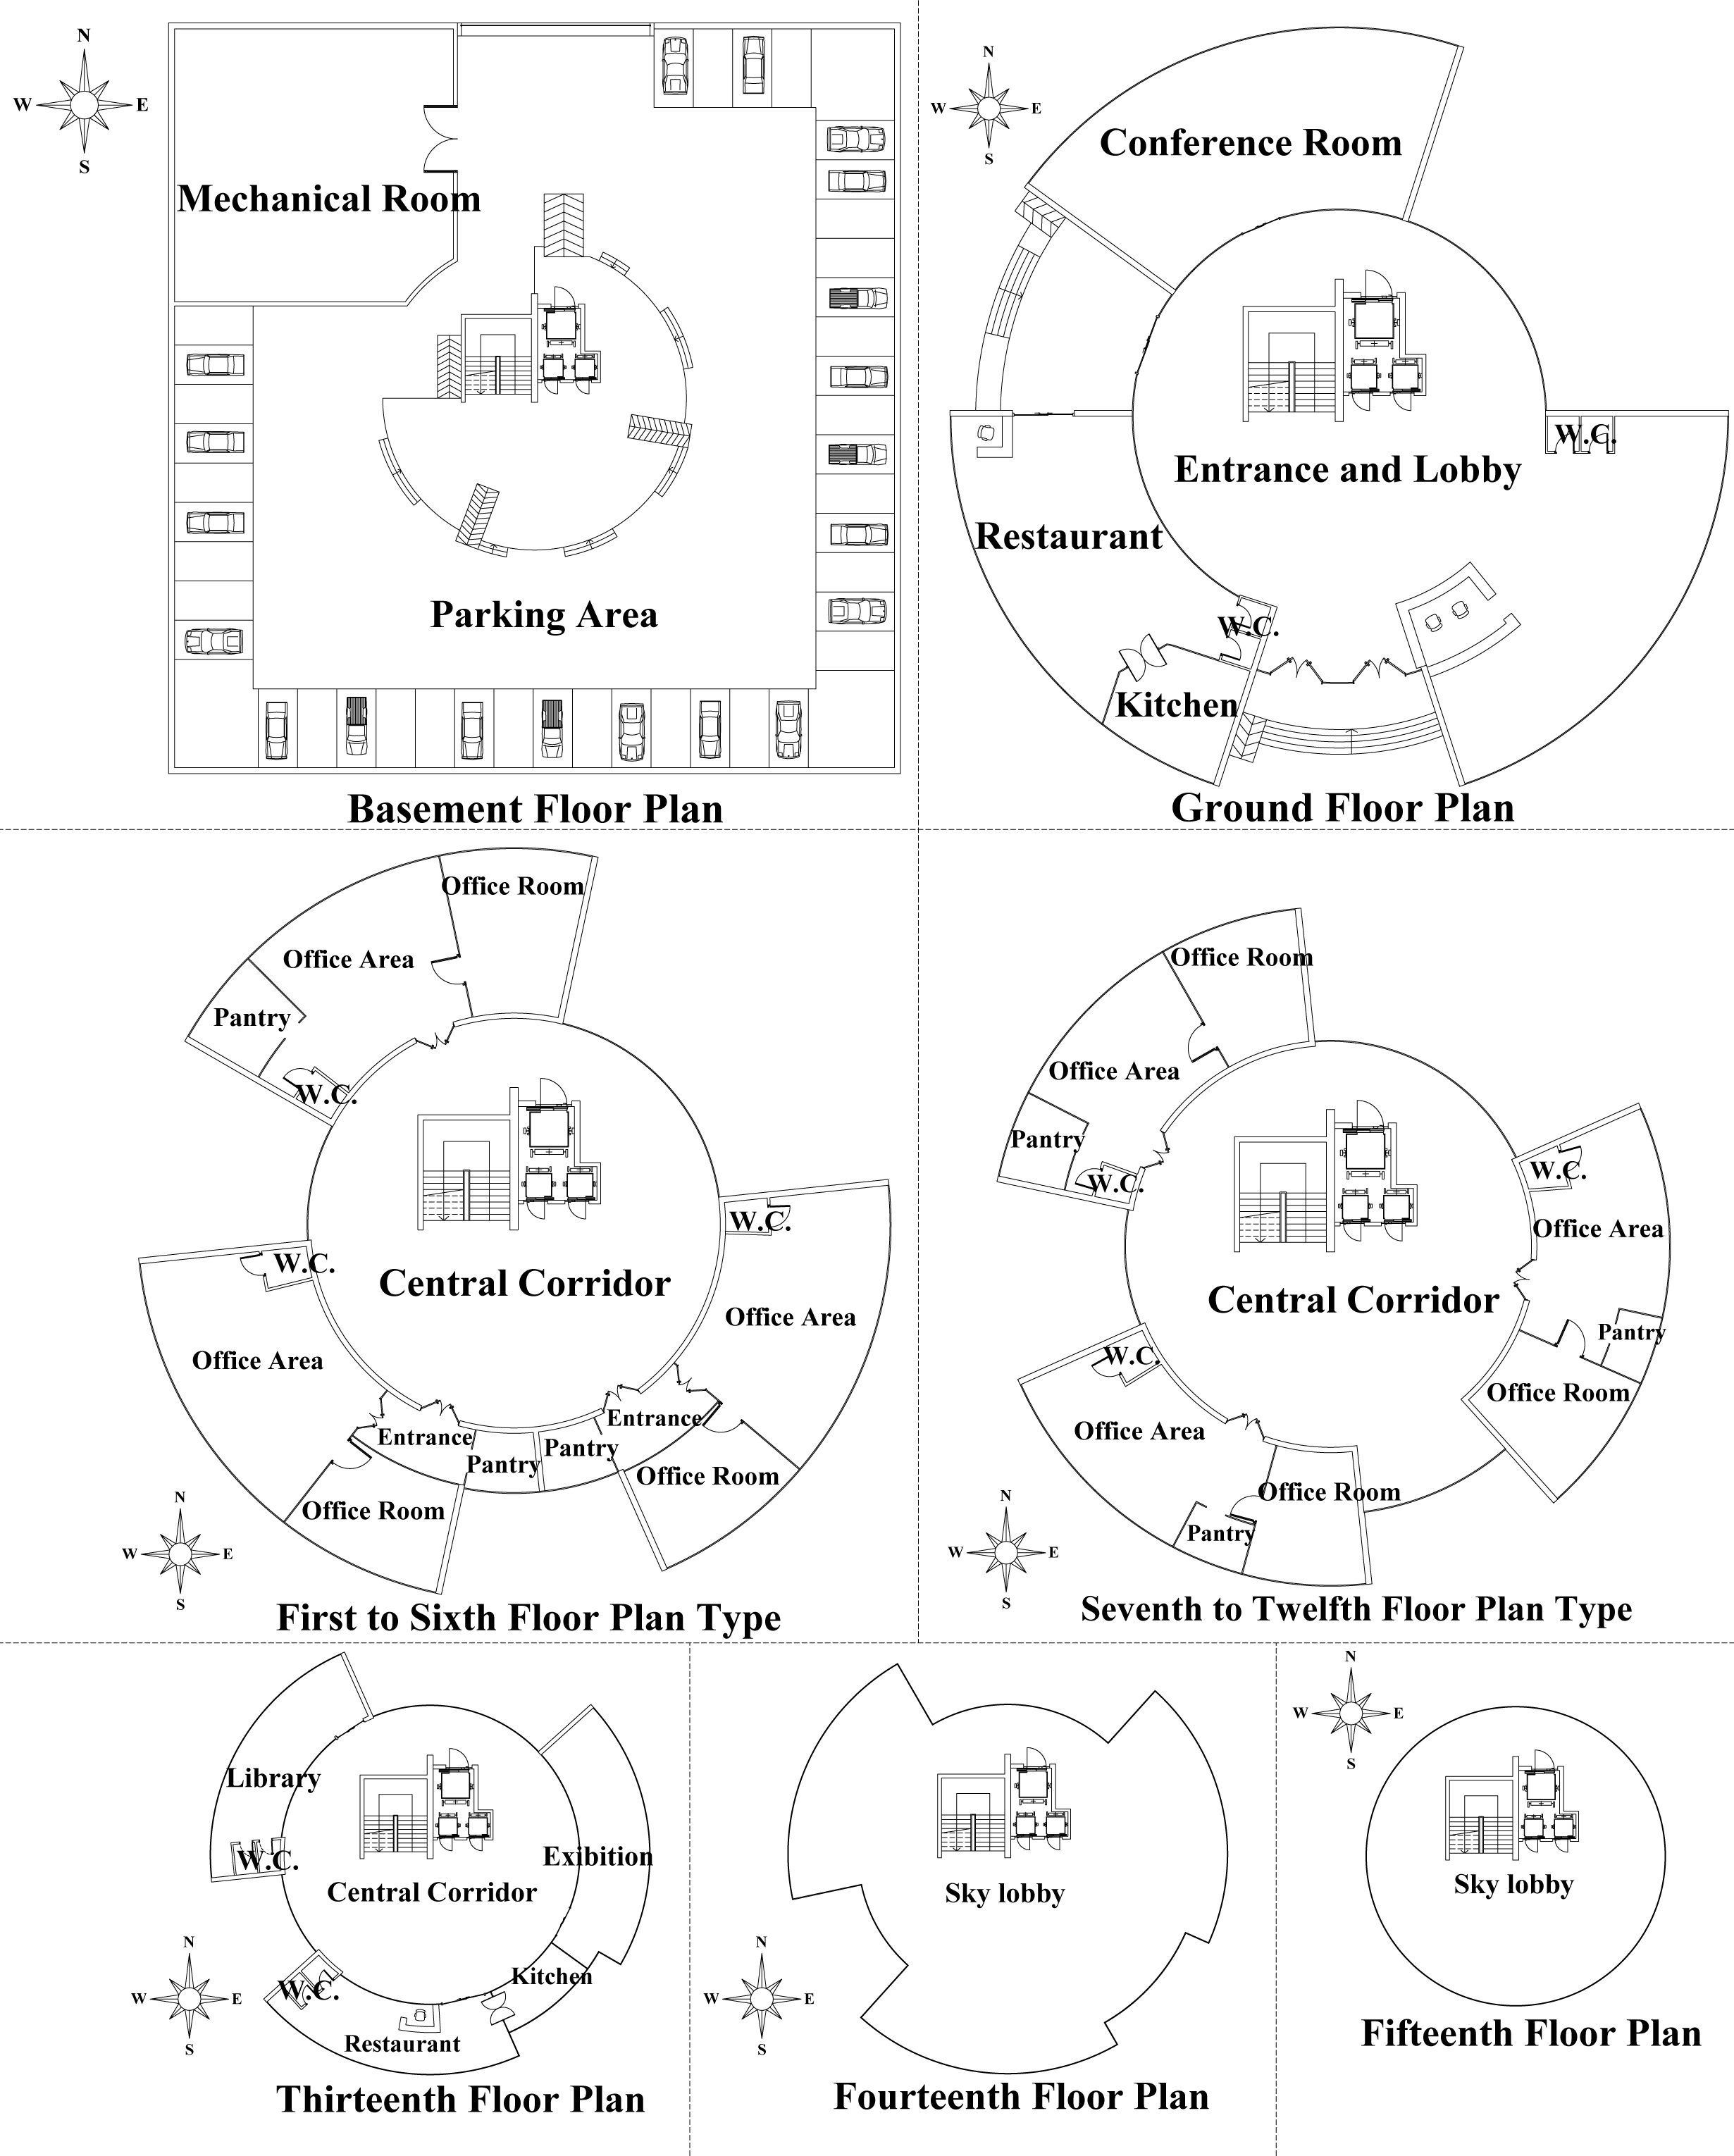 Figure 3
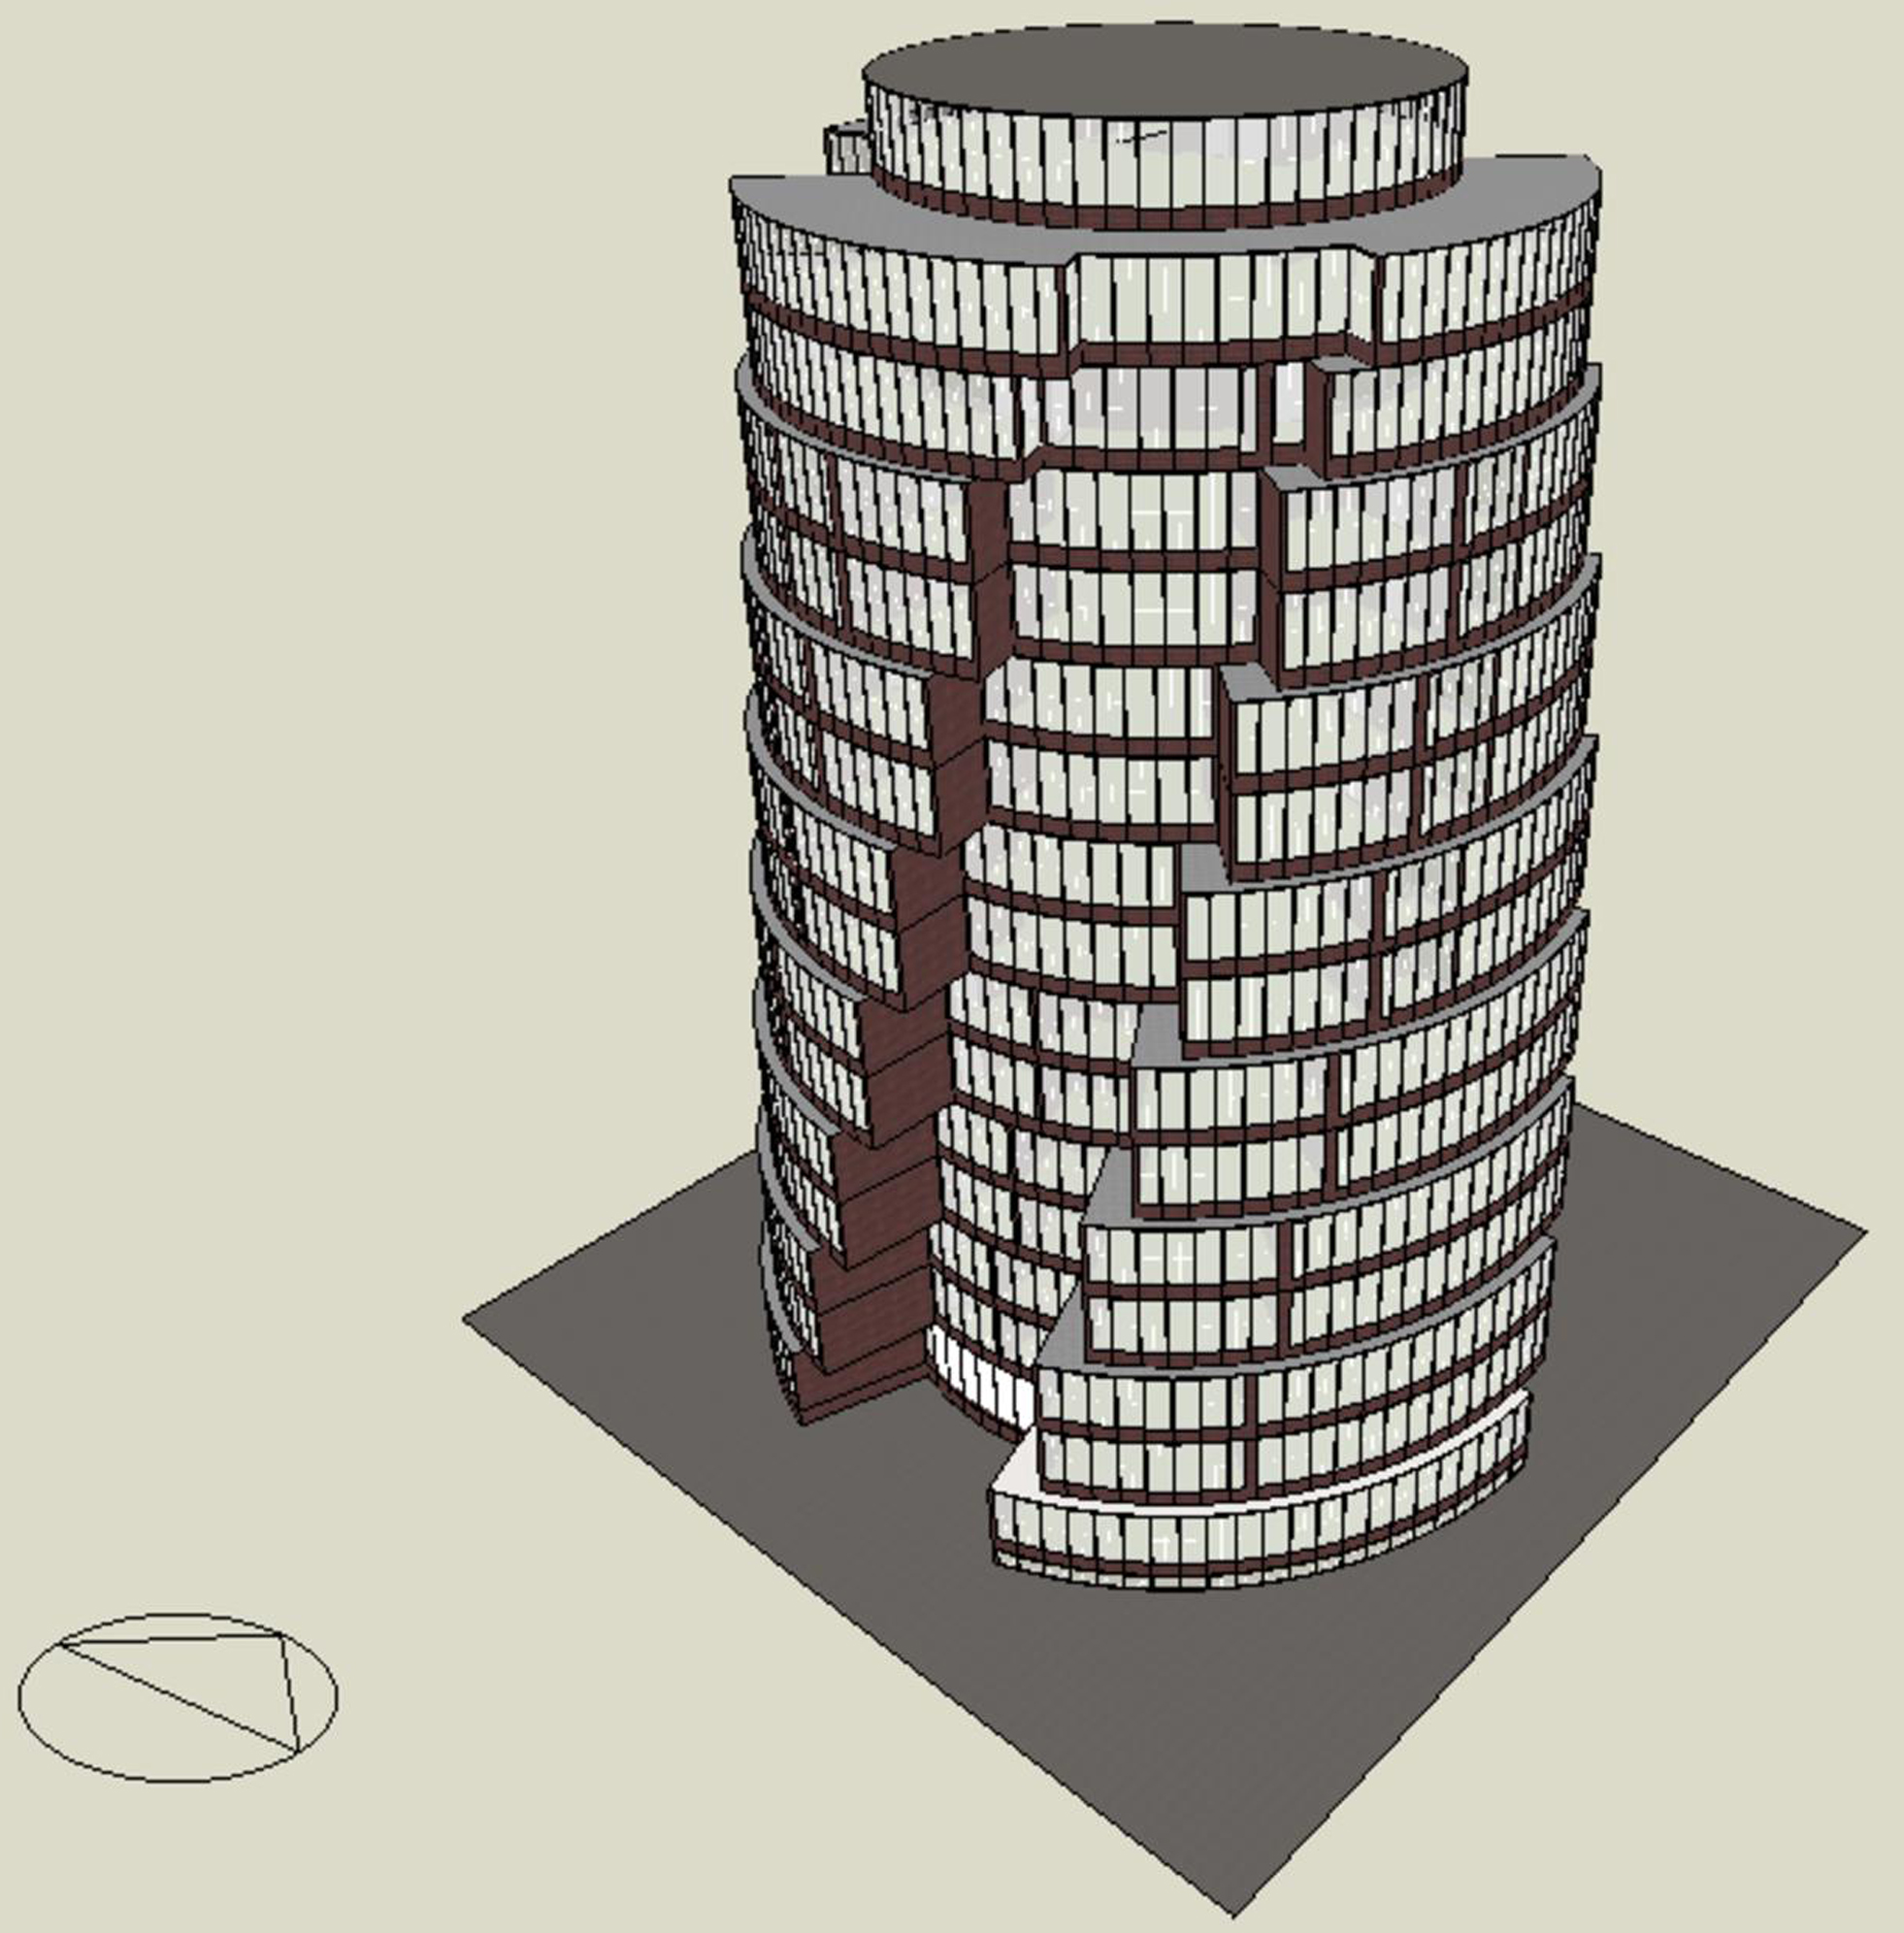 Figure 4
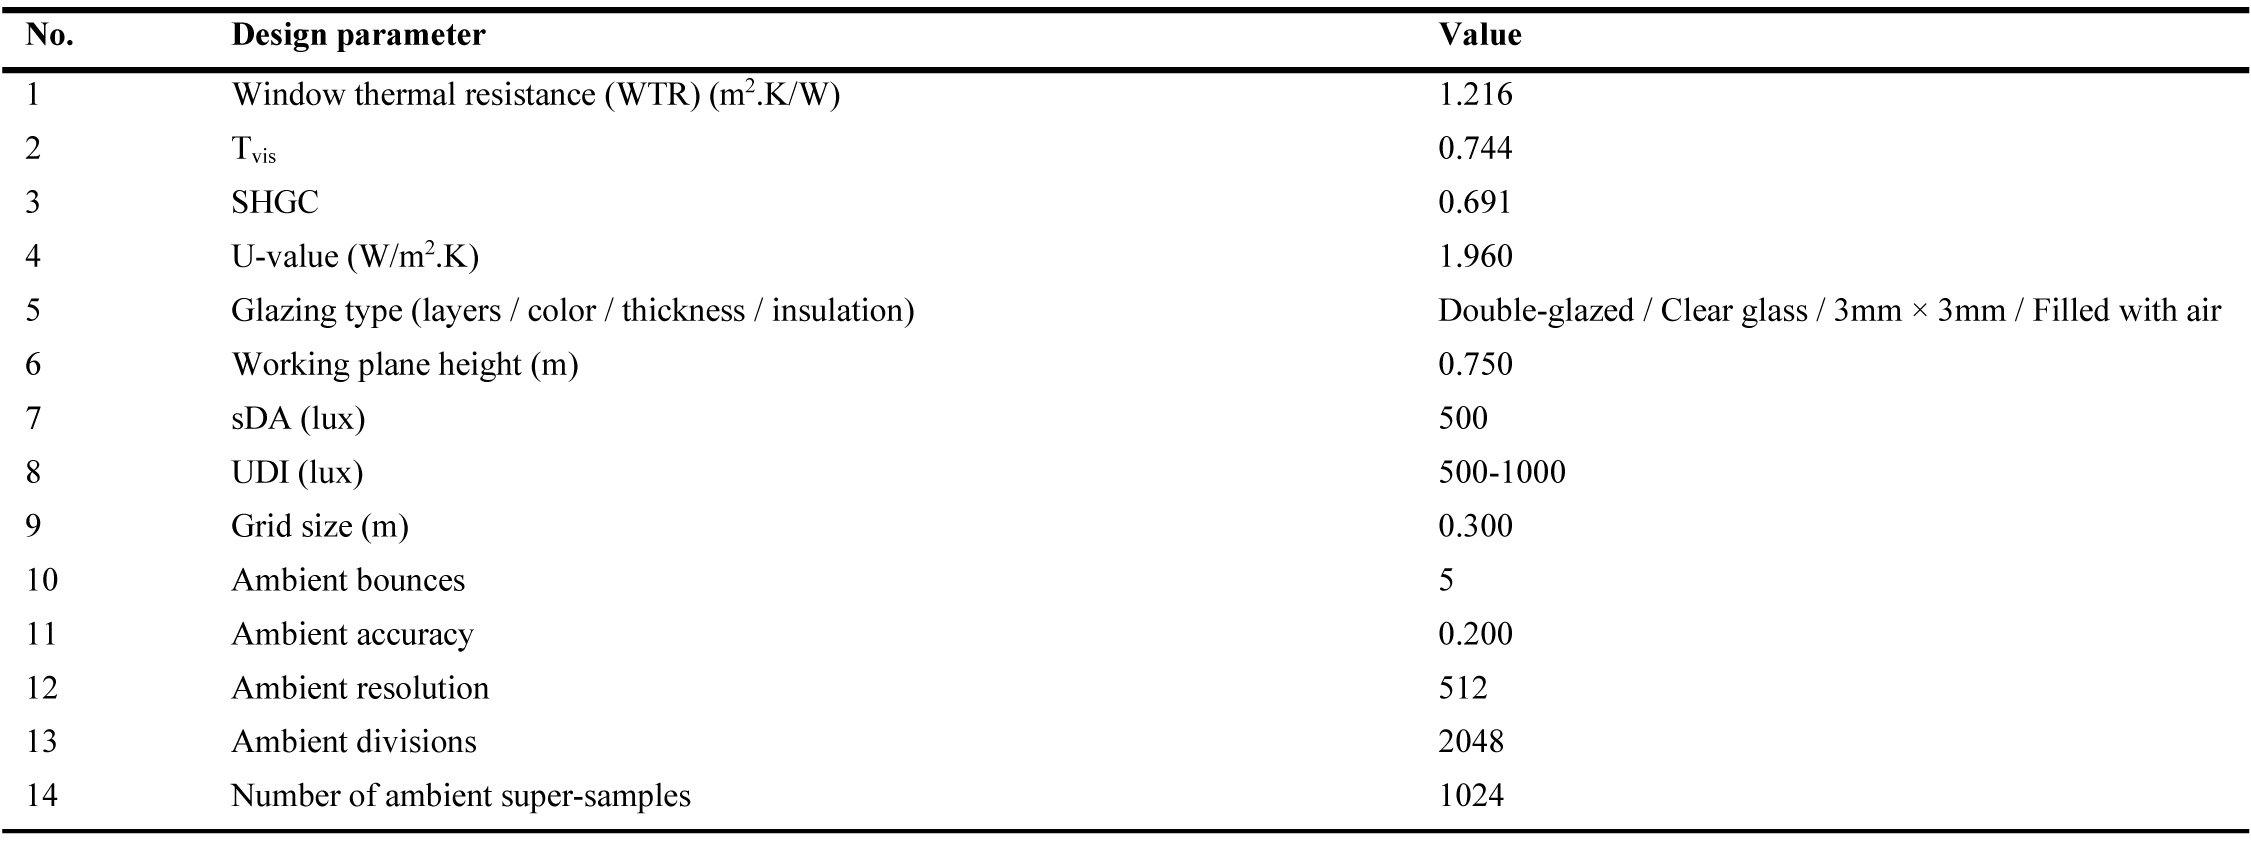 Table 2
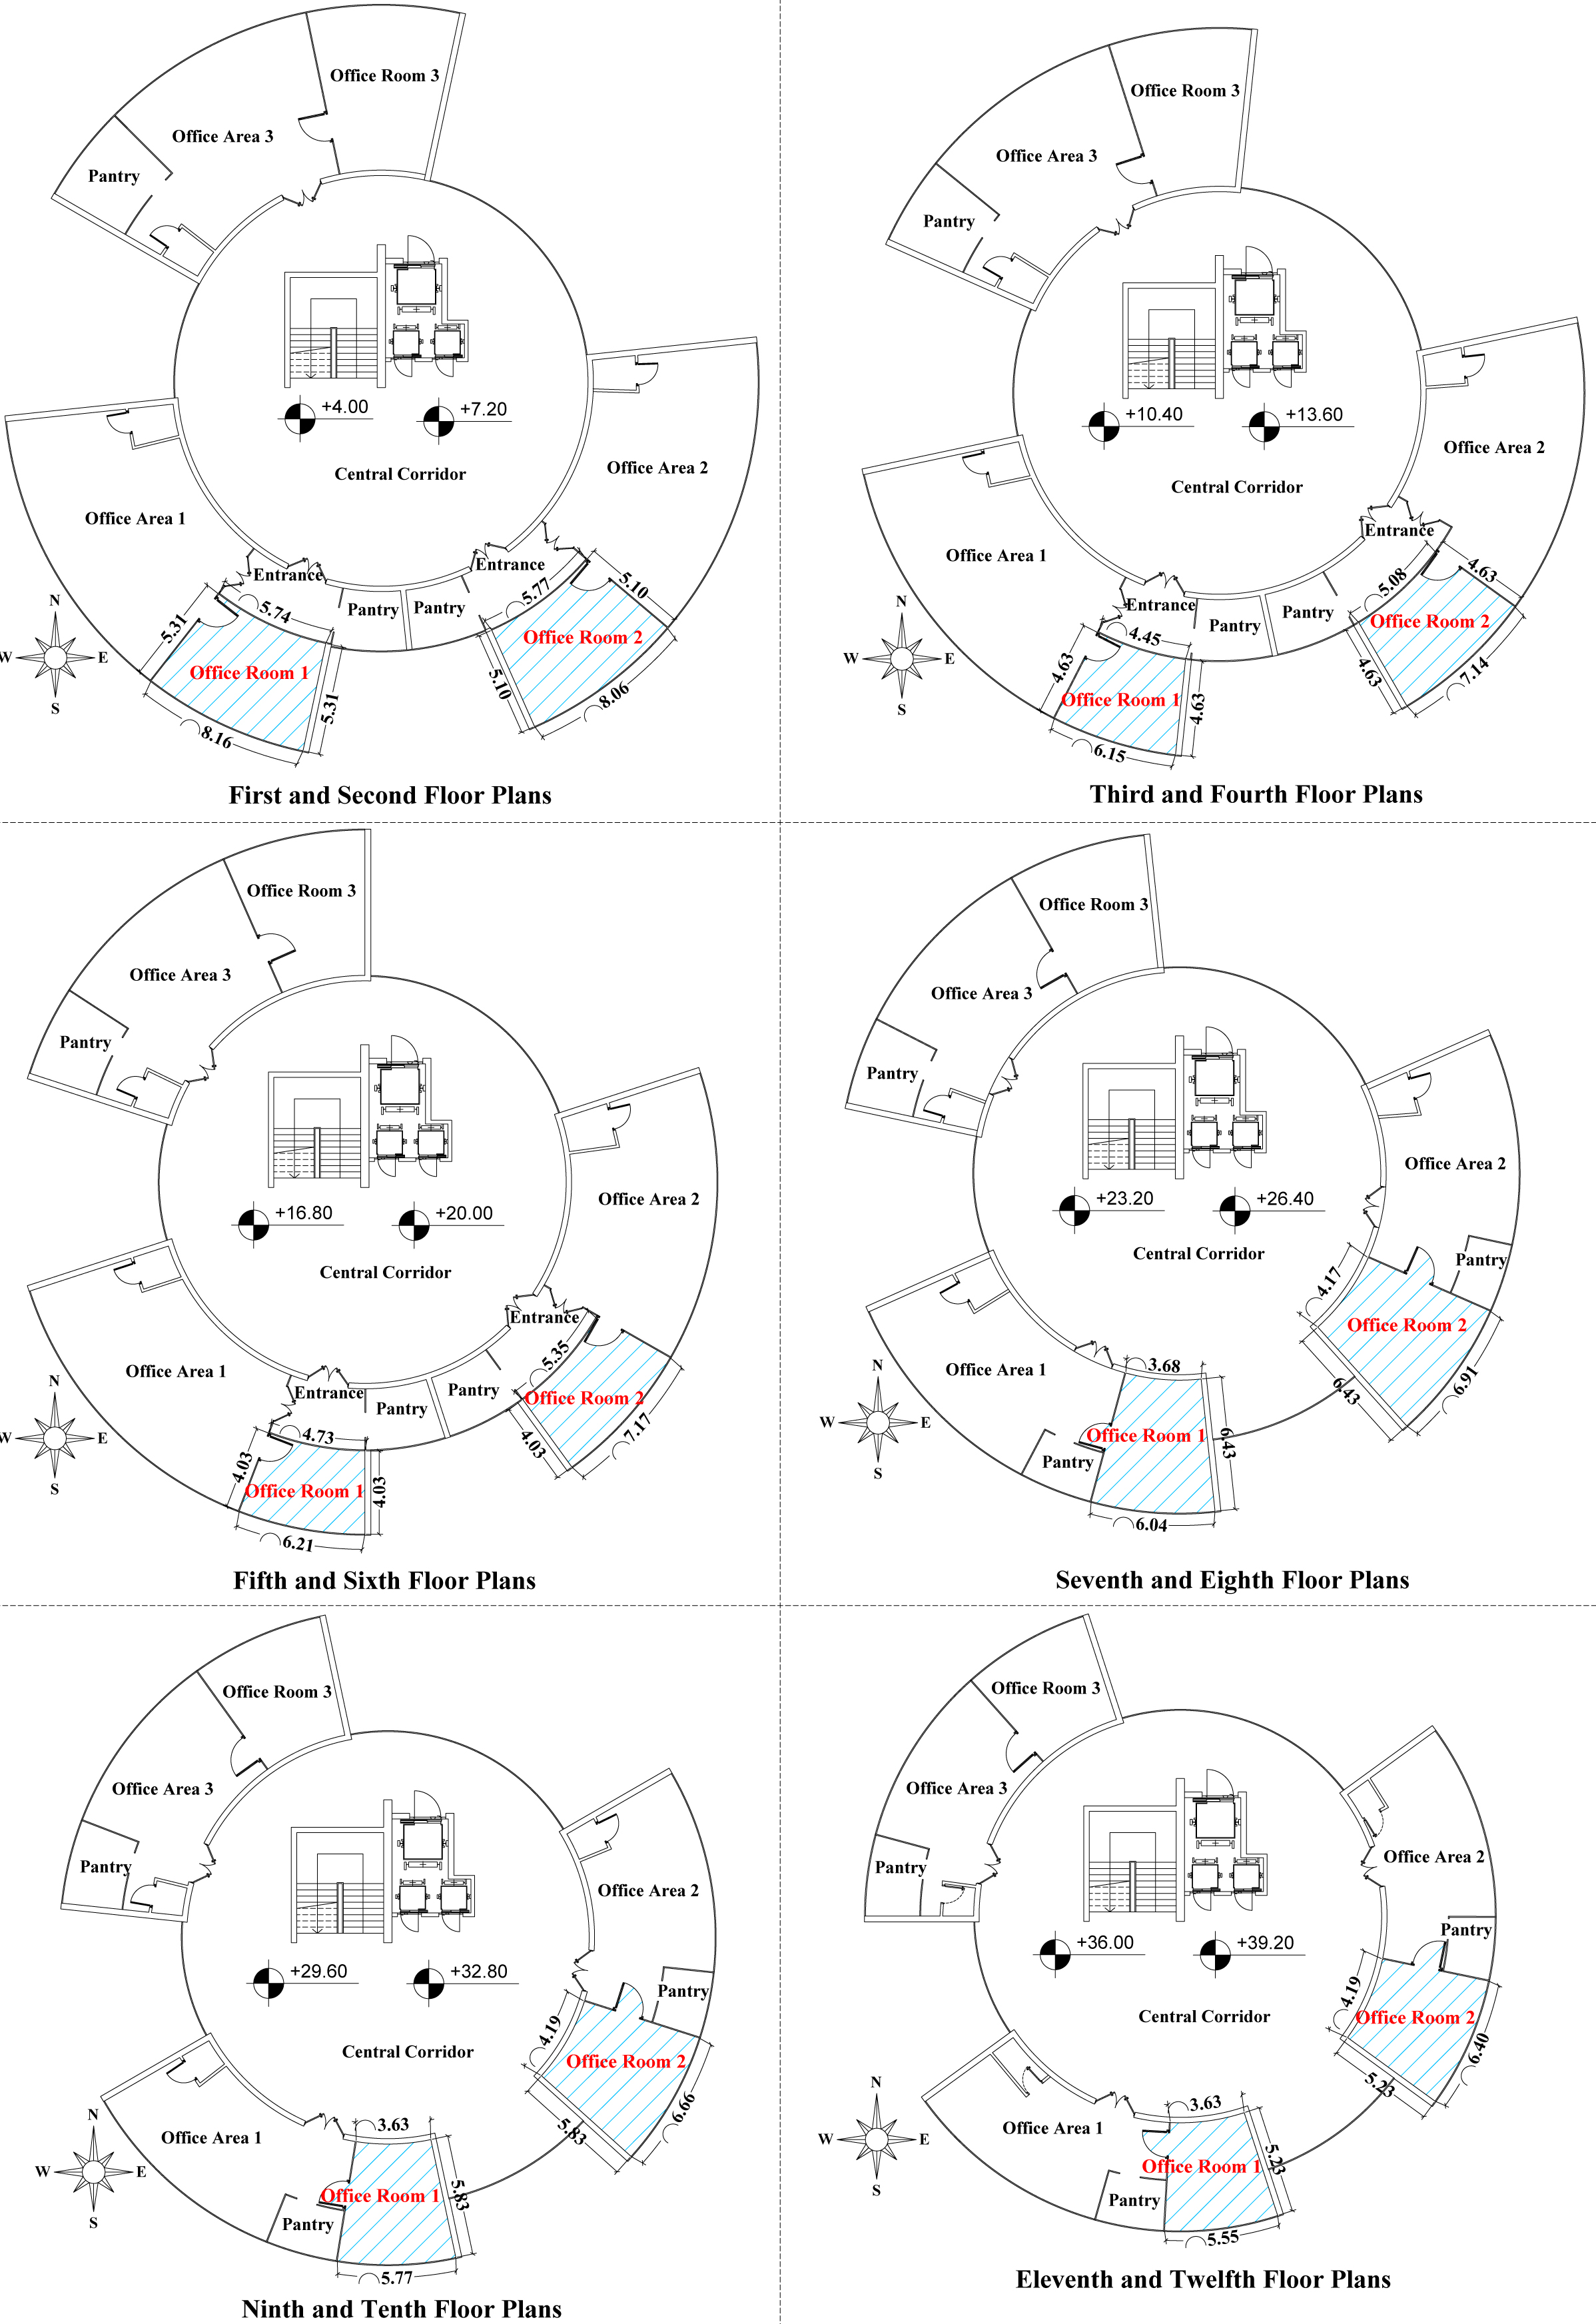 Figure 5
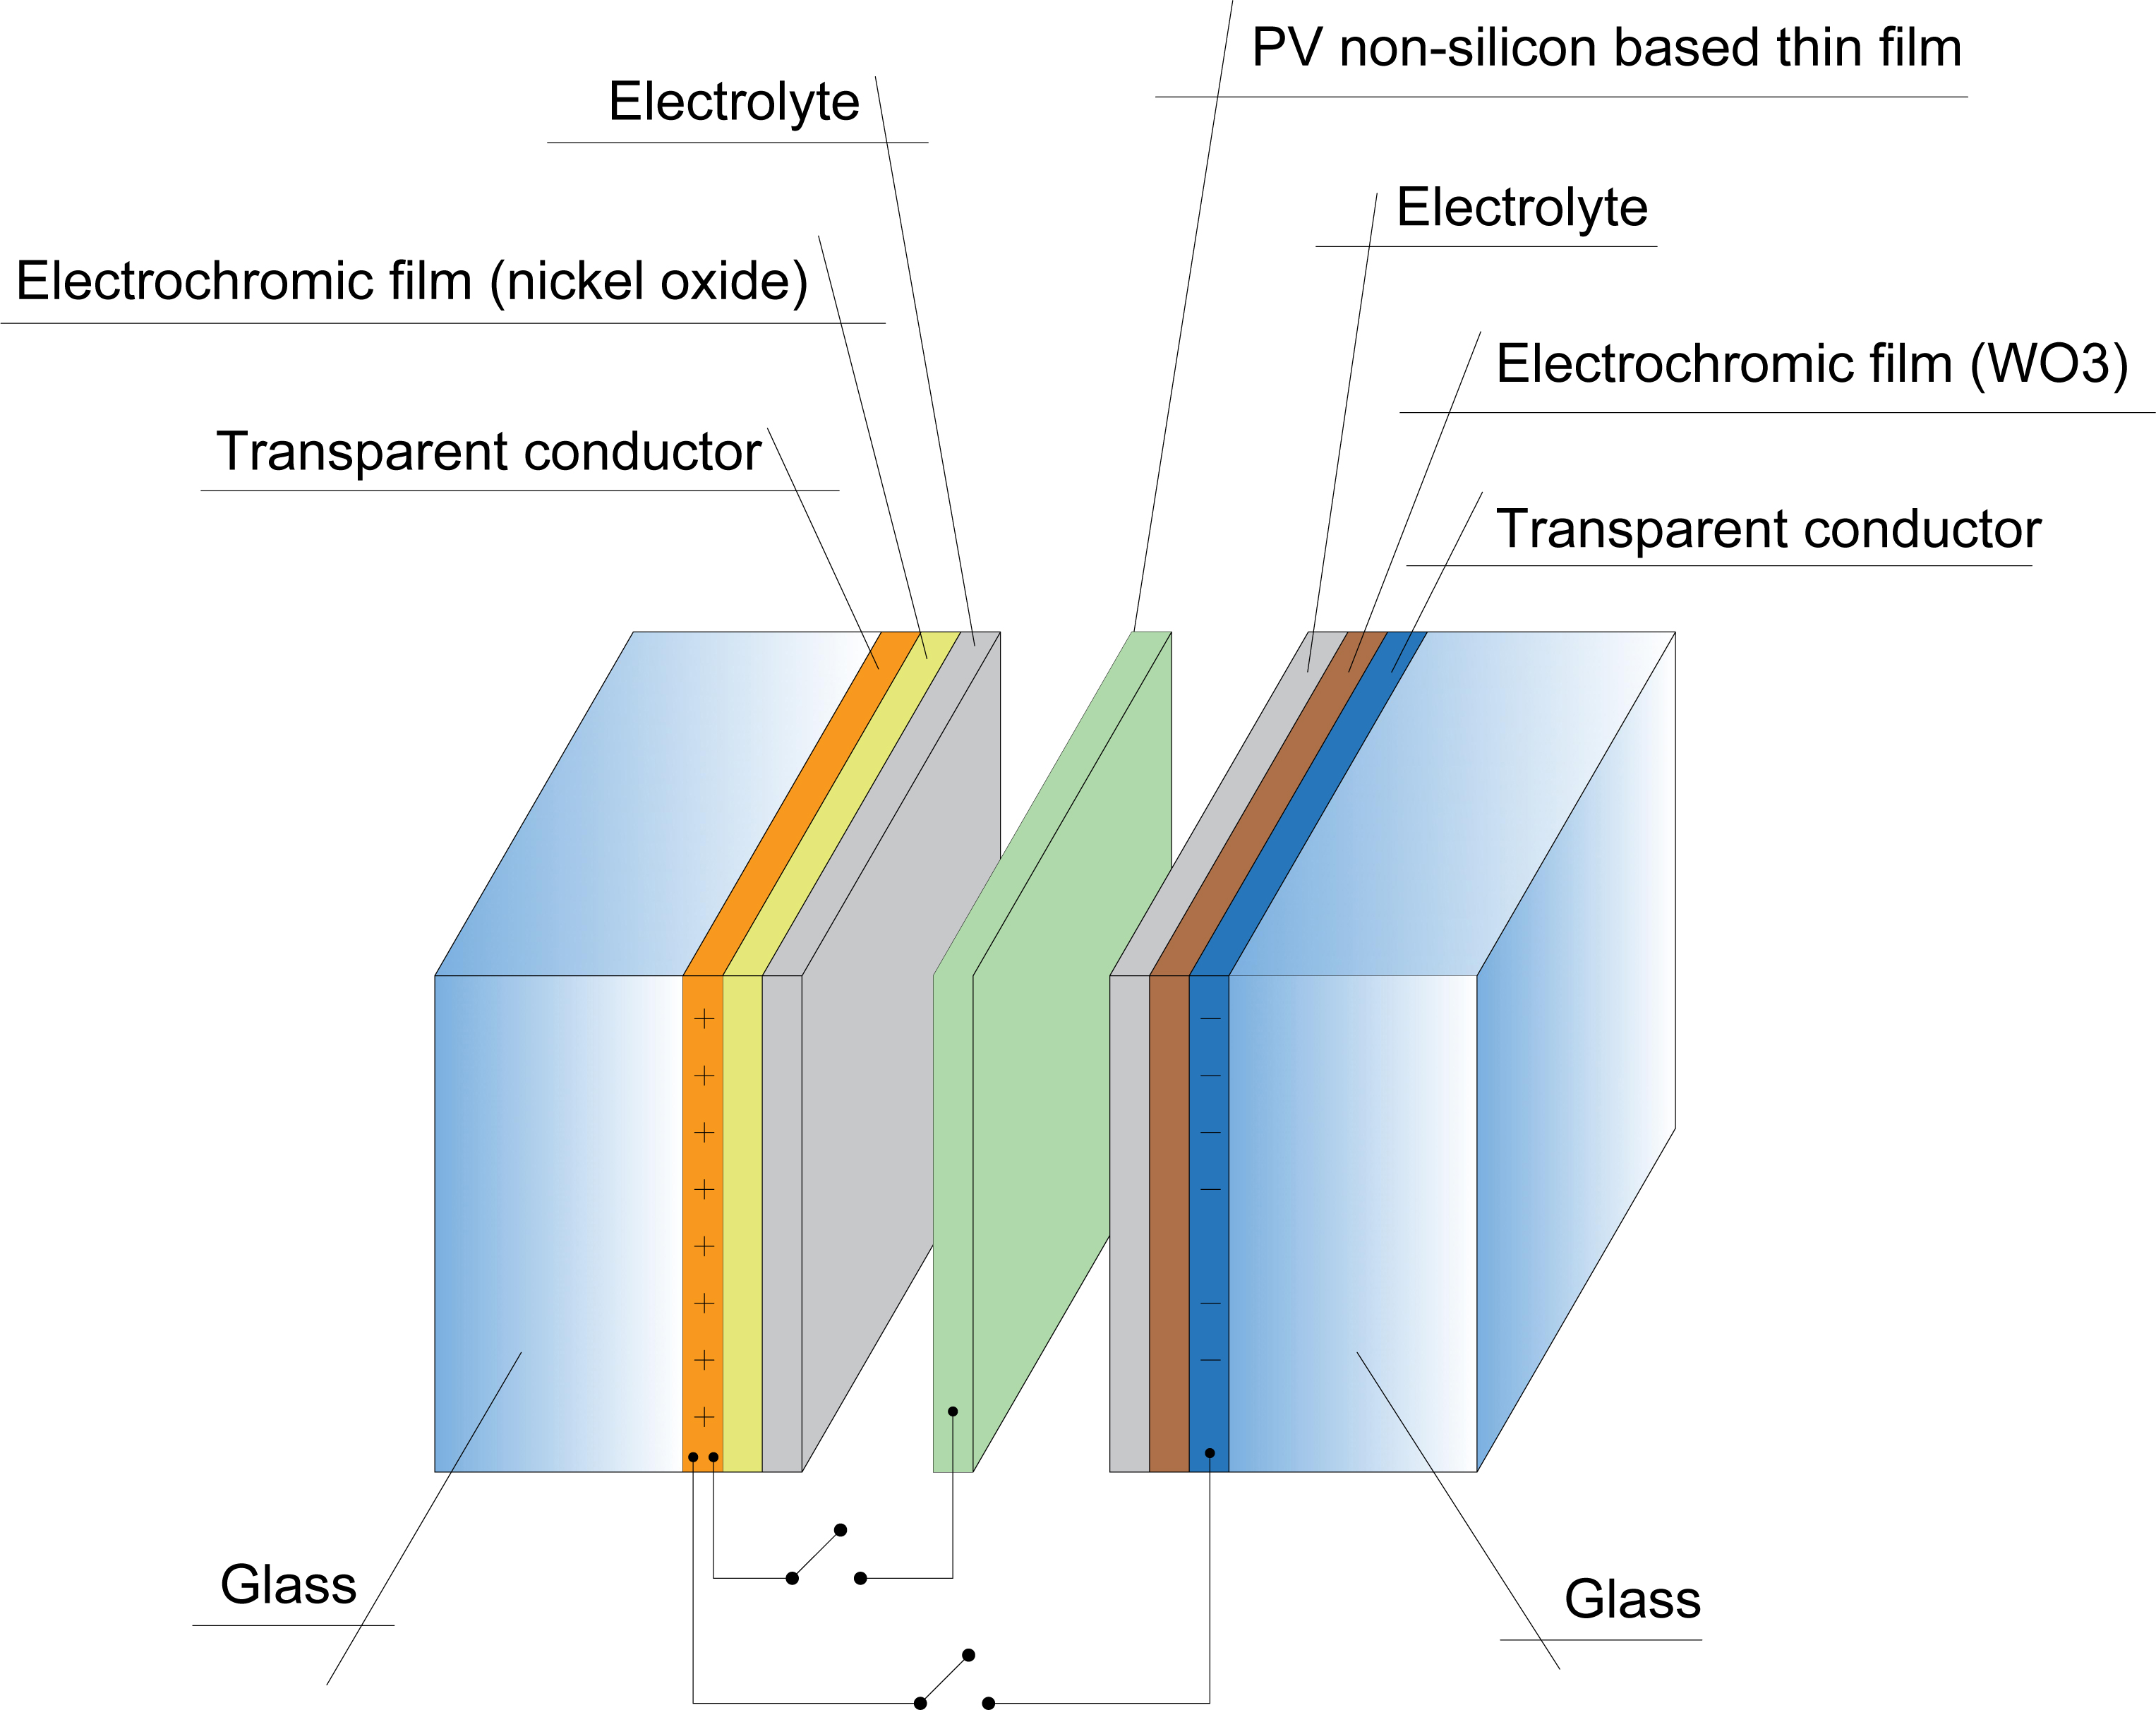 Figure 6
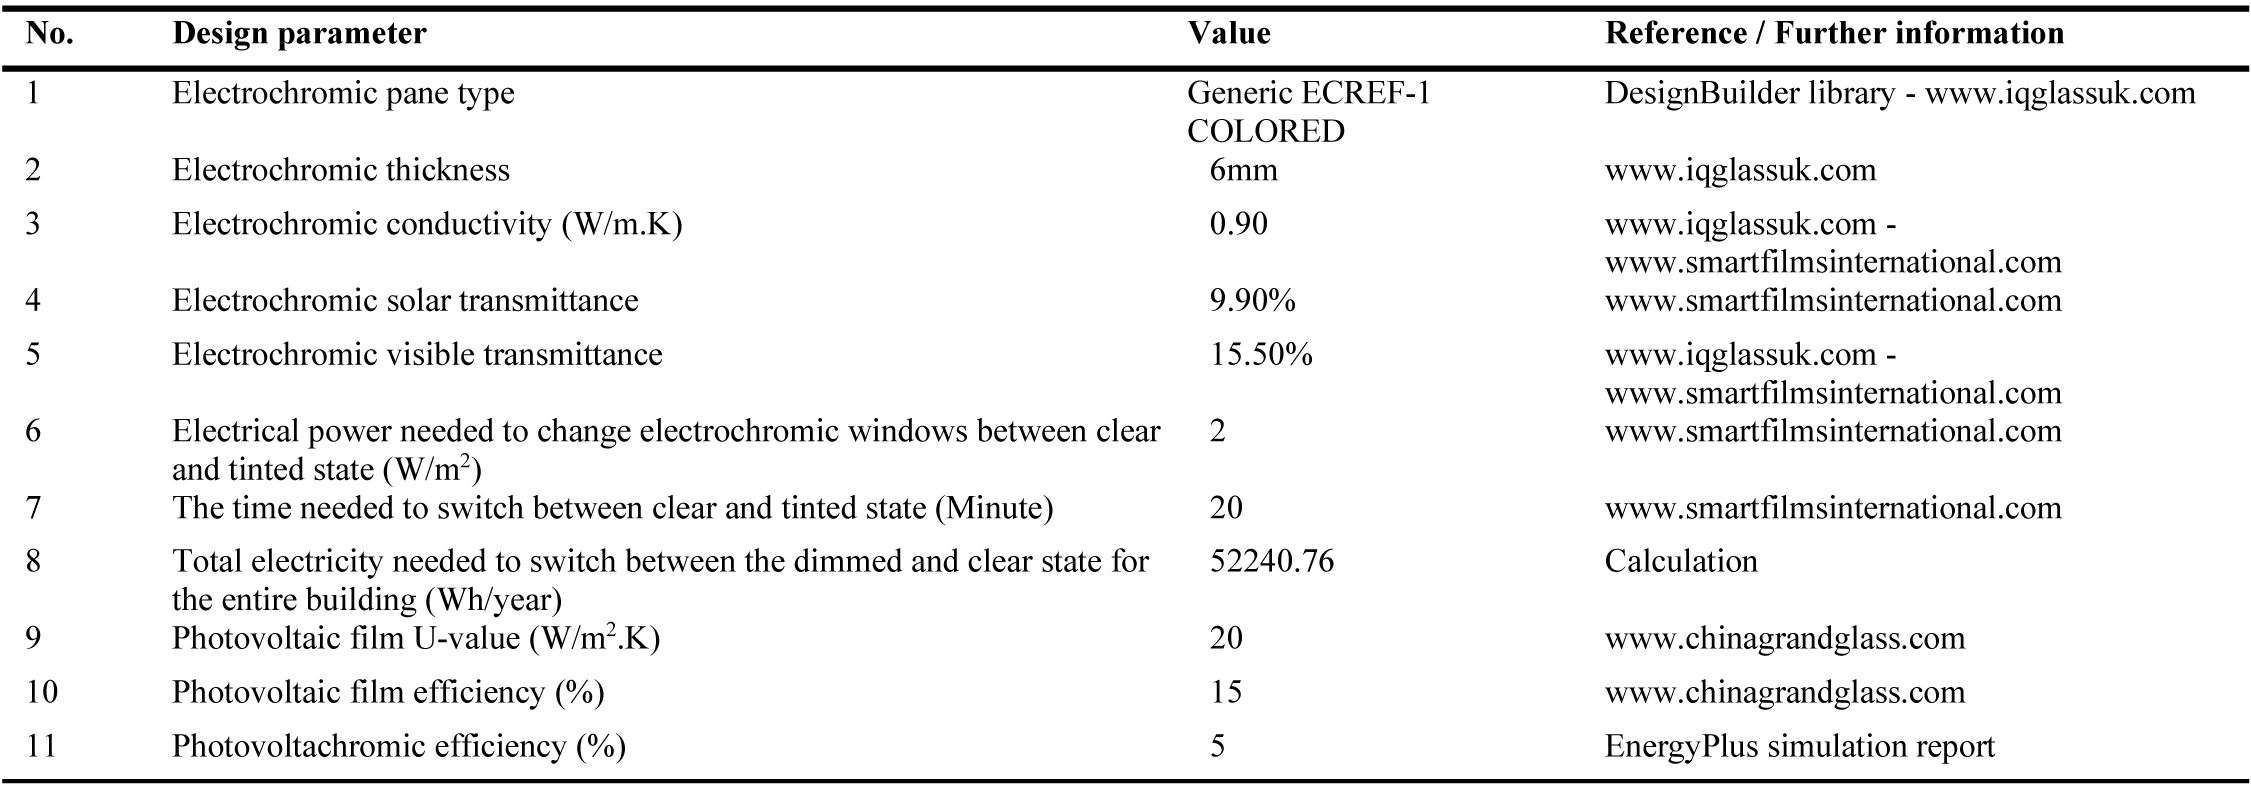 Table 3
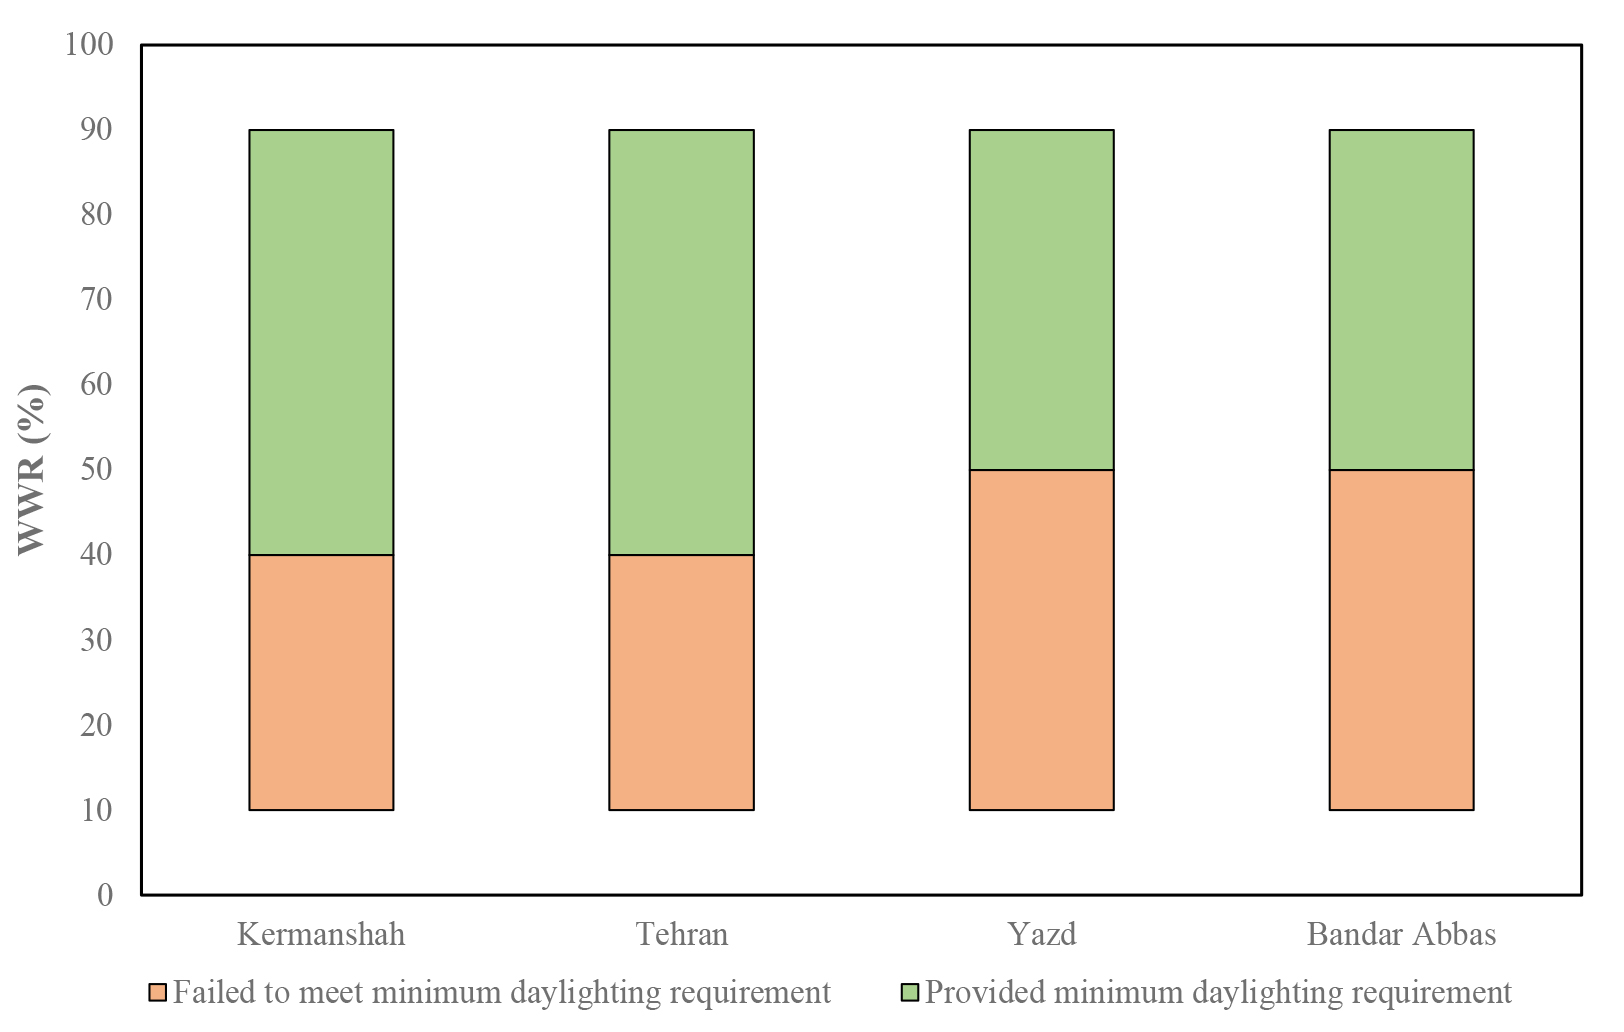 Figure 7
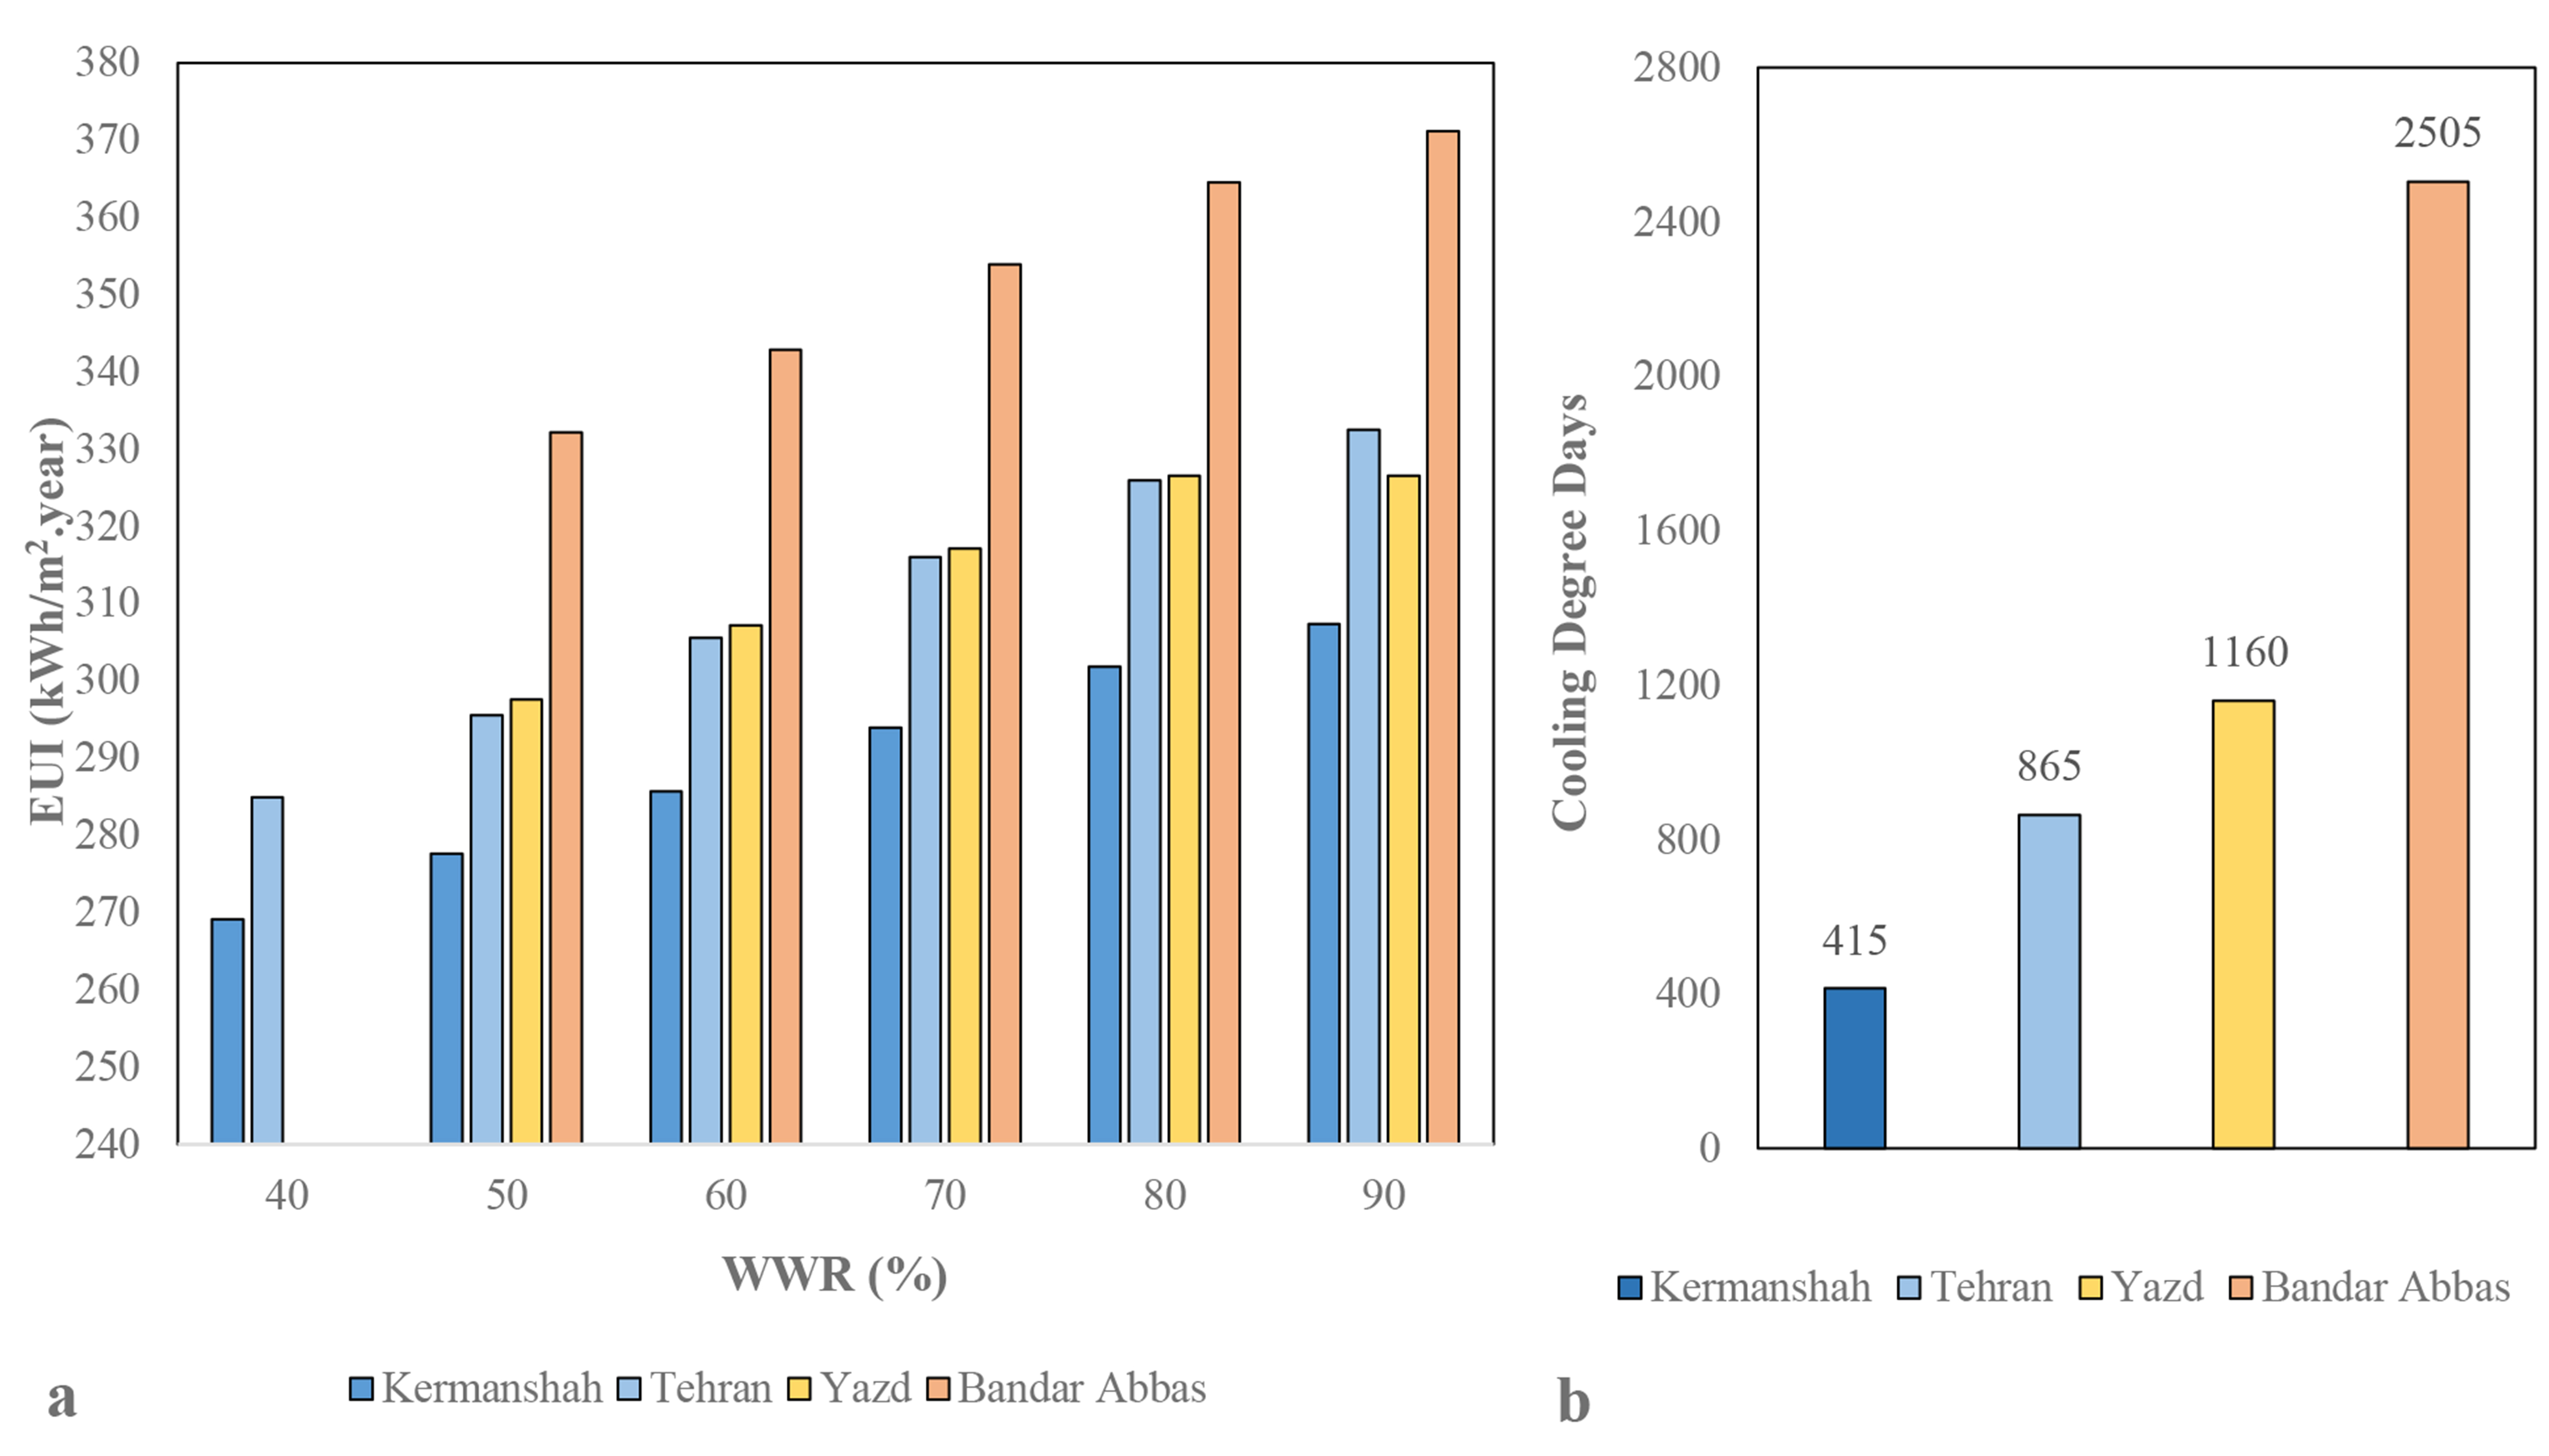 Figure 8
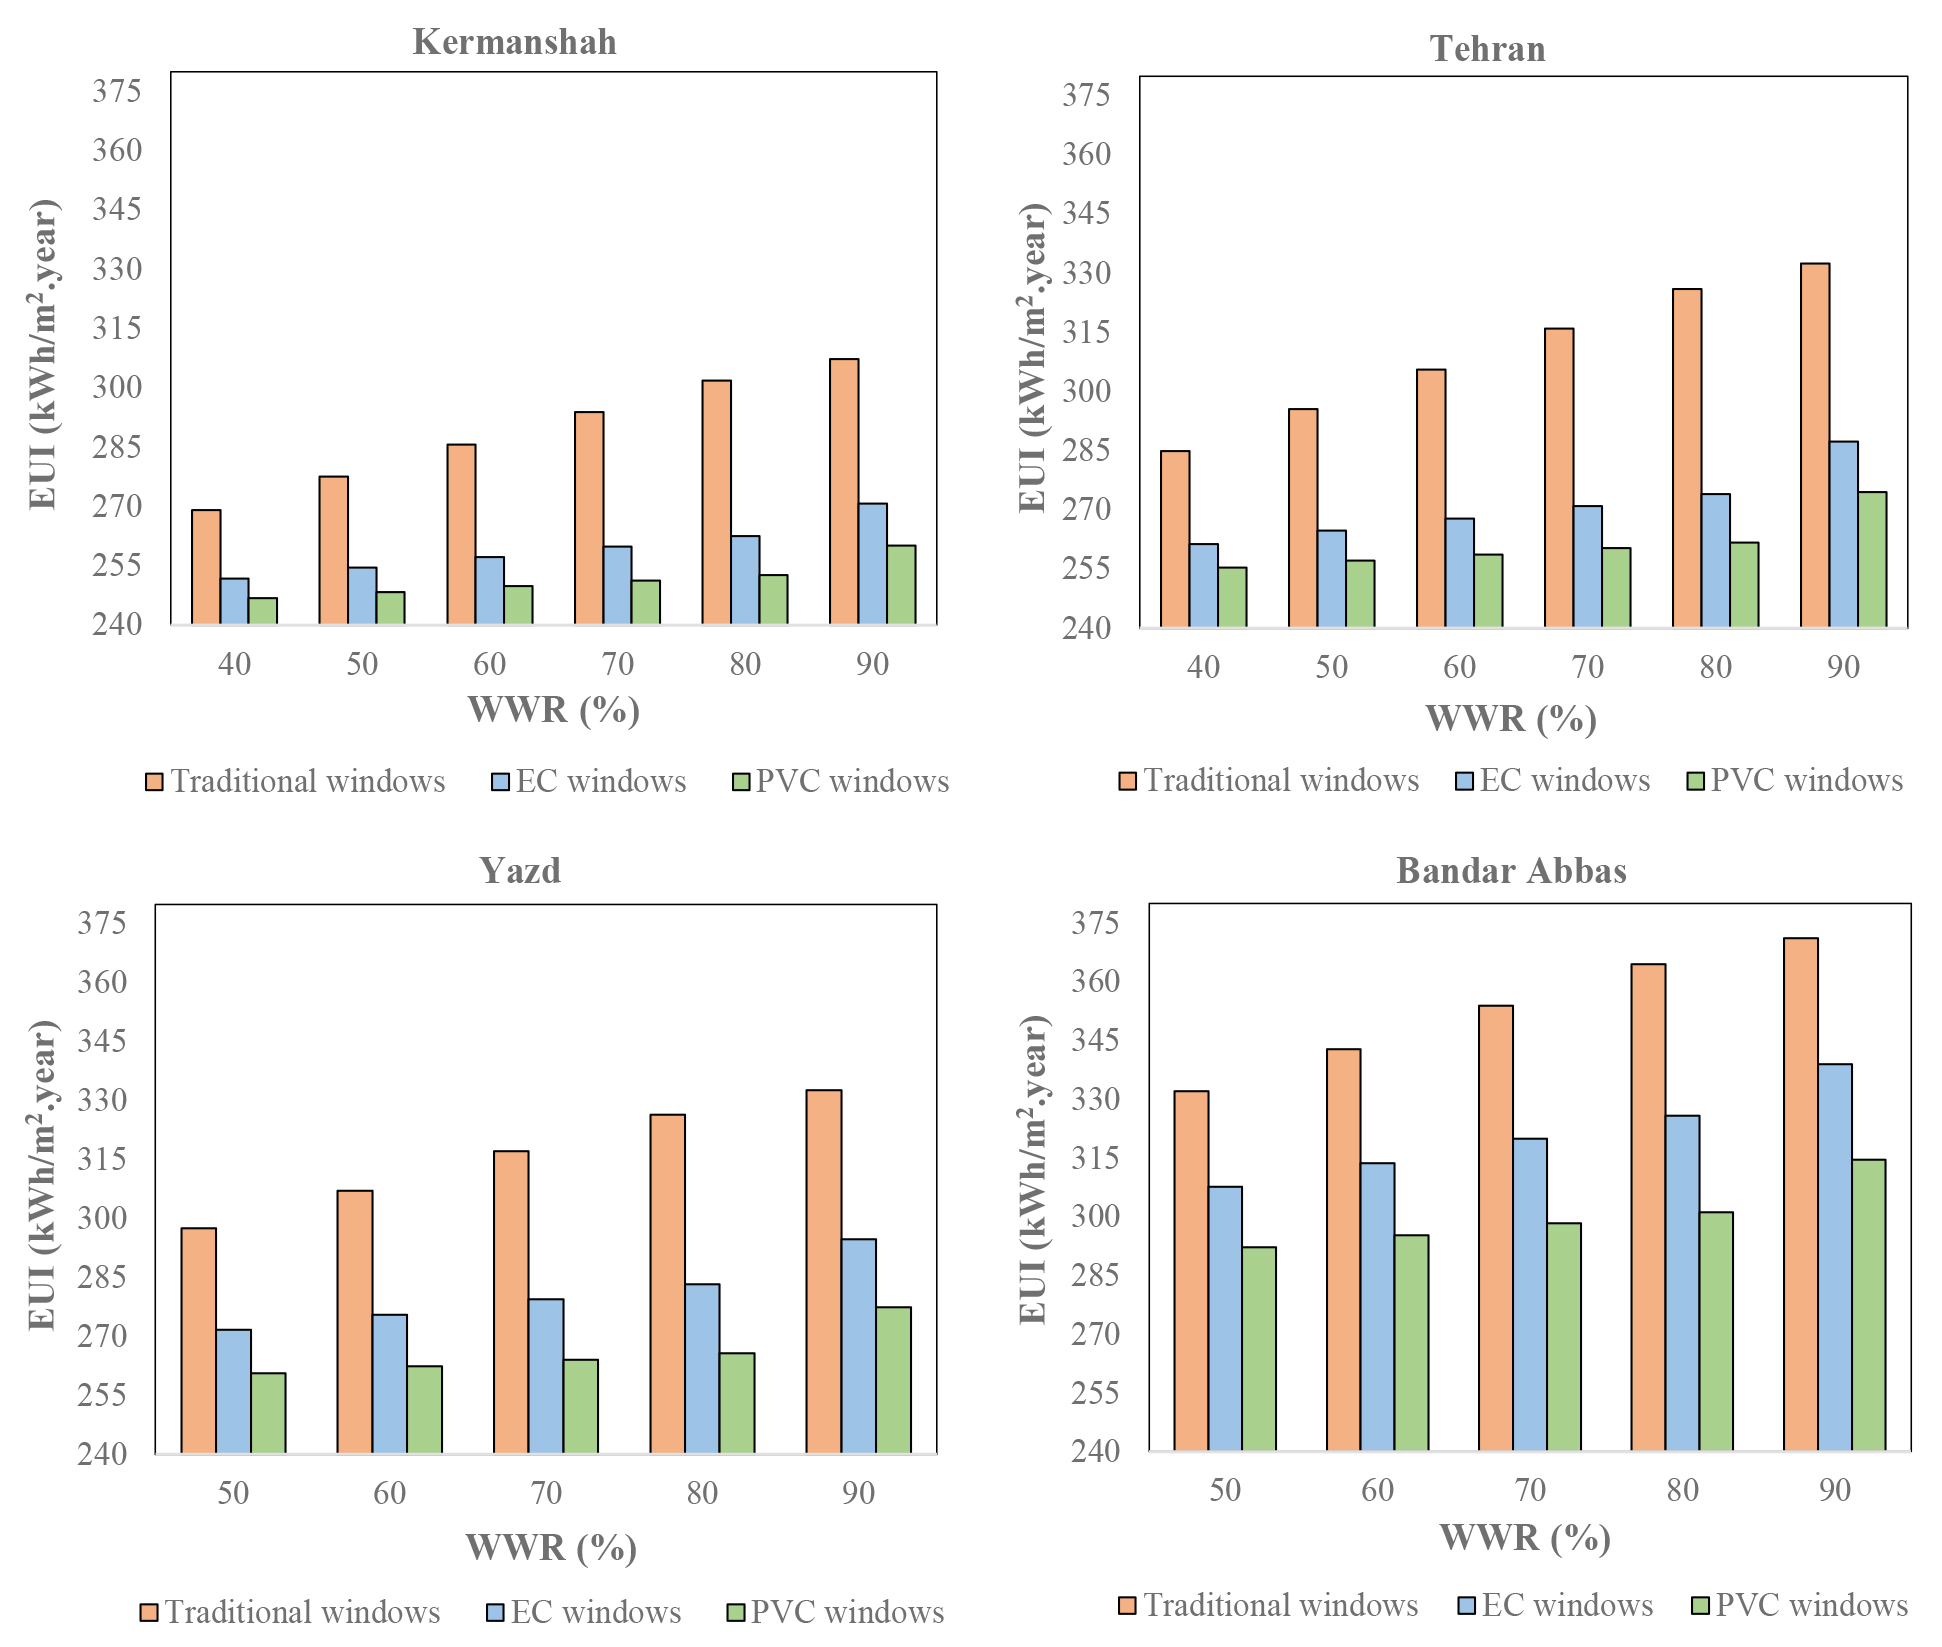 Figure 9
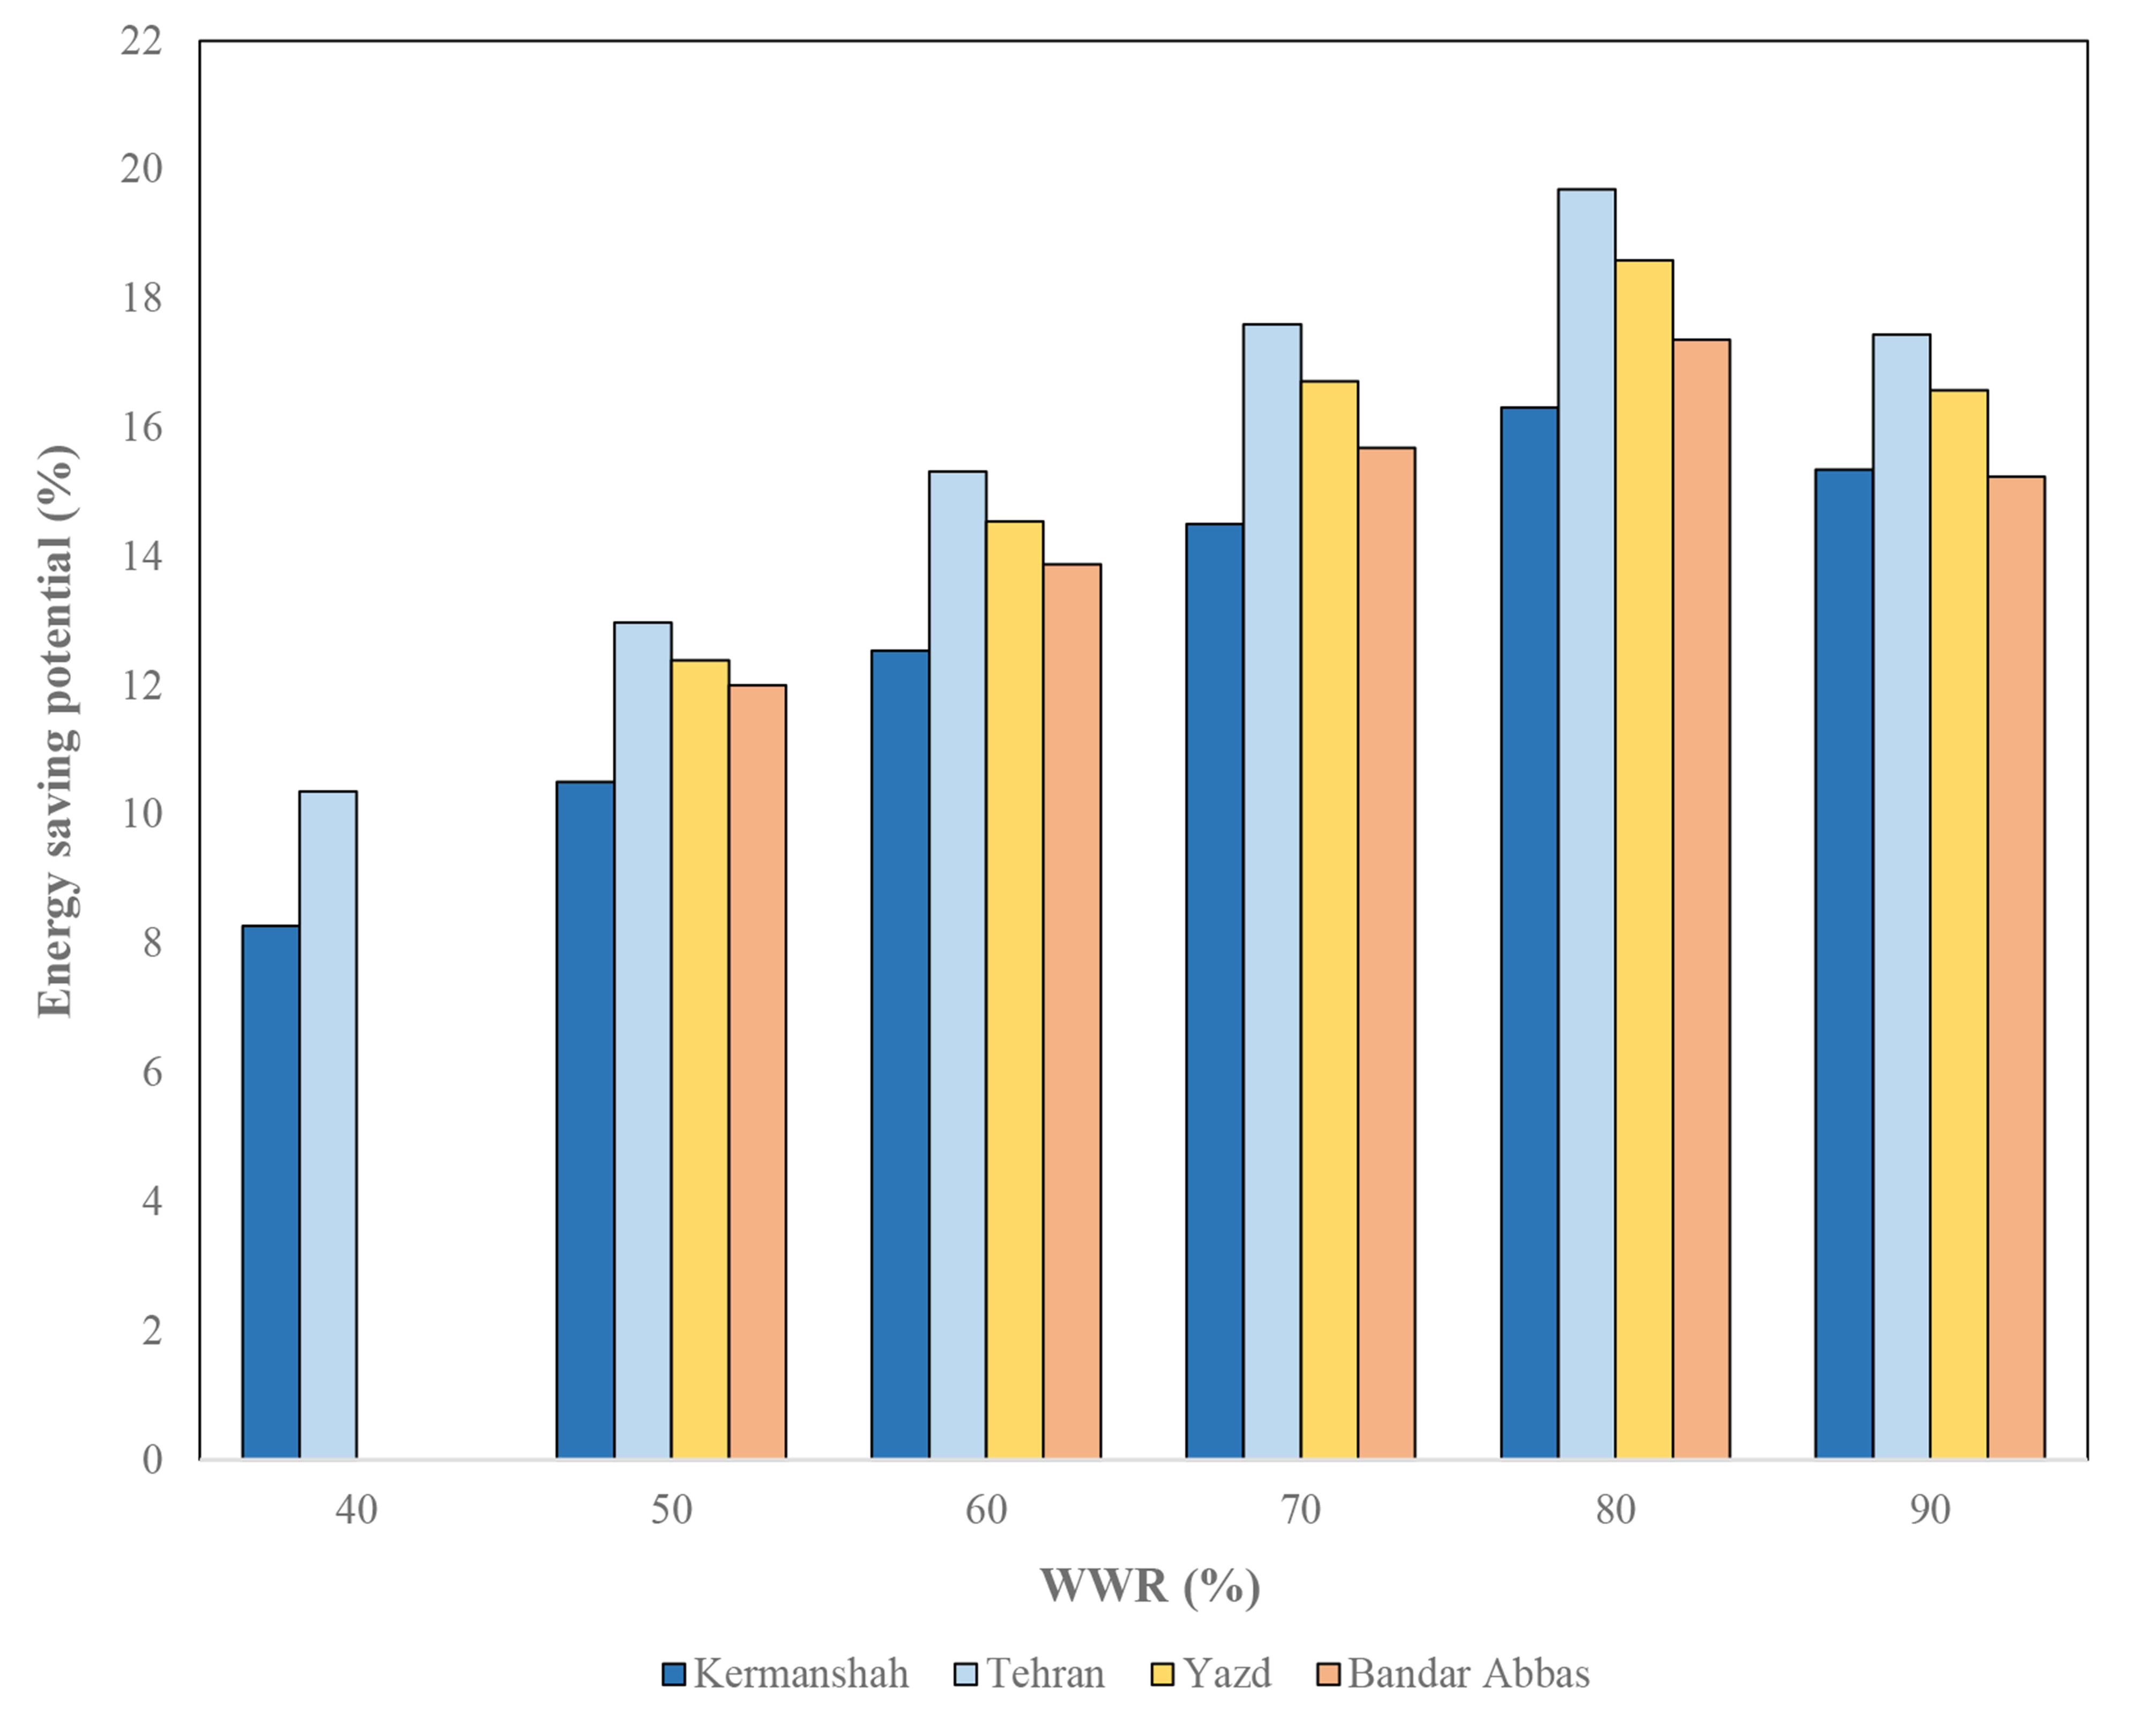 Figure 10
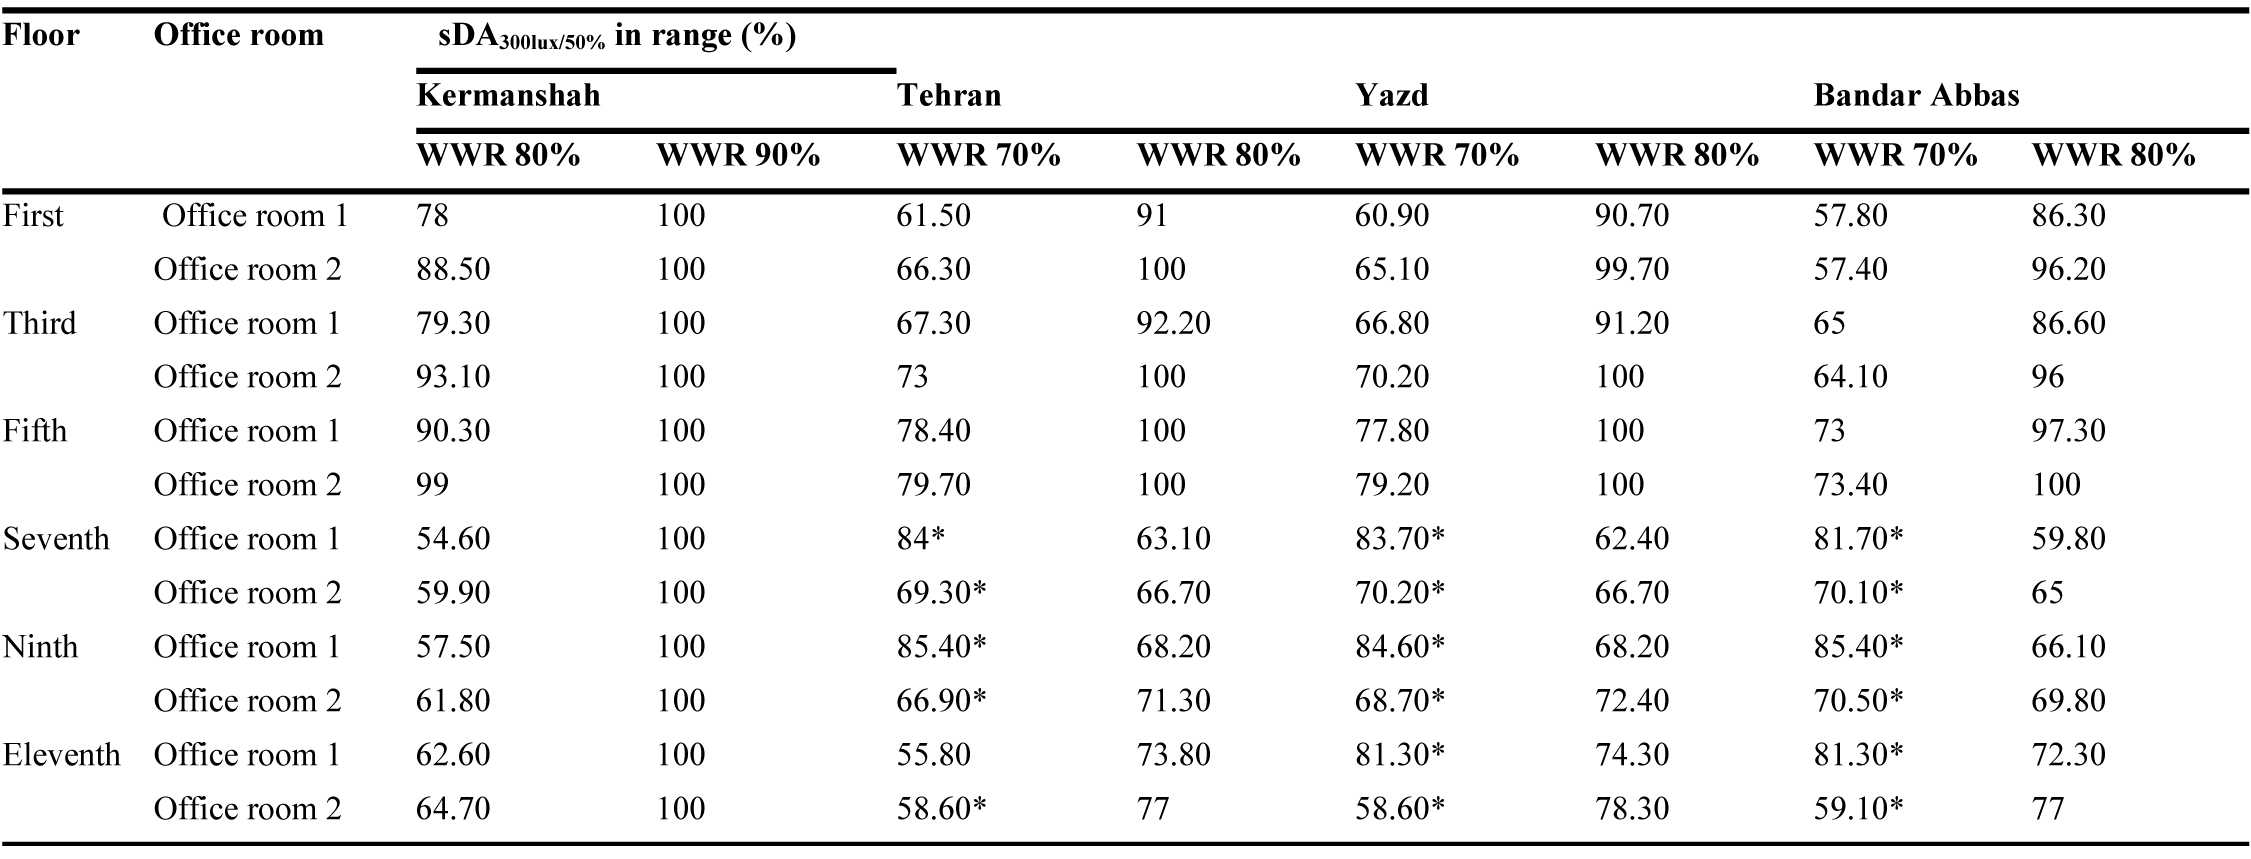 Table 4
 Table 5
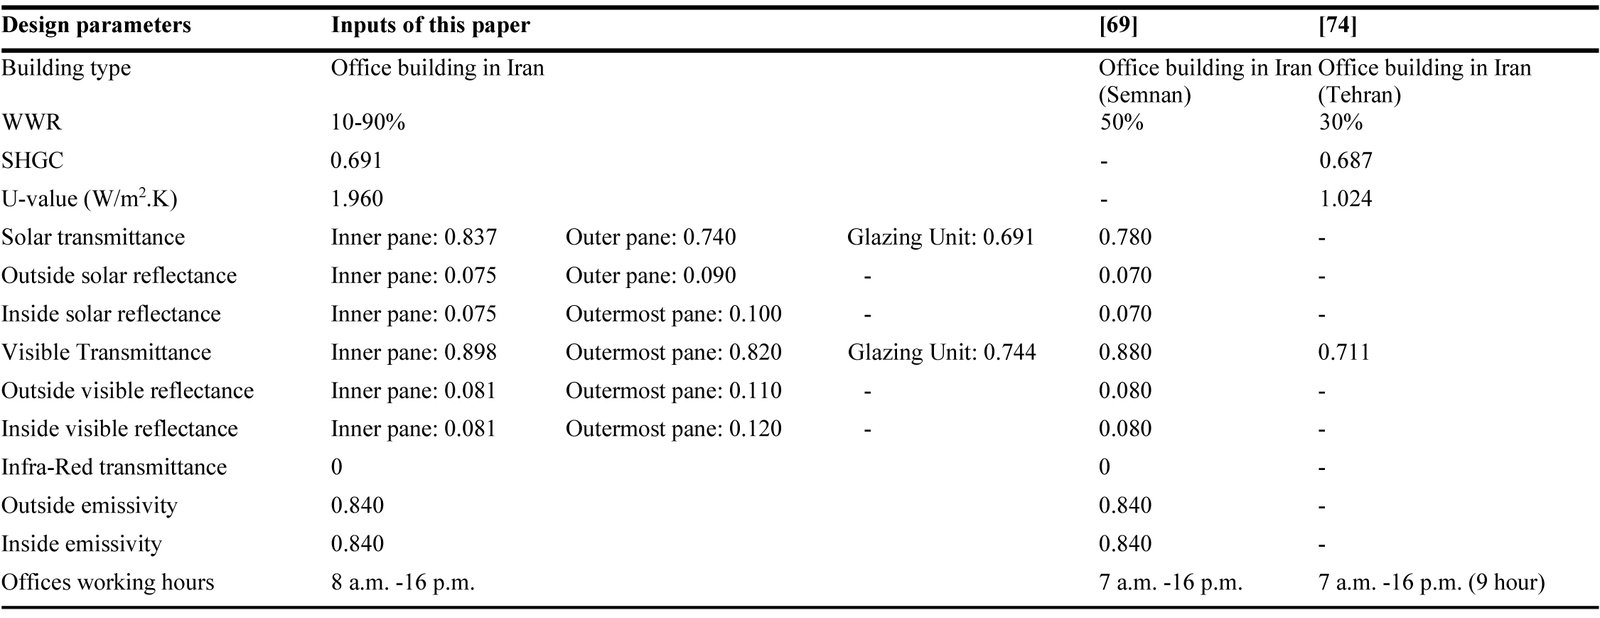 Table 6


