Volume 8 Issue 2 pp. 181-203 • doi: 10.15627/jd.2021.16
Daylight in Buildings and Visual Comfort Evaluation: the Advantages and Limitations
Amir Tabadkani,*,a Astrid Roetzel,a Hong Xian Li,a Aris Tsangrassoulisb
Author affiliations
a School of Architecture and Built Environment, Deakin University, Geelong Waterfront Campus, Australia
b Department of Architecture, University of Thessaly, Perion Areos, 38334 Volos, Greece
*Corresponding author.
stabadkani@deakin.edu.au (A. Tabadkani)
astrid.roetzel@deakin.edu.au (A. Roetzel)
hong.li@deakin.edu.au (H. X. Li)
atsagras@arch.uth.gr (A. Tsangrassoulis)
History: Received 24 March 2021 | Revised 9 May 2021 | Accepted 17 May 2021 | Published online 03 July 2021
Copyright: © 2021 The Author(s). Published by solarlits.com. This is an open access article under the CC BY license (http://creativecommons.org/licenses/by/4.0/).
Citation: Amir Tabadkani, Astrid Roetzel, Hong Xian Li, Aris Tsangrassoulis, Daylight in Buildings and Visual Comfort Evaluation: the Advantages and Limitations, Journal of Daylighting 8 (2021) 181-203. https://dx.doi.org/10.15627/jd.2021.16
Figures and tables
 Figure 6
Abstract
Exposure to daylight significantly affects the psychological well-being of occupants by diminishing headaches, eye tensions, or stress. Daylight penetration is a matter of collaboration between building façade and perimeter zones that can be controlled through façade design features. This study reviews available daylighting systems to block or redirect natural light inside the space and their overall performance. Adaptation found to be the main key feature of daylighting systems to improve their effectiveness in indoor environments. As the main implication of such systems on the visual comfort performance of occupants, a list of quantitative indices is studied based on their mathematical equation to outline their advantages and limitations. Findings revealed a lack of agreement on acceptable indoor illuminance thresholds for most of the indices and the absence of a reliable glare index in presence of sun within the view field of the occupant. Similarly, many green building certifications propose a specific criterion to assess view out but remained a challenge for future studies.
Keywords
Building envelope, Daylighting systems, Occupant comfort, Quantitative metrics
1. Introduction
Many researchers stated daylight as an optimal psychological fact for living since first human beings identified Sun as the only lighting source and lived under daylight conditions [1]. Beside psychological effects, especially during a task, a pleasant lighting quality is always appreciated and linked to human’s comfort and performance, but it is beyond the bounds of possibility to build an objective relation between light and productivity [2], as many other variables are taken into account such as noise, air quality and temperature. People have an instinctive tendency to natural light rather than artificially lit spaces in a building and studies confirmed exposure to daylight can have a significant effect on well-being by diminishing headaches, eye tensions, or stress [3].
Daylight design in buildings is a subjective argument based on the urban regulations, building typology, architectural planning and limitations, aperture proportions, economic or occupant desires and their reactions to the lighting condition. In some buildings, daylighting strategy is unique like museums, while in office buildings, daylight is more important than other hosting factors, therefore implementing daylight concepts in the early stage of a design is beneficial in certain ways: (1) economic and ecological effects by reducing energy consumption and greenhouse gas emission [4]; (2) supporting natural rhythm of the human circadian system physiologically [5]; (3) ensure superior color rendering to improve health, visual system and supply high rate of flicker-free illumination dynamically which stimulate human eye [6]; and (4) social behavior is usually improved within occupants who are closer to windows [7] or in a room with more apertures [8]. Since daylight is not accessible during the day permanently and its magnitude decreases in the deeper side of the space, thus there should be always a proper combination with artificial lighting and geometrical planning.
From global perspectives, the source of daylight (sun) in high-latitude regions is noticeable during summer and winter conditions, while at lower latitudes the daylight variations are reduced [9]. Therefore, at high latitudes where daylight levels are quite low during winter, designers aim to redirect daylight into the building from the brightest part of the sky, and maximize sunlight penetration. On the contrary, in the regions where daylight levels are considerably high over the year, the design strategy often emphasizes on restricting amount of incoming light to prevent overheating and discomfort glare [10].
A conventional window may be enough to let the daylight enter the space, but providing more natural light into the depth of the space requires more advanced design alternatives such as daylighting systems. Daylight penetration is a matter of collaboration between building façade and perimeter zones. Thus, seeking integrated daylighting control strategies within an energy efficient process is a challenging task to manage various performance objectives such as lighting, mechanical energy demand and envelope thermal properties with human desires like visual comfort, or personal operational controls. This is a multi-objective task and require extensive knowledge of daylighting systems and quantitative indices to assess visual comfort. To date, many daylighting systems were introduced and used in buildings that either could guide the light into the depth of a space or redirect it into the space to improve visual comfort. Following the visual comfort evaluation, two fundamental quantitative indices are used to as basis to develop new metrics; illuminance and luminance. Illuminance refers to the received daylight on a horizontal task plane while luminance is the luminous intensity within a view direction of user. As a result, this paper aims to review two fundamental scopes that found to be absent in the literature: (1) outlining the benefits and limitations of each daylighting system with respect to visual comfort and energy savings, and (2) the implications of daylight penetration into the space on visual comfort that requires further attention for quantification from different perspectives including daylight level or uniformity, glare, and view to outdoors. It should be noted that the latter section of this research aims to update the literature provided in [11] as some of the indices were introduced recently.
2. Methodology
This study aims to update the literature in terms of current advantages and limitations of different daylighting systems and visual comfort quantitative indices. To this end, a critical review and analysis was conducted for this research according to its definition [12] in four main steps: 1) an extensive research through cross-referencing to identify the key papers in the field, 2) evaluating the literature based on their contributions to their respective functions, 3) outlining the key research gaps, and 4) highlighting the potential recommendations for future investigations. As a result, following the research workflow presented in Fig. 1 and the aim of this study, the structure of the paper is divided into three main sections:
- Section 3 – An overview of available daylighting systems and their implications on either visual comfort and energy savings.
- Section 4 – Detailed mathematical explanation of the existing visual comfort quantitative metrics, their dependencies and limitations.
- Section 5 – highlighting the research gaps and recommendations based on findings of previous two sections.
Figure 1
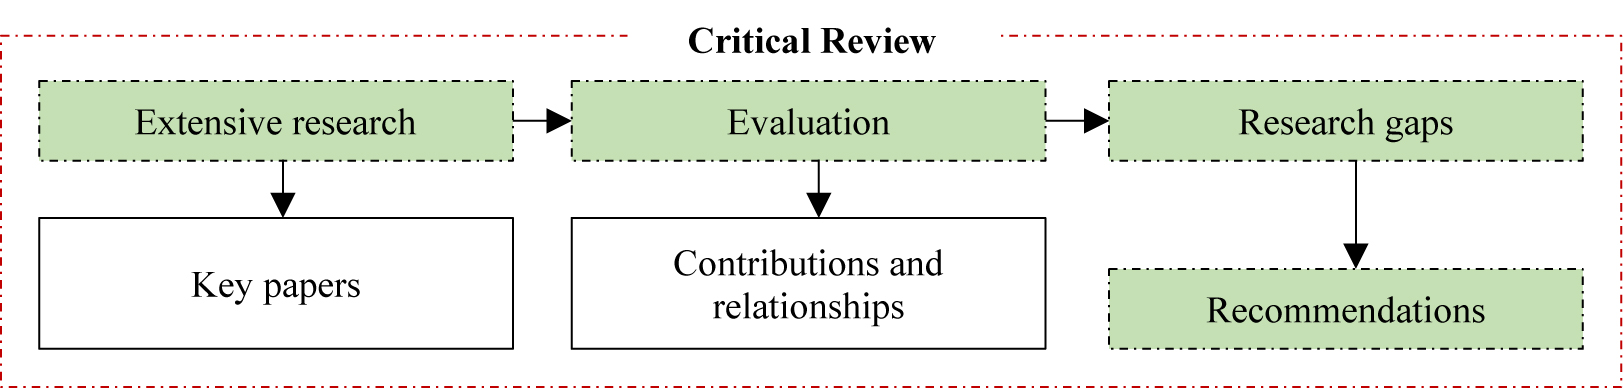
Fig. 1. Research workflow.
3. Daylighting systems
Windows are not only apertures in building envelopes anymore since new innovations like double-skin facades changes the underlying definition. Nonetheless, windows are used to mainly provide views to outdoors and daylighting. To this end, there are two main approaches to deliver more daylight to the interior, by increasing the floor area fraction near to the fenestrations that require architectural design strategies, or applying daylighting optical structures to deliver light thoroughly beyond perimeter zones. In order to redirect light or prevent excessive sunlight penetration, advanced daylighting techniques can be helpful, especially in cases where particular tasks are performed or a high degree of visual control is essential. Substantially, selecting a proper system should take into consideration three main aspects [13]: (1) window or other opening’s functionality (e.g. visual connection and/or permit daylighting); (2) the responsibility of the system (e.g. redirecting and/or blocking light); and (3) the interaction of the system with other available systems. As a result, a wide range of daylighting systems have been applied in different researches and experiments that are either played a role as guiding the daylight into the space or as shading systems, in which the following section discusses the features of each system individually.
3.1. Prismatic panels
Prismatic panels are planar components including a flat surface and a prismatic patterned side composed of transparent materials such as polymers [14]. These panels are usually consolidated within window panes for low maintenance. The basic function is to redirect diffused lights from the highest point of sky towards the deepest side of the room especially in highly obstructed sites and the second role is to reflect certain light angles while transmitting from other angles. As shown in Fig. 2, the panels can be applied as a fixed light-guiding system or as an integrated adaptive system [15]. The former type usually used in glazed roofs aimed to redirect the diffuse daylight within certain angles, while reflecting direct sunlight of other directions through a reflective coating (aluminum), and the latter case is normally found as louver form to reflect sunlight from a certain angle by entire inner reflection. However, if they are placed vertically to deliver daylight deeper into the interiors, they can play as an anti-glare system except when sunlight enters directly.
Figure 2
![Fixed and adaptive prismatic panels [15].](figures/8-181-2.jpg)
Fig. 2. Fixed and adaptive prismatic panels [15].
In practice, prismatic panels are translucent and falsify the outdoor view and preferably should be positioned vertically higher than eye level to maintain the visual field for users. The system is able to transmit light by 90%; however, under overcast sky conditions, it decreases daylight factor imperceptibly comparing with clear glazing [16]. Moreover, the overall performance of the system highly depends on the deflecting angles and climate, although under sunny sky conditions has a potential in energy savings. Besides, an integrated system was developed to increase the indoor illuminance levels in University of Berlin, Germany by Hüppe, including a layer of prismatic panel for sun shading and a semi-perforated blinds to deflect the diffuse light; however, as they are placed internally, the shading factor is quite low and the visual connection to outside is extremely reduced [13].
3.2. Laser-cut Panels (LCP)
According to the inventor [17], LCP can be installed as the main glazing system or as a second internal glazing above eye level to perform the same as light shelf or reflective blinds. Technically, it is produced by implementing parallel laser cuts with acrylic materials to act as small interior mirrors to redirect light in high portion especially in rear areas of the room [18] through passing the voids by ordinal process of refraction and reflection (Fig. 3), while preserving a good visual field. With regard to risk of glare, there is an insignificant quantity of light scattered by the LCP due to sharp edges of the system, although glare can still happen through direct sunlight when a substantial portion of light is sent without any deflections. Thus, to reduce discomfort glare, venetian blinds should be placed in front of the LCP.
Figure 3
![Light path through LCP system [19].](figures/8-181-3.jpg)
Fig. 3. Light path through LCP system [19].
3.3. Light shelf
Light shelf is designed to shade and redirect daylight through its top surface onto the ceiling and provide a glare-free visual field by dividing a window into a view zone and a clerestory zone above. With regard to its position, external light shelves perform better in terms of blocking direct sunlight and reflecting daylight towards indoor that might cause unbalanced illuminance, while interior ones maximize the sunlight flows into the indoors with high risk of glare. According to a study [20], a comparison between four scale model of light shelf and conventional overhang is conducted in Madrid, Spain, in which the study showed that light shelf performed more efficient than a classical overhang by 25% increment of redirecting light in terms of illuminance levels and it is revealed that the system reduces the existing illuminance contrast between areas near to window and back of the room by enhancing the distribution levels [21].
Further optical improvements on light shelves were suggested by [22]: (1) geometrical modification towards a curved and fragmented light shelf for sunlight reflections due to certain solar altitudes passively, and (2) available semi-specular films in market could increase the efficiency. Moreover, the same study tested four light-shelf designs combined with light pipes in Los Angles as depicted in Fig. 4. The curved configurations coated by highly reflective films (88% reflectance) aimed to redirect sunlight while the altitude changes, therefore the inclinations were calculated by taking into account the window orientation and latitude, to ensure an optimum design solution for narrow spread and specular reflections. As a result, using curved light shelves can increase indoor illuminance in rear zones up to 10 m away from the window for equinox sun angles and south faced facades (northern hemisphere).
Figure 4
![From left to right: Static horizontal shelf, one level curved light shelf, two levels, and multi-level light shelf [23].](figures/8-181-4.jpg)
Fig. 4. From left to right: Static horizontal shelf, one level curved light shelf, two levels, and multi-level light shelf [23].
Furthermore, a conceptual tracking light shelf system was proposed in Fig. 5 that reflects daylight into the space by utilizing both diffuse and direct sunlight [24] called VALRA (Variable Area Light Reflecting Assembly). This system adjusted a reflective film made by plastic over a spring-loaded tracking roller, in which its efficiency is limited to maximum 9m distance from window depending on sky changes and boarding limits.
Figure 5
![Seasonal operation of VALRA [13].](figures/8-181-5.jpg)
Fig. 5. Seasonal operation of VALRA [13].
Following dynamic approach, a comparison between static and active polished light shelf was conducted through computer-based simulations and physical examination in Sao Paulo, Brazil, where the illuminance and solar energy were the main objectives [25]. The study showed that static light shelf enhances daylight uniformity by sacrificing illuminance ranges under overcast skies, and performs better than dynamic one unless its tilt angle be optimized based on the sun’s position, where a method for controlling the tilt angle of the exterior part of a mirror light shelf resulted in energy savings [26]. Figure 6 illustrates a research study by [27] proposing a dynamic sunlight redirection system as mirrors installed on a light shelf that revealed a significant improvement of daily mean illuminance of non-day-lit spaces and uniformity up to 128% and 54% respectively in summer solstice. Also, the system does not impose discomfort glare due to the sun reflections on the ceiling except when the occupant has a direct visual connection to the sun.
Figure 6
![Active sunlight redirection system (ASRS) [27].](figures/8-181-6.jpg)
Fig. 6. Active sunlight redirection system (ASRS) [27].
3.4. Louvers and blinds
Louvers and blind systems are basically composed of multi-level horizontal or vertical slats that have the ability to be fixed or dynamically-operated [13]. The system may block the visual field, deflect and/or transfer solar radiation directly or diffusely to the interiors, although the overall performance of the system can vary significantly depending on several settings: (a) sun position [15]; (b) system positon [28]; (c) slat’s tilt [29]; (d) slat’s reflectivity and transparency [30]; (e) system operation [31]; and (f) slats configuration (flat or curved) [32].
Louvers and blinds are generally adjustable shading systems that can be applied in several applications in order to customize their performance. As the simplest form, upward-tilted slats permit light transition from sun and sky through the concave curvature towards the ceilings, while downward-tilted slats admits from light redirections ground surface primarily [16]. Similarly, an innovative system designed (Fig. 7) as ‘Fish’ system comprises fixed horizontal concaved slats with a triangular joint aligned accurately to each louver itself within window panes. As respects, the system is limited to glare control and redirecting diffuse light to upper quarter of the zone, and additional shades such as roller blind is needed to prevent solar radiation [13].
Figure 7
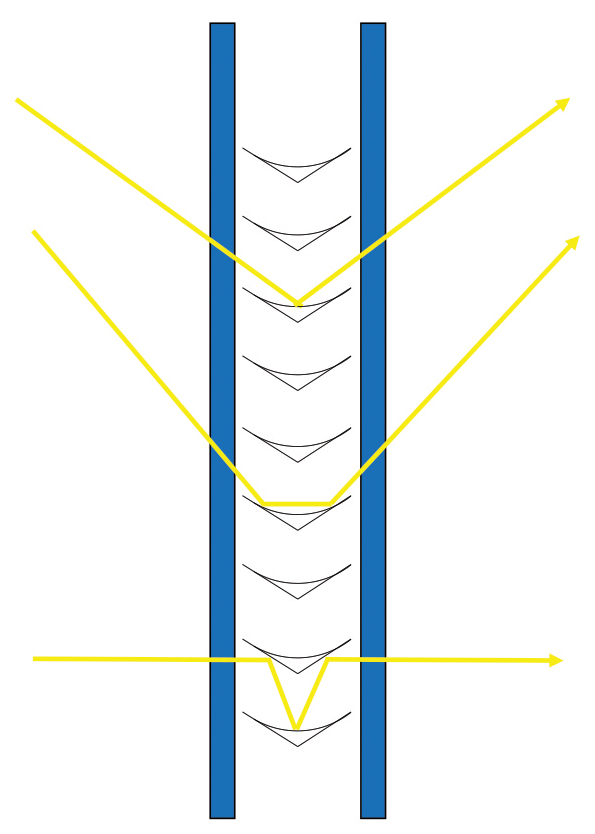
Fig. 7. The ‘Fish’ system.
Following light-directing louvers, ‘Okasolar’ and ‘Retrolux’ systems are proposed to deflect daylight in low sun angles in winter, and reject it in higher altitudes to give the ability of shading in summer. The main difference between these modified louvers, is their position in the composition. Okasolar is asymmetrical profile that positioned between the window panes that can be adjusted into different states (Fig. 8), while Retrolux is a fixed device and can be used in interior, exterior or within double-paned window (Fig. 9) [16].
Figure 8
![Light-directing louvers: Okasolar daylighting system [33].](figures/8-181-8.jpg)
Fig. 8. Light-directing louvers: Okasolar daylighting system [33].
Figure 9
![Light-directing louvers: Retrolux daylighting system [34].](figures/8-181-9.jpg)
Fig. 9. Light-directing louvers: Retrolux daylighting system [34].
In respect to discomfort glare, blinds can create linear bright patches along the slats resulting in glare in sunny skies [35]. Tiltable slats are more effective in controlling energy consumption or glare problems comparing with fixed ones, in which the latter system should be placed above eye level preferably to reduce the possible glare effects. Another drawback of the system, depending on the slat’s angles, louvers and blinds can significantly obstruct the visual connection to outdoors, therefore in most cases the system is completely or partially responsive to adjust the view field [16].
3.5. Anidolic systems
Anidolic systems are innovative light-guiding structures or advanced light shelves [14] by taking the edge-ray principle of non-imaging optics (Fig. 10) to achieve prominent strategies for daylight harvesting and re-distribution. It follows a principle that any ray transition through the input aperture with an incidence angle between specific domain, emerges from the output aperture within the same range [36].
Figure 10
![Schematic diagram of non-imaging optical system [37].](figures/8-181-10.jpg)
Fig. 10. Schematic diagram of non-imaging optical system [37].
Consequently, three anidolic systems were developed to deliver acceptable performance: (a) anidolic ceiling; (b) integrated anidolic system; and (c) anidolic solar blinds. The anidolic ceiling incorporates with an integrated duct into a ceiling to send the light flux to the interiors due to highly reflective surfaces especially in locations where cloudy sky is dominant [13] as shown in Fig. 11. As an experimental study by [37], daylight factor was improved significantly especially in rear part the test room up to 100%, thus glare reduction was possible through homogenizing indoor daylight levels [38]. Integrated anidolic system aims to respond to the daylighting requirements in building refurbishment where the building façade should remain unchanged. Figure 12 illustrates a cross-section of an integrated anidolic system combined with micro-louvers for solar protection which was carried-out by ray-tracing simulations, and showed a considerable enhancement in diffuse light redirection [39] in addition to possible glare risk reduction [40]. Anidolic solar blinds consist of a three-dimensional grid of hollow specular elements in small scale as an innovative difference with other anidolic systems [13], that enhances direct sunlight scattering. Figure 13 shows an outdoor view of the system mounted on a test room above eye level and a roller shade for lower part and it is concluded that a deep sunlight penetration and proper glare control is achievable by the system [37].
Figure 11
![(a) and (b) Anidolic ceiling mechanism [37].](figures/8-181-11.jpg)
Fig. 11. (a) and (b) Anidolic ceiling mechanism [37].
Figure 12
![Integrated anidolic system [39].](figures/8-181-12.jpg)
Fig. 12. Integrated anidolic system [39].
Figure 13
![Anidolic solar blind system [37].](figures/8-181-13.jpg)
Fig. 13. Anidolic solar blind system [37].
3.6. Directional shading system with holographic optical element (HOE)
The system reflects or redirects incident light through laminated holographic film within two glazing layers and transmits the diffuse light from other angles without altering visual connection [41], especially in buildings with high glazing ratio where overheating or glare are the main problems. HOE can be adjusted in two different sun-tracking configurations: (1) a transparent HOE to redirect incident sunlight onto the ceiling within small angular range; (2) a sunlight-concentrating HOE to redirect sunlight onto solid linear tabs for absorption and thermal energy or electricity conversion by photovoltaic panel [42] (Fig. 14), thus the visual field through panels can be reduced up to 50%.
Figure 14
![Applications of HOE [42].](figures/8-181-14.jpg)
Fig. 14. Applications of HOE [42].
3.7. Sun-directing glass
This technology is very effective in direct or diffuse daylight redirection, although the interior luminance intensity must be kept under control to avoid discomfort glare. The main element of the system is a series of curved acrylic strips with high refractive index (comparing with gas) which are placed within a double-paned window as a sealed unit [16] and play as optical light elements by total internal reflection to guide incoming daylight within 15° to 65° onto the ceiling especially at mid-latitudes in sunny skies. In practice, sun-directing system is translucent and reduces visible light penetration in which it should be applied above eye height to avoid glare without distorting view. Figure 15 confirms the possible combination of horizontal and vertical internal reflections of the system which leaded to a relatively glare-free uniform illumination onto the ceiling without any tracking parts except in overcast sky conditions, although according to [13] the possibility of discomfort glare still exists due to the bright illuminance of the system itself.
Figure 15
![Sun-directing glass [16].](figures/8-181-15.jpg)
Fig. 15. Sun-directing glass [16].
3.8. Limitation and advantages of daylighting systems
Consequently, daylighting systems can be classified in different terms due to many possible decisions during a design process. Windows need to be protected from sun rays and possible glare to provide a comfortable indoor environment, while daylight redirection can result in energy savings and is not absolutely necessary function. However, the visual connection to outside is not a daylighting system’s purpose but a fundamental function of the window itself, in which the impact of the system on user’s view to outdoors needs to be studied.
All of these systems require different actions and performance criteria related to their characteristics [27] such as daylight redirection to under-lit task area, daylight improvement for zone illumination, visual comfort enhancement through glare control or optimum solar protection and thermal control. All of these key roles may change their prioritization significantly not only in real design cases, but also due to time scales (e.g. minutes, hours) or change of interior function. As shown in Table 1, limitations and advantages of each daylighting system can give a clear perspective to building professions of available daylighting systems that is based on the capability of shading or light-guiding systems in sending diffuse light to indoors by preventing or scattering sunlight:
- Daylighting systems with shading based on two strategies:
- Redirecting diffuse light – blocking direct incident sunlight while transferring diffuse daylight;
- Using direct sunlight – scatter sunlight or redirect it onto the ceiling or higher than eye level.
- Daylighting systems without shading based on redirecting daylight to deeper grids far from a window which may not prevent direct sunlight, and are categorized into two systems:
- Diffuse light-guiding systems – redirecting natural light from brighter areas of sky vault around zenith especially under overcast sky condition for sites with dense surroundings;
- Direct light-guiding systems – allowing direct sunlight to indoors excluding glare and overheating.
Table 1
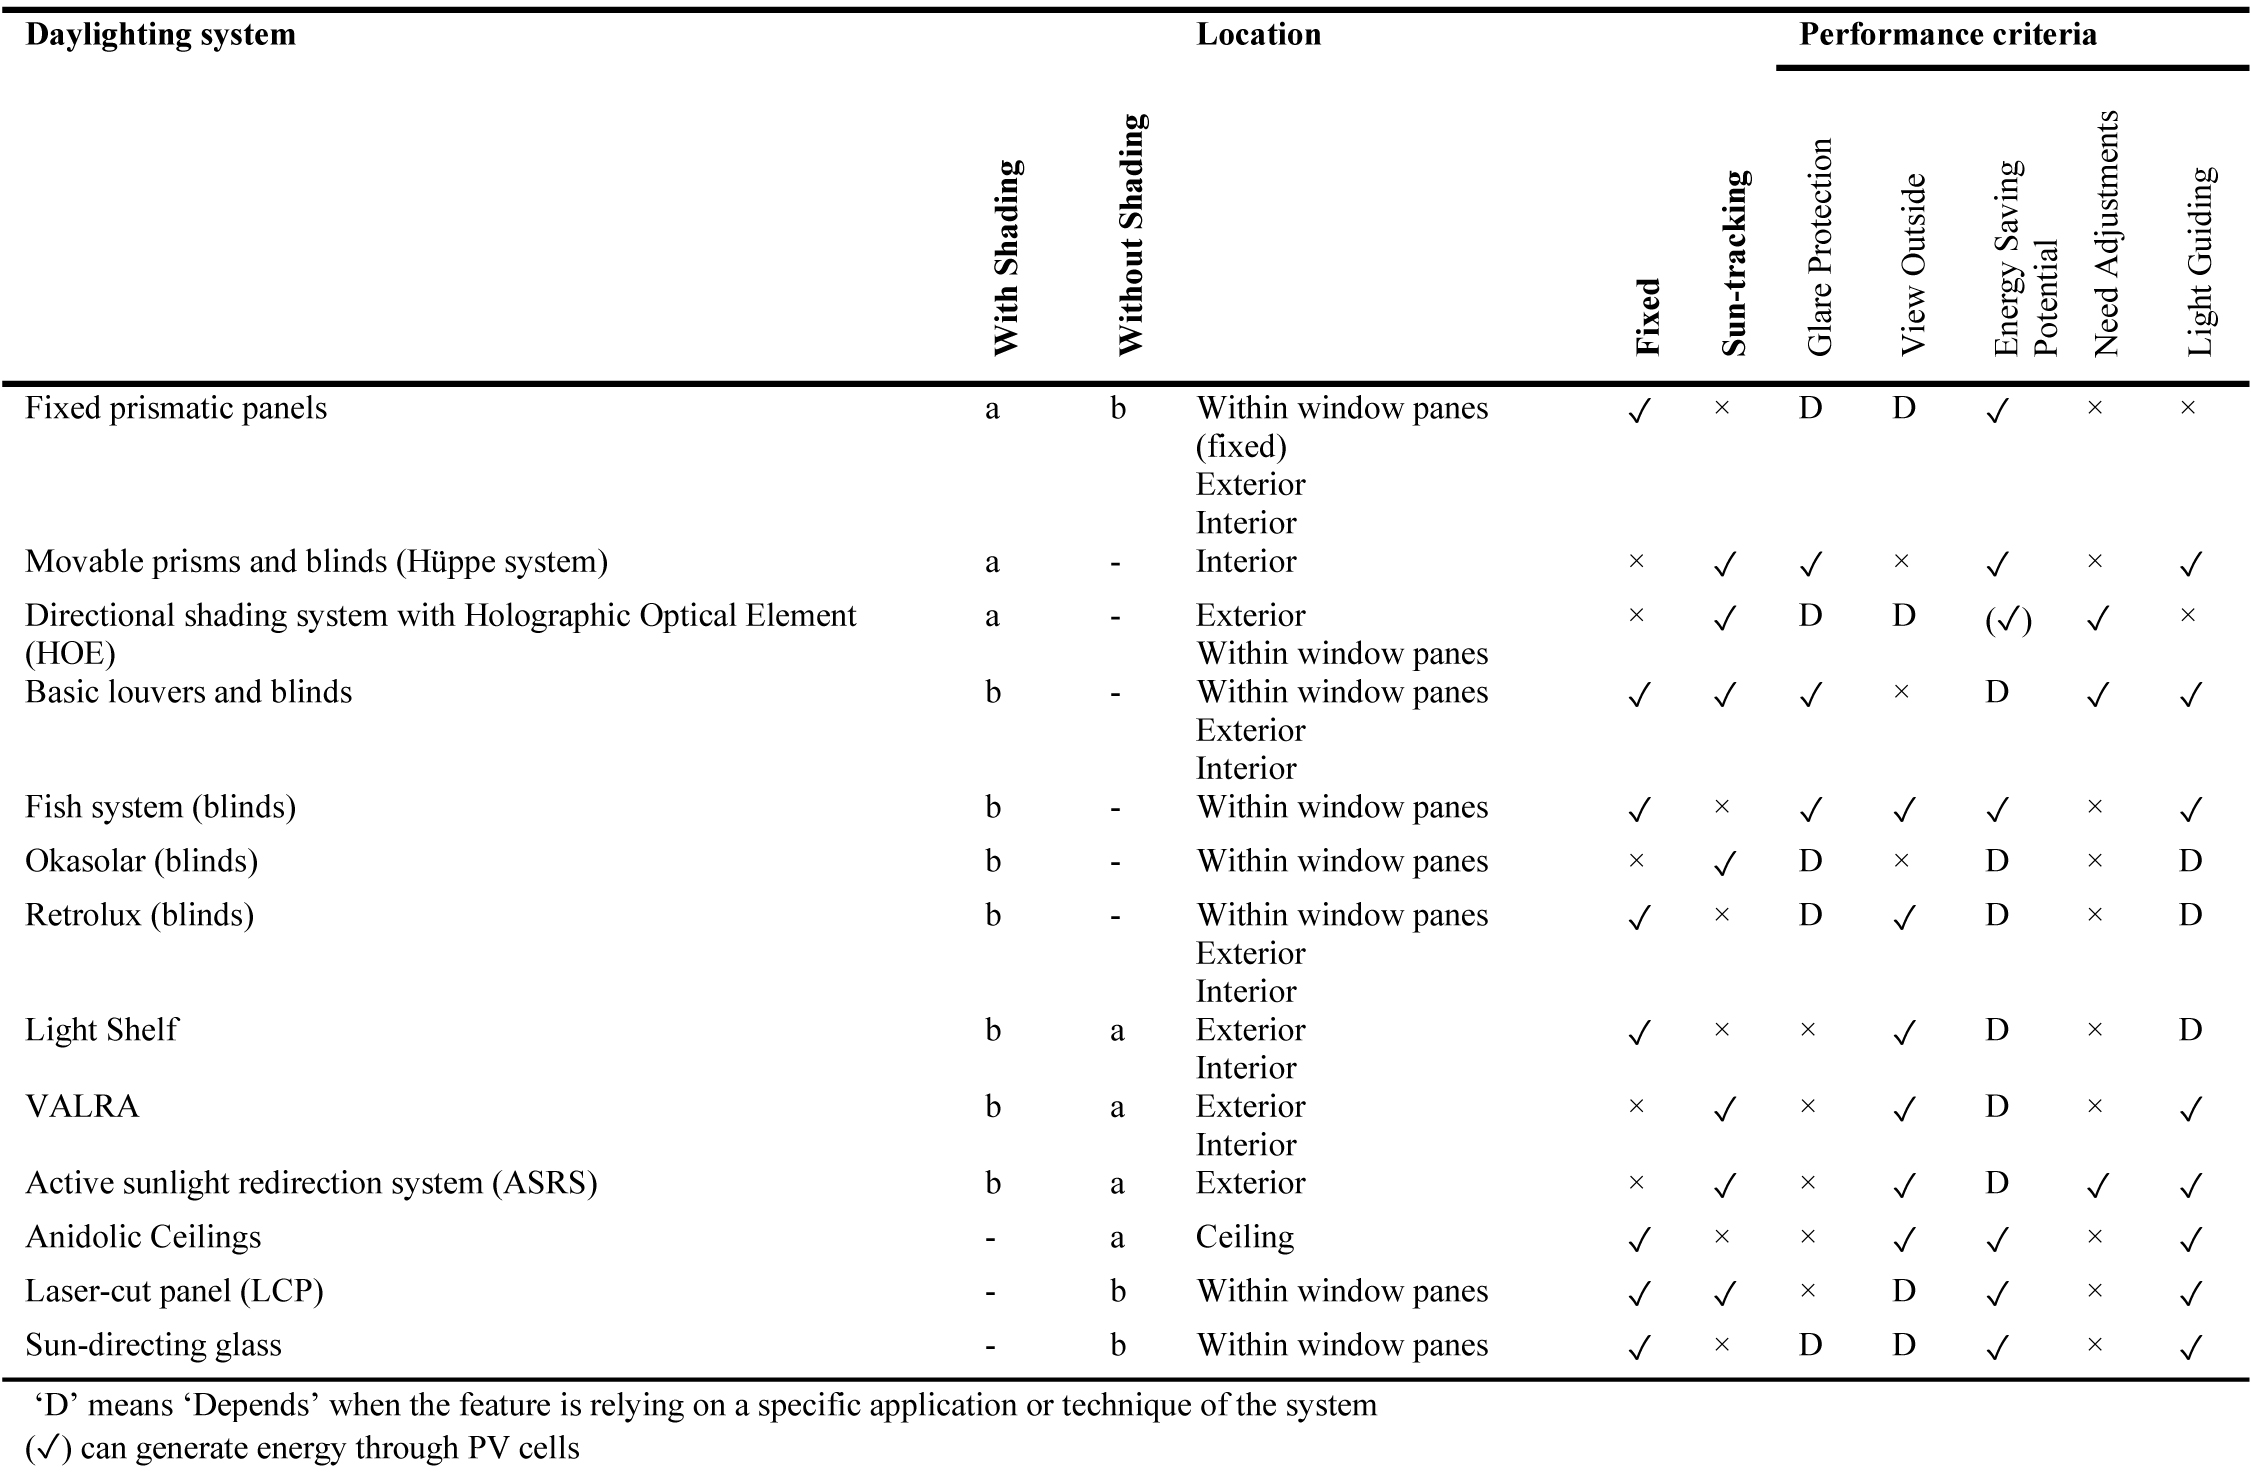
Table 1. Selection matrix of daylighting systems.
According to Table 1, the potential performance criteria of daylighting systems are followed by several subjective questions adopted from [13]:
- Glare protection – Is system protecting the visual field from direct sun and veiling reflections?
- View outside – Is system transparent enough to permit a clear view field with no obstructions?
- Energy saving potential – Does the system minimize the need for artificial lighting comparing with conventional system? Or alternatively, does the system allow to generate energy?
- Need adjustments – Does the system need any extra passive or active adjustments to track daily or seasonal changes of sun position constantly while keeping the same effectiveness?
- Light guiding into the depth of the room – Is system able to provide more daylight in deeper areas comparing with conventional fenestration systems?
As a result, the most critical part of the daylighting systems is their reaction to direct sunlight that is a challenging task for architects when offering highly glazed façade to use natural light and resulting in glare, excessive illuminance ratio and solar gain of interior areas. Using ceiling and specular materials with an optimized form such as light shelves or reflective louvers are potentially more effective than interior LCP in terms of redirecting diffuse light. However, in case of light shelves protecting user from discomfort glare might be a challenging task especially in winter season. Redirection capability of daylighting systems can diminish the problems and make benefits of direct sunlight while keeping visual comfort in acceptable range. However, the redirection capability is mostly available above eye level (e.g. prismatic panels) to reflect the light onto the ceiling and depth of the room, which still remains the view window unshaded and thus, discomfort glare becomes a negative experience of such systems. Moreover, architectural layout limitations might hinder the applications of systems like anidolic ceilings which can potentially decrease the floor height due to the light-duct. According to findings in Table 1, in all systems, discomfort glare can be expected for occupants in case of presence of sun in their view field especially in lower sun altitudes. This finding emphasizes the high effectiveness of adaptive daylighting systems such as venetian blinds could deliver a better multi-objective performance under various daylighting and sky conditions than fixed systems, although adaptations adds further complexity (e.g. finding an optimum control strategy for automation).
On other front, choosing the optimum daylighting system within a design process is not feasible only by knowing its characteristics since they are mainly designed based on guiding or redirecting light into the space, thus are not capable of maintaining view to outdoors and protect occupants from discomfort glare simultaneously. Therefore, visual comfort evaluation is a necessary step for designers to rate a working space against different aspects including daylight level, glare condition or view to outdoors that is the focus of the next section.
4. Visual comfort
Table 1 reveals that designing daylighting systems is not necessarily limited to energy efficiency and electricity consumption; visual comfort performance is equally important in form of glare protection, view to outdoors or indoor illuminance. However, visual comfort is a subjective perception in a visual environment that is affected by several but coexisting variables. It influences occupant’s well-being as defined by European standard [43] and similar to thermal comfort principles, these interrelated variables can be classified into Psychological, Physiological and Rational aspects, although the first two aspects are less measurable [44] and therefore, are not discussed in detail in this study.
Psychologically, visual comfort has major influences on productivity as well as circadian daily rhythm which is responsible to synchronize human’s internal clock to 24 hours as shown in Fig. 16. Circadian regulation is a function of daylight exposure and duration, its intensity and pattern to understand the night-time exposure and can be evaluated by physiological variables such as timing of skin exposure, or alertness [44]. On the other hand, lack of proper light quantity results in a psychological illness called Seasonal Affective Disorder (SAD) that is mostly related to climatic conditions and latitude [45]. In addition to lighting benefits through windows, interest in utilizing views for all users is emerged from a wide range of research studies in psychology and environment that supports the original concept of providing windows as significant element for improving individual well-being and performance [46,47]. A later research [6] confirmed the importance of visual connection for users in windowless work stations by creating surrogate windows as posters of natural scenes, in which it showed the view content has a further psychological impact on health, job satisfaction, user workability or stress relieving [47,48]. A view mitigates stress particularly if the work requires doing details at close distances. From physiological point of view, the human body reacts to light through two sensors: human eye and the skin. The human eye processes light signals in a wide range of magnitudes in a sunlit day [9] and can adapt itself to bright or dark environment by changing pupil’s size. While a turning point between visual and thermal comfort is their impact on human thermal sensation which depends on skin exposure in a given indoor environment, and both seemed to be pleasant when the light source was daylight [47].
Figure 16
![Human Circadian Cycle [49].](figures/8-181-16.jpg)
Fig. 16. Human Circadian Cycle [49].
As the main focus of this research, the rational aspect of visual comfort in a given work environment is a function of ideal brightness for users by permitting enough light quantity, glare-free perspectives, providing a uniform indoor illuminance and luminance and sufficient views to outdoor environment that influence occupants’ visual satisfaction [44,50]. On the other hand, poor visibility may cause visual discomfort and forcing the eye to adapt to brightness level quickly, while existing high brightness contrasts or distracting light within the field of view (FOV) can cause discomfort glare [51], or alternatively, non-uniform illuminated task area results in disability glare or unclear visual perception. Therefore, keeping a balance between daylight penetration, view to outdoor and glare probability is an essential target in achieving efficient daylighting and comfort that is highly affected by physical (e.g. luminance) and non-physical parameters (e.g. user’s perception of daylight) that are used as basis to quantify visual comfort. In particular, the evaluation of visual comfort has been investigated for decades through a wide range of metrics. This research updates the existing literature based on five quantitative criteria: (1) quantifying daylight magnitude, (2) daylight distribution, (3) direct sunlight penetration, (4) discomfort glare sensation and (5) view to outdoors.
4.1. Indices for evaluating daylight quantity
The majority of studies refer daylighting penetration into the space as illuminance which is a physical measured in lux at a given point P of a surface (Ep) following by Eq. 1 that that returns the ratio between incident luminous flux (φ) on a diminutive surface around P and the surface area (Arec). As can be derived from the equation, the main limitation is the difficulty of differentiating the source of incoming light onto the surface (natural or artificial).
Illuminance metric indicates the daylight level at certain point at each hour that does not necessarily interpret the daylight sufficiency of a space over a year. Therefore, Daylight Factor (DF) was widely used to evaluate the daylight adequacy and defined as “the ratio of the internal illuminance at a point (Ep,obs) in a building to the unshaded, external horizontal illuminance (Ep,unobs) under a CIE overcast sky” as the worst case scenario [52], although it neglects the climatic dynamic changes, sun position, building orientation or material reflectance which then reduces the calculation time significantly. Therefore, several studies questioned the accuracy of DF for daylight studies [53,54] due to its static behavior [55]. Recently, researchers developed a modified DF metric, or namely, DFaverage in which orientation factor is implemented in the calculation process.
Figure 17
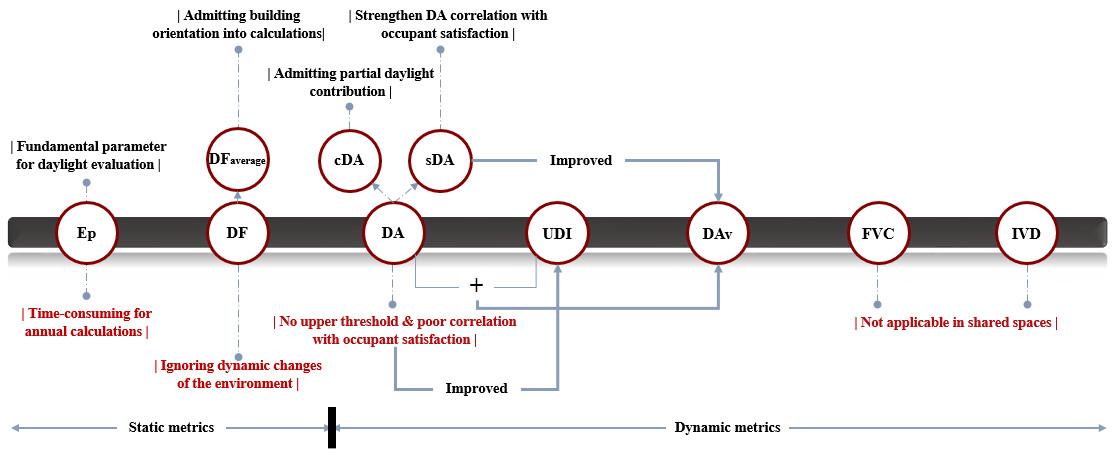
Fig. 17. Daylight quantity indices and their interrelations.
Furthermore, the ignorance of dynamic behavior of a climate motivated researchers to develop metrics that consider unique solar and weather conditions, or adaptive systems such as shading devices in a project. To this end, climate-based daylight modelling (CBDM) were introduced to provide information of daylight sufficiency and exceedance of a design (Fig. 17). As the first index of CBDM approach, Daylight Autonomy is defined by [56] as “the percentage of the occupied hours (ti) of the year when a minimum illuminance threshold (Elimit) is met by the sole daylight (Edaylight)” (Eq. 3). However, this metric is a one-tailed metric which cannot predict the excessive daylight that might cause overheating or discomfort glare, and studies reported its poor correlation with occupants’ satisfaction [57].
Based on DA definition, Continuous Daylight Autonomy (cDA) was proposed by [58] to implement partial changes related to time-steps when daylight horizontal illuminance is below the limit as shown in Eq. 4, and admits even a partial daylight contribution is still advantageous.
Following the existing limitations of DA and cDA, Illuminating Engineering Society [59] improved DA correlation with occupants’ satisfaction through an alternative modified version of DA called spatial Daylight Autonomy (sDA) and is defined as “the annual percentage of occupied hours (y) where at least 50% of the floor area (Pi) reached to a certain illuminance threshold (x)” (Eq. 5). This equation results in a single or zonal value, although reporting a single value might not be an applicable daylighting metric in shared working spaces.
In order to define an upper threshold with a similar definition of DA (Fig. 17), Useful Daylight Illuminance (UDI) is defined as the time fraction (ti) of analysis points over a year when the indoor horizontal illuminance falls into a specific range [11]. The proposed range converts UDI into a two-tailed metric that contains lower and upper thresholds and an acceptable range as UDIunderlit, UDIoverlit and UDIuseful respectively (Eq. 6). Thus, values above upper threshold gives the frequency of excessive illuminance levels that might lead to visual discomfort as glare and thermal stress. Although in the literature different thresholds have been proposed [60-62]. Researchers also concluded a strong correlation between two CBDM metrics (UDI and sDA) and occupant’s visual satisfaction that supports the CBDM adaptation in simulations [53].
In addition to UDI, Reinhart and Wienold [63] combined DA and UDI into a single value as Daylight Availability (DAv) to overcome the absence of upper thresholds of DA and its modified versions (Fig. 17). The metric divides the day-lit space into four zones: ‘fully daylit’ and ‘partially daylit’, which refers to sDA300,50%, DA150,50% respectively, ‘overlit’ area when upper threshold (e.g. 2500 lux) reaches more than 5% of the occupied hours by analysis points, and the remaining area as ‘non-daylit’. Therefore, despite the consideration of different ranges, it can be useful in shared spaces unlike sDA. Further in a simulation-based research [64], DAv metric could deliver a feasible proxy that showed a strong linear relation with total energy consumption.
Similar to UDI concept, Frequency of Visual Comfort (FVC) is the time fraction (ti) in percent over a given period that illuminance (Edaylight) values are within a specific range to ensure visual comfort regarding daylight only as shown in Eq. 7 [65]. This means visual comfort is guaranteed when illuminance is not below EUnder or above EOver, while the main difference with UDI is the measuring approach of illuminance level, in which UDI counts on spatial rendering in each analysis point, while FVC proposed an average daylight illuminance that hinders its applicability in shares zones.
The average daylight illuminance was not only the focus of FVC (Fig. 17), but also Sicurella et al. [65] introduced Intensity of Visual Discomfort (IVD) as “the time integral of the difference between the spatial average of the current daylight illuminance and the upper limit of visual comfort (Eover = 750 lux) as IVDover or the lower limit of visual comfort (Eunder = 150 lux) as IVDunder”. As a result, IVD can assess both natural light penetration and visual discomfort simultaneously, while it is difficult to obtain zero IVD during a long period.
4.2. Daylight distribution indices
Light distribution ratio is as important as light amount to provide visual comfort mostly in office buildings [66], not only because it reduces glare possibility but also it relates to the frequency of occupants switching on lights. According to [67], it is confirmed that a uniform daylit space even with less light quantity appears more acceptable than an unbalanced light distribution with higher illuminance. However, in the literature there is only one available metric related to daylight distribution as Illuminance Uniformity (UO) which is the ratio between minimum (Eminimum) and the average (Eaverage) illuminance intensity over a given task plane (Eq. 9). In addition, different uniformity ratios have been suggested by 0.8 [68] or 0.4 to 0.7 depending on the visual activity [43] that outlines the inconsistency of recommended thresholds and more importantly, there is no correlation between the proposed calculation and occupancy-related factors.
Table 2
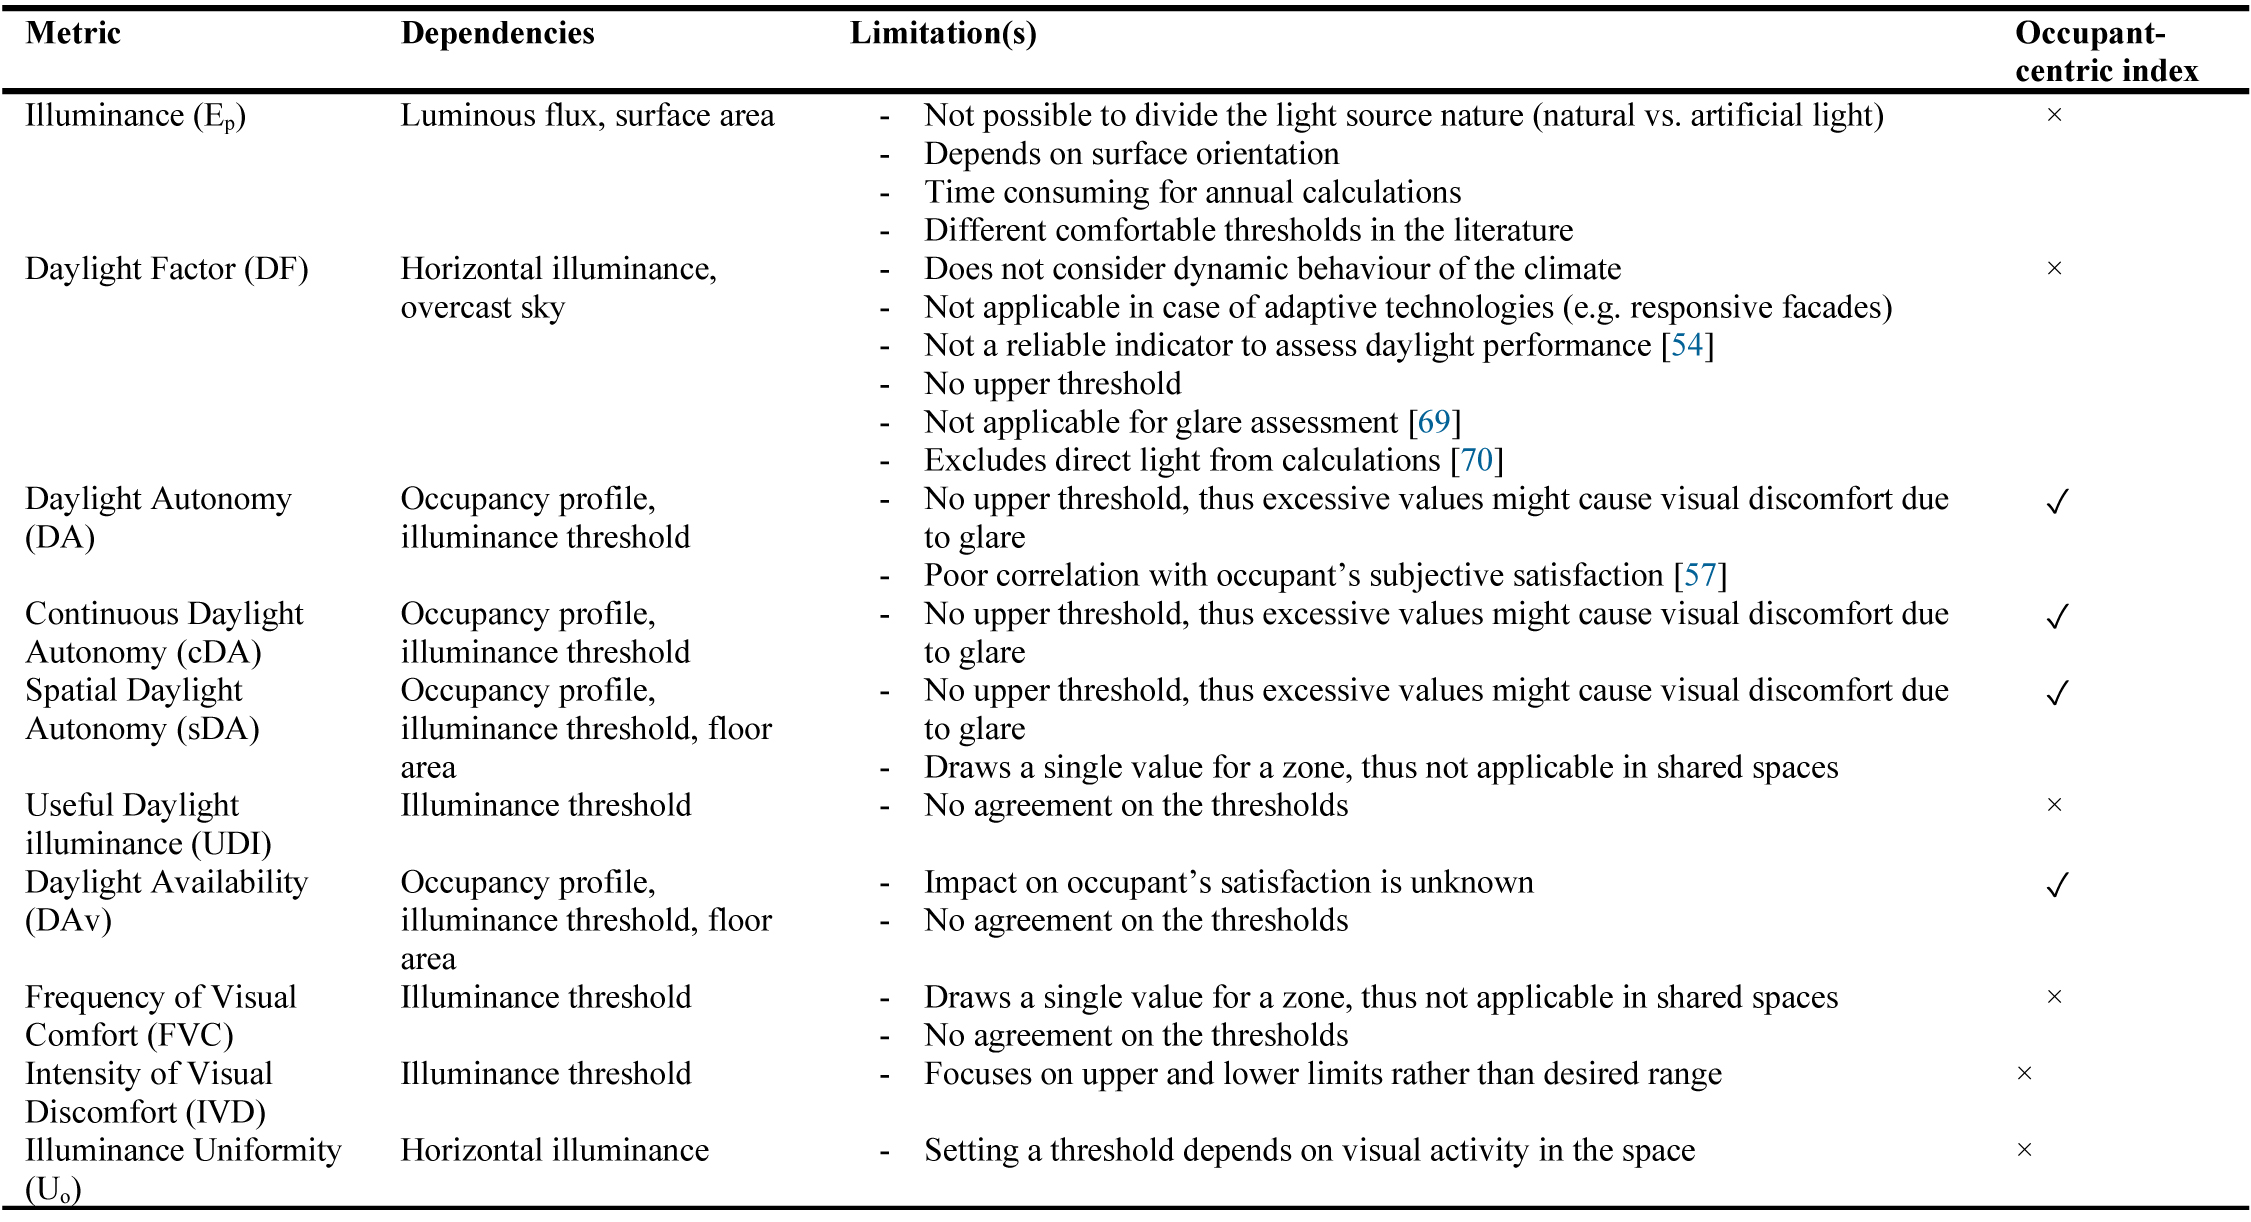
Table 2. Visual comfort metrics to assess natural light quantity and distribution.
As a result, Table 2 outlines an overall view of individual visual comfort metrics regarding daylight quantity and distribution including their potential advantages and limitations, and their mathematical correlation with occupants-related factors. Findings reveal that UDI and DAv metrics are more accurate to quantify the daylight penetration in a given space due to their range and area divisions that make them feasible to apply especially in shared spaces. However, more investigations are required to assess DAv against occupants’ satisfaction.
4.3. Indices for direct sunlight
In response to the sDA definition and the existing limitation regarding DA due to absence of upper threshold, the IES committee [59] proposed a complementary metric to evaluate visual discomfort potential in a day-lit environment (not as a glare metric, but as a proxy for visual and thermal discomfort). Annual Sun Exposure is an illuminance-based and dynamic metric that gives the ability to assess direct sunlight penetration specifically. It is defined as the space fraction of illuminated analysis points by direct daylight in percentage exceed at least 250 hours of occupation over a year above 1000lux (in short, ASE1000,250h). According LEED v4, a maximum 10% ASE is assumed an acceptable threshold, while keeping sDA above 50% as a standardized calculation for simulation-based modeling approach to examine daylight performance. But currently, due to several significant uncertainties such as the real representation of sun, and the impact of analysis grid resolution on results, ASE is not powerful enough to be considered as a daylight metric for evaluation [53,71].
Recently, a new metric as ‘Sunlight duration’ introduced by [72] to describe a day-lit environment and defined as the daily time fraction which incident sunlight penetrates into a space through fenestrations in hours or unit-less parameters. Sunlight duration depends on surrounding obstructions in an urban context that can block direct sun radiation. Eq. 10 evaluates sunlight duration (s) in sequence of sun azimuths based on sun altitude (γs) and height of obstructions (γ), in which for a given reference point on the window pane if γs < γ, the reference point is shaded by buildings and if γs > γ, the reference point is shaded from the zenith (e.g. overhangs). Beside mathematical calculations, there are several ways to calculate sunlight duration such as sun path diagram, using diagrams (Waldram), or taking a photo from the reference point through fisheye lens (Fig. 18).
Figure 18
![Using fisheye camera to capture sunlight duration by overlaying stereographic sun path diagram [73].](figures/8-181-18.jpg)
Fig. 18. Using fisheye camera to capture sunlight duration by overlaying stereographic sun path diagram [73].
Sunlight duration gives an indication of a time-dependent exposure to sun, but without quantifying the intensity. To this end, to answer “how much sunlight can enter a room?” another metric is introduced by [74] which is the cross-sectional area of passing sunlight incident beam through a window (Eq. 11). Thus, it depends on day-lit portion of the window, sunlight incident duration and its cosine angle, that is highly scalable and can be expressed on an annual basis as Annual Sunlight Beam Index (Stot) (Fig. 19).
Figure 19
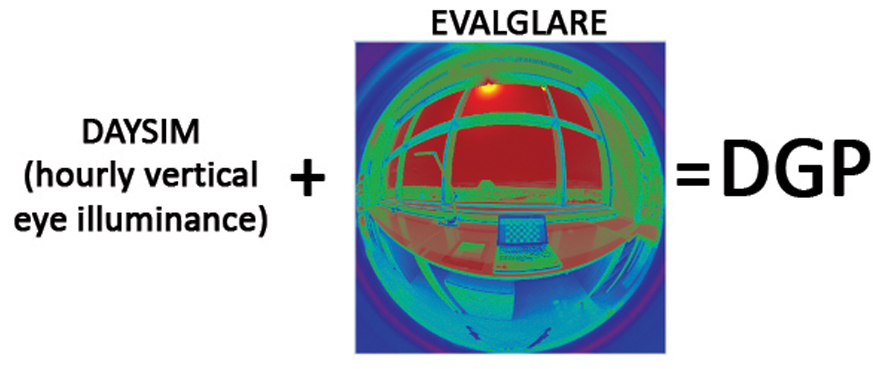
Fig. 19. Enhanced simplified calculation method of DGP.
Table 3
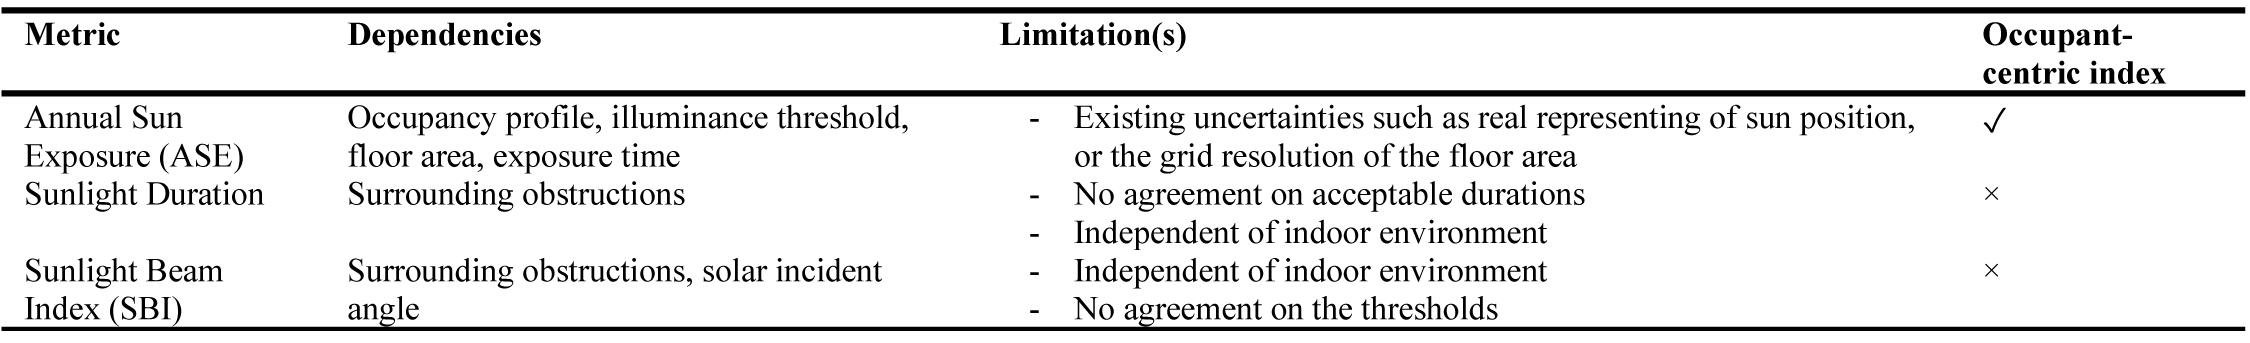
Table 3. Visual comfort metrics to assess sunlight penetration.
Substantially, Stot is the total SBI of all glazed apertures over a year when the sun height γs is above zero (Table 3).
4.4. Glare indices
Psychological and physiological human well-being are the main reasons of improving indoor environment and in regards to rational aspect of visual comfort, glare metrics play a significant role as they involve occupant’s conditions and subjective responses locally. It is still a challenge to identify an independent standardized metric for glare assessment since each index assesses visual perception individually, and the understanding of discomfort glare is insufficiently discovered [11]. Glare is a complex issue related to light sources and different approaches have been conducted to assess or predict potential visual disabilities, and as stated by [75], they can be categorized in three main groups: (i) lighting factors; (ii) context factors; and (iii) observer factors. The direct method of glare perception includes in measuring the luminance of an existing light source seen by an observer’s eye (luminance-based), while other approaches are based on equations that rely on subjective opinions and limited degree of discomfort glare [76]. In principle, Eq. 13 combines general factors that are influential in discomfort glare calculation [77]:
Based on the equation itself several results can be observed [78]: (i) the brighter the source, the more glare risk; (ii) the brighter background luminance, the lower glare risk; and (iii) the further the light source from FOV, the lower glare risk. The background luminance defines the adaptation level of the eye to the luminous environment (mainly in the case of small glare sources) since in all subjective measurements, subjects have time to adapt themselves to ambient conditions [79]. The second physical quantity for adaptation level is Vertical Eye Illuminance (Ev) mainly for large glare sources.
As the main effective factor on glare, luminance is a photometric measure that quantifies the luminous intensity of a “reference point in a given angle (γ) per unit of visible area around the given point” in nit or cd/m2 [11] (Eq. 14). According to [80], acceptable maximum luminance value of the source is still the most challenging issue. There are different upper limit values and categories proposed by [81] by 2000, 4000, and 6000 cd/m2 as ‘acceptable’, ‘just uncomfortable’ and ‘intolerable’ thresholds, or Shin [82] recommended upper thresholds up to 3200, 5600 and 10000 cd/m2.
Apart from measuring absolute luminance intensity, the contrast ratio among luminance values within FOV of an observer should remain in reasonable range to prevent glare on a task plane. To take the advantage of this metric, Osterhaus [83] identified three zones: (i) central zone – the visual task; (ii) adjacent zone – up to 60° cone around visual task; and (iii) non-adjacent zone – up to 120° cone around visual task, and proposed luminance ratios as 1:3:10 respectively. Other recommendations have been proposed by the IES [84] as 1:20 between central zone and adjacent zone. Because of the nature of light and depending on the visual task layout, the luminance ratios differ, for example, when people are exposed to excessive daylight near to windows, they prefer to tolerate rather than closing blinds [85]. Therefore, determining potential glare problems only based on luminance ratios with no certain agreement on the thresholds is still required more investigation [80].
To take the surrounding’s reflectance into glare quantification, British Glare Index (BGI) is derived from empirical studies of glare equation and introduced by [86] which is an efficient metric artificial small sources are causing glare (Eq. 15). Therefore, it is not applicable when the source is natural light from non-uniform sources like windows. Basically, BGI includes three ranges (Table 4): 10 as ‘imperceptible glare’, 28 as ‘just intolerable’ and 30 as ‘intolerable glare’ [76,87].
Table 4
![Nine-point scale of glare sensation based on [11,104].](figures/8-181-24.jpg)
Table 4. Nine-point scale of glare sensation based on [11,104].
Similar to BGI, Visual Comfort Probability (VCP) emerged from experimental case studies by [88] including typically-sized uniform sources, and does not perform accurately under large non-uniform sources such as daylight and very small or large light sources like halogens [89] and might overestimate glare [90]. The main contribution of this metric is the admittance of a dimensionless index that evaluates the population of observers in a given artificially-lighted environment in percentage who feel comfortable in a scale of 0 to 100 according to (Eq. 16). Table 4 suggests acceptable thresholds found in the literature.
where DGR=Discomfort Glare Rating.
To minimize the mathematical inconsistency imposed by BGI equation, Einhorn [91] proposed a new metric CIE Glare Index (CGI) based on empirical tests with uniform glare sources that included adaptation capability by computing direct and diffuse illuminances as (Ed) and (Ei) respectively (Eq. 17), on a cross-sectional plane passing observer’s eyes. However, Iwata et al. [92] examined CGI accuracy under large artificial source (screen) and concluded CGI is overestimating glare, but according to [93], could be an appropriate index for worst possible scenario to overestimate glare. In other experimental research, similar results have been achieved for a roller blind scene [90]. Similar to other metrics, there are different interpreted thresholds for CGI as recommended in Table 4.
A combination of BGI, VCP and CGI proposed by CIE [94] in form of Unified Glare Rating (UGR) system where the adaptation parameter implemented in the CGI equation (Ed+Ei) is replaced by background luminance (Lb) in Eq. 20. According to Table 4, UGR ranges from 10 ‘imperceptible’ to 34 ‘intolerable’ that 19 is recommended as a boundary between discomfort and comfort glare. Similar to other glare metrics, UGR developed under experimental studies including very small uniform sources with a limited solid angle between 3×10⁻⁴ and 10-1 sr, that is only suitable for artificial lighting rather than non-uniform large glare sources like curtain walls, although several studies used it for day-lit spaces without direct sun like DGI [90,95]. In addition, when the observer’s sight line is positioned below glare sources, UGR cannot predict glare accurately. Further modifications applied to the metric for larger light sources greater than 1.5 m2 by CIE called Great-room Glare Rating (GGR), while for smaller light sources below 3×10⁻⁴ sr, UGRsmall can be used for surfaces lower than 0.005m2 [96]. However, UGR, GGR and UGRsmall are developed for different evaluation purposes, but they have been used for the same level of discomfort glare.
Moreover, a modified version of UGR as Unified Glare Probability (UGP) developed by Hirning [97] and Lim [54] for six open-plan office buildings in a tropical climate, Malaysia, based on the initial methodology using a combination of luminance-based maps and post-occupancy evaluation (POE) conducted in Brisbane, Australia [98]. The studies concluded the overall accuracy of the original formulation of UGP in all types of discomfort glare predictions was 69% (better than DGI, CGI, VCP and DGP) with two distinguished thresholds (UGP > 0.5 as discomfort and UGP ≤ 0.5 as comfort) [98]. Thus, a further modification of UGP applied on the linear transformation of UGR to keep the output probabilities within 0 to 1 in Eq. 21, as the optimum equation to assess glare from windows for both climates. Moreover, in respect to luminance ratio, the contrast between background and window identified as the most influential factor on glare discomfort [97].
However, there are several limitations in terms of UGP application [97]:
- The metric is developed only for tropical and subtropical climates, and more investigation is required to test its validation across other climates,
- UGP is not applicable in conditions with a low possibility of window glare and fits the most in open-plan spaces with access to windows in absence of direct sun within FOV.
The aforementioned glare metrics are only applicable when the glare source is artificial lighting. To overcome this limitation, Daylight Glare Index (DGI) as the first index for glare evaluation under non-uniform large sources (windows with considerable luminance level (Lwin)) proposed by [77] through an equation with a modification by [99] (Eq. 18). As can be seen from the equation, DGI is a CGI-based index for electric lighting with a modified solid angle including each source from the observer point of view (ω), and proposed from experimental testing with placing diffusive fabric in front of artificial sources [100,101]. This metric associates with several thresholds as suggested by several authors in Table 5, while negative values are possible technically [102].
Table 5
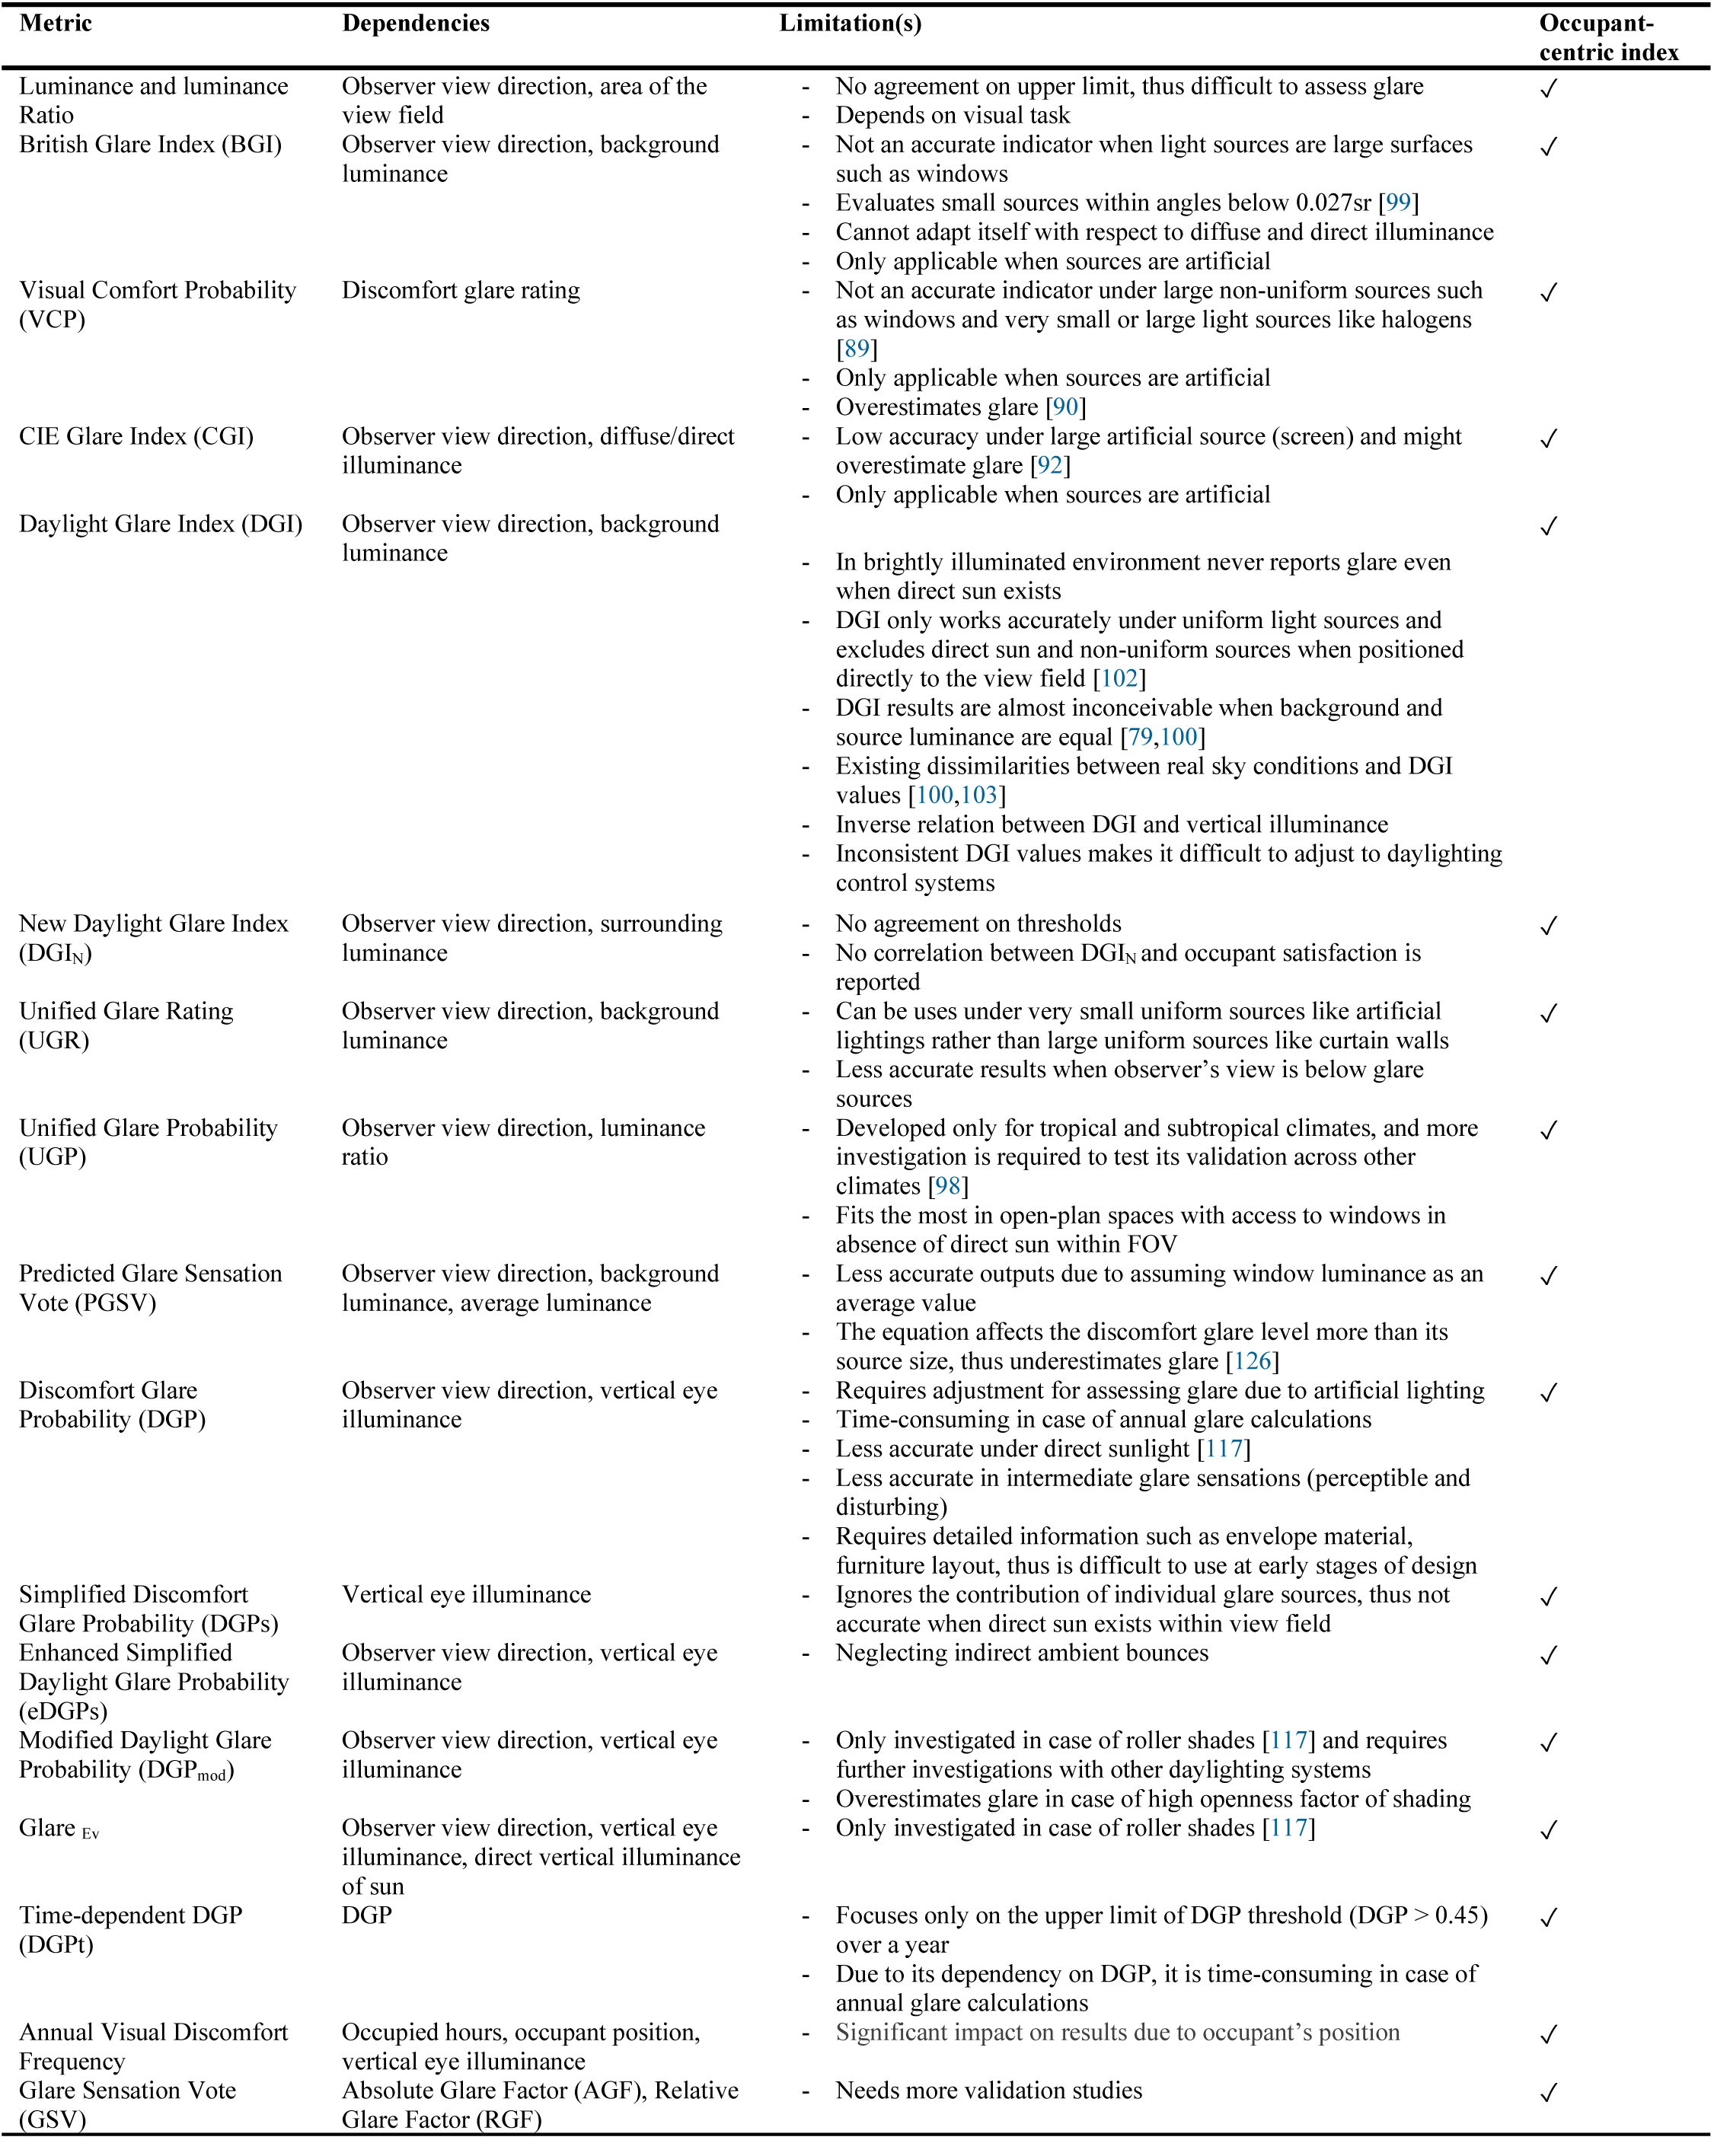
Table 5. Visual comfort metrics to assess glare.
Based on simulation and experimental-based studies [90,102], when dominant background luminance factor increases, DGI drops, in which the study revealed DGI in brightly illuminated environment never reports glare even when direct sun exists and no apparent correlation found between subjective glare evaluation and DGI. Second, DGI only works accurately under uniform light sources and excludes direct sun and non-uniform sources when positioned directly to the view field [102]. Third, DGI results are almost inconceivable when background and source luminance are equal [79,100]. And lastly, few dissimilarities were observed between real sky conditions and DGI values that questioned the accuracy of DGI [100,103].
To modify the inaccuracy of background luminance factor in DGI, Nazzal [105] proposed a new metric called New Daylight Glare Index (DGIN) which replaced background luminance Lb with a stronger component that take into account surrounding luminance Ladaptation (Eq. 19) which showed a strong correlation with vertical illuminance and glare values in bright conditions.
Covering the inconsistency of DGI was not only the aim of DGIN, but also another metric as Predicted Glare Sensation Vote (PGSV) was introduced based on 120 various test conditions over 200 subjects including non-uniform luminance sources (windows) specifically for daylight [106]. The proposed equation of PGSV is adapted by connecting the background luminance (Lb) to the average luminance and configuration factor of the source as (Lwp) and (ΦW) respectively (Eq. 25) in four absolute values varying from 0 as imperceptible glare sensation to 3 as intolerable sensation threshold.
Following the contribution of daylight in glare evaluation, Discomfort Glare Probability (DGP) proposed by [107] and validated by [81] with an equation as follows (Eq. 22). Although, the main difference with DGI is adding a new factor called Vertical Eye Illuminance (Ev) to construct a better relation with glare sensation [108,109] and improve the level of illuminance received by observer’s responses [110]. The DGP equation is based on statistical analysis in full-scaled office mock-ups in Copenhagen and Freiburg with over 70 participants, and the formula is valid between 0.2 and 0.8, [11] and Ev above 380lux, although in [102] reported DGP values up to 1. Wienold and Christoffersen suggested the following glare comfort criteria for DGP (Table 5): DGP < 0.35 is meant to represent ‘imperceptible’ glare, 0.35 < DGP < 0.40 is perceived as ‘perceptible’, 0.40 < DGP < 0.45 is meant to represent ‘disturbing’, lastly DGP > 0.45 is considered as ‘intolerable’ [81].
According to [80,90], DGP is the most accurate metric especially in absolute glare conditions (‘imperceptible’ and ‘intolerable’), but unlike UGR, is a poor indicative index in intermediate levels of discomfort glare (‘perceptible’ and ‘disturbing’). Moreover, McNeil and Burrell [102] revealed a strong correlation between DGP and horizontal illuminance unlike DGI in a brightly day-lit space in line with a simulation-based analysis and questioned if any DGP threshold is applicable globally. While individual point-in-time simulation of glare is worthful for static assessments, but might not be an optimum solution for time-varying visual comfort evaluation including the impact of interior conditions such as dynamic shading. Recent efforts have reveled the possibility of DGP application throughout the year with reliable results under dynamic conditions [111]. Nonetheless, DGP has some limitations:
- DGP is a time consuming metric for computation in comparison to other available metrics [112,113], in which two further simplified modifications aimed at reducing the simulation time (DGPs and eDGPs),
- For a comprehensive study, several observer’s key FOVs need to be assessed in a space through available software such as RADIANCE [114] and Evalglare [107],
- DGP predictions are less accurate under direct sunlight [115,116], which then a new modified version (DGPmod) was developed to overcome this issue [117].
- Evaluation of DGP metric in early design stages is very difficult to be adjusted due to the well-defined requests such as materials, furniture or observer’s FOV.
- Based on the computational results [118], the contrast term needs more analysis, especially in low illuminated task area.
A simplified version of DGP (DGPs) proposed by [119] to reduce the computation time by neglecting the contrast term (solid angle and luminance of the source within FOV) of DGP equation as follows (Eq. 23):
The simplification was justified according to the importance of linear function of Ev which was stronger than other factors [81]. DGPs ignores the contribution of individual glare sources, thus using this metric in presence of any direct sun or specular reflections within observer’s scene is not recommended and could potentially mislead inaccurate glare risks [120]. However, in situations with shadings such as roller shades or venetian blinds that block the direct sunlight, DGPs declared more reliable results than DGP [108,109,117].
Recently, researchers introduced a new dynamic metric [120] called ‘Annual Visual Discomfort Frequency’ and defined it as the percentage of occupied hours that must meet two criteria: (i) the direct vertical eye illuminance of sun disk (Ev,beam) should be lower than 1000lux; (ii) the total vertical eye illuminance (Ev,total) should be below 2670lux. Obviously, both conditions emerged from illuminance-based metrics, ASE and DGPs respectively. Also, in terms of DGPs thresholds, a recent study suggested three ranges corresponding to Ev [121], although higher thresholds were also reported by [122].
Similar to DGPs, in order to shorten the simulation time, the enhanced simplified Discomfort Glare Probability (eDGPs) was introduced and validated over two years by [109] (Eq. 24):
Conceptually, DGP is based on two terms as shown in Eq. 22: (1) term 1 that depends on the vertical eye illuminance, and term 2 that compute the glare source properties with regard to observer’s view point. Therefore, as an illustration of eDGPs calculation method (Fig. 19), term 1 can be conducted quickly by DAYSIM [56], while the second term is an image-based calculation depending on local quantities of the main glare source through Evalglare software. This approach leads to a more accurate result than DGPs, since it takes into account the peak glare sources without calculating the exact luminance distribution of the space, and minimizes the computation time due to neglecting indirect ambient bounces [107].
The common main limitation among proposed glare metrics is their inaccurate predictions when sun is visible within user’s view field. A particular experimental research with 41 participants [117] improved the numerical coefficients of the original form of DGP equation through a new metric called “modified DGP” DGPmod while using 14 window roller shades composed of different visual transmissivity and openness factor (Eq. 26). However, this specific environmental conditions limits its applicability in other setups and require further investigations with other daylighting systems. Additionally, when the experiments subjected to high openness factor of shadings, the results overestimated glare risk compared to real conditions.
The second part of the research introduced an illuminance-based metric based on DGPs for discomfort glare evaluation in presence of sun within FOV, called GlareEv. Thus, a combination of two factors that one collects the impact of the sun only, as direct vertical illuminance (Ev,dir(sun)), and another captures the whole brightness sensation, as total vertical illuminance (Ev) (Eq. 27), can result in an adequate concept for cases including the sun within FOV, since authors assumed other minor specular reflections are negligible compared to sun. GlareEv allows faster annual calculation due to elimination of image-based luminance processing of DGPs; however, it is only investigated for the studied case study in [117] and requires more investigations in other setups.
Furthermore, European daylighting standard [123] derived Time-dependent DGP (DGPt) to control the upper limit of illuminance in DGP equation, in which authors identified the critical glare situation that exceeds 5% with a DGP equal to 0.45 over a year (Eq. 28).
Following the given upper threshold in DGPt, a recent study [53] conducted 842 subjective surveys in four classrooms of two LEED silver certified buildings over a year, and used DGPs and Ev domains within a new space-discretized metric called sDGPexceed as “the percent of space where the vertical eye illuminance at the height of 1.2m, is more than 4276 lux in more than 5% of the occupation time” (Eq. 29), where N is number of analysis points. The study presented stronger correlation between sDGPexceed and individual’s level of discomfort glare than horizontal illuminance-based metric (ASE) by 84.2% and 71.1% respectively.
From another point of view, existing glare metrics evaluate the glare magnitude with certain limitations in predictions especially when the task area is exposed to direct sunlight [80,120] rather than identifying the actual cause. This gap motivated researchers [80,124] to introduce Glare Sensation Vote (GSV). Studies argued that in any discomfort glare experience two glare factors coexist: Absolute Glare Factor (AGF) and Relative Glare Factor (RGF), but the main objective is identifying the dominant factor to resolve especially when sun is present in view field of users. To this end, a subjective-based research conducted experiments over 26 office spaces in Argentina with presence of direct sunlight and the only glare source; window, between a limited time period where sun penetration was dominant [116]. As a result of experiment, Glare Sensation Vote (GSV) scale as recommended by [125] includes AGF and RGF as coefficients (Eq. 30). The equation simplified the glare evaluation when the observer experiences direct sunlight within the center and adjacent zones of FOV. Also, it revealed the most dominant factor is the absolute glare factor (Ls_%2000C) which underlined the importance of glare source position in FOV; the closer the glare source, the more negative impact on glare sensation [116].
Figure 20
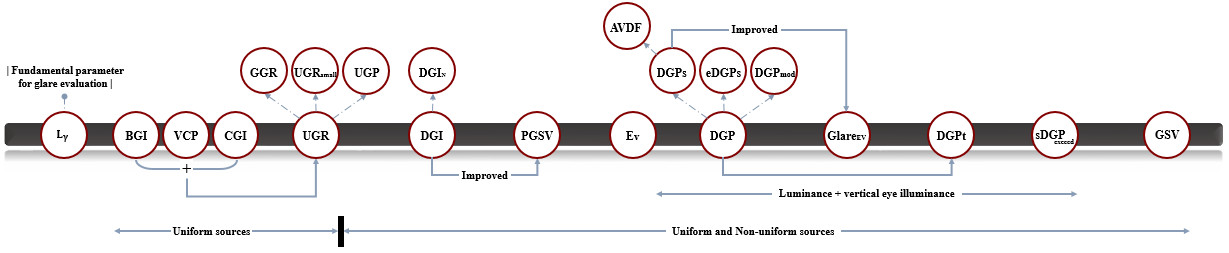
Fig. 20. Glare indices and their interrelations.
In summary, Table 5 highlights the high dependency of the entire glare indices to occupants within calculations mainly through their positions and view directions in the space, although there is only one metric (Annual Visual Discomfort Frequency) that integrates occupied hours and position together. The research progress in the literature as shown in Fig. 20 reveals many indices are developed to cover the main limitations of previously developed metrics such as CGI to refine the adaptation feature of BGI, or DGPs and eDGPs to enable faster calculations instead of DGP. The most common limitation among glare indices is their inaccuracy when sun is present within occupant’s view field; however, two metrics attempted to fulfil this gap (Glare Ev and GSV), but their applications in other setups is still not clear as they are developed within specific circumstances. Therefore, more studies are needed to validate their effectiveness.
4.5. View out
View means a visual connection to outdoors through an opening in the building that provides information about surrounding landscape, orientation and weather changes. From psychological point of view, both daylight and view out are responsible for balancing the circadian rhythm that has impacts on user’s visual perception. Having an outdoor view changed conventional practices of architectural planning especially in office buildings where designers aimed at locating open-plan offices along the outer edge of the floor area and resulted in more longitudinal building forms to answer visual demands. On the other side, quantified metrics have been introduced by building rating organizations like LEED (Leadership in Energy Efficient Design) protocol [127] or WELL building standard [128] that resulted in applying full-glazed facades to maintain view for deep floor plans while it requires considerable technical strategies to control visual and thermal comfort within the perimeter zones. Therefore, to evaluate view several factors affect its performance [48,110,129,130]:
- Fenestration and daylighting systems
According to standards on daylighting like ‘DIN 5034, Part 1’ or ‘EN-17037’, window size specifications require a minimum 55% of the room width (approximately equals to 30% window-to-wall ratio (WWR)) is required. Furthermore, the latest version of LEED v4 [127], adapted the proposed evaluation metric by [131], the ‘view factor’ ranging from 1 to 5 (Table 6). The metric can be evaluated based on a view-point’s grid that takes into account lateral and vertical view angles. Alternatively, the earlier version of European Standard [132] defined visual contact as the capacity of the daylighting system to permit view out when it is fully deployed based on two parameters: (a) normal/normal transmittance (τv,n-n), and (b) diffuse transmittance (τv,n-dif). This standard represents a condition that a person and an object should be distinguishable within 1m and 5m away from the external daylighting system, in which high values of τv,n-n are desired for better shape recognition (Table 7).
- View access
Another effective factor in visual connection assessment is the portion of the outdoor content that can be seen by the occupant through window. According to the report [130], providing suitable view access to occupants especially in a shared environment is a challenging task that can be calculated through view angle to the window, distance from the window, alternative design features (e.g. courtyards) or spatial assessment of a floor (e.g. certification systems). With As required by [133] or LEED v4, all the task equipment must not be located more than 10m from a window in a workstation, while in BREAM rating system [134] the maximum allowable distance depends on the window-to-wall ratio.
- Multiple views
Providing multiple lines of sight can be evaluated through the total number of distinct view windows and the total available view angles over a horizontal FOV for a given location. In LEED v4, the compliance is agreed on having multiple view sights in different directions of at least 90 degrees difference (e.g. south and east windows) is highly recommended especially for open-plan office buildings [127].
- View content
The view content can significantly affect the view quality and human psychological well-being by including natural elements such as trees, sky, people presence, movement objects (e.g. water), or a distant view [135]. The European Standard [136] assessed view content based on four-scale criteria (insufficient, minimum, medium, and high) based on the content that can be seen by occupants.
- Visual transparency and clarity
It is common that windows with exterior or interior solar screen and shadings that are responsible for controlling glare and thermal load obstruct the view quality through their openness factor properties. Besides, a clear view to outdoors is considered as a necessary design considerati on by [133] or similarly LEED v4. With respect to the essential needs to shading devices utilization, providing a clear visual connection to outdoors affect the shading type and its properties significantly. The view can be distorted easily by daylighting systems such as prismatic panels, LCP or roller shades [110]. To this end, a study by [137] developed a View Clarity Index (VCI) based on roller shade and its openness factor (OF) and visible transmittance (Tv) (Eq. 31). However, the evaluation of view clarity is still not clear and requires more studies under different design scenarios and daylighting systems.
Table 6
![View assessment based on European standard [127].](figures/8-181-26.jpg)
Table 6. View assessment based on European standard [127].
Table 7
![View assessment based on European standard [132].](figures/8-181-27.jpg)
Table 7. View assessment based on European standard [132].
The evaluation criteria mentioned above helped researchers to introduce a new generic metric called View Quality Index (VQI) [130] which is a combination of view content, view access and view clarity as formulated in Eq. 32 and is applicable for single windows. Each variable assumed to be equally important, while allowing different weighting factors depending on the design features, but there is no recommendation which parameter is more important and requires more investigations.
5. Discussion on the findings
Facades have significant role to control energy consumption in buildings especially through windows that are more prone to waste energy. Therefore, different daylighting systems are developed to block or redirect the light to control energy waste and indoor environment. Studies highlight that adaptation is the key term to choose the proper daylighting system and is a good indicator to evaluate the accuracy of visual comfort quantitative metrics. Among daylighting systems, venetian blinds and light shelves have more capability to address visual comfort demands along enhancing energy efficiency due to their physical adaptation comparing to fixed systems [55,138]; however, maintaining sufficient view to outdoors while minimizing the risk of discomfort glare found to be the main limitation of all systems. Moreover, different studies developed many visual comfort indices in presence of adaptive systems like venetian blinds or roller shades that could be adjusted by users. As far as glare and its quantifiable metrics are the major concern, several gaps and points within literature are outlined as follows:
- A general agreement exists on the glare agents, but there are many evolved dependent metrics and none of them could evaluate glare comprehensively. Each glare metric has its own disability and limited to a specific indoor environmental conditions. This is because the position and the size of the glare source is not static during time intervals.
- None of the indices consider psychological aspects of visual comfort completely into their subjective evaluations, although in a recent study [66], authors proposed a new visual comfort index (VQI) based on two glare metrics (sDGP and UGR) to cover qualitative aspects of visual comfort, but is applicable only in residential spaces without considering specific shading devices.
- There is a significant challenge in terms of their reliability when direct sun is present within FOV.
- Most of the metrics were proposed based on empirical studies in office-like mock ups in a specific climate, thus they need more validation case studies to be generalized in other climates and building types.
- As supported by [139], different shading systems such as roller shades and venetian blinds were tested to identify glare using DGI and DGP, in which results could not show any relation to observations. Therefore, the different characteristics of daylighting systems as one of the main design techniques to control daylight and visual discomfort are not fully considered during glare evaluation and on the other side, there is no dynamic glare metrics that can reflect the dynamic behaviour of a shading system.
- To date, there are very few studies investigated the relationship between thermal comfort and discomfort glare [140] that revealed subjects have different tolerance due to discomfort glare when they are exposed to thermal discomfort.
- Regarding metrics limitations, besides psychological and physiological aspects, there are many observed factors that have different impacts on discomfort glare, in which mostly this is the reason of high discrepancy between numerical and subjective evaluations. Also, their interaction and intensity is still not precisely understood. Personal factors such as gender [141] had no influence on discomfort glare, while other factors like culture [121], time of the day [142], fatigue or contrast ratio [97] still need substantial exploration. Besides, several studied factors such as the age [98], view direction and position [143] or view to outdoors [135] were inconclusive due to their impact on glare perception, therefore more effort is needed to clarify the individual’s relation with glare perception.
- As suggested by [79], due to present issues with existing metrics, an appropriate method to rate subjective discomfort glare perception is a “percentage of people who would be disturbed” rather than a sole mathematical evaluation.
As a result of existing indicators discussed in section 4, the main evaluation metrics of visual comfort are investigated based on a logical structure, and their features and limitations are summarized in Tables 5-7. In overall, 38 visual indices recollected from literature that are mostly related to day-lit environments and were categorized in two main bases: illuminance-based and luminance-based metrics. The greatest shortcoming among them is that all of the indices were developed in offices, or working task planes which limit their predictions in residential. From occupant perspective, all luminance-based indices take occupant into their calculation through occupant’s view direction and position, occupancy profile, and area of user’s field of view, while limited number of illuminance-based metrics consider occupants as part of the equation like illuminance. This finding shows the evolution trend of proposing occupant-centric mathematical equations to cover the existing real challenges that occupants face in a built environment; however, their applications are either limited to specific circumstances or require more validation.
Illuminance maps or DF would be very useful for static analysis, but, if annual simulation is the main interest, computation time would increase drastically. Thus, in order to employ the concept, this massive data needs to be transformed into some intuitive metrics or namely, CBDM, in which they all should be based on two common features: first, concentrating on a specific time scale of investigation, and second, a threshold to identify ‘adequate’ daylight level. CBDM provides a complete year-round evaluation, and in particular, indices that are performed as a single value over a year such as Spatial Daylight Autonomy (sDA) has an acceptable performance overall. Among CBDM metrics, DAv and Useful Daylight Illuminance (UDI) can be recommended for long-term daylight evaluation specifically since they define upper and lower thresholds to avoid potential visual discomfort due to glare and overheating problems.
Among luminance-based metrics, Daylight Glare Probability (DGP) has been widely used within recent field studies and researchers aimed at optimizing its coefficients or combining multiple metrics in one equation with different interior and exterior building conditions. However it is inaccurate when dim lighting or direct sun is available within FOV [144]. In addition to DGP, Unified Glare Probability (UGP) development based on UGR, showed a remarkable correlation within subjective assessment, although it has been only tested in open-office plans in tropical climates.
In terms of long-term glare evaluation, DGP has the ability to be adjusted to annual evaluations including its modified versions DGPs, eDGPs or DGPmod, in case of using shading systems, and sDGPexceed, which seems to be a suitable replacement of ASE as it deals with vertical eye illuminance (Ev) rather than horizontal illuminance which showed a determinative role in glare evaluation. Alternatively, in case of presence of direct sunlight in a day-lit environment, none of the metrics can accurately assess glare except GSV model that introduced a new method to evaluate glare sensation in real conditions, but requires more validation investigations.
Therefore, when sun is visible within FOV more than one glare metric would be necessary to evaluate. Furthermore, in terms of filtering certain hours that may have a greater potential of experiencing visual discomfort over a year, Annual Sunlight Beam Index (Stot) is an appropriate limiting factor to extract problematic hours due to incident beam penetration through selected fenestrations by considering the existing building obstructions.
Few studies investigated the influence of both daylight and outdoor view on visual performance [145,146]. For example, in a survey-based research [147] authors concluded that students prefer ‘views’ as the second priority before daylight availability in choosing seats. Other research conducted by [148,149] revealed people have a tendency to tolerate glare from windows if they have sufficient outdoor views especially when the source is a natural scene. Consequently, outlining the existing parameters to evaluate view to outdoor and preserving a proper interrelation between a pleasant view connection to outside, visual and thermal comfort, requires an integrated approach towards adaptive technologies and operational control strategies based on indoor demands, but also highlights the present limitations of quantifying view [110,150]: Firstly, dynamic view-based indices are missing, and secondly, it is still unclear how to prioritize the view parameters based on occupant’s satisfaction explicitly.
5. Conclusion
This study reviewed the state-of-art through two research areas: (1) highlighting the typical daylighting systems for windows along with their technical aspects and their potentials and limitations to control user’s visual comfort and energy efficiency, and (2) quantifying visual comfort through a series of proposed metrics available in the literature. Regarding the former scope, one common limitation among typical daylighting systems is their inability of controlling view to outdoors and glare simultaneously. To this end, adaptive daylighting systems such as blinds or sun-tracking light shelves are likely performing more efficient due to dynamic climatic changes and user visual comfort criteria. This is mainly the reason of the high interest of recent studies focusing on proposing different adaptive facades typologies [10]. Alternatively, to quantify visual comfort through daylight level and distribution, direct sunlight, and glare, 38 metrics are collected from literature with their specific mathematical formulation. Recent developments show higher contribution to glare evaluation through fulfilling the existing shortcomings of previously-developed metrics. The main common feature among glare indices is their dependency on occupant, although there are two main limitations: (1) some of the metrics are developed in presence of daylighting systems that could be manually changed by the user during experiments, thus applying these metric in other setups might not end with similar results, (2) most of the luminance-based metrics are not accurate enough when sun is present within FOV of the user, except two metrics DGPmod and GSV that are limited to certain climate and setups. Within illuminance-based metrics, CBDMs revealed more reliable results to calculate the magnitude of indoor illuminance over a year considering; however, in most cases there is no agreement on their acceptable thresholds which caused using inconsistent assumptions by researchers in their studies. Similarly, existing standards and metrics to quantify view to outdoors and its quality are still insufficient to represent user experiences in real built environment.
However, the following limitations can be addressed in future investigations: (1) the comparison of daylighting systems are limited to their own functionality and technical characteristics towards improving either visual comfort or energy efficiency; however, future researches can analyse the potential of daylighting systems through simulations and compare their performance against each other which found to be absent in the literature, (2) the second part of the paper focuses on updating the state-of-art of the literature to quantify visual comfort, although there are psychological or physiological parameters that potentially affect the proposed numerical-based metrics’ performance which are often ignored or assumed fixed within experiments.
Contributions
A. Tabadkani: Conceptualization, Methodology, and Writing – Original Draft; A. Roetzel: Supervision, Writing – Review and Editing; H. Xian Li: Writing – Review and Editing; A. Tsangrassoulis: Writing – Review and Editing.
Declaration of competing interest
None of the authors have any direct or indirect conflict of interests to this research study.
References
- R.J. Wurtman, The effects of light on the human body, Sci Am 233 (1975) 69-77.
- M. De Carli, V. De Giuli, R. Zecchin, Review on visual comfort in office buildings and influence of daylight in productivity.in: Indoor Air, (2008).
- M. Rashid, C. Zimring, A Review of the Empirical Literature on the Relationships Between Indoor Environment and Stress in Health Care and Office Settings: Problems and Prospects of Sharing Evidence, Environment and Behavior 40 (2008) 151-190. https://doi.org/10.1177/0013916507311550
- M. Bodart, A. De Herde, Global energy savings in offices buildings by the use of daylighting, Energy and Buildings 34 (2002) 421-429. https://doi.org/10.1016/s0378-7788(01)00117-7
- A.R. Webb, Considerations for lighting in the built environment: Non-visual effects of light, Energy and Buildings 38 (2006) 721-727. https://doi.org/10.1016/j.enbuild.2006.03.004
- J.H. Heerwagen, G.H. Orians, Adaptations to Windowlessness: A Study of the Use of Visual Decor in Windowed and Windowless Offices, Environment and Behavior 18 (1986) 623-639. https://doi.org/10.1177/0013916586185003
- S.R. Kellert, E.O. Wilson, The biophilia hypothesis, Island Press, (1995)1559631473.
- P. Boyce, Why daylight?in: International conference on daylighting technologies for energy efficiency in buildings, (1998).
- C. Reinhart, Daylighting Handbook I first ed., Building Technology Press, (2014) 978-0692203637.
- A. Tabadkani, A. Roetzel, H.X. Li, A. Tsangrassoulis, Design approaches and typologies of adaptive facades: A review, Automation in Construction 121 (2021) 103450. https://doi.org/10.1016/j.autcon.2020.103450
- S. Carlucci, F. Causone, F. De Rosa, L. Pagliano, A review of indices for assessing visual comfort with a view to their use in optimization processes to support building integrated design, Renewable and Sustainable Energy Reviews 47 (2015) 1016-1033. https://doi.org/10.1016/j.rser.2015.03.062
- M.J. Grant, A. Booth, A typology of reviews: an analysis of 14 review types and associated methodologies, Health Information & Libraries Journal 26 (2009) 91-108. https://doi.org/10.1111/j.1471-1842.2009.00848.x
- N. Ruck, S. Selkowitz, Q. Aschehoug, J. Christoffersen, R. Jakobiak, K. Johnsen, E. Lee, Daylight in Buildings: A Source Book on Daylighting Systems and Components, LBNL Report ed., Lawrence Berkeley National Laboratory, (2000).
- N. Baker, K. Steemers, Daylight design of buildings, James & James, (2002).
- A. Eltaweel, M.A. Mandour, Q. Lv, Y. Su, Daylight Distribution Improvement Using Automated Prismatic Louvre, Journal of Daylighting 7 (2020) 84-92. https://doi.org/10.15627/jd.2020.7
- H. Arnesen, T. Kolås, B. Matusiak, A guide to dayligthting and solar shading systems at high latitude, SINTEF Academic Press, (2011).
- I. Edmonds, Performance of laser cut light deflecting panels in daylighting applications, Solar Energy Materials and Solar Cells 29 (1993) 1-26. https://doi.org/10.1016/0927-0248(93)90088-k
- M.B. Hirning, V.R. Garcia-Hansen, J.M. Bell, Theoretical comparison of innovative window daylighting devices for a subtropical climate using radiance.in: Proceedings of the 6th International Conference on Energy Efficiency in Commercial Buildings, Luxembourg, 2010, 279-285.
- P.J. Greenup, Development of Novel Technologies for Improved Natural Illumination of High Rise Office Buildings, Queensland University of Technolgy, (2002).
- S. Claros, A. Soler, Indoor daylight climate-comparison between light shelves and overhang performances in Madrid for hours with unit sunshine fraction and realistic values of model reflectance, Solar Energy 71 (2001) 233-239. https://doi.org/10.1016/s0038-092x(01)00046-9
- C.E. Ochoa, I.G. Capeluto, Evaluating visual comfort and performance of three natural lighting systems for deep office buildings in highly luminous climates, Building and Environment 41 (2006) 1128-1135. https://doi.org/10.1016/j.buildenv.2005.05.001
- L.O. Beltran, E.S. Lee, S.E. Selkowitz, Advanced Optical Daylighting Systems: Light Shelves and Light Pipes, Journal of the Illuminating Engineering Society 26 (1997) 91-106. https://doi.org/10.1080/00994480.1997.10748194
- A. Kontadakis, A. Tsangrassoulis, L. Doulos, F. Topalis, A Review of Light Shelf Designs for Daylit Environments, Sustainability (2018) 71. https://doi.org/10.3390/su10010071
- T.C. Howard, W. Place, B. Andersson, P. Coutiers, Variable area light reflecting assemblies (VALRA).in: In Proceedings of the 2nd International Daylighting Conference, CA, USA, 1986, 222–234.
- I.M. Franco, Efficacy of light shelves: Passive, dynamic and automatic devices related to light and thermal behavior.in: Thermal Performance of Exterior Envelopes of Whole Buildings, Clearwater Beach, FL, USA, 2007.
- M. Kostantoglou, A. Tsangrassoulis, Performance evaluation of an automatically controlled light-shelf.in: In Proceedings of the 5th Balkan Light Conference, Belgrad, Serbia, 2012.
- A. Kontadakis, A. Tsangrassoulis, L. Doulos, F. Topalis, An active sunlight redirection system for daylight enhancement beyond the perimeter zone, Building and Environment 113 (2017) 267-279. https://doi.org/10.1016/j.buildenv.2016.09.029
- S. Zhang, D. Birru, An open-loop venetian blind control to avoid direct sunlight and enhance daylight utilization, Solar Energy 86 (2012) 860-866. https://doi.org/10.1016/j.solener.2011.12.015
- G.Y. Yun, D.Y. Park, K.S. Kim, Appropriate activation threshold of the external blind for visual comfort and lighting energy saving in different climate conditions, Building and Environment 113 (2017) 247-266. https://doi.org/10.1016/j.buildenv.2016.11.021
- M.H. Oh, K.H. Lee, J.H. Yoon, Automated control strategies of inside slat-type blind considering visual comfort and building energy performance, Energy and Buildings 55 (2012) 728-737. https://doi.org/10.1016/j.enbuild.2012.09.019
- A. Tabadkani, A. Tsangrassoulis, A. Roetzel, H.X. Li, Innovative control approaches to assess energy implications of adaptive facades based on simulation using EnergyPlus, Solar Energy 206 (2020) 256-268. https://doi.org/10.1016/j.solener.2020.05.087
- S. Chaiyapinunt, N. Khamporn, Shortwave thermal performance for a glass window with a curved venetian blind, Solar Energy 91 (2013) 174-185. https://doi.org/10.1016/j.solener.2013.02.007
- OKALUX. 2020. Available: https://www.okalux.com/products/product-finder/products/ [Accessed 20.11.2020.
- K. Lichtplanung. 2021. Available: http://www.koester-lichtplanung.de/pages_gb/news_01.html [Accessed 30.01.2021.
- A.A. Freewan, L. Shao, S. Riffat, Interactions between louvers and ceiling geometry for maximum daylighting performance, Renewable Energy 34 (2009) 223-232. https://doi.org/10.1016/j.renene.2008.03.019
- W.T. Welford, R. Winston, High Collection Nonimaging Optics, Academic Pr, (1989) 9780127428857. https://doi.org/10.1016/b978-0-12-742885-7.50003-6
- J.-L. Scartezzini, G. Courret, Anidolic daylighting systems, Solar Energy 73 (2002) 123-135. https://doi.org/10.1016/s0038-092x(02)00040-3
- S.K. Wittkopf, Daylight performance of anidolic ceiling under different sky conditions, Solar Energy 81 (2007) 151-161. https://doi.org/10.1016/j.solener.2006.04.002
- F.M. Rubinstein, A New Technique for Computer Simulation of Illuminated Spaces AU - Ward, Gregory J, Journal of the Illuminating Engineering Society 17 (1988) 80-91. https://doi.org/10.1080/00994480.1988.10748710
- G. Courret, Anidolic Daylighting Systems, Department of Architecture, EPFL, (1999). https://doi.org/10.1016/j.energy.2018.12.069
- M.V. Collados, D. Chemisana, J. Atencia, Holographic solar energy systems: The role of optical elements, Renewable and Sustainable Energy Reviews 59 (2016) 130-140. https://doi.org/10.1016/j.rser.2015.12.260
- D. Zhang, J.M. Castro, R.K. Kostuk, One-axis tracking holographic planar concentrator systems, Journal of Photonics for Energy 1 (2011) 015505. https://doi.org/10.1117/1.3590943
- BS-EN12665, Light and Lighting-Basic terms and criteria for specifying lighting requirements, British-Adopted European Standard, 2018. https://doi.org/10.3403/02651658u
- L. Edwards, P. Torcellini, Literature review of the effects of natural light on building occupants, (2002). https://doi.org/10.2172/15000841
- C. Sapia, Daylighting in buildings: Developments of sunlight addressing by optical fiber, Solar Energy 89 (2013) 113-121. https://doi.org/10.1016/j.solener.2012.12.003
- B.L. Collins, Windows and people : a literature survey : psychological reaction to environments with and without windows, Washington : U.S. Dept. of Commerce, National Bureau of Standards, 1975.
- J.A. Veitch, A.D. Galasiu, The Physiological and Psychological Effects of Windows, Daylight, and View at Home: Review and Research Agenda, Research Report (National Research Council Canada. Institute for Research in Construction); no. IRC-RR-325, 2012. https://doi.org/10.1037/e554552013-001
- K.M.J. Farley, J.A. Veitch, A Room with a View: A Review of the Effects of Windows on Work and Well-Being, National Research Council of Canada (NRCC) technical report IRC-RR-136, 2001.
- M. Andersen, J. Mardaljevic, S.W. Lockley, A framework for predicting the non-visual effects of daylight – Part I: photobiology- based model, Lighting Research & Technology 44 (2012) 37-53. https://doi.org/10.1177/1477153511435961
- IESNA, IES lighting handbook, 8th ed., New York : Illuminating Engineering Society of North America, 1993, 9780879951023.
- J.Y. Suk, M. Schiler, K. Kensek, Discomfort glare metrics: Investigating their accuracy and consistency in daylight glare evaluation by using human subject study data.in: Facade Tectonics World Congress, Los Angeles, USA, (2016). https://doi.org/10.1016/j.buildenv.2016.09.018
- P. Moon, D.E. Spencer, Illumination from a non-uniform sky, Illum. Eng. 37 (1942) 707–726.
- Z.S. Zomorodian, M. Tahsildoost, Assessing the effectiveness of dynamic metrics in predicting daylight availability and visual comfort in classrooms, Renewable Energy 134 (2019) 669-680. https://doi.org/10.1016/j.renene.2018.11.072
- G. Lim, M.B. Hirning, N. Keumala, N. Ghafar, Daylight performance and users’ visual appraisal for green building offices in Malaysia, Energy and Buildings 141 (2017) 175-185. https://doi.org/10.1016/j.enbuild.2017.02.028
- A. Tabadkani, A. Roetzel, H.X. Li, A. Tsangrassoulis, A review of automatic control strategies based on simulations for adaptive facades, Building and Environment (2020) 106801. https://doi.org/10.1016/j.buildenv.2020.106801
- C.F. Reinhart, O. Walkenhorst, Validation of dynamic RADIANCE-based daylight simulations for a test office with external blinds, Energy and Buildings 33 (2001) 683-697. https://doi.org/10.1016/s0378-7788(01)00058-5
- J.A. Jakubiec, G. Quek, T. Srisamranrungruang, Towards Subjectivity in Annual Climate-Based Daylight Metrics.in: Proceedings of BSO 2018: 4th Building Simulation and Optimization Conference, Cambridge, UK, 2018.
- Z. Rogers, D. Goldman, Daylighting Metric Development Using Daylight Autonomy Calculations In the Sensor Placement Optimization Tool - Development Report and Case Studies, 2006.
- L. Heschong, V.D. Wymelenberg, Keven, M. Andersen, N. Digert, L. Fernandes, A. Keller, J. Loveland, H. McKay, R. Mistrick, B. Mosher, C. Reinhart, Z. Rogers, M. Tanteri, Approved Method: IES Spatial Daylight Autonomy (sDA) and Annual Sunlight Exposure (ASE), IES - Illuminating Engineering Society, 2012.
- J. Mardaljevic, Examples of Climate-Based Daylight Modelling.in: CIBSE National Conference: Engineering the Future, Oval Cricket Ground, London, UK, 2006.
- A. Nabil, J. Mardaljevic, Useful Daylight Illuminance: A New Paradigm to Access Daylight in Buildings, Lighting Research & Technology 37 (2005) 41-59. https://doi.org/10.1191/1365782805li128oa
- S. Olbina, Y. Beliveau, Developing a transparent shading device as a daylighting system, Building Research & Information 37 (2009) 148-163. https://doi.org/10.1080/09613210902723738
- C.F. Reinhart, J. Wienold, The daylighting dashboard – A simulation-based design analysis for daylit spaces, Building and Environment 46 (2011) 386-396. https://doi.org/10.1016/j.buildenv.2010.08.001
- D.A. Chi, D. Moreno, J. Navarro, Correlating daylight availability metric with lighting, heating and cooling energy consumptions, Building and Environment 132 (2018) 170-180. https://doi.org/10.1016/j.buildenv.2018.01.048
- F. Sicurella, G. Evola, E. Wurtz, A statistical approach for the evaluation of thermal and visual comfort in free-running buildings, Energy and Buildings 47 (2012) 402-410. https://doi.org/10.1016/j.enbuild.2011.12.013
- S. Zanon, N. Callegaro, R. Albatici, A Novel Approach for the Definition of an Integrated Visual Quality Index for Residential Buildings, Applied Sciences 9 (2019). https://doi.org/10.3390/app9081579
- D.R.G. Hunt, Predicting artificial lighting use - a method based upon observed patterns of behaviour, Lighting Research & Technology 12 (1980) 7-14. https://doi.org/10.1177/096032718001200102
- M.C. Dubois, Impact of Shading Devices on Daylight Quality in Offices - Simulations with Radiance, Energy and Building Design, Lund (SE): Lund University, 2001.
- F. Cantin, M.C. Dubois, Daylighting metrics based on illuminance, distribution, glare and directivity, Lighting Research & Technology 43 (2011) 291-307. https://doi.org/10.1177/1477153510393319
- R. Hopkinson, P. Petherbridge, J. Longmore, Daylight in architecture, William Heineman Ltd, London (UK), 1966.
- E. Brembilla, D.A. Chi Pool, C.J. Hopfe, J. Mardaljevic, Inter-model comparison of five climate-based daylight modelling techniques: redirecting glazing/shading systems, 2017.
- S. Darula, J. Christoffersen, M. Malikova, Sunlight and Insolation of Building Interiors, Energy Procedia 78 (2015) 1245-1250. https://doi.org/10.1016/j.egypro.2015.11.266
- CEN/TC, Energy Performance of Buildings - Part 1: Indoor Environmental Input Parameters for Design and Assessment of Energy Performance of Buildings Addressing Indoor Air Quality, Thermal Environment, Lighting and Acoustics, CEN/TC, (2015). https://doi.org/10.3403/30133865u
- J. Mardaljevic, N. Roy, The sunlight beam index, Lighting Research & Technology 48 (2016) 55-69. https://doi.org/10.1177/1477153515621486
- C. Pierson, J. Wienold, M. Bodart, Discomfort glare perception in daylighting: influencing factors, Energy Procedia 122 (2017) 331-336. https://doi.org/10.1016/j.egypro.2017.07.332
- W.K.E. Osterhaus, Discomfort glare assessment and prevention for daylight applications in office environments, Solar Energy 79 (2005) 140-158. https://doi.org/10.1016/j.solener.2004.11.011
- R.G. Hopkinson, Glare from daylighting in buildings, Applied Ergonomics 3 (1972) 206-215. https://doi.org/10.1016/0003-6870(72)90102-0
- A. Jakubiec, C.F. Reinhart, DIVA 2.0: Integrating Daylight and Thermal Simulations using Rhinoceros 3D, DAYSIM, and EnergyPlus.in: Proceedings of the 12th Conference of IBPSA, Building Simulations, Sydney, (AU), 2011, 2202–2209.
- C. Pierson, J. Wienold, M. Bodart, Review of Factors Influencing Discomfort Glare Perception from Daylight, LEUKOS 14 (2018) 111-148. https://doi.org/10.1080/15502724.2018.1428617
- J.Y. Suk, M. Schiler, K. Kensek, Development of new daylight glare analysis methodology using absolute glare factor and relative glare factor, Energy and Buildings 64 (2013) 113-122. https://doi.org/10.1016/j.enbuild.2013.04.020
- J. Wienold, J. Christoffersen, Evaluation methods and development of a new glare prediction model for daylight environments with the use of CCD cameras, Energy and Buildings 38 (2006) 743-757. https://doi.org/10.1016/j.enbuild.2006.03.017
- J. Shin, G.Y. Yun, J.T. Kim, View types and luminance effects on discomfort glare assessment from windows, Energy and Buildings 46 (2012) 139-145. https://doi.org/10.1016/j.enbuild.2011.10.036
- W.K.E. Osterhaus, Recommended luminance ratios and their application in the design of daylighting systems for offices.in: Proceedings of the 35th Annual Conference of the Australia and New Zealand Architectural Science Association (ANZAScA), Geelong (AU), 2002.
- D.L. Dilaura, K.W. Houser, R.G. Mistrick, G.R. Steffy, The Lighting Handbook: Reference and Application 10th ed., Illuminating Engineering Society of North America, 2011.
- A. Linney, Maximum Luminances and Luminance Ratios and their Impact on Users' Discomfort Glare Perception and Productivity in Daylit Offices, Wellington (NZ): Victoria University of Wellington, 2008.
- P. Petherbridge, R.G. Hopkinson, Discomfort Glare and the Lighting of Buildings, Transactions of the Illuminating Engineering Society 15 (1950) 39-79. https://doi.org/10.1177/147715355001500201
- P. Boyce, Human Factors in Lighting, 3rd ed., CRC Press, Boca Raton, (2014) 9781439874899.
- S.K. Guth, A method for the evaluation of discomfort glare, Illuminating Engineering 58 (5) (1963) 351-364.
- R. Harrold, D. Mennie, IESNA Lighting Ready Reference: A Compendium of Materials from the IESNA Lighting Handbook, 9th Edition : Lighting Fundamentals, Illuminating Engineering Society of North America (2003) 9780879951894.
- J.Y. Suk, M. Schiler, K. Kensek, Investigation of existing discomfort glare indices using human subject study data, Building and Environment 113 (2017) 121-130. https://doi.org/10.1016/j.buildenv.2016.09.018
- H.D. Einhorn, Discomfort glare: a formula to bridge differences, Lighting Research & Technology 11 (1979) 90-94. https://doi.org/10.1177/14771535790110020401
- T. Iwata, K. Kimura, M. Shukuya, K. Takano, Discomfort caused by wide-source glare, Energy and Buildings 15 (1990) 391-398. https://doi.org/10.1016/0378-7788(90)90013-9
- J.A. Jakubiec, C.F. Reinhart, ‘The ’adaptive zone’-A concept for assessing discomfort glare throughout daylit spaces, Lighting Research and Technology 44 (2012) 149–170. https://doi.org/10.1177/1477153511420097
- CIE, Discomfort Glare In The Interior Working Environment, 1995.
- I. Gillian, V. Garcia-Hansen, M.B. Hirning, Evaluation of the Luminous Environment in Open-plan Offices with Skylights.in: The World Renewable Energy Forum, SOLAR, Denver, Colorado, 2012.
- J. Vos, B. Cole, H. Bodmann, E. Colombo, T. Takeuchi, T.J.C.T.R.C. Van Den Berg, CIE equations for disability glare, 146 (2002) 2002.
- M.B. Hirning, G.L. Isoardi, V.R. Garcia-Hansen, Prediction of discomfort glare from windows under tropical skies, Building and Environment 113 (2017) 107-120. https://doi.org/10.1016/j.buildenv.2016.08.005
- M.B. Hirning, G.L. Isoardi, I. Cowling, Discomfort glare in open plan green buildings, Energy and Buildings 70 (2014) 427-440. https://doi.org/10.1016/j.enbuild.2013.11.053
- P. Chauvel, J.B. Collins, R. Dogniaux, J. Longmore, Glare from windows: current views of the problem, Lighting Research & Technology 14 (1982) 31-46. https://doi.org/10.1177/096032718201400103
- L. Bellia, A. Cesarano, G.F. Iuliano, G. Spada, Daylight glare: a review of discomfort indexes.in: Vis Qual Energy Effic Indoor Light: Today Tomorrow Rome, Italy, 2008.
- A. Piccolo, F. Simone, Effect of switchable glazing on discomfort glare from windows, Building and Environment 44 (2009) 1171-1180. https://doi.org/10.1016/j.buildenv.2008.08.013
- A. McNeil, G. Burrell, Applicability of dgp and dgi for evaluating glare in a brightly daylit space, Proceedings of SimBuild; 2016: SimBuild 2016, 2016.
- M. Boubekri, L.L. Boyer, Effect of window size and sunlight presence on glare, Lighting Research & Technology 24 (1992) 69-74. https://doi.org/10.1177/096032719202400203
- J. Mardaljevic, Rethinking daylighting and compliance.in: Proceedings of the SLL/CIBSE international lighting conference, Dublin (IE), 2013, 1–9.
- A.A. Nazzal, A new evaluation method for daylight discomfort glare, International Journal of Industrial Ergonomics 35 (2005) 295-306. https://doi.org/10.1016/j.ergon.2004.08.010
- M. Tokura, T. Iwata, M. Shukuya, Experimental study on discomfort glare caused by windows part 3 : Development of a method for evaluating discomfort glare from a large light source, Journal of Architecture and Planning (Transactions of AIJ) 61 (489), 1996, 17-25. https://doi.org/10.3130/aija.61.17_8
- J. Wienold, J. Christoffersen, Towards a new daylight glare rating.in: In: Proceedinsg of the 10th European Lighting Conference, Lux Europa, Lux EuropaBerlin (DE), 2005, 157–161.
- G.Y. Yun, K.C. Yoon, K.S. Kim, The influence of shading control strategies on the visual comfort and energy demand of office buildings, Energy and Buildings 84 (2014) 70-85. https://doi.org/10.1016/j.enbuild.2014.07.040
- J. Wienold, Dynamic daylight glare evaluation.in: In: Proceedings of the 11th International IBPSA Conference, Building Simulation, Glasgow, Scotland (UK), (2009), 944–951.
- K. Konis, S. Selkowitz, Effective Daylighting with High-Performance Facades, Emerging Design Practices, Springer International Publishing, Switzerland, (2017) 978-3-319-39463-3. https://doi.org/10.1007/978-3-319-39463-3_3
- I. Konstantzos, A. Tzempelikos, Y.C. Chan, Experimental and simulation analysis of daylight glare probability in offices with dynamic window shades, Building and Environment 87 (2015) 244-254. https://doi.org/10.1016/j.buildenv.2015.02.007
- M. Andersen, S. Kleindienst, L. Yi, J. Lee, M. Bodart, B. Cutler, An intuitive daylighting performance analysis and optimization approach Building Research & Information 36 (2008) 593-607. https://doi.org/10.1080/09613210802243159
- E.E. Tsianaka, A concept to evaluate dynamic daylight glare, Lund University, 2018.
- G. Ward, R.A. Shakespeare, Rendering with Radiance, Morgan Kaufmann, (1998) 978-1558604995.
- K. Van Den Wymelenberg, M. Inanici, P. Johnson, The effect of luminance distribution patterns on occupant preference in a daylit office environment, LEUKOS The Journal of the Illuminating Engineering Society of North America 7 (2013) 103-122. https://doi.org/10.1582/leukos.2010.07.02003
- J.A. Yamin Garretón, E.M. Colombo, A.E. Pattini, A global evaluation of discomfort glare metrics in real office spaces with presence of direct sunlight, Energy and Buildings 166 (2018) 145-153. https://doi.org/10.1016/j.enbuild.2018.01.024
- I. Konstantzos, A. Tzempelikos, Daylight glare evaluation with the sun in the field of view through window shades, Building and Environment 113 (2017) 65-77. https://doi.org/10.1016/j.buildenv.2016.09.009
- S. Kleindienst, M. Andersen, The adaptation of daylight glare probability to dynamic metrics in a computational setting, 2009.
- J. Wienold, Dynamic simulation of blind control strategies for visual comfort and energy balance analysis.in: Proceedings of the 10th International Building Performance Simulation Association conference and Exhibition, Beijing: Tsinghua University Press, 2007, 1197-1204.
- Y. Chan, A. Tzempelikos, I. Konstantzos, A systematic method for selecting roller shade properties for glare protection, Energy and Buildings 92 (2015) 81-94. https://doi.org/10.1016/j.enbuild.2015.01.057
- R.A. Mangkuto, K.A. Kurnia, D.N. Azizah, R.T. Atmodipoero, F.X.N. Soelami, Determination of discomfort glare criteria for daylit space in Indonesia, Solar Energy 149 (2017) 151-163. https://doi.org/10.1016/j.solener.2017.04.010
- L. Giovannini, F. Favoino, V. Lo Verso, A. Pellegrino, V. Serra, A Simplified Approach for the Annual and Spatial Evaluation of the Comfort Classes of Daylight Glare Using Vertical Illuminances, Buildings 8 (2018) 171. https://doi.org/10.3390/buildings8120171
- J. Christoffersen, J. Mardaljevic, The New European Standard (prEN 17037) in Buildings–A Brighter Future? Part 2, CISBE, no. prEN 17037, 2016.
- J.Y. Suk, M. Schiler, K. Kensek, Absolute glare factor and relative glare factor based metric: Predicting and quantifying levels of daylight glare in office space, Energy and Buildings 130 (2016) 8-19. https://doi.org/10.1016/j.enbuild.2016.08.021
- T. Iwata, M. Tokura, Examination of the limitations of predicted glare sensation vote (PGSV) as a glare index for a large source: Towards a comprehensive development of discomfort glare evaluation, International Journal of Lighting Research and Technology 30 (1998) 81-88. https://doi.org/10.1177/096032719803000205
- W. Kim, J.T. Kim, The Scope of the glare light source of the window with non-uniform luminance distribution.in: In: Proceedings of the 3rd International Symposium on Sustainable Healthy Buildings (SHB2010), Seoul (KR), 2010.
- USGBC, United States Green Building Council (USGBC), LEED v4 for Building Design and Construction, Washington, D.C., USA, 2018.
- WELL, WELL buildings standard v2, https://v2.wellcertified.com/, 2019.
- A.H. Sadek, R. Mahrous, Adaptive glazing technologies: Balancing the benefits of outdoor views in healthcare environments, Solar Energy 174 (2018) 719-727. https://doi.org/10.1016/j.solener.2018.09.032
- W.H. Ko, M.G. Kent, S. Schiavon, B. Levitt, B. Giovannini, A window view quality assessment framework, 2020.
- BS-EN14500, Blinds and shutters. Thermal and visual comfort. Test and calculation methods, European committee for standardization UK, 2008, p. 60 https://doi.org/10.3403/30100408u
- BS-EN14501, Blinds and shutters — Thermal and visual comfort — Performance characteristics and classification, European committee for standardization UK, 2005. https://doi.org/10.3403/30100403u
- DIN-5034-1, Daylight in Interiors Deutsches Institut fur Normung E.V. (DIN), 2011, p. 17.
- B.G. Limited, BREEAM UK New Construction 2018, BRE Global Limited, Watford, UK, 2018.
- H.I. Hellinga, Daylight and view: the influence of windows on the visual quality of indoor spaces, 2013.
- BS-EN17037, Daylight in Buildings European committee for standardization Ireland, 2018.
- I. Konstantzos, Y.-C. Chan, J.C. Seibold, A. Tzempelikos, R.W. Proctor, J.B. Protzman, View clarity index: A new metric to evaluate clarity of view through window shades, Building and Environment 90 (2015) 206-214. https://doi.org/10.1016/j.buildenv.2015.04.005
- A. Tabadkani, A. Roetzel, H.X. Li, A. Tsangrassoulis, A review of occupant-centric control strategies for adaptive facades, Automation in Construction (2020) 103464. https://doi.org/10.1016/j.autcon.2020.103464
- I. Elzeyadi, The impacts of dynamic façade shading typologies on building energy performance and occupant’s multi-comfort, Architectural Science Review 60 (2017) 316-324. https://doi.org/10.1080/00038628.2017.1337558
- J.Y. Garretón, R. Rodriguez, A.E. Pattini, Effects of perceived indoor temperature on daylight glare perception, Building Research & Information 44 (2016) 907-919. https://doi.org/10.1080/09613218.2016.1103116
- M.G. Kent, S. Altomonte, P.R. Tregenza, R. Wilson, Temporal variables and personal factors in glare sensation, Lighting Research & Technology 48 (2015) 689-710. https://doi.org/10.1177/1477153515578310
- A. Borisuit, F. Linhart, J.L. Scartezzini, M. Münch, Effects of realistic office daylighting and electric lighting conditions on visual comfort, alertness and mood, Lighting Research & Technology 47 (2014) 192-209. https://doi.org/10.1177/1477153514531518
- S. Völker, M. Freyer, S. Raphael, M. Meyborg, Influence factors for discomfort glare of headlamps and a new model for its estimation.in: CIE 2017 Midterm Meetings and Conference on Smarter Lighting for Better Life, Jeju, South Korea, 2018. https://doi.org/10.25039/x44.2017.po94
- J. Wienold, T. Iwata, M. Sarey Khanie, E. Erell, E. Kaftan, R. Rodriguez, J. Yamin Garreton, T. Tzempelikos, I. Konstantzos, J. Christoffersen, T. Kuhn, E., C. Pierson, A., M. Andersen, Cross-validation and robustness of daylight glare metrics, Lighting Research & Technology (2019) 983-1013. https://doi.org/10.1177/1477153519826003
- J. Kim, J. Shin, G. Yun, Prediction of discomfort glares from windows: influence of the subjective evaluation of window views, Indoor Built Environment 21 (2011) 92-97. https://doi.org/10.1177/1420326x11423157
- N. Tuaycharoen, The reduction of discomfort glare from windows by interesting views, 2006.
- Z. Gou, M. Khoshbakht, B. Mahdoudi, The Impact of Outdoor Views on Students’ Seat Preference in Learning Environments, Buildings 8 (2018). https://doi.org/10.3390/buildings8080096
- N. Tuaycharoen, Windows are less glaring when there is a preferred view, Built - Environment 9 (2011) 45-55. https://doi.org/10.4038/besl.v9i1-2.3064
- M.G. Kent, T. Cheung, S. Altomonte, S. Schiavon, A. Lipczyńska, A Bayesian method of evaluating discomfort due to glare: The effect of order bias from a large glare source, Building and Environment 146 (2018) 258-267. https://doi.org/10.1016/j.buildenv.2018.10.005
- H.I. Hellinga, T. Hordijk, The D&V analysis method: A method for the analysis of daylight access and view quality, Building and Environment 79 (2014) 101-114. https://doi.org/10.1016/j.buildenv.2014.04.032
Copyright © 2021 The Author(s). Published by solarlits.com.

10012
Total views
Citations
SHARE ON


