Volume 8 Issue 2 pp. 204-221 • doi: 10.15627/jd.2021.17
Improvement of Daylight Factor Model for Window Size Optimization and Energy Efficient Building Envelope Designs
Chahrazed Mebarki,*,a Essaid Djakab,a Abderrahmane Mejedoub Mokhtari,b Youssef Amrane,c Lotfi Derradjid
Author affiliations
a Laboratory Built in the Environment, University of Science and Technology Houari Boumediene (USTHB), 16111 Algiers, Algeria
b Soil Materials and Thermal Laboratory (LMST) University of Science and Technology of Oran Mohammed BOUDIAF, USTOMB – Algeria
c Laboratory of Electrical and Industrial Systems, University of Science and Technology Houari Boumediene (USTHB), 16111 Algiers, Algeria
d National Center of Studies and Integrated Research of the Building, CNERIB, Algiers, Algeria
*Corresponding author.
cmebarki@usthb.dz (C. Mebarki)
djakabe@yahoo.fr (E. Djakab)
abderahmane.mokhtari@univ-usto.dz (A. M. Mokhtari)
yamrane@usthb.dz (Y. Amrane)
lotfi.derradji@yahoo.fr (L. Derradji)
History: Received 27 March 2021 | Revised 12 May 2021 | Accepted 2 June 2021 | Published online 29 July 2021
Copyright: © 2021 The Author(s). Published by solarlits.com. This is an open access article under the CC BY license (http://creativecommons.org/licenses/by/4.0/).
Citation: Chahrazed Mebarki, Essaid Djakab, Abderrahmane Mejedoub Mokhtari, Youssef Amrane, Lotfi Derradji, Improvement of Daylight Factor Model for Window Size Optimization and Energy Efficient Building Envelope Design, Journal of Daylighting 8 (2021) 204-221. https://dx.doi.org/10.15627/jd.2021.17
Figures and tables
Abstract
Based on a new approach for the prediction of the Daylight Factor (DF), using existing empirical models, this research work presents an optimization of window size and daylight provided by the glazed apertures component for a building located in a hot and dry climate. The new approach aims to improve the DF model, considering new parameters for daylight prediction such as the orientation, sky conditions, daytime, and the geographic location of the building to fill in all the missing points that the standard DF, defined for an overcast sky, presents. The enhanced DF model is considered for the optimization of window size based on Non dominated Sorting Genetic Algorithm (NSGA II), for heating and cooling season, taking into account the impact of glazing type, space reflectance and artificial lighting installation. Results of heating and cooling demand are compared to a recommended building model for hot and dry climate with 10% Window to Wall Ratio (WWR) for single glazing. The optimal building model is then validated using a dynamic convective heat transfer simulation. As a result, a reduction of 48% in energy demand and 21.5% in CO2 emissions can be achieved. The present approach provides architects and engineers with a more accurate daylight prediction model considering the effect of several parameters simultaneously. The new proposed approach, via the improved DF model, gives an optimal solution for window design to minimize building energy demand while improving the indoor comfort parameters.
Keywords
Daylight factor, Glazed area, Energy demand, Daylighting
Nomenclature
| Acronyms | |
| DF | Daylight Factor % |
| QT | Total energy demand from luminaires and the window (W) |
| Q luminaires | Energy demand from luminaires (W) |
| Q solar heat gain | Energy demand from the window due to solar heat gain (W) |
| Q window -DT | Energy demand from the window due to temperature gradient (W) |
| QW | Energy transfer corresponding to the thermal transmission through the glazed area, (kWh/m²-year) |
| QOp | Energy transfer corresponding to the thermal transmission through the Opaque surfaces, (kWh/m²-year) |
| S | The area of the working plane (m²). |
| d | Maintenance factor. |
| Uf | Luminaire utilization factor. |
| Qu | Unitary heat load of the luminaire (W). |
| Ei | the internal illuminance level(lux) |
| E Artificial | Internal artificial illuminance level provided by the artificial lighting installation (lux). |
| EHT | the simultaneous exterior illuminance on a horizontal plane (lux) |
| EVT | the simultaneous exterior illuminance on a vertical plane (lux) |
| IHT | Total solar irradiance on a horizontal plane (W/m²) |
| IVT (t) | Total solar irradiance on a vertical plane (W/m²) |
| Ag | Glazed area of the window (m²). |
| At | Total area of room-surfaces (m²). |
| M | Maintenance correction factor. |
| R² | Average reflectance of all room surfaces. |
| U | Thermal transmission coefficient of the glazing (W/m².°C). |
| SHGC | Solar Heat Gain Coefficient of the glazing |
| L | The local latitude |
| OF | Orientation factor |
| CF | Cloud amount Factor |
| H | The hour angle |
| Greek symbols | |
| α | The luminaire yield. |
| ju | Unitary luminous flux of the luminaire (lm). |
| t | Transmittance of glazing (visual transmission). |
| q | Vertical angle of visible sky from the center of the window. |
| ⴄ | Luminous efficacy(lm/w) |
| gs | Solar altitude |
| δ | Solar declination |
1. Introduction
Energy efficiency in the building sector has become a major concern of energy and climate policies as it represents 40% [1] of global worldwide energy consumption. In Algeria, Building sector presents about 43% of final energy consumption [2], which is mainly related to the use of heating and cooling equipment [3]. The improvement of the energy efficiency of the buildings contributes to the preservation of the environment. The building envelope is responsible for a large part of energy demand as it is the physical separator between the interior and exterior and therefore exposed to uncontrollable meteorological variations throughout a year [4]. To this end, building envelopes should be optimized in order to reduce energy demand by adapting active strategies such as integrating BIPV and smart windows [5-7], or, passive strategies as the optimization of building envelope using single or double glazing [8,9]. Single and double glazings are commonly used due to their relatively low cost. Their high luminous transmission and solar factor leads to a considerable solar heat gain that minimizes heating demand in winter season, and improve energy saving for artificial lighting [10]. The advantage of using single or double glazing compared to the use of BIPV or smart windows is mainly economic concern [11-14].
To comply with the Paris climate agreement, Algeria has planned a strategy action plan for 2021/2030 which consists to achieve 27% of national electricity production from Renewable Energies at horizon 2030, generalization of efficient lighting, in particular photovoltaic public lighting and apply a building envelope thermal refurbishment program of 5,000 houses per year between 2021 and 2030 [15,16]. Moreover, greenhouse gaz mitigation actions plan respecting international commitments to achieve the voluntary scenario of 7% for the first step and to achieve the conditional scenario by 2030.
In design practice, the choice of building envelope is highly dependent on the philosophy of the architects. This choice has a significant impact on energy needs for cooling and heating [17]. The use of daylight in a building is one of the most obvious ways to save energy [18].The amount of light introduced into a space is affected by the luminous transmission of the glazing and the size of the window, which represents also the weakest link in the building in terms of energy demand [19,20].Therefore, the optimization of the window size remains a research interest. An inappropriate window size design can lead to excessive penetration of sunlight into the space, causing glare and overheating problems.
Recently, there has been an increasing interest among building designers and architects to optimize the window size as a means to reduce energy use in buildings. Literature review of essential previous studies that focused on the optimization of window size and building energy demand are shown in Table 1.
Table 1
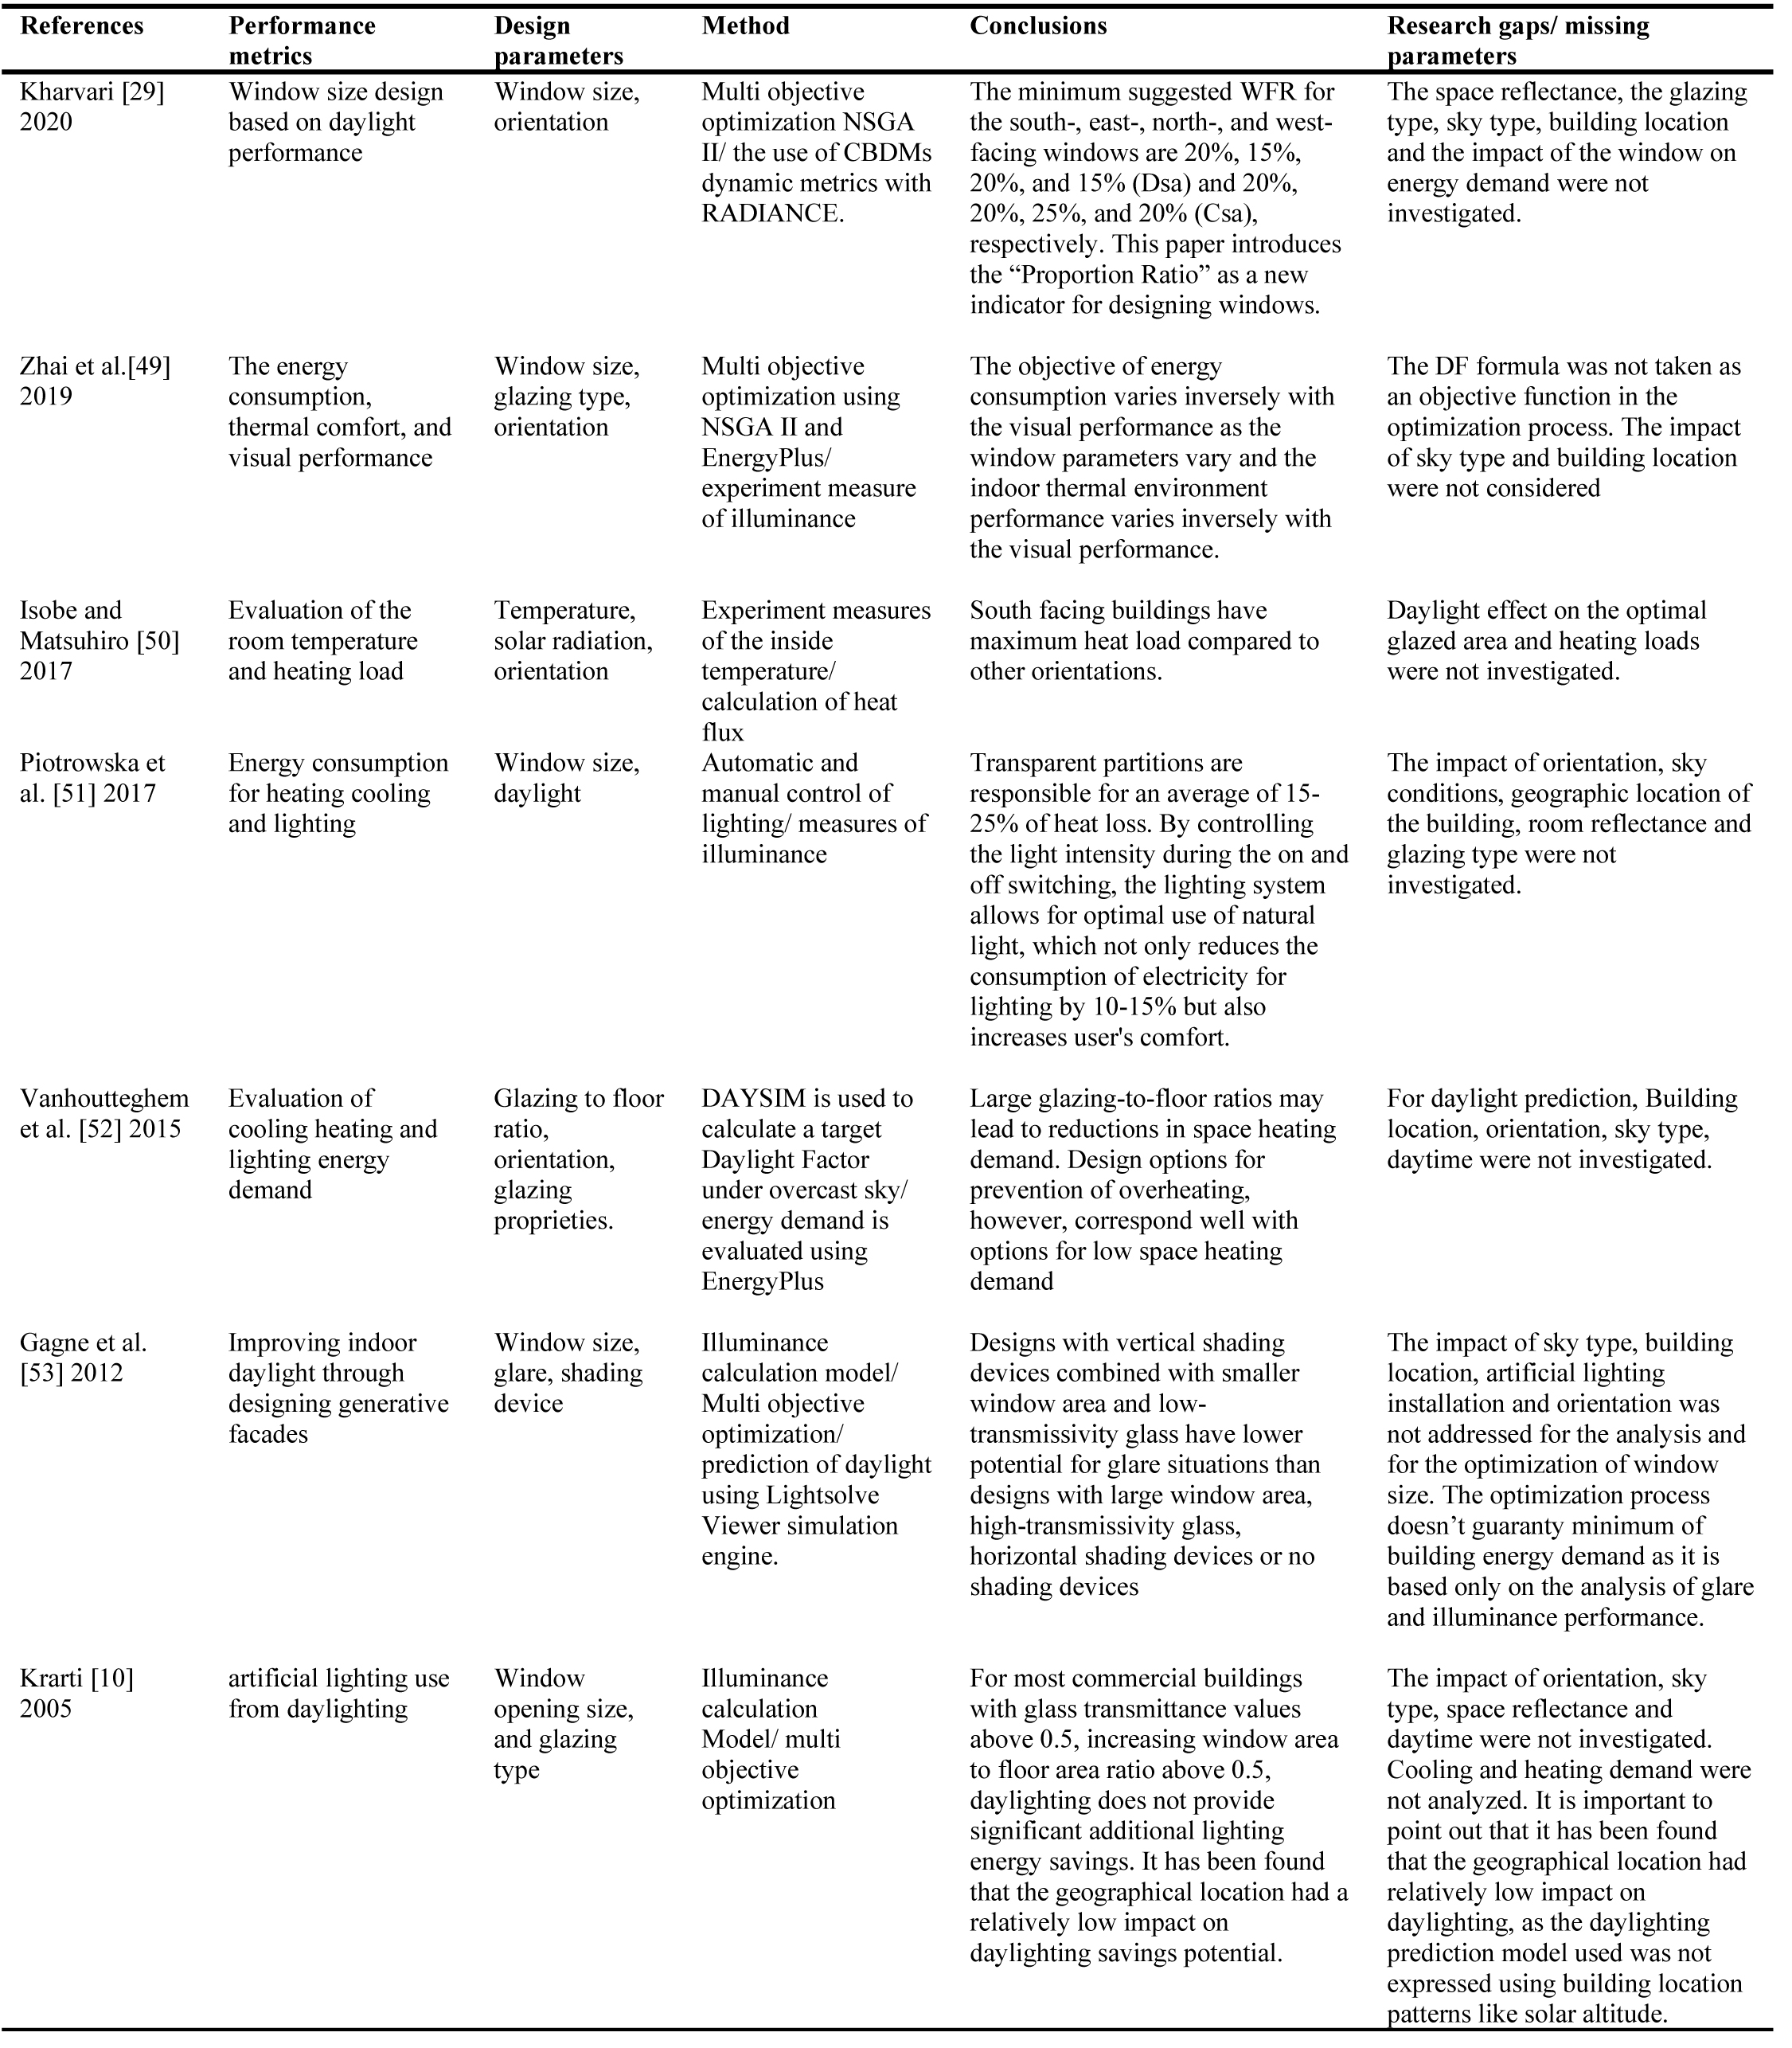
Table 1. Literature review of essential previous studies that focused on the optimization of window size and building energy demand.
Recently, building standards and green building rating systems have moved toward climate-based daylighting metrics (CBDM) examples being daylight autonomy [21], which is a dynamic metric that considers illuminance distributions under all sky conditions and requires measurements for a whole year [22] . These climate-based metrics are very interesting. However, the CBDMs are not easy to predict and require the use of a validated dynamic daylight simulation engine such as DAYSIM. As they are based on a dynamic model, the incorporation of dynamic building simulation in an optimization process is inefficient and complex [23]. Therefore, the consideration of daylighting for multi-objective optimization requires a detailed model for daylight prediction while considering the impact of window size. For daylight prediction, the DF is commonly used [24,25]. The DF is a static daylight metric [4]. It represents the ratio of the internal illuminance level (Ei) to the simultaneous exterior illuminance on a horizontal plane (EHT). Recent research works tend to replace the DF with a dynamic daylight prediction model as the Useful Daylight Illuminance (UDI-a (autonomous)) [26,27], which is supposed to give detailed results, since it is based on a complex calculation. The main barrier that hided researchers on investigating alternative daylight prediction model is that DF does not consider the impact of orientation [28], building location [29] daytime and sky conditions [30–32], since the CIE reference sky is overcast.
Therefore, this study aims to determine the optimal window size, for a main hot and dry climate, based on a new approach for daylight factor (DF) prediction, using existing empirical models. The proposed method presents a combination of several empirical models of several indicators such as the Orientation Factor (OF), the luminous efficacy (h) and the Cloud amount Factor (CF), previously developed by researchers for daylight energy studies. Since the prediction of the external and internal illuminance level is not obvious for clear or overcast sky, Taylor et al. [33], developed various sky luminance distribution models which require data of global and diffuse illuminance. They presented a luminous efficacy model (h) for global horizontal irradiance to derive values of outdoor global horizontal illuminance data from local weather station data. The luminous efficacy was developed for clear sky conditions [34,35] based on solar altitude. Then, a general model was proposed to consider all sky conditions [36,37], by introducing a new indicator which is the Cloud amount Factor (CF) [37]. Consequently, the determination of the outdoor illuminance level becomes easier and depends on solar irradiation, which can be calculated according to the altitude of the sun, building location patterns and daytime [38].
As the daylight factor concept is based on the worst case condition (the completely overcast sky), it does not change with orientation [25]. Hunt [39] and littelfair [40], proposed the use of an orientation factor (OF). This factor can be multiplied by the daylight factor to consider the effect of orientation. The above named studies proposed an average orientation factor for four cardinal directions instead of an orientation factor that depends on daytime or the changing position of the sun during the day.
In this work, the use of the average DF model is also considered to take into account the impact of glazing type, the space reflectance and the space dimensions. The average orientation factor (OF) is introduced in the average DF formula and turned into a dynamic orientation factor that depends on daytime variation and can be calculated for all orientations. Therefore, the prediction of daylighting with the present approach, using the enhanced DF model, led to consider the impact of different new parameters that are the orientation, building location, daytime and sky conditions.
The improvement of the DF model, proposed by this research work, is carried out in order to offer to architects a simple, generalizable and detailed model to accurately predict daylighting, which can be used in the earlier design stage for all orientations, sky conditions and building locations, without necessarily going through complex dynamic models that sometimes requires the use of softwares.
As various changing parameters are considered, a multi-objective optimization is carried out for the optimization of window size, using the None Sorting dominated Genetic Algorithms (NSGA II), which is considered as one of the most efficient [41] and popular multi objective genetic algorithm [42]. The internal natural illuminance level determined with the enhanced DF model in combination with artificial lighting and energy demand for cooling and heating are considered as objective functions, with a constraint that limits the indoor illuminance level at 500lux according to the CIBSE [43,44] and EN 12 464 [45], as the building case study is an office building. The energy demand for cooling and heating of the optimum building model of this study is compared to a reference building model with a recommended Window to Wall Ratio (WWR) of 10% for hot and dry climate, as optimum window size for single glazing [8], using Energy Plus. A 10% WWR used in a hot and dry climate may be sufficient to provide the necessary illuminance level in a space, without additional artificial lighting. However, this configuration does not necessarily guarantee a minimum energy demand. For the same type of glazing, if the glazed area is reduced and the natural lighting is complemented by a given number of luminaires, the energy demand can be reduced while still guaranteeing the necessary visual comfort. Therefore, the optimization of the window size is based on the complementarity between artificial lighting and daylight, and the optimal results must present a compromise between thermal and visual comfort. The optimum model is then validated through dynamic convective heat transfer simulation using the Simscale tool.
The first step of this work is to improve the DF model by integrating different indicators for daylight prediction taking into account sky type, orientation, daytime, geographical location of the building, glazing type, glazed area and space reflectance. The improved DF Model is used in the NSGA II [46] multi objective optimization algorithm to optimize the glazed area. The building case study, of a square shape, which is recommended as the most compact building shape [47,48], with 10% WWR, will be compared to the optimized building model in terms of energy demand and daylight performance. The resulting reduction in energy demand, cost and CO2 emissions is compared and discussed at the end of this paper to highlight the benefits obtained using the present proposed approach.
2. Methodology
This paper presents a multi-objective optimization method based on NSGA-II using an improved Daylight Factor model to optimize the window size and building energy demand. Section 2.1 of this paper presents the improvement of the standard DF model. Several new parameters are taken into consideration, such as orientation, geographical location of the building, sky conditions and day time. The improved DF model is used in the optimization process in section 2.2, in order to optimize the window size and energy demand considering different glazing types and orientations. This optimization is carried out for an office building case study presented in Section 3, designed according to the recommendations of previous research works. The results of the multi objective optimization in terms of optimum window size, daylight and energy demand are presented and discussed in Section 4. The energy consumption, CO2 emissions and the cost of the artificial lighting installation and HVAC system of the optimized building are analyzed and compared to the initial building model in section 4.5. The structure of the method is shown in Fig. 1.
Figure 1

Fig. 1. Flowchart of the methodology application.
2.1. Improvement of DF model
By definition, the Daylight Factor (DF) is the ratio of the internal illuminance level (Ei), due to daylight at a point on the indoors working plane received directly or indirectly from the sky, to the simultaneous exterior illuminance on a horizontal plane (EHT), from the whole of an unobstructed sky (Eq. (1)) [25]:
This method does not require a detailed estimation of the external illuminance and is based on the worst possible condition (CIE overcast sky). Therefore, any extra light will be welcomed [25]. As a result, the complexity of predicting the internal illuminance under any sky conditions could be reduced. The simple and easier way to determine the external illuminance level is by using the luminance efficacy (h). This indicator was developed to establish the relationship between solar irradiance (IHT) and illuminance (EHT):
The calculation of the external irradiation is carried out considering the sun’s position in the sky and building location. It represents the sum of direct, diffuse and reflected irradiance depending on building orientation and daytime and can be calculated according to ASHRAE Standard [38], depending on solar azimuth, incident angle, solar declination and solar altitude. From the luminous efficacy and the external irradiation, the external illuminance can be calculated. Therefore, the calculation of the external illuminance becomes very flexible as the direct component of solar irradiation could be added or neglected.
Effectively, several researchers have published the values of the luminous efficacy (h) for typical sky conditions [33,54,55].
Indeed, Aydinly [34,56], developed the following empirical formula to calculate the luminous efficacy (ⴄ) basing on solar altitude (gs) (Fig. 2):
where, the calculation of the solar altitude (γs) can be carried out using the formula proposed by ASHRAE [38], that is:
where, L is the local latitude, H is the hour angle, and Δ is the solar declination.
And for clear sky conditions Chroscicki [35], developed the following equation, that is:
Figure 2
![Solar angles for vertical and horizontal surfaces [38].](figures/8-204-2.jpg)
Fig. 2. Solar angles for vertical and horizontal surfaces [38].
Also, in order to consider all sky conditions, Shikuyu and Kimura [36], made some improvements to Chroscicki formula by adding Cloud amount Factor (CF), ranging from 0 for a clear sky to 10 for a completely cloudy sky, i.e:
In the present work, clear sky is considered and CF is considered equal to 0. From Eq. (1), Eq. (2) and Eq. (5) the DF formula can be expressed as follows:
However, to predict the internal illuminance level, space patterns such as glazing type, space reflectance and area of room surfaces must be included in the DF model. Therefore, the average DF formula is considered:
where, Ag is the glazed area of the window, t is the transmittance of glazing (visual transmission), q is the vertical angle of visible sky from the center of the window, M is the maintenance correction factor, At is the total area of room-surfaces and R is the average reflectance of all room surfaces. To consider the impact of orientation in the average DF formula, the (OF) developed by Littelfair [40] is introduced:
where, the Average OF is:
where EHT and EVT represent, respectively, the simultaneous exterior illuminance on a horizontal and vertical plane. The average OF proposed by Littelfair [40] is limited to North, South, East and West directions. For a generalized and flexible formula, the OF is expressed according to daytime as follows:
Finally, from Eq. (2), Eq. (5), Eq. (9) and Eq. (11), the DF model can be expressed as follows:
From Eq. (7) and Eq. (12) the DF can be expressed as:
From Eq. (9) and Eq. (13), the OF(t) can also be expressed as follows, considering the total solar irradiance on a horizontal plane IHT and vertical plane IVT:
The Impact of solar position on Orientation Factor (OF) is presented in Fig. 3.
Figure 3
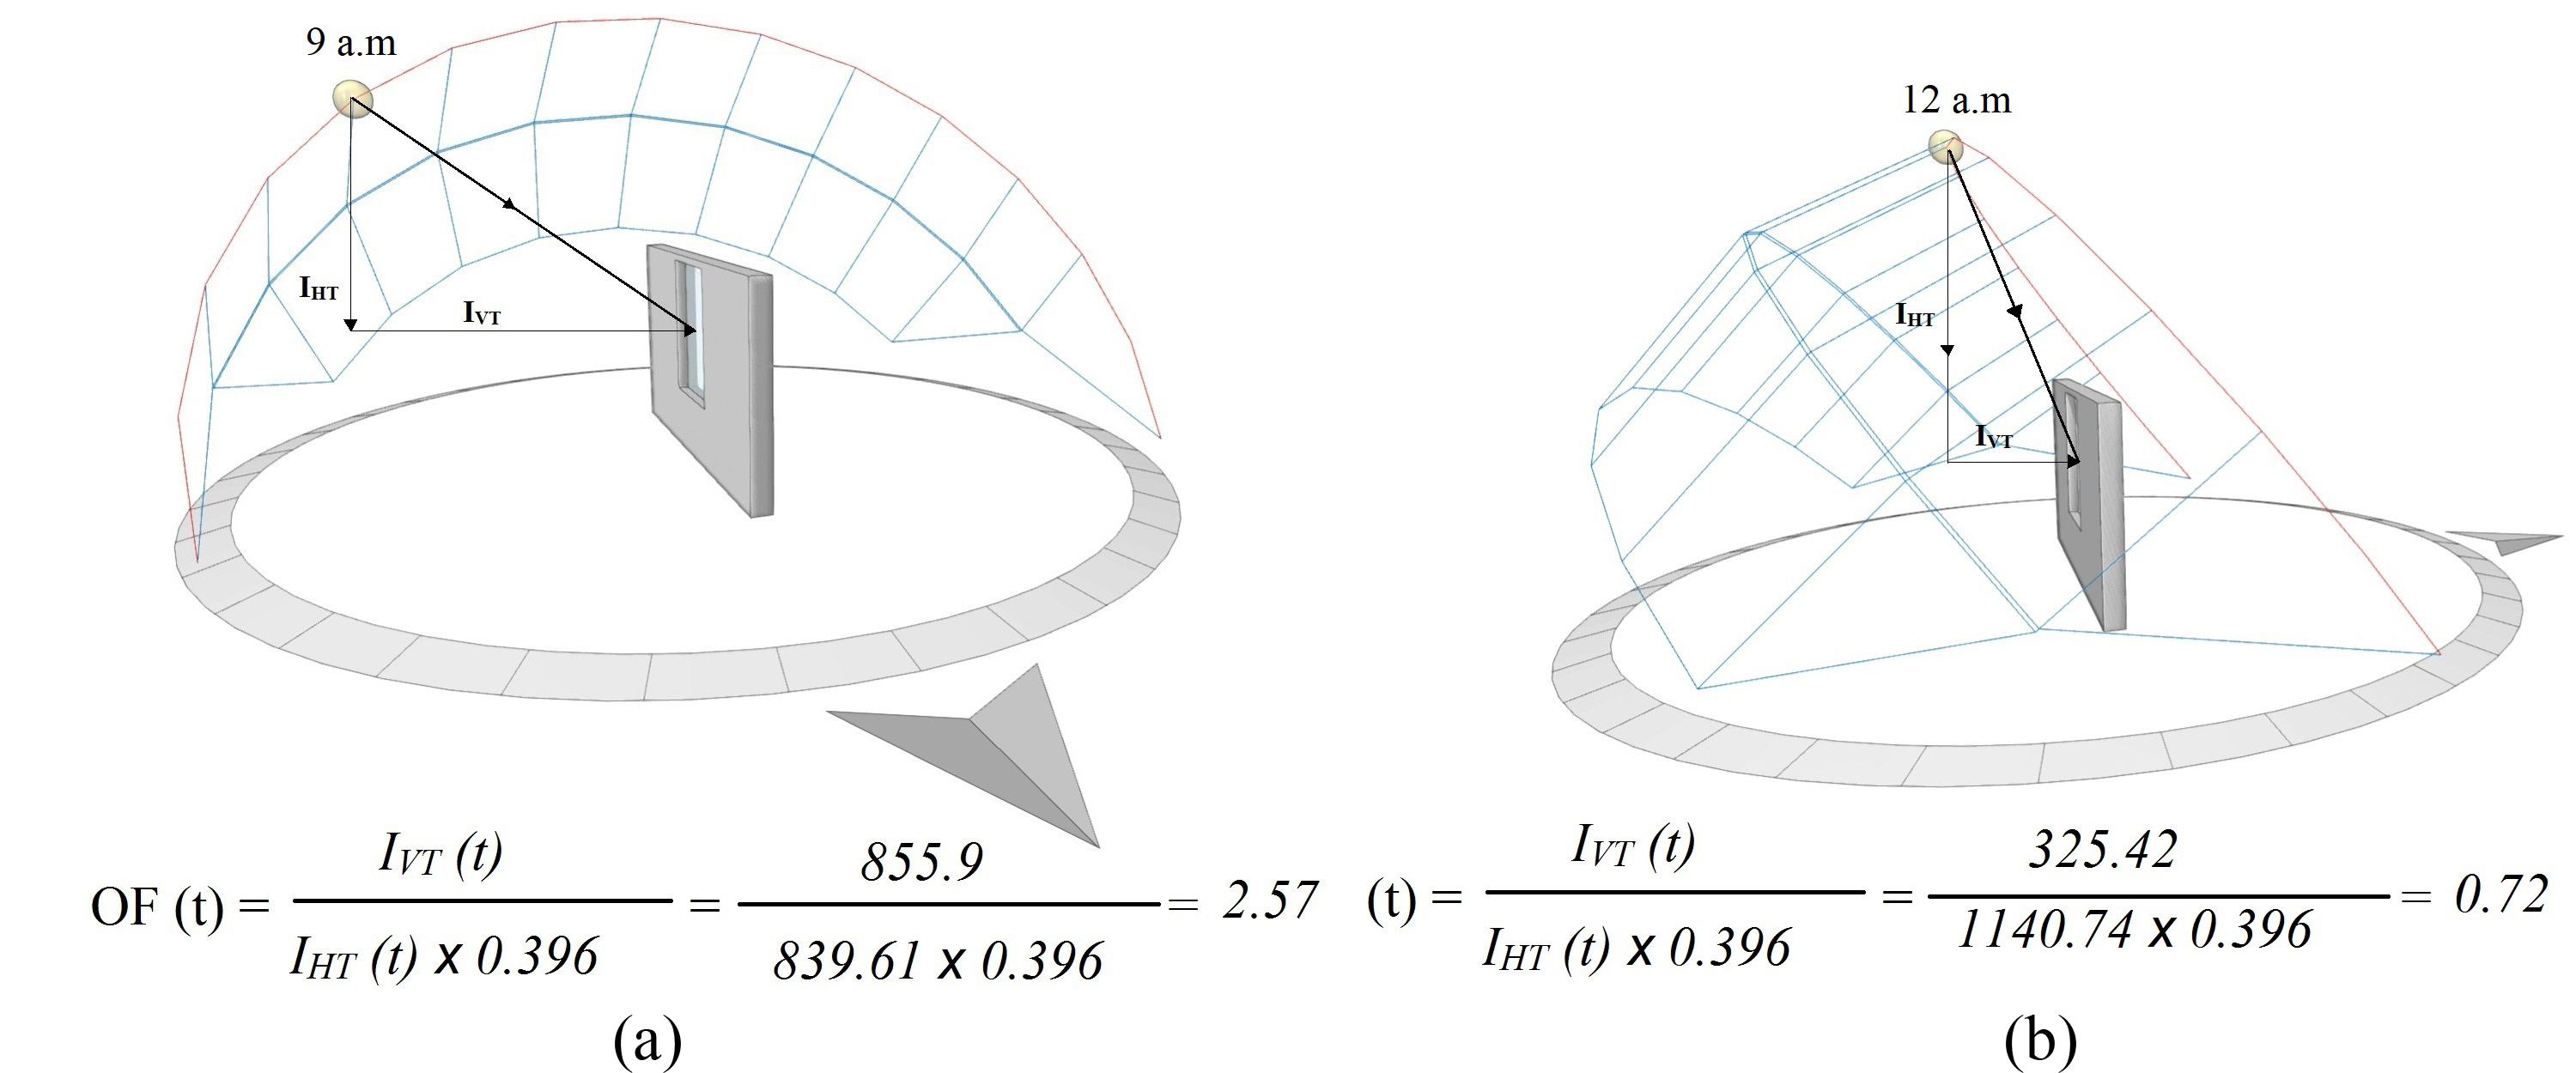
Fig. 3. Impact of solar position on orientation factor (OF) for (a) East direction and (b) South direction.
The resulting DF model Eq. (13), offers certain flexibility and thus represents a generalizable model that can be used for all orientations, sky conditions and geographical locations.
2.2. Window size optimization approach
Since the window and the artificial lighting installation are both sources of heat and light in the building, the main objective of the optimization is to find a good balance between daylight and artificial lighting to reduce energy requirements for heating and cooling, with the required indoor illuminance level for six orientations that are: North, South, East, West, SSE and SSW. For the optimization of window size, NSGA II is used where the considered objective functions are: -artificial lighting installation Eq. (15) and Eq. (16), combined with the internal natural illuminance level determined with the enhanced DF model Eq. (13); - energy demand for cooling and heating considering only energy demand from luminaires and windows Eq. (17) and Eq. (18). Thus, it is a multi-objective optimization with a constraint that limits the indoor illuminance level at 500lux according to the CIBSE [43,44]and EN 12 464 [45], as the building case study is an office building. The optimization considers the complementarity between artificial lighting and daylighting.
Eq. (15) is used to calculate the number of luminaires required for the complementarity of the artificial illuminance (EArtificial) with natural illuminance (Ei), that is:
where:
where S is the area of the working plane, d is the maintenance factor, Uf is the luminaire utilization factor, a is the luminaire yield and ju is the unitary luminous flux of the luminaire. The optimization process is carried out for the summer season only, as it represents the worst period in terms of energy demand. However, the energy demand should be considered for heating and cooling and is given by the following equations:
where, Q luminaires is the energy demand from luminaires, Q solar heat gain is the energy demand from the window due to solar heat gain and Q window - ΔT is the energy demand from the window due to temperature gradient .To optimize the total energy demand (QT), solar heat gains are considered free heat gains that reduce (-) the heating demand in Eq. (17) for the heating period. On the other hand, solar heat gains are considered as additional (+) cooling loads in Eq. (18) for the cooling period. Indeed, as a long summer characterizes hot and dry climates the optimization process is carried out for the summer season only. The interaction between the different design parameters in the optimization approach for the calculation of the total energy demand (QT) is illustrated in Fig. 4.
Figure 4
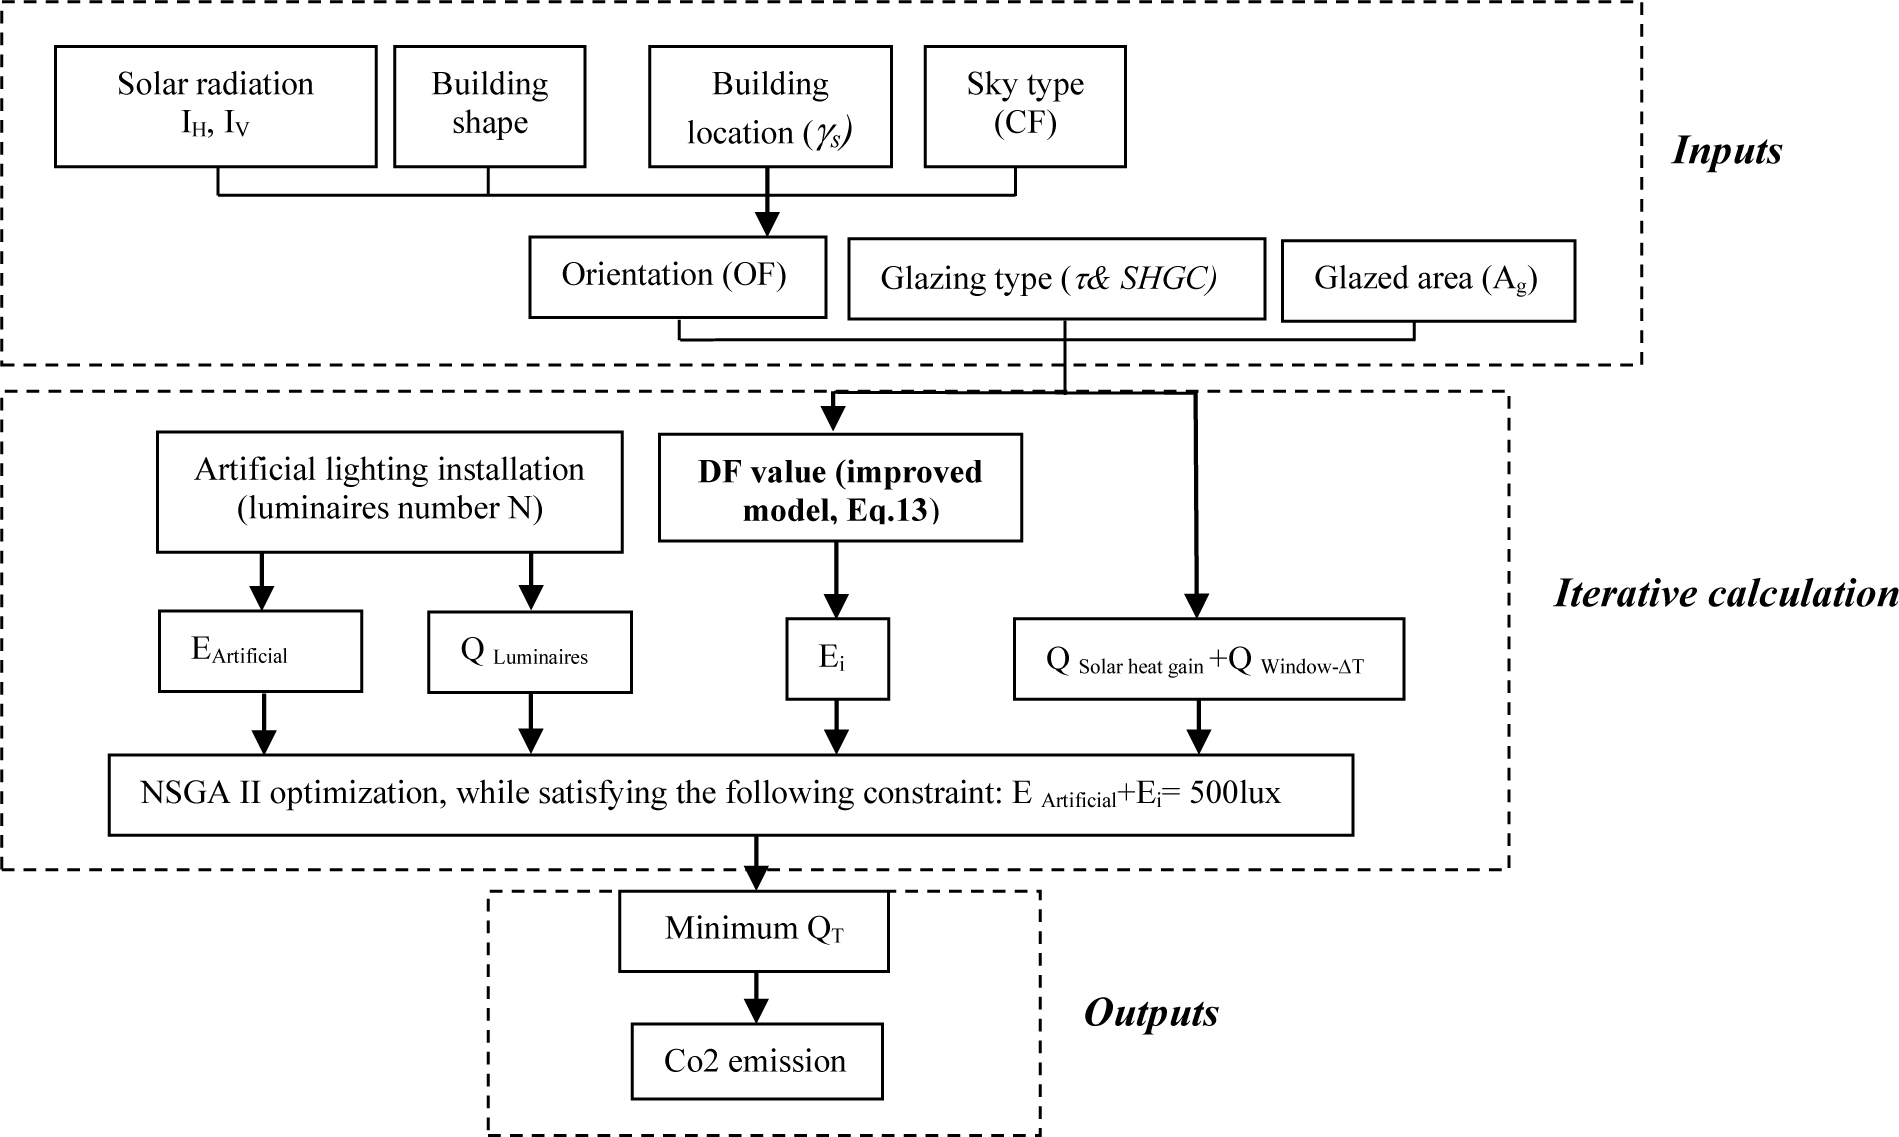
Fig. 4. The interaction between the different design parameters in the optimization approach for the total energy demand (QT) calculation.
The methodology of the optimization process using NGAII is presented in Fig. 5. The parameters of the NSGAII genetic algorithm are given in Table 2 and the characterization of the design parameters used in the optimization are given in (Table 3). The optimization process is carried out for 4 different types of glazing (Table 4).
Figure 5
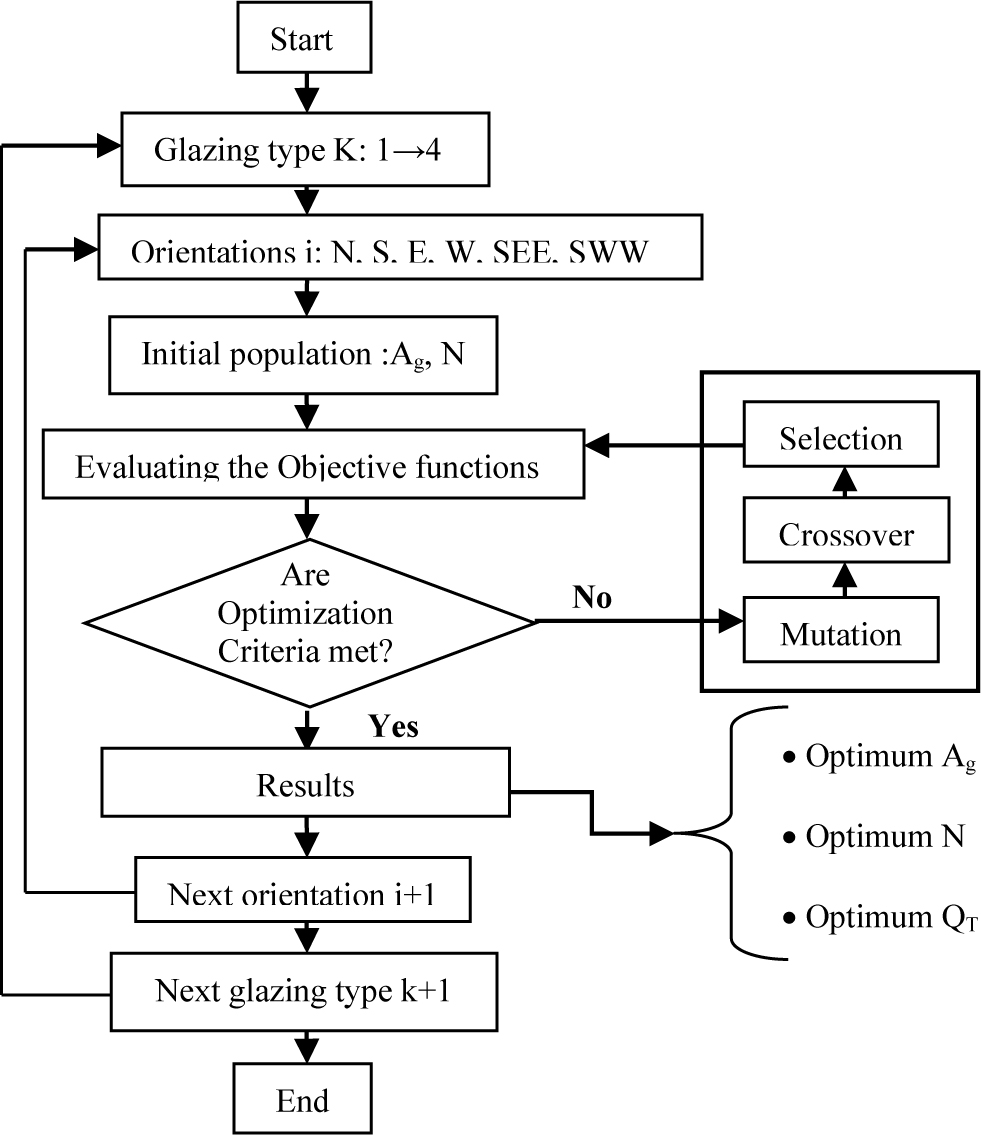
Fig. 5. Genetic Algorithm NSGA II Flowchart.
Table 2
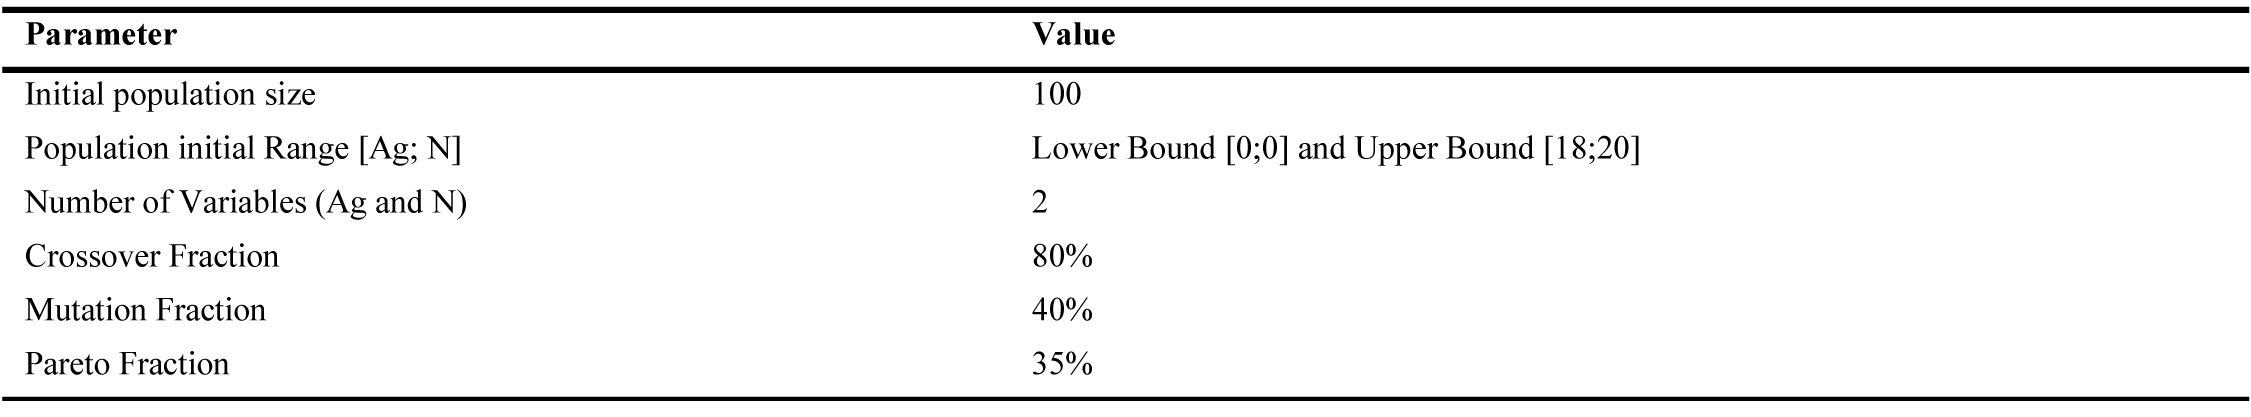
Table 2. Genetic algorithm NSGA II parameters.
Table 3
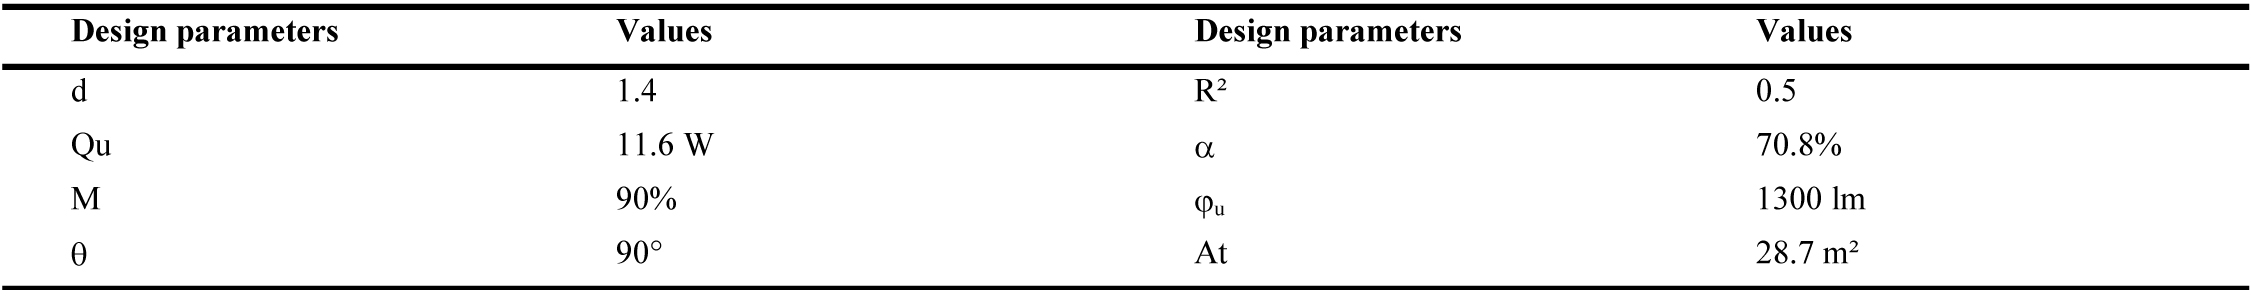
Table 3. Characterization of the design parameters used in the optimization.
Table 4
![Glazing type characteristics [57].](figures/8-204-19.jpg)
Table 4. Glazing type characteristics [57].
3. Case study Presentation
3.1. Building climatic environment
The proposed methodology is implemented for an office building, illustrated in Fig. 6, located in a typical hyper arid Saharan climate in Algeria, in the region of Adrar (southwest Algeria), which is considered as one of the hottest zones in the world. The design of the office building case study is based on the optimum results recommended by previous research works with 10% WWR and a square shape.
Figure 6
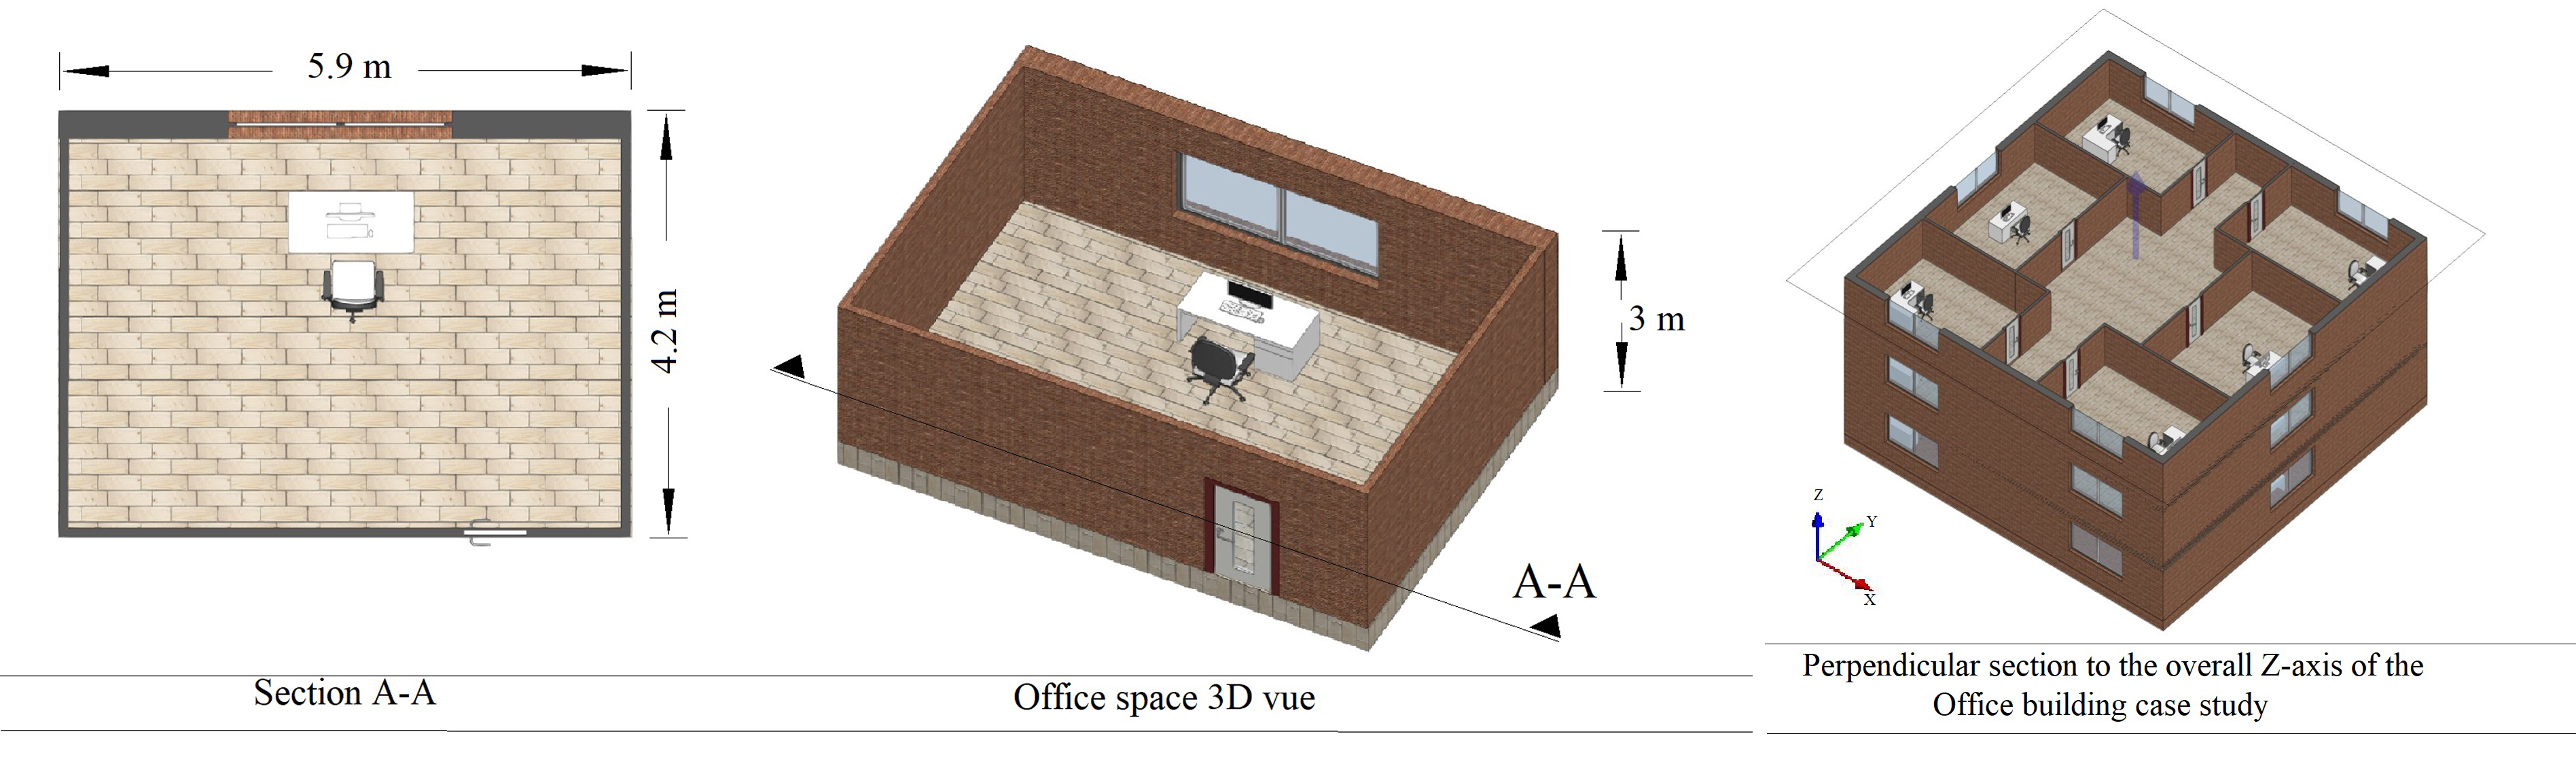
Fig. 6. Characteristics of the office building (case study).
The scenarios of daily temperature variation and global irradiation on a horizontal plane, used in the EnergyPlus environment for ADRAR, are presented in Figs. 7 and 8 and are taken from the international meteorological database Meteonorme. The optimization process is carried out for a typical day of July, as it represents the hottest month of the year (Figs. 7 and 8).
Figure 7
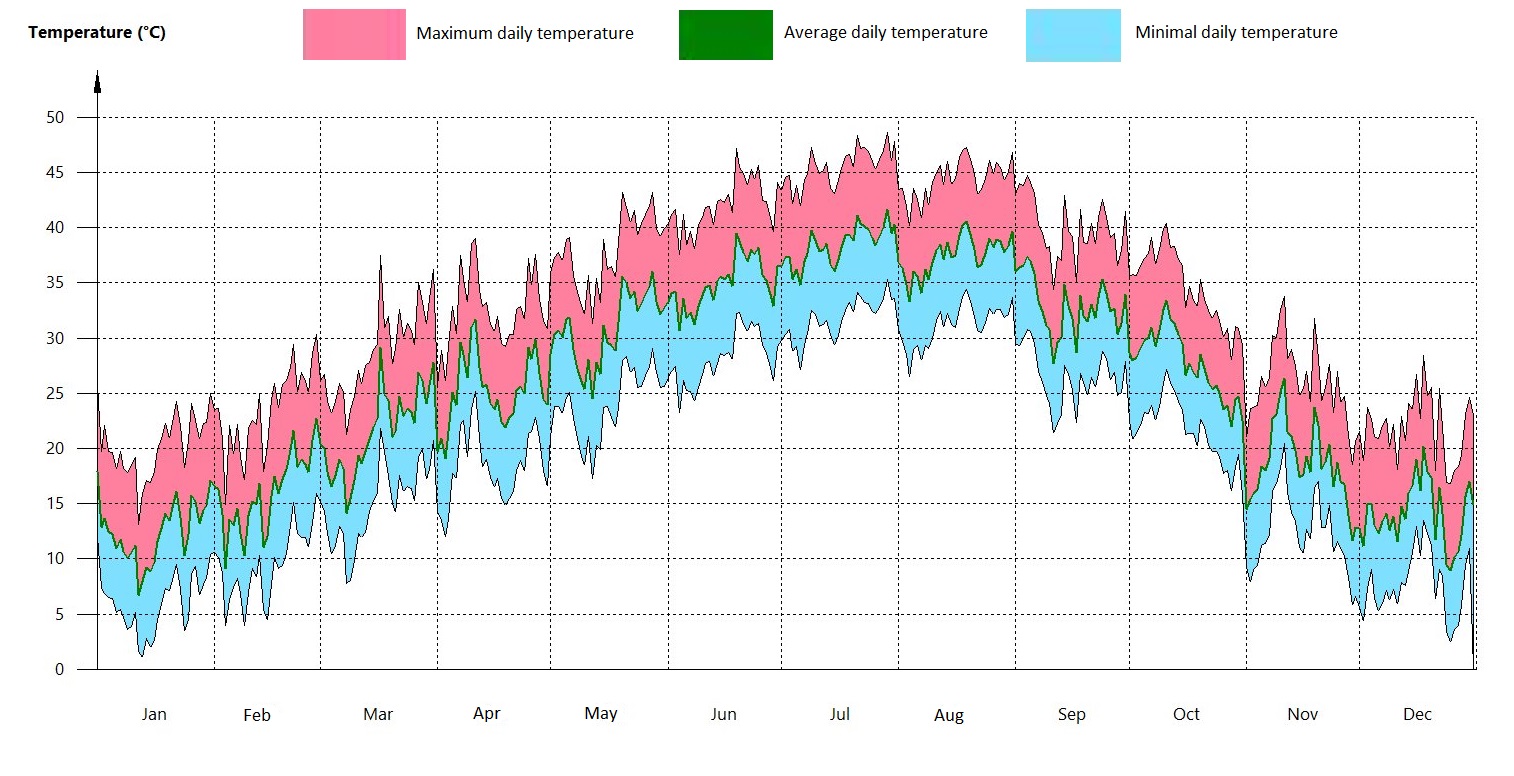
Fig. 7. Scenario of daily temperature variation used in EnergyPlus environment.
Figure 8
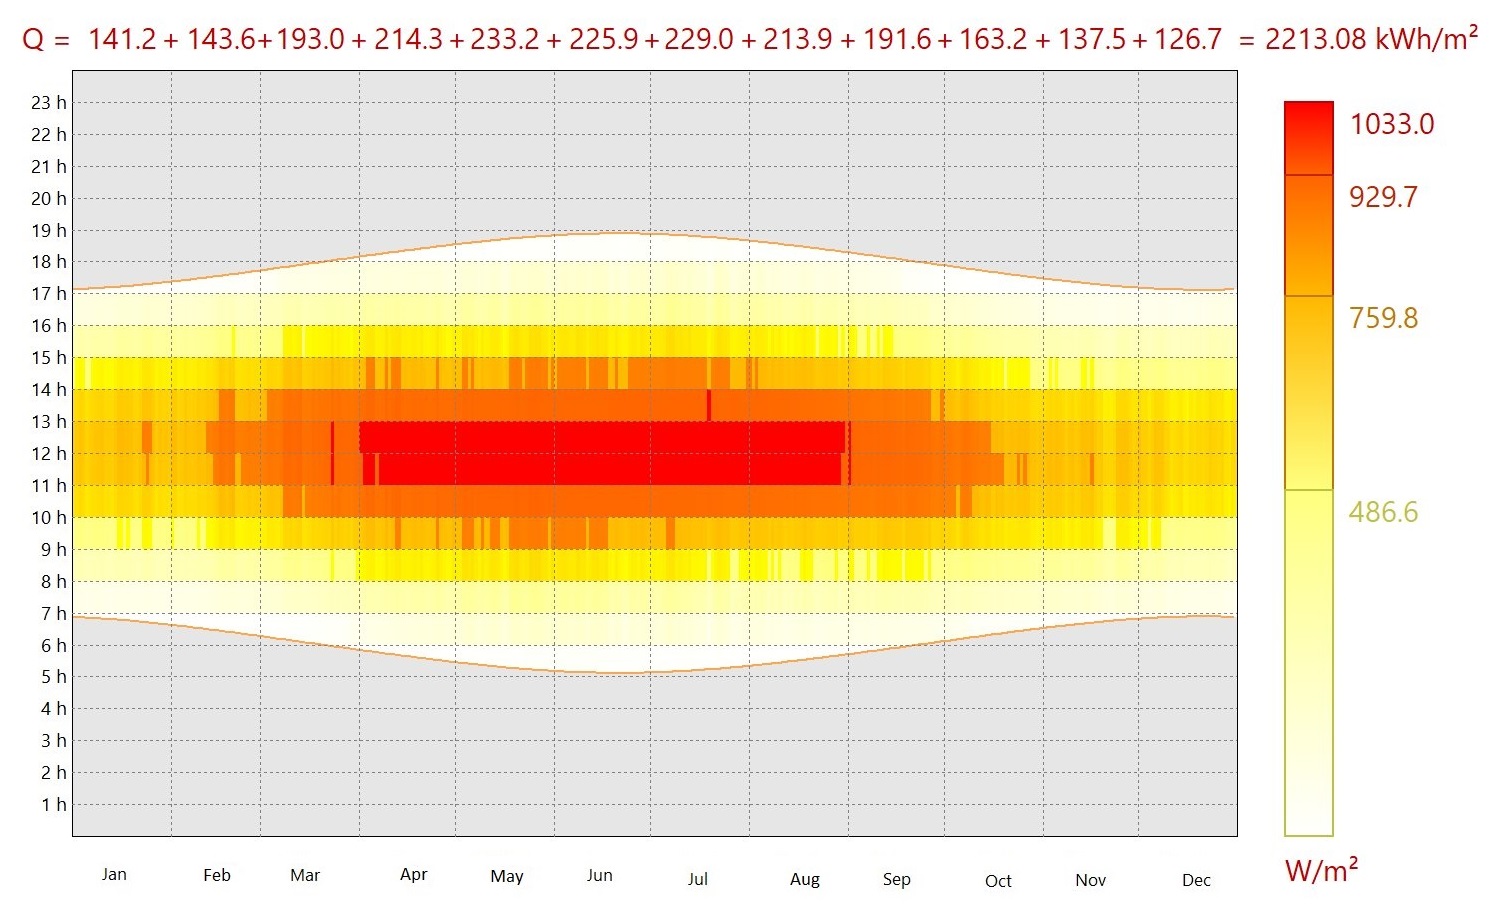
Fig. 8. Scenario of global irradiation on a horizontal plane used in EnergyPlus environment.
3.2. Building climatic environment
To evaluate the annual energy demand of the building, a simulation is performed with EnergyPlus calculation engine. The optimal window sizes are taken into account in the building case study simulation. The optimization with NSGA II genetic algorithm is performed with MATLAB tool, considering clear sky conditions. The optimization results for each orientation and glazing type are presented in Tables 5-10. The energy demand for heating and cooling is then compared to that of the reference building model with a WWR of 10% of single glazing (Fig. 9). The energy demand due to the glazed area expressed as a percentage (%) is also investigated (Fig. 10). To validate the optimized building case study, a dynamic simulation of convective heat transfer is performed using the Simscale tool at 3 p.m for the month of July. The results are shown in Fig. 10.
Figure 9
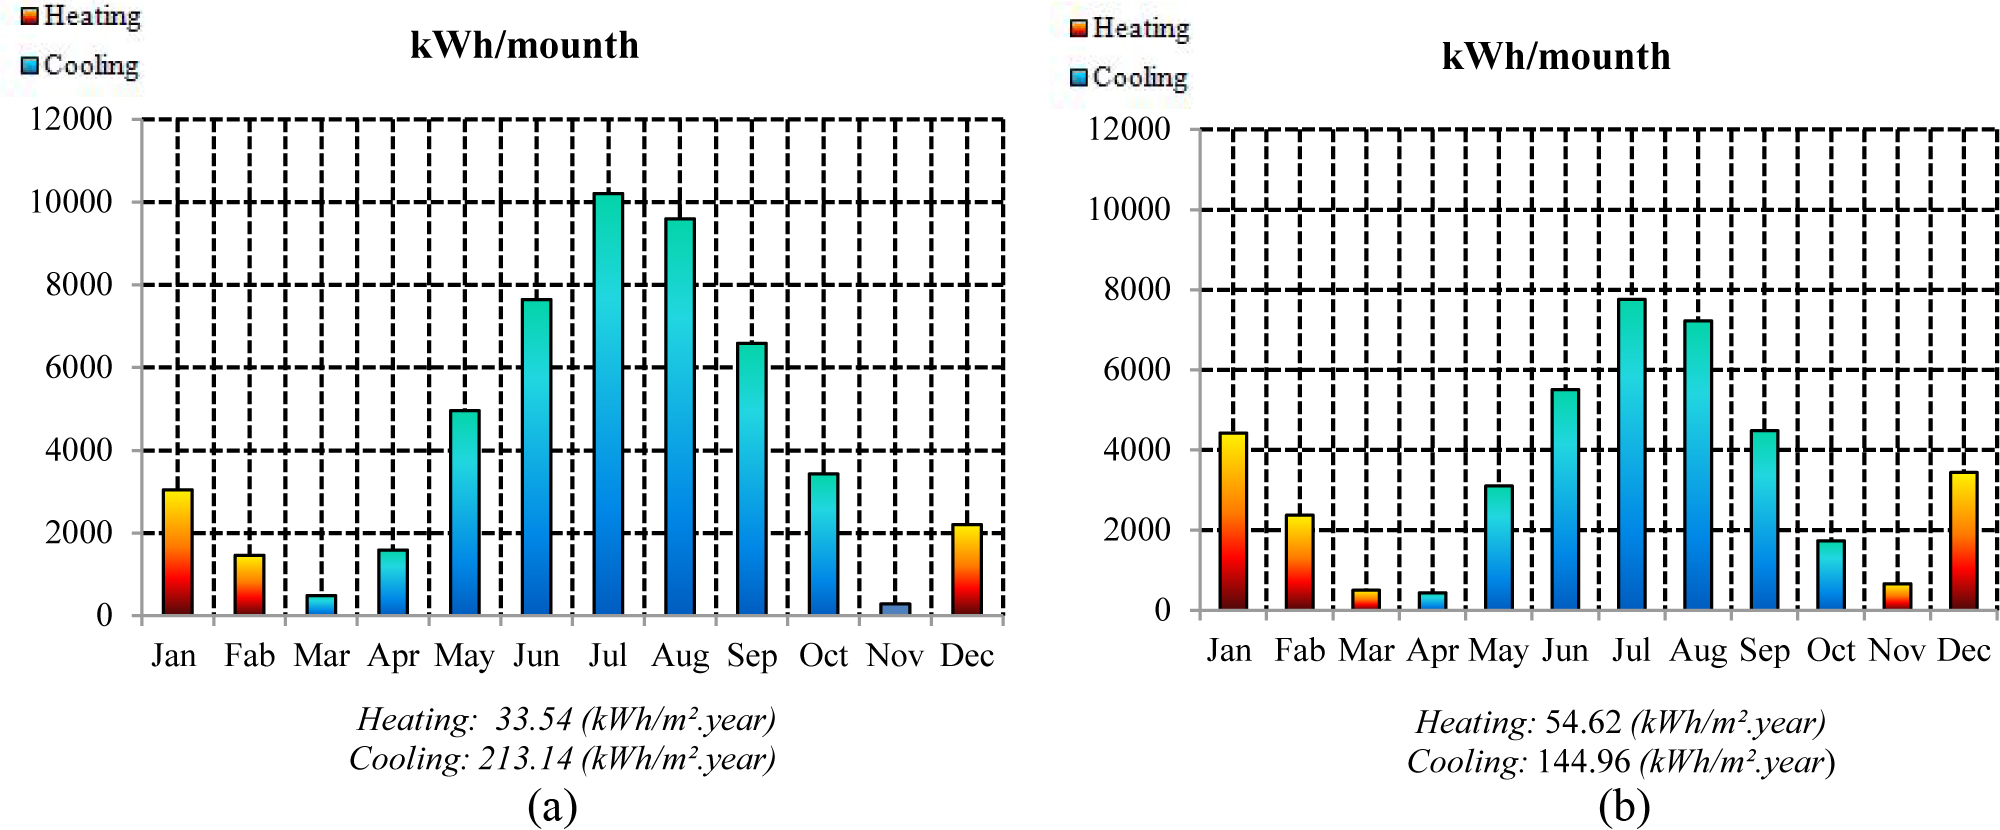
Fig. 9. Energy demand analysis: (a) 10%WWR (glazing type 1); (b) optimum window size (glazing type 4).
Figure 10
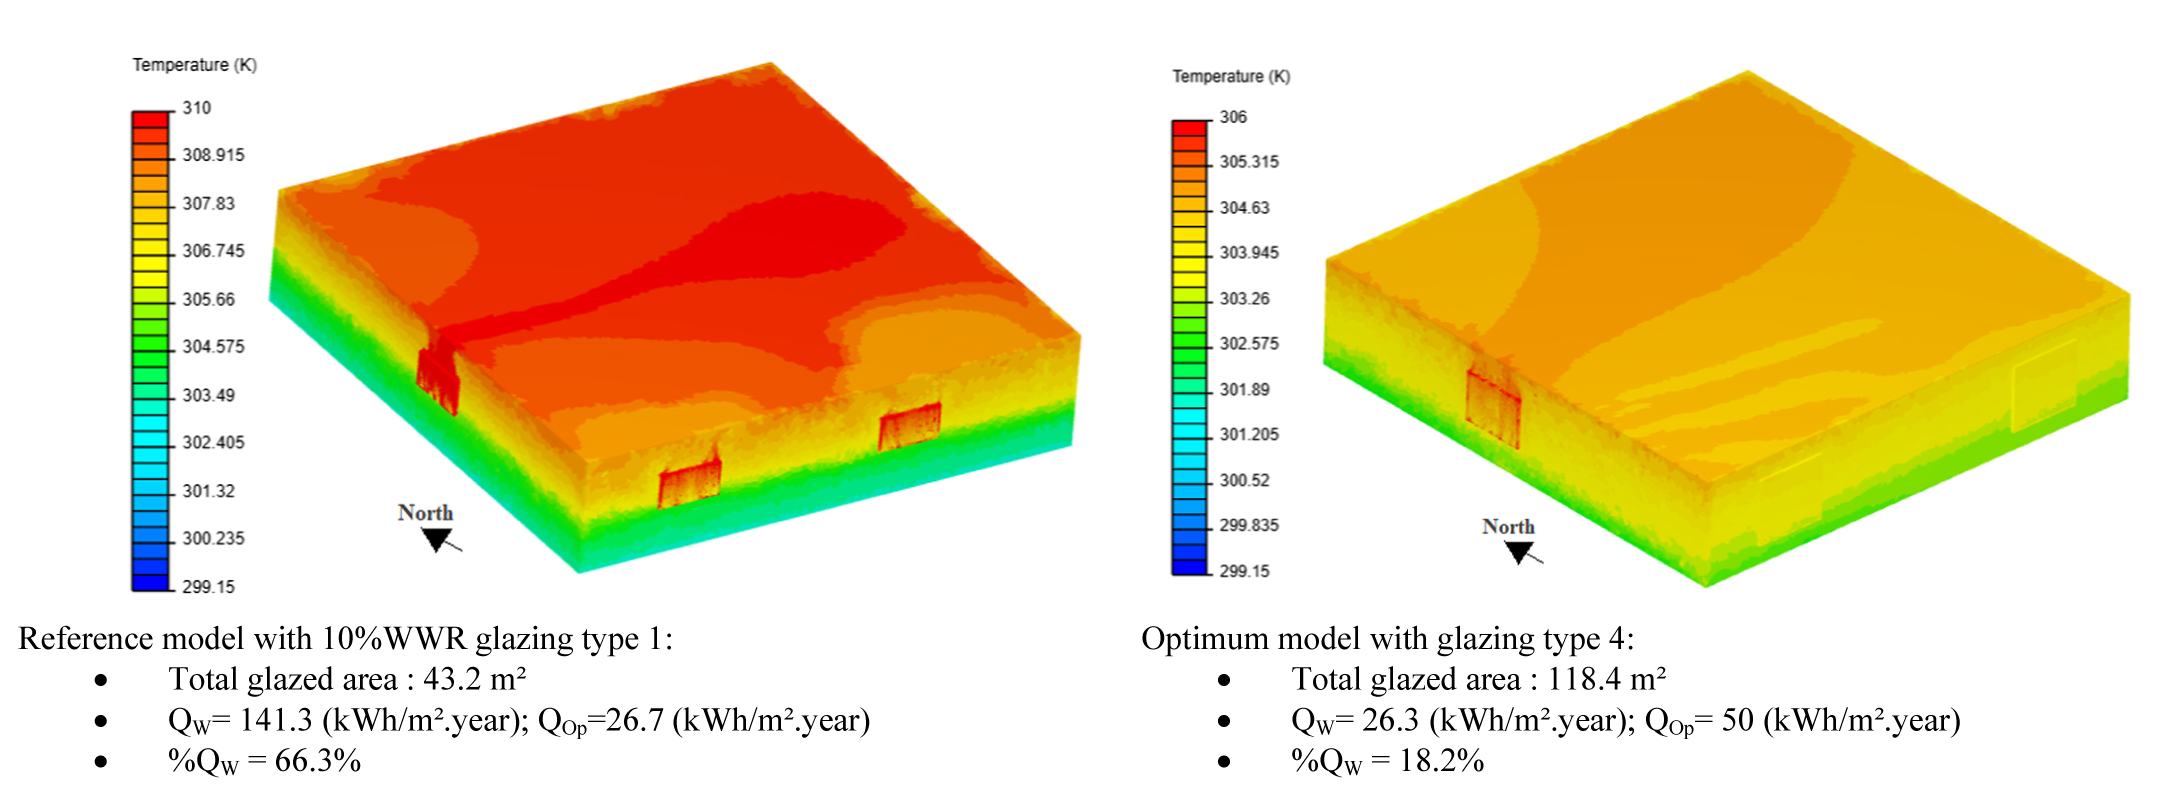
Fig. 10. Convective heat transfer simulation for the tow building models at 3 p.m.
4. Results and discussion of the optimized parameters
4.1. DF result analysis
Tables 5-10 show that the DF value varies for each orientation, glazed area, sky type and glazing type. The result shows two different lighting situations. For an overcast sky, when the DF value increases, the daylight gain Ei through the window increases, as the external illuminance EHT is the same for all orientations. While for a clear sky, when the DF value decreases, the daylight gain Ei increases. Therefore, north orientation presents the highest DF value, as the exterior illuminance EHT is low, and south orientation presents the lowest DF value, as the external illuminance EHT is very high (Fig. 3). The interpretation of the results reveals that daylighting performance with the DF for a clear sky is completely opposite to the case of an overcast sky. As a result, the south direction presents more daylight than the other orientations (as EHT is high) and minimum solar heat gain (as IVT is low) (Fig. 3). This result is in good agreement with those of reference [58] for the southern orientation.
Table 5
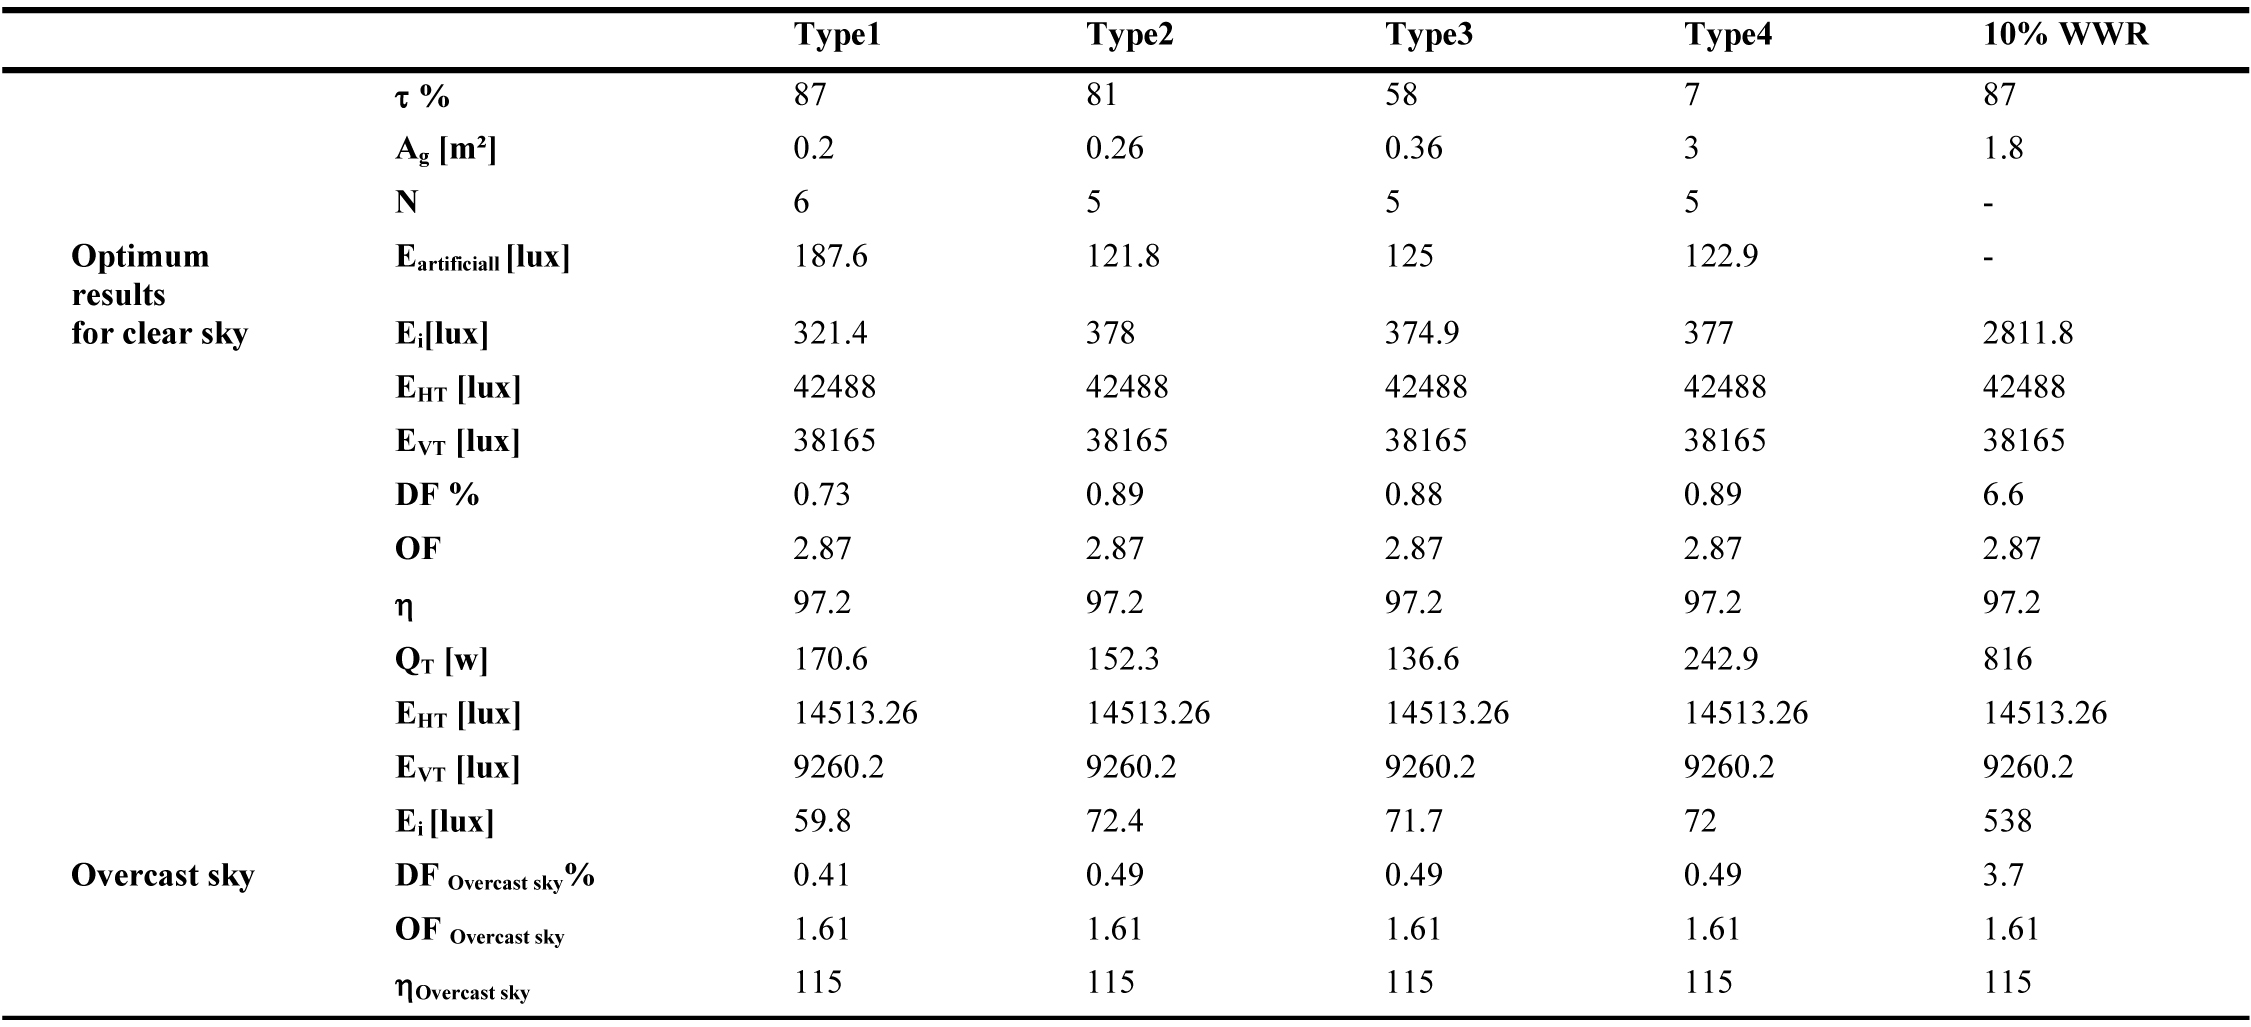
Table 5. Results of the optimization for East direction (Ag is the same for clear and overcast sky).
Table 6
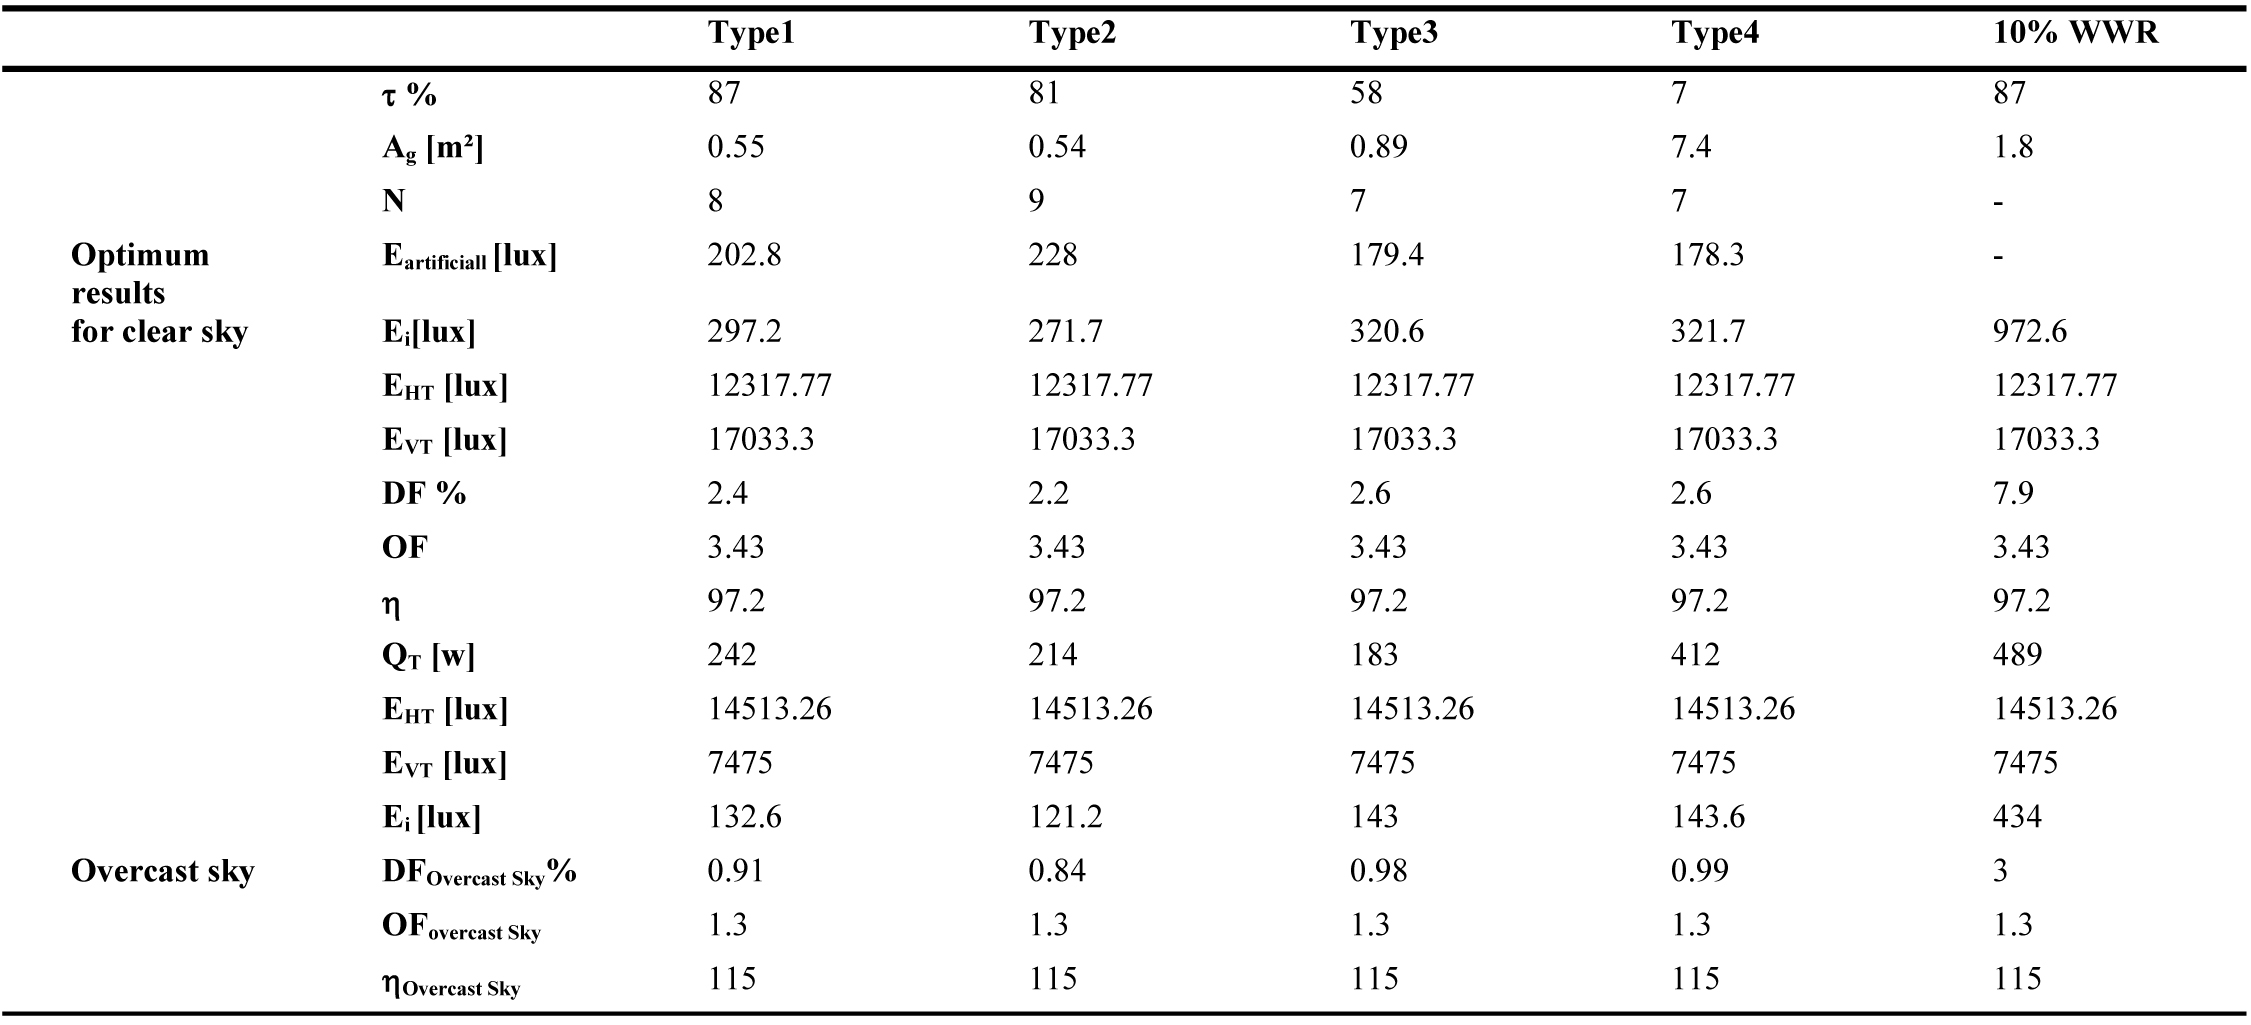
Table 6. Results of the optimization for North direction (Ag is the same for the clear and overcast sky).
Table 7
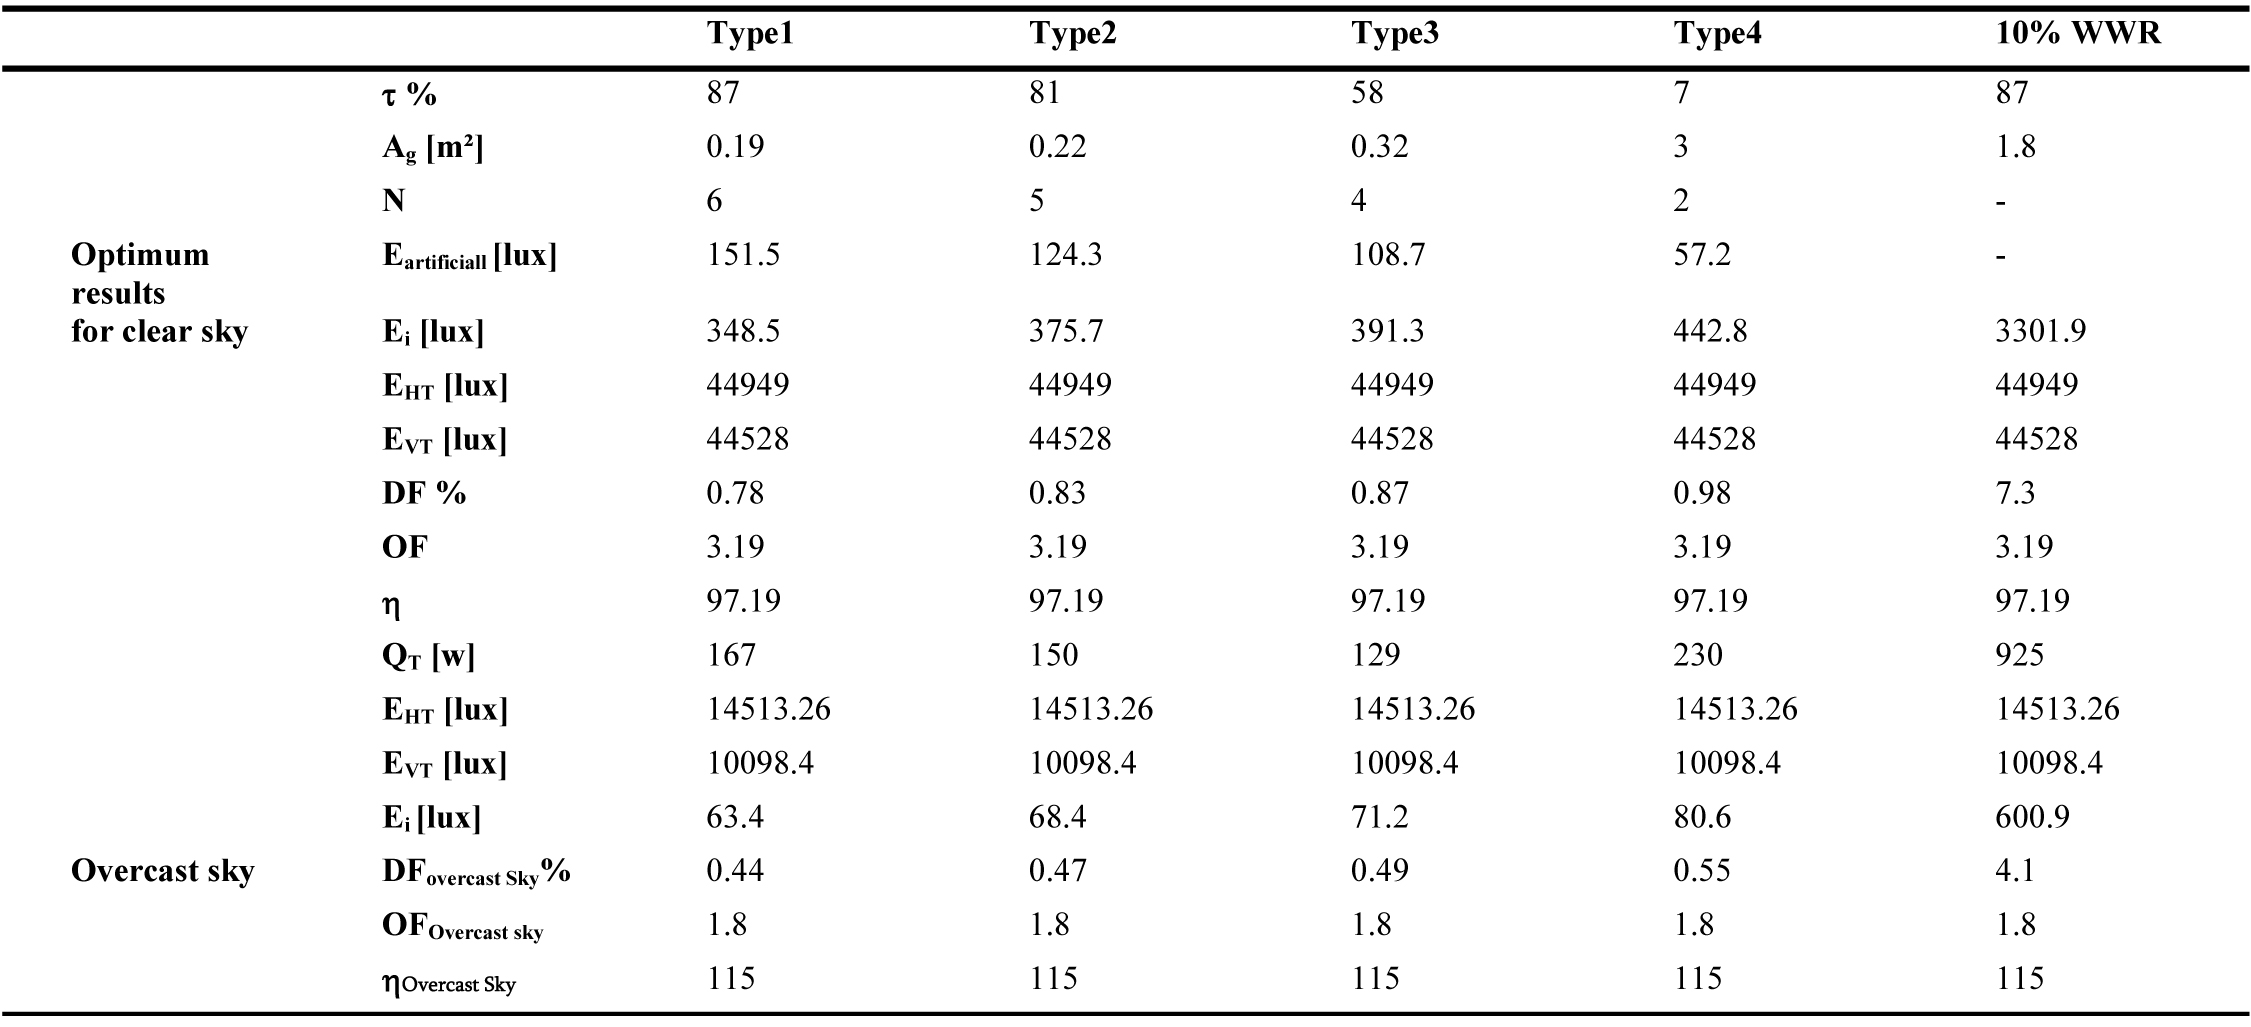
Table 7. Results of the optimization for West direction (Ag is the same for the clear and overcast sky).
Table 8
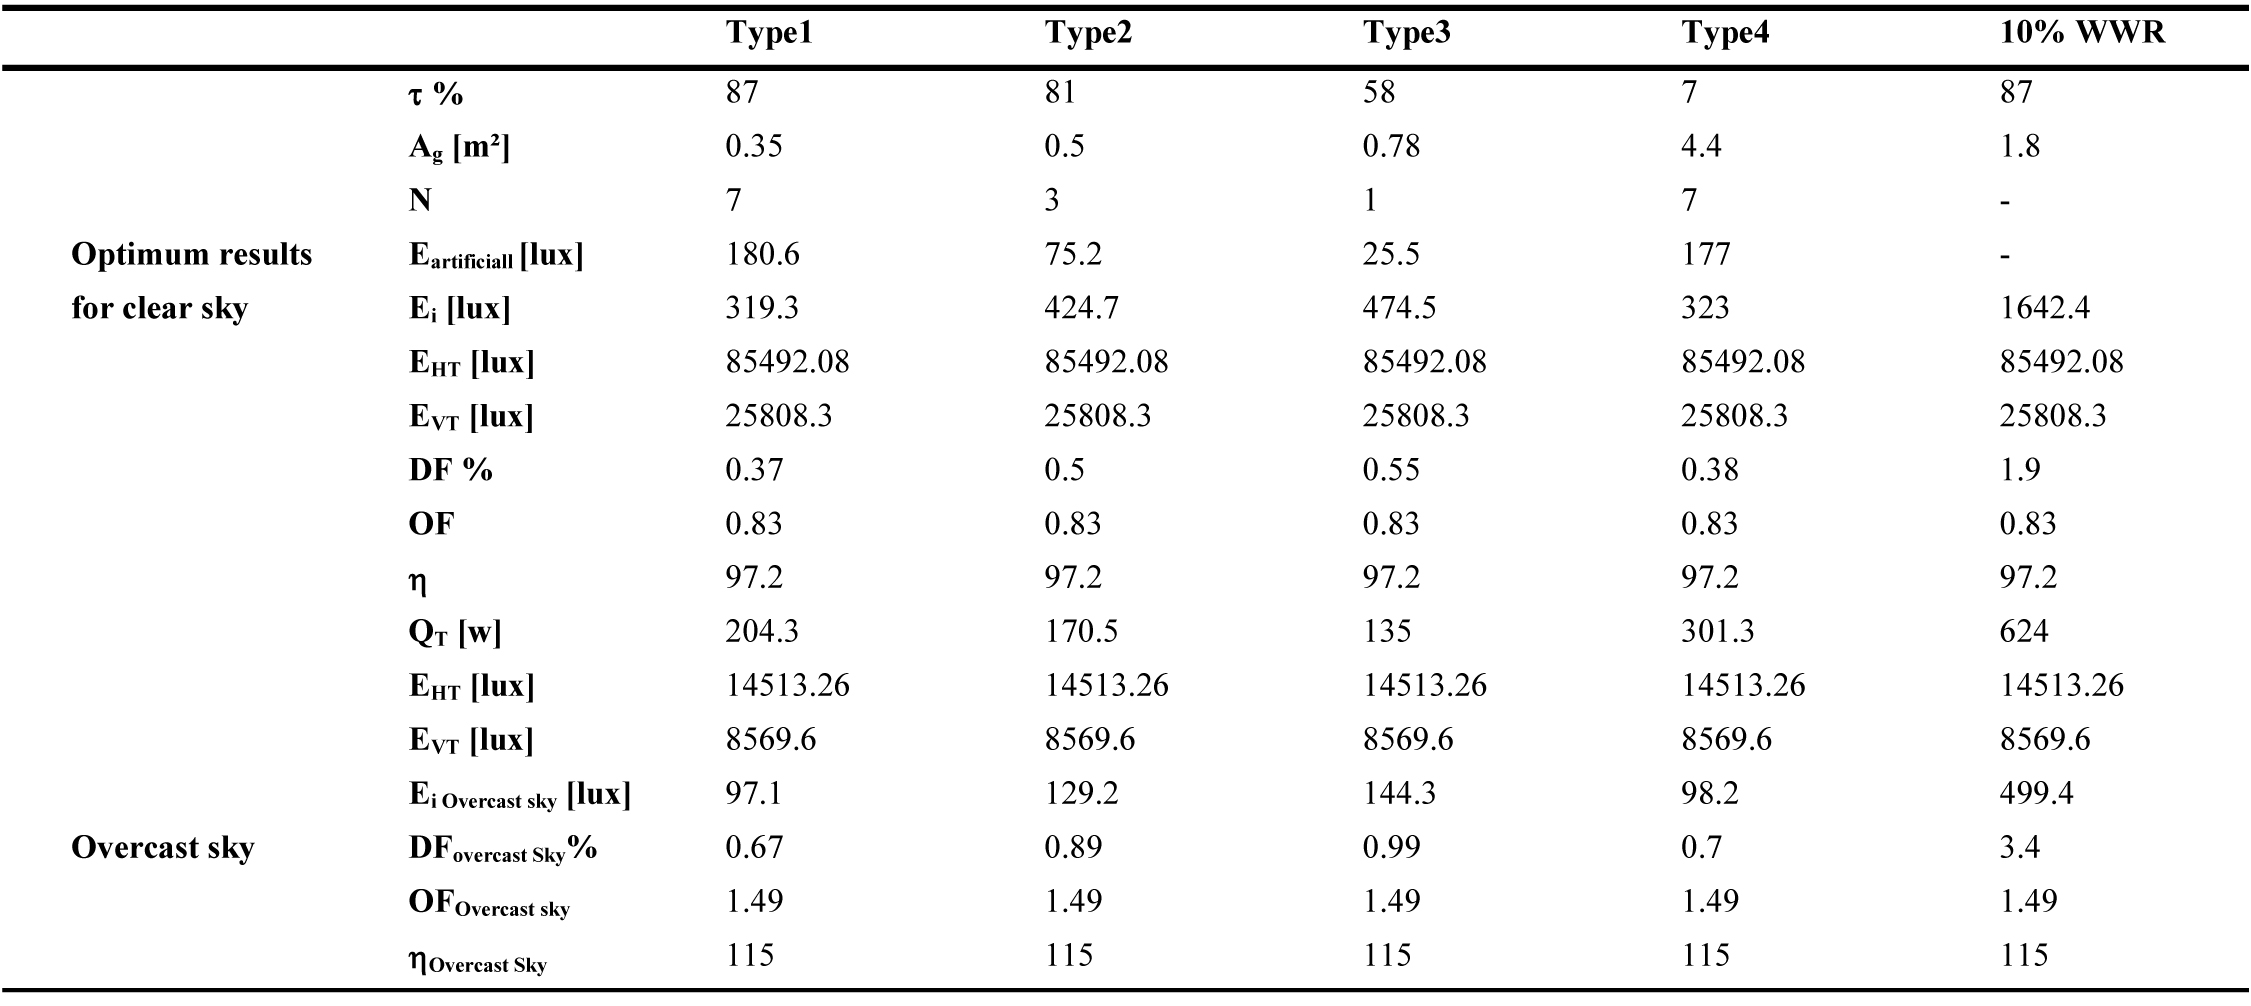
Table 8. Results of the optimization for South direction (Ag is the same for the clear and overcast sky).
Table 9
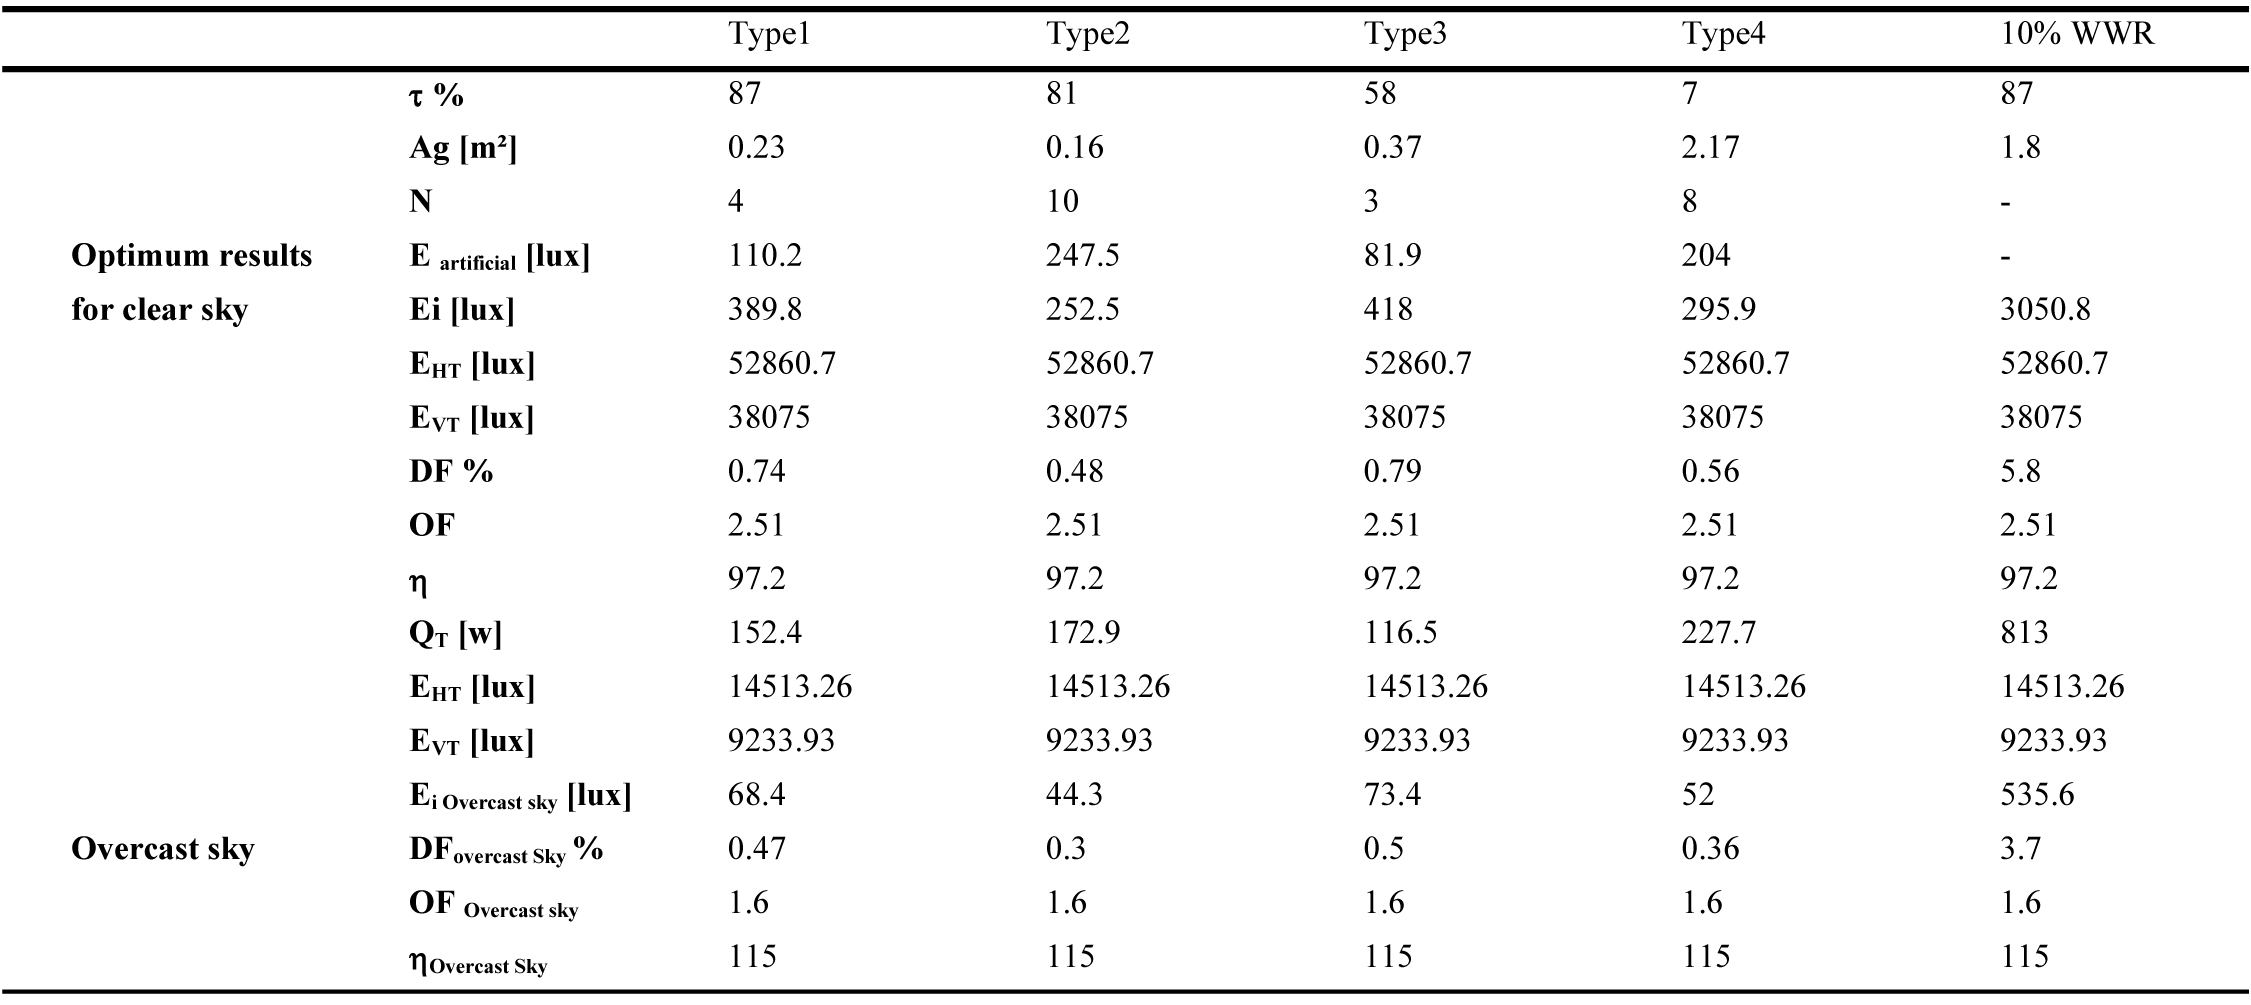
Table 9. Results of the optimization for SEE direction (Ag is the same for the clear and overcast sky).
Table 10
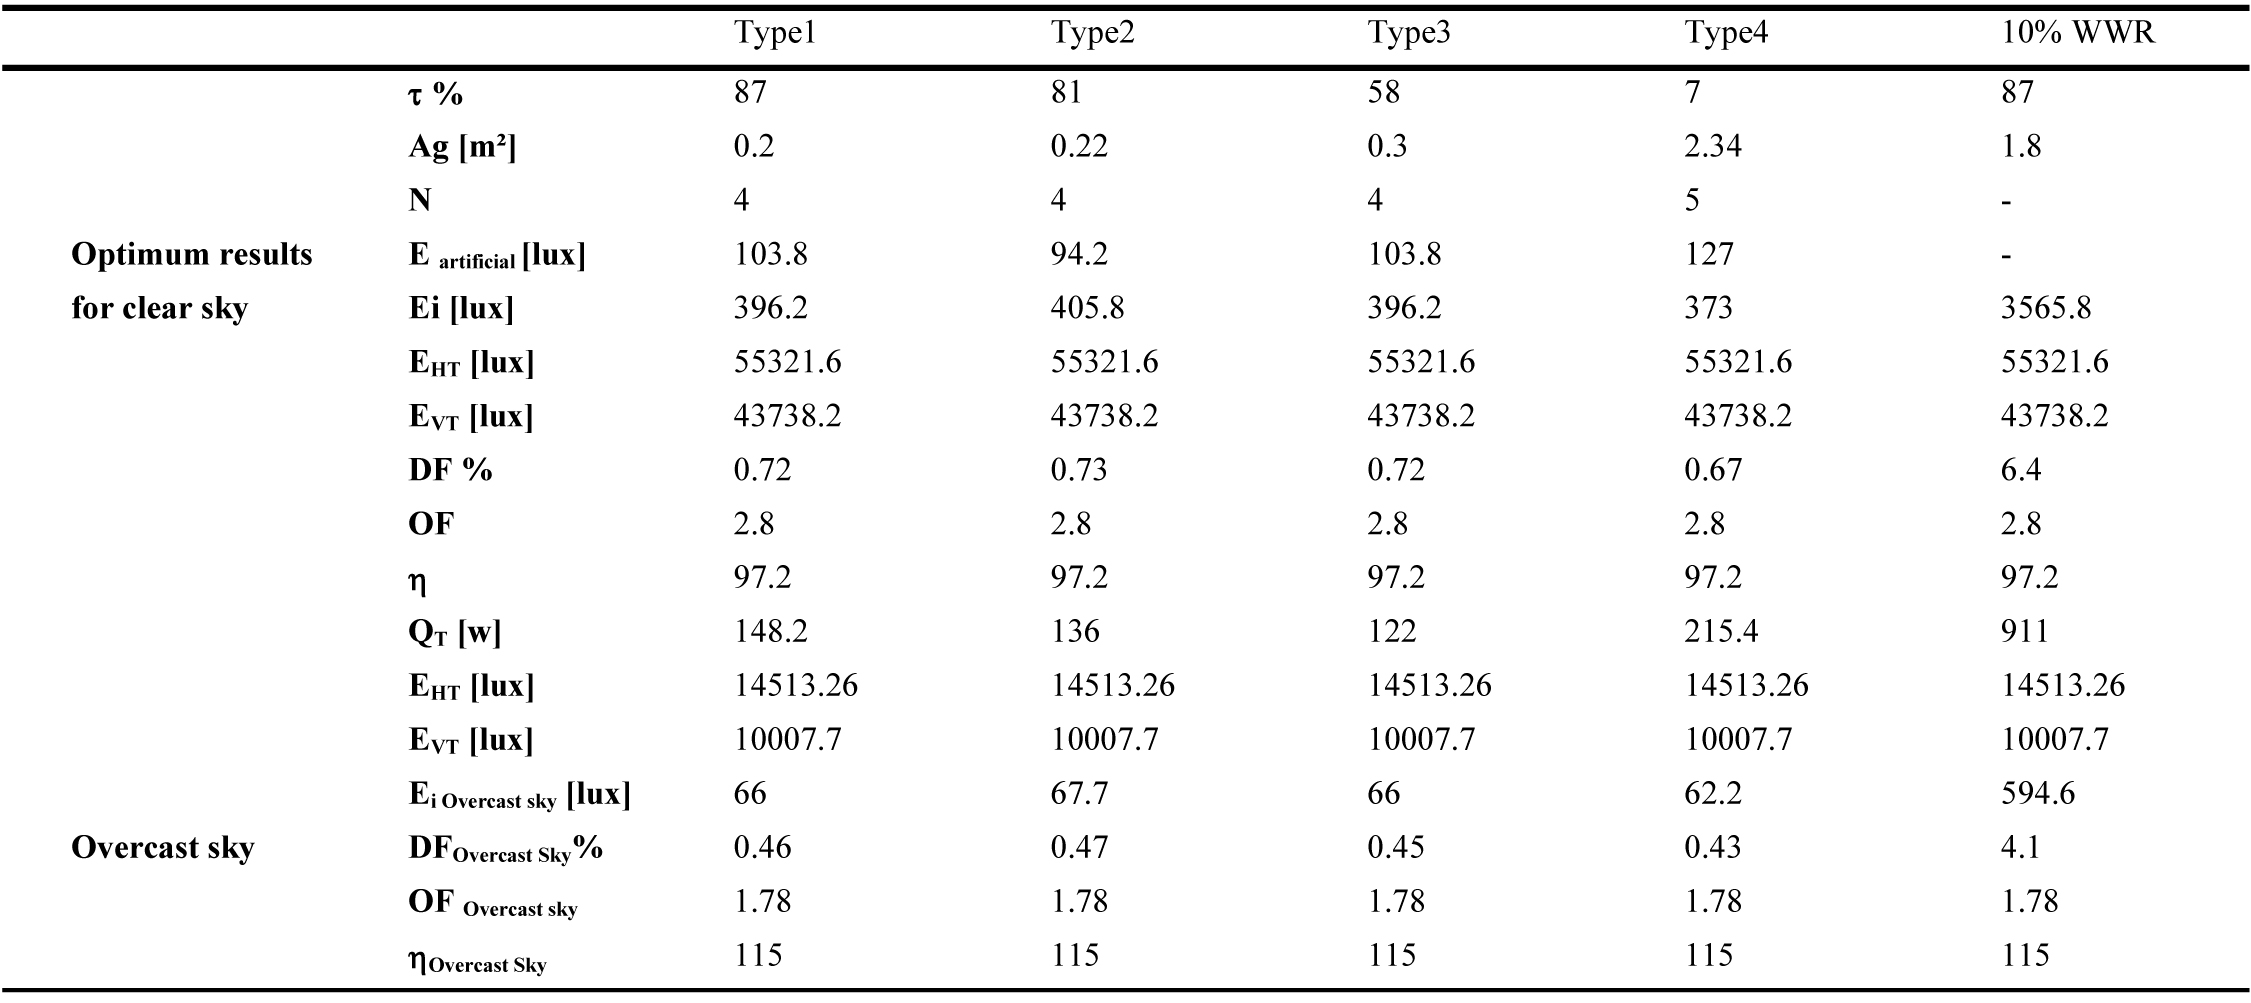
Table 10. Results of the optimization for SEE direction (Ag is the same for the clear and overcast sky).
For an overcast sky, EHT is the same for all orientations. In this case, the value of DF calculated with the standard formula (Eq. (1)), for a fixed glazed area, is the same for all orientations. The impact of the orientation is carried out by the consideration of the external illuminance EVT for the calculation of the orientation factor (OF), which amortizes the value of DF according to daytime and season. This interpretation using the present new approach reveals the impact of sky conditions, direct sunlight and orientation on DF value.
Along the same lines, the Illuminating Engineering Society of North America (IESNA) Lighting Handbook suggests that ‘when an average daylight factor is 5% or greater an interior space will appear to be well lighted. When the average daylight factor is less than 2%, the interior space will seem dimly lighted’ [59]. These recommended DF values are only valid in the case of an overcast sky (direct sunlight excluded). In this case, the internal illuminance level Ei is underestimated. If a clear sky is considered, the same window area could represent excessive daylight. For example, a WWR of 10%, for East direction, presents a DF of 3.7% for an overcast sky condition with an internal illuminance Ei of 538lux (Table 5). If clear sky is considered, DF value changes to 6.6% with an internal illuminance of 2811.8 lux (Table 5), which could cause overheating and over lighting problems. This optimization approach shows that the daylighting performance of a window must be related to its energy performance in order to find the best compromise that provides thermal and visual comfort. To do so, clear sky conditions should be considered. As a result, the present methodology can be applied to determine the optimum window size for any space and the potential for energy savings in any city worldwide as the DF enhanced model is expressed according to building orientation, solar altitude (building location) and sky type.
4.2. Window size and QT
Tables 5-10 show the obtained optimum window sizes (Ag) and luminaires number (N) that give minimum energy demand (QT). The results show that the optimum window size increases when the visible transmittance (t) of the glazing decreases.
From an energetic point of view, a 10% WWR, recommended by Alwetaishi [8] and Muhaisen et al. [20], ensures the required level of indoor lighting without the need for additional artificial lighting. Nevertheless, it represents higher energy demand with excessive daylight entry, compared to a reduced glazed area for the same type of glazing with additional artificial lighting. For the east direction, for example, 10% WWR (1.8 m²) of glazing type 1 presents an energy demand of 816W (Table 5), while for the same glazing type, the optimal result presents a glazed area of 0.2m² with 6 luminaires and energy demand of 170.6W (Table 5). To increase the size of the glazed area, while guaranteeing minimum energy demand and the required internal illuminance level, several glazing types are considered. From the results of Tables 5-10, glazing type 4 seems to be the most adequate as it presents the largest glazed area due to its low luminous transmission (7%). This result is in accordance with the results of reference [60], the single glazing has the smallest optimal glazed area as it has a high heat transmission coefficient, visible transmittance and solar factor, which causes additional cooling and heating loads. This is crucial as a large window size has a positive impact on occupants. Peoples like to be able to see out of the building. A window allows one to stay in touch with the changing weather and time of the day. It offers a visual rest center, enabling eye muscles to relax on a relatively distant point [61]. As a result, the use of glazing type 4 with optimum size is highly recommended in hot and dry climate instead of 10% WWR of single glazing.
Orientation also has an impact on optimum window sizes. It increases when solar radiation decreases. As a result, north orientation presents the largest window sizes, as the direct solar radiation is excluded. On the other hand, the external horizontal radiation is lower in the south orientation (Fig. 3). Thus, the optimum results for south orientation give minimum energy demand.
4.3. Energy demand analysis
To evaluate the annual energy demand of the building case study, a simulation is carried out using EnergyPlus. The optimal window sizes relative to glazing type 4 are therefore considered in the building case study. The energy demand for heating and cooling is compared with that of the same building with 10% WWR of single glazing [8] (Fig. 9). The percentage of energy demand due to the glazed area (%QW) over the total energy demand is also investigated. To validate the optimized building case study, a dynamic convective heat transfer simulation is carried out using Simscale at 3p.m (Fig. 10).
From Fig. 9, the cooling period is longer than heating period. This is quite obvious for a hot and dry climate as a long summer characterizes this climate with a higher external temperature and solar radiation. In both cases, cooling demand is greater than heating demand. Nevertheless, the cooling period is longer for the building with 10%WWR. This is due to the use of single glazing which leads to higher solar heat gains, as it has a high solar factor of 83%, which increases the inside temperature (Fig. 10). This is interesting in the heating season as solar heat gains reduce heating demand, since it accounts as free energy. For example, for March and April, with single glazing, cooling demand is higher compared to high-performance glazing type 4, because the transmission of solar heat gain is stopped by the high performance glazing as it has a low solar factor (8%). In this case, 10%WWR of single glazing, recommended by Alwetaishi [8], presents 66.3% of total building energy demand (Fig. 10). On the other hand, the total building energy demand presents 18.2% for glazing type 4. Therefore, heating demands decrease when single glazing is used as shown in Fig. 10. These results are in good agreement with those obtained by reference [62] under the same environmental conditions of hot and dry climate. As a result, the use of high performance glazing (glazing type4) with optimum window size is recommended for hot and dry climates in order to reduce cooling demands. A single glazing type is not suitable for hot and dry climates as it leads to high solar heat gain.
Figure 10, shows a convective heat transfer simulation at 3p.m for the two building models, with temperature variation inside a typical floor of the building case study, carried out using Simscale tool. The consideration of 10% WWR with a single glazing type causes excessive heat gains compared to the use of high performance glazing with optimized surfaces, as single glazing has a high transmission coefficient and solar factor, which increases the office ambient temperature. It shows minimum heat gains for north, east and south orientation and maximum heat gain for west orientation, because of solar radiation which plays an important role in increasing the internal room temperature. As a result, the optimum building model shows a considerable reduction of 32% in cooling demand while ensuring a large glazed area of 118.4m² compared to 10%WWR which corresponds to 43m² (Fig. 10) for the whole office building.
4.4. Analysis related to the shape and orientation of the building
The orientation of the glazed area is impacted by building shape and orientation. The square shape offers minimum possibilities for windows orientation (the 4 cardinal directions). East and west orientations cannot be avoided if the building is oriented north. As shown in the previous subsection, west orientation presents maximum heat gain than the other orientations, as the angle of incidence becomes parallel to the normal of the glazed area at 3 p.m, which produces maximum solar heat gain and therefore overheating and glare problems. To improve the result of the optimization (Tables 5-10), the shape of the building is changed to a hexagonal shape as shown in Figs. 11 and 12. This shape allows avoiding the two critical orientations east and west while favoring the north and south orientation for minimum solar heat gains. Besides, this shape is more compact than the square shape for the same volume, which reduces heat exchange through the external wall. With this configuration, cooling demand is reduced to 111.8 (Kwh/m².year) (Fig. 11). The reduction in cooling demand goes from 32% to 48% with a total glazed area of 112 m², which is higher than the 10% WWR (43 m²) and the window is responsible for 22.5% of total energy demand (Fig. 12) compared to 10%WWR which represents 66.5%.
Figure 11
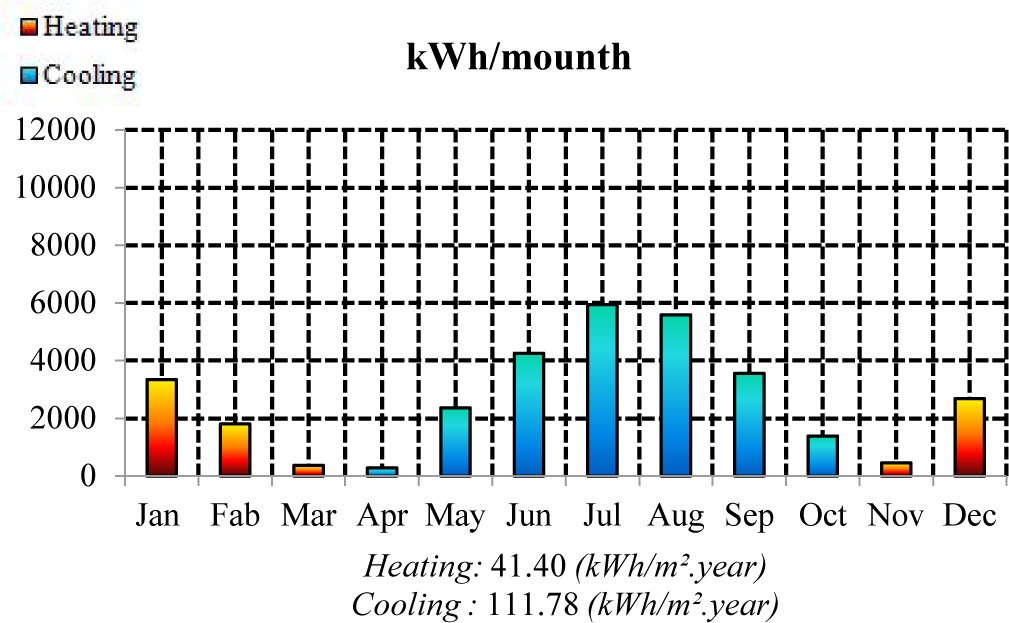
Fig. 11. Energy demand analysis for the optimum building using optimum window sizes of glazing type 4.
Figure 12
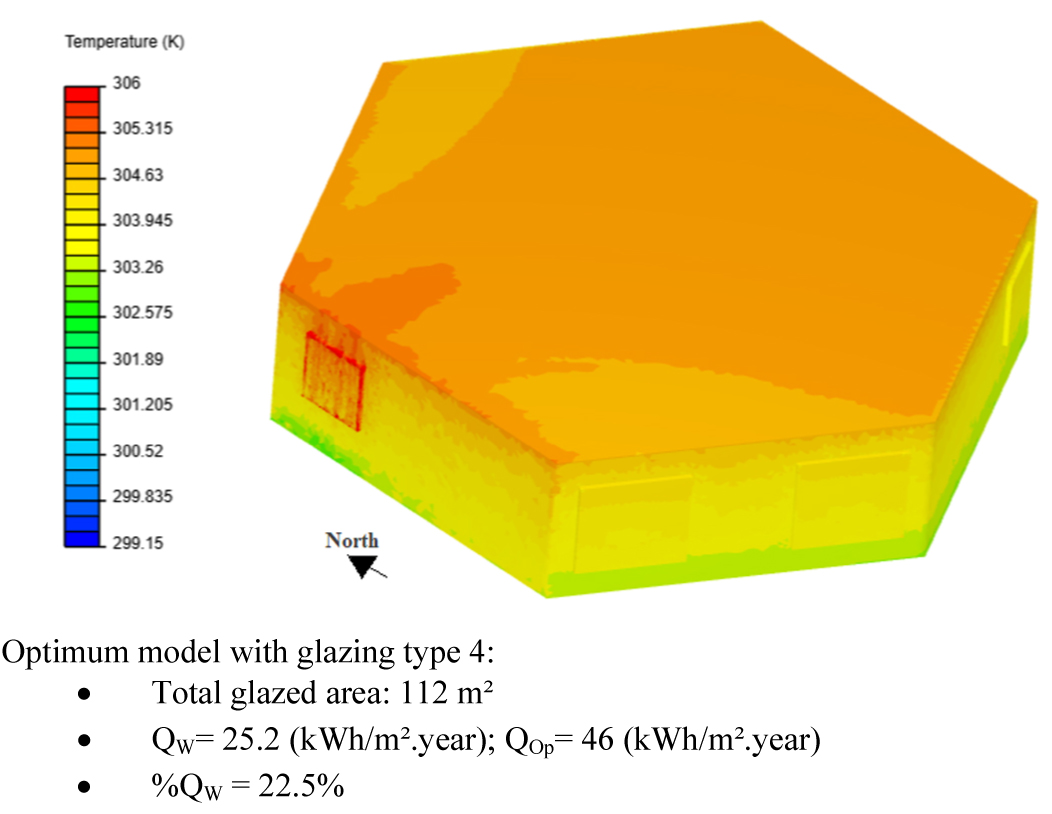
Fig. 12. Convective heat transfer simulation at 3 p.m for the optimum building model.
4.5. Environmental and economic impact of the optimum building envelope
The impact of the HVAC system and the artificial lighting installation on building energy consumption is considered in this section. For air conditioning, the chosen HVAC system is a basic Rooftop unit with air ducts (Fig. 13). The outcomes in terms of cost and CO2 emissions are compared in Table 11, Figs. 14 and 15. As the complementary artificial lighting installation of the optimum building model (Tables 5-10), affects the energy consumption of the building, the Lighting Energy Numeric Indicator LENI [63] is calculated and combined with the energy consumption of the HVAC system, to estimate the total energy consumption per year for the optimum building model.
Figure 13
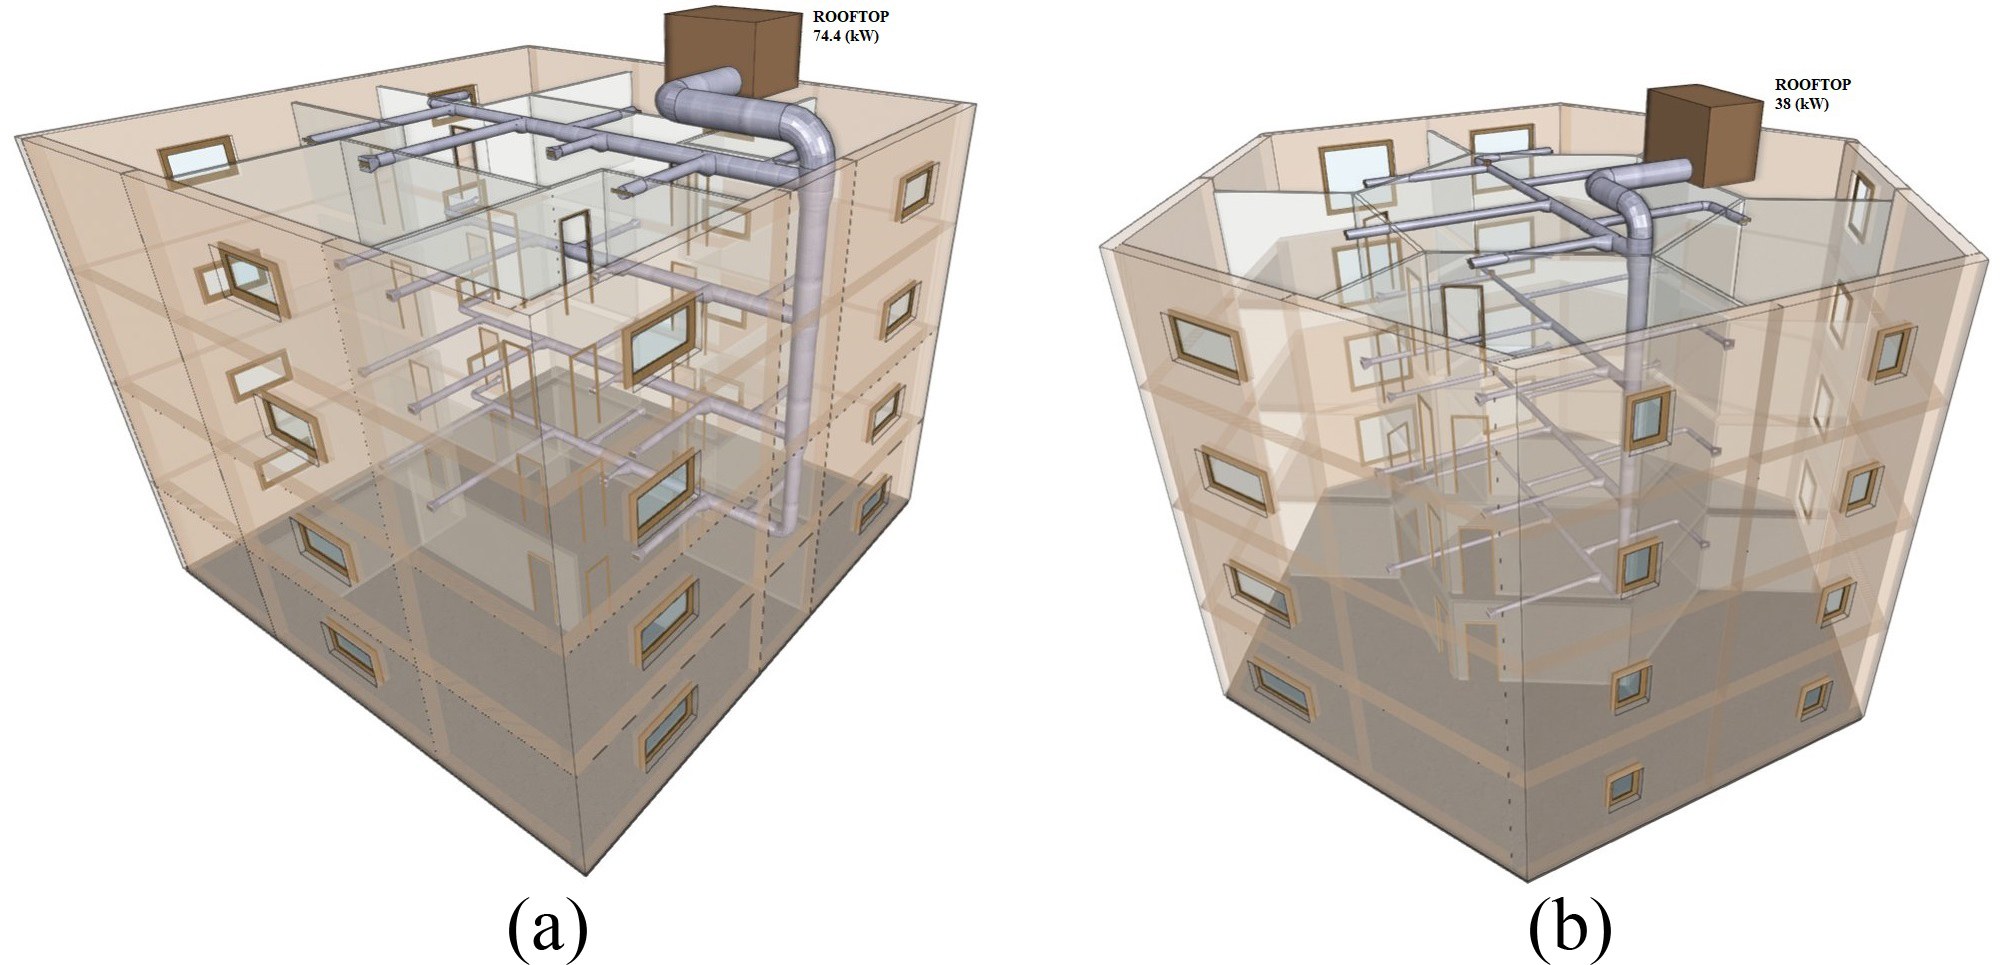
Fig. 13. (a) 3D views of the HVAC system for the reference building model with 10% WWR (b) and the optimum building model.
Table 11
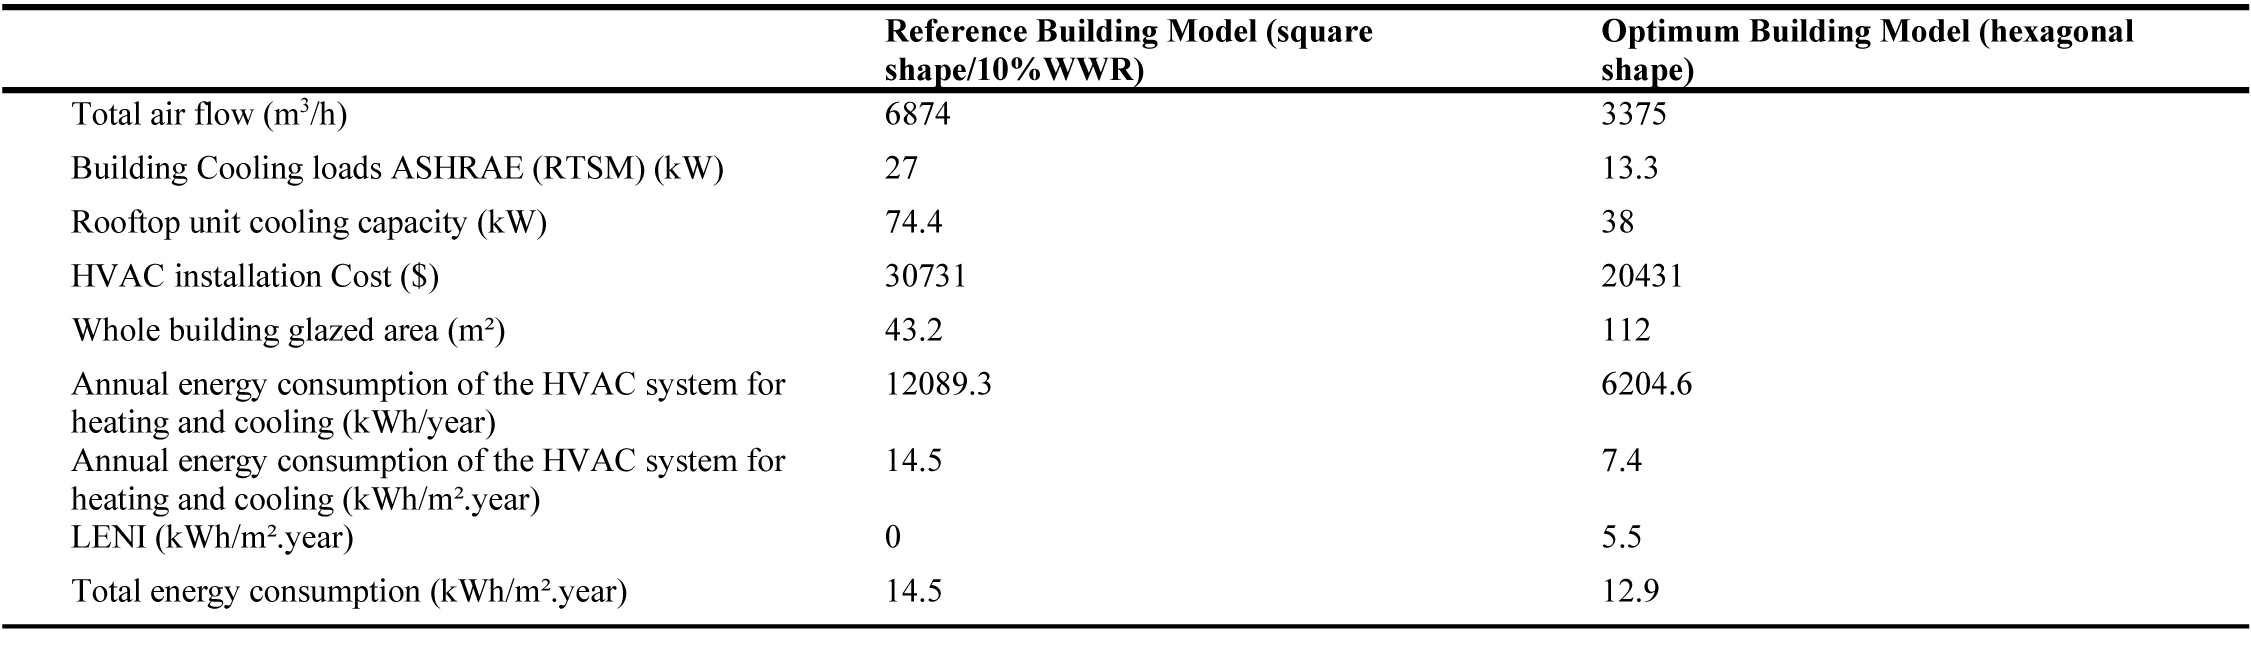
Table 11. Building performance analysis.
Figure 14
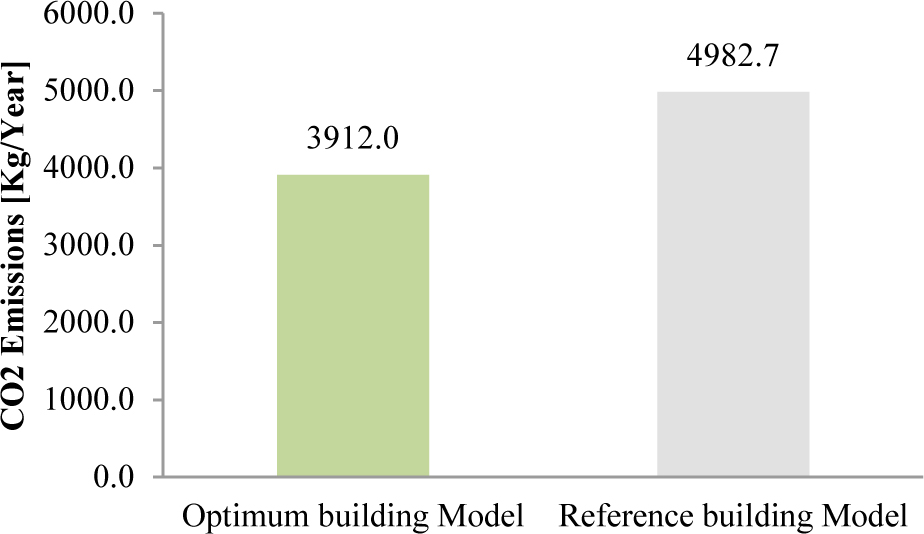
Fig. 14. CO2 emissions of the two building models.
Figure 15
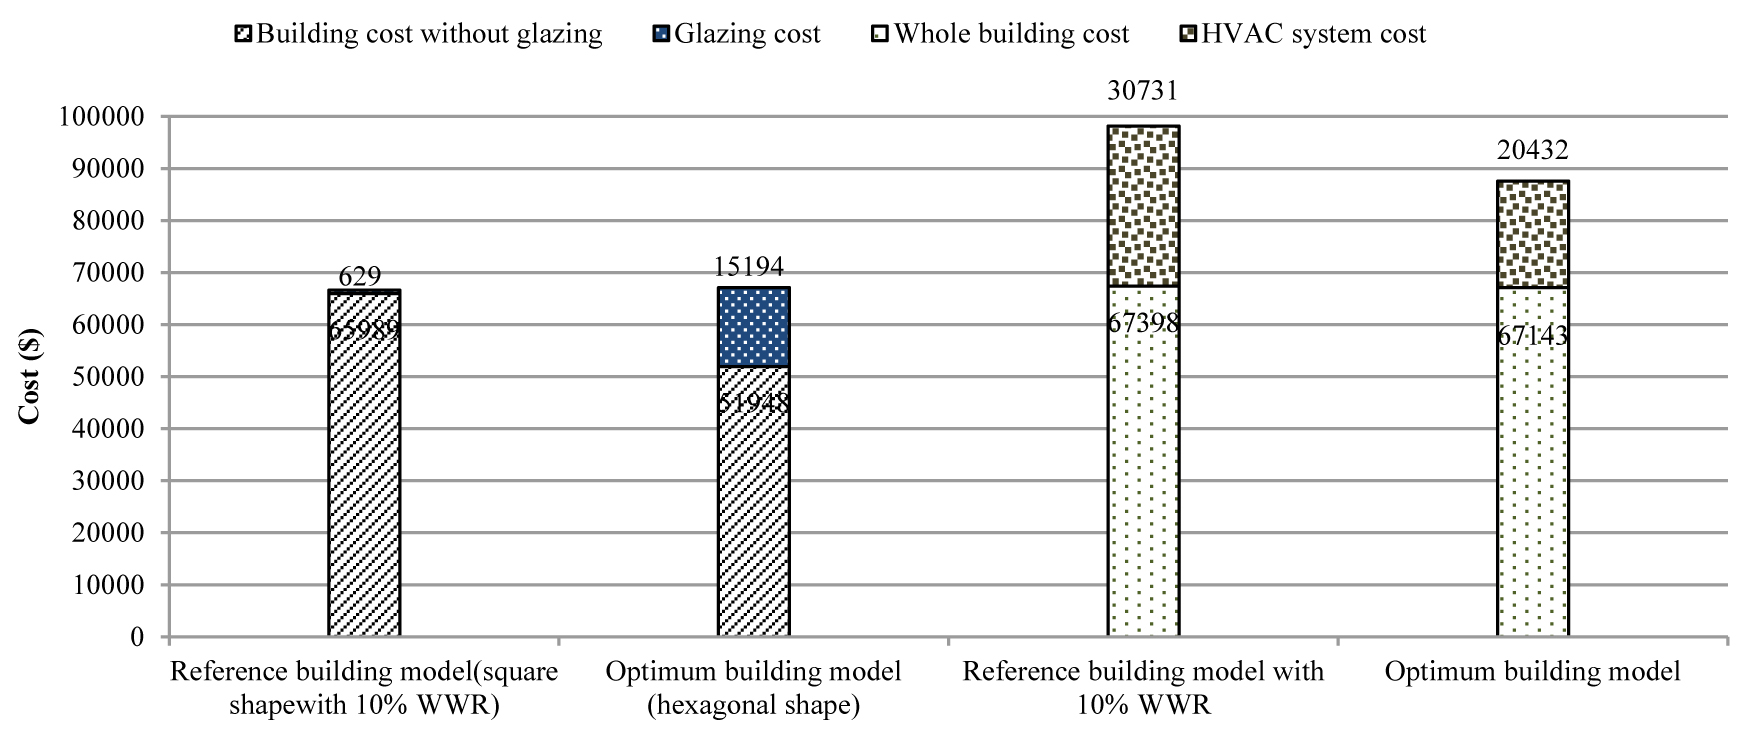
Fig. 15. Economic impact of the reference building model with 10%WWR and the optimum building model.
The cost of the HVAC system installation is also analyzed using the Cost Generator, which is an international database developed by CYPE according to market for several countries [11]. In the present work, generic prices are considered. These are an average cost values obtained considering different countries markets prices. CO2 emissions are calculated considering the fossil CO2 emission factor and fossil fired power plants (Natural gas) [64,65].
From Table 11 and Fig. 13, the optimum building model shows several advantages compared to the building model with 10% WWR. As the building envelope is optimized, cooling loads are reduced by 50%. This has an impact on the size of the air ducts (Fig. 13), and the supply airflow rate which is reduced by 51%, as well as the cooling capacity of the HVAC system and its cost, which is reduced by 33.5%. Regarding the energy consumption, the optimum building model presents minimum total energy consumption of 12.9 (kWh/m².year) including the artificial lighting installation, compared to the reference building model with 10%WWR where the energy consumption is 14.5 (kWh/m².year).Therefore, CO2 emissions resulted from the total energy consumption (Table 11)are also reduced by 21.5%, as depicted in Fig. 14.
Figure 15 shows that the optimum building model is more economical, not only in terms of energy consumption but also in construction as it has a more compact shape (Hexagonal shape), which in turn leads to a reduction in the amount of building materials. It should be pointed out that even the optimum building model has a large glazed area with high performance glazing, which is very expensive than single glazing (Single glazing: 16 $/m²; Glazing type 4: 137 $/m²) [11], the optimum building model shows significant benefits than the reference building model with a recommended window size of 10%WWR [8,20] and a square shape [47,48],because the consideration of a high performance glazing with optimized size and a compact building shape with optimum orientation, contributes to the reduction of cooling and heating loads and therefore to the reduction on the size of the HVAC system, air ducts and energy consumption. These results are in good agreement with those obtained by reference [14] under the same environmental conditions of hot and dry climate of Morocco using a high performance gazing type.
As a result, the consideration of the cumulative cost of the whole building with the HVAC system led to say that the optimum building model presents maximum economic benefits with a minimum of energy demand (with a reduction of 48%) and a larger glazed area of 112 m² for optimum occupants comfort.
5. Conclusion
The daylight factor proposed in this research work depends on an integral approach of design that takes into account various parameters such as building location, time of year, sky conditions, room dimension, window size, glazing type, wall reflectance, maintenance factor, orientation and daytime. This is achieved through the integration of various indicators as the Orientation Factor (OF), Cloud amount factor (CF) and luminous efficacy (h), which were experimentally validated by previous research works and developed for use in daylighting studies. The obtained DF model is therefore generalizable, accurate and simple to use for daylight prediction for all geographic locations of buildings.
In this work, daylight is considered as an important parameter in energy efficient design, as it complements electrical lighting during the day. This property is taken into consideration for the optimization of the window size, based on the compromise between thermal and visual comfort. The optimal result presents the best configuration of natural lighting (from the glazed area) and artificial lighting (from the luminaires) that gives minimum energy demand. The use of the obtained DF formula leads to the optimization of the window size in order to reduce building energy demand, because of its flexibility and the fact that it depends on all parameters that influence the amount of energy and natural light introduced into the space.
The result of this work shows that the building envelope is a determining factor that directly influences building energy demand. The bioclimatic design of the building, as well as its shape, glazing type, window size and building orientation, determine its thermal performance. These parameters contribute not only to the reduction of building energy demand but also to the reduction of HVAC system cost and CO2 emissions. Due to the compactness of the hexagonal shape, a greater choice of window orientation is possible and the heat exchange through the outer wall is reduced. As a result, building and HVAC system cost are reduced.
This new approach for the optimization of window size using the DF enhancer formula allowed obtaining a large glazed area with minimum energy demand compared to the reference building model with a recommended single glazing of 10% WWR. As a result, a quite considerable reduction of 48% of energy demand and 21.5% of CO2 emissions can be achieved. Therefore, the methodology presented can be applied to determine the optimum window size for any space and the potential for energy savings in any city worldwide.
Finally, the use of the improved DF formula is highly recommended. This new DF model is an accurate and simple model which completes all the missing points that the standard DF presents. Thus, it offers several advantages:
- It takes into account the location of the building.
- It can represent the change in indoor illuminance levels due to the temporal variation of sky luminance.
- The orientation of building façade effects on DF calculation.
In hot and arid regions, for solving the problems of energy consumption and CO2 emissions, a careful consideration of climatic conditions and understanding the surrounding luminance environment is a key factor. The usual recommendations are mainly related to the protection from the effects of solar radiation. However, using the new model of DF with the current new approach for the optimization of building energy demand and energy consumption needs to consider daylighting, the building shape, the orientation, glazed area, glazing type, the reflectance of room surfaces, sky type and the geographic location of the building, which are the major parameters to handle.
Indeed, the CBDMs still a very efficient dynamic metrics to accurately predict daylighting using software. However, the new DF model is a simple formula expressed as a function of the orientation, daytime, sky conditions and geographical location of the building, which allows a simple prediction of DF and offers several advantages over CBDMs, as presented in Table 12.
Table 12

Table 12. Comparison of the improved DF model to a CBDMs metric Daylight autonomy.
This study focuses on the optimization of window size to minimize building energy demand, considering the complementarily between daylight and artificial lighting installation. However, some limitations are outlined:
- If the illuminance uniformity is required in the room, the use of the improved DF is not sufficient, and room modeling is required in order to study the illuminance uniformity in the whole room surface. The uniformity of the illuminance creates a better environment for visual comfort and is a major part of indoor environment quality studies.
- The impact of glare in the optimization process was not investigated to optimize the window size.
This study presents a new approach for the optimization of window size through an improved daylight factor considering the case of hot climate. The approach in this research work is a first step towards integrating intelligent search methods into the design process using the improved DF model. The method should be extended to optimize the window size and energy demand for different climate conditions and building configurations and classification regarding the impact on the environment.
Acknowledgment
The authors would like to thank the manager of the official representative of CYPE Software in Algeria “KRCP Consulting” and the National Centre for Integrated Building Studies and Research (CNERIB) and the Laboratory Built in the Environment (LBE) for their support for this research work.
Contributions
C. Mebarkiand and E. Djakab carried out the improvement of DF formula, the optimization process, the simulations, the calculation of the annual energy demand, energy consumption, CO2 emissions and the interpretation of the results. Y. Amrane helped for the development of the NSGA II program with MATLAB. A. M. Mokhtariand and L. Derradji are strongly acknowledged and thanked for their valuable comments to improve the manuscript.
Declaration of competing interest
The authors report no conflicts of interests.
References
- International Energt Agency I. World Energy Outlook, 2018.
- APRU. LA CONSOMMATION ÉNERGÉTIQUE FINALE Chiffres clés Année, 2017.
- F. Boudali Errebai, L. Derradji, A. Limam, M. Amra, Energy efficient and economic profitability between standard and high energy performance dwellings in a semi-arid climate, International journal of Ambient Energy (2021). https://doi.org/10.1080/01430750.2021.1874525
- A. Tabadkani, A. Roetzel, HX. Li, A. Tsangrassoulis, A review of automatic control strategies based on simulations for adaptive facades, Building and Environment 175 (2020) 106801. https://doi.org/10.1016/j.buildenv.2020.106801
- A. Mesloub, G. Aritra, Daylighting of Light Shelf Photovoltaics ( LSPV ) for Office Buildings in Hot Desert-Like Regions, Applied sciences 10 (2020) 7959. https://doi.org/10.3390/app10227959
- A. Mesloub, A. Ghosh, GA. Albaqawy, E. Noaime, BM. Alsolami, Energy and Daylighting Evaluation of Integrated Semitransparent Photovoltaic Windows with Internal Light Shelves in Open-Office Buildings, Advances in Civil Engineering (2020) 0–21. https://doi.org/10.1155/2020/8867558
- A. Mesloub, A. Ghosh, M. Touahmia, Performance Analysis of Photovoltaic Integrated Shading Devices ( PVSDs ) and Semi-Transparent Photovoltaic ( STPV ) Devices Retrofitted to a Prototype O ffi ce Building in a Hot Desert Climate, Sustainability 12 (2020) 10145. https://doi.org/10.3390/su122310145
- M.Alwetaishi, Impact of glazing to wall ratio in various climatic regions: A case study, Journal of King Saud University - Engineering Sciences, 31 (2019) 6–18. https://doi.org/10.1016/j.jksues.2017.03.001
- P. Rathi, Optimization of Energy Efficient Windows in Office Buildings. Kent State University, 2012.
- M.Krarti,PM. Erickson,TC. Hillman, A simplified method to estimate energy savings of artificial lighting use from daylighting, Building and Environment 40 (2005) 747–54. https://doi.org/10.1016/j.buildenv.2004.08.007
- CYPE catalogue cost generater, http://generateur-de-prix.cype.fr/ and http://www.algerie.prix-construction.info/. Spain: CYPE.
- H. Gholami, HN. Røstvik, Economic analysis of BIPV systems as a building envelope material for building skins in Europe, Energy 204 (2020) 117931. https://doi.org/10.1016/j.energy.2020.117931
- Huang D, Yu T. ScienceDirect ScienceDirect Study on Energy Payback Time of Building Integrated Photovoltaic System. Procedia Engineering. 205 (2017) 1087–92. https://doi.org/10.1016/j.proeng.2017.10.174
- Saint Gobain India Pvt. Ltd. Glass Business. SUSTAINABILTY REPORT, (2018).
- L’ENVIRONNEMENT MDEDER, Plan National Climat, 2017.
- CPDN-ALGERIE, Contribution Prévue Déterminée au niveau National, (2015).
- A.Eljojo, Effect of Windows Size , Position and Orientation on the Amount of Energy Needed for Winter Heating and Summer Cooling, Journal of Engineering Research and Technology 1 (2017) 0–8.
- V. Burmaka, M. Tarasenko, K. Kozak, A.Omeiza ,Effective Use of Daylight in Office Rooms, Journal of Daylighting 7 (2020) 154–66. http://dx.doi.org/10.15627/jd.2020.15
- H.Karabay, M.Arici, Multiple pane window applications in various climatic regions of Turkey, Energy and Buildings 45 (2012) 67–71. https://doi.org/10.1016/j.enbuild.2011.10.020
- AS.Muhaisen,HR. Dabboor, Studying the Impact of Orientation , Size , and Glass Material of Windows on Heating and Cooling Energy Demand of the Gaza Strip Buildings, Journal of Architecture and Planning 27 (2015) 1–15.
- S. Carlucci, F. Causone, F De Rosa, L. Pagliano, A review of indices for assessing visual comfort with a view to their use in optimization processes to support building integrated design, Renewable and Sustainable Energy Reviews, 47 (2015) 1016–33. https://doi.org/10.1016/j.rser.2015.03.062
- CF. Reinhart, O. Walkenhorst, Validation of dynamic RADIANCE-based daylight simulations for a test of ® ce with external blinds, Energy & Buildings, 33 (2001) 683–97. https://doi.org/10.1016/s0378-7788(01)00058-5
- Sun C, Liu Q, Han Y. Many-Objective Optimization Design of a Public Building for Energy, Daylighting and Cost Performance Improvement. applied sciences. 10 (2020) 2435. https://doi.org/10.3390/app10072435
- M. Sudan, GN. Tiwari,IM. Al-Helal, A daylight factor model under clear sky conditions for building: An experimental validation, Solar Energy 115 (2015) 379–89. https://doi.org/10.1016/j.solener.2015.03.002
- KA.Alshaibani, Prediction of interior daylight under clear sky conditions, University of Sheffield, 1996.
- M. Abdelhakim,Y.Lim, Z.Kandar, Optimum Glazing Configurations for Visual Performance in Algerian Classrooms under Mediterranean Climate, Journal of Daylighting, 6 (2019) 11–22. http://dx.doi.org/10.15627/jd.2019.2
- A. Nabil and J. Mardaljevic, Useful daylight illuminances: A replacement for daylight factors, Energy and Buildings 38 (2006) 905–913. https://doi.org/10.1016/j.enbuild.2006.03.013
- M. Ghazi Abu-Dakka, The Use of Useful Daylight Illuminance (UDI) to Test New Designs for Improving Daylight Performance of Office Buildings in Dubai-UAE, (2009).
- Kharvari F. A Field-validated Multi-objective Optimization of the Shape and Size of Windows Based on Daylighting Metrics in Hot-summer Mediterranean and Dry Summer Continental Climates, Journal of Daylighting 7 (2020) 222–37. https://doi.org/10.15627/jd.2020.19
- J.Mardaljevic,M. Andersen, N.Roy, J.Christoffersen, T. Gateway,E. Enac, Daylighting metrics : is there a relation between useful daylight illuminance and daylight glare probability ? In: Proceedings of the Building Simulation and Optimization Conference BSO12, 2012, pp. 8.
- K. Aishaibani, Average daylight factor for the ISO / CIE Standard General Sky, Lighting Research & Technology 48 (2015) 742–754. https://doi.org/10.1177/1477153515572939
- DHW. Li, GHW. Cheung, Average daylight factor for the 15 CIE standard skies, Lighting Research and Technology 39 (2006) 37–152. https://doi.org/10.1177/136578280603800213
- P.Taylor, S.Luminance,S. Illuminance, S.Treado,G. Gillette, Measurements of sky luminance , sky illuminance , and horizontal solar radiation, Journal of the Illuminating Engineering Society 12 (2013) 37–41. https://doi.org/10.1080/00994480.1983.10748827
- S. Aydinli, J.Krochmann, Data on daylight and solar radiation. Draft for CIE TC 4.2, Taylor & Francis, 1983.
- W.Chroscicki, Calculation methods of determining the value of daylight’s intensity onthe ground of photometrical and actinometrical measurements, Proc. CIE, Barcelona,1971.
- M. Yadoya, K. Kimura Research of Planning and Energy Evaluation of Natural Illumination with Direct Sunlight: Part 1: Effect of Outside Reflective Louvers, Architectural Institute of Japan Proceedings 283 (1979) 87-97. https://doi.org/10.3130/aijsaxx.283.0_87
- PJ. Littlefair, The luminous efficacy of daylight: a review, Lighting Research & Technology 17 (1985) 162–82. https://doi.org/10.1177/14771535850170040401
- ASHRAE Fundamentals Handbook, FENESTRATION:Chapter 30, 2003.
- DRG.Hunt, The use of artificial lighting in relation to daylight levels and occupancy, Building and Environment 14 (1979) 21–33. https://doi.org/10.1016/0360-1323(79)90025-8
- PJ. Littlefair, Predicting annual lighting use in daylit buildings, Building and Environment 25 (1990) 43–53. https://doi.org/10.1016/0360-1323(90)90040-x
- S.Attia,M. Hamdy, WO.Brien, S.Carlucci, Assessing gaps and needs for integrating building performance optimization tools in net zero energy buildings design, Energy & Buildings 60 (2013) 110–24. https://doi.org/10.1016/j.enbuild.2013.01.016
- K.Deb, A.Member, A.Pratap, S.Agarwal, T. Meyarivan, A Fast and Elitist Multiobjective Genetic Algorithm 6 (2002) 182–97. https://doi.org/10.1109/4235.996017
- PR.Boyce, P.Raynham, The Society of Light and Lighting Handbook, Society of Light and Lighting, 44 (2009) 1–316.
- CIBSE, Daylighting and window design, 1999.
- EN 12464, 2012. p. 11.
- Y.Yusoff, MS.Ngadiman,AM. Zain, Overview of NSGA-II for Optimizing Machining Process Parameters, Procedia Engineering 15 (2011) 3978–3983. https://doi.org/10.1016/j.proeng.2011.08.745
- S.Belniak, The influence of the building shape on the costs of its construction, Journal of Financial Management of Property and Construction 18 (2013) 90–102.
- SP.Allan Ashworth, Cost Studies of Buildings,sixth ed, London, 2015. zzzzzzzzzzz
- Y.Zhai, Y.Wang, Y.Huang, X.Meng, A multi-objective optimization methodology for window design considering energy consumption, thermal environment and visual performance, Renewable Energy 134 (2019) 1190–1199. https://doi.org/10.1016/j.renene.2018.09.024
- M.Isobe, K.Matsuhiro, Effect of Orientation of Window on Building Heat Load : Perspective of N-E India Effect of Orientation of Window on Building Heat Load : Perspective of N-E India, In: IOP Conference Series: Materials Science and Engineering, 2017, pp.1-8. https://doi.org/10.1088/1757-899x/225/1/012166
- E.Piotrowska, A.Borchert, Energy consumption of buildings depends on the daylight, In: E3S Web of Conferences, Energy and Fuels, 2017. https://doi.org/10.1051/e3sconf/20171401029
- L.Vanhoutteghem, GCJ .Skarning, CA.Hviid, S.Svendsen, Impact of façade window design on energy , daylighting and thermal comfort in nearly zero-energy houses, Energy and Buildings 102 (2015) 149–156. https://doi.org/10.1016/j.enbuild.2015.05.018
- J. Gagne,M. Andersen, A generative facade design method based on daylighting performance goals, Journal of Building Performance Simulation 5 (2012) 37–41. https://doi.org/10.1080/19401493.2010.549572
- Technology C for B, Laboratory NE, Standards NB of, Washington D 20234, Solar Radiation and Illumination, 1981.
- S. Dervishi, A. Mahdavi, A simple model for the derivation of illuminance values from global solar radiation data, Building Simulation 6 (2013) 379–83. https://doi.org/10.1007/s12273-013-0133-8
- S.Aydinlin, Uber die Berechnung der zurverfugungstehendensolarenergie und des Tages-lichtes (on the calculation of available solar energy and daylight), Dissertation Tech, Univ. Berlin (Fortschrittberichte der VDI-Zeit-schriften ).
- SAINT GOBAIN. MEMENTO. 2007.
- A.Tzempelikos,AK.Athienitis, The impact of shading design and control on building cooling and lighting demand, Solar Energy 81 (2007) 369–382. https://doi.org/10.1016/j.solener.2006.06.015
- Illuminating Engineering Society of North America I. IESNA,Lighting Handbook, Ninth ed., New York, 2000.
- WJ.Hee, MA.Alghoul, B.Bakhtyar,O. Elayeb, MA.Shameri, MS.Alrubaih, The role of window glazing on daylighting and energy saving in buildings, Renewable and Sustainable Energy Reviews, 42 (2015) 323–343. https://doi.org/10.1016/j.rser.2014.09.020
- E.Gratia, A.De Herde, Design of low energy office buildings, Energy and Buildings 35 (2003) 473–91. https://doi.org/10.1016/s0378-7788(02)00160-3
- SK.Alghoul, HG.Rijabo, ME.Mashena, Energy Consumption in Buildings: A Correlation for the Influence of Window to Wall Ratio and Window Orientation in Tripoli, Libya, Journal of Building Engineering 11 (2017) 82-86. https://doi.org/10.1016/j.jobe.2017.04.003
- BG.Headquarters, Draft BS EN 15193-1 Energy performance of buildings - Module M9 - Energy requirements for lighting - Part 1: Specifications, 44 ( 2014). https://doi.org/10.3403/30292861
- Final report, International comparison of fossil power efficiency and CO 2 intensity - Update 2018.
- APRU, Consommation Energétique Finale de l ’ Algérie. (2015) 1–24.
- N. Reinhart, L. Jones, F. Christoph, FAST DAYLIGHT COEFFICIENT CALCULATION USING GRAPHICS. InProceedings of BS2015: 14th Conference of International Building Performance Simulation Association. 2012.
Copyright © 2021 The Author(s). Published by solarlits.com.

2680
Total views
Citations
SHARE ON


