Volume 8 Issue 2 pp. 294-312 • doi: 10.15627/jd.2021.23
Assessment of the Thermal Performance of Vertical Green Walls Using Overall Thermal Transfer Value Based BIM Simulation Method: Case Study of Residential Buildings in Sub-Tropics
Ali Ahmed Salem Bahdad,*,a,b Sharifah Fairuz Syed Fadzil,a Hilary Omatule Onubia
Author affiliations
a School of Housing, Building and Planning, Universiti Sains Malaysia, 11800, Penang, Malaysia
b Department of Architectural Engineering & Environmental Planning, College of Engineering and Petroleum, Hadhramout University (HU), Mukalla, Yemen
*Corresponding author.
alibahaddad@gmail.com (A. A. S. Bahdad)
sfsf@usm.my (S. F. S. Fadzil)
onubihilary@gmail.com (H. O. Onubi)
History: Received 29 September 2021 | Revised 4 December 2021 | Accepted 10 December 2021 | Published online 24 December 2021
Copyright: © 2021 The Author(s). Published by solarlits.com. This is an open access article under the CC BY license (http://creativecommons.org/licenses/by/4.0/).
Citation: Ali Ahmed Salem Bahdad, Sharifah Fairuz Syed Fadzil, Hilary Omatule Onubi, Assessment of the Thermal Performance of Vertical Green Walls Using Overall Thermal Transfer Value Based BIM Simulation Method: Case Study of Residential Buildings in Sub-Tropics, Journal of Daylighting 8 (2021) 294-312. https://dx.doi.org/10.15627/jd.2021.23
Figures and tables
Abstract
Construction of multifunctional building envelopes using vertical greenery walls (VGW) has emerged as a sustainable green technology to improving cooling efficiency. To attaining the desired level of building cooling performance, VGW and overall thermal transfer value (OTTV) of the walls are useful design factors. The study aims to revise the current VGW evaluation, considering the decreased heat flux due to thermal efficiency of wall construction based on OTTV values. To achieve this, OTTV based Building Information Modelling (BIM) simulation method was proposed using Autodesk-Revit and DesignBuilder simulation based on EnergyPlus. Six wall compositions with various OTTV values of south facade for residential buildings located in sub-tropical in cooling season, were evaluated. The findings demonstrate that in the presence of a green system, a good OTTV value of the exterior walls is required for optimal performance, to keep the space within set point of cooling for long time during the cooling season. The comparisons between the bare walls and the VGW have demonstrated a great variation due to the different OTTV reached up to 6.57% and 18.44% reduction in indoor air temperature. The best combination of VGW resulted a maximum of 1.2°C reduction in indoor air temperature, with number of hours (within 28°C or less) were higher by 2506h, representing 85.59% of the overall number of hours (2928h). Overall cooling energy saving is found as 103.3kwh, representing 13.63% of the total of energy saving, and decreased the heat gained by 38.82%, representing 61.51kwh reduction during cooling season compared to base wall.
Keywords
Overall thermal transfer value, Vertical greenery, BIM, Building energy simulations
Nomenclature
| TC | Thermal conductivity |
| D | Density |
| Th | Thickness |
| Ab | Absorptivity (Solar absorptivity (α)) |
| BW | Base wall |
| VGW | Vertical green wall |
| BIM | Building Information Modelling |
| N/S | Not specified |
| U | Heat transfer coefficient |
| R | Thermal resistance |
| Tia | Indoor air temperature |
| U-Value | Thermal transmittance |
| HGs | Heat gains |
| OTTVBBS | OTTV based-BIM simulation |
| OTTV | Overall thermal transfer value |
| OTTVwall | Overall thermal transfer value of wall |
| OTTVroof | Overall thermal transfer value of roof |
| OTTVi | OTTV of walls with same orientation and Construction |
| GHG | Greenhouse gasses |
| TH | Wall thickness |
| ASHRAE | American Society of Heating, Refrigerating, and Air-Conditioning Engineers |
| SF | Solar factor |
| TDeq | Equivalent temperature difference |
| ΔT | Temperature difference |
| TD | Equivalent temperature difference |
| Af | Area of fenestration |
| Uf | U-value of fenestration |
| SC | Shading coefficient of fenestration |
| Ai | gross area of the walls |
1. Introduction
As the demand for new infrastructure grows in tandem with rising the global population, achieving sustainability in the construction industry has become a fundamental goal [1]. Understanding the varying climate conditions of a construction site is critical in determining sustainable design strategies. For buildings in sub-tropical regions, cooling systems are the largest energy consumers. As a result of this problem, a number of researchers and building designers are increasingly agreeing that quantifying the performance of building façade components at the design stage will help conserve energy and reduce GHG emissions [2,3]. Thus, in order to achieve a more sustainable development while dealing with critical issues related to climate change, new design strategies that optimise building energy performance must be explored [4]. In the present day, design with thermal characteristics of external facade building wall materials, and systems is necessary for building’s energy efficiency [5]. The changes in the wall structure and systems of building’s facade, especially in sub-tropical climates, are based on the comparison of different cooling materials and the construction of the entire exterior walls structure to improve its thermal performance [6]. To achieve the desired level of thermal performance, walls and systems must be properly detailed to reduce heat transmission by conduction, convection, and radiation [7], which can be useful in making logical design decisions and devising energy-saving strategies [8].
Prescriptive requirements for building envelope designs for evaluating thermal performance have been established in many countries worldwide. An understanding of variations of climate condition of a project site plays a vital role in selecting energy-saving strategies [9]. Currently, there are two major types of building energy-saving codes, namely prescriptive and performance-based energy codes, widely adopted in the building industry for governing energy-efficient building design [10]. Globally, external walls’ thermal performance of building envelope is typically measured using one of two building standards: Cold climates use thermal insulation standards. Thermal transmittance (U-values) of the wall construction and materials are measured using this standard. In hot regions, the overall thermal transfer value (OTTV) measure of building codes is employed [3,11]. The idea of thermal transmittance, often known as U-values, has become a crucial criterion in determining the thermal quality of a building façade and demonstrating steady-state thermal transfer performance. The quantity of heat energy that travels through a given element per unit area and time is known as thermal transmittance, or U-Value. This means that conductive heat may be transferred between interior and exterior environments when thermal transmittance is low [5,12]. An example of the requirements of the U-value of building envelopes in cold-climate countries as in British Standards (BS) EN ISO 8990. It is used as measurement stander for the U-Value of the building components, i.e., walls, roof, and floor, BS EN ISO 12567–1 for windows and doors, and BS EN ISO 12567–2 for rooflights [10,13]. Instead of U-value, the OTTV is preferred and considered a better index since it considers the influence of solar heat gain on the façade. The OTTV of an entire building is given by the weighted average of the OTTVs of the external walls and the roof of a building [10]. Thus, the higher the OTTV, the greater the cooling load on the air conditioner [14]. The OTTV was initially proposed in 1975 by the American Society of Heating, Refrigerating, and Air-Conditioning Engineers (ASHRAE) [15]. The OTTV concept has been described in the U.S. with the aim to determine heat gains and losses of a building [16]. The goal is to evaluate the total heat flux into the building and set a good OTTV to limit the heat gains [8]. Since then, it has been employed in many countries. However, the OTTV is only applicable for mechanically cooled buildings [17]. A number of countries have created mandatory building energy efficiency standards and used the OTTV as part of their requirements including Philippines, Thailand, Hong Kong, Singapore, Malaysia and Indonesia which were developed their OTTV standards [3,10].
The output of OTTV is dependent on the thermal building environment, as it is a performance-based technique. It's a measurement of a building's average heat gain over the building facade that can be able to be used to compare thermal performance. Rather than measuring the performance of individual components, it measures the overall performance of the building as a whole [18]. OTTV takes into account three different types of heat gain: (1) conduction through opaque surface, (2) conduction through glass area, and (3) solar radiation through a glass [19,20]. Two sets of OTTV are usually installed on a building, one for the external walls (OTTVwall) including the fenestration, and one for the roof (OTTVroof) [2]. The yearly net heat gain per unit space of the building facade is defined as OTTV in general [8]. Despite the fact that an OTTV code provides an efficient and effective approach for analysing the design of an exterior wall to achieve energy efficiency, the manual OTTV calculation methods are time-consuming for designers and consultants who are inexperienced with the process. This technique of calculating OTTV coefficients is also inefficient due to the possibility of human errors in the computation procedure and might result in incorrect findings. This is because the OTTV equation incorporates a number of factors and coefficients, including thermal conductivity, thermal resistance, heat capacity of building envelope materials, and the ratio of opaque to fenestration wall area [3]. In recent years, the usage of Building Information Modelling (BIM) and its visual programming interface has become an essential tool for building design and design optimizing. In order to increase energy efficiency in building design, extending the capability of current BIM to allow the access and extraction of essential information related thermal characteristics of materials from a BIM model is a good step towards improving the design.
When a BIM model is used, the building is represented as an integrated database of coordinated information that can be shared as the central model to simplify the study of a variety of performance criteria, including architectural, structural, thermal characteristics, energy, and lighting [21]. Currently, a BIM-based performance design support is increasingly being utilised in the design stages to assess numerous performance parameters on the building design (e.g., the building's envelope material, shape, and energy-efficiency). To maintain a comfortable temperature in a structure, the exterior walls material must be carefully chosen to prevent heat transmission through the building façade [22]. In theory, heat migrates through the building wall from higher-temperature parts to lower-temperature elements until it reaches the equilibrium between these parts. The degree of heat transfer is controlled by the properties of the building wall materials that were utilised in the construction. In the sub-tropics, due to the amount of solar radiation and hot climates, the form of heat transfer is by conduction, convection and radiation from a hotter external environment to cooler internal spaces. Therefore, the indoor environments become out of comfort due to heat transfer [23,24]. As a result, the OTTV is a fundamental criterion for the building design must be fulfilled. There has been a major change in the design and construction of residential building exterior walls over the last decades, with increased thermal insulation and energy-efficient components such as greening solutions [2]. Greening solutions for buildings are becoming more popular as a result of a growing global interest in a sustainable urban environment. Within these solutions, vertical green wall (VGW) system play a vital function to improve building energy performance, with the advantage of preventing land consumption [25]. VGW is a vegetated space built into the structure of a building's exterior walls. VGW can provide a viable alternative to new building construction and renovation to reduce cooling system energy requirements, reduce urban heat, and improve the thermal energy performance of existing structures [25]. VGW, as a component of urban green spaces, helps to cool the urban environment. VGW has a cooling effect on building facade surfaces due to shading, transpiration, and insulation. External wall structure materials play a role in cooling intensity, as well as plant characteristics and meteorological conditions (primarily solar radiation, air temperature, and wind) [26].
Construction of multifunctional building envelopes using VGW has emerged as a major sustainable green technology that allows for the enhancement of conventional exterior wall materials in the construction of facades. Thus, when it comes to attaining the desired level of thermal load reduction, the thermal transfer value of the building walls construction materials and the vegetation system are useful design factors. The OTTV result underscores the importance of solar heat gain reduction for walls and consider a proper selection of wall materials of high thermal value in the tropics and vertical greenery for energy efficiency. Furthermore, without a proper OTTV design of external building walls construction for VGW system, the applied green system without accurate OTTV design of wall structure may not achieve the required cooling efficiency. The application of concrete brick walls will then cause thermal discomfort in the indoor spaces, triggering an increase in thermal load [5,27]. According to earlier studies, depending on the building material, the temperature of solar-exposed facade surfaces might rise by 20–40°C [28]. The use of the right wall materials can be able to change the external facade temperature and reduce the amount of energy required to heat or cool the indoor space [29]. Several researchers, however, have looked at the thermal influence of greenery systems on building facades by sheltering walls and windows from incoming solar radiation by using VGW. VGW has been demonstrated to reduce air conditioning demand, resulting in a 5.5°C reduction in outside ambient temperature [7].
Notwithstanding the attempts made by previous studies on VGW to promote and create awareness on different aspects the thermal performance of VGW, some gaps still exist in literature. To address the outlined issues above, this study intends to develop an OTTV based-BIM simulation (OTTVBBS) method to calculate and simulate for VGW that performs an automated computation and estimation of the exterior walls of building facades design in order to determine the building's thermal performance. The present work presents the OTTVBBS method of the thermal behaviour of VGW system in the sub-tropical climate. The aim of the current research is to revise the current VGW evaluation procedure, considering the decreased heat flux due to thermal efficiency of wall construction based on OTTV values. The objectives are (1) to achieve the most appropriate building walls characteristics under sub-tropical climate for VGW system to enhance the thermal efficiency, and (2) to study the impacts of wall OTTV values on the VGW for integrated buildings facades to minimise the cooling energy demand by reducing external heat gain.
In medium-rise residential buildings with a high wall-to-roof ratio, wall space absorbs a major amount of solar radiation energy during the sunny day compared to roof space [30-33]. Using the VGW technique is the promising method for space cooling or heating based on the climate conditions. This was applied in this study with the aim to reach the most suitable building walls characteristics for greenery system to improve the thermal performance by revising the current VGW evaluation method based on OTTV values. The main novelty of this paper lies in the introduction of the most appropriate wall characteristics under sub-tropical climate for greening system in the study of the thermal performance in sub-tropical climates which has not been considered in previous studies. To the best of the authors’ knowledge, no similar attempt has been done in the literature to date, aiming to improve the building thermal performance by presenting the most appropriate walls characteristics under sub-tropical climate for greening system, which is the main contribution of this current study. The originality of this research lies in the accurate design of VGW in its combination of the OTTV of wall structure and green thermal performance assessment based on the OTTV of external facade walls construction in sub-tropical climate.
The importance of proposing external walls design strategies of building envelope integrated with greening system, which is extensively recognised as one of the most critical design parameters for efficient energy conservation, is emphasised in this study. The ability of an exterior bare wall without plants to absorb solar radiation is three times greater than that of a green wall [34]. A building's walls would otherwise absorb the solar irradiance that is absorbed by the plants, which would then be transferred inside the structure, in part, and then re-emitted as infrared radiation. The use of greenery system in building design is becoming increasingly common, and more studies are being undertaken to assess the positive effects of such technologies [35]. Establishing a credible decision-support system for prioritising exterior wall measures requires consistent assessment and measurement of energy gains, to develop a better predictive framework for the VGW’s thermal performance. During the previous decade, a large number of research have been conducted on the thermal performance of VGW, and some scientific studies have been studied in depth, as described in Table 1.
Table 1
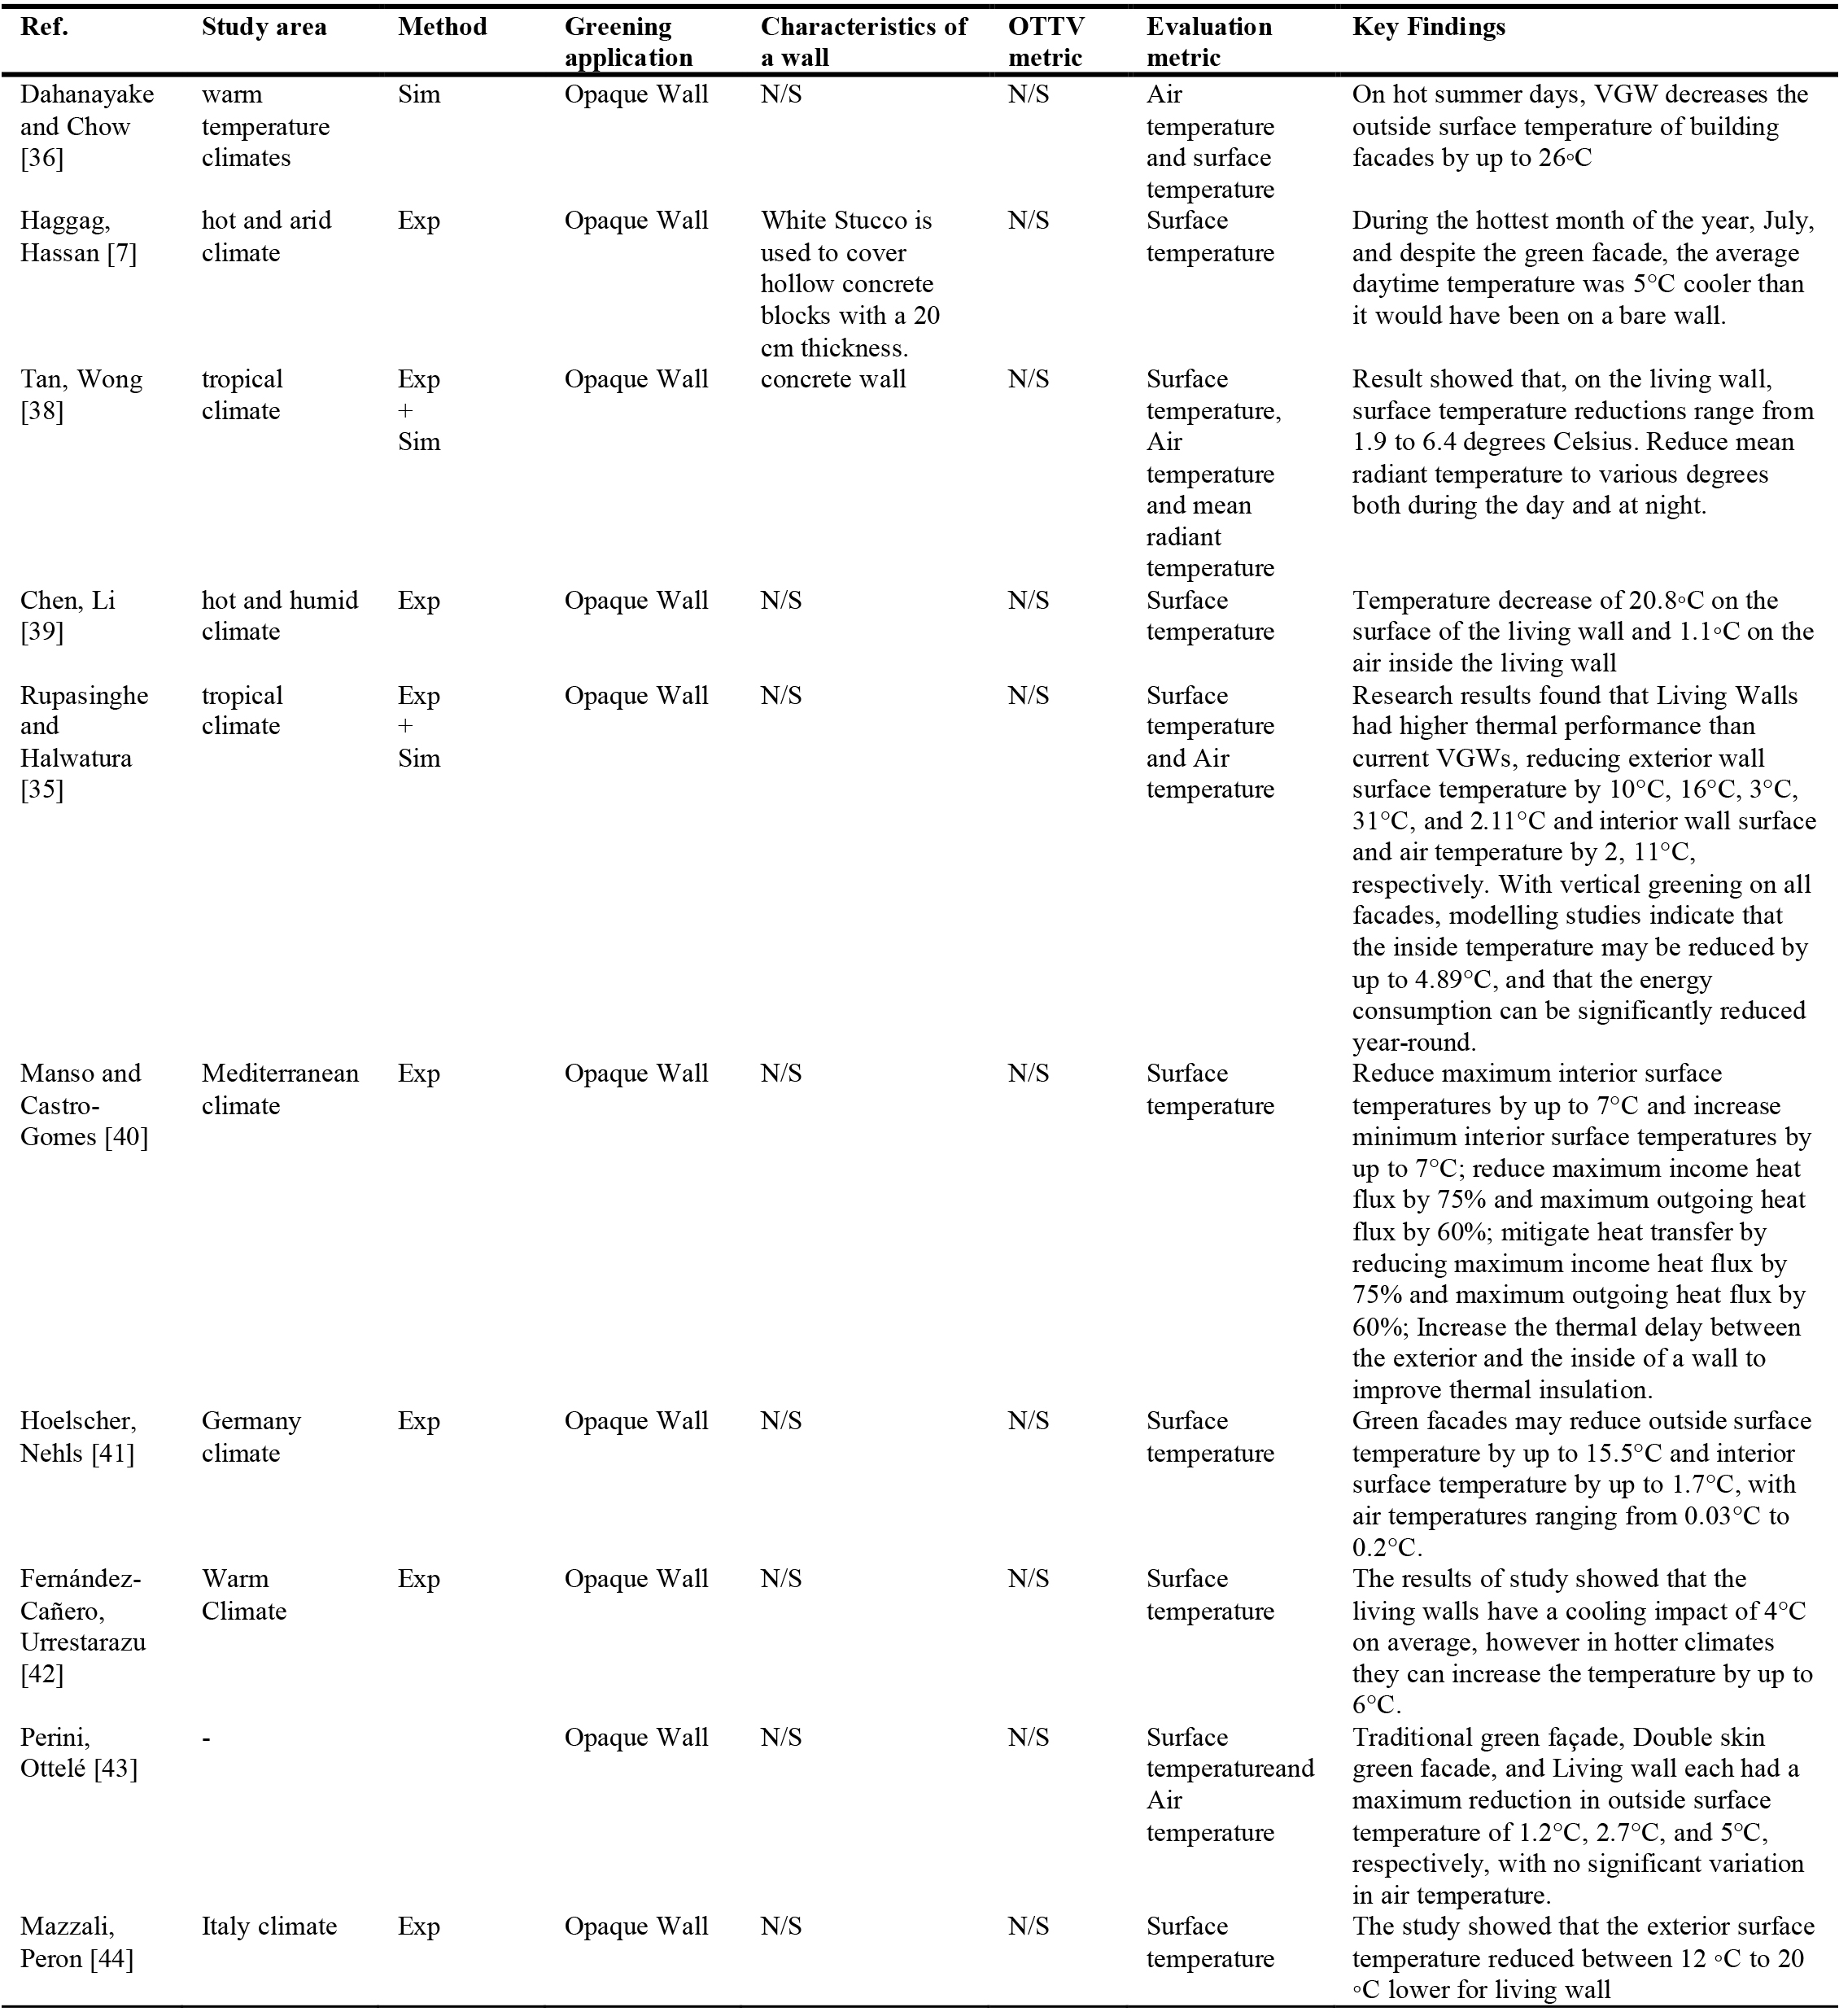
Table 1. Summary of the studies on the green system.
A typical VGW consists of several layers, such as layers of walls and greening system. These layers increase the thermal performance of the building exterior and regulate the thermal conductivity of the interior area. Thermal conductance of a VGW is an index of resistance to heat flux via conduction across the layer, which is determined by the thermal conductivity of the materials layers [36]. The thermal resistance of the layers is proportional to their thermal performance capability, a layer with a higher thermal resistance has better thermal performance [25]. In particular, the OTTV of walls structure covered by the green system is negligible in previous studies. Previous research has found that the materials used to construct green facades have a major environmental effect when a building's energy consumption may be lowered or the construction's multi-functionality can be improved by using plants [7]. Heat transmission can be decreased by 0.25 kWhm2 if a concrete wall is covered with a layer of plants, according to Hoyano [37]. The insulating ability of VGW system also rely on the wall structure, density of foliage and properties of the intermediate air layers.
Researchers have found that VGW may considerably increase a building's thermal performance, and the use of green walls in modern cities is increasing. Nevertheless, building designers have not calculated the thermal design of the wall itself based on the values of OTTV for buildings constructed with green wall system, and it was not taken into account during the evaluation of the green system. There has not been any research done on this topic yet. For an appropriate VGW design, it may be necessary to update the present green system performance analysis technique based on the calculation of the OTTV of walls and measuring the extent of the potential impact caused by the application of the green system based on the OTTV calculated values. To bridge this gap, the aim of the current study as mentioned above is to revise the current VGW evaluation method, to get the best suitable exterior walls characteristics for building façade under sub-tropical climate for VGW system to enhance the thermal efficiency. Another gap, among of the studies that used simulation method, is that the OTTVBBS method to analyse the thermal efficiency of VGW based on different wall OTTV values of wall construction, has not yet utilized.
2. Research methodology and Materials
2.1. Research framework
In the case of buildings with green walls, the traditional OTTV calculation approach is ineffective. As a result, a new approach for OTTV calculation of VGW should be developed, considering the additional thermal characteristics effect of VGW system. This study developed a OTTVBBS method to calculate and simulate the VGW which enables an automatic calculation and assessment of the walls design that is combined with greening for assessing the building's thermal performance. The research methodology consists of two techniques as explained in Fig. 1, the calculation of the OTTV and “simulation-based analysis” study based on BIM model through three steps. In the first step is BIM modelling of case study and alternatives. To optimize the evaluation of the thermal performance, the BIM prototype was designed as an integrated framework to link BIM models to physical/thermal assets stored in the BIM database. The second stage is to collect information from the BIM database about under-investigation wall constructions to compute variables important to OTTV calculation. As a result of this process, OTTV equations are used as the coefficients for calculating OTTV from BIM model information. The findings of the initial research for OTTV calculation serves as the foundation for the second phase of the study, wherein the later part focuses on finding the impact of heat-rate on the existing OTTV through greenery system using simulation. In the last step green system was applied to the base cases to discover the impacts of VGW based on OTTV values through comparing the indoor air temperature, cooling energy performance, and heat gains.
Figure 1
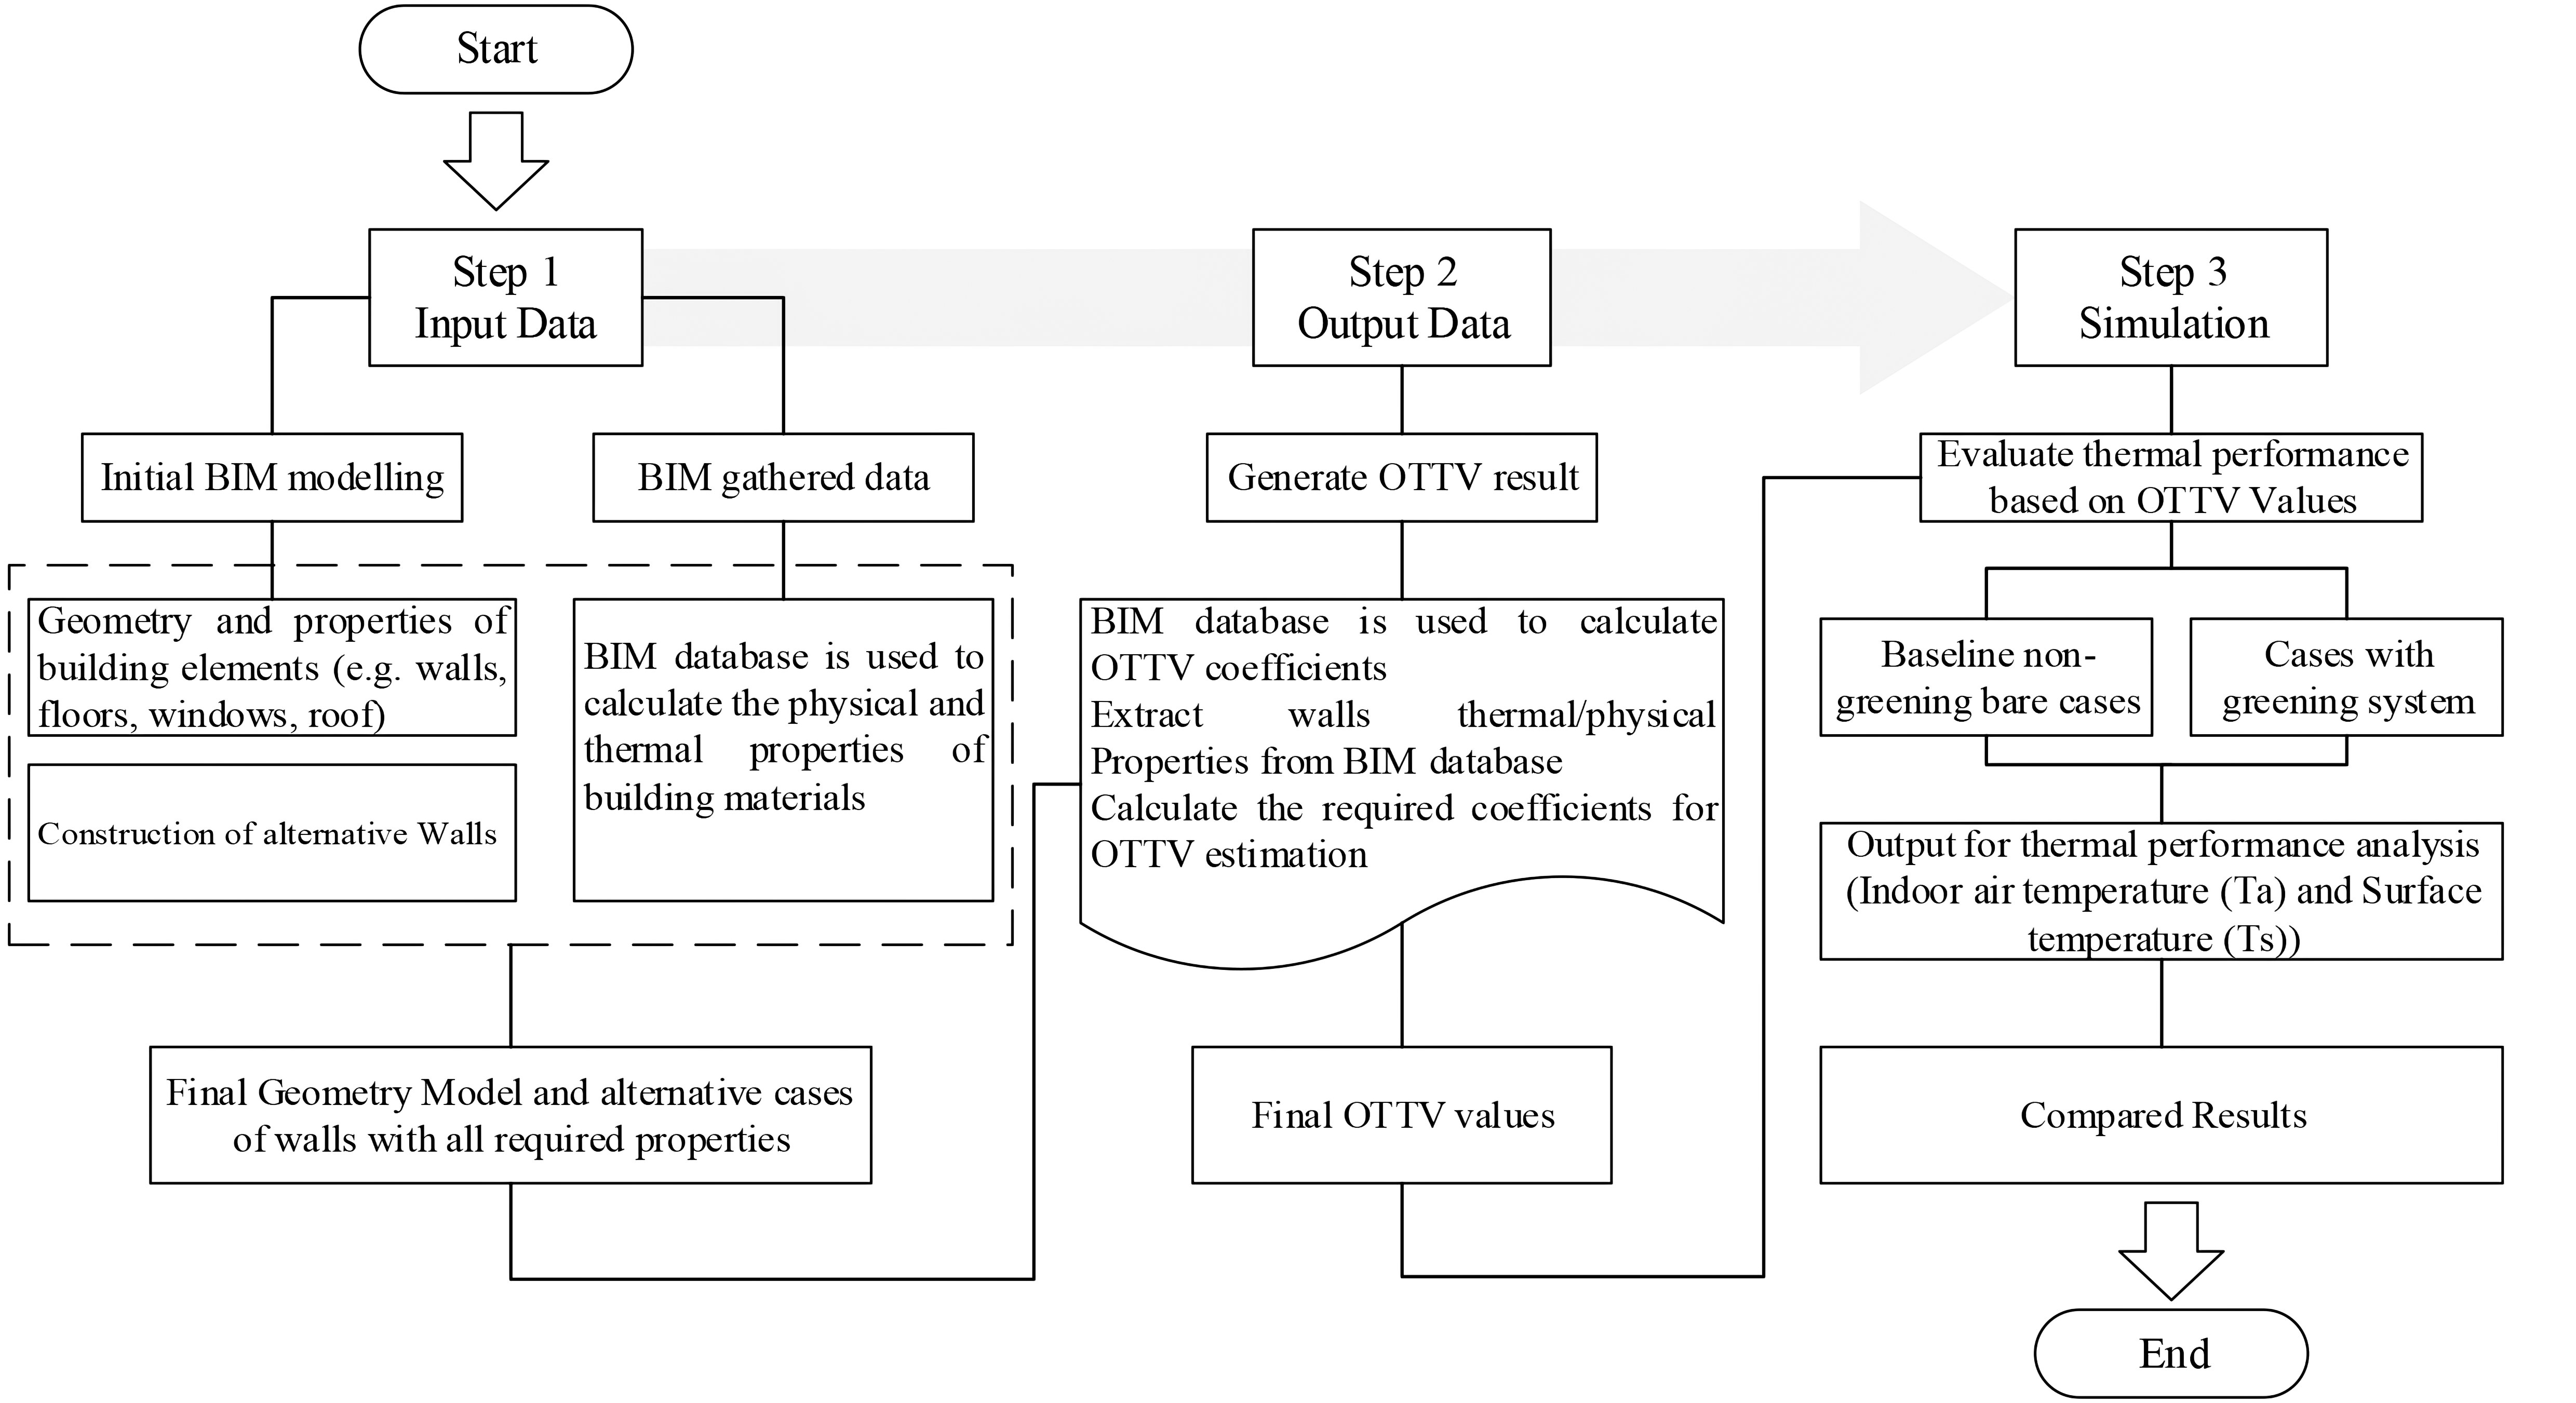
Fig. 1. Main working proposed method of OTTVBBS.
2.2. Case study building specification
The present analysis is concerned with an urban residential unit-scaled of multi-storey building, in the Hadhramout region of Yemen, and more precisely in the urban environment of Mukalla city within the very hot summer and winter warm climate zone of Yemen (Figs. 2 and 3), was selected as the case study building in this research. Mukalla City located at 14.5404° N, 49.1272° E with a subtropical dry climate with few differences in temperature over the year. Although there is a slight variation between the summer and winter seasons, the summer season has a little more precipitation. The summer is fairly hot from June to September. Daily temperatures can easily exceed 40°C or higher. The winter period is warm there with average temperatures just a little below thirty degrees with an average maximum temperature of 28°C in the daytime and it is bone-dry. Spring and autumn with maximum temperatures ranging from 25°C to 35°C, are mild and typically dry [45]. The building was oriented to the south and with five stories high with two apartments in each floor-plan as shown in Fig. 4. The dimensions of building model were 20 m (Length) × 20 m (Width) × 16 m (Height), based on Mukalla City's typical archetype of medium-rise residential structures (Fig. 4). Two identical rooms located in third floor were selected (width: 4.0m; length: 5.0m; and height: 3.2 m, with opaque walls: one with non-greenery bare walls and the other with a VGW system, both facing south orientation as shown in Fig. 4. The South facing was selected for study, because it exposed to direct sunlight during all daytime of summer period due to the sun path. From both sides, 2.5cm white Stucco (cement plaster) is applied to all external and internal walls made of concrete hollow bricks with a thickness of 20 cm without external insulation as one of the most common construction methods in Hadhramout (Fig. 5). Consequently, the total thickness of the wall structure has its value at 25 cm. Because in sub-tropical climate, the external walls are usually made of 20.5-40.0 cm thick concrete. The case study building is assumed to be located into an open space area, no consideration is given to natural obstacles or nearby buildings that could restrict the amount of solar radiation reaching the building envelope. As a result, the exterior walls of the selected rooms are immediately exposed to the outer natural conditions.
Figure 2
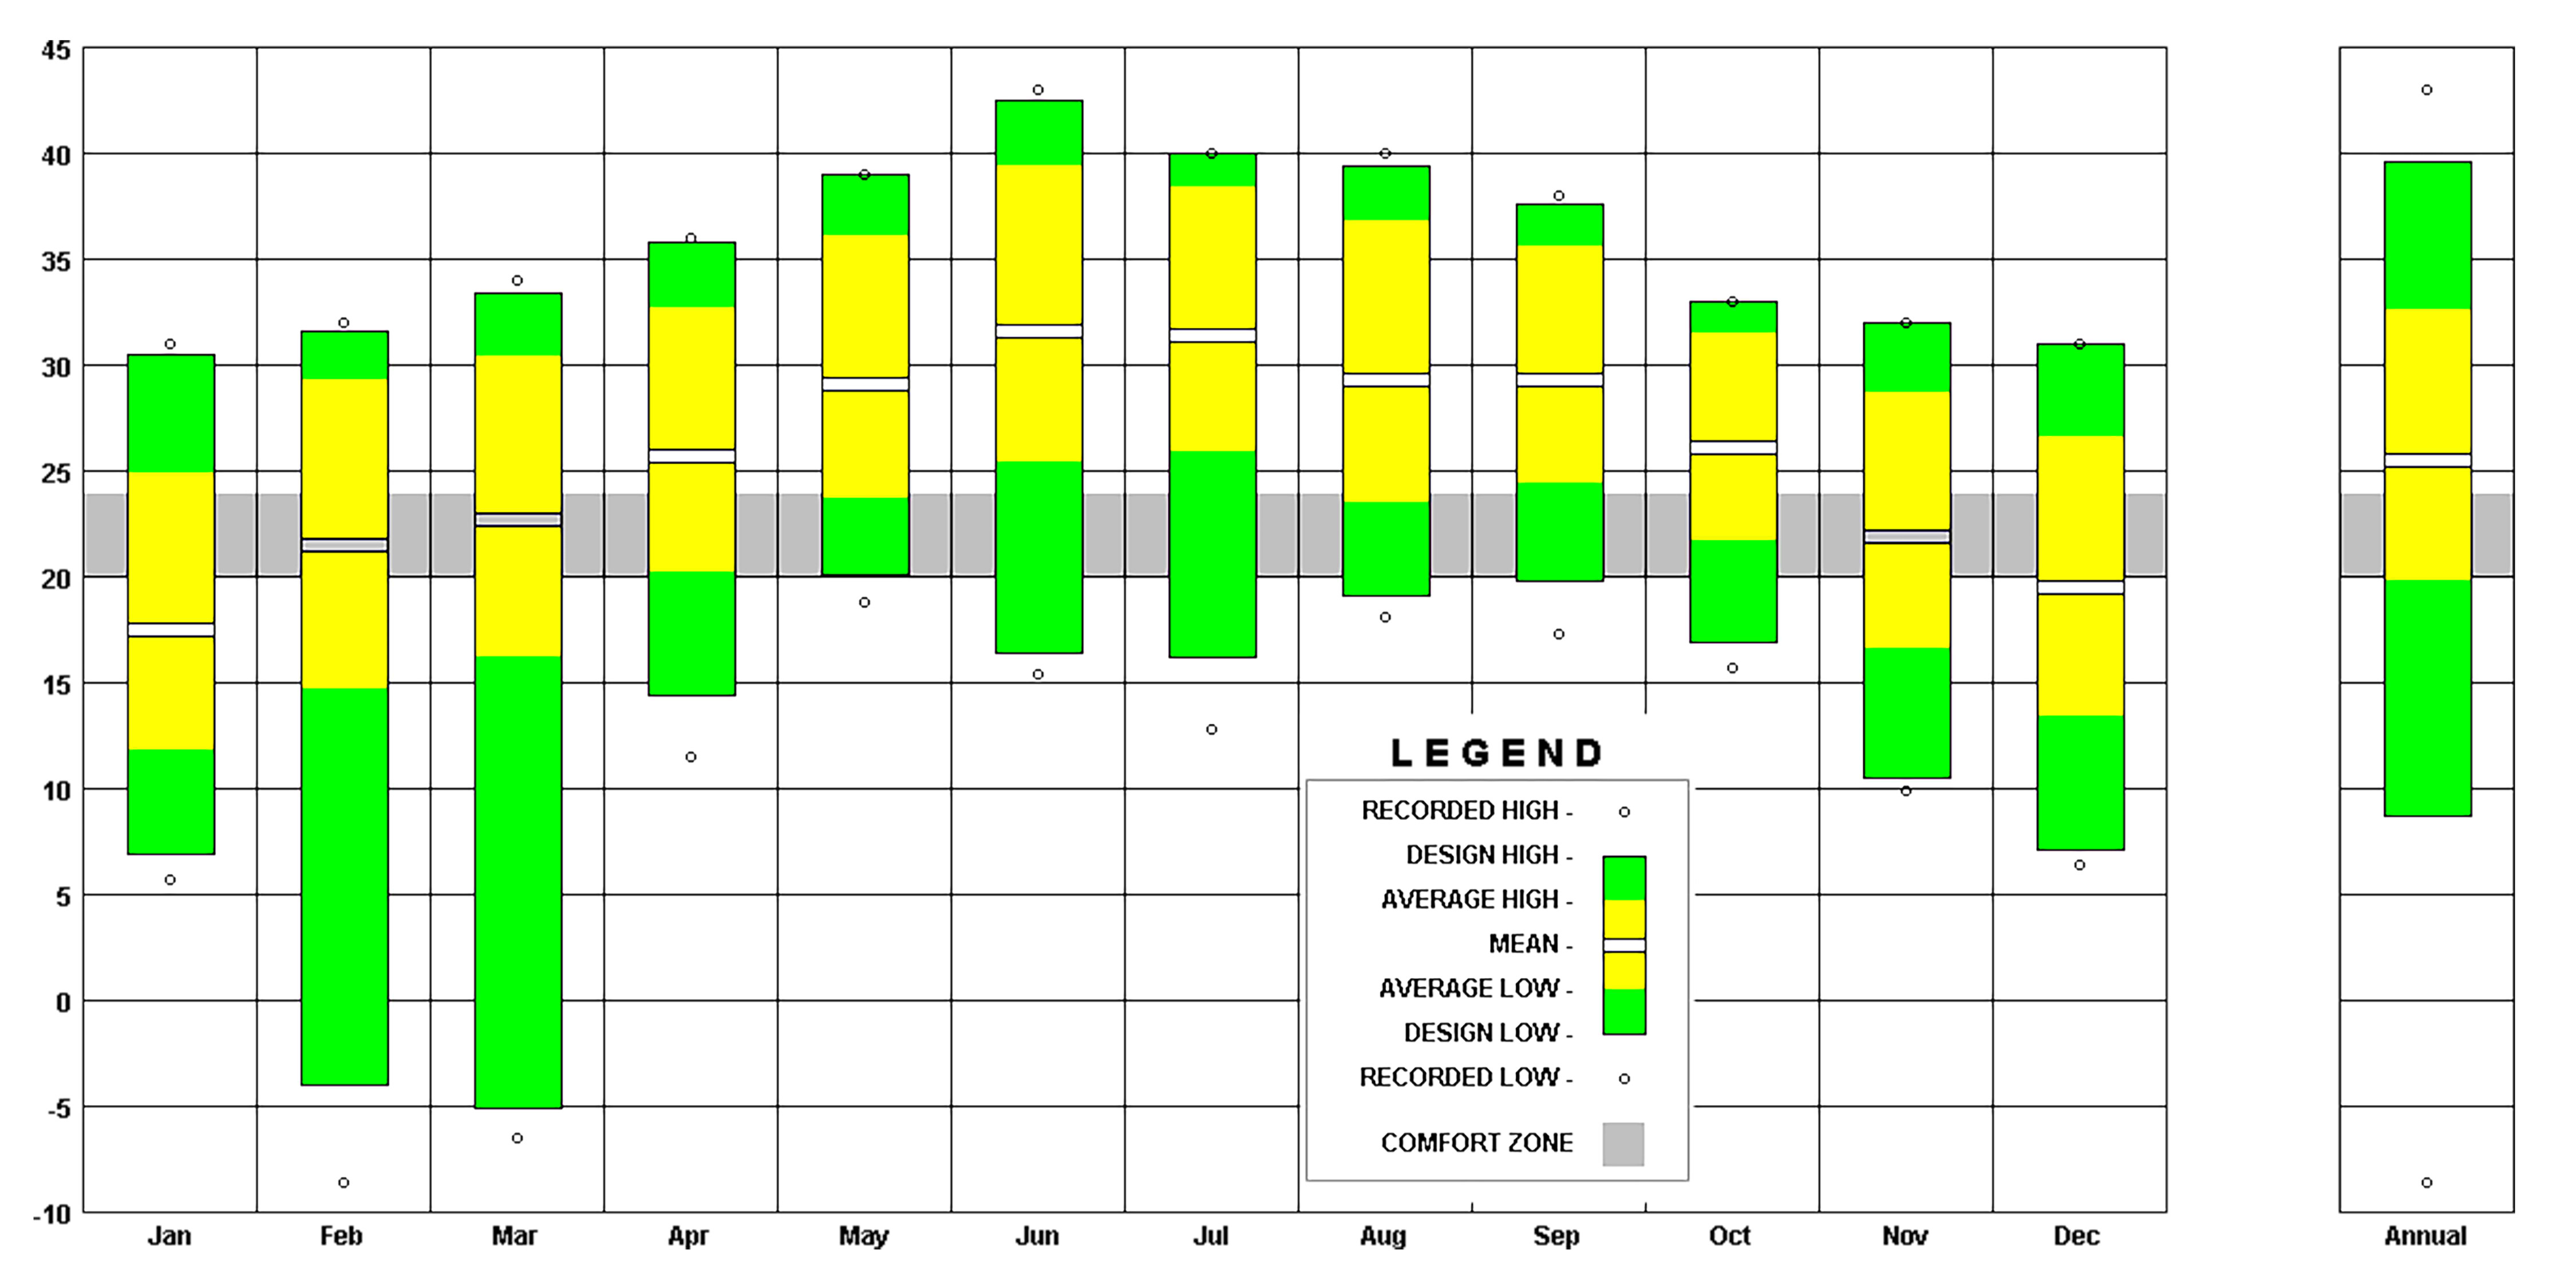
Fig. 2. Daily dry bulb temperature in Mukalla City, Yemen.
Figure 3
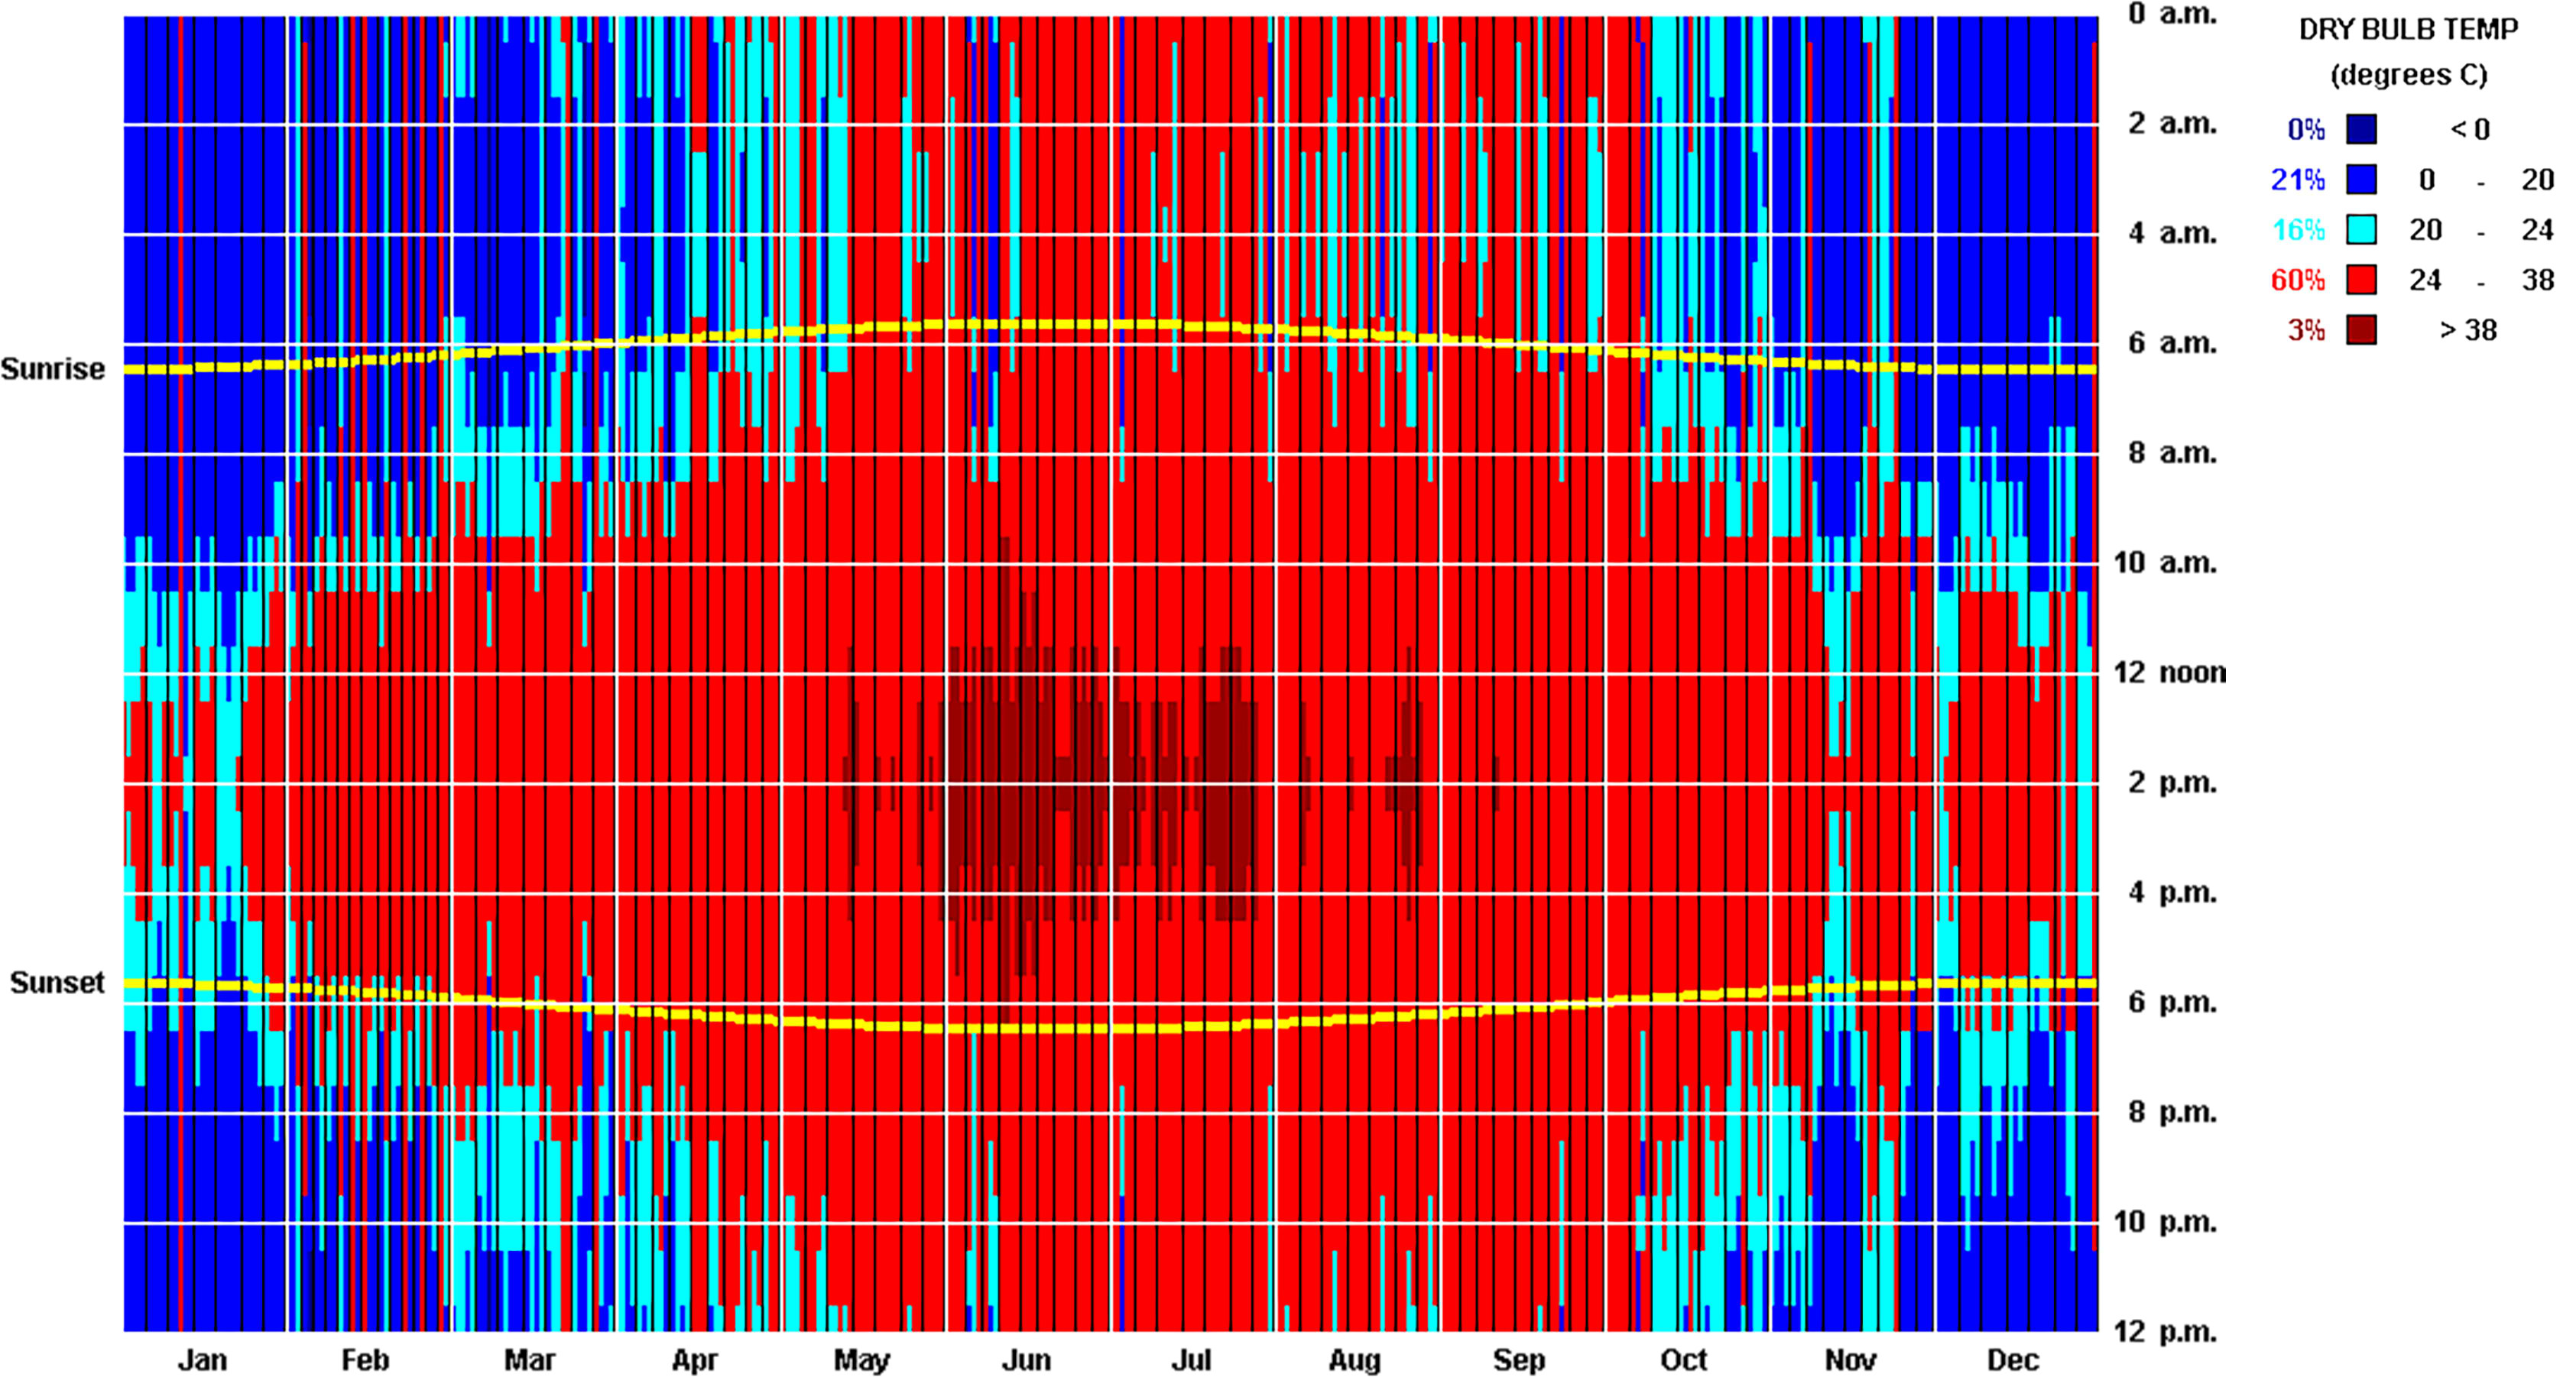
Fig. 3. Daily dry bulb temperature in Mukalla City, Yemen.
Figure 4
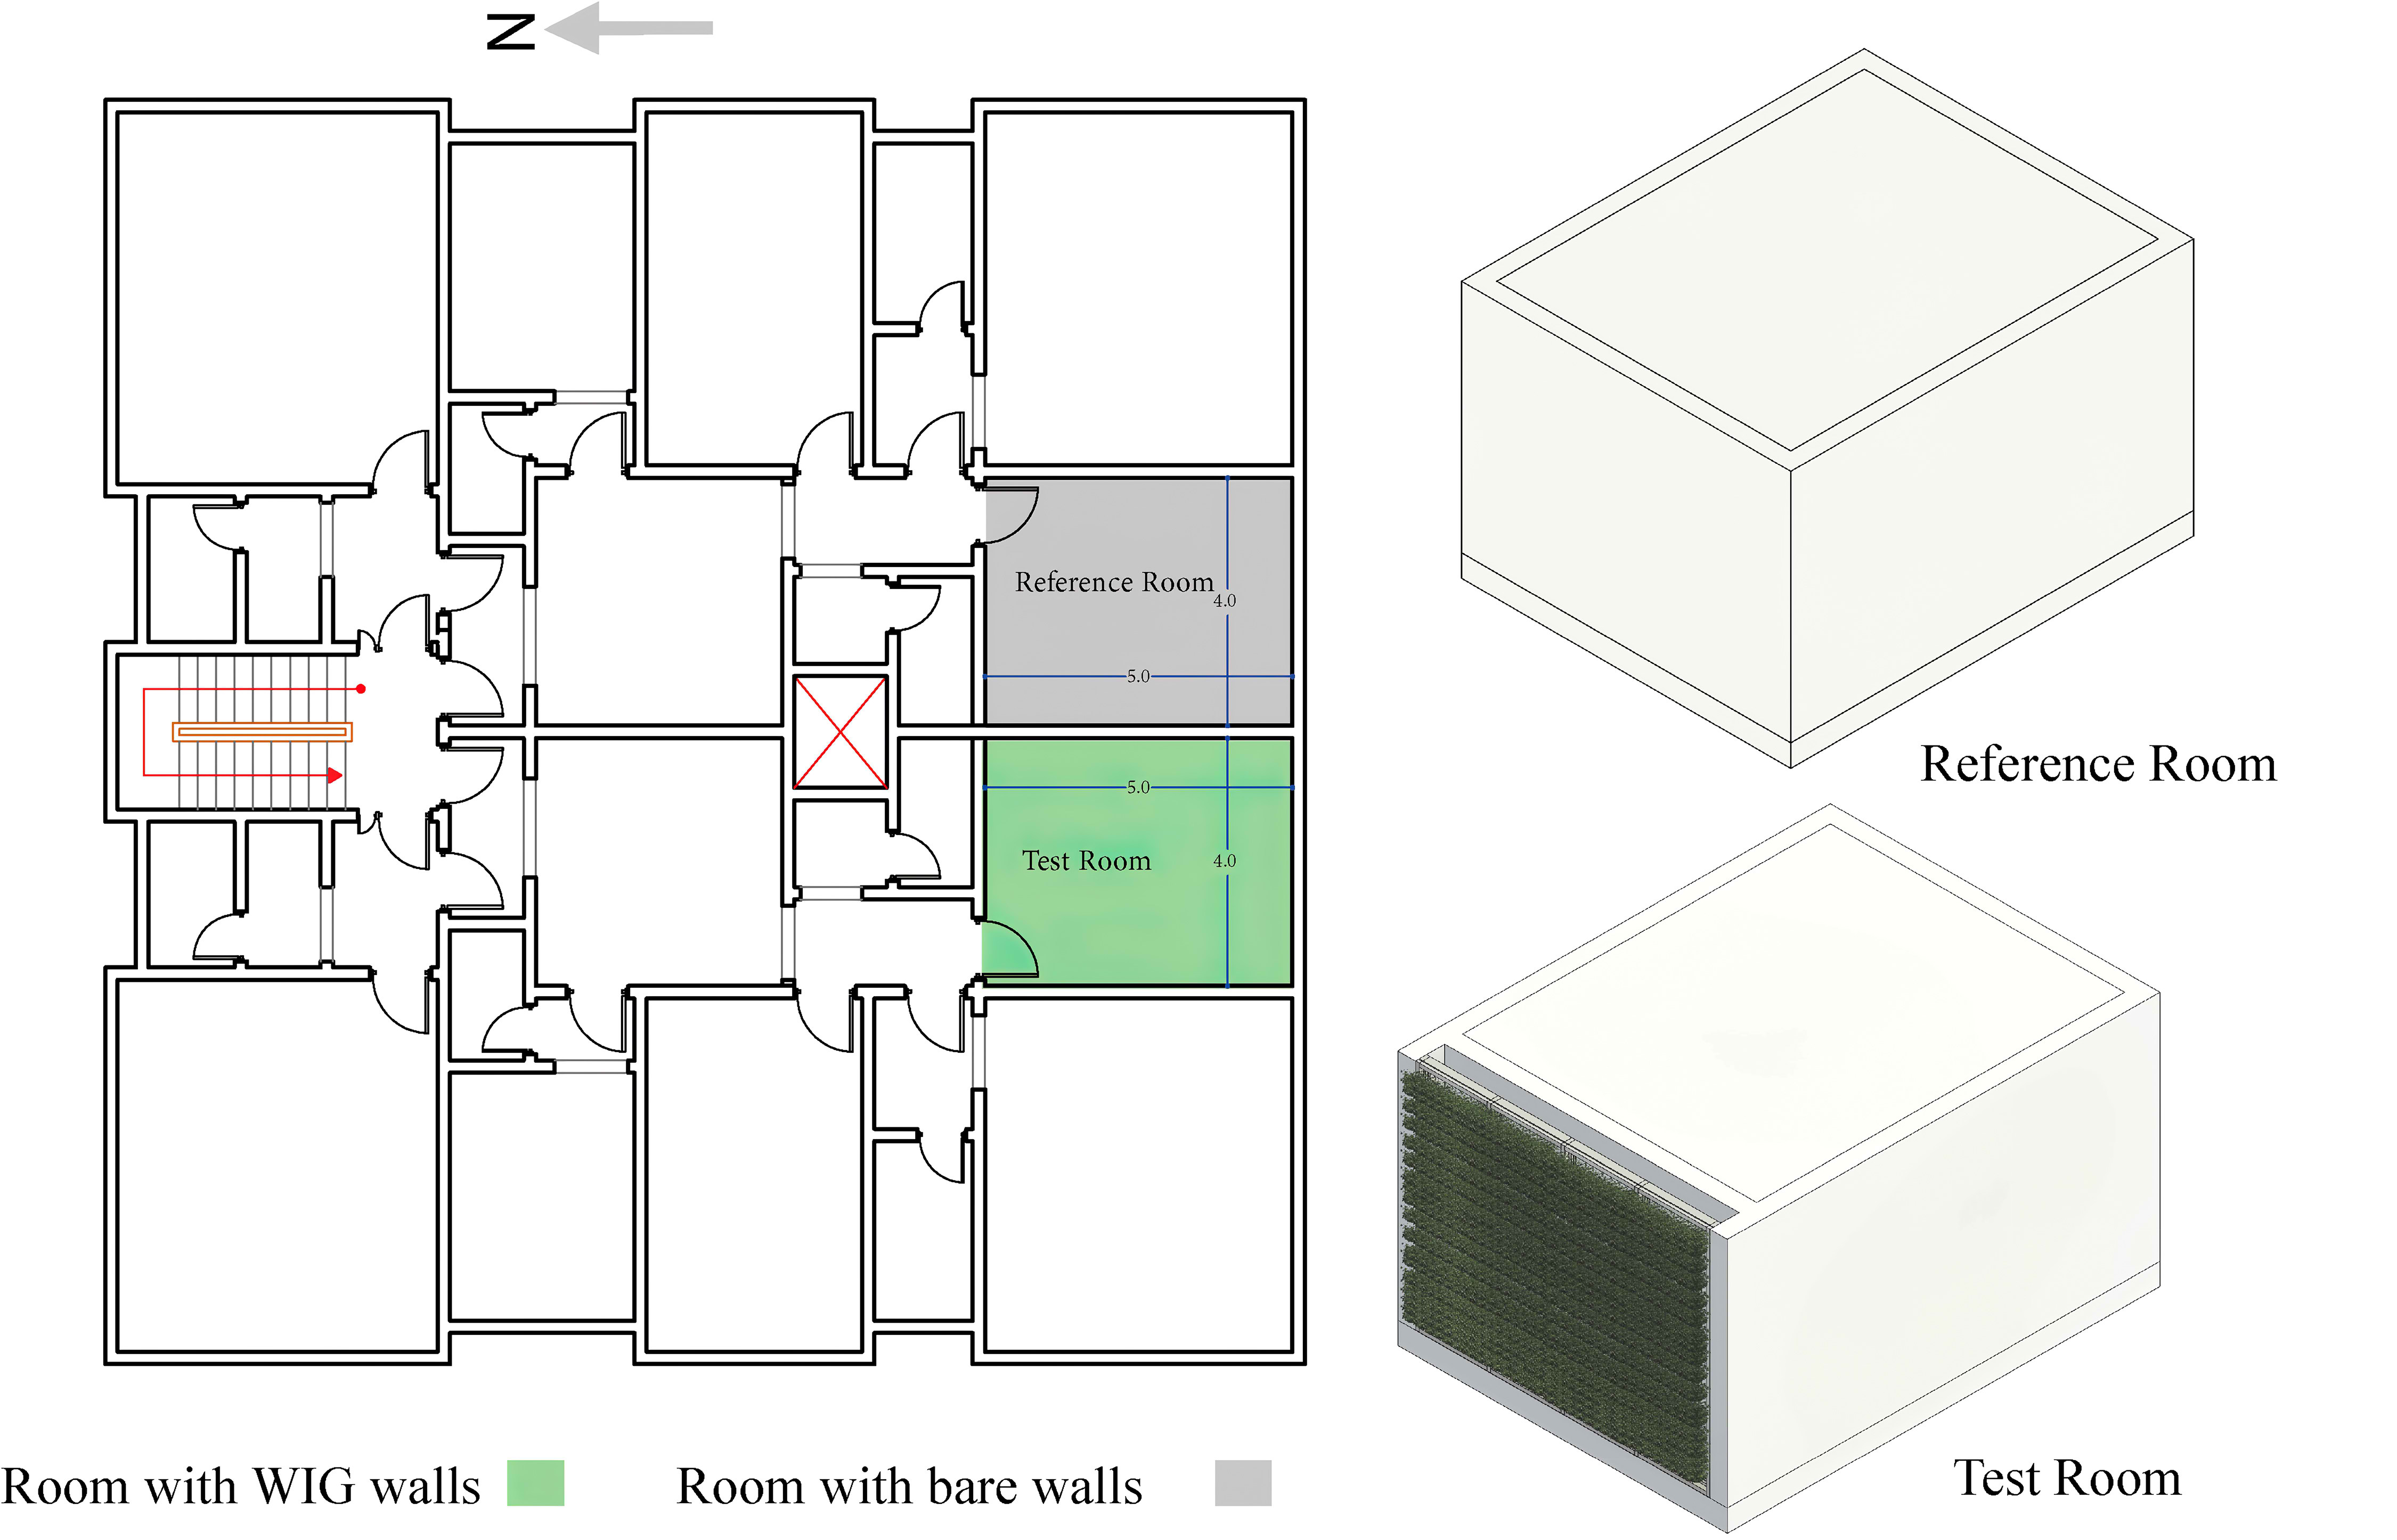
Fig. 4. Typical layout of third floor of residential building under study and the test rooms.
Figure 5
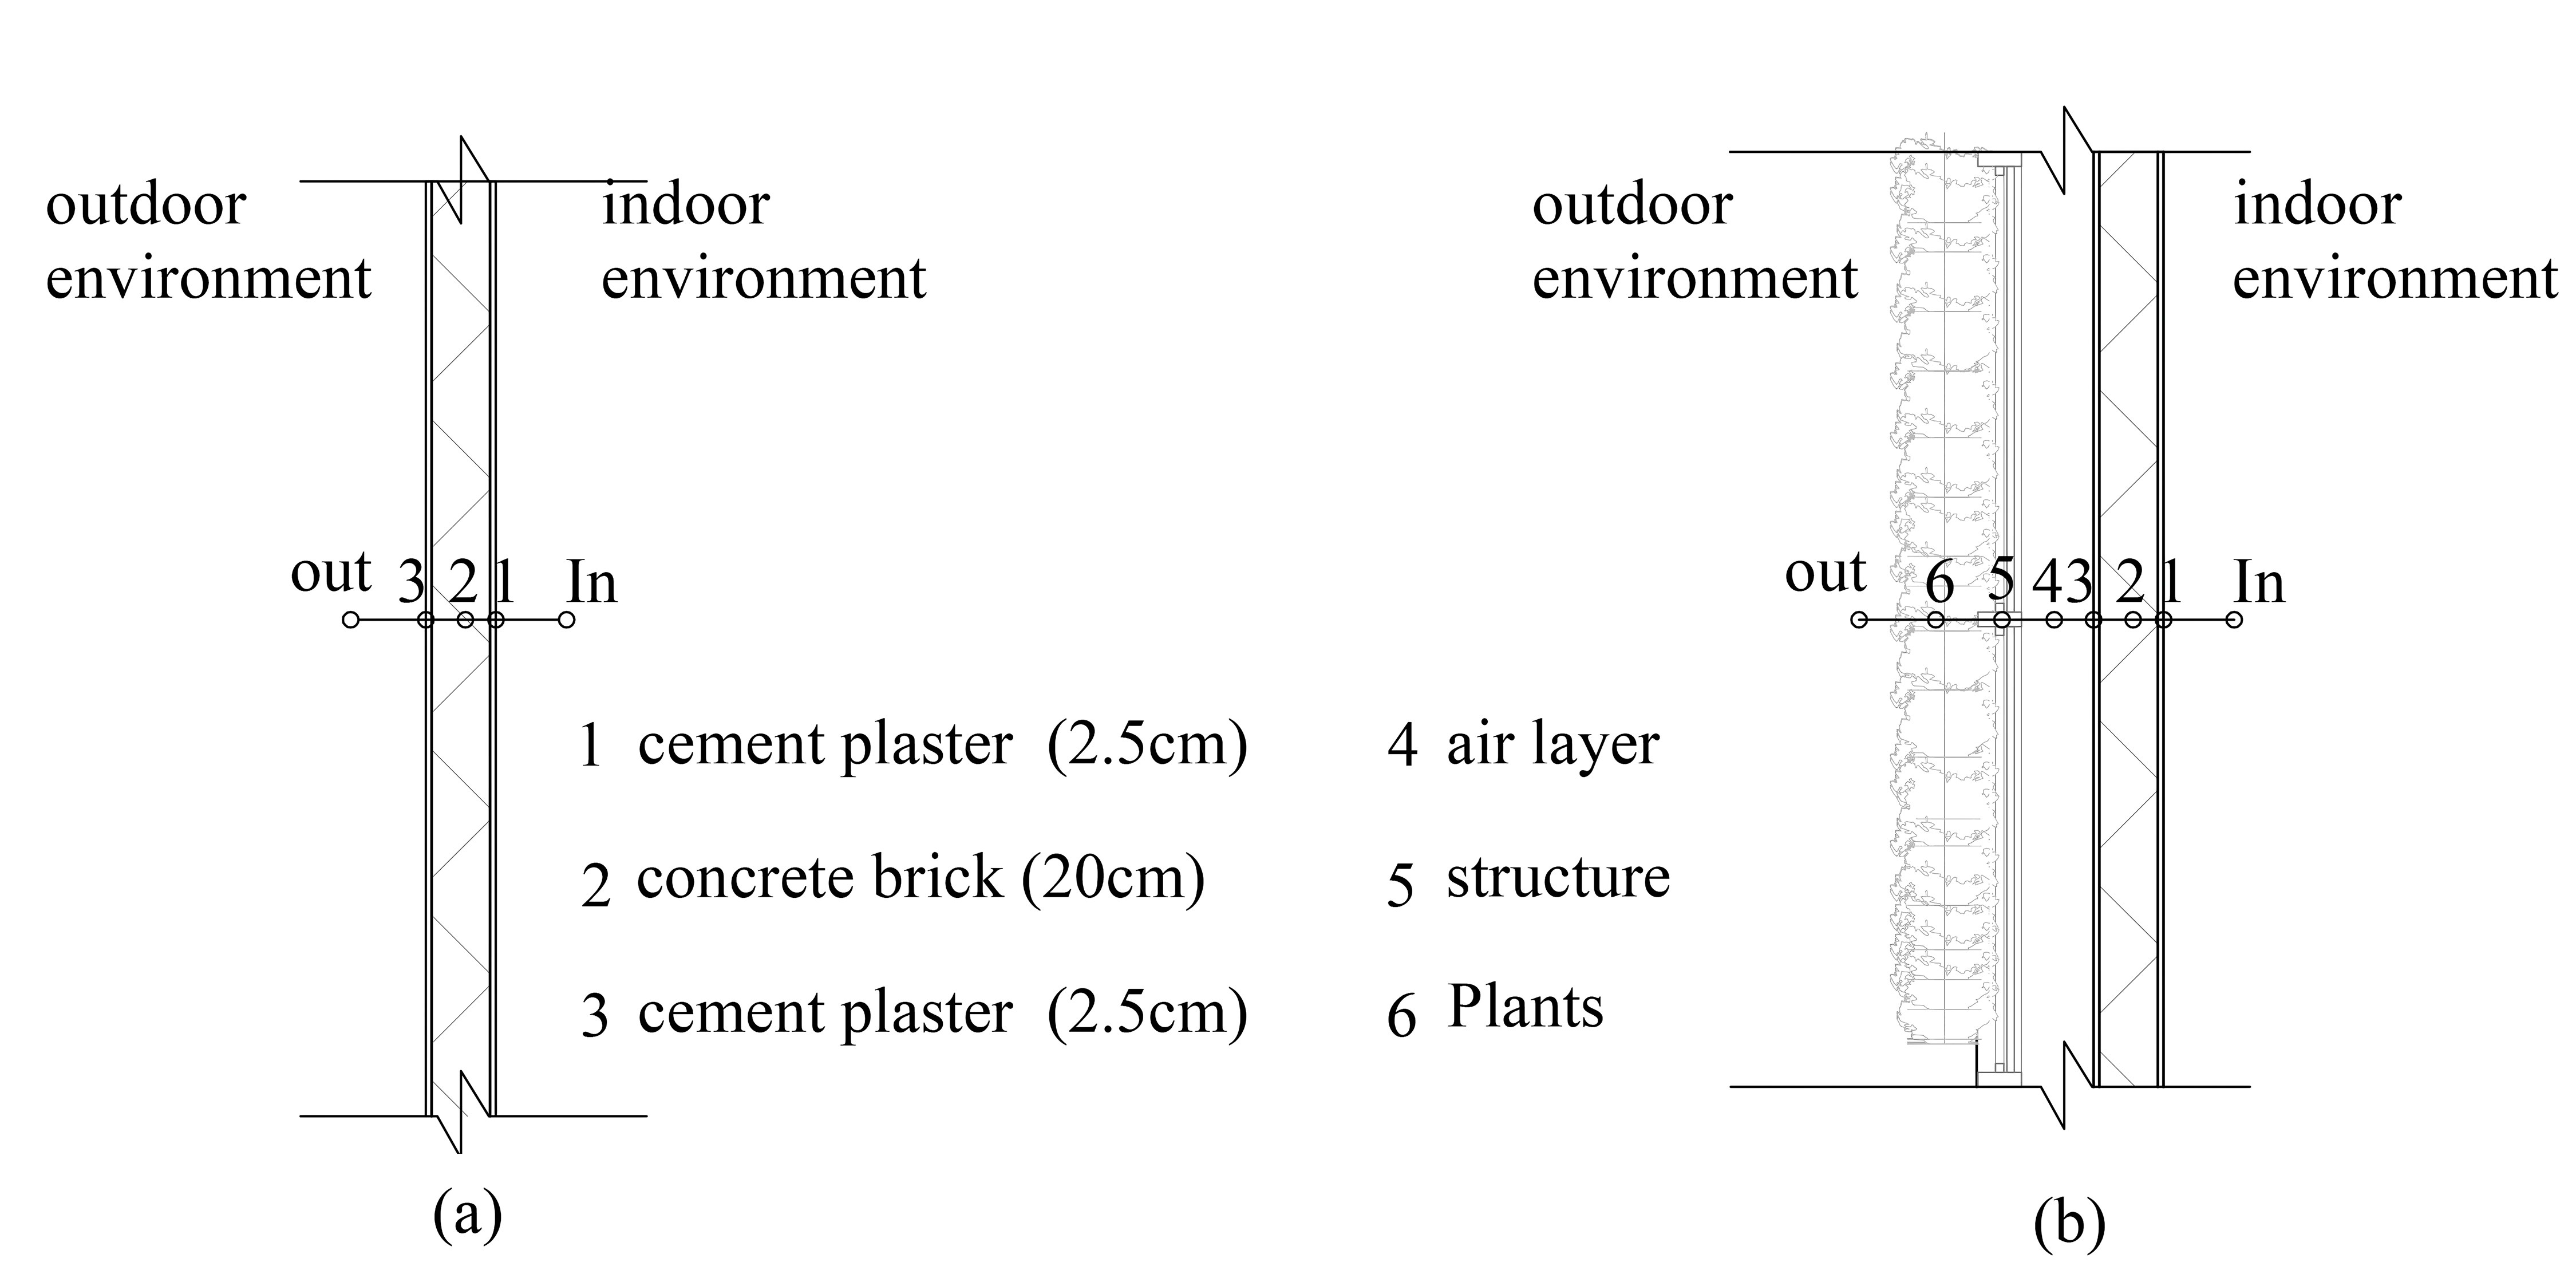
Fig. 5. Typical sections of (a) a bare wall and (b) wall with green system.
2.3. Description of the wall systems under study
From the field survey and the architectural and construction offices, and from the architectural drawings and design documents of local architectural residential buildings in Mukalla City, Yemen in the recent years. As illustrated in Fig. 6, there are six different forms of conventional bare walls construction. The details of construction materials of these six walls construction is listed in Table 2. The majority of wall construction in residential structures may be represented by these six types of bare wall construction. These six typical bare wall constructions identified were incorporated into this south wall facing of reference room so that six base wall (BW-1, BW-2, BW-3, BW-4, BW-5, and BW-6) cases were established (Fig. 6). Then greening system was incorporated into the six base case walls established and incorporated to test room so that six test green system cases (VGW-1, VGW-2, VGW-3, VGW-4, VGW-5, and VGW-6). The reference cases were modelled first by using Autodesk Revit using BIM model to calculate their OTTV values, then they were exported and modelled again with green system by using DesignBuilder based on EnergyPlus energy-model to analyse their thermal performance with and without green system.
Figure 6
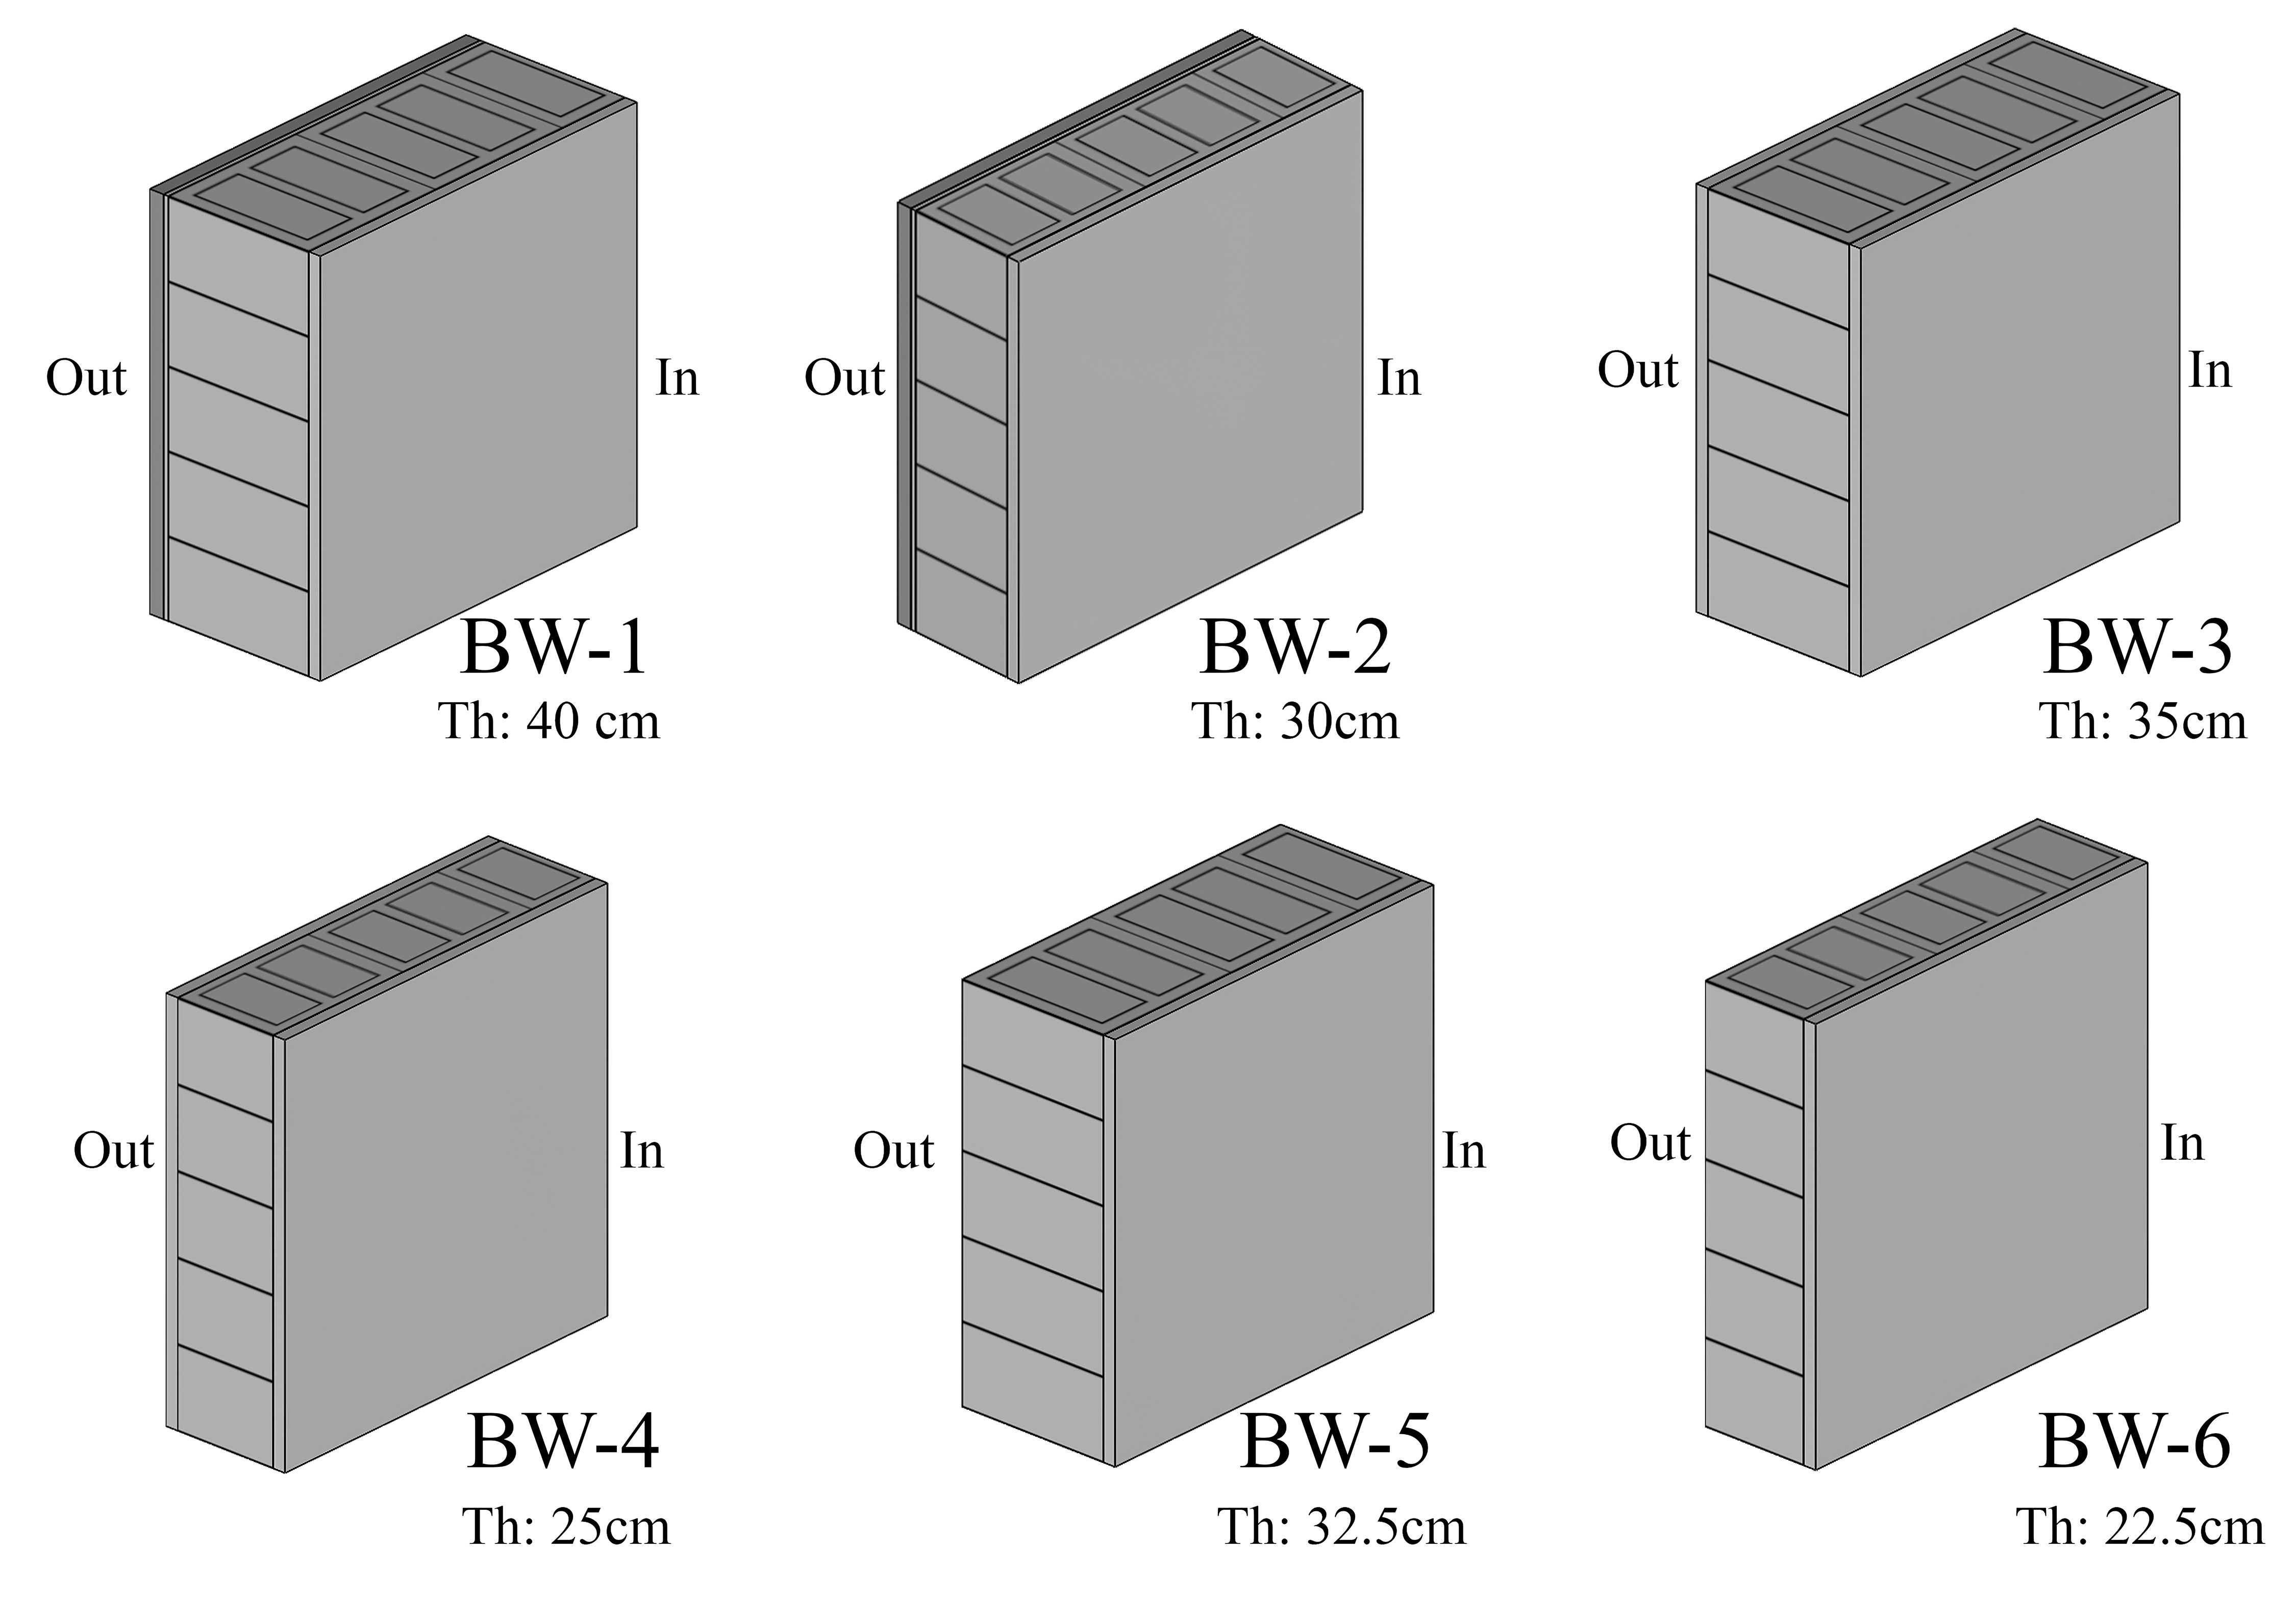
Fig. 6. The 3D model of six typical bare walls constructions identified for investigation.
Table 2
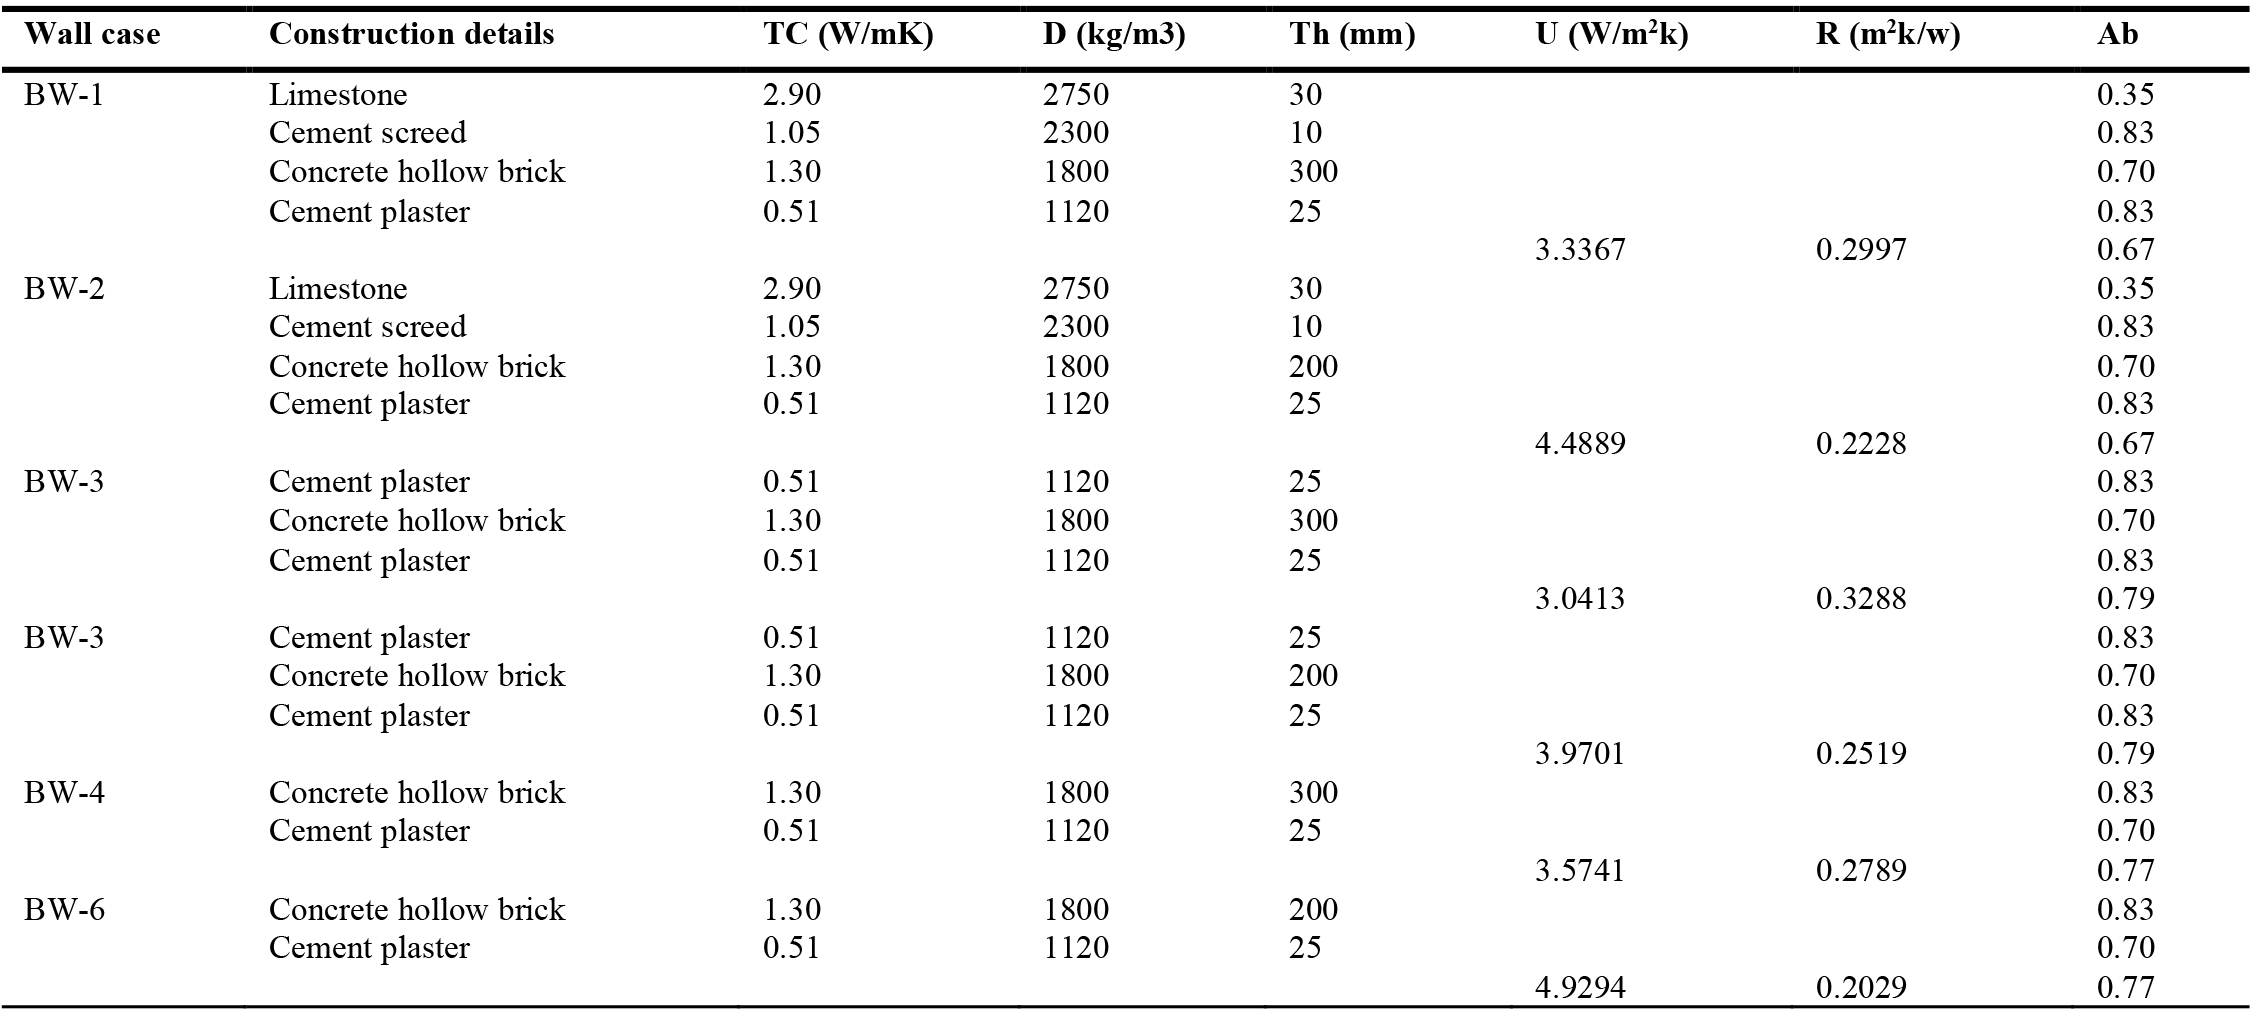
Table 2. Construction details of six typical bare wall constructions and their thermal properties.
2.4. The BIM energy-simulation model and greenery system parameters
The heat flux between building facades and the external environment in the presence of green walls is the subject of the simulation study developed in this research. To model the performance of buildings, a variety of software tools are employed, some of which assist computational optimization [46]. The method used in this study utilized two BIM assessment tools (Autodesk Revit 2022 and DesignBuilder 6). Engineers and researchers worldwide utilise Autodesk Revit, which is one of the most commonly used BIM codes, since it is a visual programming and user-friendly interface, it is used in this study to develop the OTTV based-BIM simulation method. DesignBuilder is an interface for EnergyPlus. EnergyPlus is one of the most well-known energy simulation tools, and DesignBuilder basically simplifies the process of building simulation [47]. As a result, using DesignBuilder considerably simplifies tasks like developing building models, designing the thermal characteristics of exterior elements, and defining schedules for things like occupations and HVAC systems [48].
On the basis of the current building design and material specifications, a building simulation model of the case study building has been built and validated. The geometry of the study building elements is modelled in Revit to create a 3D BIM model that contains the virtual equivalents of real architectural elements (Fig. 7(b)). Then the BIM model exported to gbXML format can be loaded straight into DesignBuilder, as DesignBuilder can support the quick transformation of BIM. Additionally, there is a "Design-Builder Add-in" for Revit that automates BIM model conversion into a DesignBuilder-compatible file [49]. In turn, the DesignBuilder was then used to calculate the indoor air temperature (Tia), cooling energy performance, and heat gains (HGs). The energy-simulation model developed in EnergyPlus of the residential building by using DesignBuilder is shown in Fig. 7(a). The model settings and constituent parameters of the green wall were elaborated and the parameters of VGW constituent materials were set based on the study by Li, Zhang [49] as shown in Table 3. The greenery were installed on the structure was adopted with an air gap of 80 mm between the room wall and the substrate based on the study by Hao, Xing [50].
Figure 7
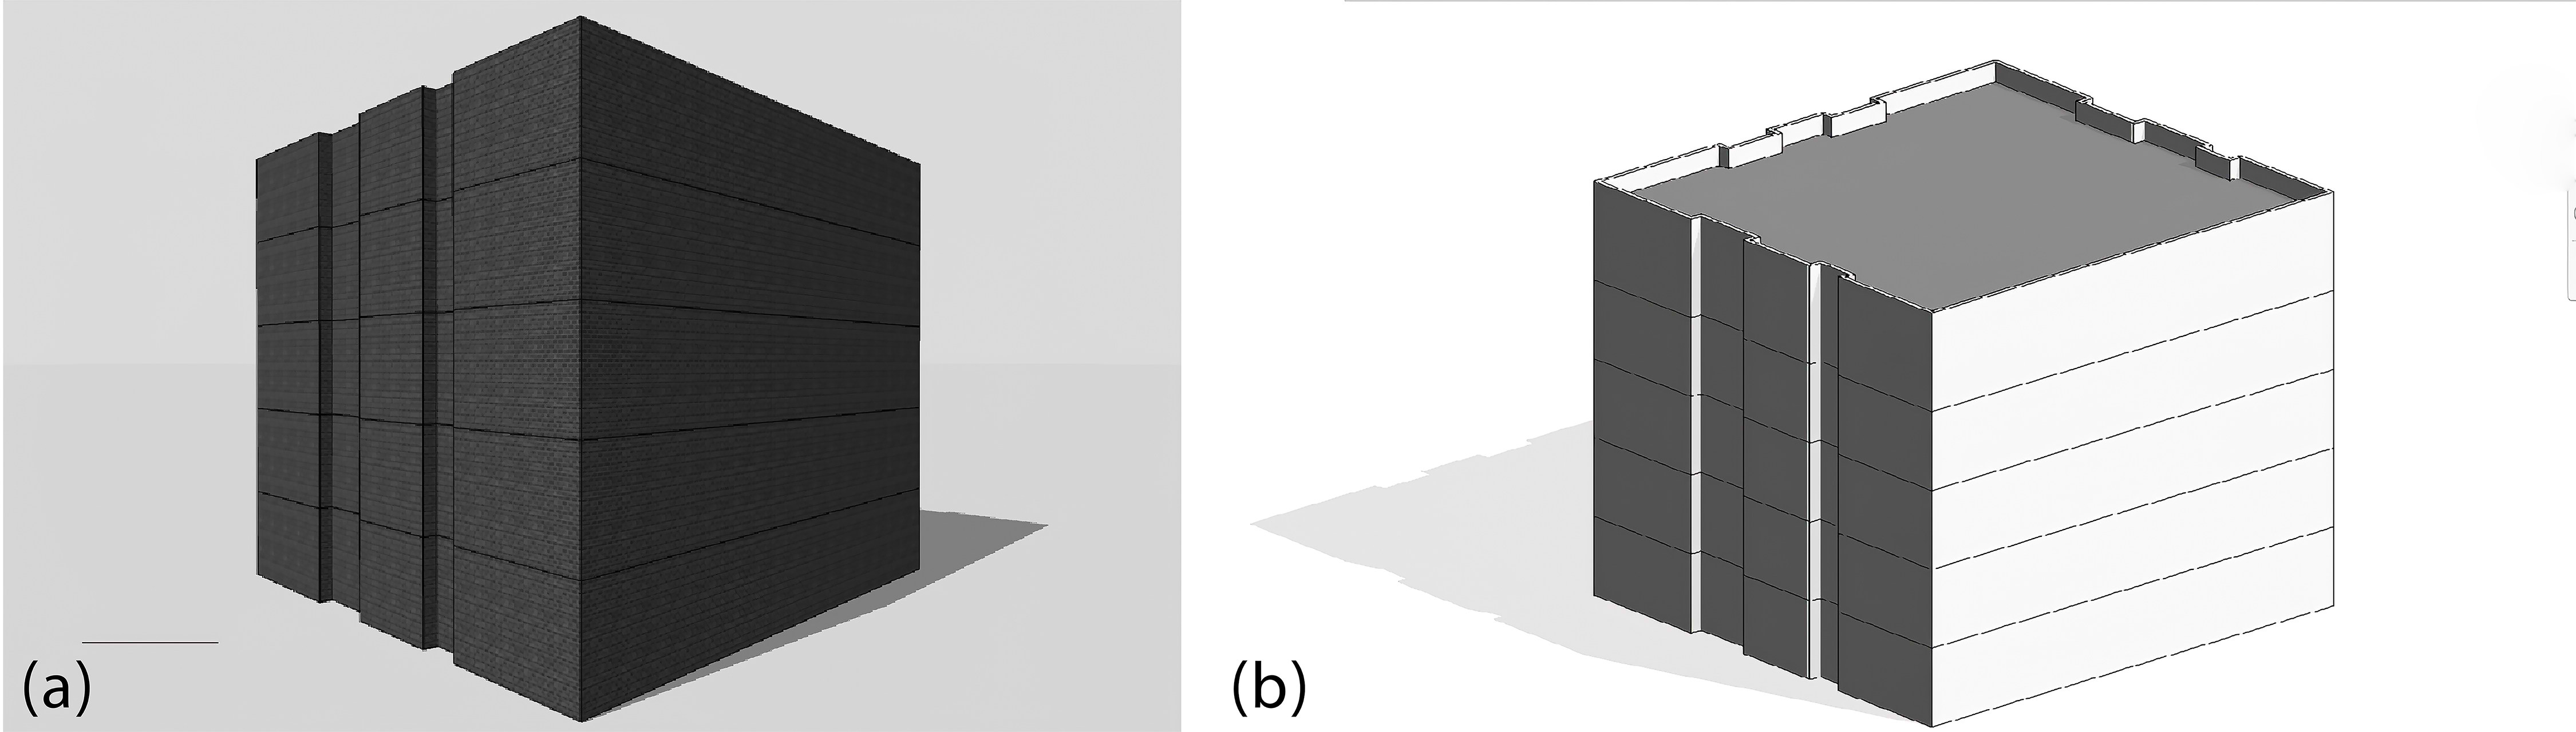
Fig. 7. (a) The developed EnergyPlus energy-simulation model of the residential building by using DesignBuilder and (b) Geometric BIM model of the residential building by using Revit.
Table 3
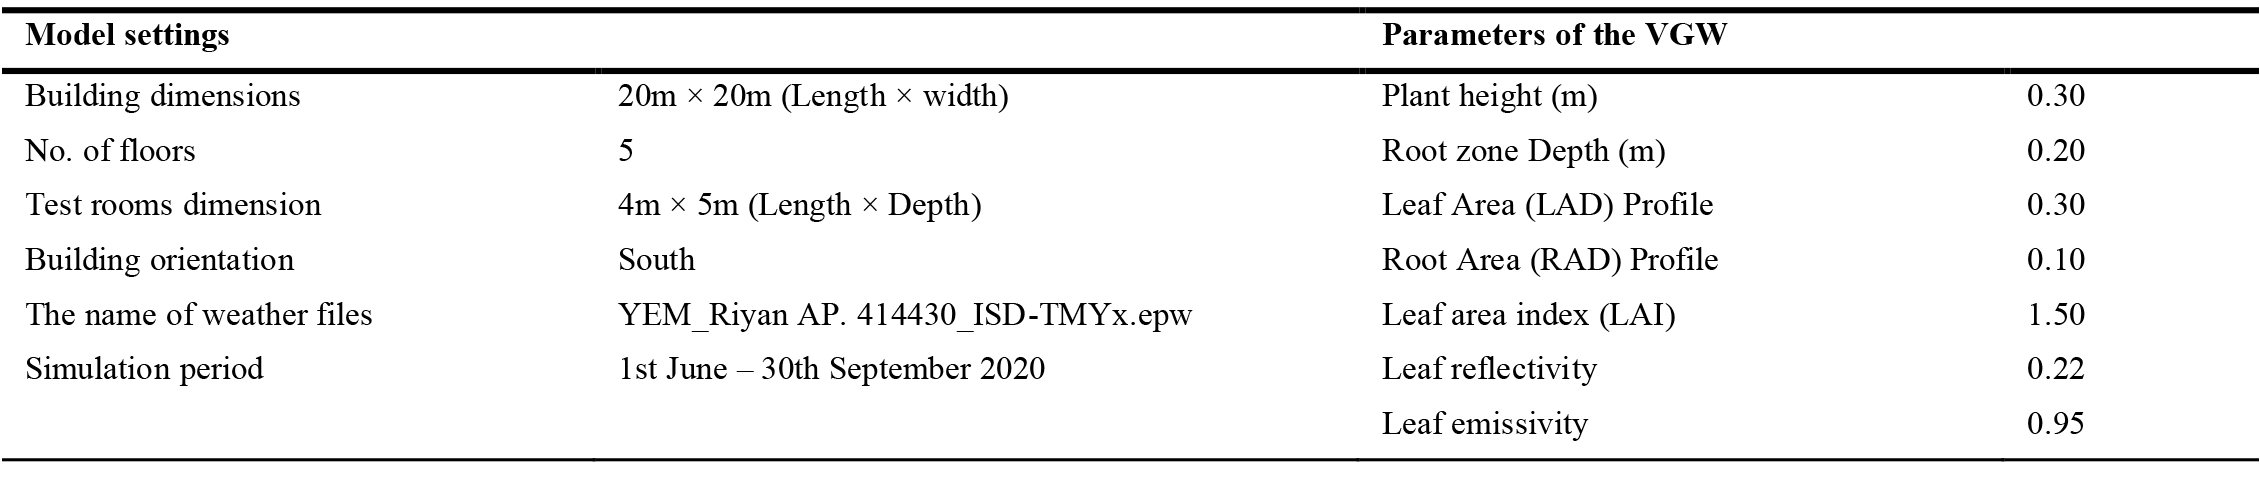
Table 3. Settings of simulation model and parameters of the green wall constituent materials.
2.5. Simulation conditions
In order to effectively analyse the thermal performance of indoor space to estimate the effect of the VGW system, specific meteorological information must be considered. The simulation was conducted in Mukalla City, which is in the Hadhramout Province of Yemen, featuring a typical hot summer and warm winter climate. The simulation lasted from June 1st, 2020, to September 30th, 2020, and covered the hottest dates during the year in Mukalla City, in Yemen to ensure the maximum possible ambient temperature and solar radiation intensity based on historical weather data to assess the impact of the VGW. In order to demonstrate the "worst-case scenario" for energy usage in sub-tropical areas dominated by cooling demands, each room was modelled as a thermal zone and set to be fully air conditioned throughout the year with a cooling set point temperature of 26°C during the day based on most previous studies; i:e [46,51,52] and this was set back to 28°C taking into consideration the local climate conditions as the maximum threshold. The general settings for a typical apartment building in DesignBuilder are listed in Table 4 based on Zhang, Xu [53] study. The model run lasted 24h, starting on 1st of June and lasting until 30th of September 2020 to cover whole cooling season. Climate data for Yemen was obtained from the U.S. Department of Energy's EnergyPlus climate file database (epw) (see Table 3).
Table 4
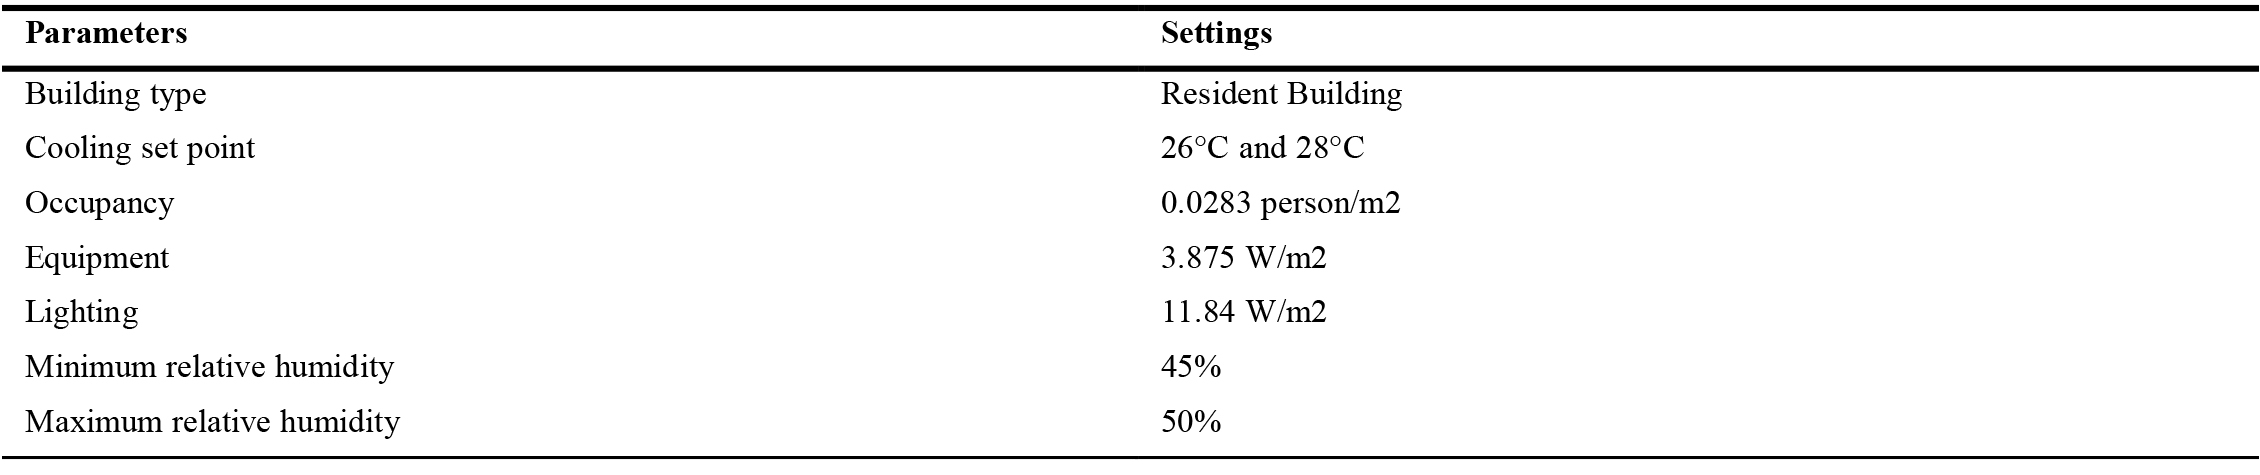
Table 4. Input factors and settings assumed for the building energy simulation in DesignBuilder.
2.6. Calculation of the OTTV of walls
Originally, ASHRAE standard 90:75 introduced the OTTV formula, which included the integration of building design and environmental conditions. As illustrated in equation (1), the original OTTV equation can be stated in terms of WWR, assuming for a specific climatic location, the climatic factors and the local parameters remain unchanged, and these parameters are represented by solar factor (SF), Equivalent temperature difference (TDeq), and temperature difference (ΔT). These parameters are average values related to the outdoor ambient temperature and the solar radiation [5].
As previously stated, to compute OTTV for conventional building materials exterior walls and roofs, the equations (2) and (3) were used [2]. When it comes to calculating OTTV, the standard practise is to compute them for individual walls that have the same orientation and construction, and then, the OTTV of the whole exterior wall calculated by taking the weighted average of all of these values (Eqs. (4)) [20].
where, Aw, area of the opaque walls; Uw, U-value (thermal transmittance) of the opaque walls (W/m2K); absorptivity (ɑw), TD, equivalent temperature difference; Af, area of fenestration (m2); Uf, U-value of fenestration; SC, shading coefficient of fenestration; SF, solar factor for that orientation; Ai, gross area of the walls, OTTVi, is the OTTV of walls with same orientation and construction, and ΔT, temperature difference.
3. Validation simulation model
Several earlier studies conducted to validate DesignBuilder based on EnergyPlus model to simulate building performance in several countries were analysed by contrasting the real measurements and simulated values. The study compared simulated Tia with real measured data to evaluate the accuracy of the EnergyPlus energy-model. The simulation model has been remodelled to be the as same as the measured room. Comparisons of the indoor temperature obtained from the real measured and simulated for the resident room from June to September as shown in Fig. 8. Specifically, maximum simulated indoor temperature is 33.3◦C, 31.6◦C, 31.0◦C and 30.1◦C respectively. Comparing with the actual indoor temperature 35.2◦C, 35.8◦C, 33.7◦C and 34.2◦C respectively, as a small error between simulation and field measure. Nonetheless, the computer simulation results follow the same pattern as the measured data. The results from real experiment showed that the results of indoor temperature indicator vary in an acceptable range, signifying that the simulation energy-model is valid. To sum it all up: The simulated findings for the residential room are typically in line with the actual results obtained. This means that additional thermal performance research may be done with confidence using the simulated energy model.
Figure 8
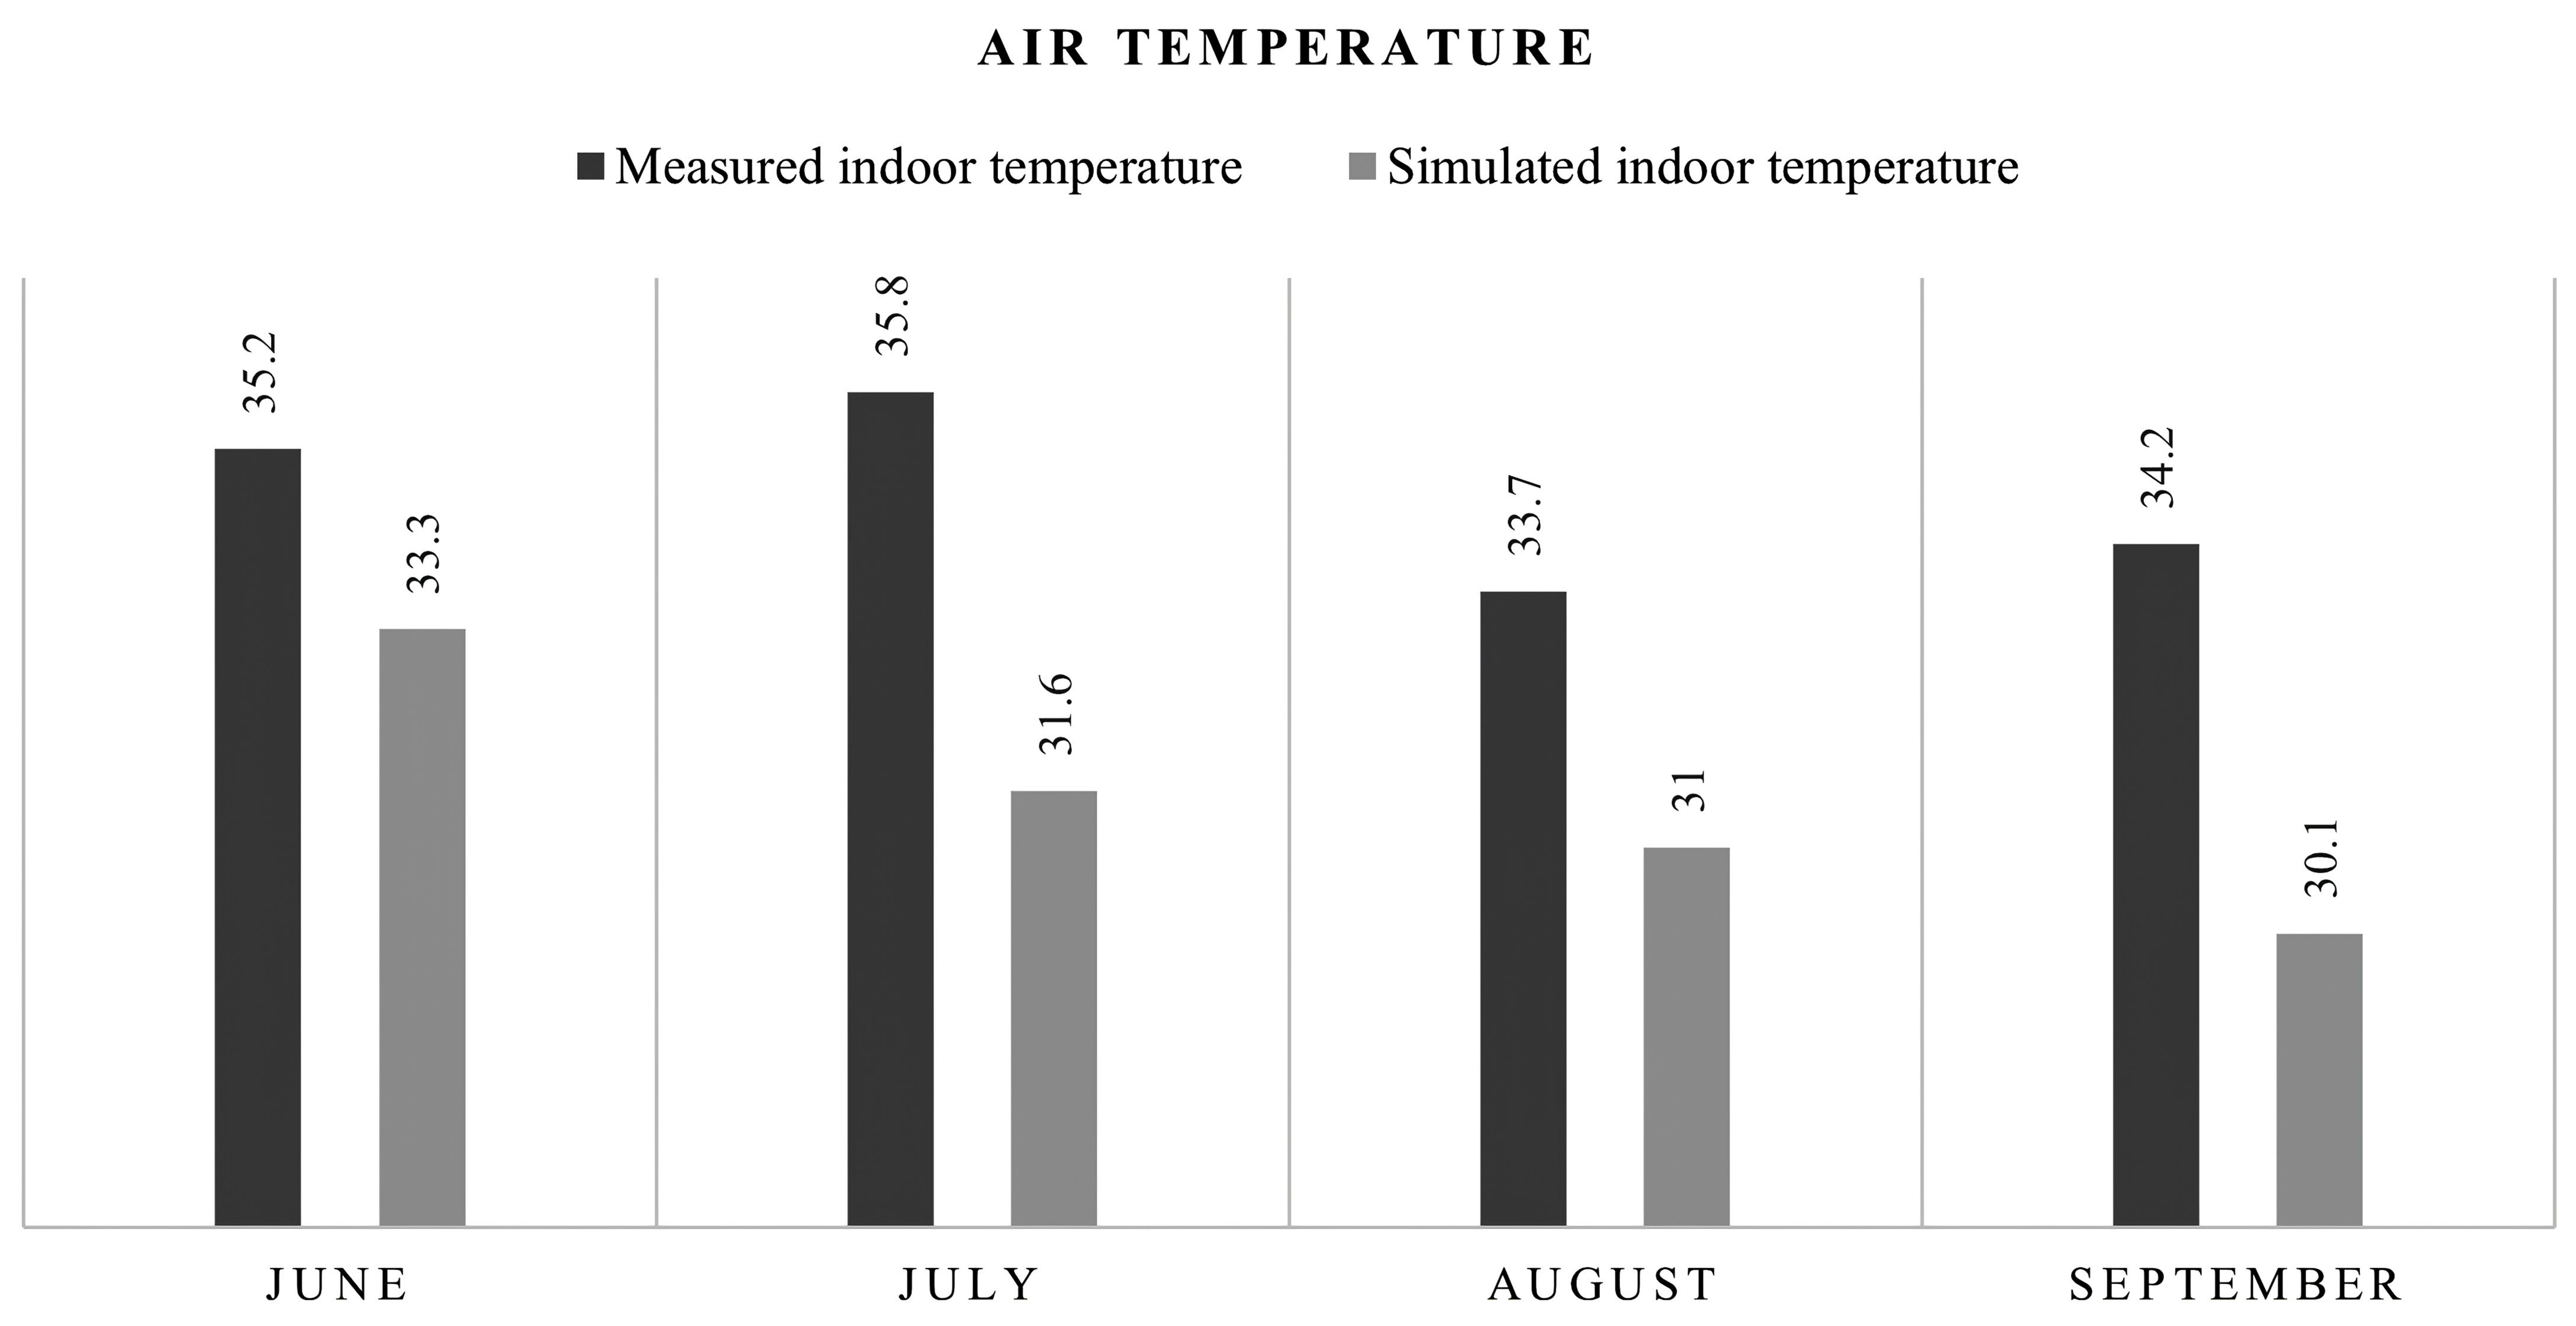
Fig. 8. Comparisons of the indoor temperature obtained from the real measured and simulated for the resident room.
4. Results and discussion
This research study comprises the comparison of Tia, cooling energy performance, and HGs in different walls construction with different OTTV values between non-green bare walls, identified as reference walls, and a wall covered with greening system, identified as VGW system. As mentioned in section 2.3, a combination of six wall compositions with VGW system (VGW-1 to VGW-6) and reference walls cases (BW-1 to BW-6), results in 12 options that have been calculated with meteorological input data from Mukalla city in Yemen.
4.1. OTTV calculation using BIM database
To address the problem of exterior walls overheating due to continuous exposure to solar radiation of conventional residential building with high thermal mass, the best option is to reduce the wall temperature and heat flux of the opaque wall assembly. In order to assess the VGW system, a correlation between the OTTV values of typical bare wall structures and the thermal performance of the wall with green system over the cooling season must be established. From the OTTV analysis, the wall with a relatively low OTTV would have better thermal behaviours under sub-tropical climate during the cooling season period. Table 5 presents the thermal properties and OTTV values calculation of the six reference walls construction. The results highlighted that the OTTV values of reference walls assessment based on wall composition of layers showed that the wall with highest OTTV has less layers compared to walls that have multi-layers.
Table 5
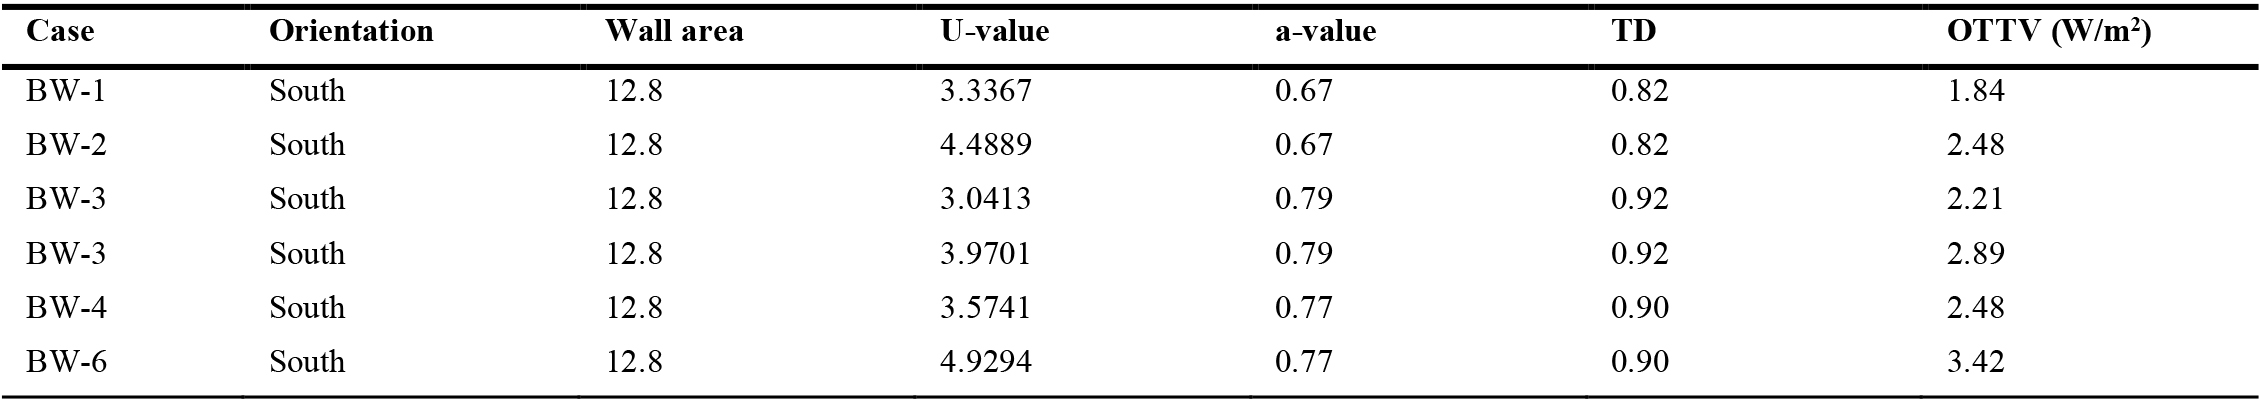
Table 5. Thermal properties and OTTV values of the six wall constructions.
4.2. Thermal performance of bare walls and VGW system
Simulations were conducted with the aim of estimating the thermal performance of VGW systems applied to different wall constructions with different OTTV values, to develop a correlation between the effects of OTTV values of a bare wall construction and the VGW system. The hourly Tia, monthly heat gain, and monthly cooling performance over the cooling season, are used. The OTTV values of the south walls was different by increasing the number of the construction layers (Table 5). Following the derivation of the needed OTTV coefficients, all coefficients are aggregated and utilised as a set of input variables to compute thermal performance through simulation. The thermal performance of VGW system is estimated after obtaining the results of the OTTV computation in the first step by comparing the outcomes of the thermal performance reference cases with OTTV standards. The simulations were run in the cooling season (1st of June to 30th of September) to examine the thermal performance of the VGW by evaluating the Tia, heat gain, and the cooling performance of all VGW system scenarios (VGW-1 to VGW-6) applied to reference walls as mentioned before (Table 2). The comparison of results between reference walls (BW-1 to BW-6) allows to understand the effect of OTTV based on their composition (see Fig. 6). The change in the external wall characteristics resulted in different OTTV values, which had a significant effect on temperatures were higher in the original façade than on the VGW system.
4.2.1. Influence of VGW on indoor air temperature (Tia)
The comparison between the Tia of the reference room with bare walls (BW-1 to BW-6) and those of the test room with VGW system (VGW-1 to VGW-6) showed a significant result as shown in Figs. 9-14. Inside both rooms, the Tia of the reference room were much higher than the test room. Tia reached 33.3◦C, 33.9◦C, 34.2◦C, 34.2◦C, 34.5◦C and 35.1◦C respectively, as the maximum values while those of the room with VGW were limited to 32.1◦C, 32.5◦C, 33.1◦C, 33.5◦C, 33.9◦C, and 34.1◦C respectively. The findings revealed that the Tia were 1.2◦C, 1.4◦C, 1.2◦C, 0.7◦C, 1.3◦C, and 1.1◦C respectively, higher on the reference room with bare walls than those of the test room with VGW system as shown in Fig. 15.
Figure 9
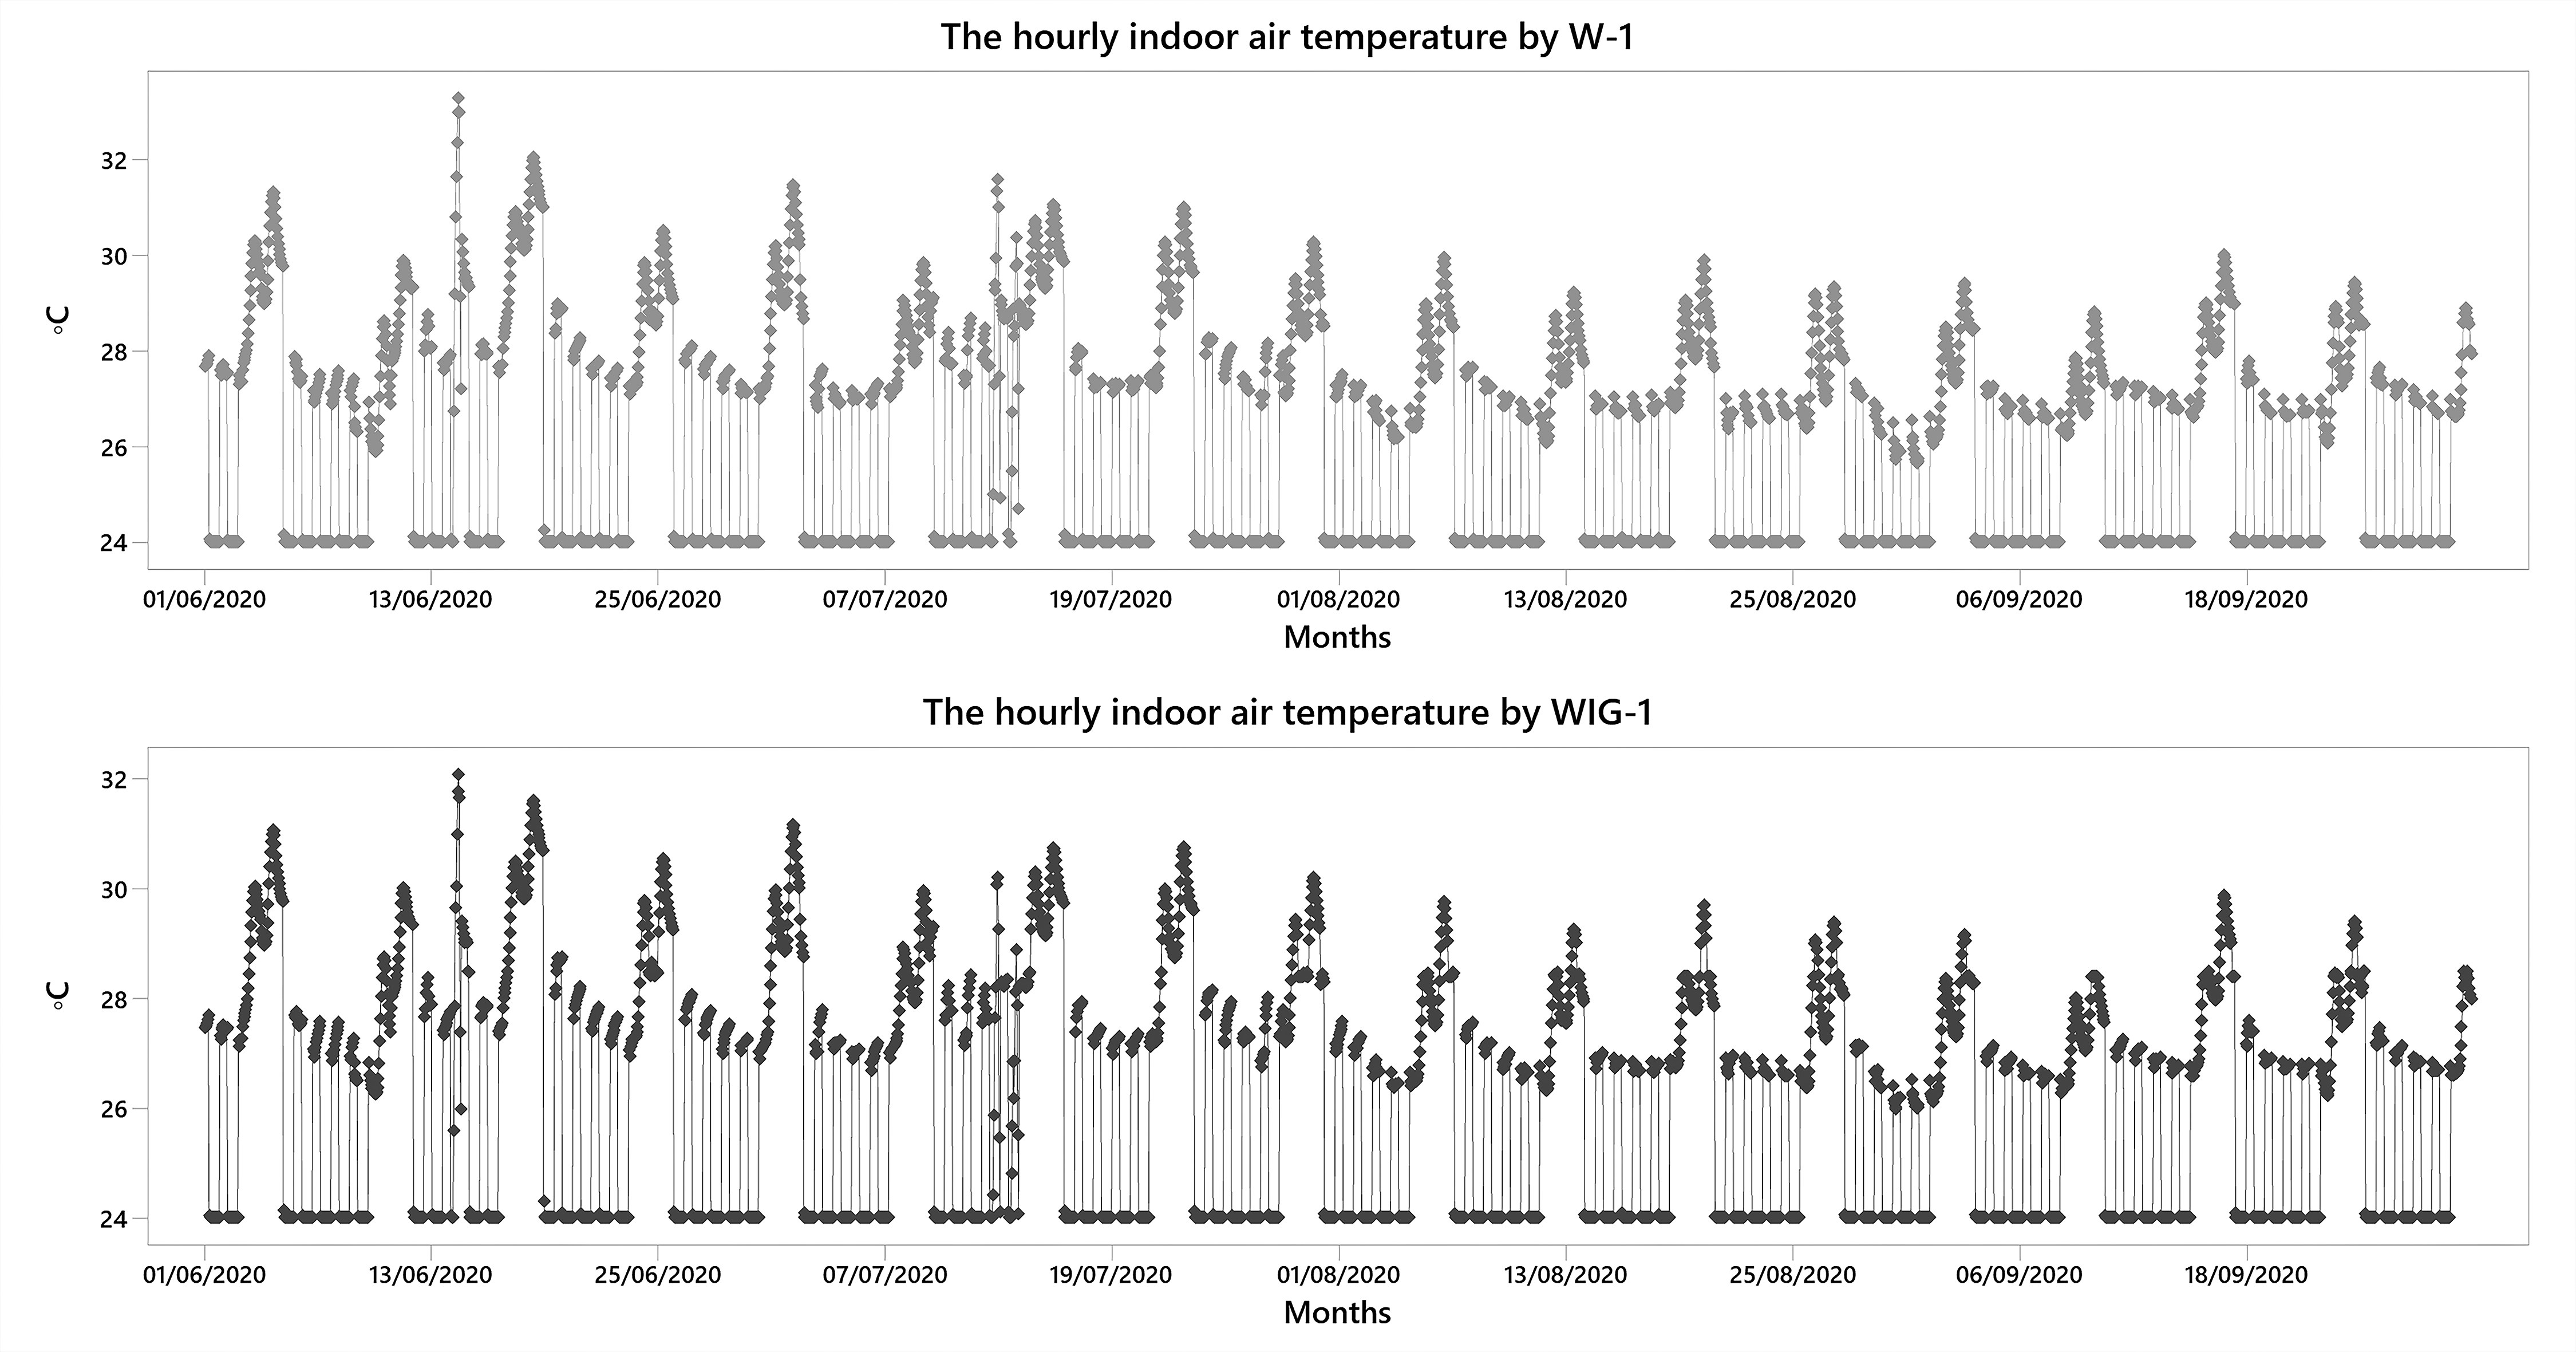
Fig. 9. Comparison between the Tia of the reference BW-1 wall and VGW-1 green wall (summer period) of both rooms.
Figure 10
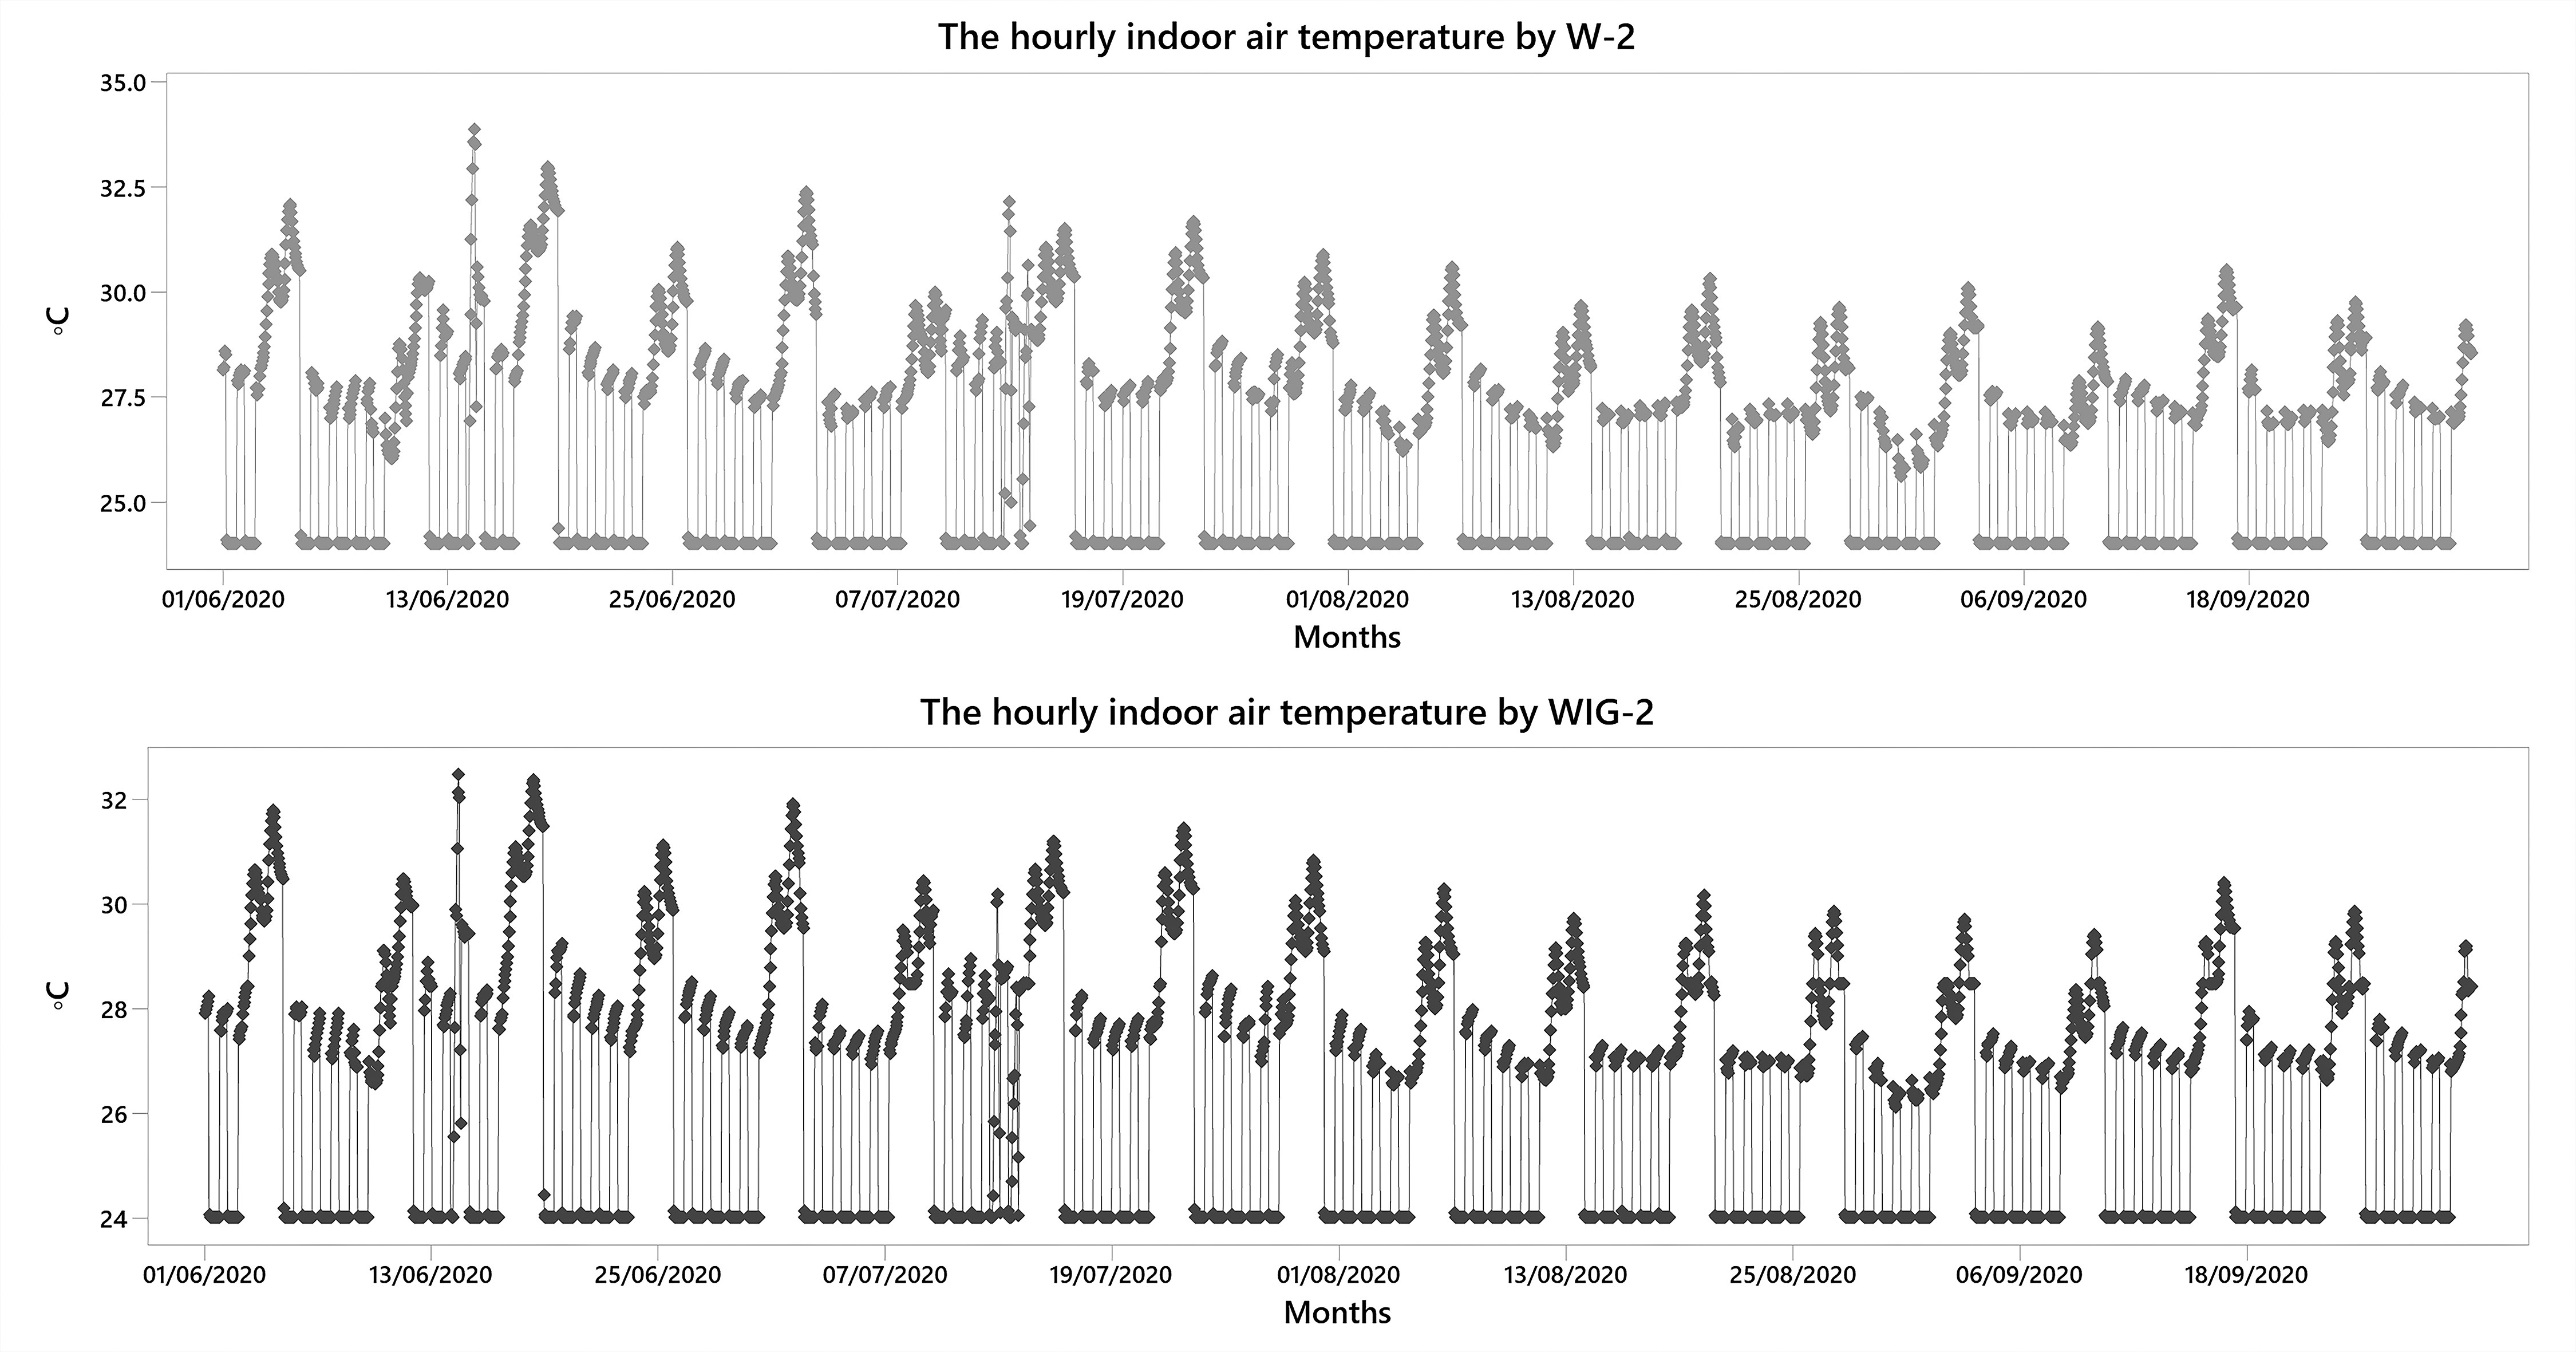
Fig. 10. Comparison between the Tia of the reference BW-2 wall and VGW-2 green wall (summer period) of both rooms.
Figure 11
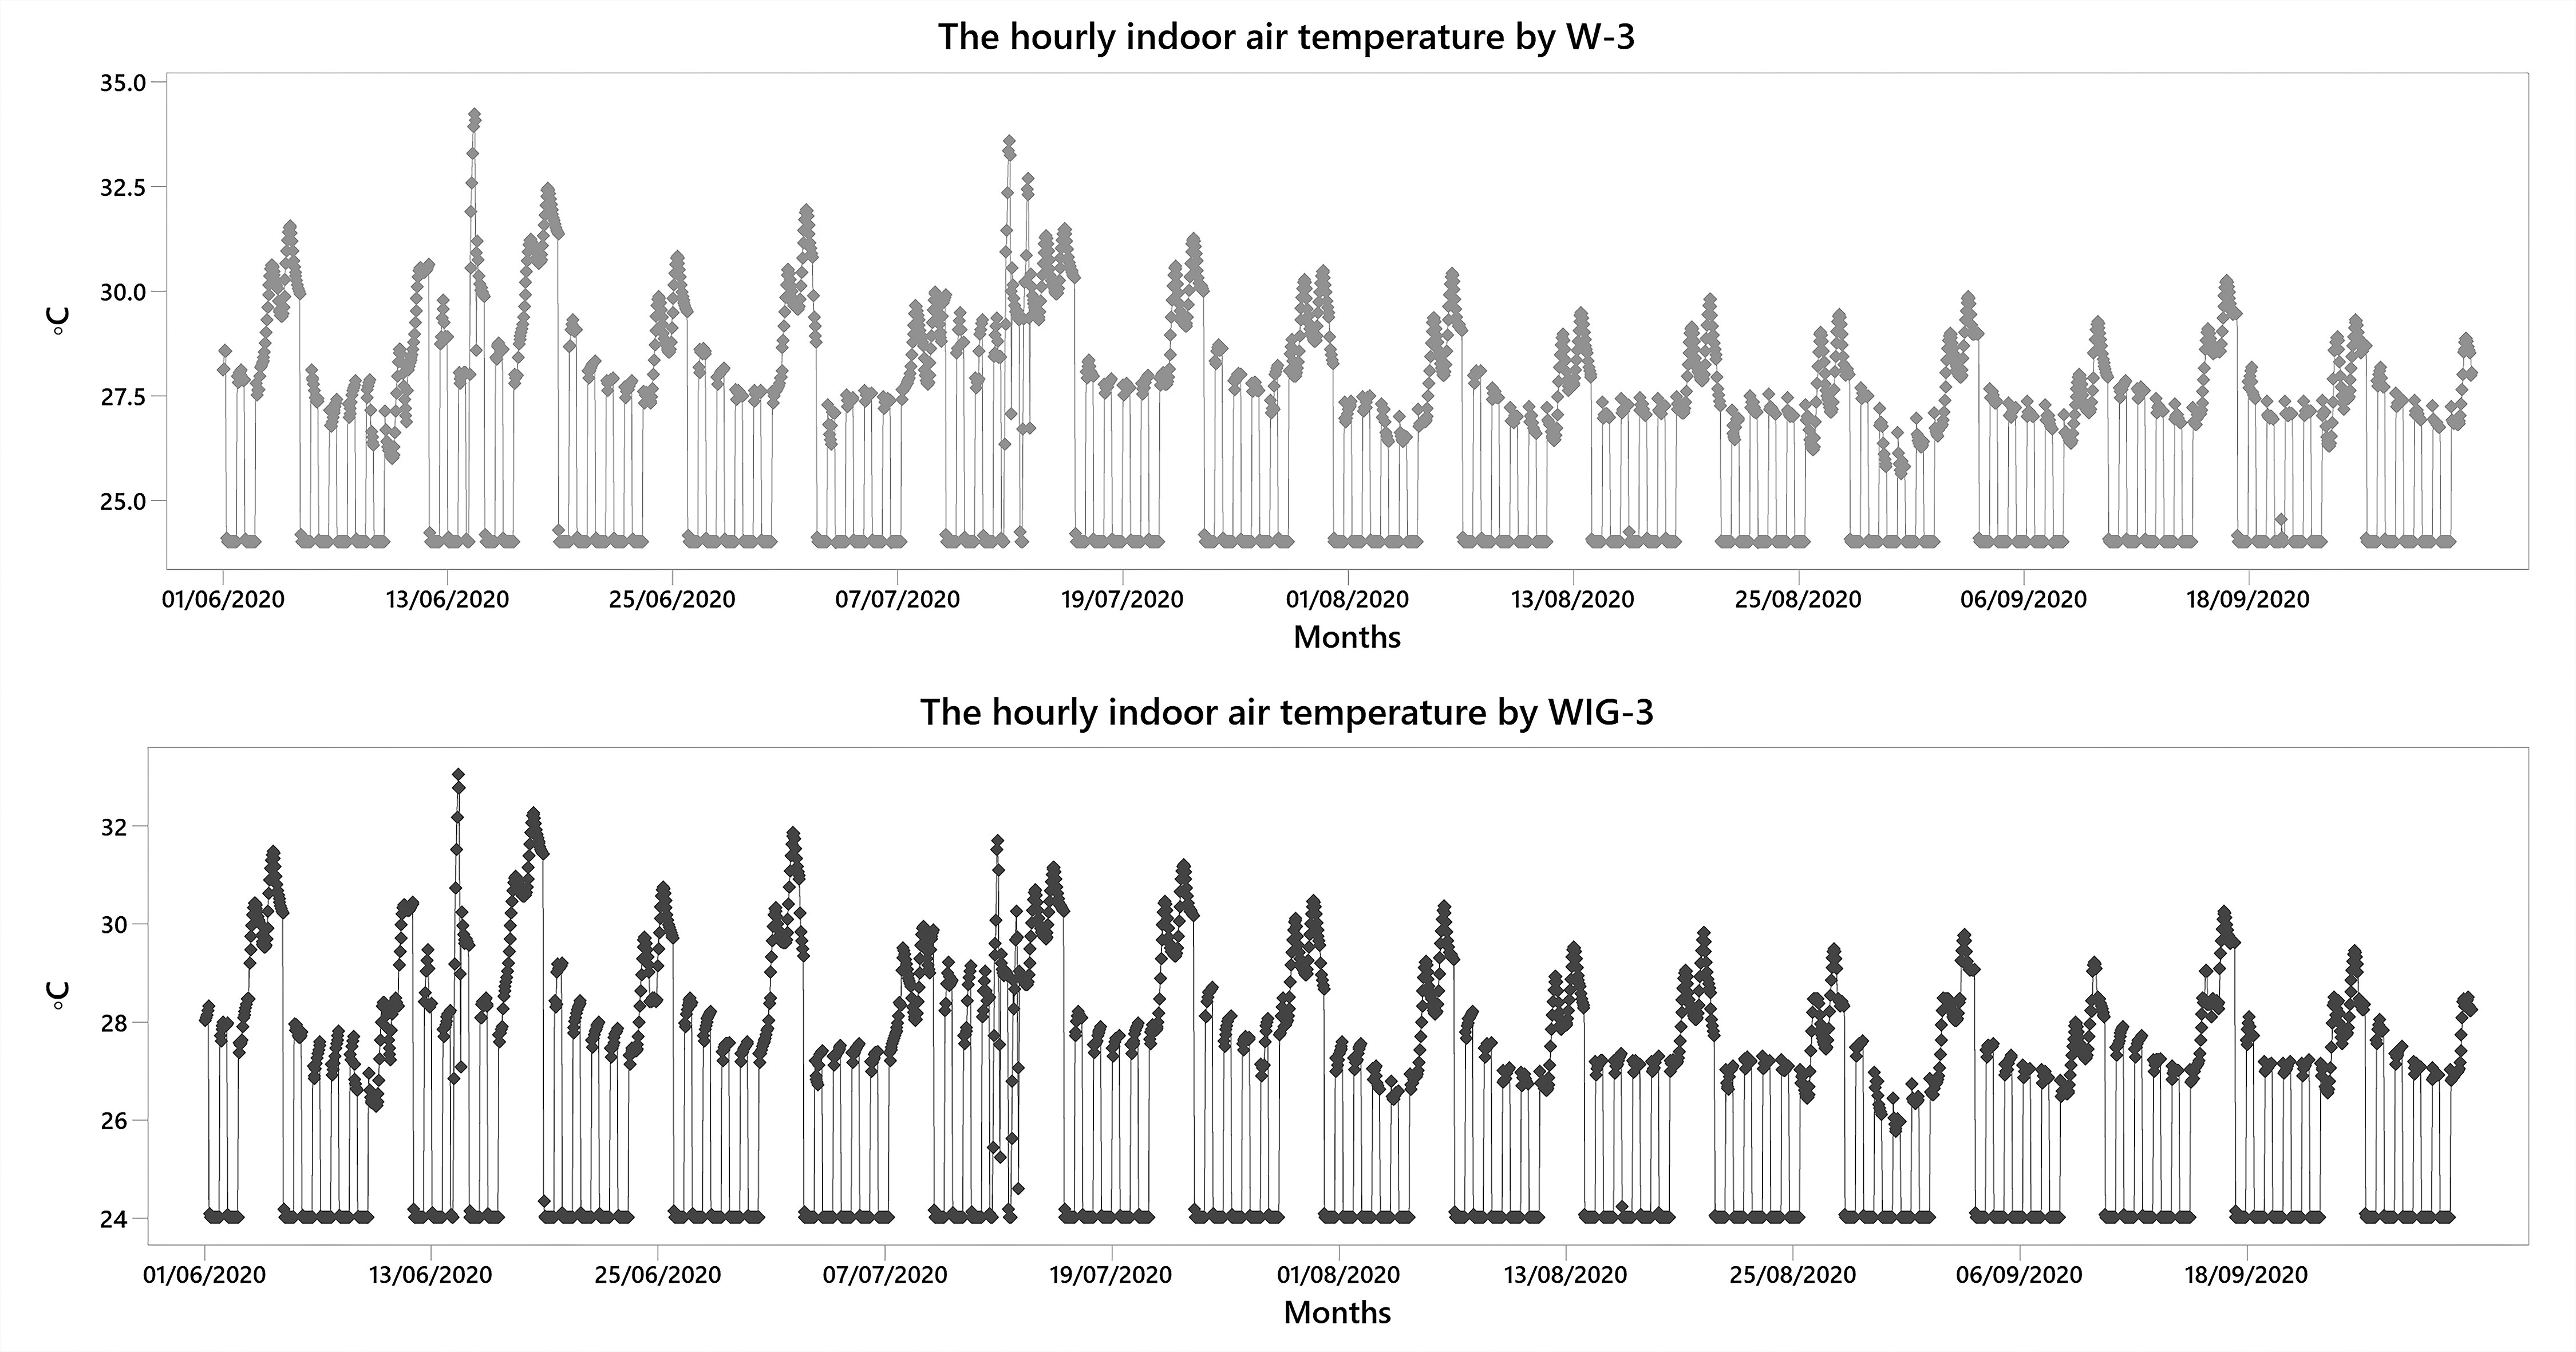
Fig. 11. Comparison between the Tia of the reference BW-3 wall and VGW-3 green wall (summer period) of both rooms.
Figure 12
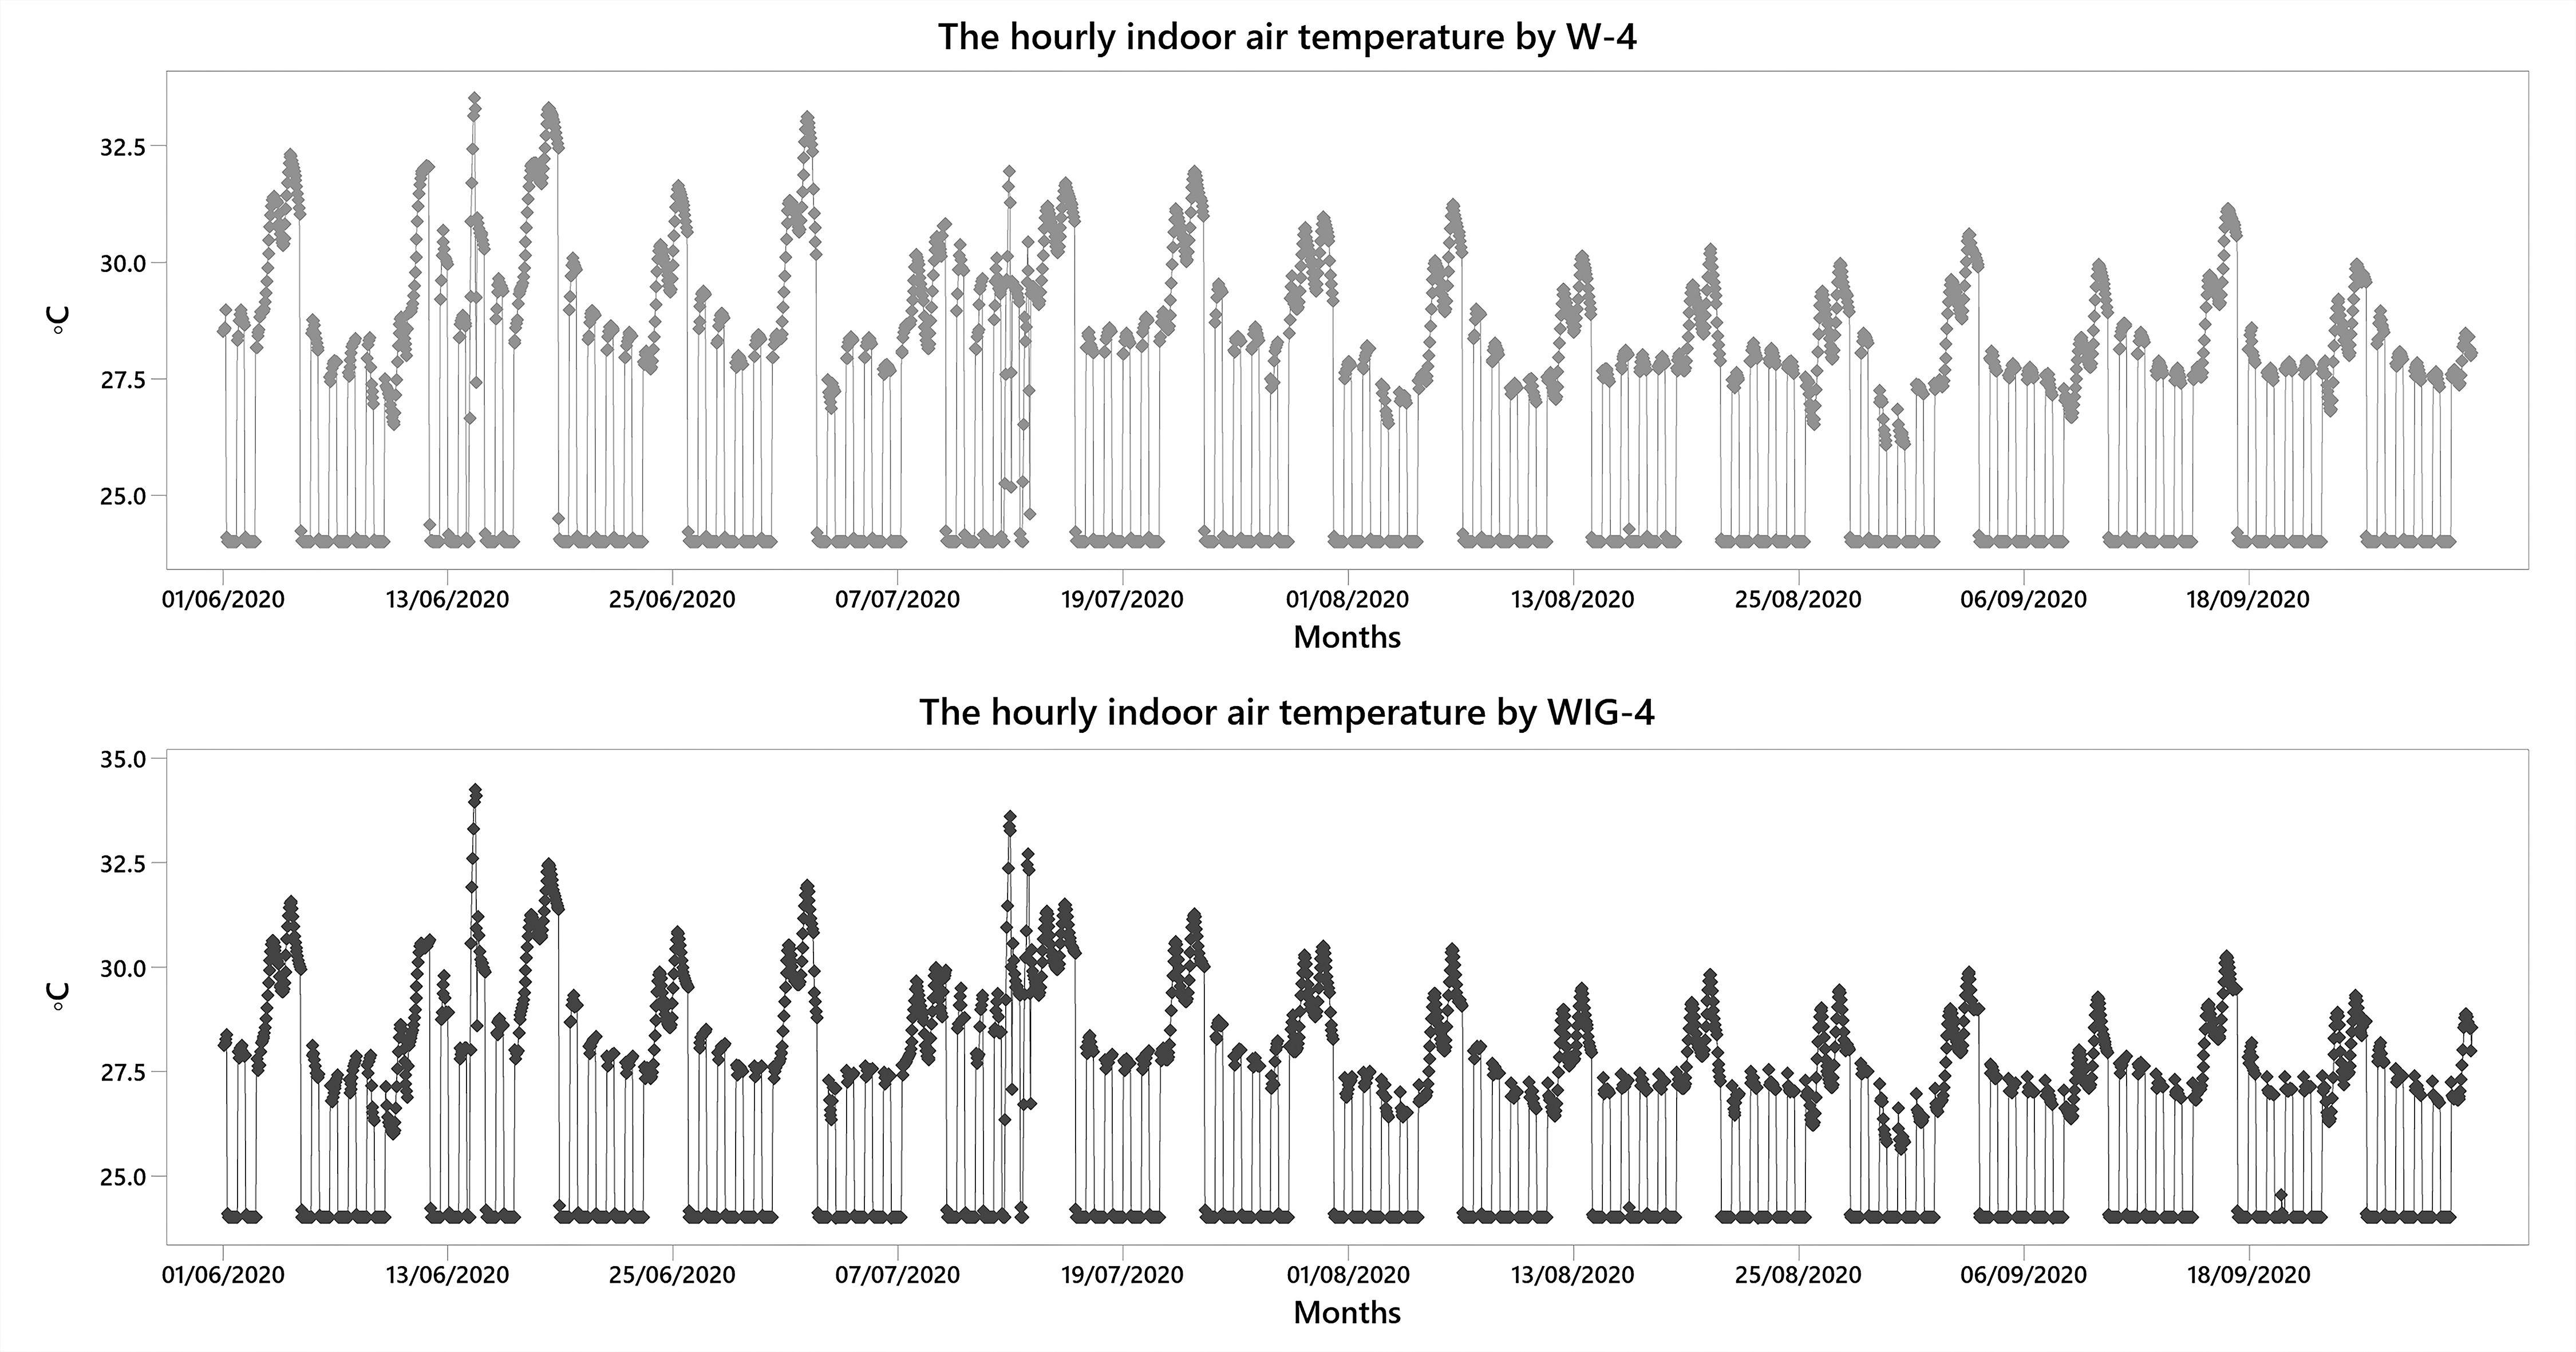
Fig. 12. Comparison between the Tia of the reference BW-3 wall and VGW-4 green wall (summer period) of both rooms.
Figure 13
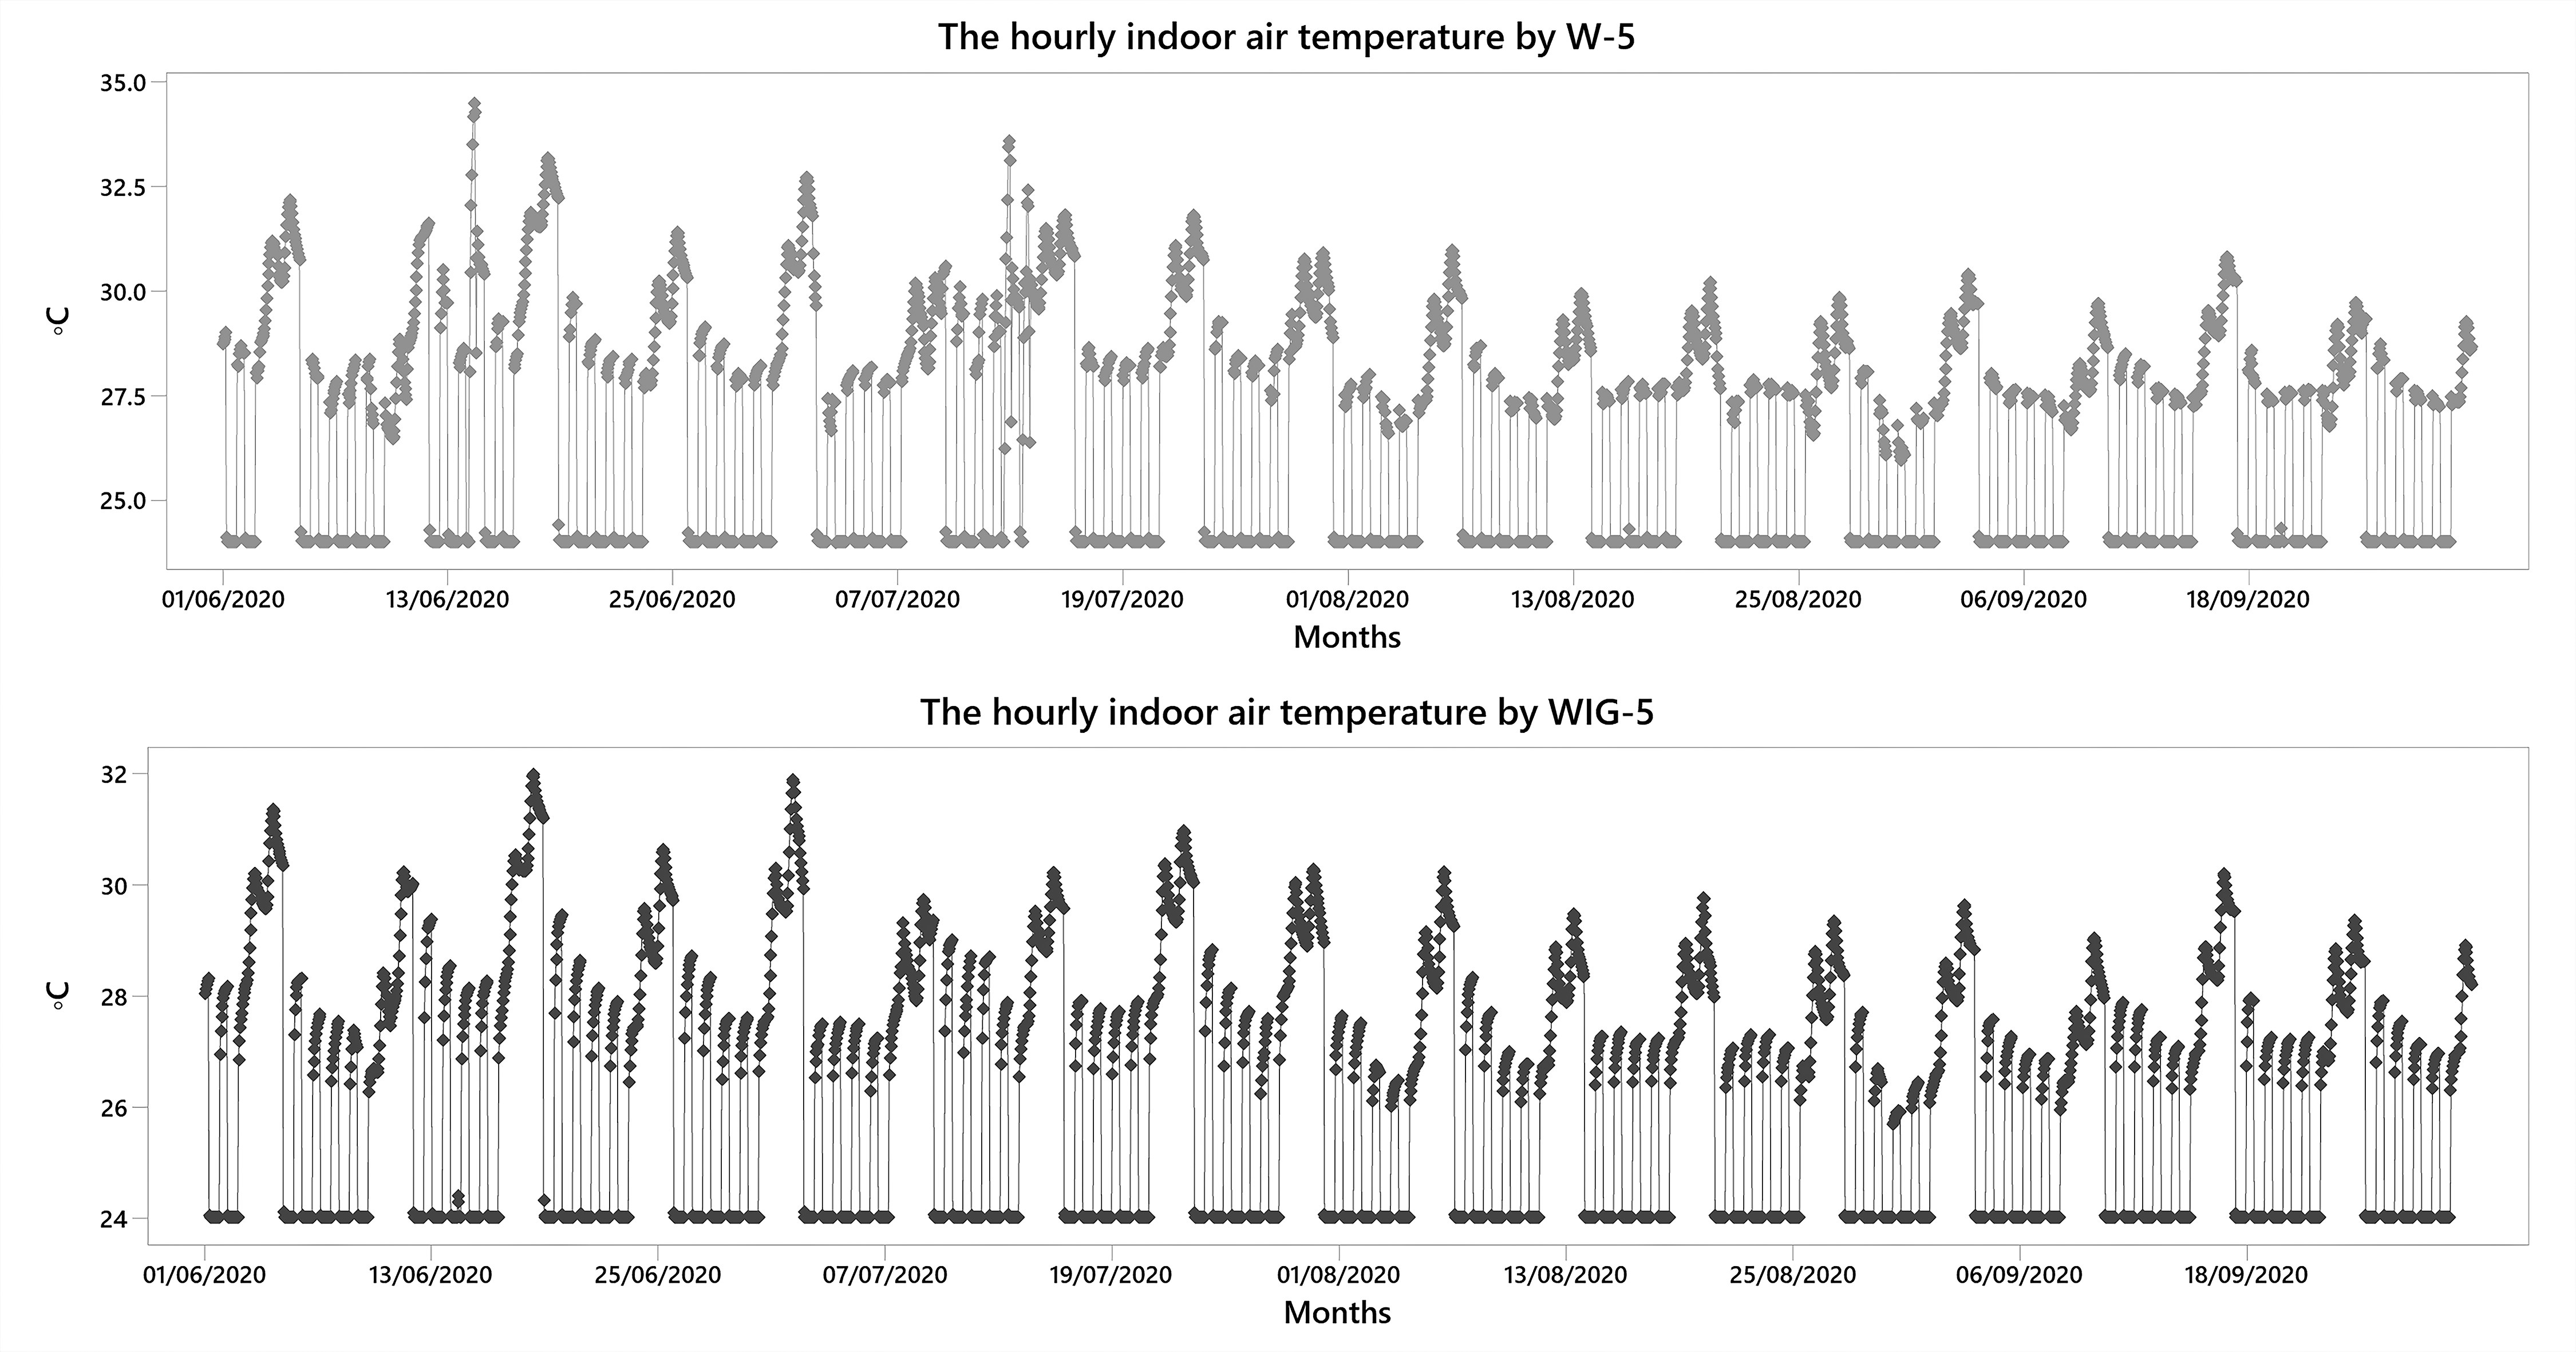
Fig. 13. Comparison between the Tia of the reference BW-4 wall and VGW-5 green wall (summer period) of both rooms.
Figure 14
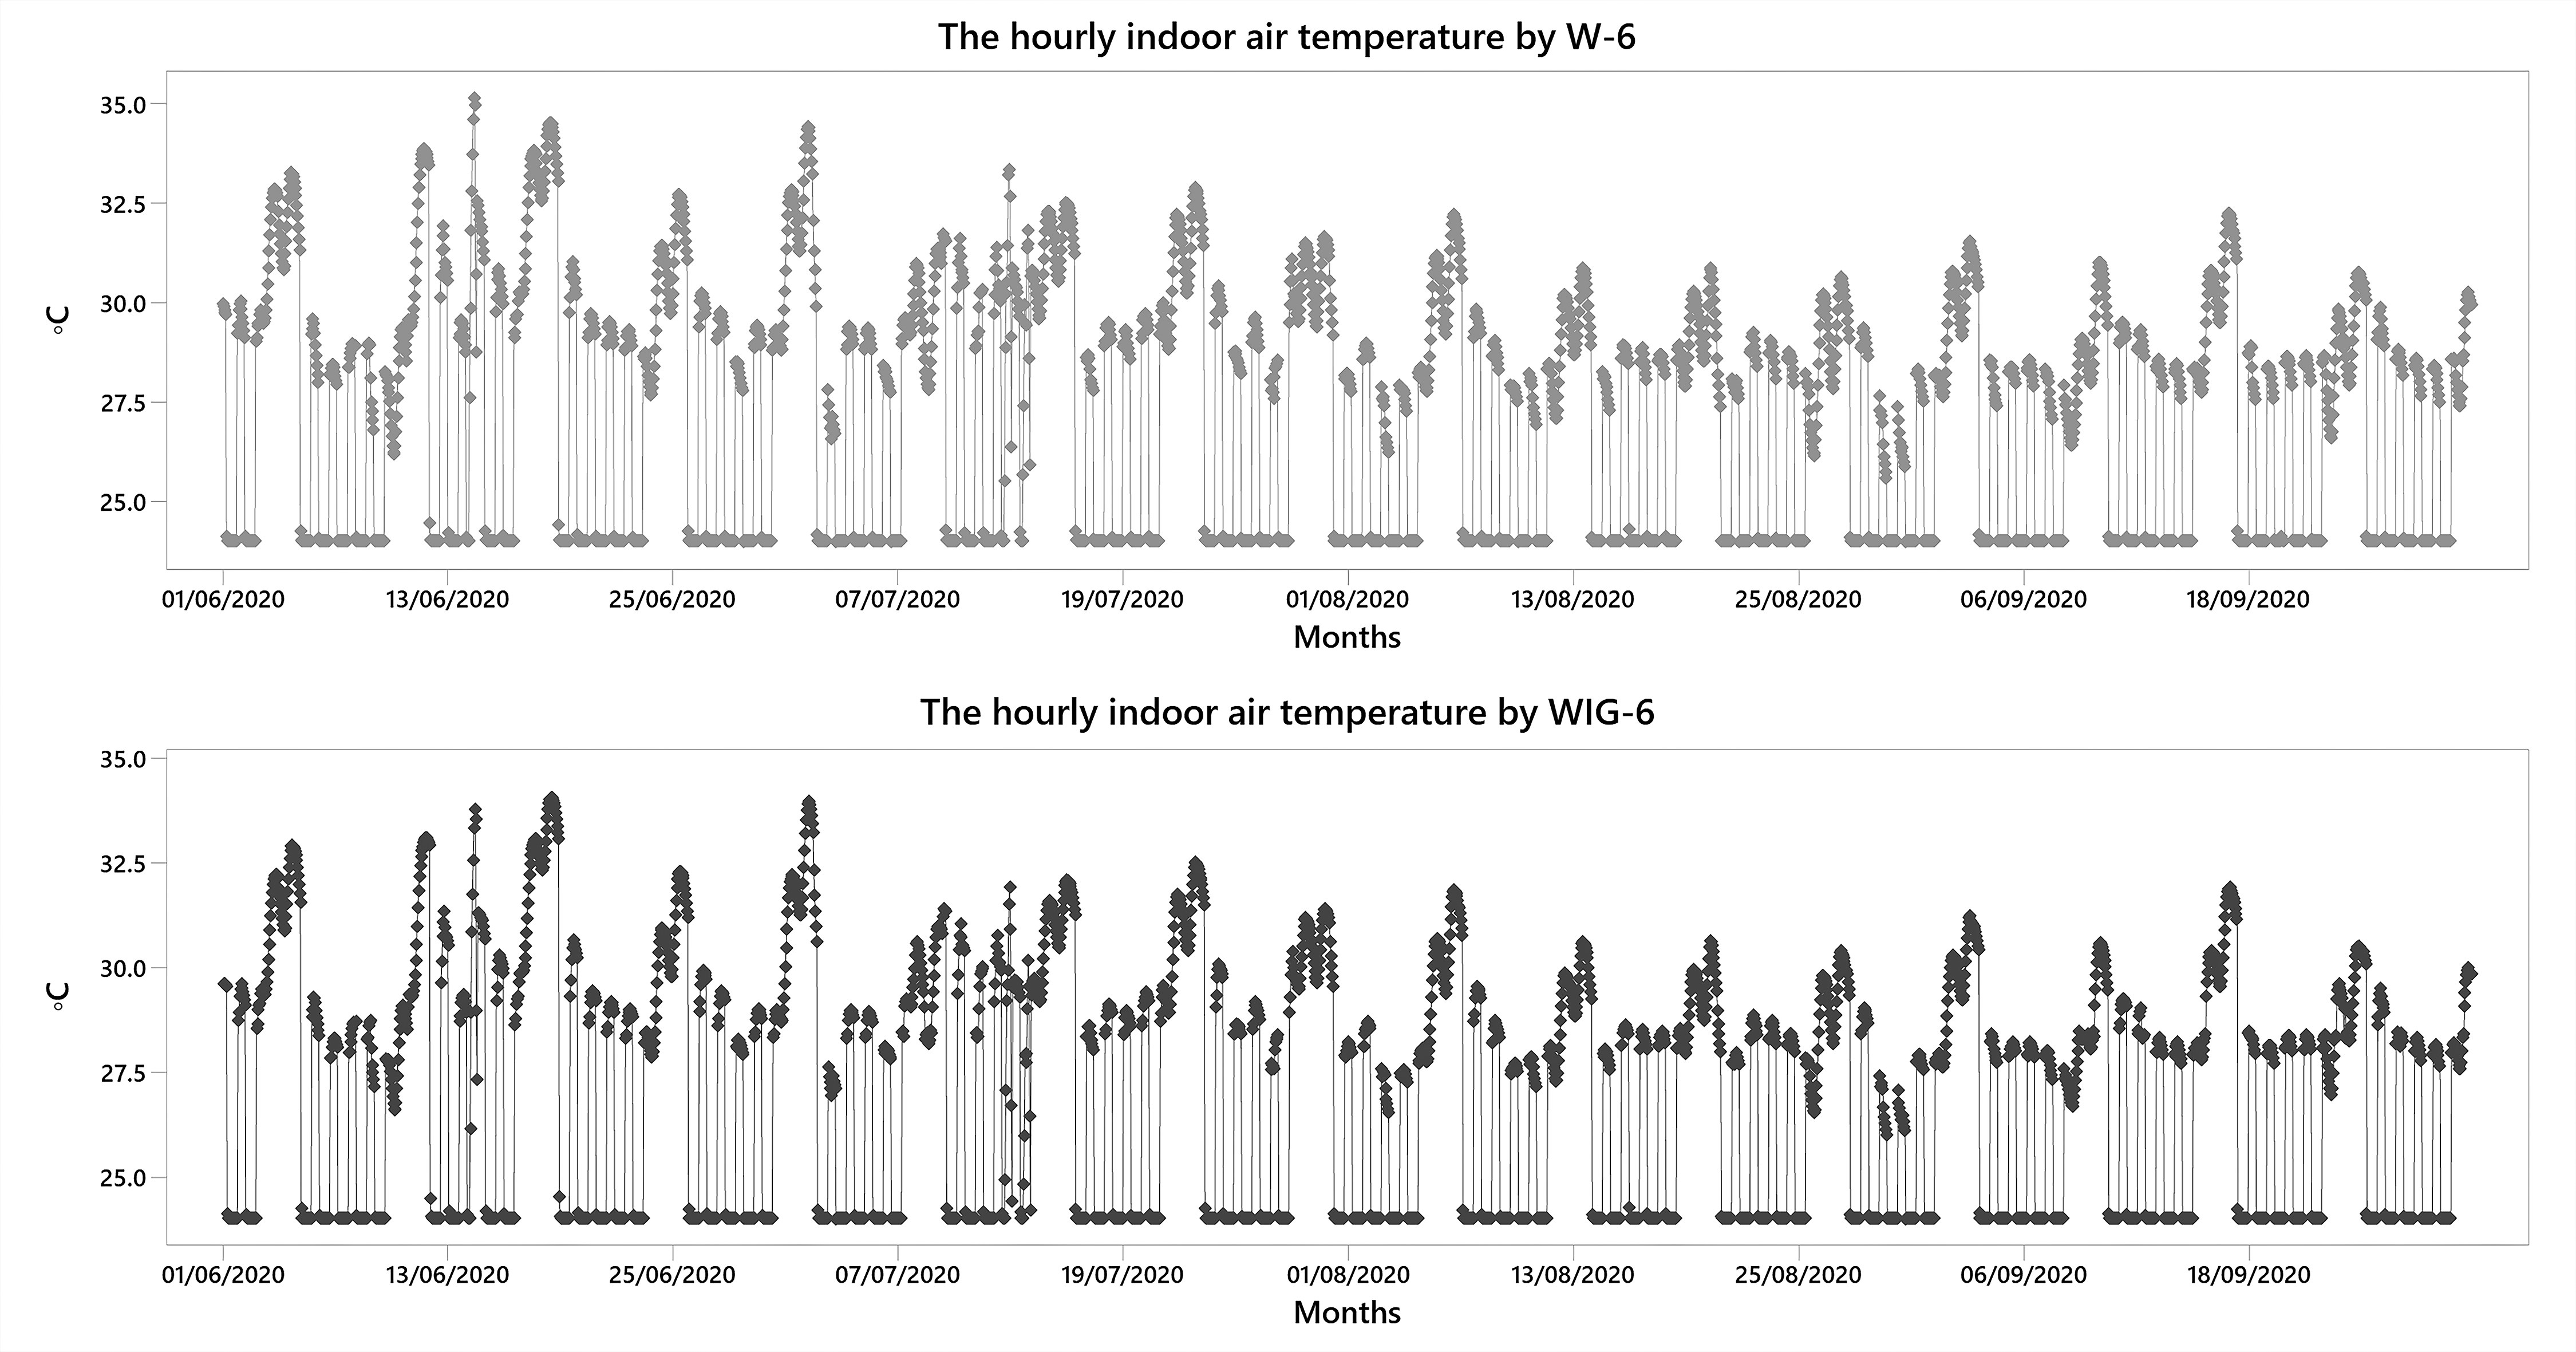
Fig. 14. Comparison between the Tia of the reference BW-6 wall and VGW-6 green wall (summer period) of both rooms.
Figure 15
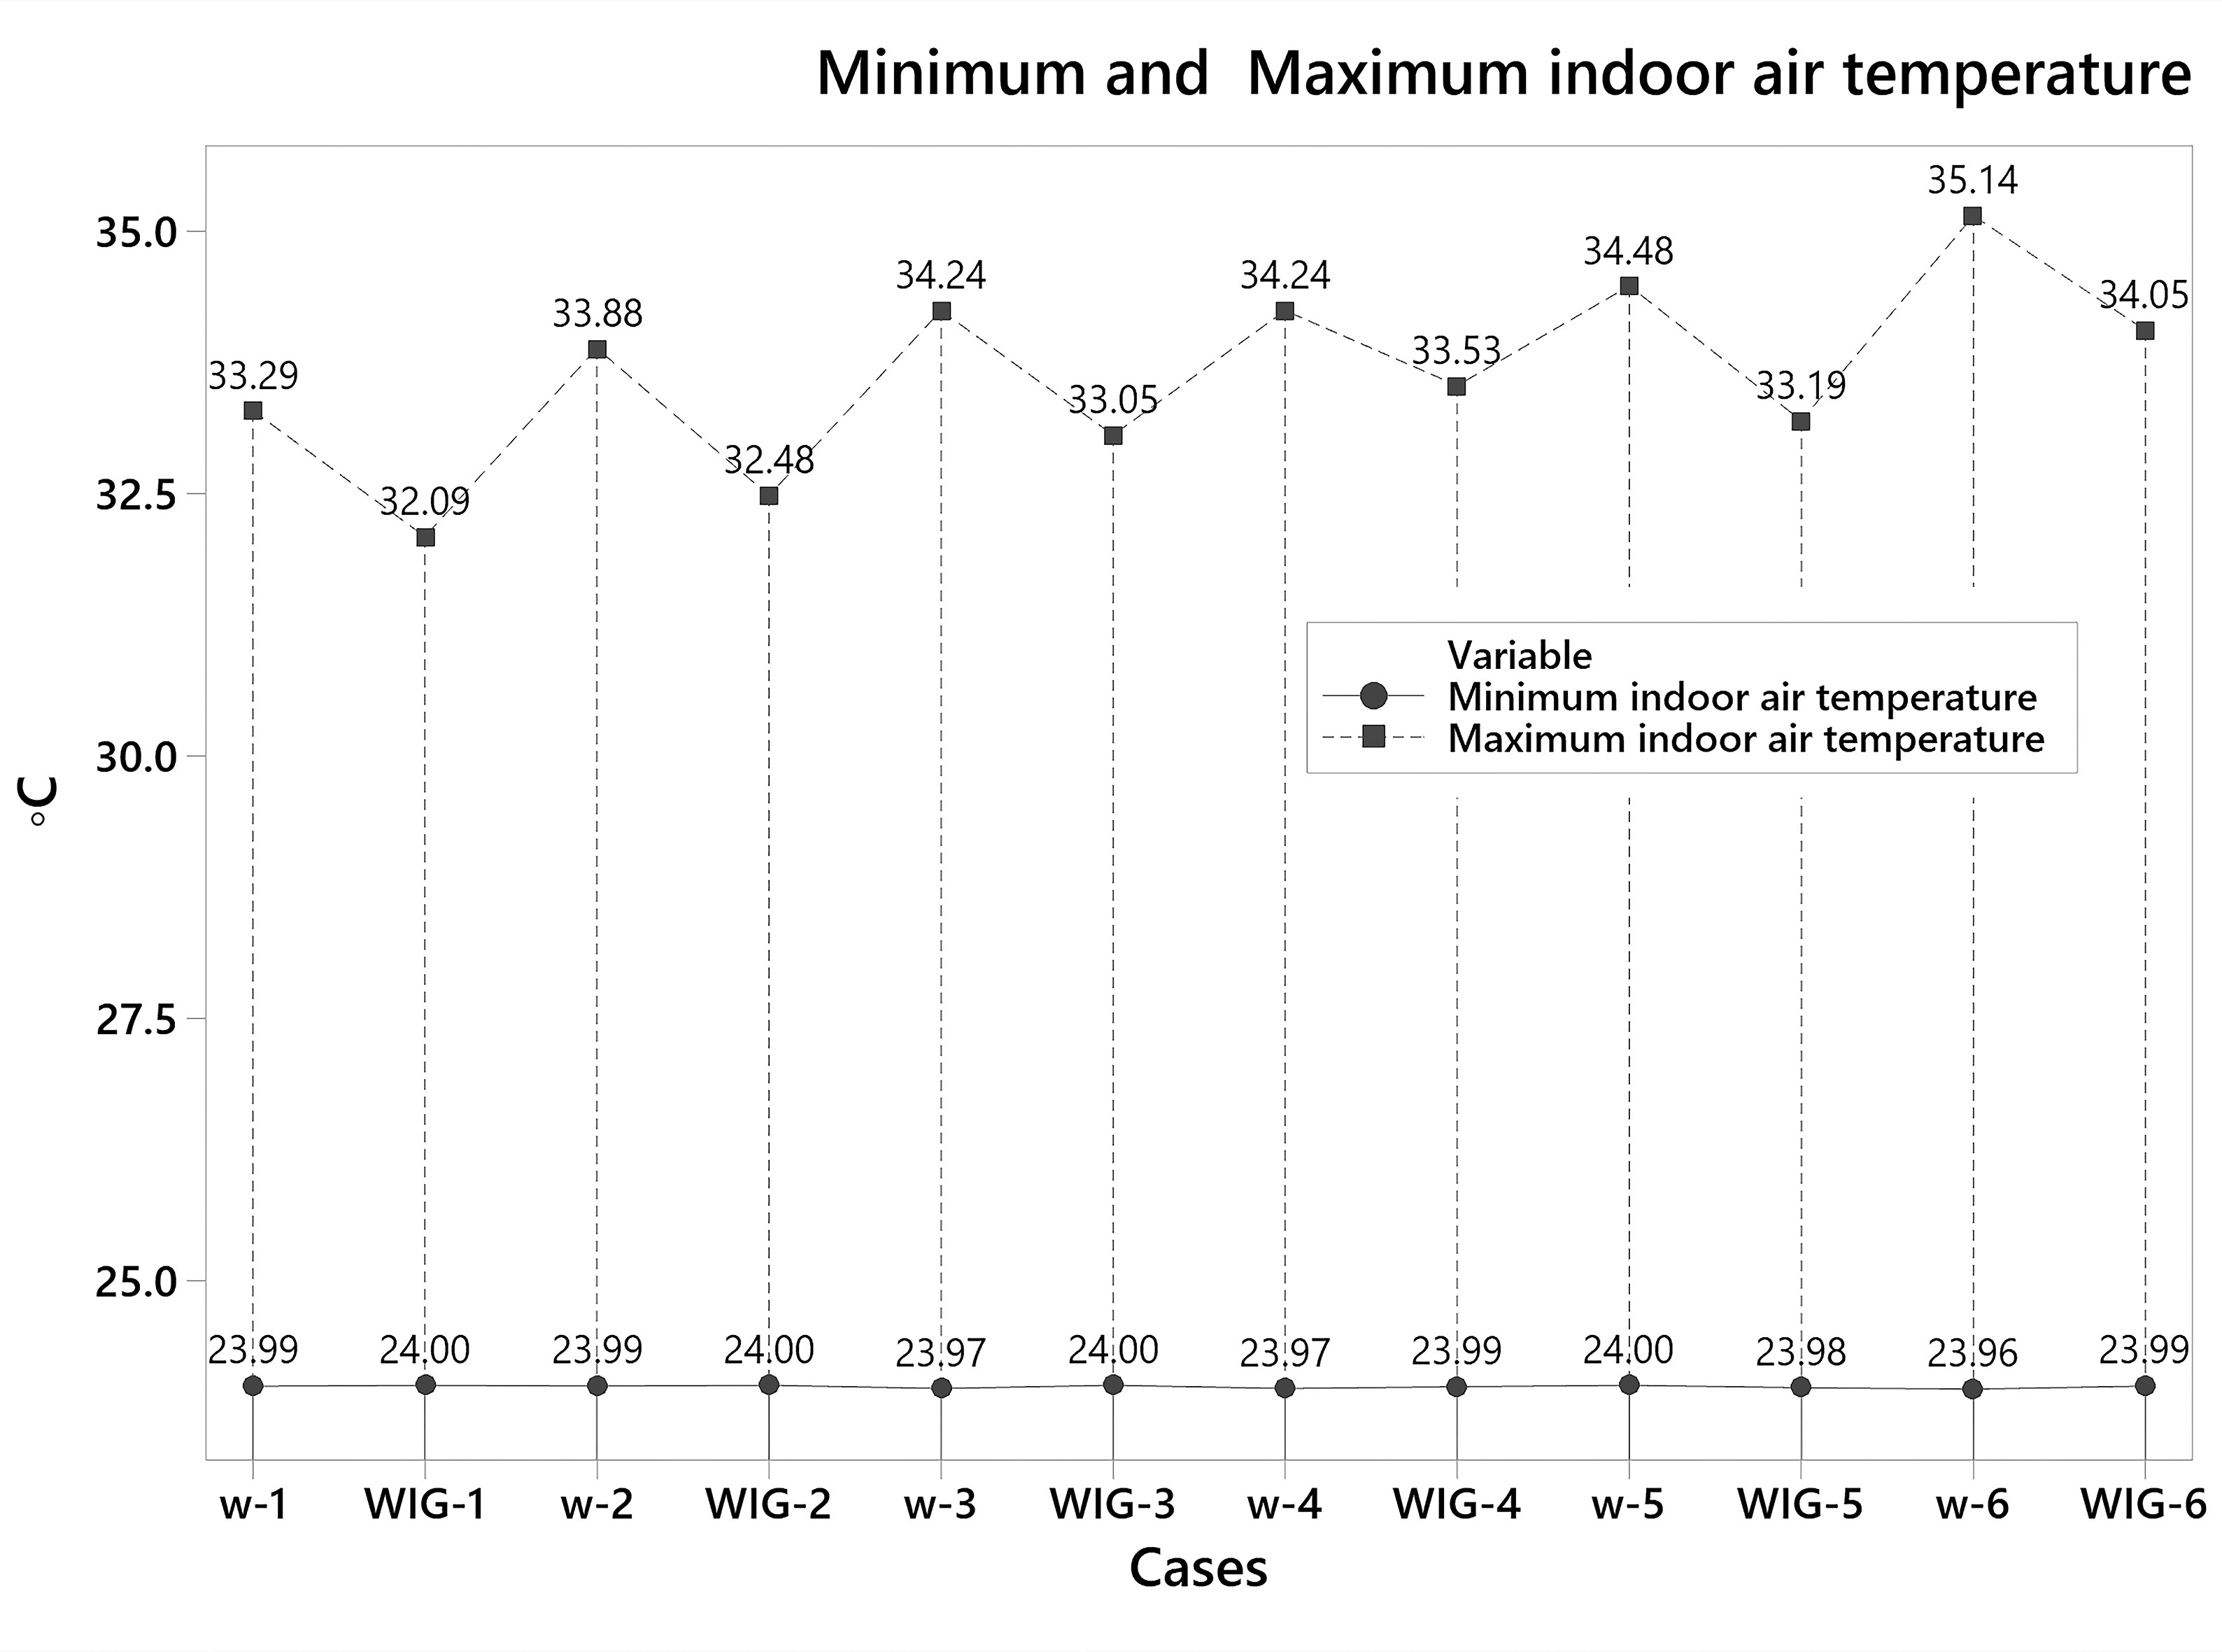
Fig. 15. Comparison between the minimum and maximum Tia in both rooms for 12 south wall scenarios with bare walls and VGW system.
By taking 28◦C as a maximum cooling threshold set point of the Tia. The number of hours during which the Tia of both rooms was 28°C or less is shown in Fig. 16(a) during whole cooling season period. The figure shows that the air temperature in the reference room with bare walls (BW-1 to BW-6) within 28◦C or less for 2355h, 2217h, 2218h, 1995h, 2047h, and 1670h, which represents 80.43.63%, 75.72%, 75.75%, 68.14%, 69.91%, and 57.04% respectively, of the total number of hours (2928h) in the cooling season period. Unlike the test room with VGW system, the number of hours during which the Tia within 28◦C or less were higher by 2506h, 2333h, 2342h, 2242h, 2350h, and 1815h, representing 85.59%, 79.68%, 79.99%, 76.57%, 80.26%, and 61.99% respectively, of the total number of hours during the cooling season (summer period). The findings revealed showed that the improve of the Tia by using VGW system were 7.49%, 6.57%, 6.99%, 16.17%, 18.44%, and 14.01% respectively, higher compared to the reference room with bare walls as shown in Fig. 16(b).
Figure 16
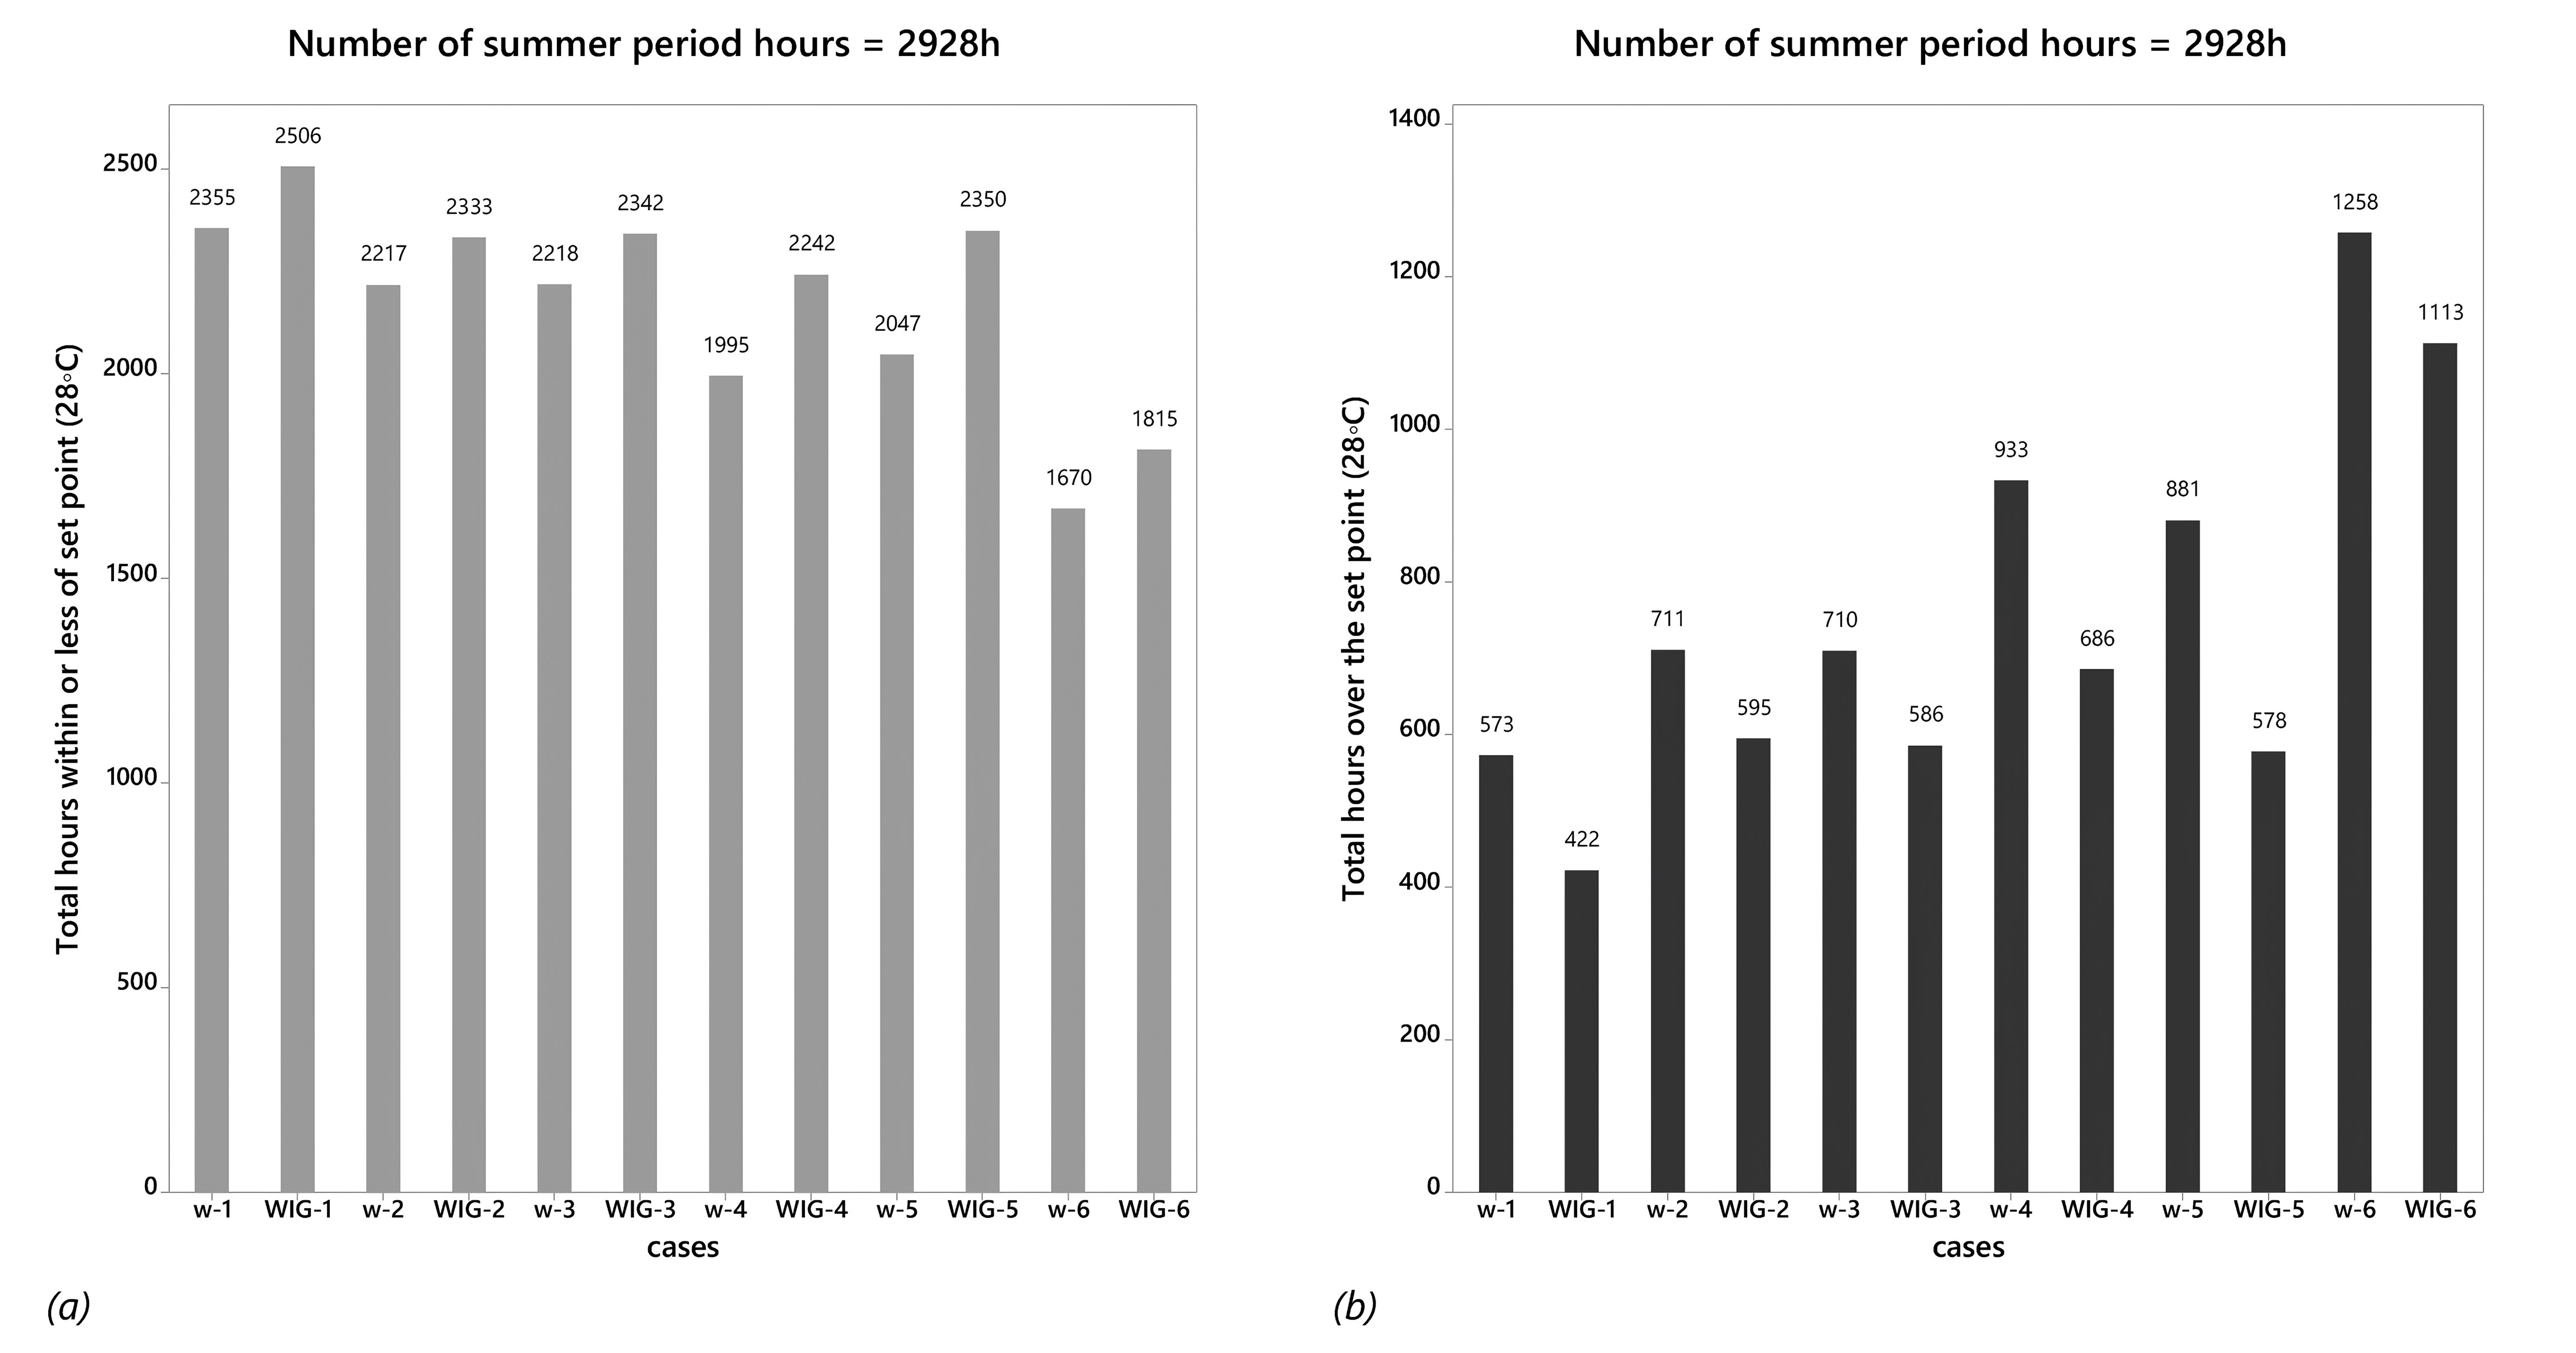
Fig. 16. Number of hours in a situation of Tia; (a) within or less of set point (28◦C) and (b) over the set point (28◦C).
The number of hours that bare walls are estimated in an uncomfortable condition is higher than in the VGW system. As shown in Fig. 17(a), the number of hours of the Tia inside the reference room with bare walls (BW-1 to BW-6) that have exceeded the set point Tia (28◦C) by 573h, 711h, 710h, 933h, 881h, and 1258h respectively, higher than the test room that has green wall system from total of 2928h for whole summer period. This represents 24.33%, 32.07%, 32.01%, 46.77%, 43.04%, and 75.33% respectively of the total number of hours in the cooling season period, unlike the test room with VGW system (VGW-1 to VGW-6) where the percentage of time consumed in a condition of Tia more than set point were only 16.84% (422h), 25.50%(595h), 25.02%(586h), 30.60%(686h), 24.60%(578h), and 61.32% (1113h) respectively (Figs. 17(a) and (b)).
Figure 17
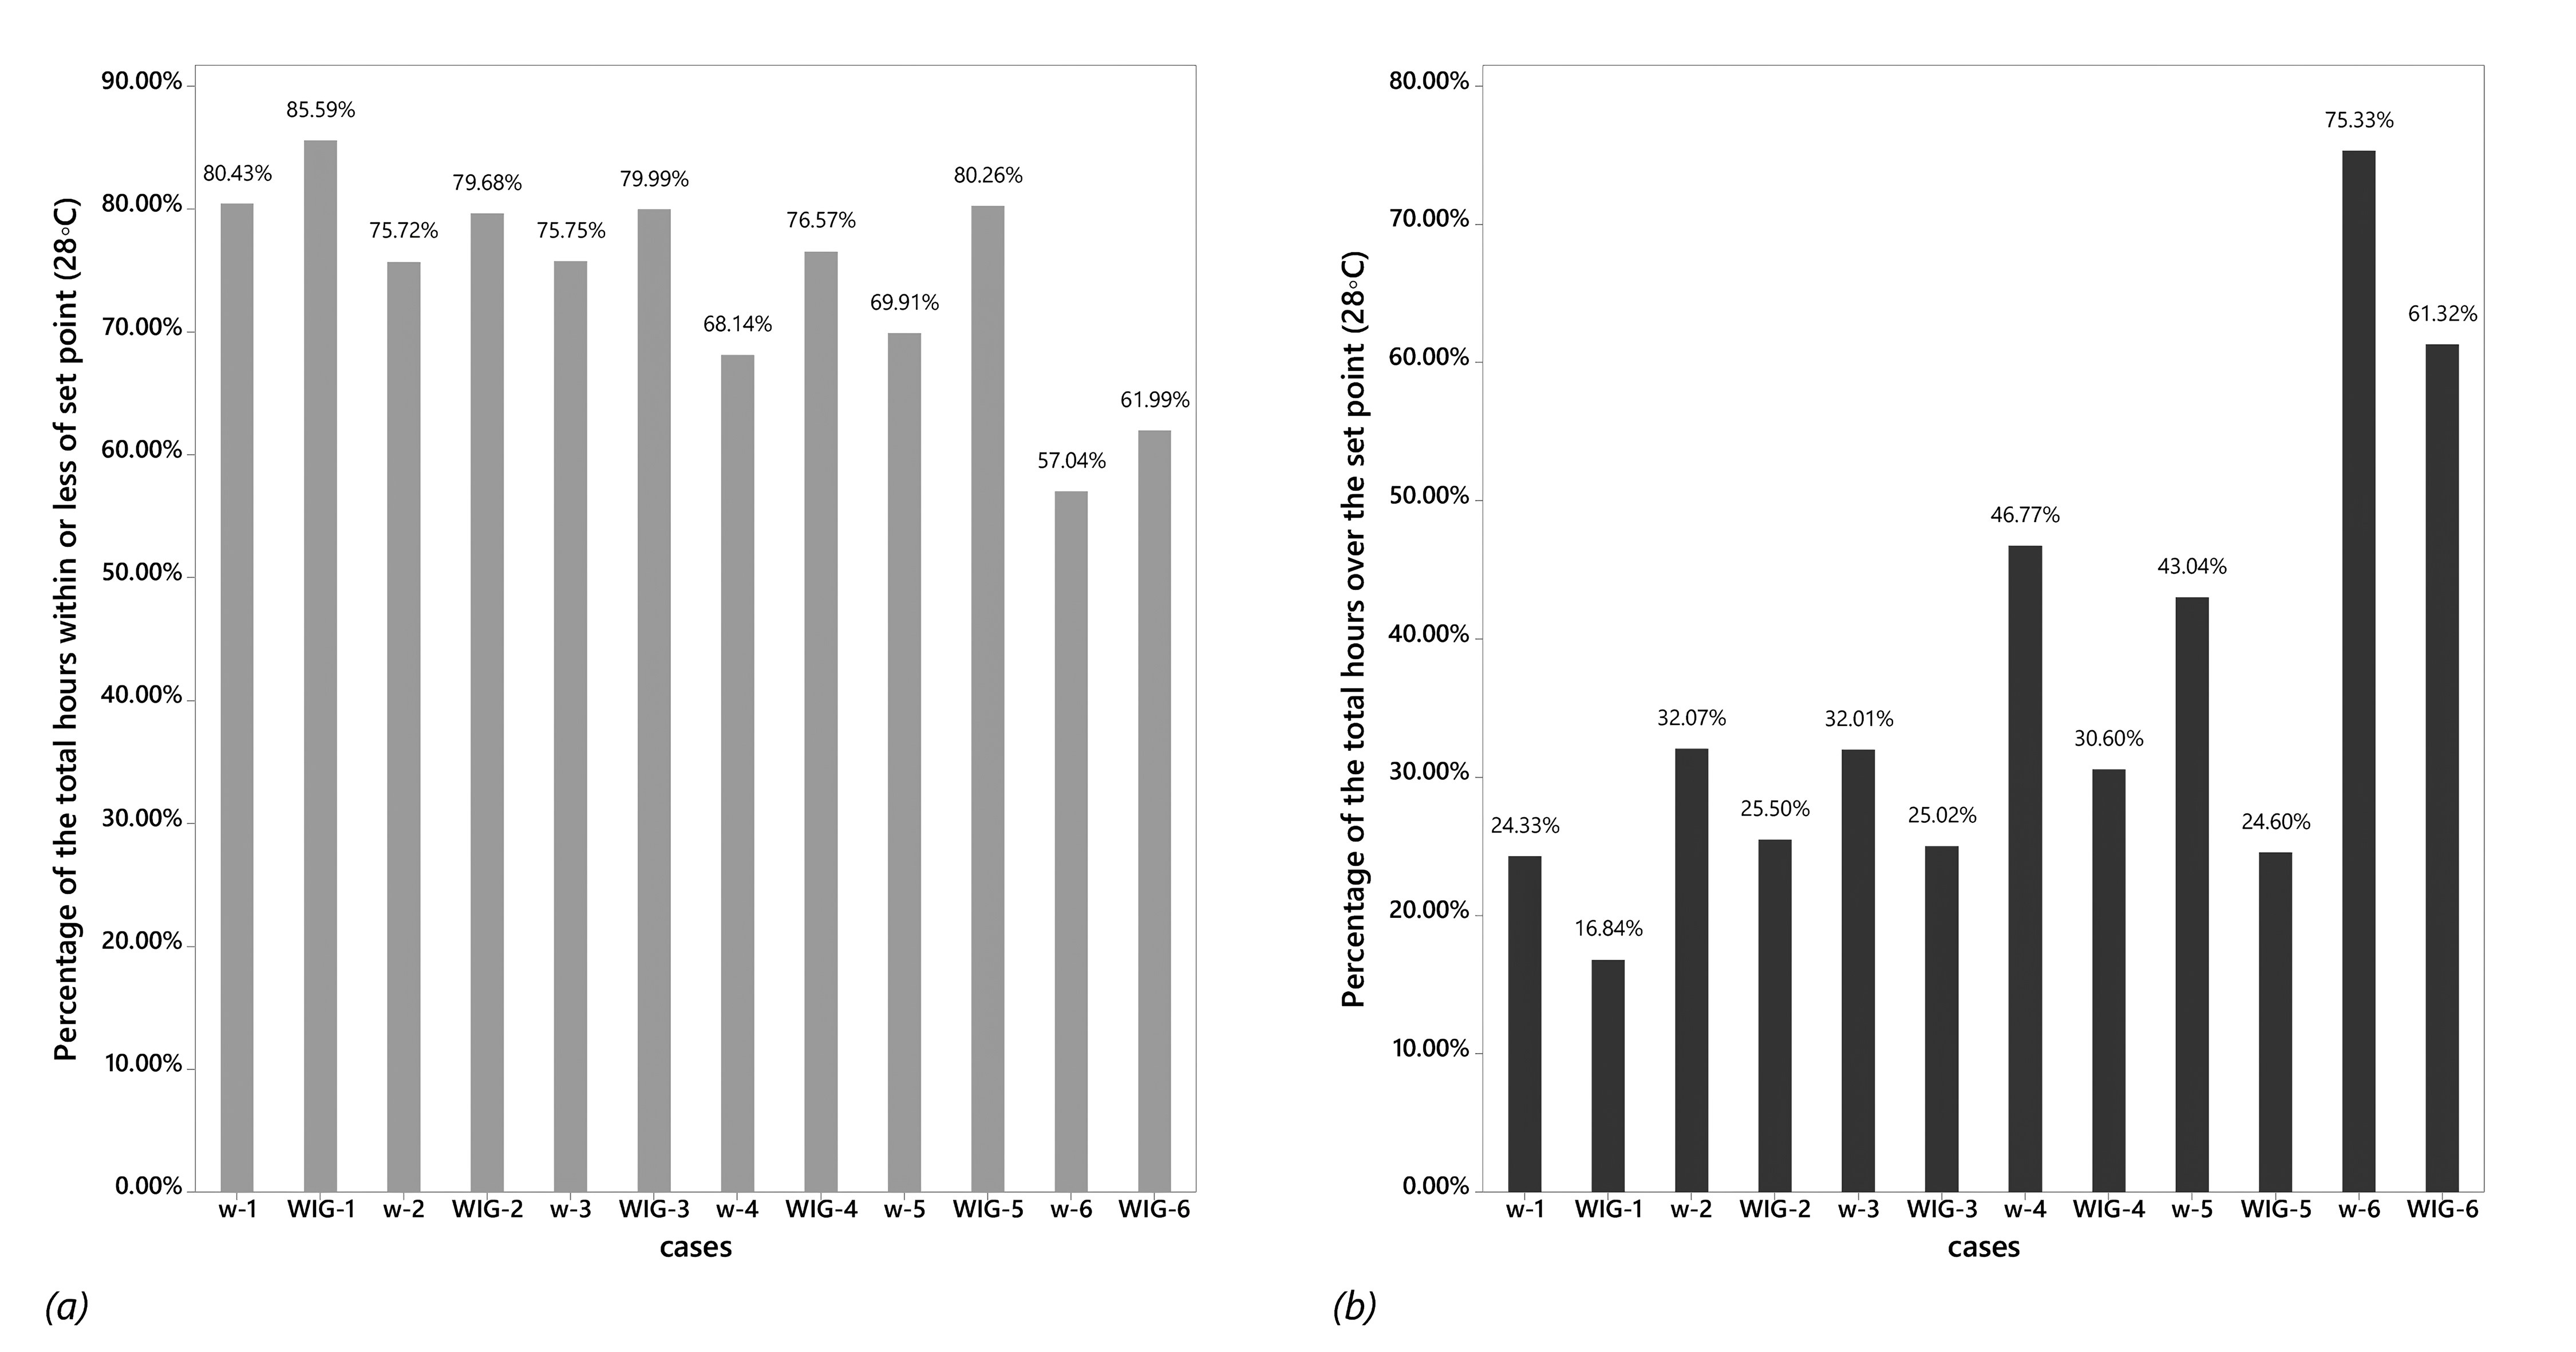
Fig. 17. Percentage of total of hours in a situation of Tia; (a) within or less of set point (28◦C) and (b) over the set point (28◦C).
4.2.2. Influence of VGW on cooling energy performance
To evaluate the influence of VGW system on the energy consumption of cooling, the findings of simulations of monthly energy demands for cooling for each type of test walls (VGW system) are compared with those of the reference bare walls as shown in Fig. 18. The results of the simulation showed that the influence of the VGW system on cooling performance is significant when simulating the system with different OTTV values are considered. In the case of room using VGW system, the energy demand for cooling was lower than that of the reference room with bare walls. Figure 18 shows the monthly cooling energy demand comparison for reference walls and VGW system. For all cases during cooling period rooms with VGW system consume lesser energy. From the Figs. 19(a) and (b), it can be found that the room with VGW system (VGW-1 to VGW-6), the overall cooling energy saving due to VGW are found as 103.3kwh, 130.1kwh, 136.1kwh, 123.1kwh, 155.5kwh, and 175.7kwh respectively for whole summer period compared to reference room with bare walls. This represents 13.63%, 15.58%, 15.35%, 13.69%, 16.59%, and 16.69% respectively of the total energy savings for cooling performance in the summer period, unlike the reference room with bare walls (BW-1 to BW-6) where the total cooling energy savings were only 11.99%, 13.48%, 13.31%, 14.98%, 14.23%, and 14.30% respectively.
Figure 18
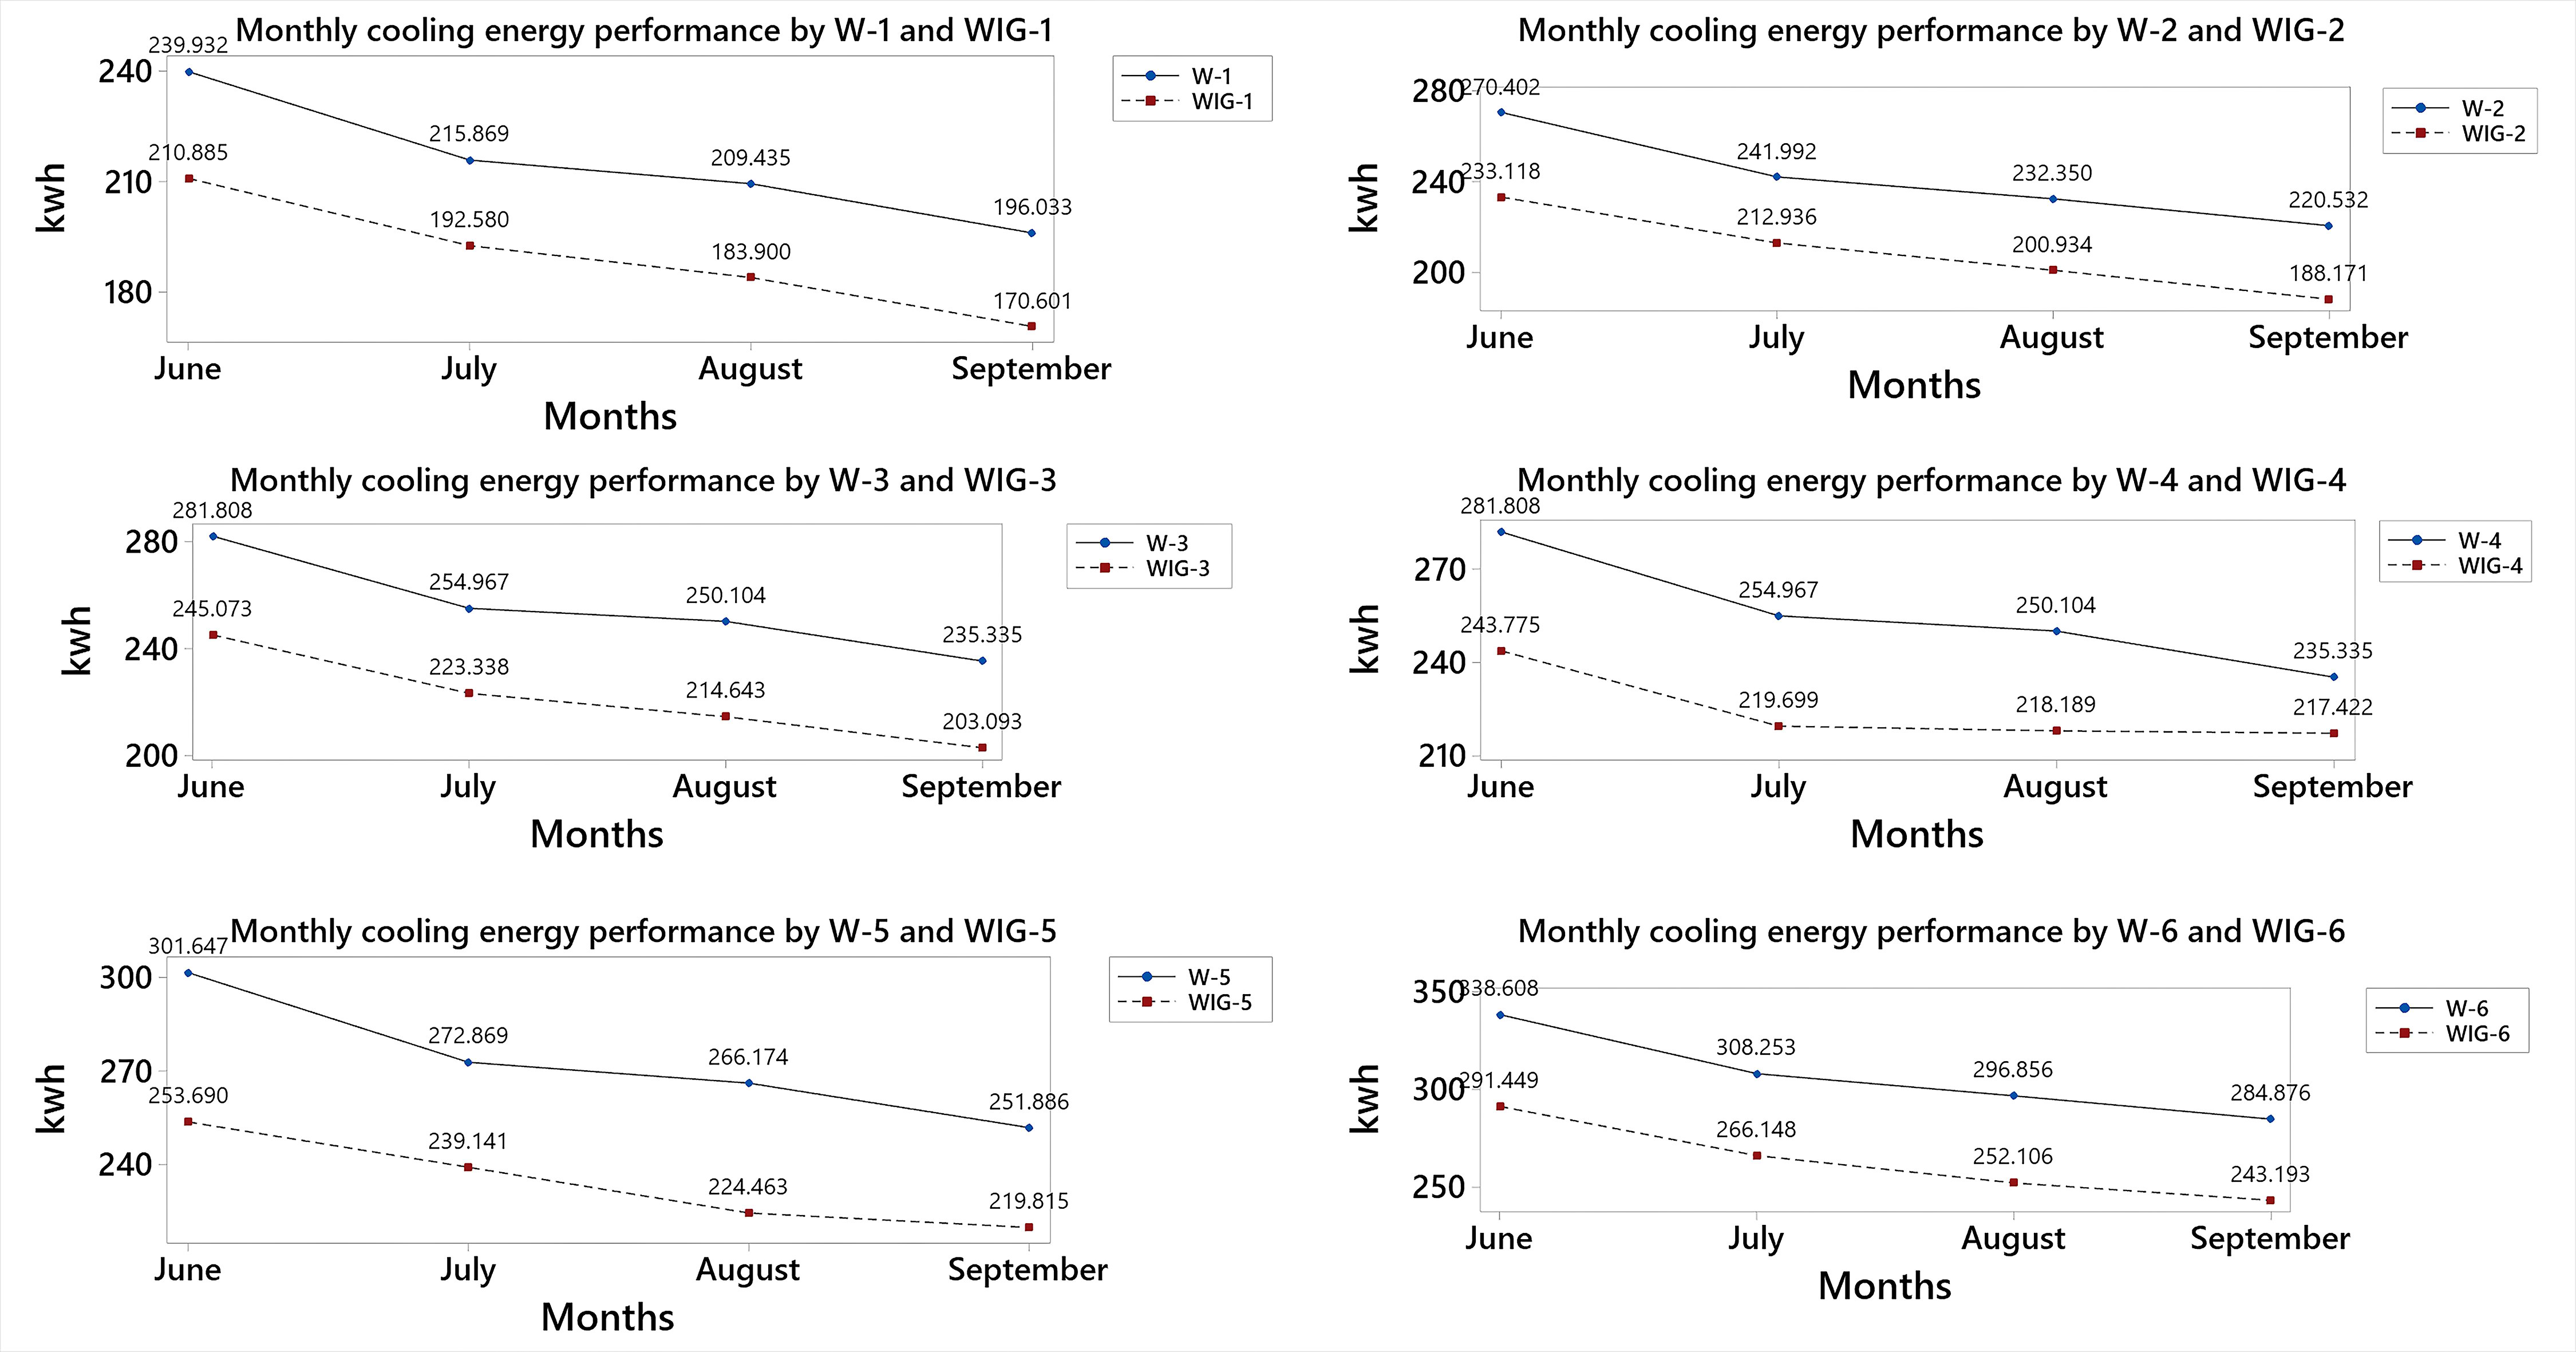
Fig. 18. The monthly variation in cooling energy demand in both rooms for 12 south wall scenarios with bare walls and VGW system.
Figure 19
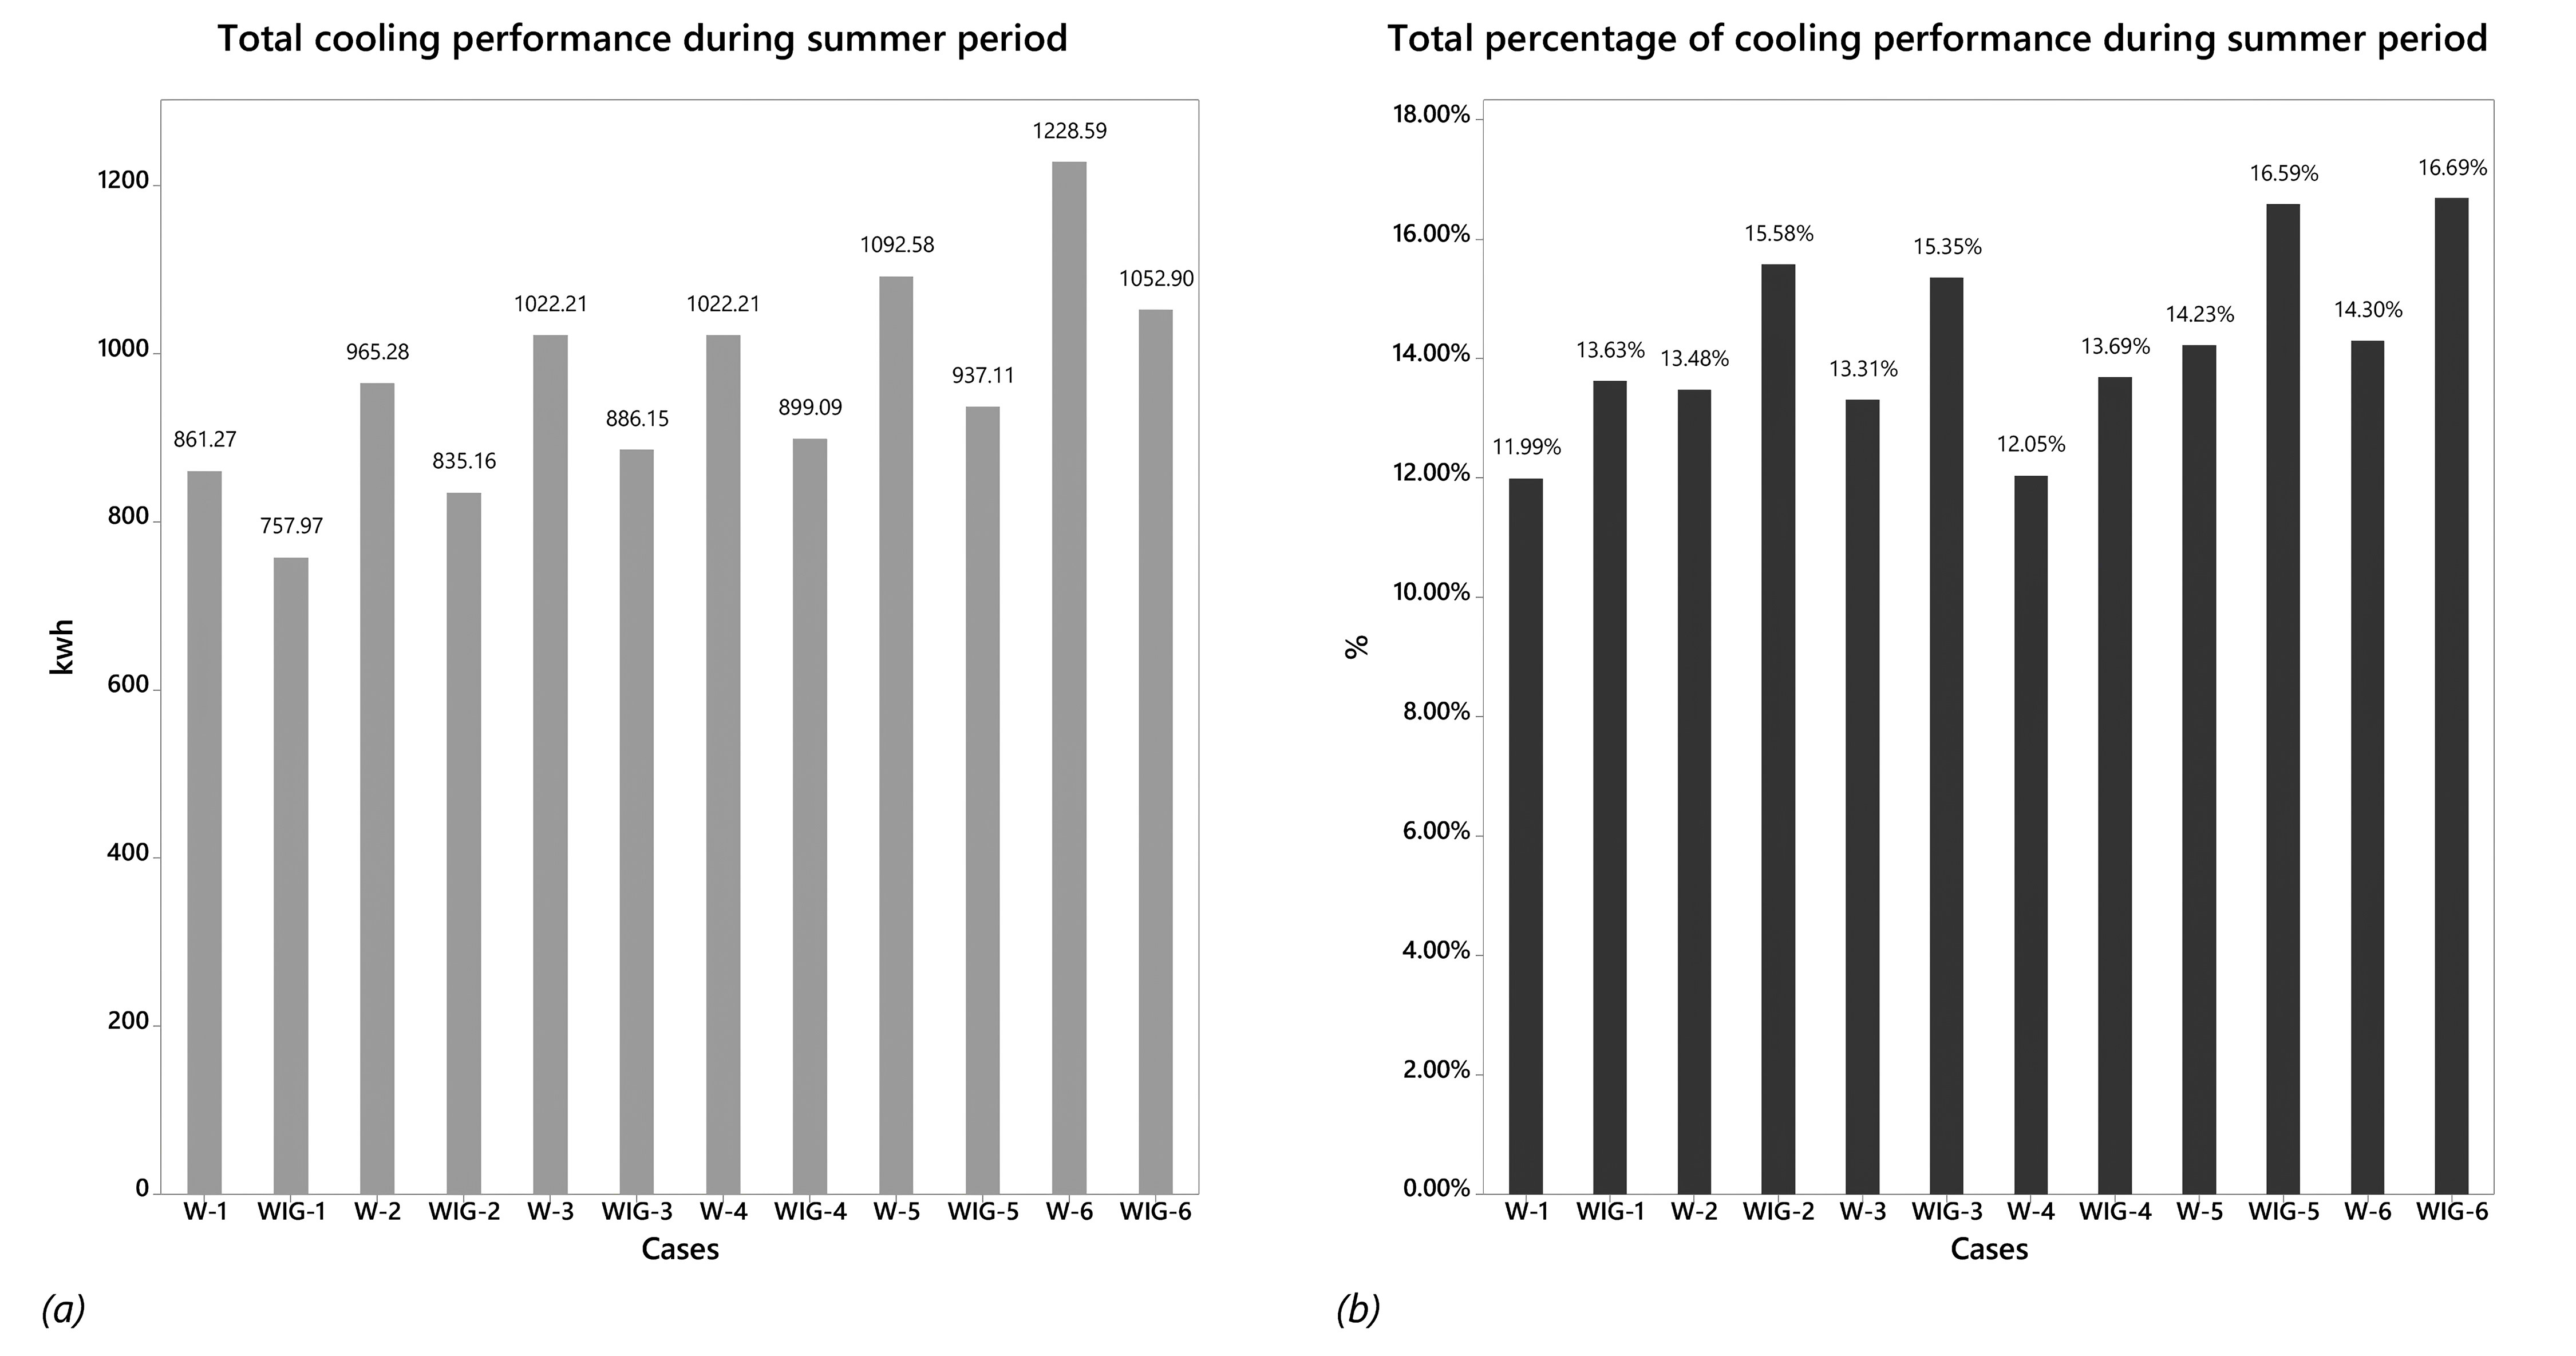
Fig. 19. (a) Total cooling energy performance during and (b) Total percentage of cooling energy performance during summer period.
4.2.3. Influence of VGW on heat gains
The VGW set on the south wall made it significantly reduce the monthly HGs compared to the case of reference room with bare wall as shown in Fig. 20. The reduction in HGs is due to the reduced heat flux provided by the VGW system and low OTTV values, which lower the heat flow absorbed by the green facades by their presence. The simulations results showed that the HGs for the reference room with bare walls seniors (BW-1 to BW-6) for whole cooling season (summer period) were 85.38 kWh, 94.12kwh, 116.02kwh, 116.02kwh, 116.27kwh, and 124.29kwh respectively. The presence of VGW system seniors (VGW-1 to VGW-6) have decreased HGs by 38.82%, 47.85%, 41.48%, 29.33%, 36.12%, and 37.11% respectively, or a heat gain of 61.51kwh, 63.66kwh, 82.00kwh, 89.71kwh, 85.42kwh, and 90.65kwh respectively, compared to the reference room, unlike the reference room with bare walls (BW-1 to BW-6) where the total HGs only represents 27.96%, 32.36%, 29.32%, 22.68%, 23.09%, and 27.07% respectively (Figs. 21(a) and (b)).
Figure 20
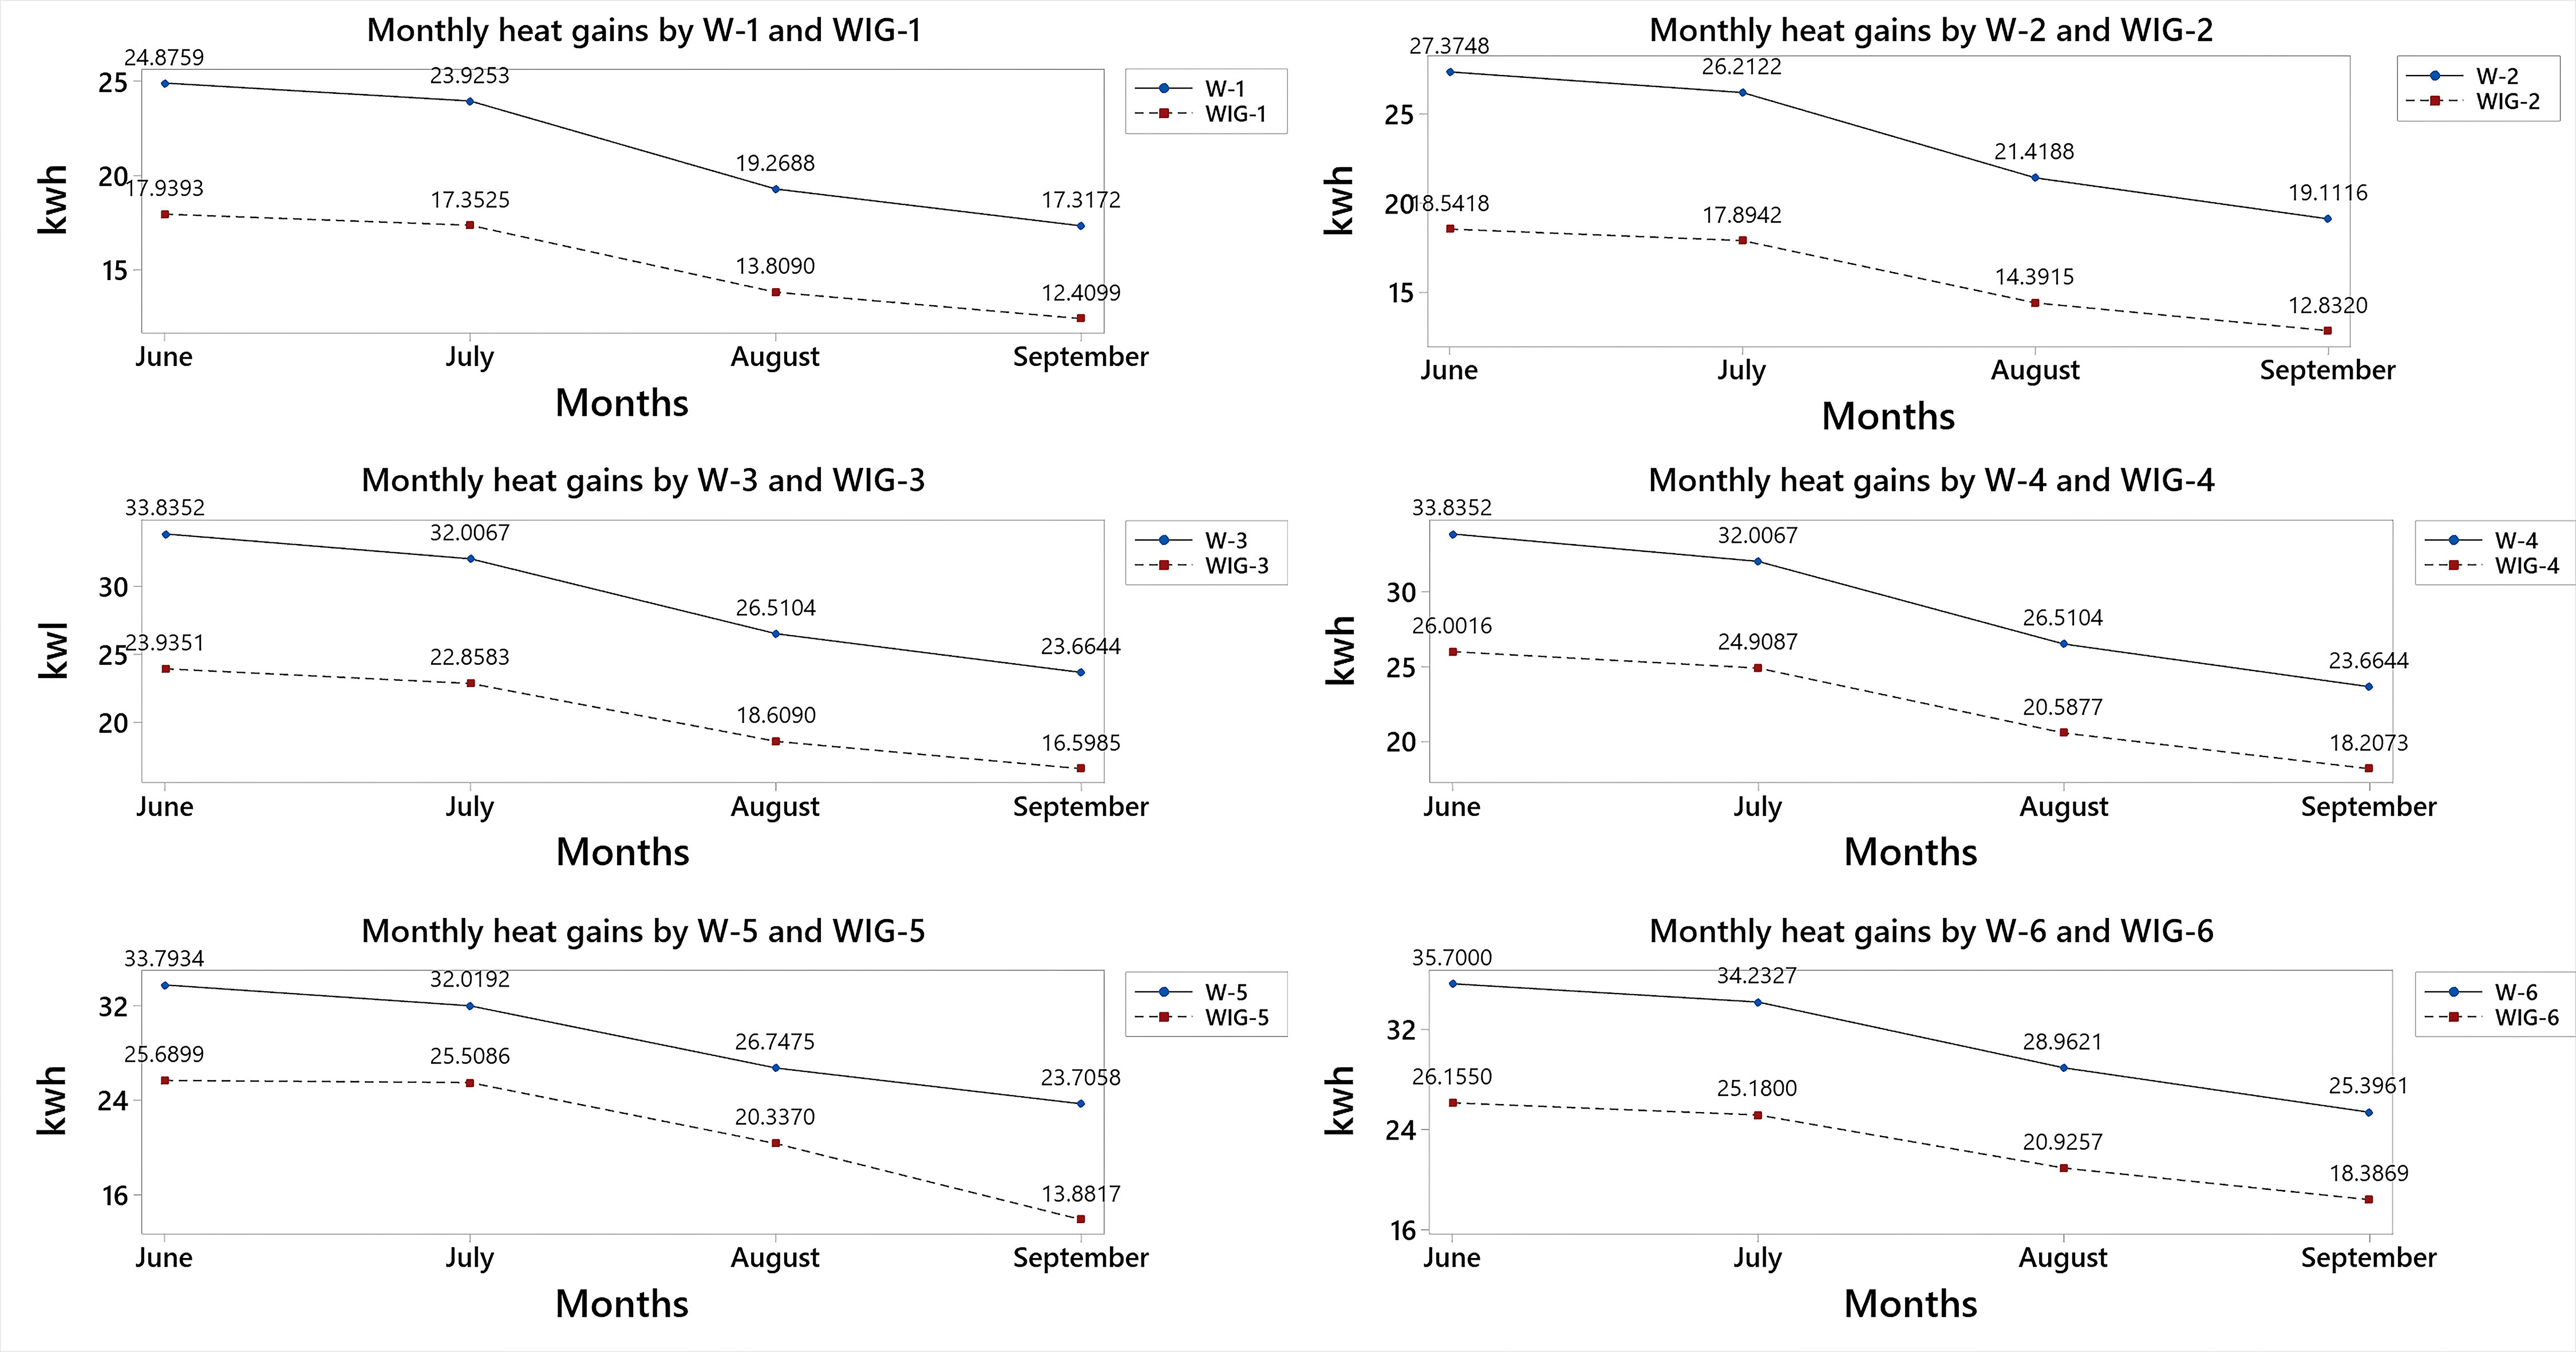
Fig. 20. The monthly variation in HGs in both rooms for 12 south wall scenarios with bare walls and VGW system.
Figure 21
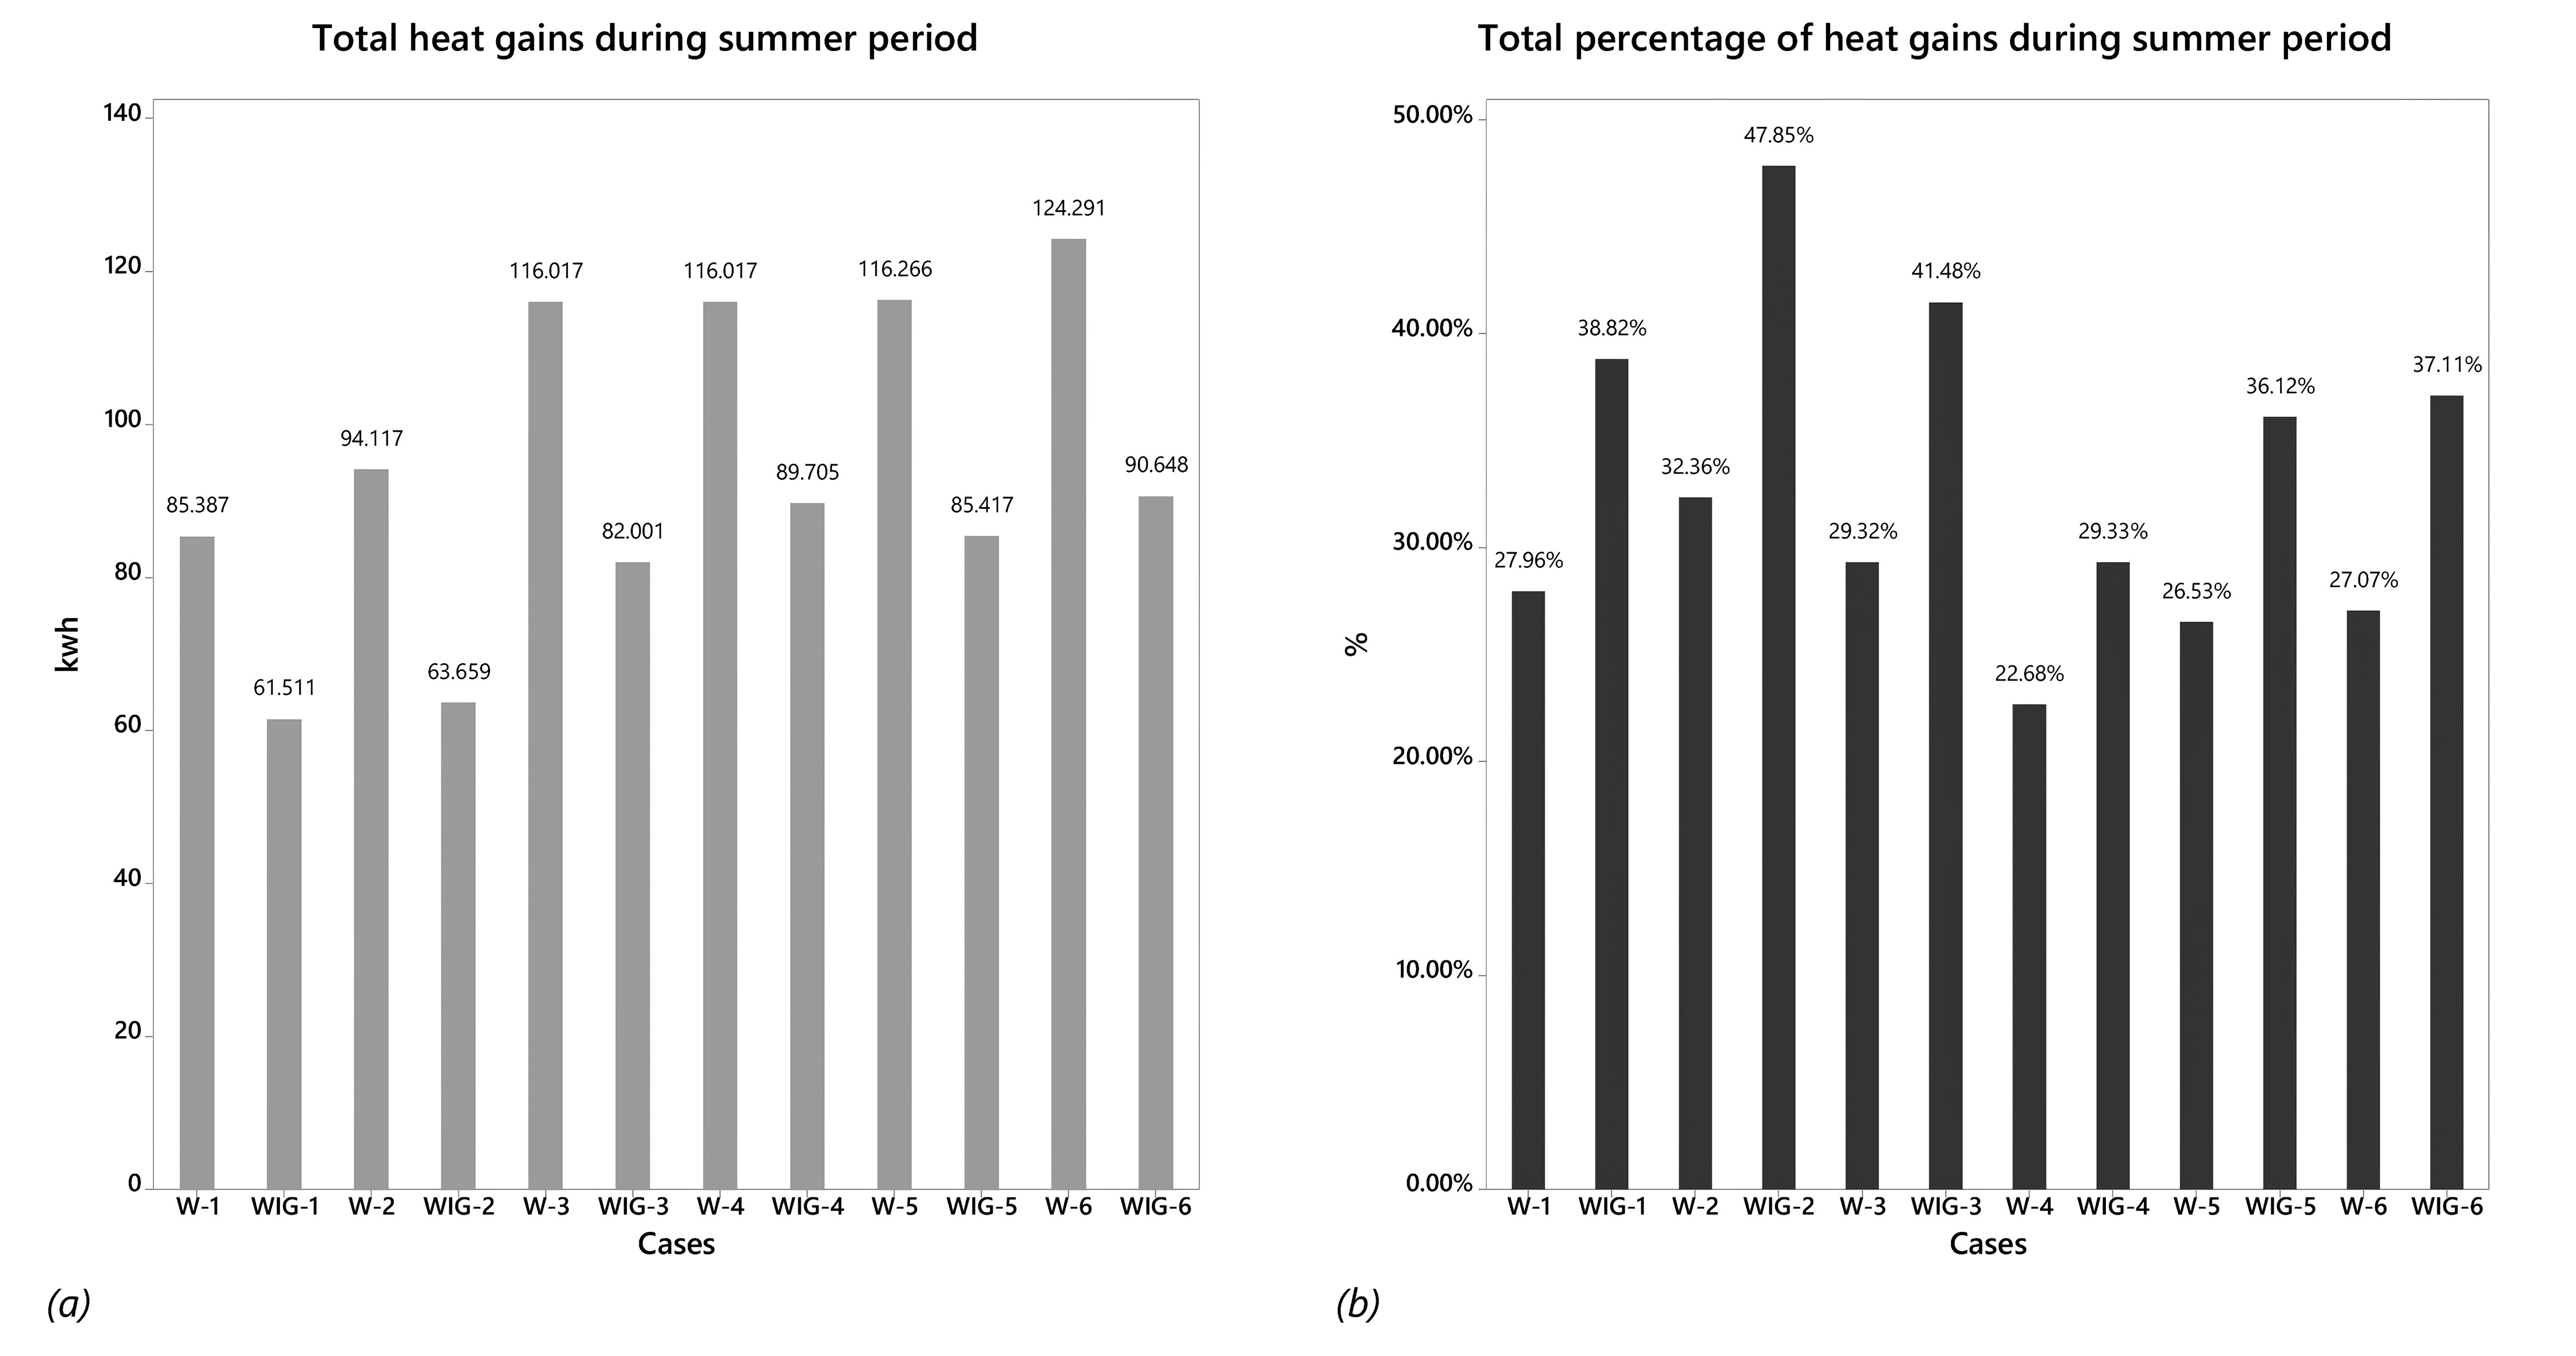
Fig. 21. (a) Total HGs during and (b) Total percentage of HGs during summer period.
5. Conclusion
This study has demonstrated the importance of considering the VGW system when designing buildings' energy performance, which is currently not the case in Yemen's sub-tropical environment. Indeed, the integration of an energy-model created in a DesignBuilder environment allowed for the thermal consequences of using a simple VGW system on buildings to be evaluated. One of the primary motivations for the development of the VGW is to maximize a building's thermal performance by conserving the energy for cooling in sub-tropical climate. The heat transfer potential due to the Tia, cooling performance, and HGs were evaluated by comparing the Tia of the VGW with that of other alternatives.
The details of research results and main conclusions are depicted as followings:
- The present work presents the OTTV-based BIM simulation method (OTTVBB) of the thermal behaviour of wall integrated with green system in the sub-tropical climate of Yemen. The necessity of measuring the thermal performance of exterior walls to obtain reliable overall energy performance has been underlined in this study.
- The OTTVBB method provides an acceptable thermal performance value for a design by comparing multiple material setups. The method provides a predetermining thermal property of the construction material of building envelopes in order to help design designers in making decisions regarding selecting of envelope materials with respect to energy performance of building regulations, not only for buildings integrated with green system in sub-tropics but also for any complex energy system for energy performance can be useful in different climates areas.
- The characteristics of wall construction employed in the exterior walls of building facades play an important part in ensuring interior thermal performance. A series of calculations and analysis was carried out to determine the OTTV values and Tia, cooling performance, and HGs of six different wall modules integrated with a greening system using the OTTVBB method.
- The research methodology consists of two techniques; first, the calculation of the OTTV by referring to the standard guiding tools, and second, and second, “simulation-based analysis” study based on BIM model using DesignBuilder software through three steps. In the first step is BIM modelling of case study and alternatives. To optimize the evaluation of the thermal performance, the BIM prototype was designed as an integrated framework to link BIM models to physical/thermal assets stored in the BIM database. The second stage is to collect information from the BIM database about under-investigation wall constructions to compute variables important to OTTV calculation.
- The simulation results found that the tested walls with greenery system had significantly better thermal performance than those walls that did not have greenery system, according to OTTVBB analysis.
- The simulation findings demonstrate that in the presence of a green system, a good OTTV value of the exterior walls is required for optimal performance, because it can be noted that with low OTTV values of wall and VGW system can keep the space within set point of cooling for long time during the summer period. Furthermore, different simulations performed on the 12 choices of the South-facing walls have emphasised the thermal performance that the VGW system can provide throughout the cooling season.
- The comparisons between the modifications of the walls construction of the bare walls and the VGW system have demonstrated a great variation due to the different OTTV values and green system. These reached up to 6.57% and 18.44% reduction in Tia as minimum and maximum values during the summer period.
In conclusion, given Yemen's sub-tropical environment, the combination of VGW and low-OTTV wall construction produced the best results and is likely to be concluded as the most practical choice. As a result, selecting a kind of wall construction with a good OTTV value is critical, and it must be done in accordance with the climatic conditions of the sub-tropical region. Thus, the use of VGW with low wall values of OTTV is strongly recommended on external wall facades to reduce heat flux.
Acknowledgement
The authors gratefully acknowledge the support from Universiti Sains Malaysia (USM) post-doctoral research fellowship scheme.
Contributions
A. A. S. Bahdad: Methodology, Validation, Simulation, Writing-Original draft preparation, investigation and data analysis, visualization, S. F. S. Fadzil: Conceptualization, methodology, supervision, H. O. Onubi: Reviewing and Editing.
Declaration of competing interest
The author(s) declared no potential conflicts of interest with respect to the research, authorship, and/or publication of this article.
References
- C. Herath, C. Gunasekara, D.W. Law, S. Setunge, Long term mechanical performance of nano-engineered high volume fly ash concrete, Journal of Building Engineering (2021) 103168. https://doi.org/10.1016/j.jobe.2021.103168
- A. Chan, T. Chow, Evaluation of Overall Thermal Transfer Value (OTTV) for commercial buildings constructed with green roof, Applied energy 107 (2013) 10-24. https://doi.org/10.1016/j.apenergy.2013.02.010
- W. Natephra, N. Yabuki, T. Fukuda, Optimizing the evaluation of building envelope design for thermal performance using a BIM-based overall thermal transfer value calculation, Building and Environment 136 (2018) 128-145. https://doi.org/10.1016/j.buildenv.2018.03.032
- P. Bano, S. Dervishi, The impact of vertical vegetation on thermal performance of high-rise office building facades in Mediterranean climate, Energy and Buildings 236 (2021) 110761. https://doi.org/10.1016/j.enbuild.2021.110761
- M.H.A. Nasir, A.S. Hassan, Thermal performance of double brick wall construction on the building envelope of high-rise hotel in Malaysia, Journal of building Engineering 31 (2020) 101389. https://doi.org/10.1016/j.jobe.2020.101389
- L. Zhang, Analysis of energy saving effect of green building exterior wall structure based on ANSYS simulation analysis, Environmental Technology & Innovation (2021) 101673. https://doi.org/10.1016/j.eti.2021.101673
- M. Haggag, A. Hassan, S. Elmasry, Experimental study on reduced heat gain through green façades in a high heat load climate, Energy and Buildings 82 (2014) 668-674. https://doi.org/10.1016/j.enbuild.2014.07.087
- U. Mathur, R. Damle, Impact of air infiltration rate on the thermal transmittance value of building envelope, Journal of Building Engineering 40 (2021) 102302. https://doi.org/10.1016/j.jobe.2021.102302
- M. Mourshed, D. Kelliher, M. Keane, Green architecture: The need for climate analysis and thermal simulation during early stages of design, Global Built Environment Review 5 (2005) 12-20.
- A.L.S. Chan, T.T. Chow, Evaluation of Overall Thermal Transfer Value (OTTV) for commercial buildings constructed with green roof, Applied Energy 107 (2013) 10-24. https://doi.org/10.1016/j.apenergy.2013.02.010
- L. Hongyu, M. LAVERICK. Measurement of thermal performance of building envelope-a comparison of some international legislation, in: 2nd International Conference on Waste Engineering and Management-ICWEM 2010, 2010, pp. 108-121.
- B. Tejedor, M. Casals, M. Gangolells, X. Roca, Quantitative internal infrared thermography for determining in-situ thermal behaviour of façades, Energy and Buildings 151 (2017) 187-197. https://doi.org/10.1016/j.enbuild.2017.06.040
- C.L.G. Ministry of Housing. Conservation of Fuel and Power, UK Building Regulation 2010-L1A, Building regulation in England setting standards for the energy performance of new and existing buildings, Accessed on, 2021, Available at: https://www.gov.uk/government/publications/conservation-of-fuel-and-power-approved-document-l.
- R. Saidur, M. Hasanuzzaman, M. Hasan, H.H. Masjuki, Overall thermal transfer value of residential buildings in Malaysia, Journal of Applied Sciences 9 (2009) 2130-2136. https://doi.org/10.3923/jas.2009.2130.2136
- A.L.S. Chan, T.T. Chow, Calculation of overall thermal transfer value (OTTV) for commercial buildings constructed with naturally ventilated double skin façade in subtropical Hong Kong, Energy and Buildings 69 (2014) 14-21. https://doi.org/10.1016/j.enbuild.2013.09.049
- K.B. Janda, J.F. Busch, Worldwide status of energy standards for buildings, Energy 19 (1994) 27-44. https://doi.org/10.1016/0360-5442(94)90102-3
- S.C.M. Hui, J.C. Lam, Overall thermal transfer value (OTTV) - A review, Hong Kong Engineer 19 (1991) 26-32.
- J. Lee, S. Kim, J. Kim, D. Song, H. Jeong, Thermal performance evaluation of low-income buildings based on indoor temperature performance, Applied Energy 221 (2018) 425-436. https://doi.org/10.1016/j.apenergy.2018.03.083
- A.S. Hassan, M.H.A. Nasir, Analysis on the OTTV of Modern-Style Apartment Facades in Bandar Sri Permaisuri, Kuala Lumpur, Pertanika Journal of Science & Technology 25 (2017).
- J.C. Lam, C. Tsang, D.H. Li, S. Cheung, Residential building envelope heat gain and cooling energy requirements, Energy 30 (2005) 933-951. https://doi.org/10.1016/j.energy.2004.07.001
- M.R. Asl, S. Zarrinmehr, M. Bergin, W. Yan, BPOpt: A framework for BIM-based performance optimization, Energy and Buildings 108 (2015) 401-412. https://doi.org/10.1016/j.enbuild.2015.09.011
- A. Schlueter, F. Thesseling, Building information model based energy/exergy performance assessment in early design stages, Automation in construction 18 (2009) 153-163. https://doi.org/10.1016/j.autcon.2008.07.003
- D. Bienvenido-Huertas, R. Rodríguez-Álvaro, J.J. Moyano, F. Rico, D. Marín, Determining the U-value of façades using the thermometric method: potentials and limitations, Energies 11 (2018) 360. https://doi.org/10.3390/en11020360
- G. Zemella, A. Faraguna, Evolutionary optimisation of facade design: A New approach for the design of building envelopes. 2014: Springer. https://doi.org/10.1007/978-1-4471-5652-9_1
- I. Blanco, G. Vox, E. Schettini, G. Russo, Assessment of the environmental loads of green façades in buildings: a comparison with un-vegetated exterior walls, Journal of Environmental Management 294 (2021) 112927. https://doi.org/10.1016/j.jenvman.2021.112927
- K.A. Hoffmann, T. Šuklje, J. Kozamernik, T. Nehls, Modelling the cooling energy saving potential of facade greening in summer for a set of building typologies in mid-latitudes, Energy and Buildings 238 (2021) 110816. https://doi.org/10.1016/j.enbuild.2021.110816
- H. Omrany, A. Ghaffarianhoseini, A. Ghaffarianhoseini, K. Raahemifar, J. Tookey, Application of passive wall systems for improving the energy efficiency in buildings: A comprehensive review, Renewable and sustainable energy reviews 62 (2016) 1252-1269. https://doi.org/10.1016/j.rser.2016.04.010
- C. Alonso, F. Martín-Consuegra, I. Oteiza, E. Asensio, G. Pérez, I. Martínez, B. Frutos, Effect of façade surface finish on building energy rehabilitation, Solar Energy 146 (2017) 470-483. https://doi.org/10.1016/j.solener.2017.03.009
- E. Barreira, V.P. de Freitas, Evaluation of building materials using infrared thermography, Construction and building materials 21 (2007) 218-224. https://doi.org/10.1016/j.conbuildmat.2005.06.049
- Y.Q. Cui, B. Zhang, S.F. He, Research on Solar Water Heating System Design of the High-Rise Residential Buildings Based on Sunlight Simulation, Applied Mechanics and Materials 507 (2014) 486-491. https://doi.org/10.4028/www.scientific.net/amm.507.486
- P. Hoseinzadeh, M. Khalaji Assadi, S. Heidari, M. Khalatbari, R. Saidur, K. Haghighat nejad, H. Sangin, Energy performance of building integrated photovoltaic high-rise building: Case study, Tehran, Iran, Energy and Buildings 235 (2021) 110707. https://doi.org/10.1016/j.enbuild.2020.110707
- P.J. Jones, D. Alexander, A. Marsh, J. Burnett, Evaluation of Methods for Modelling Daylight and Sunlight in High Rise Hong Kong Residential Buildings, Indoor and Built Environment 13 (2004) 249-258. https://doi.org/10.1177/1420326x04045177
- A. Vulkan, I. Kloog, M. Dorman, E. Erell, Modeling the potential for PV installation in residential buildings in dense urban areas, Energy and Buildings 169 (2018) 97-109. https://doi.org/10.1016/j.enbuild.2018.03.052
- K. Kontoleon, E. Eumorfopoulou, The effect of the orientation and proportion of a plant-covered wall layer on the thermal performance of a building zone, Building and environment 45 (2010) 1287-1303. https://doi.org/10.1016/j.buildenv.2009.11.013
- H. Rupasinghe, R. Halwatura, Benefits of implementing vertical greening in tropical climates, Urban Forestry & Urban Greening 53 (2020) 126708. https://doi.org/10.1016/j.ufug.2020.126708
- K.K.C. Dahanayake, C.L. Chow, Studying the potential of energy saving through vertical greenery systems: Using EnergyPlus simulation program, Energy and Buildings 138 (2017) 47-59. https://doi.org/10.1016/j.enbuild.2016.12.002
- A. Hoyano, Climatological uses of plants for solar control and the effects on the thermal environment of a building, Energy and buildings 11 (1988) 181-199. https://doi.org/10.1016/0378-7788(88)90035-7
- C.L. Tan, N.H. Wong, S.K. Jusuf, Effects of vertical greenery on mean radiant temperature in the tropical urban environment, Landscape and Urban Planning 127 (2014) 52-64. https://doi.org/10.1016/j.landurbplan.2014.04.005
- Q. Chen, B. Li, X. Liu, An experimental evaluation of the living wall system in hot and humid climate, Energy and buildings 61 (2013) 298-307. https://doi.org/10.1016/j.enbuild.2013.02.030
- M. Manso, J. Castro-Gomes, Thermal analysis of a new modular system for green walls, Journal of Building Engineering 7 (2016) 53-62. https://doi.org/10.1016/j.jobe.2016.03.006
- M.-T. Hoelscher, T. Nehls, B. Jänicke, G. Wessolek, Quantifying cooling effects of facade greening: Shading, transpiration and insulation, Energy and Buildings 114 (2016) 283-290. https://doi.org/10.1016/j.enbuild.2015.06.047
- R. Fernández-Cañero, L.P. Urrestarazu, A. Franco Salas, Assessment of the cooling potential of an indoor living wall using different substrates in a warm climate, Indoor and Built Environment 21 (2012) 642-650. https://doi.org/10.1177/1420326x11420457
- K. Perini, M. Ottelé, A. Fraaij, E. Haas, R. Raiteri, Vertical greening systems and the effect on air flow and temperature on the building envelope, Building and Environment 46 (2011) 2287-2294. https://doi.org/10.1016/j.buildenv.2011.05.009
- U. Mazzali, F. Peron, P. Romagnoni, R.M. Pulselli, S. Bastianoni, Experimental investigation on the energy performance of living walls in a temperate climate, Building and Environment 64 (2013) 57-66. https://doi.org/10.1016/j.buildenv.2013.03.005
- Atlas. weather forecast and climate, Al Mukalla, Yemen,, Accessed on, 2021, Available at: https://www.weather-atlas.com/en/yemen/al-mukalla-weather-january#climate_text_1.
- K. Lakhdari, L. Sriti, B. Painter, Parametric optimization of daylight, thermal and energy performance of middle school classrooms, case of hot and dry regions, Building and Environment (2021) 108173. https://doi.org/10.1016/j.buildenv.2021.108173
- E. Assem, A. Al-Mumin, Code compliance of fully glazed tall office buildings in hot climate, Energy and buildings 42 (2010) 1100-1105. https://doi.org/10.1016/j.enbuild.2010.02.001
- M. Etxebarria-Mallea, X. Oregi, O. Grijalba, R. Hernández-Minguillón, The impact of energy refurbishment interventions on annual energy demand, indoor thermal behaviour and temperature-related health risk, Energy Policy 153 (2021) 112276. https://doi.org/10.1016/j.enpol.2021.112276
- Q. Li, L. Zhang, L. Zhang, X. Wu, Optimizing energy efficiency and thermal comfort in building green retrofit, Energy 237 (2021) 121509. https://doi.org/10.1016/j.energy.2021.121509
- X. Hao, Q. Xing, P. Long, Y. Lin, J. Hu, H. Tan, Influence of vertical greenery systems and green roofs on the indoor operative temperature of air-conditioned rooms, Journal of Building Engineering 31 (2020) 101373. https://doi.org/10.1016/j.jobe.2020.101373
- M. Palme, R. Privitera, D. La Rosa, The shading effects of Green Infrastructure in private residential areas: Building Performance Simulation to support urban planning, Energy and Buildings 229 (2020) 110531. https://doi.org/10.1016/j.enbuild.2020.110531
- L.L. Peng, Z. Jiang, X. Yang, Q. Wang, Y. He, S.S. Chen, Energy savings of block-scale facade greening for different urban forms, Applied Energy 279 (2020) 115844. https://doi.org/10.1016/j.apenergy.2020.115844
- J. Zhang, L. Xu, V. Shabunko, S.E.R. Tay, H. Sun, S.S.Y. Lau, T. Reindl, Impact of urban block typology on building solar potential and energy use efficiency in tropical high-density city, Applied Energy 240 (2019) 513-533. https://doi.org/10.1016/j.apenergy.2019.02.033
Copyright © 2021 The Author(s). Published by solarlits.com.

3331
Total views
Citations
SHARE ON


