Volume 9 Issue 1 pp. 1-12 • doi: 10.15627/jd.2022.1
Effect of Roller Shades on Chromaticity and Colour Rendering Performance of Transmitted Daylight
Ayelén Villalba,* Erica Correa, Julieta Yamín, Andrea Pattini
Author affiliations
Institute of Environment, Habitat and Energy (INAHE), Mendoza Scientific and Technological Center (CONICET), Av. Ruiz Leal s/n Parque General San Martín, Mendoza (5500), Argentina
*Corresponding author.
avillalba@mendoza-conicet.gob.ar (A. Villalba)
ecorrea@mendoza-conicet.gob.ar (E. Correa)
jyamin@mendoza-conicet.gob.ar (J. Yamín)
apattini@mendoza-conicet.gob.ar (A. Pattini)
History: Received 14 October 2021 | Revised 15 December 2021 | Accepted 30 December 2021 | Published online 29 January 2022
Copyright: © 2022 The Author(s). Published by solarlits.com. This is an open access article under the CC BY license (http://creativecommons.org/licenses/by/4.0/).
Citation: Ayelén Villalba, Erica Correa, Julieta Yamín, Andrea Pattini, Effect of Roller Shades on Chromaticity and Colour Rendering Performance of Transmitted Daylight, Journal of Daylighting 9 (2022) 1-12. https://dx.doi.org/10.15627/jd.2022.1
Figures and tables
Abstract
Several studies have focused on the performance of roller shades in terms of glare, outdoor vision, daylight availability and energy performance. Currently, other parameters linked to visual amenity, such as chromaticity and colour rendition, are becoming relevant. When solar radiation passes through a window, it changes its spectral composition due to the presence of the solar shading system and the glazing. Against this background, the present study focuses on the spectral transmittance of eleven woven screen fabrics and its influence on the chromaticity and colour rendition. Results show that dark-coloured woven screen shades provide higher correlated colour temperature (CCT) values (range 6470 K - 6479 K) and therefore would produce “cooler” visual environments, while light-coloured woven screen shades provide lower CCT values (range 5210 K - 5644 K) creating “warmer” visual environments. Regarding colour rendering metrics, the light transmitted through all the studied woven shades shows excellent colour rendition. Finally, it is concluded that the combined analysis of optical properties, spectral data and its impact on parameters that determine the quality of lighting in an interior space enables an understanding of woven screens performance, which results in the possibility of taking appropriate decisions when selecting woven shades.
Keywords
Roller screen shades, Chromaticity, Colour rendition, Daylight
1. Introduction
One of the most efficient ways to reduce energy lighting consumption in buildings is to take advantage of the free natural source called sunlight [1] in daytime spaces. The use of daylighting combined with artificial lighting control systems has revealed, in field studies, significant energy savings [2,3]. This is particularly important in regions with many clear sky days, as it offers the opportunity to light indoor daytime spaces with sunlight. The use of natural lighting in buildings can also improve the quality of interior spaces [4,5]. However, daylight is generally an under-exploited resource mainly due to its variable nature [6]. Furthermore, the potential for energy saving and visual comfort depends on how daylight enters the indoor space and this is mainly determined by shading and solar control systems [7–9].
Shading devices have become increasingly important in the energy performance of buildings. This has led to the development of several innovative components [10] that seek to improve the quality of indoor lighting and manage solar gain. If we focus on indoor woven shades, innovation has been targeted at the type of fabrics used – screen, sheer, blackout, translucent – and at their style – roller shade, cellular honeycomb shade, cellular roller shade, dual shade, and sliding panels –. Currently, indoor woven shades are one of the most widely used solar shading systems because of their low cost, simplicity and visual appearance. Proper implementation of woven shades can improve the quality of interior lighting and reduce energy consumption used for space lighting, heating and cooling [11–13].
Openness factor and visible transmittance are the most commonly studied properties of woven shades. Several studies have focused on their impact on roller shades performance. Konstantzos and Tzempelikos [14] developed a methodology to recommend optical properties of shading fabrics, in terms of openness factor and visible transmittance, concerning glare mitigation, energy performance, and connection to the outdoors. Tzempelikos and Chan [15] confirmed that shade optical properties (openness factor and beam-total transmittance at normal incidence) have a significant impact on both daylighting and visual comfort and should be considered in daylighting calculation. Chan et al. [16] analysed the combined impact of visible transmittance and openness factor on discomfort frequency and daylight metrics. As a result of their study, they developed a methodology that allows determining the risk of glare according to the openness factor and the visible transmittance of the woven shade. The “view clarity index” developed by Konstantzos et al. [17] can also be calculated using these properties. Jonsson et al. [18] studied the light-scattering properties of a woven shade-screen material used for daylighting and solar heat-gain control and their relevance regarding energy and daylighting simulation software’s. Chan et al. [19] analysed the impact of angular-based solar optical properties on energy performance and glare using annual simulation for different fabrics.
Other optical properties, such as the spectral transmittance of woven shades and its impact on chromaticity and colour rendering, have not been studied as extensively. The spectral power distribution (SPD) of a light source specifies the amount of energy (or power) emitted at each wavelength [20]. The SPD of transmitted light affects visual comfort and colour perception [21]. The colour appearance of objects can be affected by the spectral power distribution of the light source [22]. The spectral transmittance of the glazing and/or the solar shading device has a direct impact on correlated colour temperature (CCT) and colour rendition properties (colour rendering index (CRI), colour fidelity index (Rf), gamut index (Rg)). For many years CCT and CRI [7,8,23–25] have been the two major components used to understand the SPD of transmitted light [21,26]. Currently, other parameters are proposed to analyse the colour rendition of light. Some of them are overall average properties (Rf and Rg) and others such as the chroma shift and the hue shift are hue-specific properties of a light source [27,28]. Furthermore, new properties, such as Duv, have been introduced to more accurately define CCT values [20]. Duv is defined as the distance from the chromaticity coordinate of the test light source to the closest point on the Planckian locus on the CIE 1960 (u,v) [29].
Other optical properties, such as the spectral transmittance of woven shades and its impact on chromaticity and colour rendering, have not been studied as extensively. The spectral power distribution (SPD) of a light source specifies the amount of energy (or power) emitted at each wavelength [20]. The SPD of transmitted light affects visual comfort and colour perception [21]. The colour appearance of objects can be affected by the spectral power distribution of the light source [22]. The spectral transmittance of the glazing and/or the solar shading device has a direct impact on correlated colour temperature (CCT) and colour rendition properties (colour rendering index (CRI), colour fidelity index (Rf), gamut index (Rg)). For many years CCT and CRI [7,8,23–25] have been the two major components used to understand the SPD of transmitted light [21,26]. Currently, other parameters are proposed to analyse the colour rendition of light. Some of them are overall average properties (Rf and Rg) and others such as the chroma shift and the hue shift are hue-specific properties of a light source [27,28]. Furthermore, new properties, such as Duv, have been introduced to more accurately define CCT values [20]. Duv is defined as the distance from the chromaticity coordinate of the test light source to the closest point on the Planckian locus on the CIE 1960 (u,v) [29].
However, most studies focusing on chromaticity and colour rendering have been carried out in the field of artificial lighting. Dikel et al. [36] examined preferences for various spectra with measured CCT of 2855 K, 3728 K, 4751 K, 5769 K, and 6507 K. Results show that values ranging between 3728 K and 5769 K were judged to be very similar to one another. They also found that many of the spectral distributions with lower CCT values were judged to be less luminous than the highest one. Finally, they conclude that there is no one preferred CCT value; there is rather a range that goes from 2750 to 14000 K, generally with negative Duv values. Ohno et al. [37] conducted a series of vision experiments so that the effect of chromaticity could be individually evaluated, minimizing other effects such as colour gamut or chroma saturation. The experiments were developed at six Duv levels (0.02, 0.01, 0, -0.01, -0.02, -0.03) and at five CCTs (2200 K, 2700 K, 3500 K, 4500 K, 6500 K). Their research showed that the lights with Duv ≈ -0.015 appeared as the most natural at all CCTs. They also stated that there is a general preference to the negative Duv lights for typical interior room environments and that the most preferred white light chromaticity was found to be around Duv -0.015, which is consistent overall CCT ranges from 2200 K to 6500 K. Wang et al. [38] conducted a study whose key objective was to test whether the chromaticity of light individually has an impact on user preferences. For this purpose, they used spectral distributions with two different CCT values (3000 K and 6500 K) but kept similar settings of those parameters that determine the colour rendering capability of a source (gamut and colour fidelity). Results showed a Duv preference of between -0.02 and -0.03 for CCT values of 3000 K and from 0 to -0.01 for CCT values of 6500 K. Rea and Freyssinier studied the subjective perception of white illumination for light sources with different CCT values through psychophysical experiments. They found that for sources with CCT values above 4000 K untinted white illumination is associated with Duv values that lie above the blackbody locus. Smet [38], who also focused on perceived neutrality of light, developed two neutral white illumination loci: UW-neutral locus (based on the unique white ratings under dark-adapted conditions) and CA-locus (based on psychophysical data on the degree of chromatic adaptation) in terms of CCT and Duv. Both loci have similar shapes but are offset from each other in the u'v' chromaticity diagram. His results also show that at 6605 K the highest neutrality is reached in both loci, with corresponding Duv values of −0.0067 for the UW-neutral locus and 0.0012 for the CA-locus.
In 2020, Royer et al. [39] validated through experimentation a criterion that determines the colour rendering quality of a light source according to three parameters (Rf, Rg, and red local chroma shift) set by ANSI/IES TM-30-18 [28]. Ten colour rendition conditions with different fidelity and gamut indexes and a red local chroma shift (Rcs,h1) were created, with CCT values ranging from 2700 K to 3500 K and Duv ranging from 0.007 to -0.014. Results show that while colour rendition is the determining factor of the appearance of the objects, chromaticity is only meaningful in those cases where saturation is high. Wider ranges of CCT have been previously explored with similar results: Wang et al. [40]: 2800 K to 6500 K; Royer et al. [41]: 2700 K to 4300 K. Royer et al. [39] state that only when chromatic adaptation is not fully considered an overall CCT preference can take place. Dangol et al. [24] state that the impact of the Duv value on the colour rendering performance of a light source remains unclear. Ohno [42] states that across different CCT (2700 K – 5000 K) / Duv (0 to -0.015) subjects preferred a chroma increase ∆C*ab between 4 and 8. The subjects’ preference starts decreasing at larger saturations, as objects progressively seem unnatural. The subjects’ preference at saturation level ∆C*ab ≈ 16 (most saturated condition) is comparable to that of the neutral saturation (∆C*ab = 0).
Against this background, the present study analyses the key optical properties –light transmittance and reflectance, spectral transmittance and reflectance- that determine the quality and quantity of the incoming daylight after passing through a woven screen shade. The analysis focuses on the SPD of transmitted light and its influence on the chromaticity (CCT and Duv) and colour rendering (Rg, Rf and red local chroma shift), as these properties have a major impact on colour perception of light and colour appearance of objects. Moreover, it is important to highlight that the impact of woven roller blinds on these parameters has been scarcely explored so far. In accordance with this objective in the following section the analysed parameters are described. In the materials and methods section woven shade samples and the measuring equipment used to determine the spectral transmittance and reflectance are described. Subsequently, the results are presented and discussed.
1.1. Analysed parameters
1.1.1. Light transmittance and reflectance
Light transmittance (τv) is the percentage of visible light transmitted through the woven shade [16] and light reflectance (ρv) is the fraction of the incident light that is reflected by the fabric. On woven shades, incident beam radiation is split into two parts: the undisturbed portion transmitted through the openings, and the intercepted portion (transmitted or reflected) [43]. The beam-total transmittance τb-t includes the beam-beam transmittance τb-b (undisturbed transmitted portion), which is equal to the openness factor at normal incidence, and the beam-diffuse transmittance (intercepted radiation). Jonsson et al. [18] hold that the diffuse transmission τb-d of the fabric is from forward scattering only. However, they detect that as wavelengths increase the reflectance decreases yet the diffuse transmittance rises. This is noteworthy if we consider that the diffuse transmittance is only a function of forward scattering. Kotey et al. [43] claim that the intercepted radiation (beam-diffuse transmittance) is scattered by multiple reflections between and possible transmission through the strands of yarn. Previous studies [18,43] show that woven fabrics, as the analysed in this paper, generally have a negligible specular reflectance component. The reflectance of the fabric behaves almost like a completely Lambertian material [18]. Therefore, the beam-beam reflectance is equal to zero and the beam-total reflectance is equivalent to the beam-diffuse reflectance [43].
These characteristics are mainly defined by the fabric pattern, colour, and density, which vary according to the manufacturer [16,18]. Roller blind fabrics come in a wide variety of colours, weave types, patterns, and fabric densities which results in different openness factors, light transmittance, and light reflectance values. Deneyer et al. [44] state in their study that the diffuse component of transmittance (beam-diffuse transmittance) is a key factor in the behaviour of light-coloured fabrics, as diffuse light transmitted by the lighter weave is higher than that transmitted by the darker weave. In line with this, Chan et al. [16] argue that light-coloured fabrics typically have higher light transmittance than darker fabrics with the same degree of aperture. In dark textiles, where diffuse transmittance is lower [44], the openness factor is a determining parameter of τv.
1.1.2. Spectral transmittance and reflectance
The spectral transmittance (τ(λ)) is defined by the ratio of the transmitted power I(λ) to the incident power I0(λ) in a small interval of wavelength around the centre wavelength λ and in a given (sufficiently small) solid angle of aperture [45]. Transparent building components can significantly modify the spectral composition of the transmitted daylight [46]. The spectral reflectance (ρ(λ)) is the fraction of radiation reflected in each area of the electromagnetic spectrum, which determines the colour of a given object.
1.1.3. Chromaticity: correlated colour temperature and Duv
There is a set of metrics for describing the spectral distribution of a white light source; which is usually referred to as tint, chromaticity, or colour of a light source [47]. The chromaticity of light is normally expressed by means of the xy or u´v´ chromaticity coordinates. However, chromaticity coordinates do not intuitively supply colour data [29], so often chromaticity is expressed in terms of CCT and Duv. Thus, in this work, CCT and Duv were selected to describe the colour of the light entering the space through the woven shades.
The CCT is a temperature of the Planckian radiator having the chromaticity nearest the chromaticity associated with the given spectral distribution on a diagram where the (CIE 1931 standard observer-based) u´, 2/3v´coordinates of the Planckian locus and the test stimulus are depicted [48]. The CCT determines whether a light source is neutral, bluish-white, or reddish-white [21]. Areas above 5000 K are often referred to as cool white, while those below 3500 K are termed warm white [22].
Duv is the Euclidean difference of chromaticity coordinate uv between the test light source to the closest point on the Planckian locus in the u’, 2/3v’ coordinate system [24], with positive values for above and negative values for below the Planckian locus [49]. Duv values provide the information of the distance and direction of color shift from the Planckian locus (yellowish/greenish or pinkish) [29].
1.1.4. Colour rendering: fidelity index (Rf), gamut index (Rg) and red local chroma shift (Rcs,h1)
Vividness, preference, naturalness, normalness, and visual clarity are some of the subjective perceptual features of a space on which colour rendition can impact significantly [28]. The colour rendering of a light source is the effect of an illuminant on the perceived colour of objects by conscious or subconscious comparison with their perceived colour under a reference illuminant [50]. Frequently the index used to describe this parameter was the CRI. Due to the shortcomings of the CRI related to the colour space, the sample set and the reference illuminant [20,22], a new method that overcomes these limitations was proposed [28]. This new approach entails determining the overall average properties (Rf, Rg) and the hue-specific properties (Rcs,hj, Rhs,hj) of the light source under study. The ANSI/IES TM-30-20 only focuses on the precise quantification of the parameters that define the colour rendering performance of a light source without setting the criteria that would link the values obtained to a subjective evaluation. Following this framework, this study uses the colour preference specification criteria determined by Royer et al. [39]. These criteria are based on the Rf, the Rg and Rcs,h1. While individually these indicators do not correlate well with subjects' preferences, a linear combination of the three does [22,41]. Royer et al. [39,51] set three tiers with varying levels of stringency:
- Tier A: Rf ≥78, Rg≥95, -1%≤Rch,h1≤15% (Best)
- Tier B: Rf ≥74, Rg≥92, -7%≤Rch,h1≤19% (Good)
- Tier C: Rf ≥70, Rg≥89, -12%≤Rch,h1≤23% (Acceptable)
The Rf is an accurate measure of average colour fidelity. It focuses on determining the similarity of colours rendered by the test source and reference illuminant [28]. Colour fidelity compares the colour appearance under a test source considering the expected appearance, based on previous observations under a reference light source [22]. According to the “Technical Memorandum: IES Method for Evaluating Light Source Colour Rendition” [28] alone the Rf is most informative when the value approaches 100 because then all colour shifts versus the reference illuminant are by definition minimal. At lower Rf values, additional measures are needed to understand how colours are being shifted.
The Rg is a measure of the area spanned by the average (a',b') coordinates of the colour evaluation samples in each hue-angle bin, (a'test,j, b'test,j) and (a'ref,j, b'ref,j) [28]. The Rg compares the areas of the colour gamuts enclosed by the test samples under the test source illumination with respect to when they are illuminated by a reference illuminant [22]. According to the ANSI-IES TM-30-20 [28] an Rg value of 100 indicates that, on average, the test source does not increase or decrease chroma compared to the reference illuminant. It does not, however, indicate that all colours will have equal chroma under the test source and reference illuminant. An Rg value greater than 100 indicates an overall average increase in chroma compared to the test illuminant, whereas an Rg value less than 100 indicates an overall average decrease in chroma [28]. Light sources that increase the saturation, and therefore the colour gamut area, are often preferred over those that do not, although they distort the colour [22].
While these parameters have not been extensively studied for roller fabrics, several studies focus on the spectral transmittance, chromaticity and colour rendering properties of light transmitted through glazings and other innovative transparent solutions. Gunde et al. [52] reported that gasochromic and electrochromic switchable windows in the coloured state modify the spectral composition of the transmitted light significantly reducing the CRI with respect to green glass under comparable conditions. Mardaljevic et al. [6] showed that as the electrochromic glazing darkens taking on a blue hue the spectral transmission changes. The glazing takes on a progressively stronger blue hue as it transitions from the clear state to the fully tinted state. To maintain a neutral transmitted light spectrum, a small proportion of the electrochromic glass is kept in a clear state. Ghosh et al. [21] studied dye-sensitized solar cells (glazing applications) and found a strong linear correlation between CCT and CRI. In contrast, when studying suspended particle device switchable glazing no strong correlation was found between CCT and CRI [53]. Buratti et al. [46] found that light transmitted through transparent monolithic aerogel tends to shift colours towards a blue hue. The CRI obtained was 85. Aste et al. [54] analysed the colour rendering performance of electrochromic, thermo-chromic, gasochromic, photochromic windows, suspended particle devices and liquid crystal devices according to the IES TM 30-15 [55] colour rendering method. They claim that the colour rendering properties of light entering the space can be strongly modified as a result of the implementation of these devices, particularly when they feature low transmittance states. Dangol et al. [24] studied different types of glazing: monolithic, laminated, coated and applied film glazing regarding various colour quality metrics, such as CIE CRI, Ra,D65 (CRI taking constant reference illuminant), Duv, CCT, colour gamut area, and TM-30. Results show that the daylight transmitted through the different types of glazing has positive Duv values. They also found that the type of material used to manufacture the window glazing has a significant impact on the CIE CRI and CCT.
2. Materials and methods
2.1. Woven shades
The fabric selection criteria are based on the colour and openness factor (OF) of the fabrics. Woven fabrics with white, grey and black fibres and their combinations were selected. Furthermore, fabrics with an OF range between 3 and 14 were chosen. Considering the previous mentioned criteria, the woven fabrics that figured the highest sales volume during the last year on the local market were chosen. The selected fabrics show different physical properties (material, colour, OF) presented in Table 1. The fabrics are made of fiberglass, polyester or fiberglass/polyester yarn for its core and coated with vinyl.
Table 1
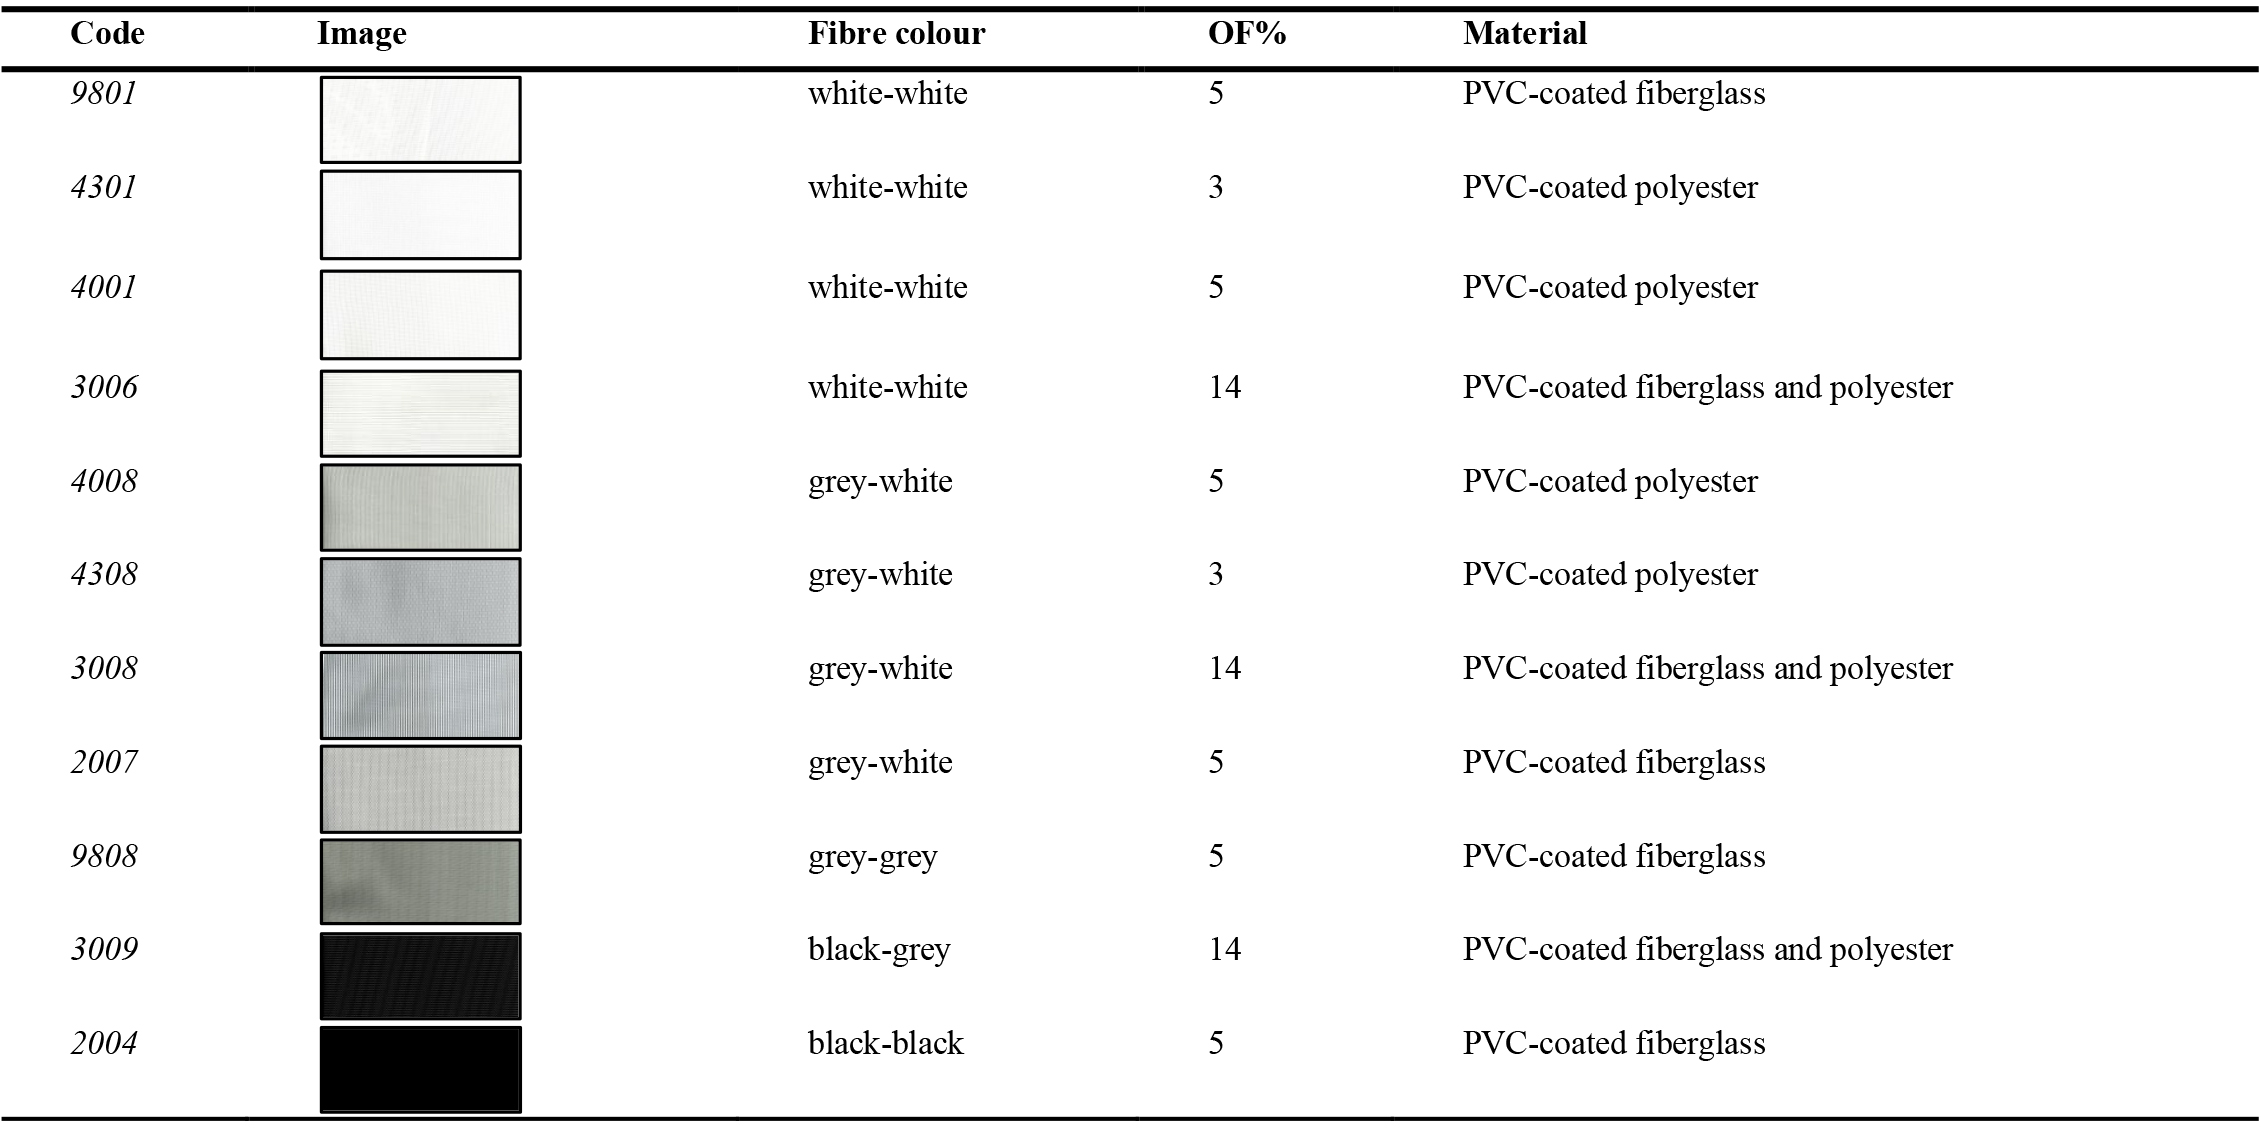
Table 1. Properties of selected fabrics: fibre colour, openness factor, material.
2.2. Spectroradiometer measurement
Spectral reflectance and spectral transmittance measurements for each of the analysed fabrics were carried out with an OPTRONIC OL 750 spectrophotometer double monochromator [56], with accessory OL 740-70 (integrating sphere) [57] and accessory OL 740-20 (high intensity source attachments) [58]. Specifications of the OL 750 spectrophotometer are shown in Table 2. These measurements were performed by the Radiometry Laboratory of the Department of Lighting, Light and Vision (DLLV, UNT) and the Institute for Research in Light, Environment and Vision (ILAV, CONICET). Measurements were made by the comparison method, which requires two scans to be completed in 4 steps: two for system calibration and two for sample measurement. Calibrated PTFE reflectance references were used.
Table 2
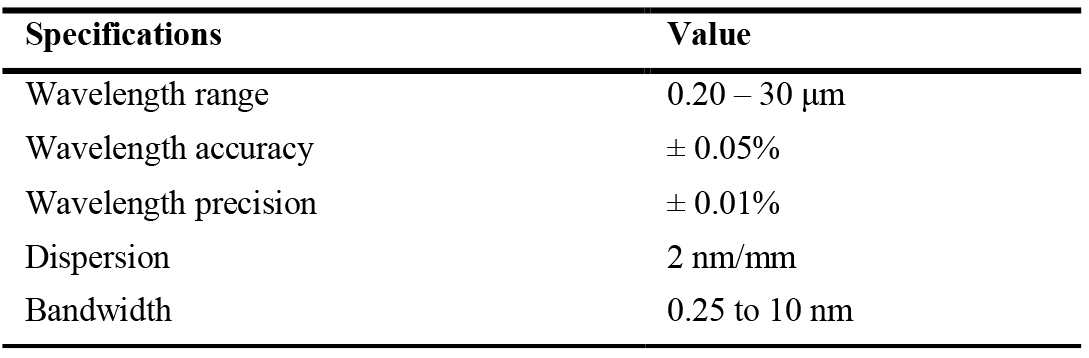
Table 2. Specifications of the OL 750 spectrophotometer.
The metrics analysed in this work were calculated based on the spectral transmittance and reflectance data. Specifically, the light transmittance values τv and light reflectance values ρv were calculated according to EN 410:2011 [59]. CCT and Duv were calculated according to the methods proposed by Onho [29] in "Practical Use and Calculation of CCT and Duv". Finally, Rf, Rg and red local chroma shift values were calculated according to ANSI/IES TM-30-20 [28].
To facilitate the analysis, textiles were grouped following their colour: light (L), intermediate (I), dark (D). This classification was made according to the fibre colour: light (white-white fibres): 4001, 3006, 9801, and 4301; intermediate (white-grey and grey-grey fibres): 3008, 9808, 4008, 4308; dark (black-grey and black fibres): 3009, 2004.
3. Results
3.1. Light transmittance and reflectance
Table 3 shows light transmittance (τv), light reflectance (ρv) and openness factor (OF) values for all the analysed fabrics. These properties will be analysed briefly given that the obtained results agree with those achieved by previous studies, outlined in the introduction to this article [16,18,43,44]. Regarding, "light" colour textiles τv values range between 0.20 and 0.28. It can be observed that the τv values are significantly higher (on average 17%) than the OF. “Intermediate" colour textiles feature τv values between 0.10 and 0.25, with the highest degree of dispersion (standard deviation (SD) 0.06). This increased dispersion is due to textile 3008 which has an OF of 14% and therefore its τv is higher (0.25). It is of relevance to analyse how "intermediate" textiles with similar properties -OF, reflectance, type of fabric and weight- (4008 and 9808) show τv values with up to a 6% difference. This notable difference in τv could be because the core material in 4008 is polyester while in 9808 it is fiberglass. However, this is not observed in light-coloured textiles, where 4001 and 9801 represent a similar situation but with higher values of ρv. Concerning "dark" fabrics - 3009 and 2004 - it can be observed that the fabric with the highest OF (3009 - OF 14%) presents τv values (0.17) similar to those of fabrics with intermediate colours (Table 3). While textile 2004, also “dark” coloured, shows a much decreased τv as it has a lower OF (5%). Finally, it is observed that the ρv is mainly determined by the colour of the textile.
Table 3
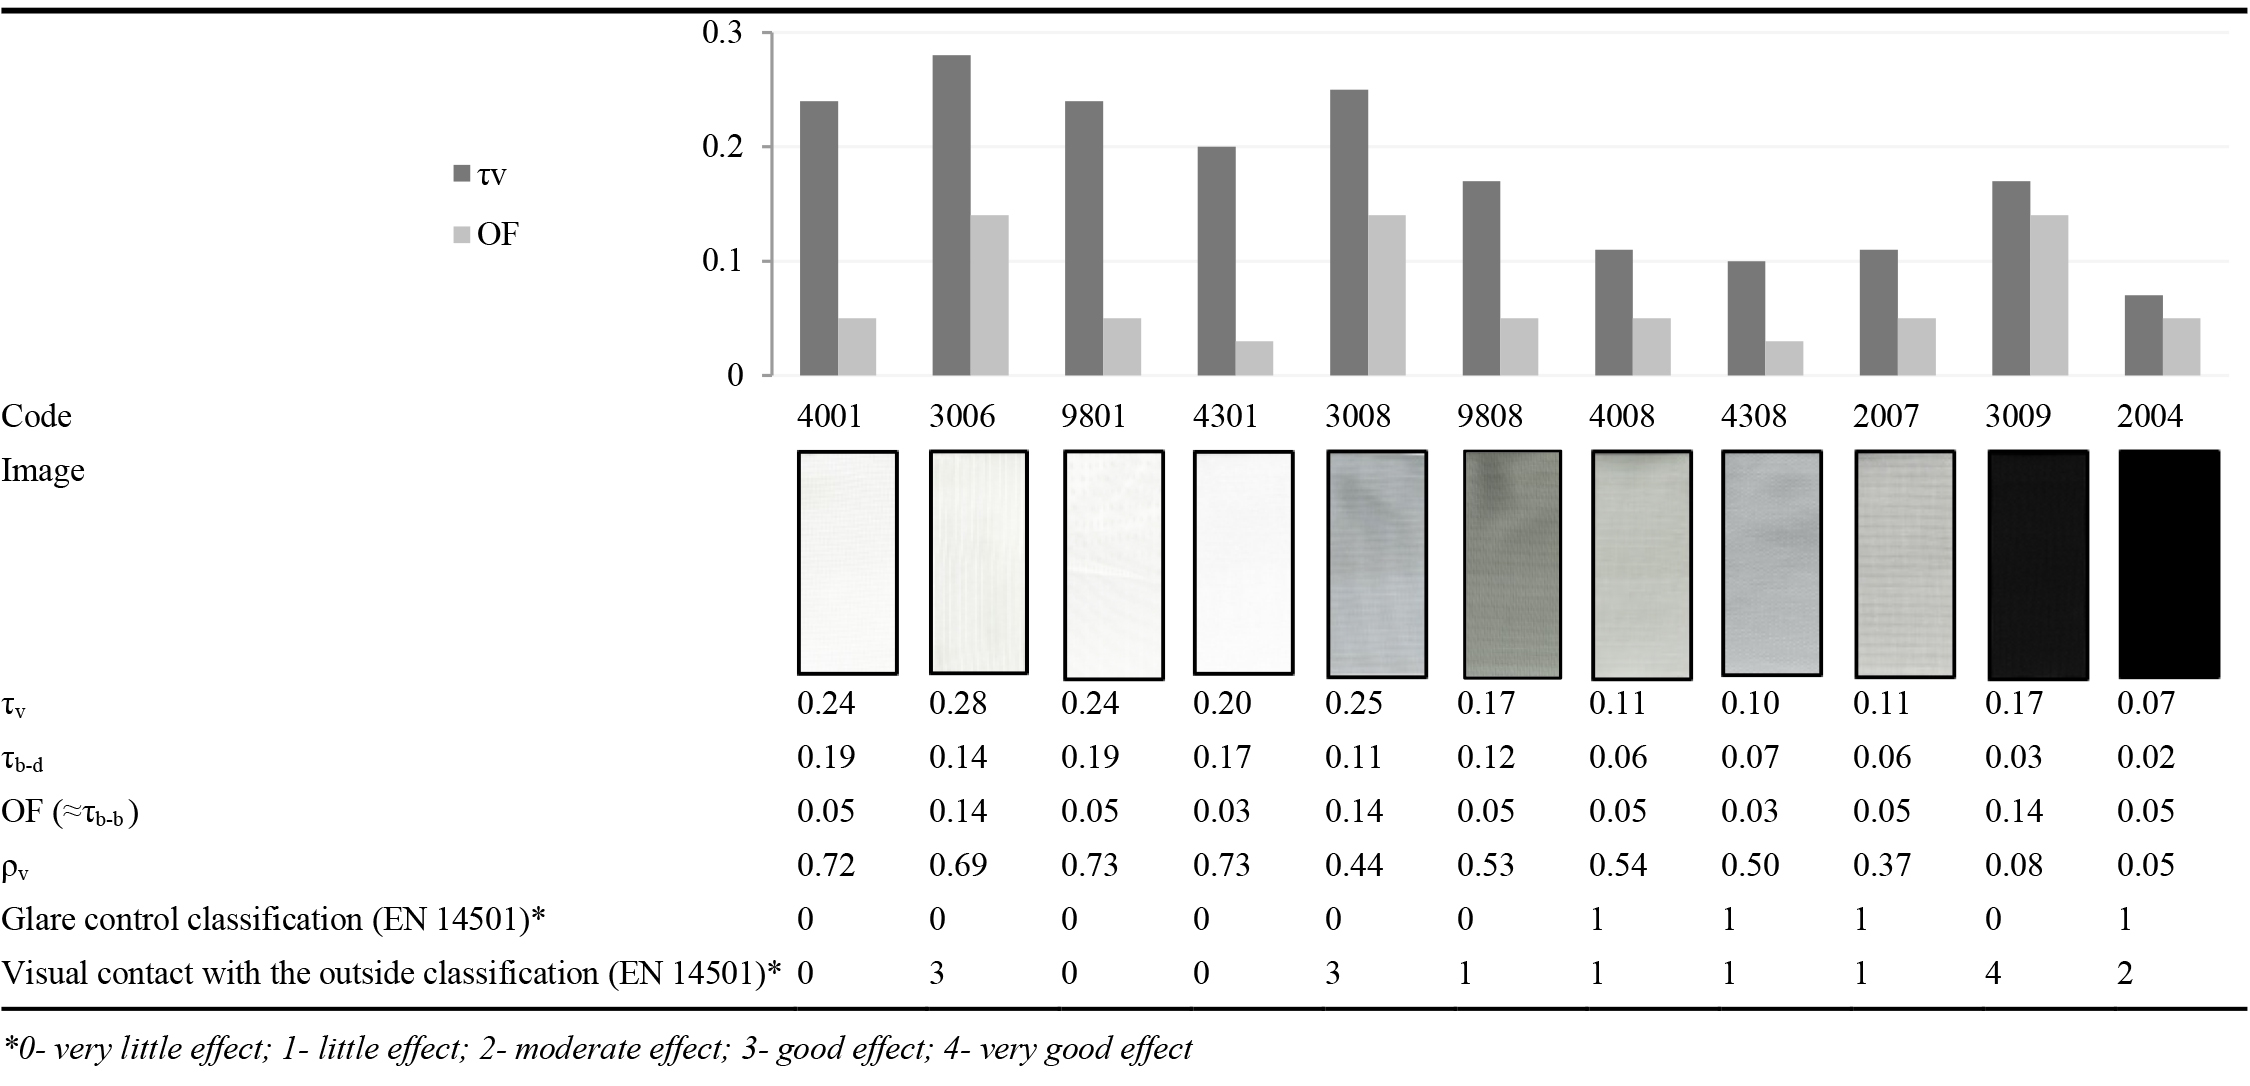
Table 3. Values of light transmittance -beam-beam transmittance τb-b / beam-diffuse transmittance τb-d - and reflectance (±0.06%) and openness factor for each of the analysed textiles. Glare control and visual contact with the outside classifications (EN 14501).
It is particularly interesting to analyse how all the studied textiles present values of beam-beam transmittance τb-b (≈ opening factor) equal or higher than 0.03 and beam-diffuse transmittance τb-d equal or higher than 0.02 (Table 3). According to these two properties, the EN 14501 standard [60] determines the glare control classification for solar protection device in which the curtain is made of textile, film or perforated opaque material. This classification follows the glare protection classes defined in the same standard: 0- very little effect; 1- little effect; 2- moderate effect; 3- good effect; 4- very good effect. Within this classification, only four of the analysed fabrics -2007, 4008, 4308 and 2004- are in category 1 and all the others fall into category 0 (Table 3), which means that they have little or very little effect on glare control. Furthermore, the EN 17037 standard [61] sets the conditions of annual radiation availability (hours of sunshine per year) and facade orientation under which textiles can be used according to their glare-prevention performance. Locations with more than 2100 annual sunshine hours are considered zone H, such is the case of the City of Mendoza. According to the standard, for this zone, fabrics “class 1” can only be used efficiently (daylight glare probability DGP ≤ 0,35 imperceptible [31]) in those spaces with small windows and where the workplace is at least 3 m away from the window, regardless of the orientation. Concerning visual contact with the outside, so as to meet a “very good” performance according to EN 14501 standard [60], a τb-b > 0.10 and a τb-d ≤ 0.04 is needed; the only tested woven shade that achieves this category is 3009 (Table 3). Fabrics 3008 and 3006 show a “good effect” (τb-b > 0.10 and a τb-d > 0.04 and ≤ 0.15).
3.2. Spectral transmittance and reflectance
Figure 1 shows the spectral transmittance curves of the “light” coloured studied textiles. By analysing the behaviour of the textiles in the category it is observed that their transmittance values increase between 390 nm (violet) and 420 nm (violet). It is interesting to observe how textiles 9801 and 3006, both made of fiberglass or mixed polyester/fiberglass, perform similarly at wavelengths above this value, while textiles 4001 and 4301, both made of polyester, exhibit different behaviour. The "light" fiberglass or mixed polyester/fiberglass fabrics reach almost their maximum transmittance between 580 nm (yellow) and 650 nm (red); next the transmittance drops between 660 nm (red) and 720 nm (red) and finally climbs back up in the near infrared range. Polyester fabrics, meanwhile, show a constant increase in transmittance values starting at 420 nm (Fig. 1).
Figure 1

Fig. 1. Spectral transmittance of “light” selected screen fabrics.
1 https://www.wintergardenz.co.nz/poly-glass.html
Figure 2 shows that textile 3008, which has a mixed composition (fiberglass and polyester) and which belongs to the "intermediate" category according to its colour, performs in a similar manner to "light" coloured textiles. As previously stated, this is due to its high OF. This fabric increases its transmittance between 390 nm (violet) and 420 nm (violet) and then it increases its transmittance values up to 25% at 630 nm (orange). After this wavelength, there is a slight decrease in transmittance values from 650 nm to 730 nm, probably due to its mixed nature -fiberglass and polyester-. Regarding the material´s composition, some greenhouse producers report that fiberglass and PVC cause a drop in transmittance at wavelengths close to 750 nm. This could explain the behaviour differences within these wavelengths, for both fiberglass and polyester textiles. As for the remaining "intermediate" textiles, the relationship between spectral transmittance performance and material composition is less clear than in the case of the analysed “light” coloured textiles. Textiles 4008, 4308 and 2007 show a constant growth in transmittance values above 410 nm (violet). Fabric 9808 shows a very slight decrease in transmittance between 640 nm to 720 nm.
Figure 2
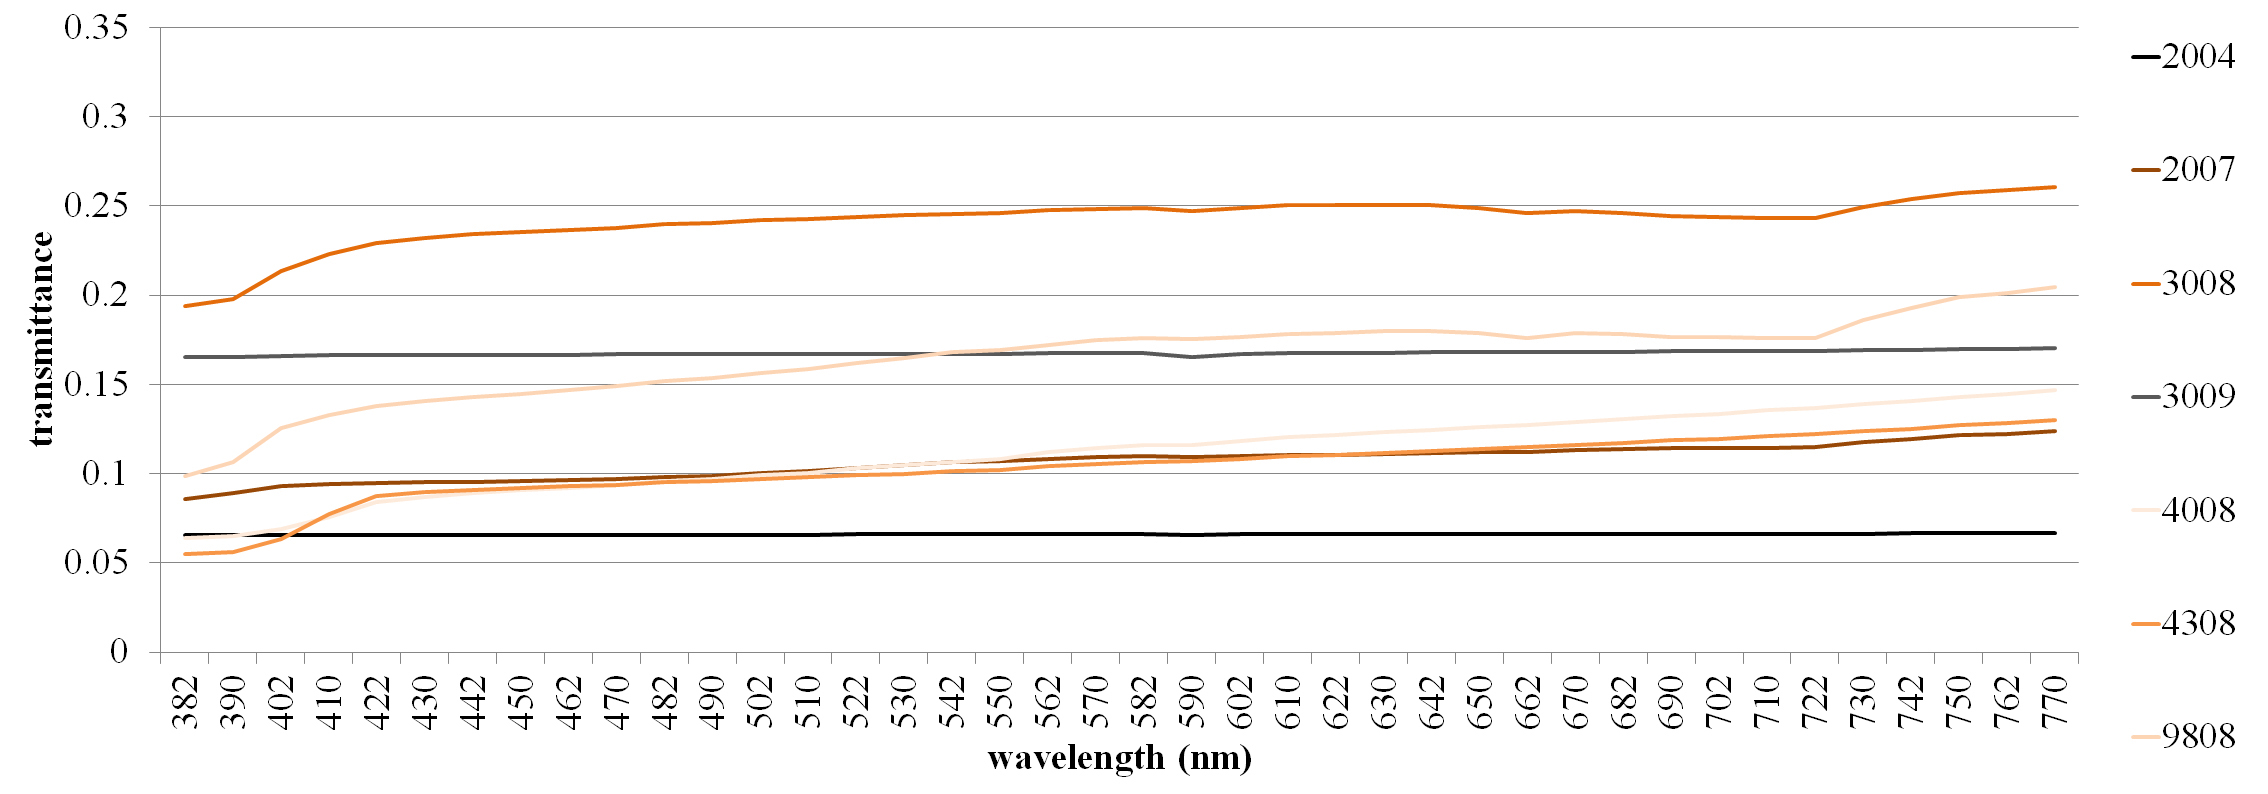
Fig. 2. Spectral transmittance of “intermediate” and “dark” selected screen fabrics.
“Dark" fabrics have a more constant response, with a lower variation in transmittance over the analysed range (378 nm - 770 nm). The standard deviation of the transmittance values is 0.0003 for fabric 2004 and 0.0012 for fabric 3009. In this group (dark colours) a change in behaviour given by the material that makes up the fabric was not detected. This is comparable to what happens with textile 2007 (τv 0.11). However, it would be interesting to analyse the performance of polyester made textiles with similar properties. In terms of the percentage of light transmittance by wavelength, it is important to note that fabric 3009 shows a similar behaviour to that of “intermediate” coloured fabrics, which, as explained above, is due to its high OF.
In Fig. 3, it can be observed that above 420 nm (violet), "light" textiles maintain spectral reflectance values between 60 and 73%, “intermediate” ones between 54 and 33% and “dark” ones between 5 and 9%. The spectral reflectance curves also show a relationship between the material that makes up the weave and the spectral behaviour of the fabric. All tested textiles, except for 2004 and 3009 -"dark"-, raise their spectral reflectance values between 380 nm (violet) and 440 nm (violet) and then maintain relatively constant reflectance values (SD min. 0.01; SD max. 0.04) in the tested wavelength range. However, when analysing the spectral reflectance data of the fabrics composed by fiberglass (Fig. 3), a decrease is observed (≈10%) in the "light" fabrics between 640 nm (red) and 750 nm (red), reaching again reflectance values close to 70% towards the near infrared range of the spectrum. Within the "intermediate" textiles, this reduction dimmed to a maximum decrease of 4%. While in “dark” textiles, the effect of the fabric material composition is not observed. Polyester fabrics show a slight (< 5%) and gradual drop in their visible spectral reflectance after reaching their highest value. The overall analysis of Fig. 3 allows us to assert that the intensity of diffuse reflection is mainly a function of colour for woven shades.
Figure 3
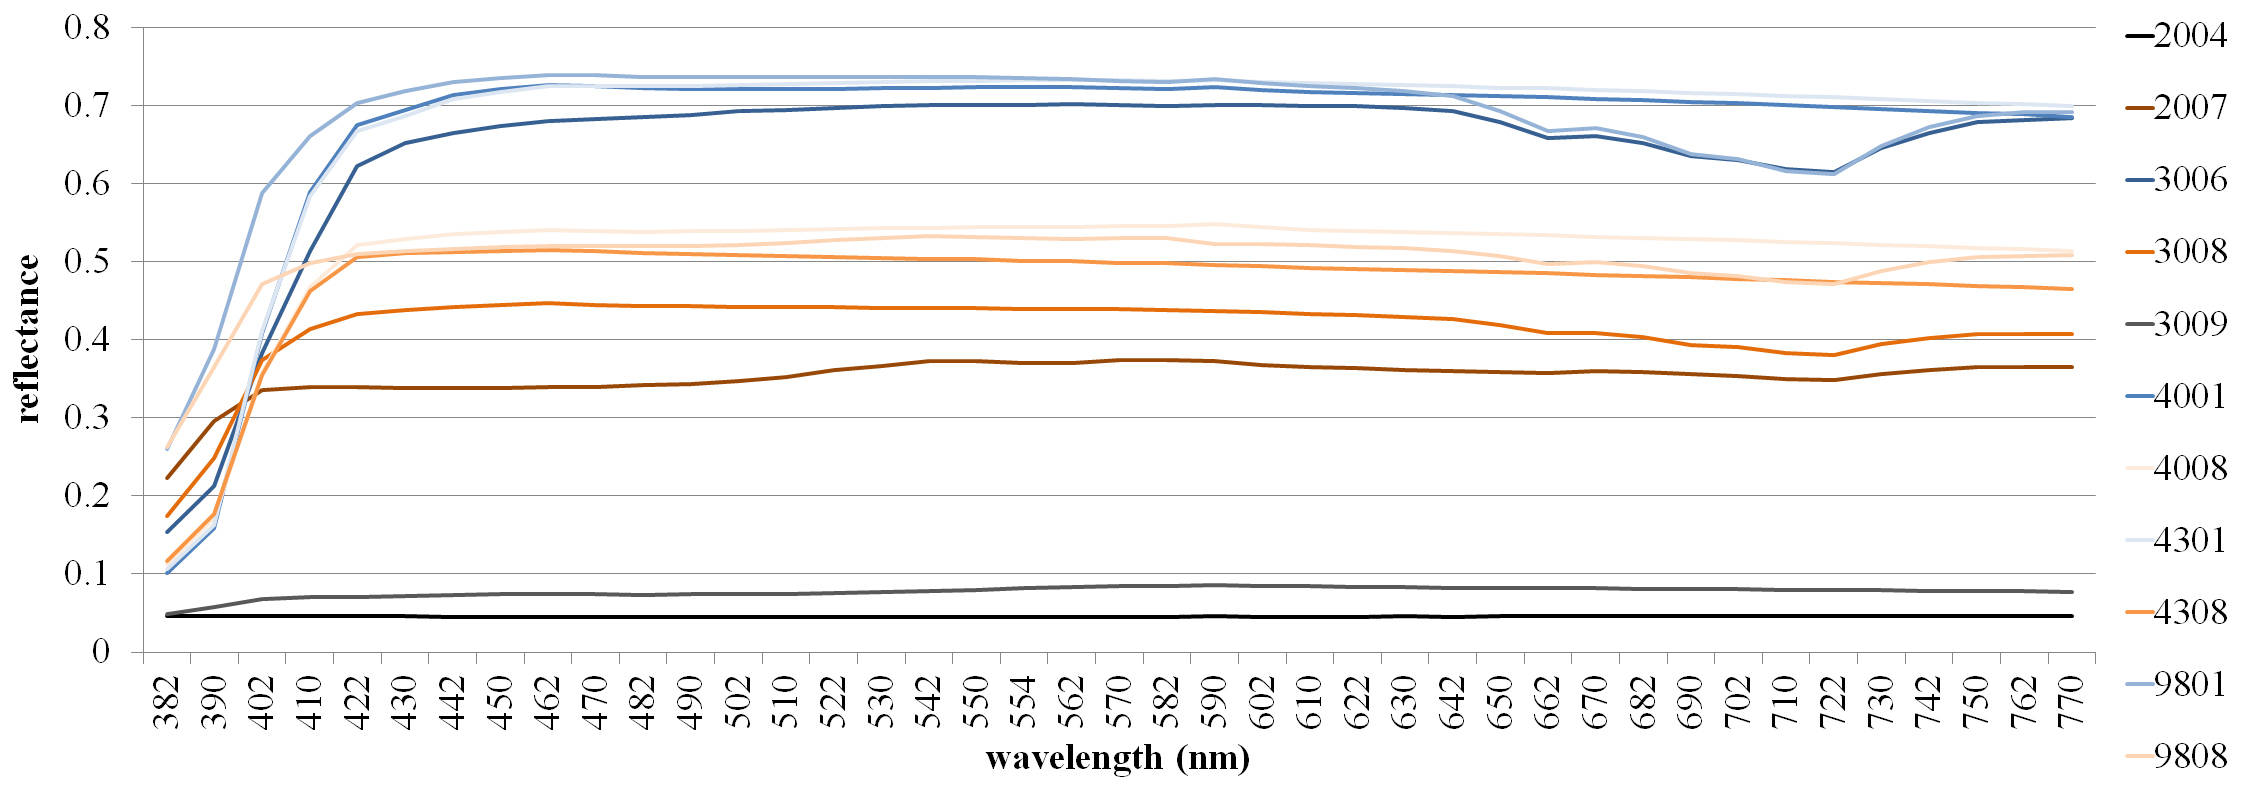
Fig. 3. Spectral reflectance of selected screen fabrics.
3.3. Chromaticity and colour rendering
The resulting parameters are shown in Table 4. CCT values range from 5210 K to 6479 K. In all the analysed cases, CCT values are lower than those of clear 6 mm glass (6554 K). The CCT values obtained exceed 4000 K, which Liang et al. [34] detects as the preferred upper limit for working conditions. However, all CCT values are located above the comfort boundary condition (higher than 3283 K) defined by Vossen et al. [33]. It is interesting to analyse how white-white textiles 4301, 4001 and 9801, white-grey textiles 4008 and 4308, and grey-grey textile 9808 fall within the CCT range that, according to Dikel et al. [36], is judged as similar and preferred (3728 K - 5769 K) when compared to more extreme and higher (6507 K) or lower (2855 K) values. Textile 3006 ranks below, yet close to the upper limit of the CCT value established by Dikel et al. [36]. The screen fabrics outside this range (3008, 3009, 2007 and 2004) share a number of optical properties. It is observed that these textiles have ρv values below 45%. This entails a reduction of the beam-diffuse transmittance τb-d (intercepted radiation), which further increases the effect of the undisturbed transmitted portion of the illuminant. This is visible in Fig. 4 where the points (chromatic coordinates u'v') corresponding to the illuminant D65 and textiles 3009 and 2004 overlap, with minor differences in their location. Moreover, the 300X series has the highest OF, within the set of analysed textiles, resulting in an increased beam-beam transmittance τb-b (undisturbed transmitted portion) which also leads to an increased impact of the spectral distribution of the D65 illuminant (CCT 6504 K and Duv 0.0032).
Figure 4
![u´v´ chromatic coordinate’s for the studied woven shades, CA-locus Smet [38], Planckian locus.](figures/9-1-4.jpg)
Fig. 4. u´v´ chromatic coordinate’s for the studied woven shades, CA-locus Smet [38], Planckian locus.
Table 4
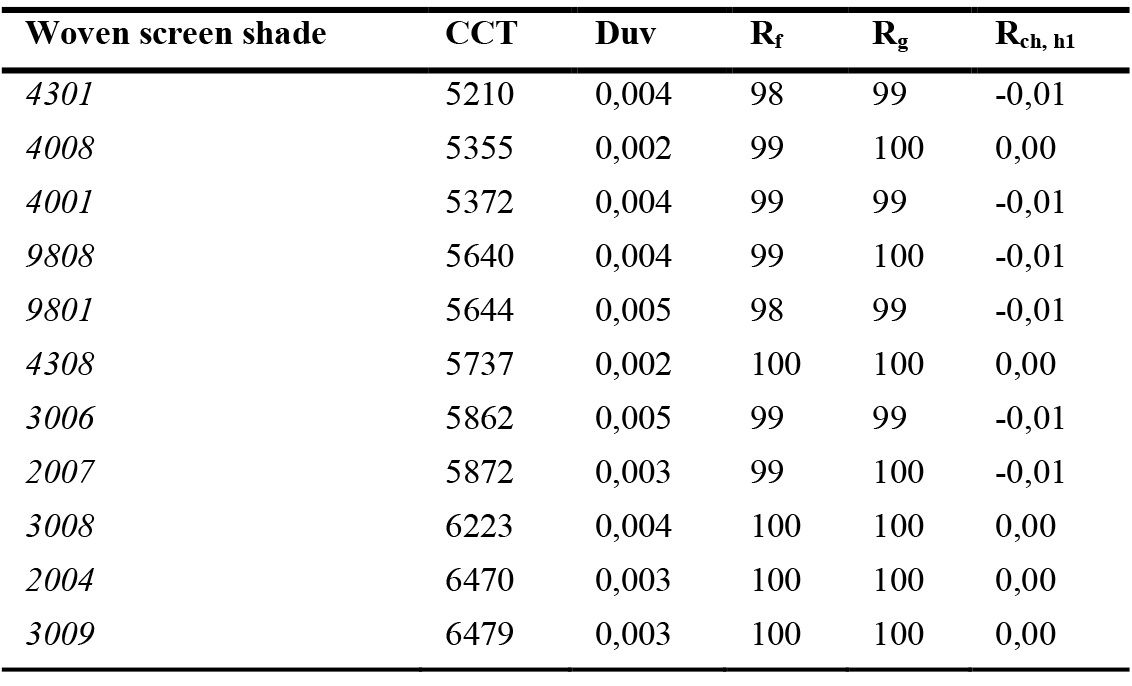
Table 4. Chromaticity and colour rendering parameters calculated for each of the analysed woven screen fabrics: CCT, Duv, Rf, Rg, Rch, h1.
The results presented in Table 4 show that the light transmitted through the studied woven screen shades has positive Duv values, and therefore their u'v' colour coordinates are above the Planckian locus or black body locus (Fig. 4). This indicates that the light transmitted through the fabrics has a yellowish/greenish colour shift. This would be unfavorable in terms of color perception according to studies conducted by Dikel et al. [36], Ohno et al. [37] and Wang et al. [62] in which a preference is identified towards environments where lights have Duv values slightly below the Planckian locus for CCT values between 2700 K and 6500 K. However, if we consider the studies developed by Smet et al. [38] and Rea and Freyssinier [63], the Duv values obtained for the range of analysed CCT are close to the neutral perception of chromaticity. Particularly, Rea and Freyssinier [63] state that between 4000 K and 6500 K, the perception of untinted white illumination is associated with Duv values above the Plackian locus. This agrees with the results obtained by Smet et al. [38], who also focus on perceived neutrality of light and develop a locus based on chromatic adaptation for which Duv neutrality values are located above the black body locus for CCT values between 4500 K and 6500 K. Figure 4 shows that the chromaticity values calculated for textiles are very close to those of the CA-locus developed by Smet et al. [38].
The Rg versus Rf plot (Fig. 5) shows that Rf values approach 100 and therefore all colour shifts compared to the reference illuminant are low. Also, the Rg values range between 99 and 100, indicating that, on average, woven shades do not increase or decrease chroma when compared to the reference illuminant. This is shown in the analysis of the local chroma shift (Rcs,hj) - average shifts in each of the 16 hue bins defined in TM-30-20 for each of the woven shades - (Table 5 and Fig. 6). Table 5 shows that the value of local chroma shift for each of the 16 hue bins is at maximum 1% and minimum -1%. Considering the values of Rf, Rg and Rcs,h1 obtained for each of the woven screen fabrics and according to the colour preference specification criteria developed by Royer et al. [39], all the fabrics correspond to Tier A (Rf ≥78, Rg≥95, -1%≤Rch,h1≤15%). This indicates that the light passing through the fabrics presents excellent colour rendition.
Figure 5
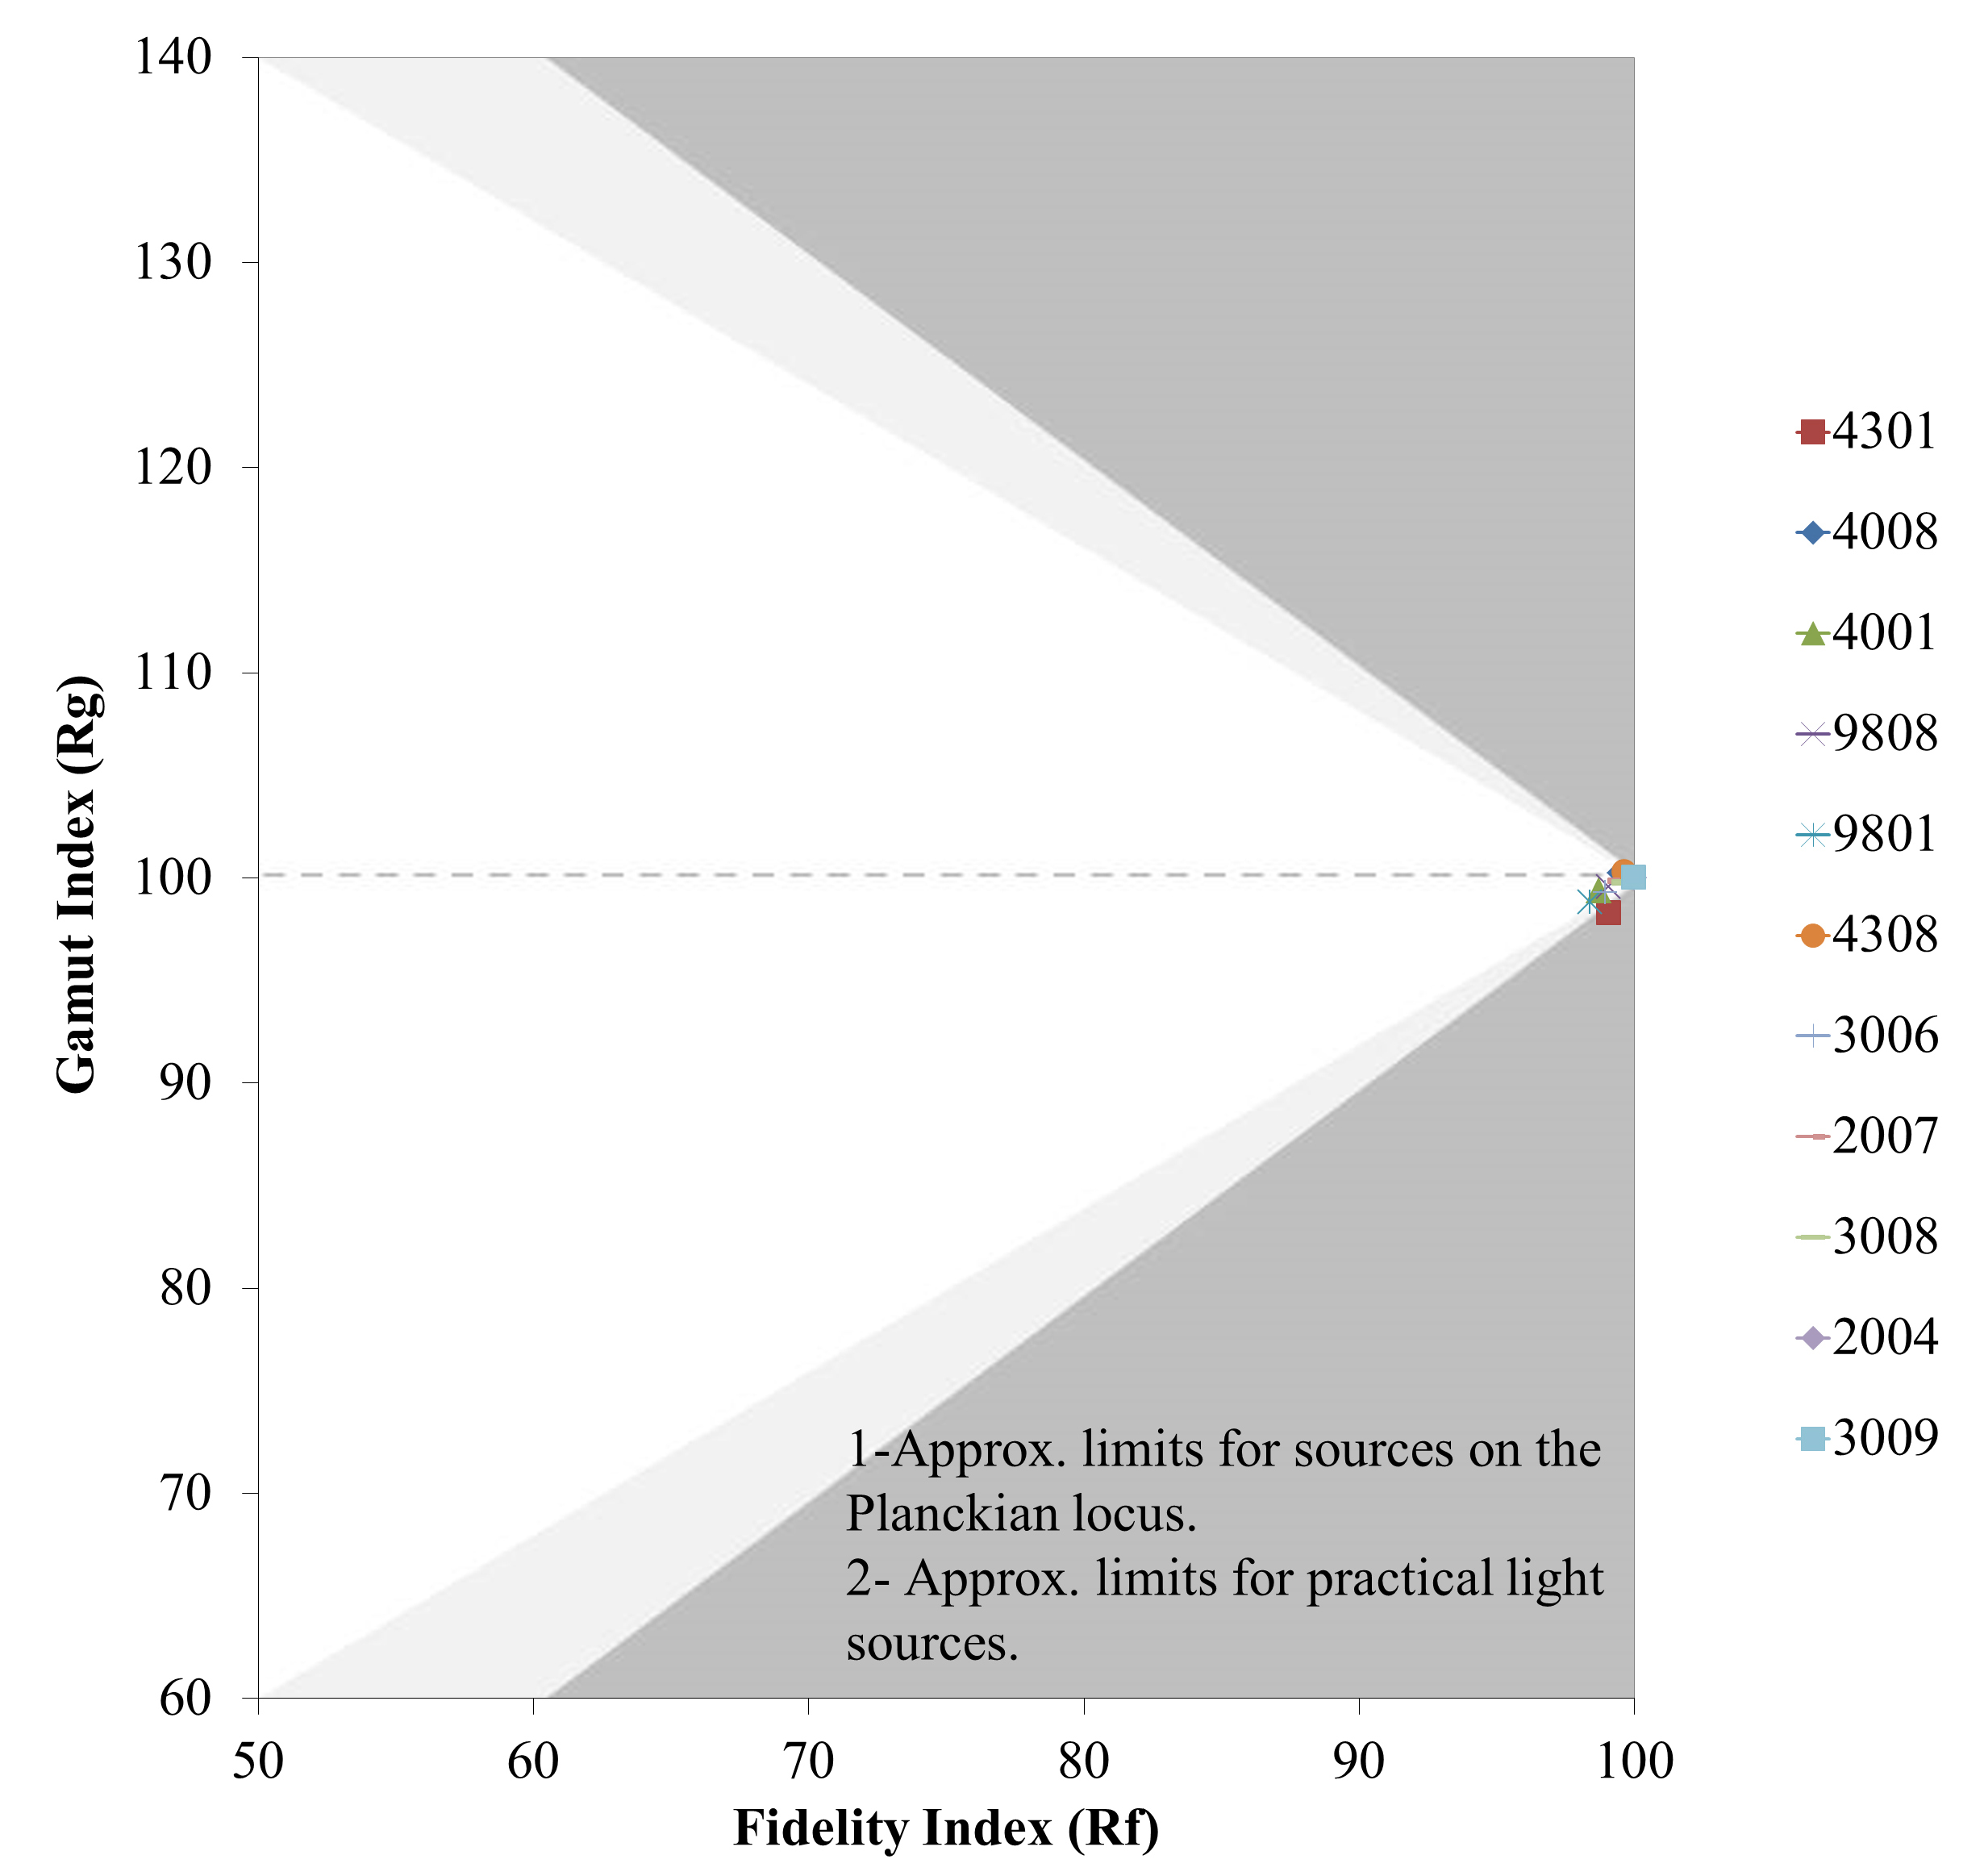
Fig. 5. Rg versus Rf plot.
Figure 6
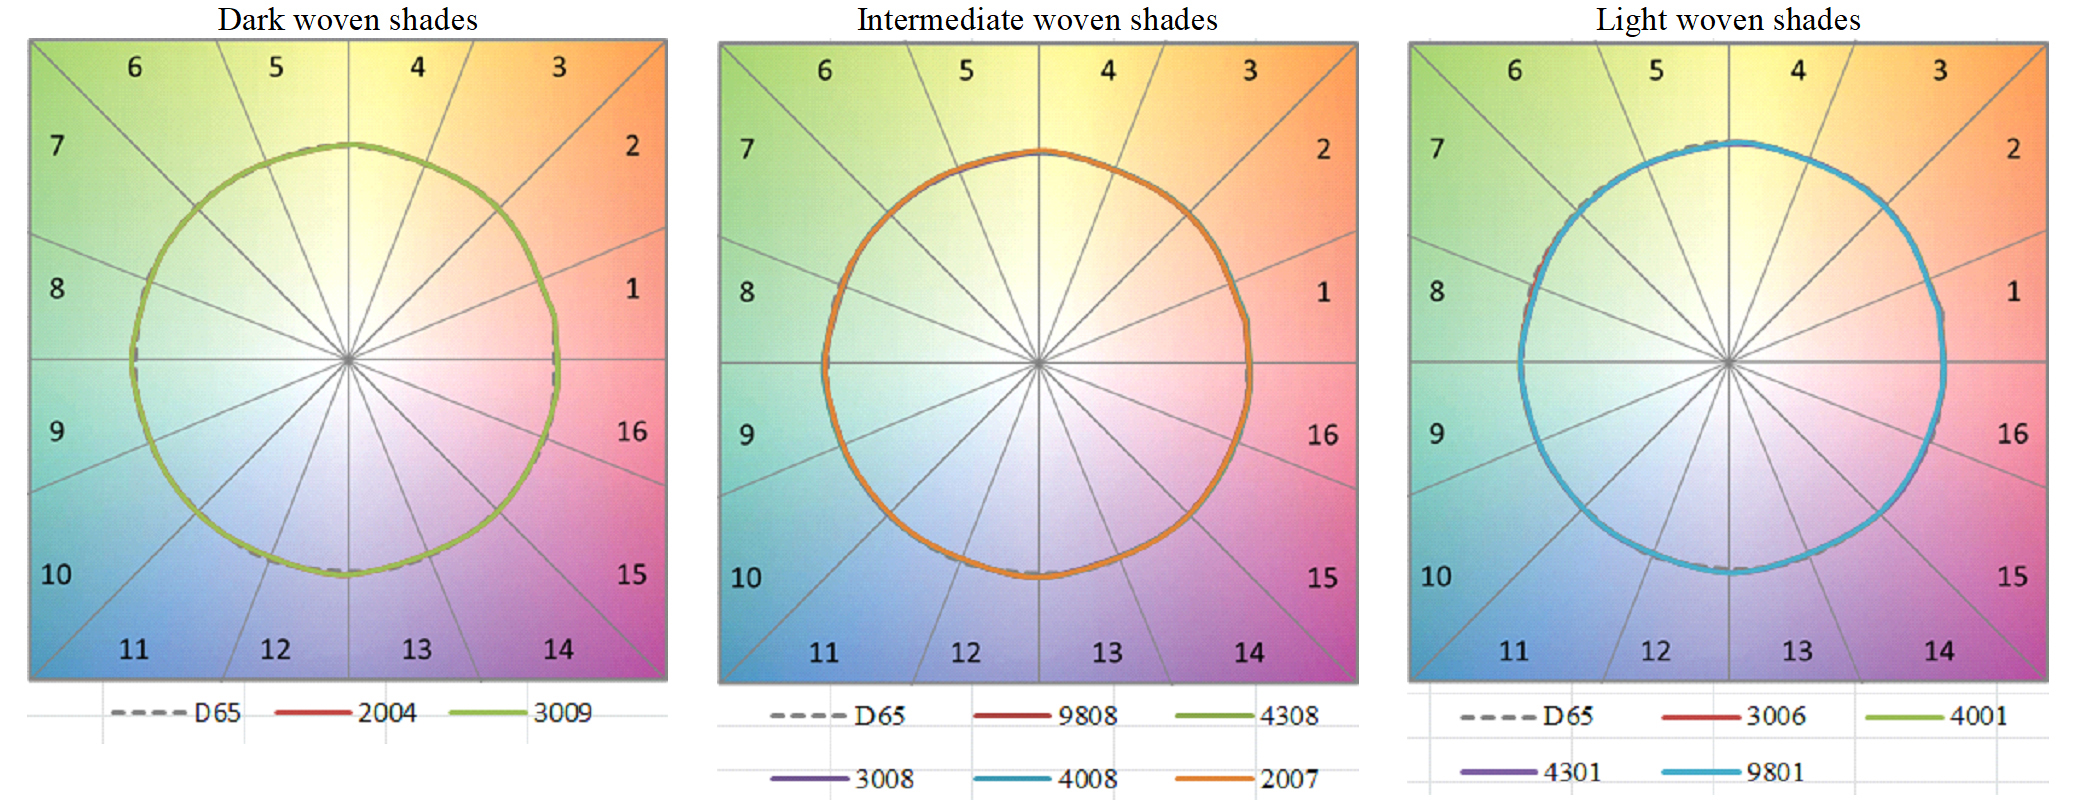
Fig. 6. Colour vector graphics for the dark, intermediate and light woven screen shades studied.
Table 5
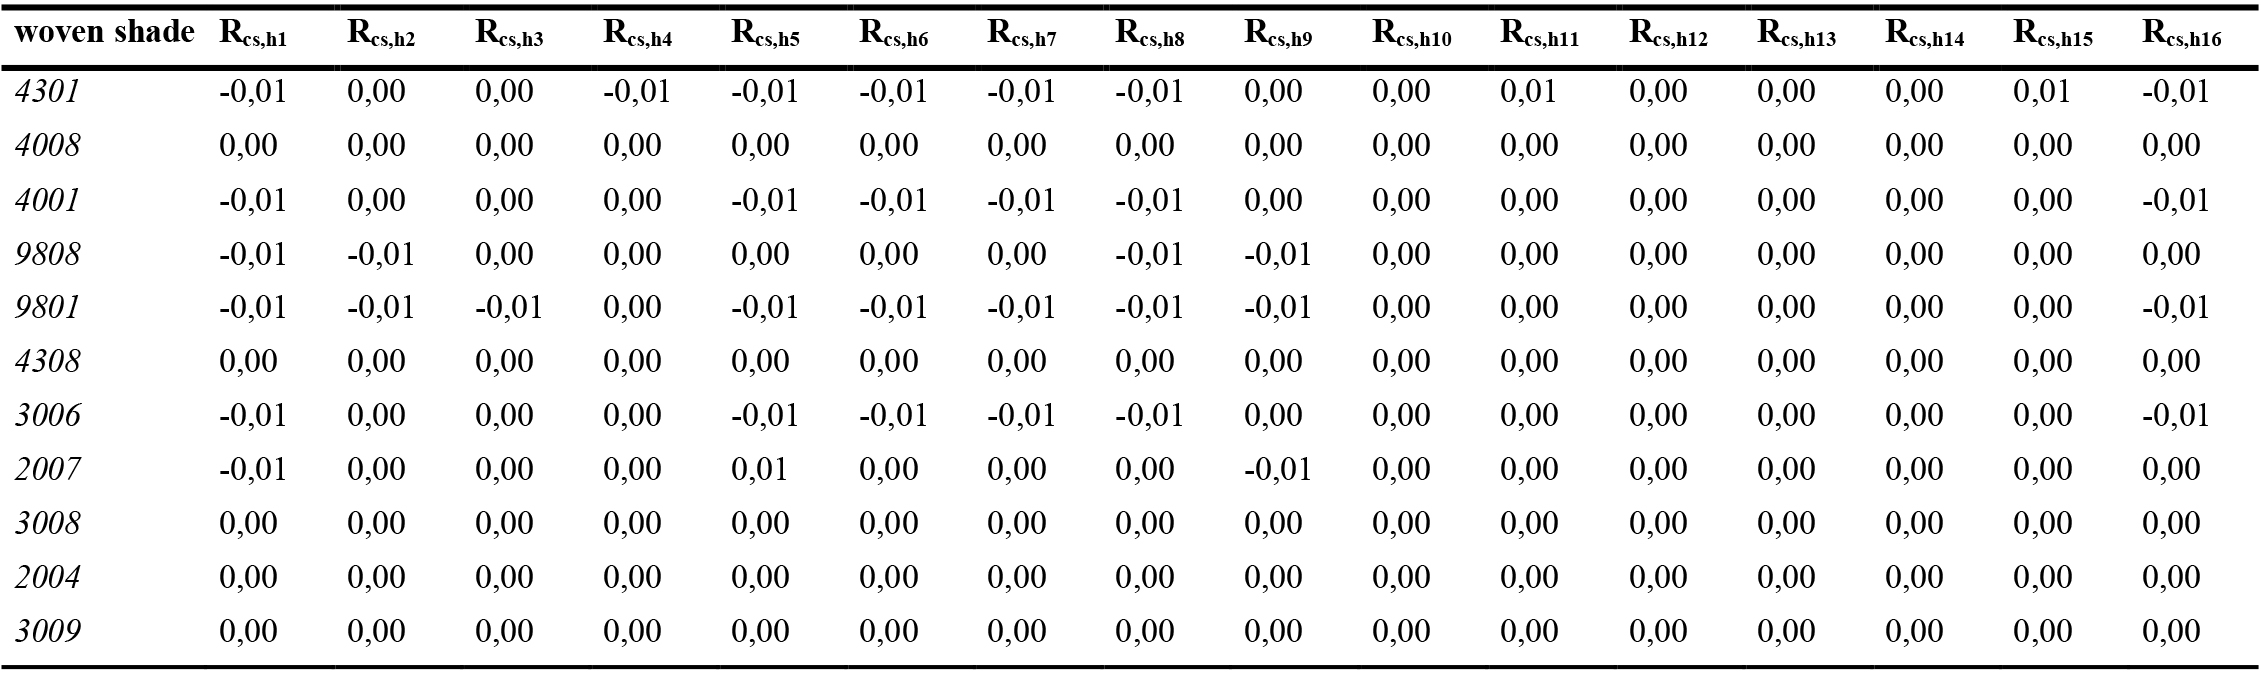
Table 5. Local chroma shift (Rcs,hj )for the eleven studied woven shades.
4. Discussion
The determination of a set of physical and optical fabric properties (τv, ρv, OF, spectral reflectance, spectral transmittance) enables further analysis on energy and visual comfort performance of the roller screen shading systems. On the one hand, considering properties such as τv makes it possible to understand issues related to energy consumption, such as which textile admits the most daylight into the space. It also enables the analysis of issues linked to indoor visual comfort. The τv and the fabric's openness factor (≈ direct transmittance), among other environmental aspects, are used in EN 14501 [60] and EN 17037 [61] standards to assess fabric performance in terms of glare and vision outside. On the other hand, analysing spectral data such as fabric spectral transmittance and reflectance shows that the material that fabrics are made of - polyester or fiberglass - has an impact on its spectral transmittance and reflectance. This underlines the importance of examining the optical behaviour of roller curtains from a spectral point of view. However, concerning the tested fabrics, the difference in the spectral behaviour according to the polymer used in the weave is not reported in the chromaticity and colour rendering metrics. This is likely because all the studied woven fabrics are coated with the same material (PVC); the surface coating mainly determines the spectral behaviour in the visible range.
Results obtained regarding the chromaticity and colour rendering qualities of daylight transmitted through the studied woven shades highlight the following issues:
- ρv and OF were found to impact CCT values. According to the results of this study, fabrics with ρv under 45% tend to have higher CCT values (range 5872 K - 6479 K) and therefore would provide "cooler" visual environments. Those with higher light reflectance, on the other hand, have lower CCT values (range 5210 K - 5737 K) providing "warmer" visual environments instead. It is also observed that those textiles with higher OF values (14%) have higher CCT values than those with the same colour but lower OF values.
- Regarding the Duv values of the light transmitted through the fabrics, it can be observed that they are located above the black body curve since they have positive values. This, as previously exposed, is favourable in terms of perceived light colour neutrality according to some studies [38,63] but unfavourable according to others [36,37,62].
- Regarding colour rendering metrics, the light transmitted through all the studied woven shades shows high values of Rf, values close to 100 for Rg and very low Rcs,h1 values and therefore excellent colour rendition. These results are in line with David et al. [22] concerning the fact that an essential property of human colour perception is that it supplies stable information about the colour of objects, independently of the object’s illumination’s chromaticity and intensity.
Given the enormous variability of the different types of glazing available on the market with respect to chromaticity and the colour rendering capacity of transmitted light [24], it is interesting to highlight how the analysed set of the most commonly used woven shade fabrics at local level-white, grey and black, with OF between 3 and 14-, do not have a significant impact on the colour rendering capacity of transmitted daylight. The results of this study regarding the set of analysed fabrics show that the focus should be placed on the spectral transmittance of the glazing that will be applied in the window system, leaving the selection of woven shades to other parameters -visual, economic and/or aesthetic-.
When analysing the results of this study, it is key to considerer that humans exhibit very good colour constancy under natural viewing conditions [64]. Fotios [65] states that colour adaptation is the regulation in the sensitivity of the visual system in response to changes in the SPD of the prevailing illumination, thereby guaranteeing that colour vision can be used reliably in different lighting conditions. Although a shift in the spectral composition of the source results in a modification of the SPD of the light reaching the retina, the human visual system has a colour balancing process that can compensate for these changes [65].
It is important to consider that the international standards for chromaticity and colour rendering analysis [28,59,66] developed so far do not address the dynamic nature of the daylight source. Time of day, season, and geographical location can modify the SPD of the sunlight hitting a window. Also, the strong angular dependence of the light transmitted by roller woven shades [67], determined by the cut-off-angle of the shades, fixes the ratio of beam-beam transmittance τb-b and the beam-diffuse transmittance τb-d entering the space, which may also influence the spectral distribution of the transmitted light. However, in the absence of specific standards for daylighting, this work and other works [21,24,53,54] published in recognized international journals in the field, use the mentioned standards to analyse the behaviour of different window components concerning these parameters. It is therefore essential to further the analysis with measurements in test rooms under daylighting conditions which include the effect of the position of the sun on the transmitted light and its consequent impact on chromaticity and colour rendering. At present, the authors of this work are working on this type of analysis. Determining whether the effect of the sun's position in the sky changes the rank of shading and glazing systems regarding these properties would establish whether there is a need to develop specific standards for evaluating window components.
Finally, it is essential to analyse the challenge proposed by the results of the study regarding light chromaticity, colour rendition, and glare and the energy-saving possibilities by the natural lighting. Regarding the color of the transmitted light, all the scenarios are in an acceptable range and, in terms of the ability to render the colors of the objects, the transmitted light has very good properties. From the perspective of daylight availability, woven shades with higher light transmittance are the best option –light coloured fabrics-, as they favour the entrance of solar light. However, when we analyse some of the studied parameters, which determine the visual comfort and the quality of the natural illumination –outside view and glare – according to standard EN 14501 [60] (Table 3), the darkest textiles with reduced transmittance, appear as the most favourable in most cases. This poses an enormous challenge for the design of window systems: achieve energy savings -reduce the use of artificial light- without neglecting the parameters that determine visual comfort. This could suggest that it is necessary to think about a window design with different zones. Some sectors and strategies favour energy saving. And others manage the entry of light in terms of colour quality and glare, generating spaces with visual comfort. Reinhart et al. [68] analysed different façade layouts and conclude that the best setting in terms of useful daylight illuminance is one that has an upper section with an overhang and a lightshelf and in the lower section blinds; as the lightshelf raises the useful illuminance in the back sector of the indoor space while the blinds limit the entry of direct solar radiation. Aste et al. [69] studied the performance -CCT, illuminance level and CRI- of a window with an upper part made up of a lightshelf and a yellow luminescent solar concentrator (used as glazing). As shown in their study the spectral properties of the glazing used in the upper part of the window should also be carefully considered in terms of CCT and CRI. In this regard, the splitting up of the window into sectors can also be thought of as a strategy for managing the CCT of transmitted daylight, as proposed by Mardaljevic et al. [6].
5. Conclusions
According to the aforementioned, it is possible to conclude that the combined analysis of optical properties, spectral data and its impact on parameters that determine the quality of lighting in an interior space enables an understanding of a fabric's performance, which results in the possibility of taking appropriate decisions when selecting a fabric, according to the purpose of the room (the task to be performed), the users' preferences and the energy-saving potential. The results of this paper contribute to the design of window systems by providing information with respect to the impact that roller screen shades have on the colour qualities of transmitted daylight. It seeks to move forward in the introduction of woven shades selection criteria that describe their performance in terms of colour appearance and colour rendering properties, focusing on the lighting demands of the tasks that will be performed in the shaded space.
In the future, it is necessary to conduct studies on user preference regarding chromaticity and the ability of daylight to reproduce the colours in interior spaces with woven shades or other solar protection systems in their openings. These studies will make it possible to verify whether the criteria developed for artificial lighting conditions require adjustments for natural lighting conditions (dynamic light source).
Acknowledgement
This work was supported by the ANPCYT [grant numbers: PICT 2017-1088; PICT 2016-1487; PICT 2017-3248; PICT 2018-03269; PICT 2018-02080; PICT 2019-04356]. The funding sources have no role in this research other than financial support.
The authors wish to thank the DINO CONTE Company for providing the roller curtain samples for this study.
Contributions
All authors were involved in the writing of the manuscript and in the development of graphic material. Dr. Villalba participated in the selection and preparation of samples, bibliographic analysis of background and standards, data processing, and analysis and discussion of results. Dr. Correa and Dr. Yamín participated in the bibliographic analysis of background and standards, data processing, and analysis and discussion of results. Dr. Pattini revised the quality of the manuscript, based on her more than 30 years of experience in daylighting.
Declaration of competing interest
The author(s) declares no potential conflicts of interest with respect to the research, authorship, and/or publication of this article.
References
- M. Bodart, R. de Peñaranda, A. Deneyer, G. Flamant, Photometry and colorimetry characterisation of materials in daylighting evaluation tools, Building and Environment 43 (2008) 2046–2058. https://doi.org/10.1016/j.buildenv.2007.12.006
- D.H.W. Li, A review of daylight illuminance determinations and energy implications, Applied Energy 87 (2010) 2109–2118. https://doi.org/10.1016/j.apenergy.2010.03.004
- N. Gentile, W. Osterhaus, S. Altomonte, M. Alvarez García, V. Garcia-Hansen, C. Amorim Naves David, B. Obradovic, Energy saving potential for integrated daylighting and electric lighting design via user-driven solutions: A literature review, in: Proc. 29th CIE Sess., 2019, pp. 205–215, Washington DC. https://doi.org/10.25039/x46.2019.op32
- A.K. Athienitis, A. Tzempelikos, A methodology for simulation of daylight room illuminance distribution and light dimming for a room with a controlled shading device, Solar Energy 72 (2002) 271–281. https://doi.org/10.1016/s0038-092x(02)00016-6
- R.P. Leslie, Capturing the daylight dividend in buildings: Why and how?, Building and Environment 38 (2003) 381–385. https://doi.org/10.1016/s0360-1323(02)00118-x
- J. Mardaljevic, R. Kelly Waskett, B. Painter, Neutral daylight illumination with variable transmission glass: Theory and validation, Lighting Research and Technology 48 (2016) 267–285. https://doi.org/10.1177/1477153515620339
- H. Köster, Dynamic daylighting architecture: basics, systems, projects, Springer Science & Business Media, Luxemburgo, 2004.
- N. V. Baker, A. Fanchiotti, K. Steemers, Daylighting in architecture: a European reference book, first ed., Routledge, London, 1993.
- International Energy Agency (IEA), Solar Energy: Maping the road ahead, 20 (2019) 1–82. zzzzz
- I.L. Wong, A review of daylighting design and implementation in buildings, Renewable & Sustainable Energy Reviews 74 (2017) 959–968. https://doi.org/10.1016/j.rser.2017.03.061
- A. Tzempelikos, H. Shen, Comparative control strategies for roller shades with respect to daylighting and energy performance, Building and Environment 67 (2013) 179–192. https://doi.org/10.1016/j.buildenv.2013.05.016
- J. Yao, An investigation into the impact of movable solar shades on energy, indoor thermal and visual comfort improvements, Building and Environment 71 (2014) 24–32. https://doi.org/10.1016/j.buildenv.2013.09.011
- R. Singh, I.J. Lazarus, V.V.N. Kishore, Effect of internal woven roller shade and glazing on the energy and daylighting performances of an office building in the cold climate of Shillong, Applied Energy 159 (2015) 317–333. https://doi.org/10.1016/j.apenergy.2015.09.009
- I. Konstantzos, A. Tzempelikos, Selecting roller shades properties based on glare mitigation, energy performance and connection to the outdoors, in: Proceedings of BSA2017: Building Simulation Applications Conference, 2017, pp. 539–546, Bolzano.
- A. Tzempelikos, Y.C. Chan, Estimating detailed optical properties of window shades from basic available data and modeling implications on daylighting and visual comfort, Energy and Building 126 (2016) 396–407. https://doi.org/10.1016/j.enbuild.2016.05.038
- Y.C. Chan, A. Tzempelikos, I. Konstantzos, A systematic method for selecting roller shade properties for glare protection, Energy and Building 92 (2015) 81–94. https://doi.org/10.1016/j.enbuild.2015.01.057
- I. Konstantzos, Y.C. Chan, J.C. Seibold, A. Tzempelikos, R.W. Proctor, J.B. Protzman, View clarity index: A new metric to evaluate clarity of view through window shades, Building and Environment 90 (2015) 206–214. https://doi.org/10.1016/j.buildenv.2015.04.005
- J.C. Jonsson, E.S. Lee, M. Rubin, Light-scattering properties of a woven shade-screen material used for daylighting and solar heat-gain control, in: Proceedings of SPIE 7065, Reflection, Scatt. Diffr. from Surfaces, 2008, San Diego, California. https://doi.org/10.1117/12.795575
- Y. Chan, A. Tzempelikos, B. Protzman, Impact of Solar Optical Properties of Roller Shades on Energy, Daylighting and Comfort, in: ASHRAE Annual Conference, 2015, pp. 1–9, Atlanta.
- K. Houser, M. Mossman, K. Smet, L. Whitehead, Tutorial: Color Rendering and Its Applications in Lighting, LEUKOS - Journal of the Illuminating Engineering Society 12 (2016) 7–26. https://doi.org/10.1080/15502724.2014.989802
- A. Ghosh, P. Selvaraj, S. Sundaram, T.K. Mallick, The colour rendering index and correlated colour temperature of dye-sensitized solar cell for adaptive glazing application, Solar Energy 163 (2018) 537–544. https://doi.org/10.1016/j.solener.2018.02.021
- A. David, K.A.G. Smet, L. Whitehead, Methods for Assessing Quantity and Quality of Illumination, Annual Review of Vision Science 5 (2019) 479–502. https://doi.org/10.1146/annurev-vision-091718-015018
- N. Aste, M. Buzzetti, C. Del Pero, R. Fusco, D. Testa, F. Leonforte, Visual Performance of Yellow, Orange and Red LSCs Integrated in a Smart Window, Energy Procedia 105 (2017) 967–972. https://doi.org/10.1016/j.egypro.2017.03.427
- R. Dangol, T. Kruisselbrink, A. Rosemann, Effect of window glazing on colour quality of transmitted daylight, Journal of Daylighting 4 (2017) 37–47.
- C. Chain, D. Dumortier, M. Fontoynont, Consideration of daylight’s colour, Energy and Building 33 (2001) 193–198. https://doi.org/10.1016/s0378-7788(00)00081-5
- C. Li, G. Cui, M. Melgosa, X. Ruan, Y. Zhang, L. Ma, K. Xiao, M.R. Luo, Accurate method for computing correlated color temperature, Optics express 24(13) (2016) 14066-14078. https://doi.org/10.1364/oe.24.014066
- H. Yaguchi, A. David, T. Fuchida, K. Hashimoto, G. Heidel, W. Jordan, S. Jost-Boissard, S. Kobayashi, T. Kotani, R. Luo, Y. Mizokami, Y. Ohno, P. Pardo, K. Richter, K. Smet, K. Teunissen, A. Tsukitani, M. Wei, L. Whitehead, T. Yano, CIE 2017 Colour Fidelity Index for accurate scientific use, Commision Internationale de L’Eclairage (CIE), Vienna, 2017.
- American National Standards Institution (ANSI) / Illuminating Engineering Society (IES), ANSI/IES Method for Evaluating Light Source Color Rendition, ANSI/IES TM-30-20, ANSI/IES, Washington D. C. - New York, 2020. https://doi.org/10.1080/15502724.2020.1860771
- Y. Ohno, Practical Use and Calculation of CCT and Duv, LEUKOS - Journal of the Illuminating Engineering Society 10 (2014) 47–55. https://doi.org/10.1080/15502724.2014.839020
- I. Konstantzos, S.A. Sadeghi, M. Kim, J. Xiong, A. Tzempelikos, The effect of lighting environment on task performance in buildings – A review, Energy and Building 226 (2020) 110394. https://doi.org/10.1016/j.enbuild.2020.110394
- N. Pineault, M.C. Dubois, Effect of window glazing type on daylight quality: Scale model study of a living room under natural sky, LEUKOS - Journal of the Illuminating Engineering Society 5 (2008) 83–99. https://doi.org/10.1582/leukos.2008.05.02.001
- H. Arsenault, M. Hébert, M.C. Dubois, Effects of glazing colour type on perception of daylight quality, arousal, and switch-on patterns of electric light in office rooms, Building and Environment 56 (2012) 223–231. https://doi.org/10.1016/j.buildenv.2012.02.032
- F.M. Vossen, M.P.J. Aarts, M.G. Debije, Visual performance of red luminescent solar concentrating windows in an office environment, Energy and Building 113 (2016) 123–132. https://doi.org/10.1016/j.enbuild.2015.12.022
- R. Liang, M. Kent, R. Wilson, Y. Wu, Development of experimental methods for quantifying the human response to chromatic glazing, Building and Environment 147 (2019) 199–210. https://doi.org/10.1016/j.buildenv.2018.09.044
- G. Chinazzo, J. Wienold, M. Andersen, Effect of Indoor Temperature and Glazing with Saturated Color on Visual Perception of Daylight, LEUKOS - Journal of the Illuminating Engineering Society 17 (2021) 183–204. https://doi.org/10.1080/15502724.2020.1726182
- E.E. Dikel, G.J. Burns, J.A. Veitch, S. Mancini, G.R. Newsham, Preferred Spectral Power Distributions of Color-Tunable LED Lighting, LEUKOS - Journal of the Illuminating Engineering Society 10 (2014) 101–115. https://doi.org/10.1080/15502724.2013.855614
- Y. Ohno, S. Oh, Vision Experiment on White Light Chromaticity for Lighting, in: CIE/USA-CNC/CIE Bienn. Jt. Meet 2013, pp. 175–184.
- Y. Wang, M. Wei, Preference among light sources with different Duv but similar colour rendition: A pilot study, Lighting Research and Technology 50 (2018) 1013–1023. https://doi.org/10.1177/1477153517712552
- M.S. Rea, J.P. Freyssinier, White lighting, Color Research and Application 38 (2013) 82–92. https://doi.org/10.1002/col.20738
- K.A.G. Smet, Two Neutral White Illumination Loci Based on Unique White Rating and Degree of Chromatic Adaptation, LEUKOS - Journal of the Illuminating Engineering Society 14 (2018) 55–67. https://doi.org/10.1080/15502724.2017.1385400
- M.P. Royer, M. Wei, A. Wilkerson, S. Safranek, Experimental validation of colour rendition specification criteria based on ANSI/IES TM-30-18, Lighting Research and Technology 52 (2020) 323–349. https://doi.org/10.1177/1477153519857625
- Q. Wang, H. Xu, F. Zhang, Z. Wang, Influence of color temperature on comfort and preference for LED indoor lighting, Optik 129 (2017) 21–29. https://doi.org/10.1016/j.ijleo.2016.10.049
- M.P. Royer, A. Wilkerson, M. Wei, Human perceptions of colour rendition at different chromaticities, Lighting Research and Technology 50 (2017) 965–994. https://doi.org/10.1177/1477153517725974
- Y. Ohno, Color quality metrics – recent progress and future perspective, 15th Int. Symp. Sci. Technol. Light. (2016).
- N.A. Kotey, J.L. Wright, M.R. Collins, Determining off-normal solar optical properties of roller blind materials, ASHRAE Transaction 115 (2009) 145-154.
- A. Deneyer, B. Deroisy, G. Lethé, G. Flamant, Bi-directional scattering distribution data of solar shading: Characterization and performances, in: CIE Centenary Conference Towards a New Century of Light, 2013, pp. 560–568, Paris.
- H.J. Hoffmann, Optical Glasses, in: K.H.J. Buschow, R.W. Cahn, M.C. Flemings, B. Ilschner, E.J. Kramer, S. Mahajan, P. Veyssière (Eds.), Encyclopedia of Materials: Science and Technology, Elsevier, 2001, pp. 6426–6441. https://doi.org/10.1016/b0-08-043152-6/01865-9
- C. Buratti, E. Belloni, F. Merli, F. Bianconi, Experimental characterization of the color rendering properties of transparent monolithic aerogel, Solar Energy 205 (2020) 183–191. https://doi.org/10.1016/j.solener.2020.05.046
- K.A.G. Smet, A. David, L. Whitehead, Why Color Space Uniformity and Sample Set Spectral Uniformity Are Essential for Color Rendering Measures, LEUKOS - Journal of the Illuminating Engineering Society 12 (2016) 39–50. https://doi.org/10.1080/15502724.2015.1091356
- Commision Internationale de L’Eclairage (CIE), Correlated colour temperature, CIE S 017:2020 ILV: International Lighting Vocabulary, CIE, Viena, 2020. https://doi.org/10.25039/s017.2020
- American National Standards Institution (ANSI), American National Standard for Electric Lamps—Specifications for the Chromaticity of Solid-state Lighting Products, ANSI C78.377-2015, ANSI, Washington D.C., 2015. https://doi.org/10.2514/4.103742.001
- Commision Internationale de L’Eclairage (CIE), Color rendering, CIE S 017:2020 ILV: International Lighting Vocabulary, CIE, Viena, 2020. https://doi.org/10.25039/s017.2020
- M. Royer, Analysis of color rendition specification criteria, Light-Emitting Devices, Materials, and Applications 10940 (2019). https://doi.org/10.1117/12.2507283
- M.K. Gunde, U.O. Krašovec, W.J. Platzer, Color rendering properties of interior lighting influenced by a switchable window, J Journal of the Optical Society of America A 22 (2005) 416–423. https://doi.org/10.1364/josaa.22.000416
- A. Ghosh, B. Norton, Interior colour rendering of daylight transmitted through a suspended particle device switchable glazing, Solar Energy Materials and Solar Cells 163 (2017) 218–223. https://doi.org/10.1016/j.solmat.2017.01.041
- N. Aste, F. Leonforte, A. Piccolo, Color rendering performance of smart glazings for building applications, Solar Energy 176 (2018) 51–61. https://doi.org/10.1016/j.solener.2018.10.026
- Illuminating Engineering Society (IES), TM-30-15 IES method for evaluating light source color rendition, IES, New York, 2015. https://doi.org/10.1080/15502724.2020.1860771
- OPTRONICS, OL Series 750 Automated Spectroradiometric Measurement, (2020) 1–3.
- OPTRONICS, OL SERIES 740-70 Integrating Sphere Diffuse Reflectance Attachment, (2020) 1.
- OPTRONICS, OL SERIES 740-20 High Intensity Source Attachment, (2020) 1–2.
- European Committee for Standardization (CEN), Glass in building — Determination of luminous and solar characteristics of glazing. European Standard NS-EN 410:2011, CEN, Brussels, 2011.
- European Committee for Standardization (CEN), Blinds and shutters - Thermal and visual comfort - Performance characteristics and classification. European standard NS-EN 14501: 2006, CEN, Brussels, 2006. https://doi.org/10.3403/30100403u
- European Committee for Standardization (CEN), Daylight in buildings. European standard NS-EN 17037: 2018, CEN, Brussels, 2018.
- B. Xiao, Color Constancy, Encyclopedia of Color Science and Technology, Springer Science+Business Media, New York, 2016.
- S. Fotios, Chromatic adaptation and the relationship between lamp spectrum and brightness, Lighting Research and Technology 38 (2006) 3–17. https://doi.org/10.1191/1365782806li149oa
- Commision Internationale de L’Eclairage (CIE), Method of Measuring and Specifying Colour Rendering Properties of Light Sources CIE 13.3-95, CIE, Viena, 1995. https://doi.org/10.1002/col.5080200313
- J. Wienold, T.E. Kuhn, J. Christoffersen, M. Andersen, Annual glare evaluation for fabrics, Proc. 33rd PLEA Int. Conf. Des. to Thrive, PLEA 2017. 2 (2017) 3435–3442.
- C.F. Reinhart, J. Mardaljevic, Z. Rogers, Dynamic daylight performance metrics for sustainable building design, LEUKOS - Journal of the Illuminating Engineering Society 3 (2006) 7–31. https://doi.org/10.1582/leukos.2006.03.01.001
- N. Aste, L.C. Tagliabue, P. Palladino, D. Testa, Integration of a luminescent solar concentrator: Effects on daylight, correlated color temperature, illuminance level and color rendering index, Solar Energy 114 (2015) 174–182. https://doi.org/10.1016/j.solener.2015.01.042
Copyright © 2022 The Author(s). Published by solarlits.com.

2301
Total views
Citations
SHARE ON


